Embed Size (px)
Citation preview

Prefatory Note
The attached document represents the most complete and accurate version available based on original copies culled from the files of the FOMC Secretariat at the Board of Governors of the Federal Reserve System. This electronic document was created through a comprehensive digitization process which included identifying the best-preserved paper copies, scanning those copies,1 and then making the scanned versions text-searchable.2 Though a stringent quality assurance process was employed, some imperfections may remain.
Please note that this document may contain occasional gaps in the text. These gaps are the result of a redaction process that removed information obtained on a confidential basis. All redacted passages are exempt from disclosure under applicable provisions of the Freedom of Information Act.
1 In some cases, original copies needed to be photocopied before being scanned into electronic format. All scanned images were deskewed (to remove the effects of printer- and scanner-introduced tilting) and lightly cleaned (to remove dark spots caused by staple holes, hole punches, and other blemishes caused after initial printing). 2 A two-step process was used. An advanced optimal character recognition computer program (OCR) first created electronic text from the document image. Where the OCR results were inconclusive, staff checked and corrected the text as necessary. Please note that the numbers and text in charts and tables were not reliably recognized by the OCR process and were not checked or corrected by staff.

Confidential (FR) Class III FOMC
November 1, 2002
CURRENT ECONOMICAND FINANCIAL CONDITIONS
Supplemental Notes
Prepared for the Federal Open Market Committeeby the staff of the Board of Governors of the Federal Reserve System
Contents
The Domestic Nonfinancial Economy . . . . . . . . . . . . . . . . . . . . . . . . . . 1
Gross Domestic Product, 2002:Q3 Advance Estimate . . . . . . . . . 1Personal Income and Consumer Spending . . . . . . . . . . . . . . . . . . . 1Labor Market Developments . . . . . . . . . . . . . . . . . . . . . . . . . . . . . 4Labor Costs . . . . . . . . . . . . . . . . . . . . . . . . . . . . . . . . . . . . . . . . . . 7Prices . . . . . . . . . . . . . . . . . . . . . . . . . . . . . . . . . . . . . . . . . . . . . . 11ISM Report on Manufacturing . . . . . . . . . . . . . . . . . . . . . . . . . . . 15Construction Put In Place . . . . . . . . . . . . . . . . . . . . . . . . . . . . . . . 15Light Vehicle Sales . . . . . . . . . . . . . . . . . . . . . . . . . . . . . . . . . . . 19
TablesReal Gross Domestic Product and Related Items . . . . . . . 2Retail and Food Services Sales . . . . . . . . . . . . . . . . . . . . . 3Changes in Employment . . . . . . . . . . . . . . . . . . . . . . . . . . 5Selected Unemployment and Labor Force Participation
Rates . . . . . . . . . . . . . . . . . . . . . . . . . . . . . . . . . . . . . . 6Employment Cost Index of Hourly Compensation for
Private Industry Workers . . . . . . . . . . . . . . . . . . . . . . . 8Labor Costs . . . . . . . . . . . . . . . . . . . . . . . . . . . . . . . . . . . 10Price Indexes for Gross Domestic Product . . . . . . . . . . . 12Recent Price Indicators . . . . . . . . . . . . . . . . . . . . . . . . . . 13Broad Measures of Inflation . . . . . . . . . . . . . . . . . . . . . . . 14Sales of Automobiles and Light Trucks . . . . . . . . . . . . . . 20
ChartsRetail and Food Services Sales . . . . . . . . . . . . . . . . . . . . . 3Private Payroll Employment Growth . . . . . . . . . . . . . . . . . 5Aggregate Hours of Production or Nonsupervisory
Workers . . . . . . . . . . . . . . . . . . . . . . . . . . . . . . . . . . . . 5Labor Force Participation Rate and Unemployment
Rate . . . . . . . . . . . . . . . . . . . . . . . . . . . . . . . . . . . . . . . 6Job Losers and Persons Working Part-Time for Economic
Reasons . . . . . . . . . . . . . . . . . . . . . . . . . . . . . . . . . . . . 6Components of ECI Benefits Costs . . . . . . . . . . . . . . . . . . 9Measures of Compensation per Hour . . . . . . . . . . . . . . . . 10Purchasing Managers - Manufacturing . . . . . . . . . . . . . . 16Purchasing Managers’ Index . . . . . . . . . . . . . . . . . . . . . . 17Nonresidential Construction . . . . . . . . . . . . . . . . . . . . . . 18
-ii-
The Domestic Financial Economy . . . . . . . . . . . . . . . . . . . . . . . . . . . . 21
TablesCommercial Bank Credit . . . . . . . . . . . . . . . . . . . . . . . . . 21Selected Financial Market Quotations . . . . . . . . . . . . . . . 22
The International Economy . . . . . . . . . . . . . . . . . . . . . . . . . . . . . . . . . 23
U.S. International Transactions . . . . . . . . . . . . . . . . . . . . . . . . . . 23Trade in Goods and Services . . . . . . . . . . . . . . . . . . . . . . . . . . . . 23Prices of Internationally Traded Goods . . . . . . . . . . . . . . . . . . . . 23Non-oil Imports . . . . . . . . . . . . . . . . . . . . . . . . . . . . . . . . . . . . . . 23Exports . . . . . . . . . . . . . . . . . . . . . . . . . . . . . . . . . . . . . . . . . . . . . 23
TablesNet Trade in Goods and Services . . . . . . . . . . . . . . . . . . . 23Prices of U.S. Imports and Exports . . . . . . . . . . . . . . . . . 25
ChartsU.S. International Trade in Goods and Services . . . . . . . 24Oil Prices . . . . . . . . . . . . . . . . . . . . . . . . . . . . . . . . . . . . . 25
1. The downward revisions to September hours and average hourly earnings in today=semployment report imply a downward revision to this income gain (all else equal) in nextmonth=s personal income release.
Supplemental Notes
The Domestic Nonfinancial Economy
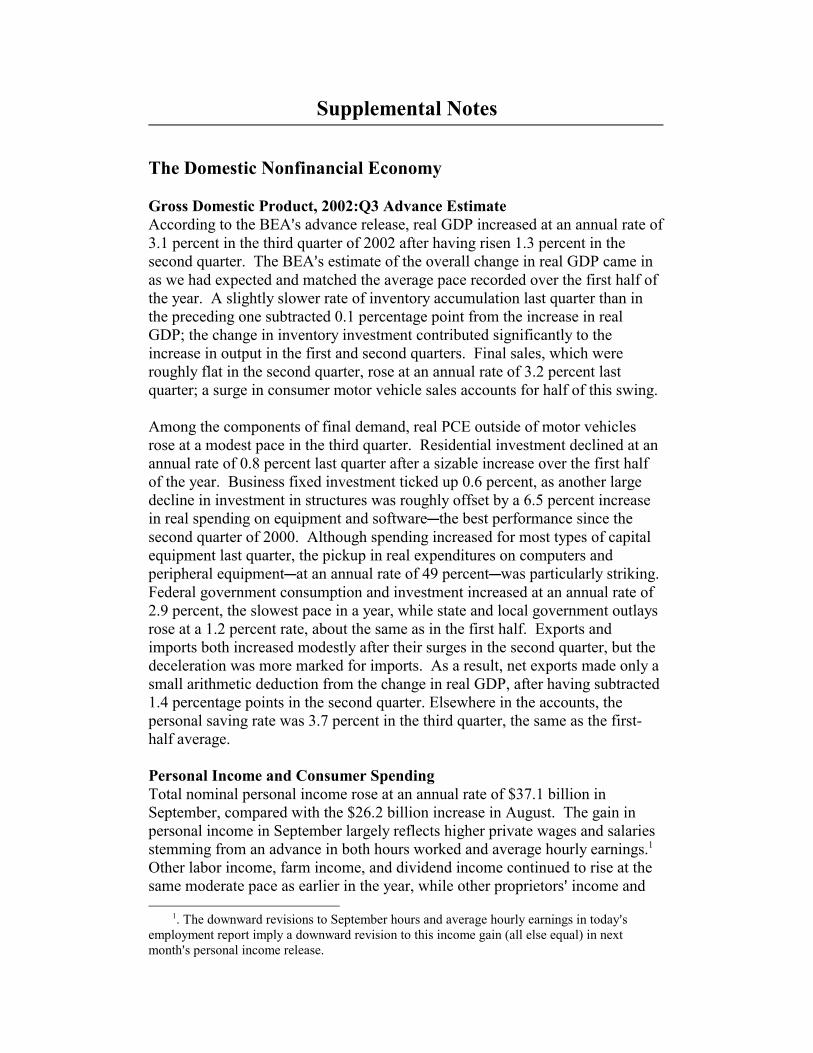
Gross Domestic Product, 2002:Q3 Advance EstimateAccording to the BEA=s advance release, real GDP increased at an annual rate of3.1 percent in the third quarter of 2002 after having risen 1.3 percent in thesecond quarter. The BEA=s estimate of the overall change in real GDP came inas we had expected and matched the average pace recorded over the first half ofthe year. A slightly slower rate of inventory accumulation last quarter than inthe preceding one subtracted 0.1 percentage point from the increase in realGDP; the change in inventory investment contributed significantly to theincrease in output in the first and second quarters. Final sales, which wereroughly flat in the second quarter, rose at an annual rate of 3.2 percent lastquarter; a surge in consumer motor vehicle sales accounts for half of this swing.
Among the components of final demand, real PCE outside of motor vehiclesrose at a modest pace in the third quarter. Residential investment declined at anannual rate of 0.8 percent last quarter after a sizable increase over the first halfof the year. Business fixed investment ticked up 0.6 percent, as another largedecline in investment in structures was roughly offset by a 6.5 percent increasein real spending on equipment and softwareCthe best performance since thesecond quarter of 2000. Although spending increased for most types of capitalequipment last quarter, the pickup in real expenditures on computers andperipheral equipmentCat an annual rate of 49 percentCwas particularly striking. Federal government consumption and investment increased at an annual rate of2.9 percent, the slowest pace in a year, while state and local government outlaysrose at a 1.2 percent rate, about the same as in the first half. Exports andimports both increased modestly after their surges in the second quarter, but thedeceleration was more marked for imports. As a result, net exports made only asmall arithmetic deduction from the change in real GDP, after having subtracted1.4 percentage points in the second quarter. Elsewhere in the accounts, thepersonal saving rate was 3.7 percent in the third quarter, the same as the first-half average.
Personal Income and Consumer SpendingTotal nominal personal income rose at an annual rate of $37.1 billion inSeptember, compared with the $26.2 billion increase in August. The gain inpersonal income in September largely reflects higher private wages and salariesstemming from an advance in both hours worked and average hourly earnings.1 Other labor income, farm income, and dividend income continued to rise at thesame moderate pace as earlier in the year, while other proprietors= income and
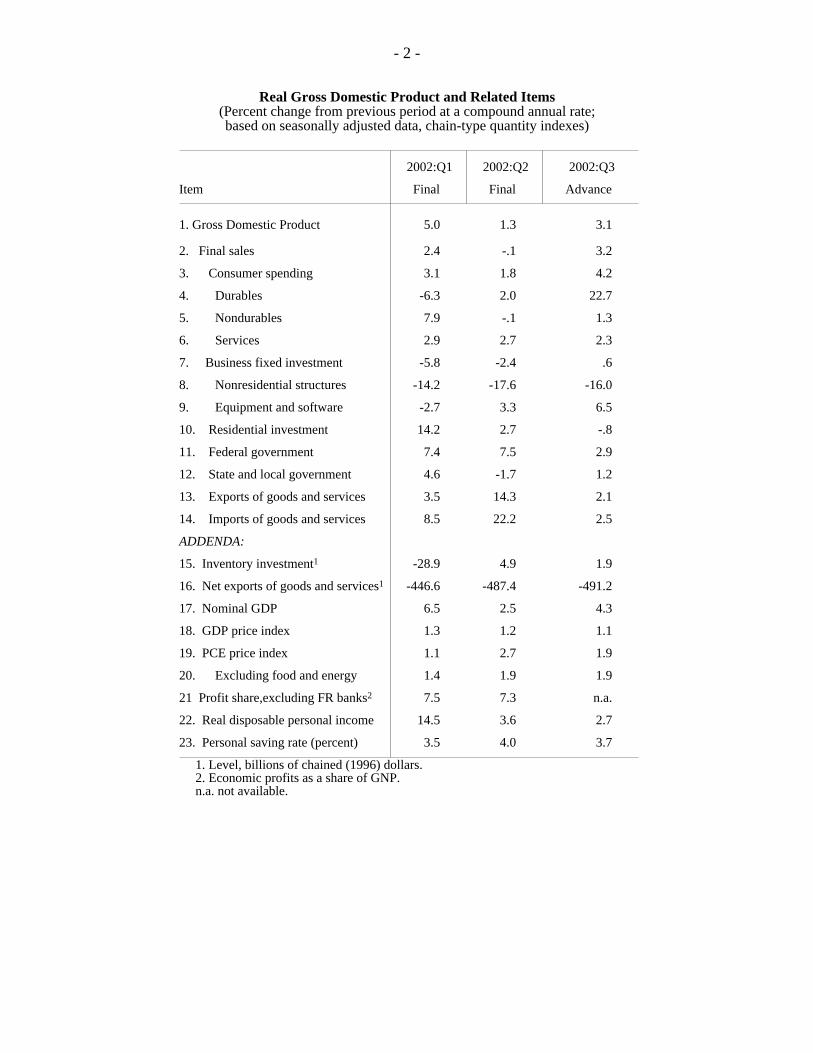
Real Gross Domestic Product and Related Items(Percent change from previous period at a compound annual rate;based on seasonally adjusted data, chain-type quantity indexes)
2002:Q1 2002:Q2 2002:Q3
Item Final Final Advance
1. Gross Domestic Product 5.0 1.3 3.1
2. Final sales 2.4 -.1 3.2
3. Consumer spending 3.1 1.8 4.2
4. Durables -6.3 2.0 22.7
5. Nondurables 7.9 -.1 1.3
6. Services 2.9 2.7 2.3
7. Business fixed investment -5.8 -2.4 .6
8. Nonresidential structures -14.2 -17.6 -16.0
9. Equipment and software -2.7 3.3 6.5
10. Residential investment 14.2 2.7 -.8
11. Federal government 7.4 7.5 2.9
12. State and local government 4.6 -1.7 1.2
13. Exports of goods and services 3.5 14.3 2.1
14. Imports of goods and services 8.5 22.2 2.5
ADDENDA:
15. Inventory investment1 -28.9 4.9 1.9
16. Net exports of goods and services1 -446.6 -487.4 -491.2
17. Nominal GDP 6.5 2.5 4.3
18. GDP price index 1.3 1.2 1.1
19. PCE price index 1.1 2.7 1.9
20. Excluding food and energy 1.4 1.9 1.9
21 Profit share,excluding FR banks2 7.5 7.3 n.a.
22. Real disposable personal income 14.5 3.6 2.7
23. Personal saving rate (percent) 3.5 4.0 3.7
1. Level, billions of chained (1996) dollars. 2. Economic profits as a share of GNP. n.a. not available.
- 2 -
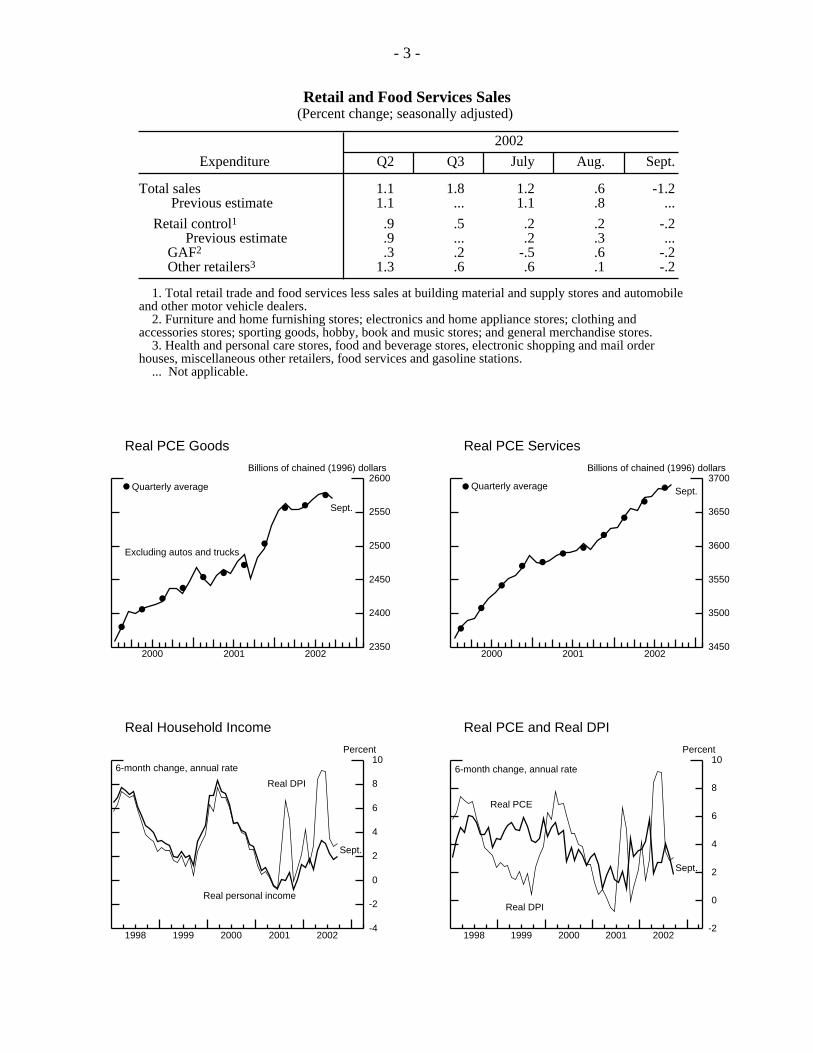
Retail and Food Services Sales(Percent change; seasonally adjusted)
2002
Expenditure Q2 Q3 July Aug. Sept.
Total sales 1.1 1.8 1.2 .6 -1.2 Previous estimate 1.1 ... 1.1 .8 ...
Retail control1 .9 .5 .2 .2 -.2 Previous estimate .9 ... .2 .3 ... GAF2 .3 .2 -.5 .6 -.2 Other retailers3 1.3 .6 .6 .1 -.2
1. Total retail trade and food services less sales at building material and supply stores and automobileand other motor vehicle dealers. 2. Furniture and home furnishing stores; electronics and home appliance stores; clothing andaccessories stores; sporting goods, hobby, book and music stores; and general merchandise stores. 3. Health and personal care stores, food and beverage stores, electronic shopping and mail orderhouses, miscellaneous other retailers, food services and gasoline stations. ... Not applicable.
2000 2001 20022350
2400
2450
2500
2550
2600
2350
2400
2450
2500
2550
2600Billions of chained (1996) dollars
Quarterly average
Sept.
Excluding autos and trucks
Real PCE Goods
2000 2001 20023450
3500
3550
3600
3650
3700
3450
3500
3550
3600
3650
3700Billions of chained (1996) dollars
Quarterly average Sept.
Real PCE Services
1998 1999 2000 2001 2002-4
-2
0
2
4
6
8
10
-4
-2
0
2
4
6
8
10Percent
Sept.
6-month change, annual rate
Real DPI
Real personal income
Real Household Income
1998 1999 2000 2001 2002-2
0
2
4
6
8
10
-2
0
2
4
6
8
10Percent
Sept.
6-month change, annual rate
Real DPI
Real PCE
Real PCE and Real DPI
- 3 -
2. The September decline was originally reported to have been 47,000.3. The diffusion index is equal to the percent of industries with employment increasing plus
one-half of the industries with unchanged employment.4. To be counted as employed, a person need work only a single hour during the reference
week. Because the lockout at West Coast ports did not last through the entire reference week,the closure did not have any effect on the employment data.
income from transfer payments surged in September. Rental income declinedfor the third straight month owing to fees associated with the surge in mortgagerefinancing activity; interest income also continued to be a drag. With personaltax and nontax payments essentially flat, disposable personal income rose at anannual rate of $36.8 billion in September. In real terms, disposable personalincome rose at an annual rate of $18.3 billion, or 0.3 percent at a monthly rate.
Real personal consumption expenditures declined 0.6 percent in Septemberowing to a significant contraction in spending on motor vehicles. Among otherdurable goods, purchases of hand tools and computers picked up noticeably, butspending on home furnishings declined. Real spending on nondurable goodsalso fell last month, with broad-based weakness that included further declines inoutlays for food and clothing. Spending on services advanced a bit, as increasedspending on electricity outweighed reduced spending on airline travel and hotelsand motels.
The increase in real disposable income combined with the decline in personalconsumption expenditures led to a 0.8 percentage point jump in the personalsaving rate, to 4.2 percent.
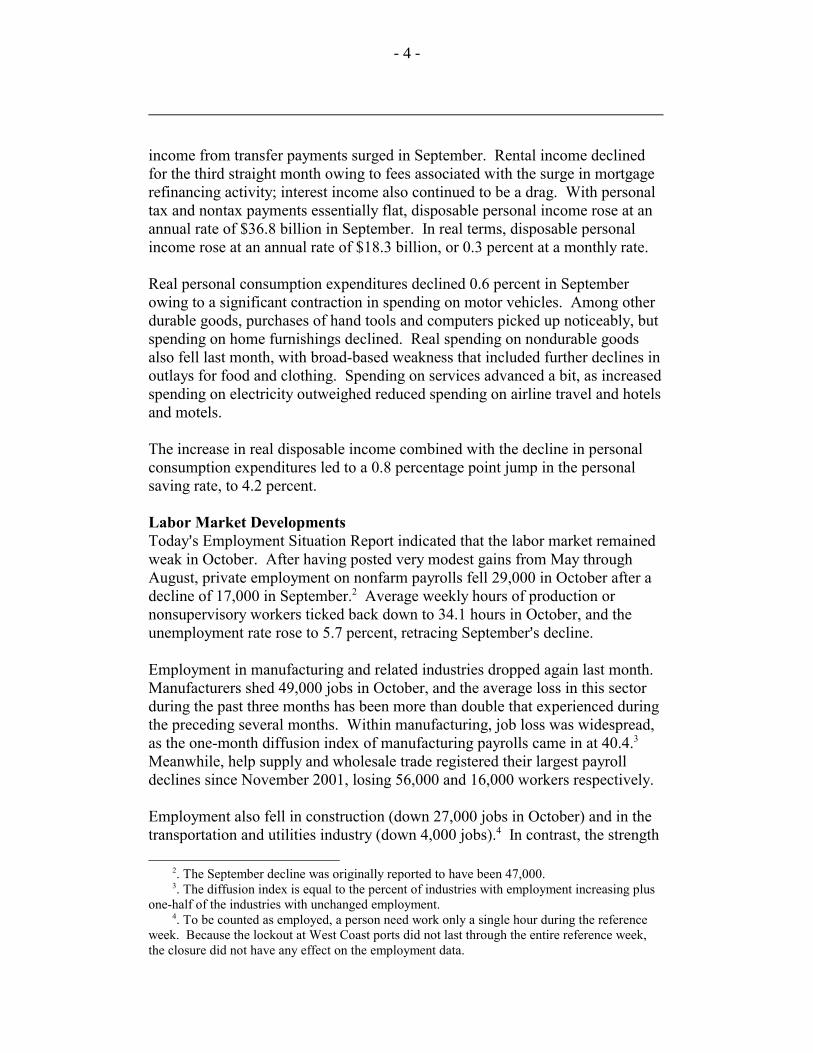
Labor Market DevelopmentsToday=s Employment Situation Report indicated that the labor market remainedweak in October. After having posted very modest gains from May throughAugust, private employment on nonfarm payrolls fell 29,000 in October after adecline of 17,000 in September.2 Average weekly hours of production ornonsupervisory workers ticked back down to 34.1 hours in October, and theunemployment rate rose to 5.7 percent, retracing September=s decline.
Employment in manufacturing and related industries dropped again last month. Manufacturers shed 49,000 jobs in October, and the average loss in this sectorduring the past three months has been more than double that experienced duringthe preceding several months. Within manufacturing, job loss was widespread,as the one-month diffusion index of manufacturing payrolls came in at 40.4.3 Meanwhile, help supply and wholesale trade registered their largest payrolldeclines since November 2001, losing 56,000 and 16,000 workers respectively.
Employment also fell in construction (down 27,000 jobs in October) and in thetransportation and utilities industry (down 4,000 jobs).4 In contrast, the strength
- 4 -
1997 1998 1999 2000 2001 2002 2003-500
-400
-300
-200
-100
0
100
200
300
400
-500
-400
-300
-200
-100
0
100
200
300
400Thousands of employees
Oct.
1-month
3-month moving average
Private Payroll Employment Growth(Strike-adjusted data)
1997 1998 1999 2000 2001 2002 2003138
140
142
144
146
148
150
152
154
138
140
142
144
146
148
150
152
1541982 = 100
Oct.
Aggregate Hours of Production orNonsupervisory Workers
CHANGES IN EMPLOYMENT(Thousands of employees; based on seasonally adjusted data)
2002 20022001 Q1 Q2 Q3 Aug. Sept. Oct.
-Average monthly change-Nonfarm payroll employment1 -119 -63 12 55 123 -13 -5 Previous -119 -63 12 39 107 -43 ... Private -158 -88 7 27 62 -17 -29 Mining 1 -2 -2 -1 4 -3 1 Manufacturing -109 -80 -22 -35 -52 -39 -49 Construction -3 -14 -15 6 37 11 -27 Transportation and utilities -23 -14 -8 -20 -15 -35 -4 Retail trade -15 5 -8 -8 -44 -11 14 Wholesale trade -16 -7 0 -4 -8 -3 -16 Finance, insurance, real estate 10 -3 -2 12 8 24 34 Services -2 27 63 78 132 39 18 Help supply services -54 4 36 8 50 1 -56 Total government 39 25 5 27 61 4 24
Total employment (household survey) -153 -54 53 377 429 711 -271 Nonagricultural -154 -14 58 315 523 601 -498
Memo:Aggregate hours of private production workers (percent change)1,2 -2.1 -0.5 0.2 -0.7 0.4 0.2 -0.4Average workweek (hours)1 34.2 34.2 34.2 34.1 34.1 34.2 34.1 Manufacturing (hours) 40.7 40.8 41.0 40.8 40.9 40.9 40.7
Note. Average change from final month of preceding period to final month of period indicated. 1. Survey of establishments. 2. Annual data are percent changes from Q4 to Q4. Quarterly data are percent changes frompreceding quarter at an annual rate. Monthly data are percent changes from preceding month. ... Not applicable.
- 5 -

1990 1991 1992 1993 1994 1995 1996 1997 1998 1999 2000 2001 200265.5
66.0
66.5
67.0
67.5Percent
3
4
5
6
7
8
9
10Percent
Unemployment rate (right scale)
Participation rate (left scale)
Oct.
Oct.
Labor Force Participation Rate and Unemployment Rate
1994 1995 1996 1997 1998 1999 2000 2001 20021.5
2.0
2.5
3.0
3.5
4.0
1.5
2.0
2.5
3.0
3.5
4.0Percent
Oct.
Oct.Part-time workers
Job losers
Note. Job losers and persons working part-time for economic reasons as a percent of the civilian labor force.
Job Losers and Persons Working Part-Time for Economic Reasons
SELECTED UNEMPLOYMENT AND LABOR FORCE PARTICIPATION RATES
(Percent; based on seasonally adjusted data)
2002 20022001 Q1 Q2 Q3 Aug. Sept. Oct.
Civilian unemployment rate (16 years and older) 4.8 5.6 5.9 5.7 5.7 5.6 5.7
Teenagers 14.7 16.0 17.1 16.9 17.2 15.7 14.6 20-24 years old 8.3 9.8 9.4 9.6 9.6 9.7 10.3 Men, 25 years and older 3.6 4.5 4.9 4.6 4.6 4.5 4.6 Women, 25 years and older 3.7 4.4 4.8 4.5 4.5 4.5 4.6
Labor force participation rate 66.9 66.5 66.7 66.6 66.6 66.8 66.7
Teenagers 49.9 48.2 47.7 47.6 47.1 48.6 47.7 20-24 years old 77.2 76.3 76.7 76.6 77.0 76.4 75.9 Men, 25 years and older 75.9 75.6 75.9 75.8 75.9 75.9 75.7 Women, 25 years and older 59.7 59.6 59.6 59.6 59.6 59.8 59.8
- 6 -

of the housing market and the surge in mortgage refinancing led the finance,insurance, and real estate industry to add 34,000 jobs in October, its largest one-month increase since March of 1998. Employment in services excluding helpsupply rose 74,000 in October, about the same pace as in the third quarter. Governments added 24,000 jobs in October, with most of the gain at the federallevel resulting from hiring by the Transportation Security Administration. Theretail trade industry added 14,000 jobs after two months of declines.
Average weekly hours of production or nonsupervisory workers moved down0.1 percentage point to 34.1 hours in October, and the September workweek wasrevised down to 34.2 hours. As a result, aggregate hours of production ornonsupervisory workers declined 0.4 percent in October and now stand belowthe August level.
The increase in the unemployment rate in October is echoed by other data fromthe household survey. The proportion of individuals in the civilian labor forceclassifying themselves as job losers rose to its highest level since the recessionbegan, while the proportion of individuals working part-time for economicreasons is now at its highest level since last December. After having risen morethan 1.1 million in August and September, household employment fell 271,000in October. The labor force participation rate edged down 0.1 percentage point,to 66.7 percent.
Initial claims for unemployment insurance under state programs rose 16,000, to410,000, for the week ended October 26, reversing most of the previous week=sdecline. Smoothing through the up and down movements of the last severalweeks, the four-week moving average of claims decreased 3,000, to 402,000. The level of claims in October appears to be somewhat depressed as a result ofthe BLS=s decision to include data from October 2001 (when claims wereelevated following the September 11 attacks) in the construction of its seasonalfactors. Using seasonal factors computed without data from 2001, the level ofclaims rose 8,000, to 439,000, for the week ended October 26, while the four-week moving average inched up to 431,000.
The level of insured unemployment for the week ended October 19 rose 76,000,to 3.62 million, while the insured unemployment rate remained at 2.8 percent. In the week ended October 12, 812,000 persons received TEUC benefits.
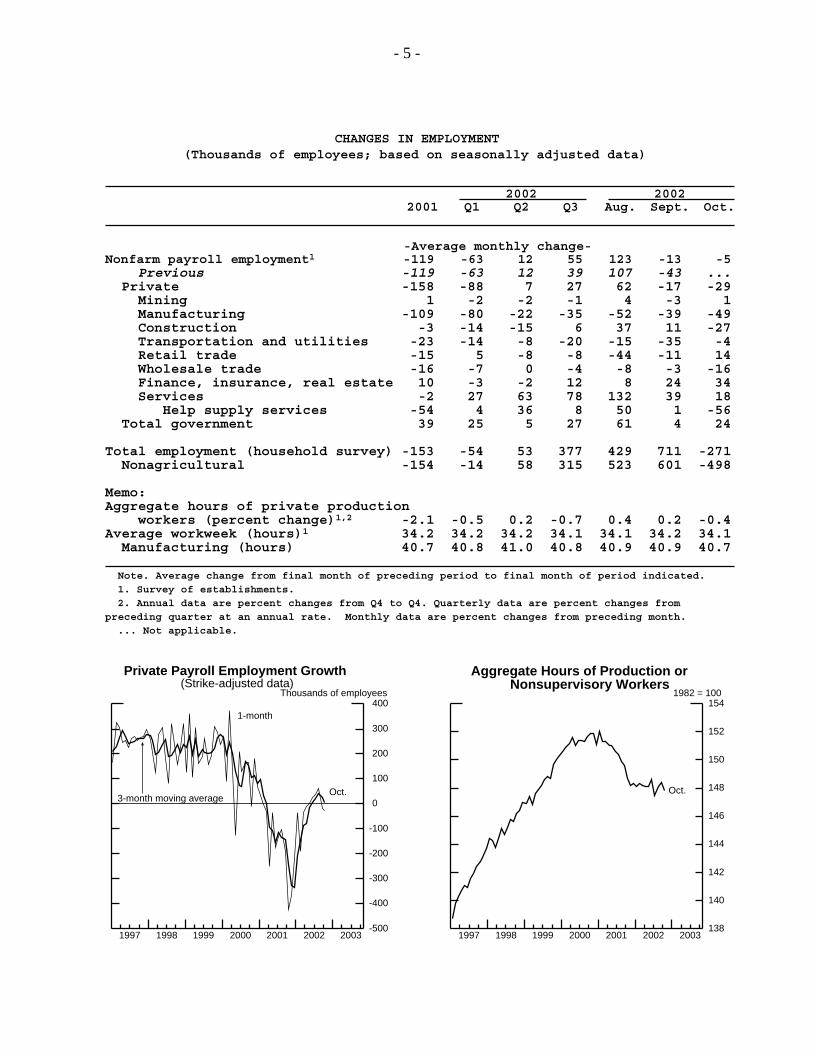
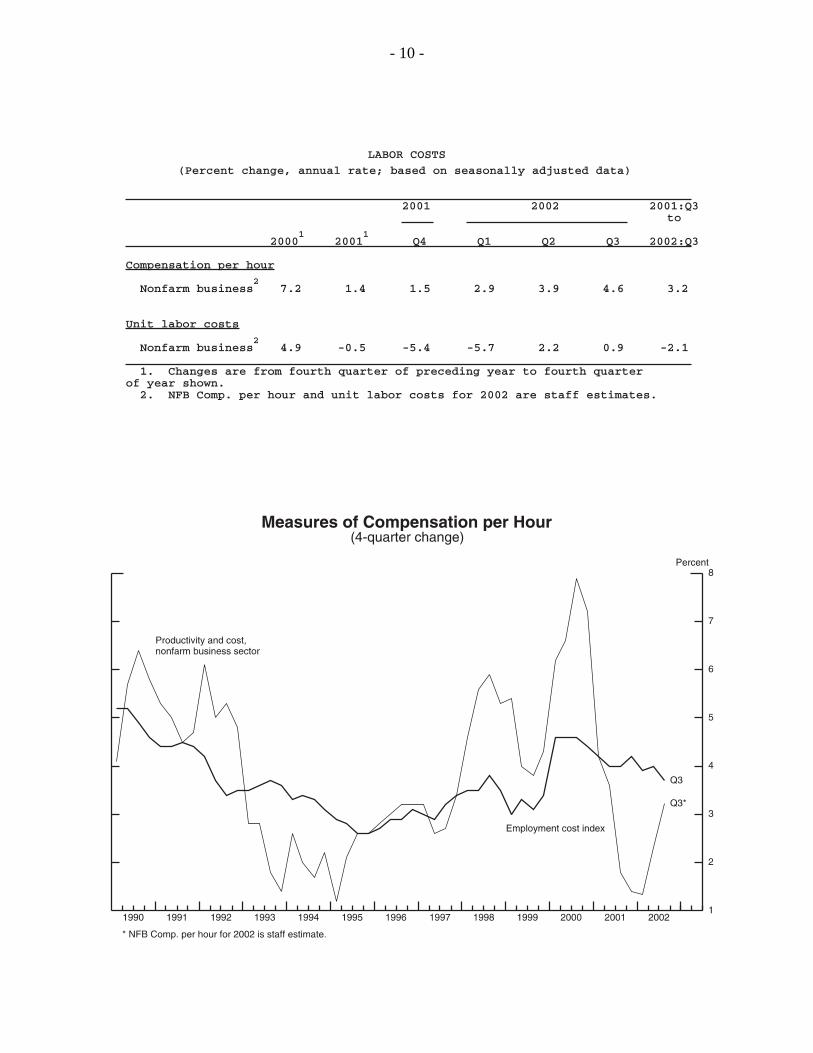
Labor CostsThe employment cost index for hourly compensation of private industry workersrose at an annual rate of 2.5 percent over the three months ending in September,after having posted a 4.4 percent increase over the previous three-month period. The wage and salary component of the index rose at an annual rate of1.5 percent, while benefit costs rose at a 4 percent rate. Over the twelve months
- 7 -
EMPLOYMENT COST INDEX OF HOURLY COMPENSATION FOR PRIVATE INDUSTRY WORKERS
_____________________________________________________________________
2001 2002 ————————————— ————————————————————— Sept. Dec. Mar. June Sept. _____________________________________________________________________
-----Quarterly percent change------- (Compound annual rate) Total hourly compensation1 3.7 4.2 3.6 4.4 2.5 Wages and salaries 2.9 3.7 3.7 3.9 1.5 Benefit costs 5.5 5.2 4.4 5.6 4.0 By industry Construction 4.1 4.8 2.6 1.6 3.1 Manufacturing 2.4 4.0 4.2 3.6 3.3 Trans., comm., and 2.7 6.7 3.9 3.9 4.6 public utilities Wholesale trade 3.1 1.8 7.2 9.7 0.0 Retail trade 3.2 8.5 -1.0 5.3 1.0 FIRE 3.6 1.0 10.0 5.2 1.7 Services 5.2 3.6 3.5 2.7 2.5 By occupation White collar 3.6 4.9 3.3 4.5 2.2 Blue collar 4.4 3.8 3.7 3.7 2.9 Service occupations 4.0 5.6 4.7 2.3 4.4 Memo: State and local governments 5.6 2.6 2.9 3.4 6.2 -----Twelve-month percent change---- Total hourly compensation 4.0 4.2 3.9 4.0 3.7 Excluding sales workers 4.1 4.2 3.9 4.0 3.6 Wages and salaries 3.6 3.8 3.5 3.6 3.2 Excluding sales workers 3.9 3.9 3.6 3.5 3.2 Benefit costs 4.9 5.1 4.8 5.1 4.8 By industry Construction 4.5 4.3 4.0 3.3 3.0 Manufacturing 3.1 3.5 3.5 3.6 3.8 Trans., comm., and 4.1 4.9 4.5 4.3 4.8 public utilities Wholesale trade 4.3 3.3 4.4 5.4 4.6 Retail trade 3.2 4.5 3.2 3.9 3.4 FIRE 3.7 3.6 4.6 4.9 4.4 Services 4.6 4.5 3.9 3.7 3.1 By occupation White collar 4.0 4.2 4.0 4.1 3.7 Sales 2.5 3.5 3.5 4.6 4.3 Nonsales 4.4 4.4 4.0 3.9 3.6 Blue collar 3.8 3.8 3.6 3.9 3.5 Service occupations 4.1 4.5 4.3 4.0 4.2 Memo: State and local governments 4.4 4.2 3.9 3.6 3.8 _____________________________________________________________________ 1. Seasonally adjusted by the BLS.
- 8 -
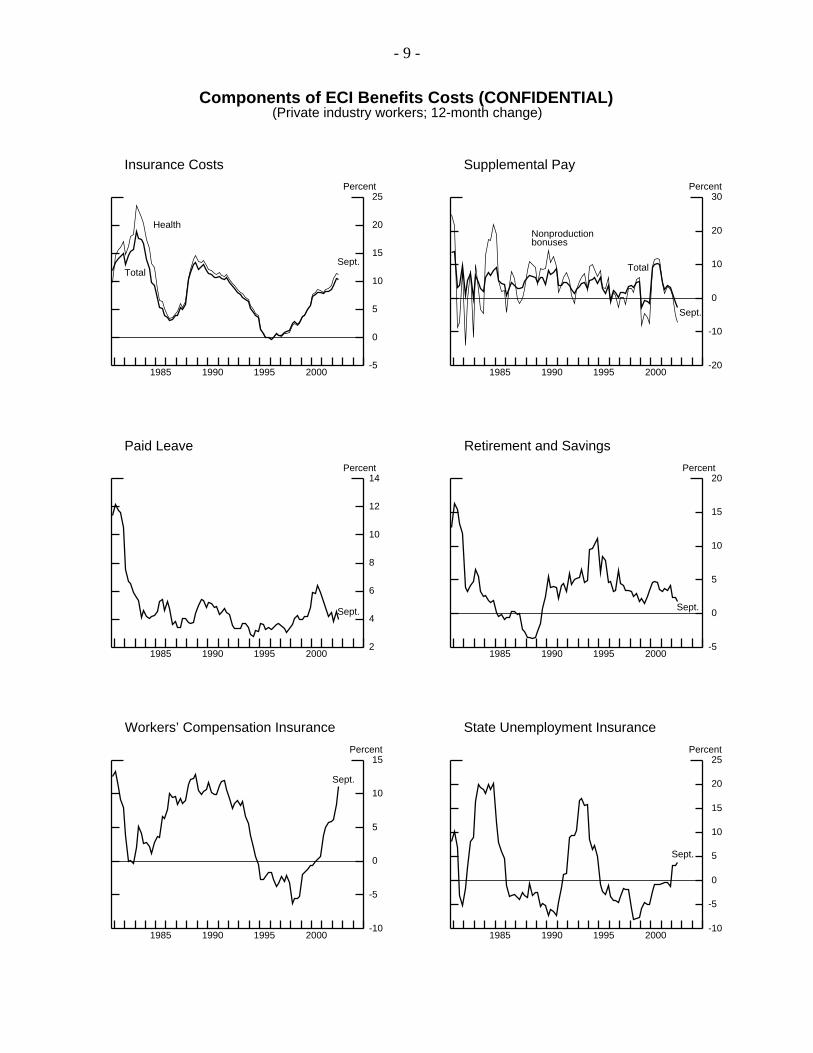
Components of ECI Benefits Costs (CONFIDENTIAL)(Private industry workers; 12-month change)
1985 1990 1995 2000-5
0
5
10
15
20
25
-5
0
5
10
15
20
25Percent
Health
TotalSept.
Insurance Costs
1985 1990 1995 2000-20
-10
0
10
20
30
-20
-10
0
10
20
30Percent
Nonproductionbonuses
Total
Sept.
Supplemental Pay
1985 1990 1995 20002
4
6
8
10
12
14
2
4
6
8
10
12
14Percent
Sept.
Paid Leave
1985 1990 1995 2000-5
0
5
10
15
20
-5
0
5
10
15
20Percent
Sept.
Retirement and Savings
1985 1990 1995 2000-10
-5
0
5
10
15
-10
-5
0
5
10
15Percent
Sept.
Workers’ Compensation Insurance
1985 1990 1995 2000-10
-5
0
5
10
15
20
25
-10
-5
0
5
10
15
20
25Percent
Sept.
State Unemployment Insurance
- 9 -
- 10 -
5. With the exception of health insurance, the benefits detail is unpublished and is providedto us by the BLS on a confidential basis.
ending in September, private-industry hourly compensation rose 3.7 percent;this rate was 0.3 percentage point lower than a year earlierCa deceleration thatnow appears more consistent with the weakness in labor markets. Excludingsales workers, whose compensation includes a substantial commissionscomponent, the ECI decelerated 0.5 percentage point over the past year.
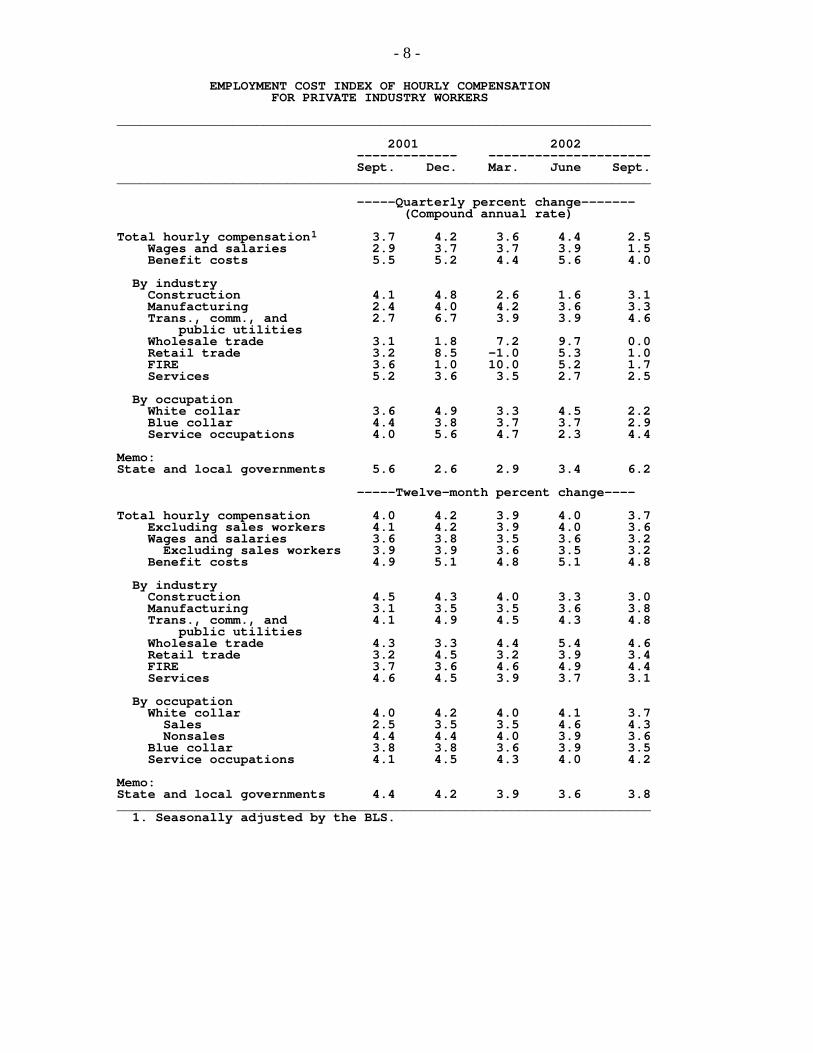
On a twelve-month-change basis, wage and salary inflation was 3.2 percentCdown 0.4 percentage point from a year earlierCwhile benefit cost inflationmoved down only 0.1 percentage point, to 4.8 percent. Within benefits,employers= costs for health insurance and workers= compensation acceleratednoticeably over the past year, but these changes were roughly offset by a sharpdeceleration in nonproduction bonuses and a less pronounced deceleration inretirement and savings costs.5
The deceleration in compensation over the past year varied considerably byindustry. Hourly compensation in construction and in services deceleratedsharply, while the rate of change in compensation in other industries hasremained steady or increased. By occupation, hourly compensation of bothwhite-collar and blue-collar workers decelerated 0.3 percentage point over thepast year, while growth of service workers= hourly compensation edged up0.1 percentage point.
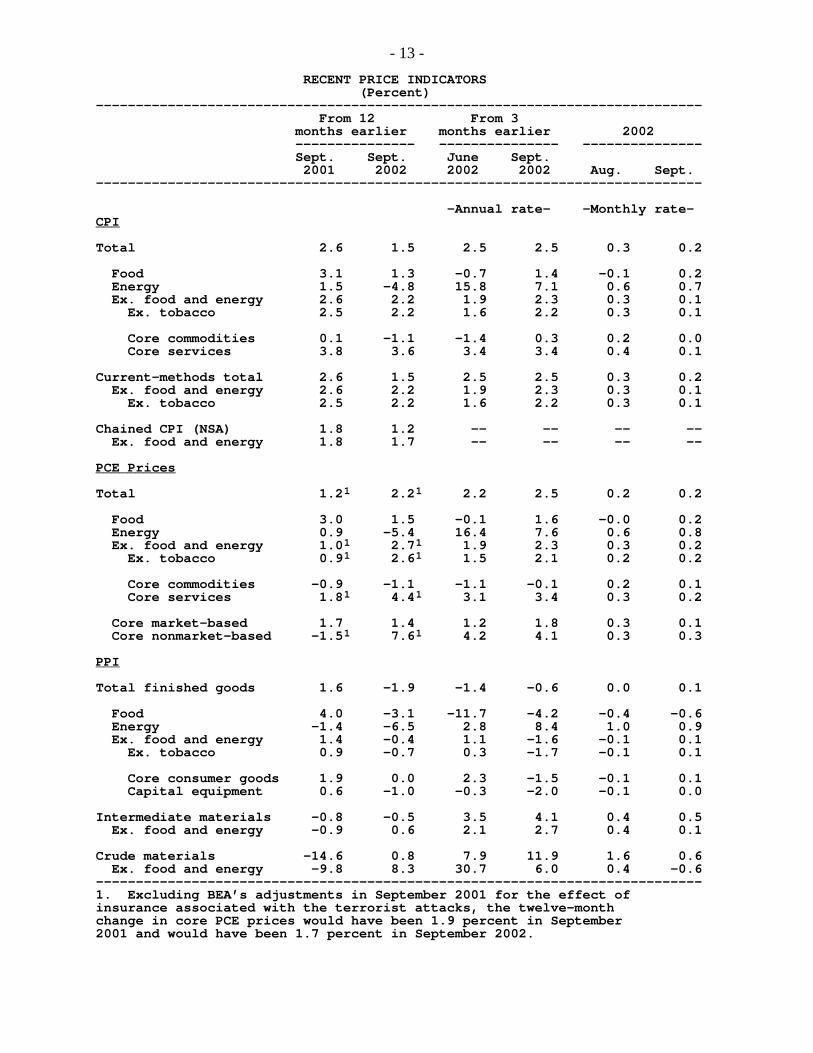
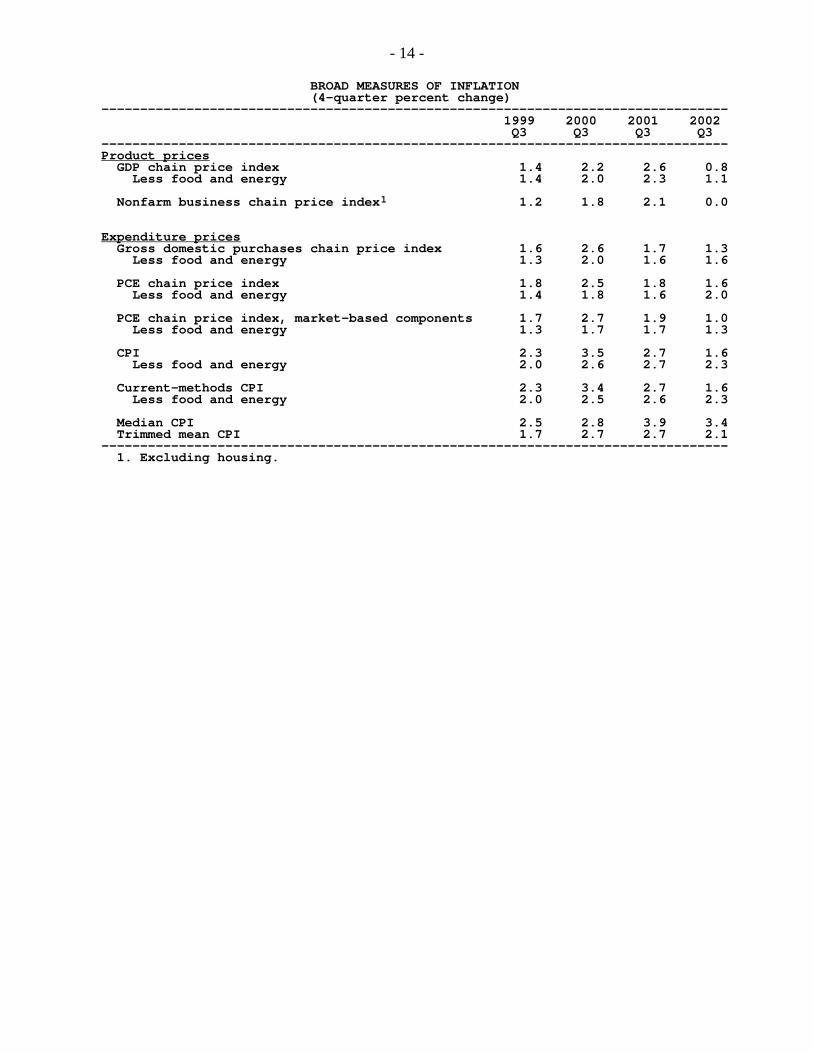
Average hourly earnings of production or nonsupervisory workers on privatenonfarm payrolls increased 0.2 percent in October. Over the twelve monthsended in October, the change in average hourly earnings was 3.0 percent, downfrom 3.8 percent over the preceding twelve months.PricesThe chain-weighted price index for GDP is estimated to have risen at an annualrate of 1.1 percent in the third quarter, while core PCE price inflation was 1.9percent. The four-quarter change in core PCE prices was 2 percent, comparedwith 1.6 percent over the year-earlier period. However, this pattern is distortedby the BEA=s treatment of insurance payouts associated with last year=s terroristattacks, which temporarily lowered the PCE price index in 2001:Q3. Excludingthese adjustments, the four-quarter change in core PCE prices would have been1.7 percent last quarter, compared with 2 percent a year earlier.
On a monthly basis, both the overall PCE price index and the core index wereup 0.2 percent in September. As with the quarterly indexes, the published year-over-year increases are distorted by last year=s treatment of insurance payouts. Excluding these insurance effects, the twelve-month change in core PCE priceswould have been 1.7 percent this September, down from 1.9 percent over the
- 11 -
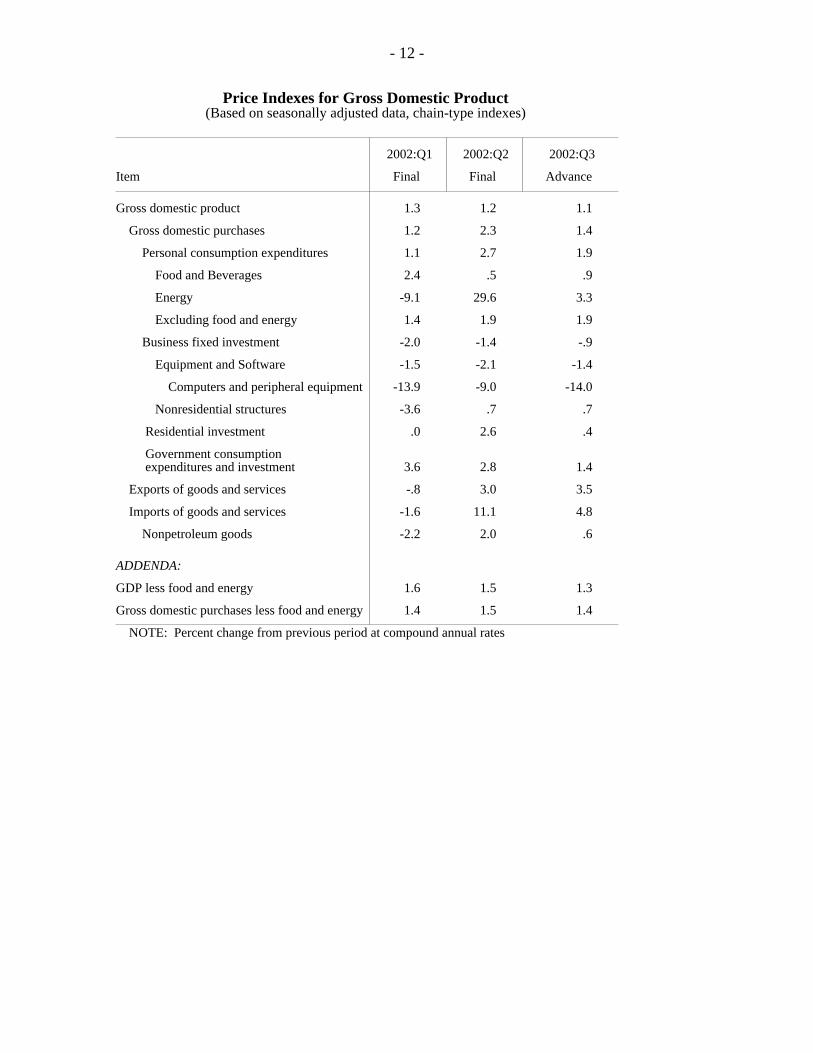
Price Indexes for Gross Domestic Product(Based on seasonally adjusted data, chain-type indexes)
2002:Q1 2002:Q2 2002:Q3
Item Final Final Advance
Gross domestic product 1.3 1.2 1.1
Gross domestic purchases 1.2 2.3 1.4
Personal consumption expenditures 1.1 2.7 1.9
Food and Beverages 2.4 .5 .9
Energy -9.1 29.6 3.3
Excluding food and energy 1.4 1.9 1.9
Business fixed investment -2.0 -1.4 -.9
Equipment and Software -1.5 -2.1 -1.4
Computers and peripheral equipment -13.9 -9.0 -14.0
Nonresidential structures -3.6 .7 .7
Residential investment .0 2.6 .4
Government consumption expenditures and investment 3.6 2.8 1.4
Exports of goods and services -.8 3.0 3.5
Imports of goods and services -1.6 11.1 4.8
Nonpetroleum goods -2.2 2.0 .6
ADDENDA:
GDP less food and energy 1.6 1.5 1.3
Gross domestic purchases less food and energy 1.4 1.5 1.4
NOTE: Percent change from previous period at compound annual rates
- 12 -
RECENT PRICE INDICATORS (Percent) ———————————————————————————————————————————————————————————————————————————— From 12 From 3 months earlier months earlier 2002 ——————————————— ——————————————— ——————————————— Sept. Sept. June Sept. 2001 2002 2002 2002 Aug. Sept. ————————————————————————————————————————————————————————————————————————————
-Annual rate- -Monthly rate- ___ CPI Total 2.6 1.5 2.5 2.5 0.3 0.2 Food 3.1 1.3 -0.7 1.4 -0.1 0.2 Energy 1.5 -4.8 15.8 7.1 0.6 0.7 Ex. food and energy 2.6 2.2 1.9 2.3 0.3 0.1 Ex. tobacco 2.5 2.2 1.6 2.2 0.3 0.1 Core commodities 0.1 -1.1 -1.4 0.3 0.2 0.0 Core services 3.8 3.6 3.4 3.4 0.4 0.1 Current-methods total 2.6 1.5 2.5 2.5 0.3 0.2 Ex. food and energy 2.6 2.2 1.9 2.3 0.3 0.1 Ex. tobacco 2.5 2.2 1.6 2.2 0.3 0.1 Chained CPI (NSA) 1.8 1.2 -- -- -- -- Ex. food and energy 1.8 1.7 -- -- -- -- __________ PCE Prices Total 1.21 2.21 2.2 2.5 0.2 0.2 Food 3.0 1.5 -0.1 1.6 -0.0 0.2 Energy 0.9 -5.4 16.4 7.6 0.6 0.8 Ex. food and energy 1.01 2.71 1.9 2.3 0.3 0.2 Ex. tobacco 0.91 2.61 1.5 2.1 0.2 0.2 Core commodities -0.9 -1.1 -1.1 -0.1 0.2 0.1 Core services 1.81 4.41 3.1 3.4 0.3 0.2 Core market-based 1.7 1.4 1.2 1.8 0.3 0.1 Core nonmarket-based -1.51 7.61 4.2 4.1 0.3 0.3 ___ PPI Total finished goods 1.6 -1.9 -1.4 -0.6 0.0 0.1 Food 4.0 -3.1 -11.7 -4.2 -0.4 -0.6 Energy -1.4 -6.5 2.8 8.4 1.0 0.9 Ex. food and energy 1.4 -0.4 1.1 -1.6 -0.1 0.1 Ex. tobacco 0.9 -0.7 0.3 -1.7 -0.1 0.1 Core consumer goods 1.9 0.0 2.3 -1.5 -0.1 0.1 Capital equipment 0.6 -1.0 -0.3 -2.0 -0.1 0.0 Intermediate materials -0.8 -0.5 3.5 4.1 0.4 0.5 Ex. food and energy -0.9 0.6 2.1 2.7 0.4 0.1 Crude materials -14.6 0.8 7.9 11.9 1.6 0.6 Ex. food and energy -9.8 8.3 30.7 6.0 0.4 -0.6 ———————————————————————————————————————————————————————————————————————————— 1. Excluding BEA’s adjustments in September 2001 for the effect of insurance associated with the terrorist attacks, the twelve-month change in core PCE prices would have been 1.9 percent in September 2001 and would have been 1.7 percent in September 2002.
- 13 -
BROAD MEASURES OF INFLATION (4-quarter percent change) ————————————————————————————————————————————————————————————————————————————————— 1999 2000 2001 2002 Q3 Q3 Q3 Q3 ————————————————————————————————————————————————————————————————————————————————— ______________ Product prices GDP chain price index 1.4 2.2 2.6 0.8 Less food and energy 1.4 2.0 2.3 1.1
Nonfarm business chain price index1 1.2 1.8 2.1 0.0
__________________ Expenditure prices Gross domestic purchases chain price index 1.6 2.6 1.7 1.3 Less food and energy 1.3 2.0 1.6 1.6
PCE chain price index 1.8 2.5 1.8 1.6 Less food and energy 1.4 1.8 1.6 2.0
PCE chain price index, market-based components 1.7 2.7 1.9 1.0 Less food and energy 1.3 1.7 1.7 1.3
CPI 2.3 3.5 2.7 1.6 Less food and energy 2.0 2.6 2.7 2.3
Current-methods CPI 2.3 3.4 2.7 1.6 Less food and energy 2.0 2.5 2.6 2.3
Median CPI 2.5 2.8 3.9 3.4 Trimmed mean CPI 1.7 2.7 2.7 2.1 ————————————————————————————————————————————————————————————————————————————————— 1. Excluding housing.
- 14 -
preceding twelve months. The market-based components of core PCE prices donot include the insurance-related distortions: These market-based componentshave decelerated 0.3 percentage point from their year-earlier changes, close tothe deceleration in the core CPI over this period.
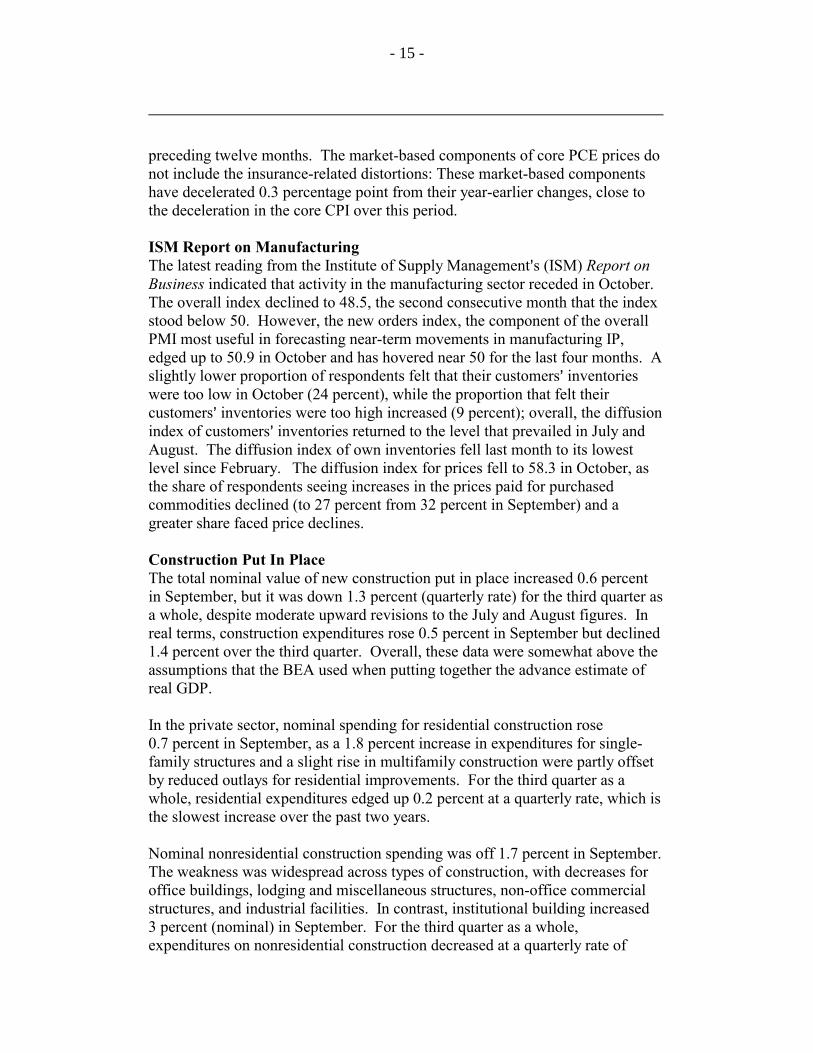
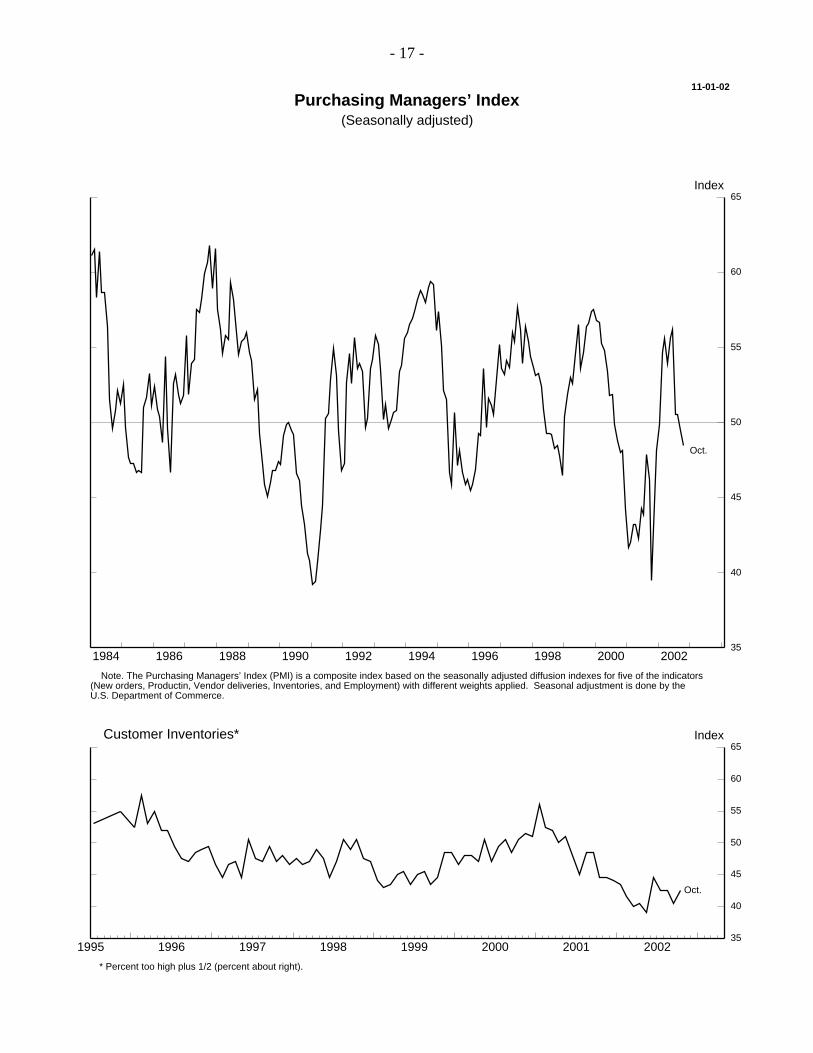
ISM Report on ManufacturingThe latest reading from the Institute of Supply Management=s (ISM) Report onBusiness indicated that activity in the manufacturing sector receded in October. The overall index declined to 48.5, the second consecutive month that the indexstood below 50. However, the new orders index, the component of the overallPMI most useful in forecasting near-term movements in manufacturing IP,edged up to 50.9 in October and has hovered near 50 for the last four months. Aslightly lower proportion of respondents felt that their customers= inventorieswere too low in October (24 percent), while the proportion that felt theircustomers= inventories were too high increased (9 percent); overall, the diffusionindex of customers= inventories returned to the level that prevailed in July andAugust. The diffusion index of own inventories fell last month to its lowestlevel since February. The diffusion index for prices fell to 58.3 in October, asthe share of respondents seeing increases in the prices paid for purchasedcommodities declined (to 27 percent from 32 percent in September) and agreater share faced price declines.
Construction Put In PlaceThe total nominal value of new construction put in place increased 0.6 percentin September, but it was down 1.3 percent (quarterly rate) for the third quarter asa whole, despite moderate upward revisions to the July and August figures. Inreal terms, construction expenditures rose 0.5 percent in September but declined1.4 percent over the third quarter. Overall, these data were somewhat above theassumptions that the BEA used when putting together the advance estimate ofreal GDP.
In the private sector, nominal spending for residential construction rose0.7 percent in September, as a 1.8 percent increase in expenditures for single-family structures and a slight rise in multifamily construction were partly offsetby reduced outlays for residential improvements. For the third quarter as awhole, residential expenditures edged up 0.2 percent at a quarterly rate, which isthe slowest increase over the past two years. Nominal nonresidential construction spending was off 1.7 percent in September.The weakness was widespread across types of construction, with decreases foroffice buildings, lodging and miscellaneous structures, non-office commercialstructures, and industrial facilities. In contrast, institutional building increased3 percent (nominal) in September. For the third quarter as a whole,expenditures on nonresidential construction decreased at a quarterly rate of
- 15 -
11-01-02
Purchasing Managers - Manufacturing(Seasonally adjusted)
1992 1994 1996 1998 2000 2002
Index
20
30
40
50
60
70
80
New orders
New export orders
Oct.
1992 1994 1996 1998 2000 2002
Index
20
30
40
50
60
70
80
Supplier deliveries*
Inventories
Oct.
* Positive entries represent slower deliveries.
1992 1994 1996 1998 2000 2002
Index
20
30
40
50
60
70
80
Production
Employment
Oct.
1992 1994 1996 1998 2000 2002
Index
20
30
40
50
60
70
80
90
100
Prices paid
Oct.
- 16 -
11-01-02
Purchasing Managers’ Index(Seasonally adjusted)
1984 1986 1988 1990 1992 1994 1996 1998 2000 2002
Index
35
40
45
50
55
60
65
Oct.
Note. The Purchasing Managers’ Index (PMI) is a composite index based on the seasonally adjusted diffusion indexes for five of the indicators (New orders, Productin, Vendor deliveries, Inventories, and Employment) with different weights applied. Seasonal adjustment is done by the U.S. Department of Commerce.
1995 1996 1997 1998 1999 2000 2001 2002
Index
35
40
45
50
55
60
65
Oct.
* Percent too high plus 1/2 (percent about right).
Customer Inventories*
- 17 -
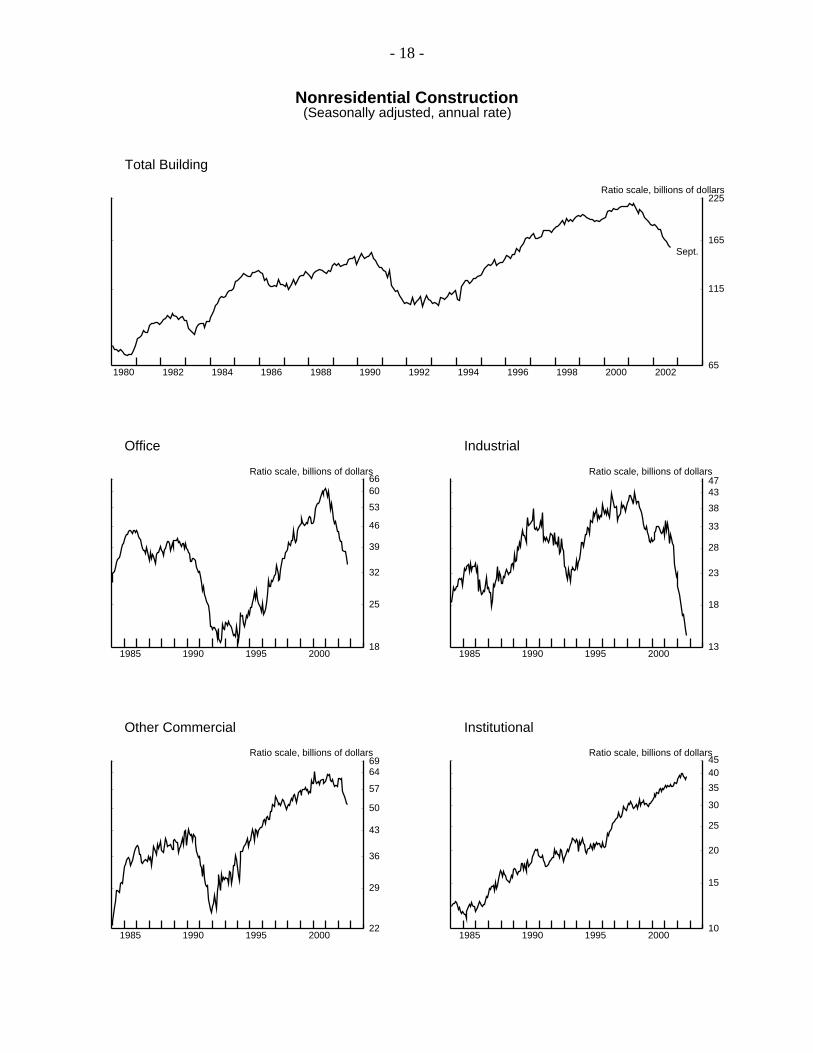
Nonresidential Construction(Seasonally adjusted, annual rate)
1980 1982 1984 1986 1988 1990 1992 1994 1996 1998 2000 200265
115
165
225
65
115
165
225
Ratio scale, billions of dollars
Sept.
Total Building
1985 1990 1995 200018
25
32
39
46
53
6066
18
25
32
39
46
53
6066
Ratio scale, billions of dollars
Office
1985 1990 1995 200022
29
36
43
50
57
6469
22
29
36
43
50
57
6469
Ratio scale, billions of dollars
Other Commercial
1985 1990 1995 200010
15
20
25
30
35
4045
10
15
20
25
30
35
4045
Ratio scale, billions of dollars
Institutional
1985 1990 1995 200013
18
23
28
33
38
4347
13
18
23
28
33
38
4347
Ratio scale, billions of dollars
Industrial
- 18 -
7.4 percent. In the public sector, construction spending rose 2.2 percent inSeptember and 1.6 percent during the third quarter as a whole.
Light Vehicle SalesLight vehicle sales in October were 15.3 million units at an annual rate, adecrease of 900,000 units from September’s pace. Sales of domesticallyproduced vehicles fell 400,000 units (3 percent) and sales of foreign-producedvehicles dropped nearly 500,000 units (13 percent). By type of vehicle, sales ofautos dropped 600,000 units and sales of light trucks declined about 300,000units.
Sales at GM improved in October, while sales at nearly all of the remainingfirms were down from their levels in the previous month. According to ourindustry contacts, sales at GM in September were reportedly held down bylimited supplies of heavily-discounted 2002 model-year vehicles relative to itscompetitors. In October, GM’s sales and market share rebounded as incentiveswere broadened to cover 2003 models, which were available in greater supply. Nonetheless, the level of GM’s sales in October were about a half million unitsbelow their average pace in the third quarter.
- 19 -
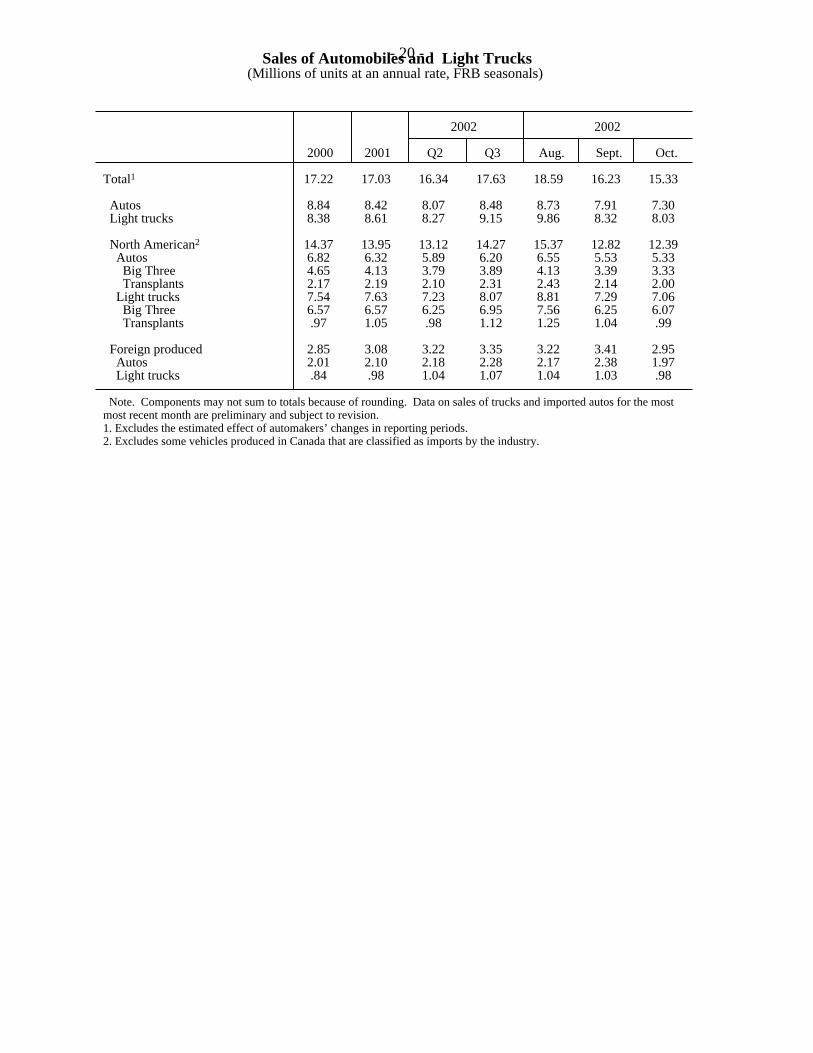
Sales of Automobiles and Light Trucks(Millions of units at an annual rate, FRB seasonals)
2002 2002
2000 2001 Q2 Q3 Aug. Sept. Oct.
Total1 17.22 17.03 16.34 17.63 18.59 16.23 15.33
Autos 8.84 8.42 8.07 8.48 8.73 7.91 7.30 Light trucks 8.38 8.61 8.27 9.15 9.86 8.32 8.03
North American2 14.37 13.95 13.12 14.27 15.37 12.82 12.39 Autos 6.82 6.32 5.89 6.20 6.55 5.53 5.33 Big Three 4.65 4.13 3.79 3.89 4.13 3.39 3.33 Transplants 2.17 2.19 2.10 2.31 2.43 2.14 2.00 Light trucks 7.54 7.63 7.23 8.07 8.81 7.29 7.06 Big Three 6.57 6.57 6.25 6.95 7.56 6.25 6.07 Transplants .97 1.05 .98 1.12 1.25 1.04 .99
Foreign produced 2.85 3.08 3.22 3.35 3.22 3.41 2.95 Autos 2.01 2.10 2.18 2.28 2.17 2.38 1.97 Light trucks .84 .98 1.04 1.07 1.04 1.03 .98
Note. Components may not sum to totals because of rounding. Data on sales of trucks and imported autos for the mostmost recent month are preliminary and subject to revision.1. Excludes the estimated effect of automakers’ changes in reporting periods.2. Excludes some vehicles produced in Canada that are classified as imports by the industry.
- 20 -

Commercial Bank Credit(Percent change, annual rate, except as noted; seasonally adjusted)
Level,Type of credit 2001 Q1 Q2 June July Aug. Aug. 2002
2002 2002 2002 2002 2002 ($ billions)
Total 1. Adjusted1 4.2 1.0 5.1 5.2 5.6 15.5 5,482 2. Reported 5.1 -1.5 5.4 9.6 10.1 17.6 5,676
Securities 3. Adjusted1 9.5 7.9 13.5 4.3 5.4 21.8 1,432 4. Reported 12.6 -2.0 13.5 20.0 21.5 28.8 1,625 5. Treasury & Agency 6.8 1.3 22.3 17.0 10.6 37.2 946 6. Other2 21.1 -6.3 1.9 24.5 36.5 17.4 680
Loans3
7. Total 2.5 -1.3 2.3 5.6 5.7 13.2 4,051 8. Business -3.6 -6.6 -8.4 -7.5 -13.7 .2 987 9. Real estate 7.2 3.8 6.7 14.9 19.8 20.0 1,902 10. Home equity 19.9 25.6 39.6 41.5 44.0 30.0 197 11. Other 6.1 1.8 3.4 12.0 17.0 18.9 1,705
12. Consumer 3.8 5.3 5.1 -1.7 -6.5 21.8 577 13. Adjusted4 7.4 5.2 4.5 3.4 -3.8 3.8 923 14. Other5 -.3 -13.4 4.9 6.0 6.2 5.6 585
Note. All data are adjusted for breaks caused by reclassifications. Monthly levels are pro rata averages of weekly (Wednesday)levels. Quarterly levels (not shown) are simple averages of monthly levels. Annual levels (not shown) are levels for the fourthquarter. Growth rates are percentage changes in consecutive levels, annualized but not compounded. The conversion from a thriftto a commercial bank charter added approximately $37 billion to the assets and liabilities of domestically chartered commercialbanks in the week ending May 8, 2002. 1. Adjusted to remove effects of mark-to-market accounting rules (FIN 39 and FIN 115). 2. Includes private mortgage-backed securities, securities of corporations, state and local governments, and foreign governmentsand any trading account assets that are not Treasury or Agency securities, including revaluation gains on derivative contracts. 3. Excludes interbank loans. 4. Includes an estimate of outstanding loans securitized by commercial banks. 5. Includes security loans and loans to farmers, state and local governments, and all others not elsewhere classified. Also includeslease financing receivables.
- 21 -
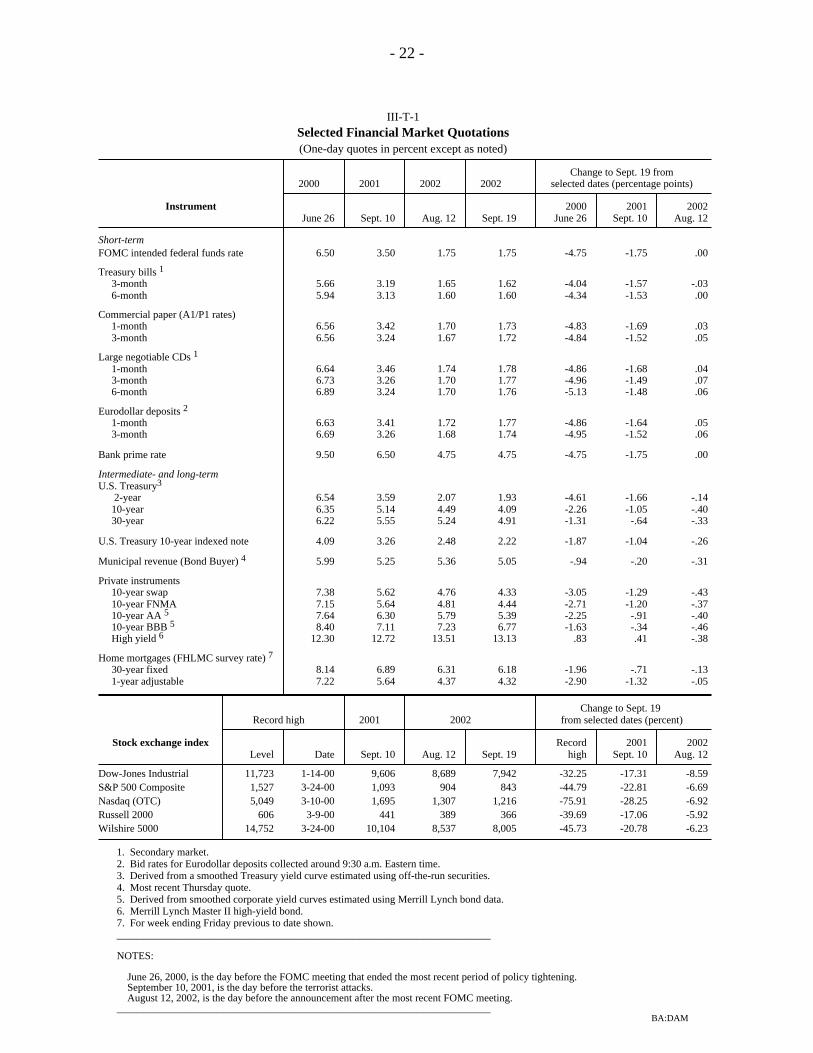
III-T-1Selected Financial Market Quotations(One-day quotes in percent except as noted)
Change to Sept. 19 from2000 2001 2002 2002 selected dates (percentage points)
Instrument 2000 2001 2002 June 26 Sept. 10 Aug. 12 Sept. 19 June 26 Sept. 10 Aug. 12
Short-termFOMC intended federal funds rate 6.50 3.50 1.75 1.75 -4.75 -1.75 .00
Treasury bills 1
3-month 5.66 3.19 1.65 1.62 -4.04 -1.57 -.03 6-month 5.94 3.13 1.60 1.60 -4.34 -1.53 .00
Commercial paper (A1/P1 rates) 1-month 6.56 3.42 1.70 1.73 -4.83 -1.69 .03 3-month 6.56 3.24 1.67 1.72 -4.84 -1.52 .05
Large negotiable CDs 1
1-month 6.64 3.46 1.74 1.78 -4.86 -1.68 .04 3-month 6.73 3.26 1.70 1.77 -4.96 -1.49 .07 6-month 6.89 3.24 1.70 1.76 -5.13 -1.48 .06
Eurodollar deposits 2
1-month 6.63 3.41 1.72 1.77 -4.86 -1.64 .05 3-month 6.69 3.26 1.68 1.74 -4.95 -1.52 .06
Bank prime rate 9.50 6.50 4.75 4.75 -4.75 -1.75 .00
Intermediate- and long-termU.S. Treasury3
2-year 6.54 3.59 2.07 1.93 -4.61 -1.66 -.14 10-year 6.35 5.14 4.49 4.09 -2.26 -1.05 -.40 30-year 6.22 5.55 5.24 4.91 -1.31 -.64 -.33
U.S. Treasury 10-year indexed note 4.09 3.26 2.48 2.22 -1.87 -1.04 -.26
Municipal revenue (Bond Buyer) 4 5.99 5.25 5.36 5.05 -.94 -.20 -.31
Private instruments 10-year swap 7.38 5.62 4.76 4.33 -3.05 -1.29 -.43 10-year FNMA 7.15 5.64 4.81 4.44 -2.71 -1.20 -.37 10-year AA 5 7.64 6.30 5.79 5.39 -2.25 -.91 -.40 10-year BBB 5 8.40 7.11 7.23 6.77 -1.63 -.34 -.46 High yield 6 12.30 12.72 13.51 13.13 .83 .41 -.38
Home mortgages (FHLMC survey rate) 7
30-year fixed 8.14 6.89 6.31 6.18 -1.96 -.71 -.13 1-year adjustable 7.22 5.64 4.37 4.32 -2.90 -1.32 -.05
Change to Sept. 19 Record high 2001 2002 from selected dates (percent)
Stock exchange index Record 2001 2002 Level Date Sept. 10 Aug. 12 Sept. 19 high Sept. 10 Aug. 12
Dow-Jones Industrial 11,723 1-14-00 9,606 8,689 7,942 -32.25 -17.31 -8.59S&P 500 Composite 1,527 3-24-00 1,093 904 843 -44.79 -22.81 -6.69Nasdaq (OTC) 5,049 3-10-00 1,695 1,307 1,216 -75.91 -28.25 -6.92Russell 2000 606 3-9-00 441 389 366 -39.69 -17.06 -5.92Wilshire 5000 14,752 3-24-00 10,104 8,537 8,005 -45.73 -20.78 -6.23
1. Secondary market. 2. Bid rates for Eurodollar deposits collected around 9:30 a.m. Eastern time. 3. Derived from a smoothed Treasury yield curve estimated using off-the-run securities. 4. Most recent Thursday quote. 5. Derived from smoothed corporate yield curves estimated using Merrill Lynch bond data. 6. Merrill Lynch Master II high-yield bond. 7. For week ending Friday previous to date shown. _______________________________________________________________________
NOTES:
June 26, 2000, is the day before the FOMC meeting that ended the most recent period of policy tightening. September 10, 2001, is the day before the terrorist attacks. August 12, 2002, is the day before the announcement after the most recent FOMC meeting. _______________________________________________________________________ BA:DAM
- 22 -
The International Economy
U.S. International Transactions
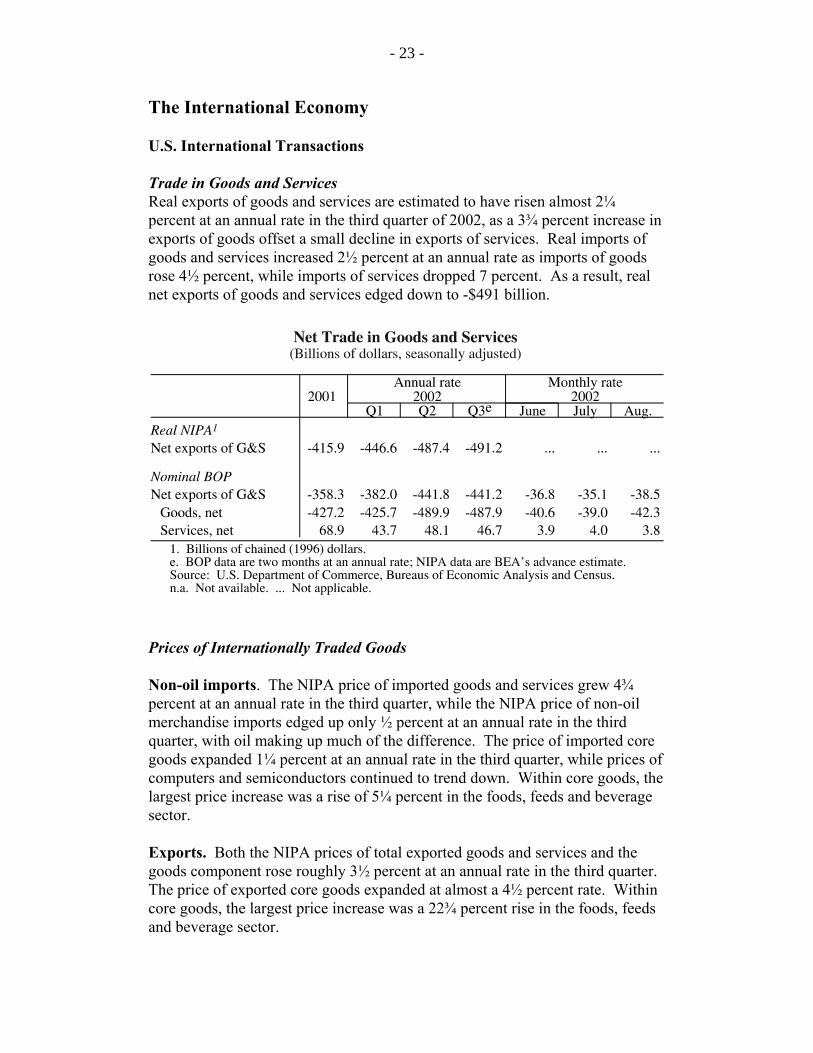
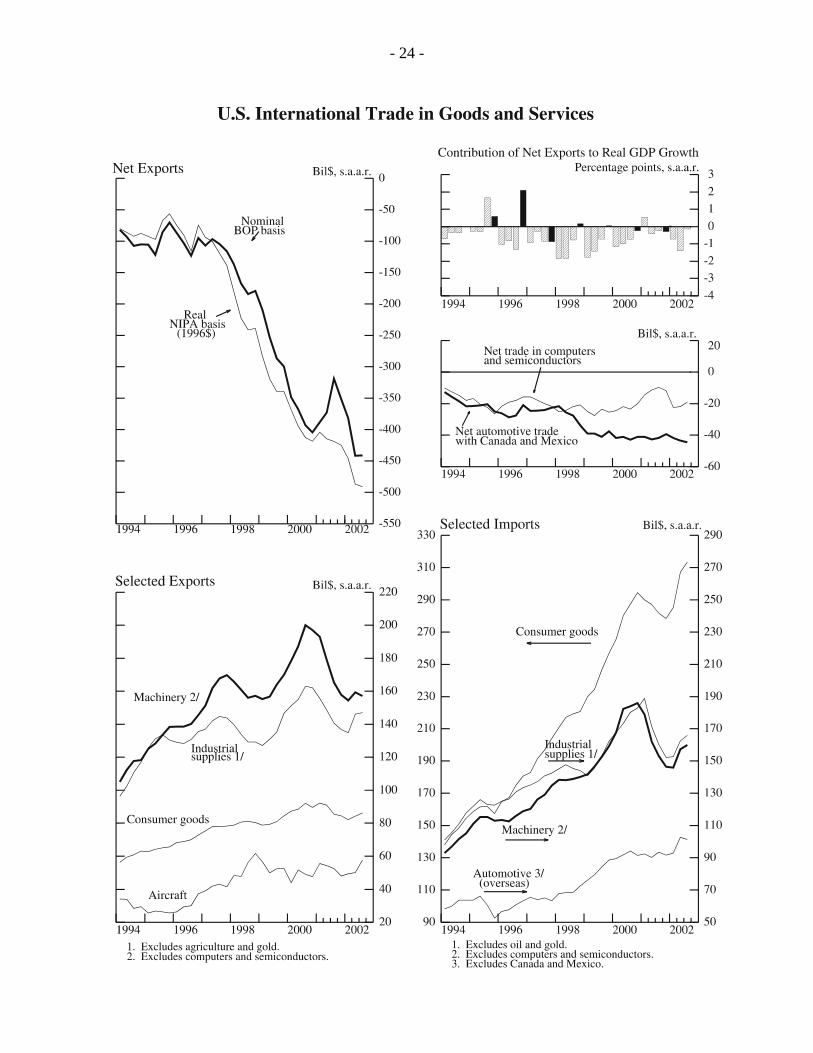
Trade in Goods and ServicesReal exports of goods and services are estimated to have risen almost 2¼percent at an annual rate in the third quarter of 2002, as a 3¾ percent increase inexports of goods offset a small decline in exports of services. Real imports ofgoods and services increased 2½ percent at an annual rate as imports of goodsrose 4½ percent, while imports of services dropped 7 percent. As a result, realnet exports of goods and services edged down to -$491 billion.
Prices of Internationally Traded Goods
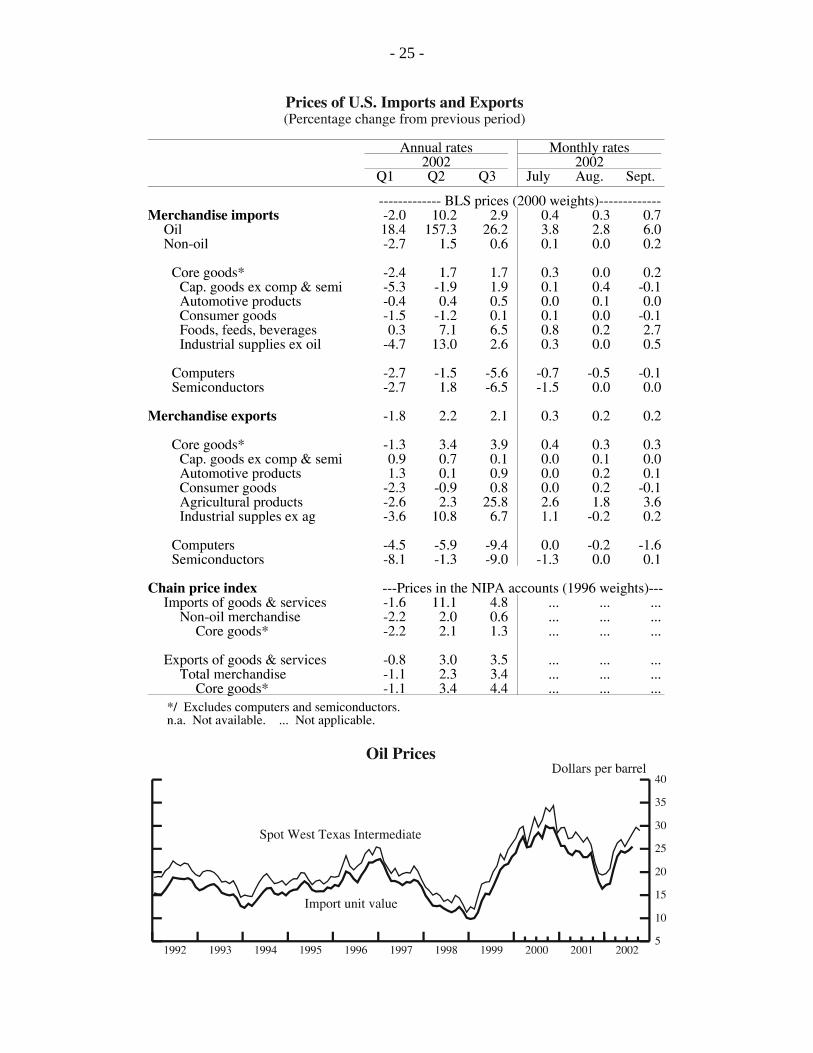
Non-oil imports. The NIPA price of imported goods and services grew 4¾percent at an annual rate in the third quarter, while the NIPA price of non-oilmerchandise imports edged up only ½ percent at an annual rate in the thirdquarter, with oil making up much of the difference. The price of imported coregoods expanded 1¼ percent at an annual rate in the third quarter, while prices ofcomputers and semiconductors continued to trend down. Within core goods, thelargest price increase was a rise of 5¼ percent in the foods, feeds and beveragesector.
Exports. Both the NIPA prices of total exported goods and services and thegoods component rose roughly 3½ percent at an annual rate in the third quarter. The price of exported core goods expanded at almost a 4½ percent rate. Withincore goods, the largest price increase was a 22¾ percent rise in the foods, feedsand beverage sector.
- 23 -
- 24 -
- 25 -