Embed Size (px)
Citation preview

Prefatory Note
The attached document represents the most complete and accurate version available based on original copies culled from the files of the FOMC Secretariat at the Board of Governors of the Federal Reserve System. This electronic document was created through a comprehensive digitization process which included identifying the best-preserved paper copies, scanning those copies,1 and then making the scanned versions text-searchable.2 Though a stringent quality assurance process was employed, some imperfections may remain.
Please note that this document may contain occasional gaps in the text. These gaps are the result of a redaction process that removed information obtained on a confidential basis. All redacted passages are exempt from disclosure under applicable provisions of the Freedom of Information Act.
1 In some cases, original copies needed to be photocopied before being scanned into electronic format. All scanned images were deskewed (to remove the effects of printer- and scanner-introduced tilting) and lightly cleaned (to remove dark spots caused by staple holes, hole punches, and other blemishes caused after initial printing). 2 A two-step process was used. An advanced optimal character recognition computer program (OCR) first created electronic text from the document image. Where the OCR results were inconclusive, staff checked and corrected the text as necessary. Please note that the numbers and text in charts and tables were not reliably recognized by the OCR process and were not checked or corrected by staff.

Confidential (FR) Class III FOMC
March 16, 2001
CURRENT ECONOMICAND FINANCIAL CONDITIONS
Supplemental Notes
Prepared for the Federal Open Market Committeeby the staff of the Board of Governors of the Federal Reserve System

Contents
The Domestic Nonfinancial Economy ........................... 1
Industrial Production and Capacity Utilization ................... . . 1Housing........................................ ................. 5Consumer Sentiment ................... ...................... 5Producer Prices ............................................. 8
TablesSelected Components of Industrial Production ................ 2Private Housing Activity ............................. . . 6Survey of Consumer Attitudes ............................ 7Recent Changes in Producer Prices ........................ 9
ChartInventory-Sales Ratios and Industrial Production
in Selected Industries ................................ 3Inventory-Sales Ratios and Industrial Production
in Selected Industries .................... .......... 4Total Private Building .............................. 6
The Financial Economy
TableSelected Financial Market Quotations ................... . 11
The International Economy ................................ 12
U.S. International Transactions ................. .............. 12Prices of Internationally Traded Goods .......................... 12U.S. Current Account Through 2000:Q4 .......................... 12U.S. International Financial Transactions ................... ..... 15
TablePrices of U.S. Imports and Exports ................... ..... 13U.S. Current Account ....... ............... .......... 14Summary of U.S. International Transactions ................. 16
ChartOil Prices ......................................... 13
Supplemental Notes
The Domestic Nonfinancial Economy
Industrial Production and Capacity UtilizationIndustrial production declined 0.6 percent in February following a downward-revised decrease of 0.6 percent in January. Relative to the previous month, thecontraction in manufacturing activity broadened considerably in February, andfactory output fell 0.4 percent. Production at utilities moved down in the firsttwo months of the year, retracing nearly all of the weather-related spike inDecember. The manufacturing operating rate dropped to 78.1 percent inFebruary, about 3-1/2 percentage points lower than its long-run average.
Conditions in the high-tech sector continued to deteriorate, with productionrising a slow 0.8 percent in February. The output of computers posted amoderate gain of 1 percent, well below last year's average monthly rate of2.6 percent. Production of communications equipment increased by a similaramount. Anecdotal reports by several major producers suggest that, in additionto consumer demand, which had already begun showing signs of weakness inthe fourth quarter, business demand has dropped back substantially in recentmonths. Moreover, several major firms, including Cisco, Motorola, andCompaq, announced layoffs that are expected to take effect by the end of thesecond quarter. Owing, in part, to the drop-back in demand for computers andcommunication equipment, the production of semiconductors slowednoticeably, edging up only 0.3 percent in February-4.2 percentage pointsbelow the average monthly rate in 2000, and the slowest monthly rate sinceApril 1993.
Elsewhere in manufacturing, the output of motor vehicles and parts ticked down0.1 percent. Assemblies were little changed, while production at parts facilitiesdropped for the fourth consecutive month. Although light vehicle inventoriesremain somewhat elevated, given the surprising strength in retail demand so farthis year, we believe that the sharpest declines for this sector likely are behindus. Production of aircraft and parts was flat after having declined for twomonths.
Output in all of the broad market categories of IP weakened in February,reflecting, in part, sizable inventory overhangs in many sectors. The productionof business equipment fell 0.9 percent, led by a large decrease in the output ofindustrial equipment. Production of construction supplies, which had been flatfor two months, also dropped 0.9 percent. Within non-energy materials,industries that have posted noticeable declines so far this year include basicmetals-particularly iron, steel, and aluminum-and textiles. In part due tohigh energy costs, capacity utilization in aluminum smelting has fallen to about70 percent, and industry reports indicate that most of this idled capacity will notbe restarted in 2001.

-2-
SELECTED COMPONENTS OF INDUSTRIAL PRODUCTION(Percent change from preceding comparable period)
2000 2000 2001Proportion
2000 H1 1 Q3 Q4 Dec. Jan. Feb.
----Annual rate----- --Monthly rate---
Total 100.0 7.3 3.5 -.6 -.3 -.6 -.6Previous 7.3 3.5 -1.1 -.6
Manufacturing 87.8 7.6 3.7 -1.3 -.8 -.6 -.4Excluding:High technology industries 78.4 1.9 -1.4 -4.3 -1.0 -.8 -.6Motor vehicles and parts 82.1 7.6 4.9 .4 -.5 -.1 -.5
Mining 6.3 2.1 2.8 -.7 -.8 2.1 -.5Utilities 5.9 8.1 1.0 10.1 6.4 -3.3 -2.3
Selected industries:
High technology 9.4 72.0 56.9 26.3 1.5 1.0 .8Computers 2.7 46.5 51.9 24.8 .4 1.0 1.0Communication equipment 2.0 35.3 41.6 30.2 .6 2.6 1.6Semiconductors2 4.7 109.8 66.4 25.5 2.5 .4 .3
Motor vehicles and parts 5.7 6.4 -11.2 -23.6 -5.2 -9.4 -.1
Aircraft and parts 2.2 -7.7 11.6 5.3 -.3 -1.2 .0
Market groups, excluding energyand selected industries:
Consumer goods 22.5 1.7 -.3 -1.6 .1 .0 -.6Durables 3.5 -.7 -9.5 -4.8 1.9 -1.2 -.6Nondurables 19.0 2.2 1.6 -1.1 -.3 .2 -.6
Business equipment 8.4 7.9 4.6 4.1 -.6 -.2 -.9
Construction supplies 6.1 3.6 -1.1 -3.9 .0 .0 -.9
Materials 24.2 .8 -3.1 -7.4 -1.5 -.2 -.7Durables 15.9 2.6 -.6 -7.2 -1.2 -.2 -.7Nondurables 8.3 -2.6 -7.6 -7.7 -2.0 -.1 -.6
1. From the final quarter of the previous period to the final quarter of theperiod indicated.
2. Includes related electronic components.
CAPACITY UTILIZATION(Percent of capacity)
1988-89 1959-2000 2000 2000 2001
High Avg. Q2 Q3 Q4 Dec. Jan. Feb.
Manufacturing 85.7 81.6 81.9 81.7 80.4 79.5 78.7 78.1Primary processing 88.3 82.7 86.4 85.4 82.8 81.1 79.7 78.8Advanced processing 84.2 81.1 79.8 80.1 79.6 79.2 78.8 78.4
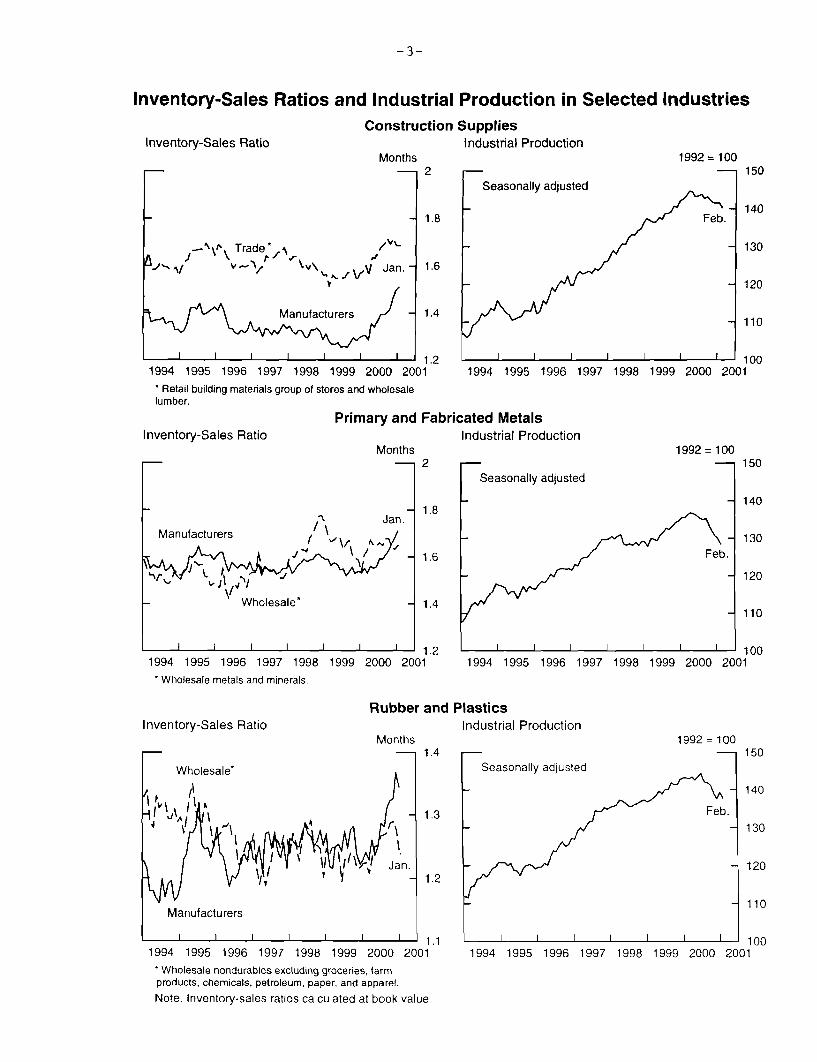
Inventory-Sales Ratios and Industrial Production in Selected Industries
Inventory-Sales Ratio
-'\ Trade* .
I v
Construction SuppliesIndustrial Production
Months- r2
SJan.
V^V Jan. -
k, 1Manufacturers 1.4
- I I I I I I 1.21994 1995 1996 1997 1998 1999 2000 2001
* Retail building materials group of stores and wholesalelumber.
Inventory-Sales Ratio
1992 = 100
I I I I I I I 1 1001994 1995 1996 1997 1998 1999 2000 2001
1992 = 100
Manufacturers
Wholesale*
I I I I I I I
1994 1995 1996 1997 1998 1999* Wholesale metals and minerals.
2000 20012000 2001
I I I I I I i 1001994 1995 1996 1997 1998 1999 2000 2001
Inventory-Sales RatioRubber and Plastics
Industrial ProductionMonths 1992 = 100
I I I I I- I I 10 01994 1995 1996 1997 1998 1999 2000 2001
Primary and Fabricated MetalsIndustrial Production
Months-
1994 1995 1996 1997 1998 1999 2000 2001
SWholesale nondurables excluding groceries, farmproducts, chemicals, petroleum, paper, and apparel.
Note. Inventory-sales ratios calculated at book value.
I
i^AA
1
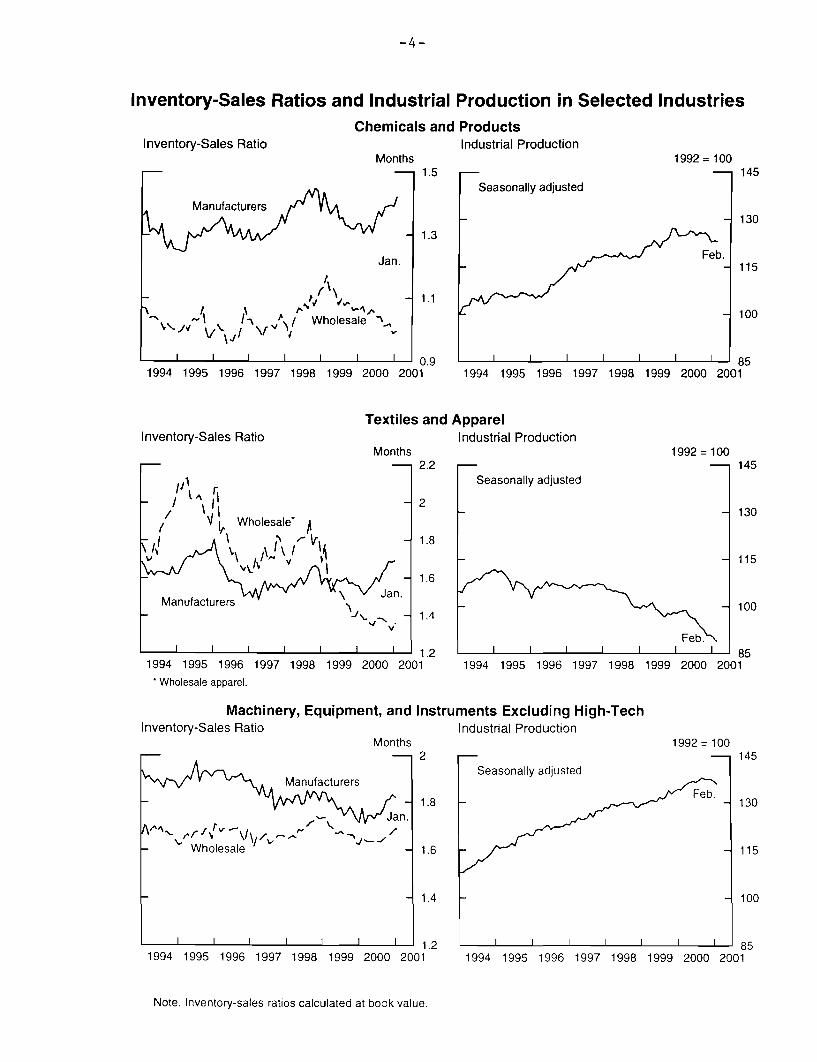
Inventory-Sales Ratios and IndustrialChemicals and
Inventory-Sales RatioMonths
1.5
Manufacturers
1.3
Jan.
~II, , / Wholesale %,'- \.I \ V.
Production in Selected IndustriesIProductsIndustrial Production
1992 = 100- - 145
Seasonally adjusted
- 130
Feb.S- 115
100
I I I I I I 0 .9 I I I I I 1 1851-- ------------- i0.9 I----- i-l--l---l--l --- l 851994 1995 1996 1997 1998 1999 2000 2001 1994 1995 1996 1997 1998 1999 2000 2001
Textiles and ApparelInventory-Sales Ratio Industrial Production
Months 1992 = 100- -2.2 - - 145
I Seasonally adjusted
/ \I - 130Wholesale* A
I 1.8
1.6Sv Jan.
Manufacturers a . - - 100-\J. - 1.4
Feb.I 11I I1.2 - I I I I I I F 85
1994 1995 1996 1997 1998 1999 2000 2001 1994 1995 1996 1997 1998 1999 2000 2001SWholesale apparel.
Machinery, Equipment, and Instruments Excluding High-TechInventory-Sales Ratio Industrial Production
Months 1992=1002 -- 145
Manuacuers Seasonally adjustedManufacturers
1.8 - 130
Wholesale - 1.6 - 115
S1.4 - 100
1 11I I 1.2 1 11 1 851994 1995 1996 1997 1998 1999 2000 2001 1994 1995 1996 1997 1998 1999 2000 2001
Note. Inventory-sales ratios calculated at book value.

HousingTotal private housing starts in February were essentially unchanged at anannual rate of 1.65 million units.' In the single-family sector, starts slippedalmost 2-1/2 percent to an annual rate of 1.32 million units in February; wehad expected a small increase. Adjusted permits for single-familyconstruction fell only 1 percent in February, and were at a slightly higher levelthan starts. In addition, the backlog of single-family permits rose slightly lastmonth. By themselves, these data would suggest a small increase in single-family starts for March.
Multifamily housing starts-which jump around a lot from month tomonth-rose almost 9 percent to an annual rate of 332,000 units in February.Although adjusted permits for multifamily construction fell slightly inFebruary, the ratio of starts to adjusted permits still remained low by historicalstandards.
Consumer SentimentAccording to the preliminary release, the Michigan SRC index of consumersentiment posted a small gain in early March - its first increase since lastNovember. Respondents were noticeably more optimistic overall aboutexpected future business conditions; they were also a bit more upbeat abouttheir personal finances over the next twelve months. In contrast, consumershad less favorable assessments of their current personal financial situations.Their appraisals of buying conditions for large household appliances wereabout unchanged. Some of the improvement in sentiment this month appearsto owe to fewer respondents having heard unfavorable news aboutunemployment. At the same time, however, a higher proportion of householdsthat said they heard unfavorable news about the stock market.2
Among those questions not in the overall index, the index of expectedunemployment edged up in early March, but the increase was smaller thanthose of recent months. Respondents had more favorable assessments of carbuying conditions early this month, reflecting improved views on car pricesand financing rates. In contrast, appraisals of home buying conditions slippeda bit owing in part to some dissatisfaction with mortgage rates.
1. By region, total starts rose 20 percent in the Northeast, retracing much of January's25 percent decline, and starts fell only slightly in the Midwest after January's remarkable45 percent increase. Elsewhere, an increase in starts in the South only partially offset a declinein the West.
2. In early March, 41 percent of respondents reported that they had heard unfavorable newsabout unemployment - down from 49 percent in February. In March. 16 percent said that theyhad heard unfavorable news about the stock market versus 11 percent in February.
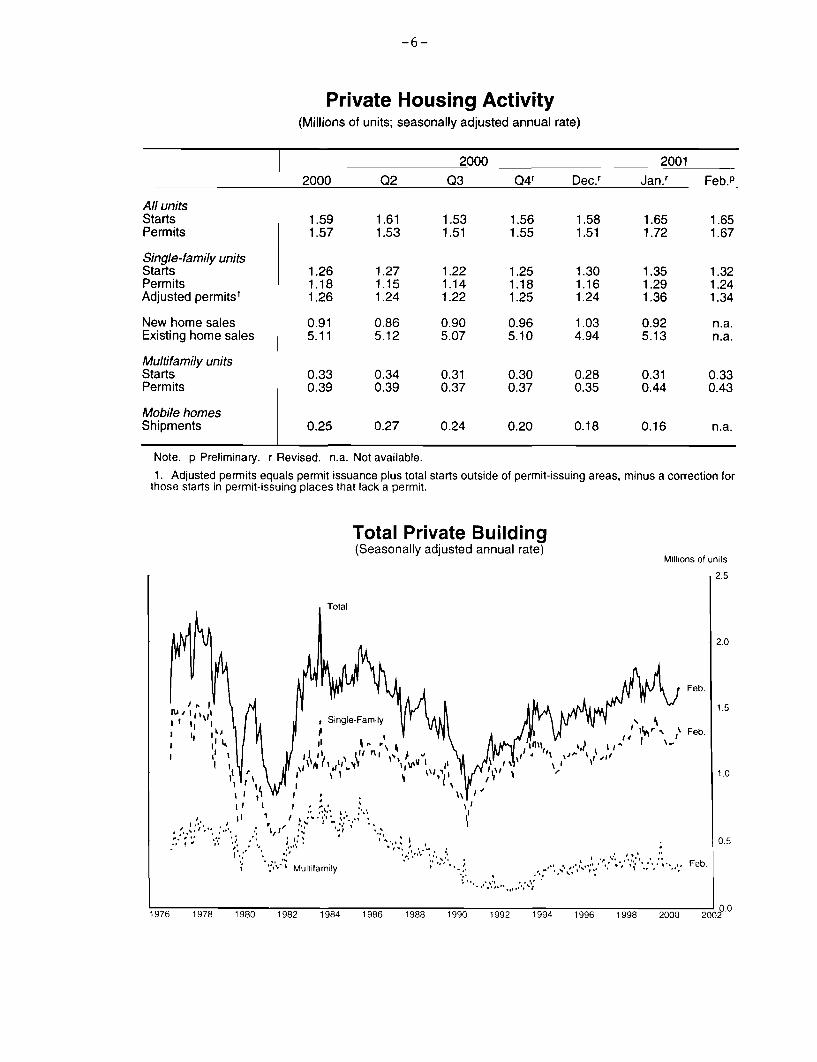
Private Housing Activity(Millions of units; seasonally adjusted annual rate)
All unitsStartsPermits
Single-family unitsStartsPermitsAdjusted permits1
New home salesExisting home sales
Multifamily unitsStartsPermits
Mobile homesShipments
2000
1.591.57
1.261.181.26
0.915.11
0.330.39
0.25
2000Q2 Q3 Q4r
1.611.53
1.271.151.24
0.865.12
0.340.39
0.27
1.531.51
1.221.141.22
0.905.07
0.310.37
0.24
1.561.55
1.251.181.25
0.965.10
0.300.37
0.20
Dec.r
1.581.51
1.301.161.24
1.034.94
0.280.35
0.18
2001
Jan.r Feb.P
1.651.72
1.351.291.36
0.925.13
0.310.44
0.16
1.651.67
1.321.241.34
n.a.n.a.
0.330.43
n.a.
Note. p Preliminary. r Revised. n.a. Not available.
1. Adjusted permits equals permit issuance plus total starts outside of permit-issuing areas, minus a correction forthose starts in permit-issuing places that lack a permit.
Total Private Building(Seasonally adjusted annual rate)
I' i ' , I ' r
(I -
, i , .., ,, , . ., , ., ..- ..; ..
S . ; . .. l '..
,, ,, 5,,.*- Feb.' ' " Multifamily " , '
'!
'***^. .. :^ '
1976 1978 1980 1982 1984 1986 1988 1990 1992 1994 1996 1998 2000
It/ 1
I I,I
I
Millions of units
2.5
2.0
SFeb.1.5
, Feb.
2CS0.)02

March 16, 2001
UNIVERSITY OF MICHIGAN SURVEY RESEARCH CENTER: SURVEY OF CONSUMER ATTITUDES(Not seasonally adjusted)
2000 2000 2000 2000 2000 2000 2001 2001 2001July Aug. Sept. Oct. Nov. Dec. Jan. Feb. Mar
(p)
Indexes of consumer sentiment (Feb. 1966=100)
Composite of current and expected conditionsCurrent conditionsExpected conditions
Personal financial situationNow compared with 12 months ago*Expected in 12 months*
Expected business conditionsNext 12 months*Next 5 years*
Appraisal of buying conditionsCarsLarge household appliances*Houses
Willingness to use creditWillingness to use savings
Expected unemployment change - next 12 months
Prob. household will lose a job - next 5 years
Expected inflation - next 12 monthsMeanMedian
Expected inflation - next 5 to 10 yearsMeanMedian
108.3 107.3 106.8 105.8114.2 112.4 112.0 113.6104.5 104.0 103.4 100.7
107.6116.9101.6
98.4110.5
90.7
94.7107.7
86.4
90.6105.8
80.8
91.8104.184.0
130 126 124 129 133 126 123 122 116139 139 132 132 137 131 126 129 132
148 151 149 143 142 121 106 93 94135 130 136 132 131 113 115 102 111
141 147 145 144 149 146 133 137 147167 166 167 166 170 161 157 152 153136 138 144 134 152 139 149 149 145
43 41 42 3362 72 67 55
111 108 111 117 114 127 139 143 145
23 21 21 19 20 19 20 23 21
3.7 3.5 3.7 4.1 3.8 3.4 3.8 3.2 3.43.0 2.7 2.9 3.2 2.9 2.8 3.0 2.8 2.9
3.2 3.5 3.6 3.7 3.6 3.7 3.5 3.6 3.52.8 2.9 3.0 3.0 2.9 3.0 2.9 3.0 3.0
* -- Indicates the question is one of the five
(p) -- Preliminary(f) -- Final
equally-weighted components of the index of sentiment.
Note: Figures on financial, business, and buying conditions are the percent reporting 'good times' (or'better') minus the percent reporting 'bad times' (or 'worse'), plus 100. Expected change inunemployment is the fraction expecting unemployment to rise minus the fraction expectingunemployment to fall, plus 100.
The mean of expected inflation over the next 12 months rose 0.2 percentagepoint to 3.4 percent in March, and the median edged up 0.1 percentage point to2.9 percent. The mean of expected inflation over the next 5 to 10 years tickeddown 0.1 percentage point to 3.5 percent, and the median was unchanged at3 percent.
Producer PricesThe producer price index for finished goods rose 0.1 percent in February,following a sharp 1.1 percent increase in January. Excluding food and energy,the index fell 0.3 percent last month, largely because of sharp declines in pricesfor motor vehicles. Over the twelve months ending in February, the core PPIincreased 1.3 percent, a pickup of 0.3 percentage point from the year-earlierperiod.
Wholesale energy prices rose 1.4 percent in February, as substantial increases innatural gas, electricity, and other energy prices more than offset declines forgasoline and heating oil. The February jump for natural gas came despite sharpdeclines in spot natural gas prices that began late in January and that by the endof February had cumulated to roughly a 50 percent drop. Prices for electricityrose further in the February report, as utilities apparently continued to passthrough previous increases in generating costs. Overall, energy prices were upabout 18 percent over the past twelve months, about 6 percentage points lessthan the increase twelve months earlier.
The PPI for finished foods rose 0.6 percent in February, with sharp increases forfresh vegetables, poultry and eggs, and fish. Over the past twelve months, thePPI for food was up 2.4 percent, an acceleration of 1.2 percentage points fromthe year earlier twelve-month change, mainly reflecting a bulge in prices ofvegetables and livestock products.
Prices of core consumer goods fell 0.4 percent in February, partly reversing ajump of 0.8 percent the previous month. Most of the February decline reflectedlower prices for cars and light trucks, which fell 1.5 percent and 3.6 percent,respectively. These declines came as automakers instituted discount programson a wide variety of products-though given the available information on theseprograms from anecdotal reports and our industry contacts, we were surprisedby the extent of the drop in these PPIs. The February decline in core consumergoods prices left the twelve-month change for this category at 1.5 percent, thesame rate of increase as in the previous year.
Prices of capital goods fell 0.3 percent in February, pulled down by the lowerprices for motor vehicles. Computer prices declined 1.1 percent last month andwere down 16-1/2 percent from a year earlier. The PPI for applications softwarefell 1.3 percent in February, largely reversing a 2.0 percent increase the previous
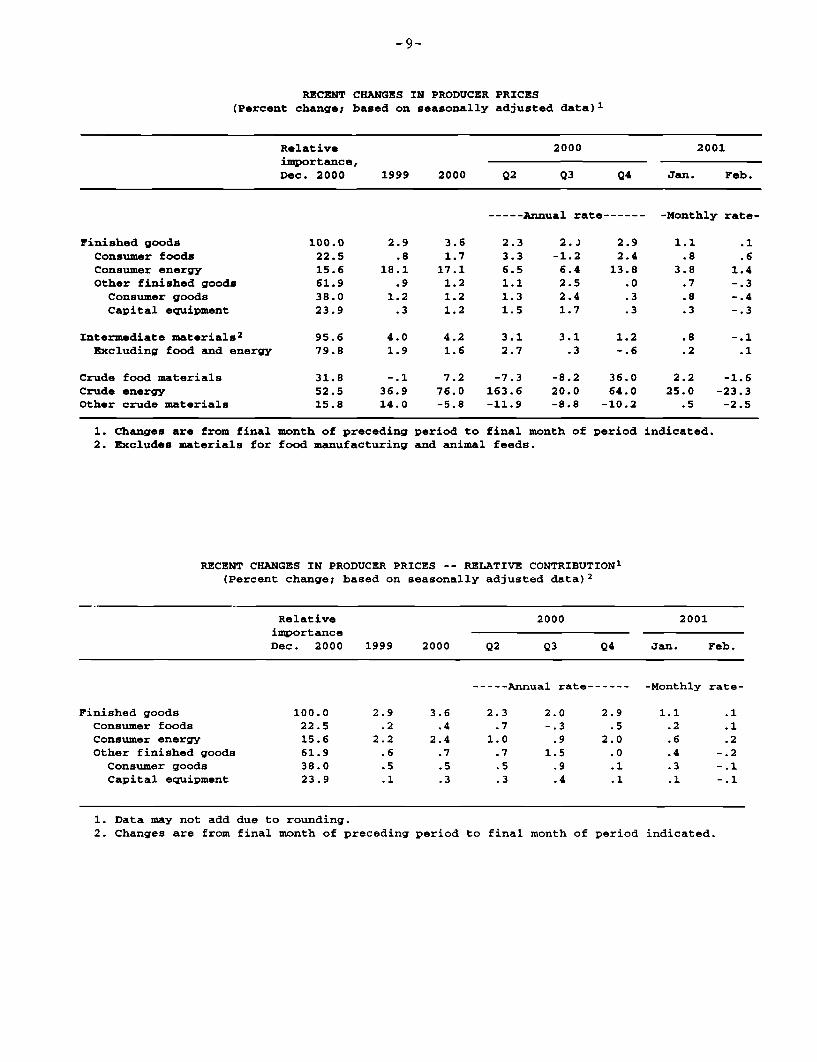
RECENT CHANGES IN PRODUCER PRICES(Percent change; based on seasonally adjusted data) 1
Relative 2000 2001
importance,Dec. 2000 1999 2000 Q2 Q3 Q4 Jan. Feb.
----- Annual rate------ -Monthly rate-
Finished goods 100.0 2.9 3.6 2.3 2.J 2.9 1.1 .1Consumer foods 22.5 .8 1.7 3.3 -1.2 2.4 .8 .6Consumer energy 15.6 18.1 17.1 6.5 6.4 13.8 3.8 1.4Other finished goods 61.9 .9 1.2 1.1 2.5 .0 .7 -.3
Consumer goods 38.0 1.2 1.2 1.3 2.4 .3 .8 -.4Capital equipment 23.9 .3 1.2 1.5 1.7 .3 .3 -.3
Intermediate materials 2 95.6 4.0 4.2 3.1 3.1 1.2 .8 -.1Excluding food and energy 79.8 1.9 1.6 2.7 .3 -.6 .2 .1
Crude food materials 31.8 -.1 7.2 -7.3 -8.2 36.0 2.2 -1.6Crude energy 52.5 36.9 76.0 163.6 20.0 64.0 25.0 -23.3Other crude materials 15.8 14.0 -5.8 -11.9 -8.8 -10.2 .5 -2.5
1. Changes are from final month of preceding period to final month of period indicated.2. Excludes materials for food manufacturing and animal feeds.
RECENT CHANGES IN PRODUCER PRICES -- RELATIVE CONTRIBUTION1
(Percent change; based on seasonally adjusted data) 2
Relative 2000 2001importanceDec. 2000 1999 2000 Q2 Q3 Q4 Jan. Feb.
----- Annual rate------ -Monthly rate-
Finished goods 100.0 2.9 3.6 2.3 2.0 2.9 1.1 .1Consumer foods 22.5 .2 .4 .7 -.3 .5 .2 .1Consumer energy 15.6 2.2 2.4 1.0 .9 2.0 .6 .2Other finished goods 61.9 .6 .7 .7 1.5 .0 .4 -.2
Consumer goods 38.0 .5 .5 .5 .9 .1 .3 -.1Capital equipment 23.9 .1 .3 .3 .4 .1 .1 -.1
1. Data may not add due to rounding.2. Changes are from final month of preceding period to final month of period indicated.

-10-
month. Over the past six months, this volatile index has edged down a bit, afterhaving posted sharp increases earlier in the year.3
At earlier stages of processing, the index for intermediate goods excluding foodand energy edged up 0.1 percent in February. Over the past year, prices of coreintermediate goods rose 1.3 percent, a deceleration of 1-1/2 percentage pointsfrom the previous year. Prices of crude goods excluding food and energy fell2.5 percent in February, more than reversing a 0.5 percent increase the previousmonth.
3. The BEA uses this index as the quarterly indicator for prepackaged software prices in theNIPAs. However, because it is a component of the PPI for service industries, it is not includedin the finished goods PPIs discussed in this memo.

-11-
Selected Financial Market Quotations(One-day quotes in percent except as noted)
Change to Mar. 15 from2000 2001 selected dates (percentage points)
Instrument 2000 2001 2001June 26 Jan. 2 Jan. 30 Mar. 15 June 26 Jan. 2 Jan. 30
Short-termFOMC intended federal funds rate
Treasury bills 13-month6-monthI-year
Commercial paper1-month3-month
Large negotiable CDs1-month3-month6-month
Eurodollar deposits 21-month3-month
Bank prime rate
Intermediate- and long-termU.S. Treasury (constant maturity)
2-year10-year30-year
U.S. Treasury 10-year indexed note
Municipal revenue (Bond Buyer) 3
Private instruments10-year swap10-year FNMAMemll Lynch BBBHigh yield 4
Home mortgages (FHLMC survey rate) 530-year fixed1-year adjustable
Stock exchange index
Dow-Jones Industrial
S&P 500 Composite
Nasdaq (OTC)Russell 2000
Wilshire 5000
6.50 6.50 6.00 -1.00 -1.00
-1.25 -1.28-1.67 -1.09-1.81 -.91
5.47 5.02 -1.54 -1.435.40 4.78 -1.78 -1.37
-1.63 -1.48 -.57-1.87 -1.41 -.59-2.15 -1.33 -.52
-1.66 -1.49 -.56-1.82 -1.40 -.57
-1.00 -1.00 -.50
-.77 -.30 -.25
-.59 -. 08 -.07
7.38 5.95 6.057.15 5.74 5.928.49 7.81 7.63
11.97 13.00 11.88
7.13 7.15 6.976.93 6.64 6.29
-. 16 -.18-.64 -.35
Change to Mar. 15from selected dates (percent)
Record 2001 2001Level Date Jan. 2 Jan. 30 Mar. 15 high Jan. 2 Jan. 30
11.723 1-14-00 10.646 10.881 10.031 -14.43 -5.78 -7.81
1.527 3-24-00 1.283 1.374 1.174 -23.17 -8.55 -14.57
5.049 3-10-00 2.292 2.838 1.941 -61.56 -15.32 -31.63
606 3-9-00 462 512 452 -25.40 -2.23 -11.63
14.752 3-24-00 11.764 12.719 10.783 -26.91 -8.34 -15.23
1. Secondary market.2. Bid rates for Eurodollar deposits collected around 9:30 a.m. Eastern time3. Most recent Thursday quote.4. Merrill Lynch 175 high-yield bond index composite.5. For week ending Friday previous to date shown.
NOTES:
June 26. 2000. is the day before the final FOMC meeting during the most recent period of policy tightening.January 2. 2001. is the day before the intermeeting FOMC action.January 30. 2001. is the day before the most recent FOMC meeting.
BA:DAM

-12-
The International Economy
U.S. International Transactions
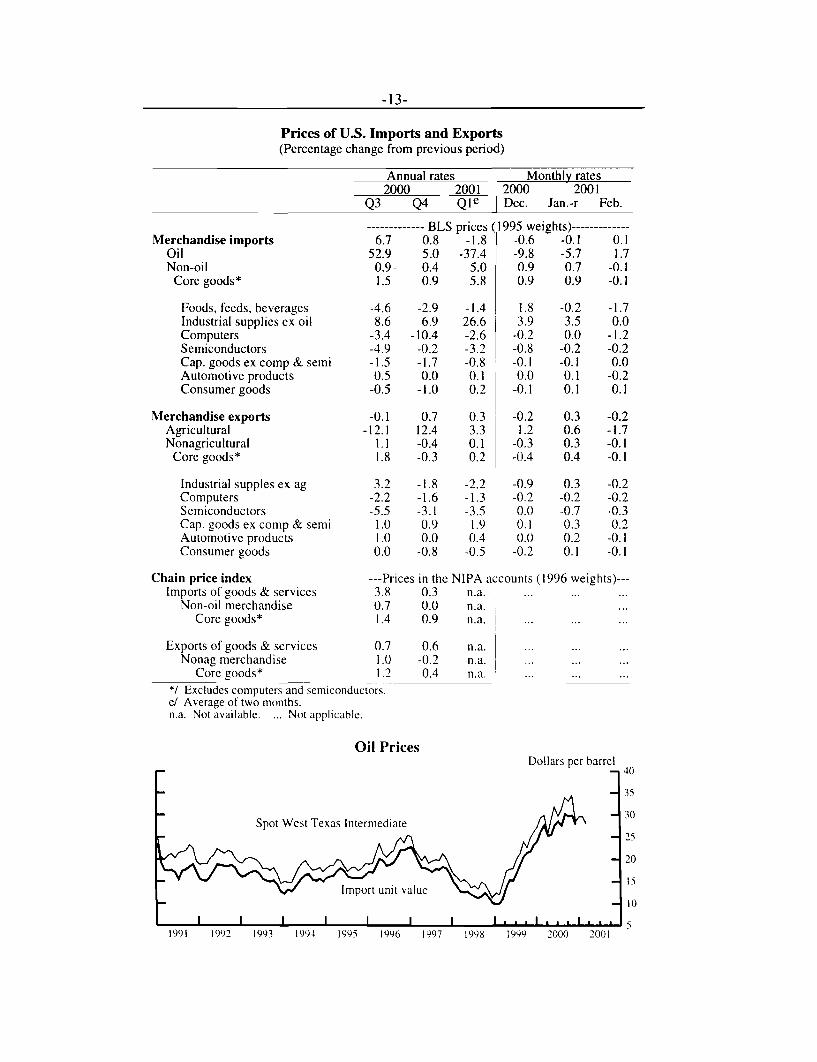
Prices of Internationally Traded GoodsOil. Following two months of declines, the BLS price of imported oil roseslightly in February, largely because of OPEC's decision in mid-January to cutproduction targets. Through the first half of March, the spot price of West TexasIntermediate averaged close to $28 per barrel, but recently has fallen below$26.50 per barrel amid concerns of further weakness in economic activity.
Non-oil imports Prices of imported non-oil goods (and core goods) declined0.1 percent in February following large increases in January (revised) andDecember. Virtually all of the increase in non-oil (and core) import prices inDecember and January was from natural gas. The price of imported non-oilindustrial supplies was flat in February as a small decline in the price of naturalgas for February (BLS preliminary estimate) was offset by increases in otherprices, particularly building materials and metals. Prices of most other importedcore goods (which exclude oil, computers, and semiconductors) declined inFebruary or were little changed.
For January-February combined, the price of imported core goods rose nearly 6percent at an annual rate, almost entirely because of rising natural gas prices.Spot prices of natural gas plunged nearly 50 percent between mid-January andthe first week of March, bringing the spot price level back to where it was beforethe run-up began.
Exports. Prices of U.S. goods exports declined slightly in February following asmall increase in January. All major categories of exported core goods (whichexclude agricultural products, computers, and semiconductors) declined with theexception of machinery, which rose a bit. For January-February combined,prices of core goods exports were about flat, as increases in prices of machineryand automotive products were nearly offset by declines in prices of industrialsupplies and consumer goods. Prices of agricultural exports declined (as grainprices moved lower in February) following five consecutive months of increases.
U.S. Current Account through 2000:Q4The U.S. current account deficit rose to a seasonally adjusted annual rate of $461billion in the fourth quarter of 2000, an increase of nearly $9 billion over thethird quarter (revised). A $14 billion (annual rate) widening in the deficit on
-13-
Prices of U.S. Imports and Exports(Percentage change from previous period)
Merchandise importsOilNon-oil
Core goods*
Foods, feeds, beveragesIndustrial supplies ex oilComputersSemiconductorsCap. goods ex comp & semiAutomotive productsConsumer goods
Merchandise exportsAgriculturalNonagricultural
Core goods*
Industrial supples ex agComputersSemiconductorsCap. goods ex comp & semiAutomotive productsConsumer goods
Chain price indexImports of goods & services
Non-oil merchandiseCore goods*
Exports of goods & servicesNonag merchandise
Core goods*
*/ Excludes computers and semiconductors.e/ Average of two months.n.a. Not available. ... Not applicable.
Annual rates Monthly rates2000 2001 2000 2001
Q3 Q4 Qle Dec. Jan.-r Feb.
---------- BLS prices (1995 weights)-------------6.7 0.8 -1.8 -0.6 -0.1 0.1
52.9 5.0 -37.4 -9.8 -5.7 1.70.9- 0.4 5.0 0.9 0.7 -0.11.5 0.9 5.8 0.9 0.9 -0.1
-4.6 -2.9 -1.48.6 6.9 26.6
-3.4 -10.4 -2.6-4.9 -0.2 -3.2-1.5 -1.7 -0.80.5 0.0 0.1
-0.5 -1.0 0.2
-0.1 0.7 0.3-12.1 12.4 3.3
1.1 -0.4 0.11.8 -0.3 0.2
1.8 -0.2 -1.73.9 3.5 0.0
-0.2 0.0 -1.2-0.8 -0.2 -0.2-0.1 -0.1 0.00.0 0.1 -0.2
-0.1 0.1 0.1
-0.2 0.3 -0.21.2 0.6 -1.7
-0.3 0.3 -0.1-0.4 0.4 -0.1
3.2 -1.8 -2.2 -0.9 0.3 -0.2-2.2 -1.6 -1.3 -0.2 -0.2 -0.2-5.5 -3.1 -3.5 0.0 -0.7 -0.3
1.0 0.9 1.9 0.1 0.3 0.21.0 0.0 0.4 0.0 0.2 -0.10.0 -0.8 -0.5 -0.2 0.1 -0.1
---Prices in the NIPA accounts (1996 weights)---3.8 0.3 n.a.0.7 0.0 n.a.1.4 0.9 n.a. ..
0.7 0.6 n.a. ...1.0 -0.2 n.a. ...1.2 0.4 n.a. ...
Dollars per barrel- 40
Spot West Texas Intermediate
Import unit value
I I I I I I I I I ,. 1 .. .I , 11991 1992 1993 1994 1995 1996 1997 1998 1999 2000 2001
Oil Prices

-14-
merchandise trade more than accounted for the increase in the current accountdeficit. In addition, there was a $12 billion increase in the deficit on otherincome and transfers driven entirely by an increase in U.S. government grants,primarily the annual transfer to Israel. These deficit increases were partiallyoffset by a $1 billion (annual rate) increase in the services balance and a $16billion increase in net investment income. For portfolio investment income,payments increased $3 billion more than receipts (at an annual rate), as netportfolio liabilities continued to grow. On the other hand, for direct investmentincome, payments fell $11 billion, reflecting reduced profitability of foreignholdings in the U.S. manufacturing sector for the second quarter in a row, whilereceipts increased $7 billion on the continued growth in gross holdings offoreign direct investment assets.
For the year 2000, the U.S. current account deficit totaled $435 billion, anincrease of $104 billion over 1999. A $104 billion increase in the merchandisetrade deficit accounted entirely for this increase. The services balance wasunchanged in 2000 at $81 billion. Net investment income increased by $5billion to -$8 billion, while other income and unilateral transfers decreased by $5billion to -$53 billion.
U.S. Current Account(Billions of dollars, seasonally adjusted annual rate)
Goods and Investment Other CurrentPeriod services, income, income and account
net net transfers, net balance
Annual1999 -265.0 -13.1 -53.4 -331.52000 -368.5 -8.1 -58.8 -435.4
Quarterly2000:Q1 -341.0 -12.2 -53.8 407.1
Q2 -355.0 -11.1 -54.9 421.0Q3 -382.5 -12.7 -57.2 -452.4Q4 -395.4 3.5 -69.1 -461.1
ChangeQ1-Q4 -35.9 5.1 8.7 -22.2Q2-Q1 -14.0 1.1 -1.1 -13.9Q3-Q2 -27.5 -1.7 -2.3 -31.5Q4-Q3 -12.9 16.2 -11.9 -8.6
Source: U.S. Department of Commerce, Bureau of Economic Analysis.
-15-
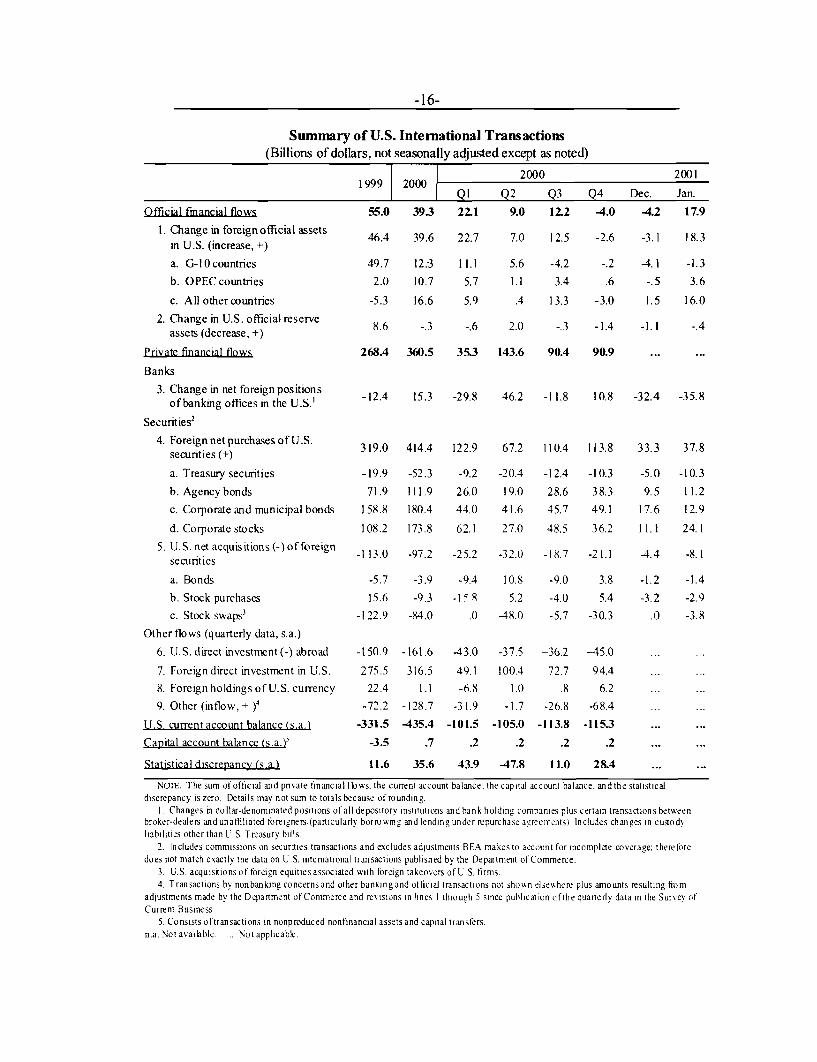
U.S. International Financial TransactionsRecently released balance of payments data showed foreign direct investment inthe United States (line 7 of the Summary of U.S. International Transactionstable) increased to a substantial $94 billion in the fourth quarter of last year.Most of this inflow was associated with merger and acquisition activity, with theacquisition of Best Foods by Unilever accounting for $25 billion. For the year,foreign direct investment in the United States was a record $317 billion,compared with $276 billion in 1999. U.S. direct investment abroad (line 6)totaled $45 billion for the quarter, up slightly from the third quarter but in linewith recent levels. For the year, U.S. direct investment abroad totaled $162billion-a slight increase from 1999.
Foreigners increased their holdings of U.S. currency by $6 billion in the fourthquarter, but by only $1 billion for the year as a whole. Currency flows werenegative in the first quarter of 2000 and near zero in the second and thirdquarters as the build-up associated with the century date change was unwound.The outflow in the fourth quarter was more typical of the flows seen throughoutthe 1990s.
The statistical discrepancy (last line) was positive $28 billion in the fourthquarter and positive $36 billion for 2000. A positive statistical discrepancyindicates some combination of under-recorded net capital inflows or over-recorded net imports.
-16-
Summary of U.S. International Transactions(Billions of dollars, not seasonally adjusted except as noted)
Official financial flows
1. Change in foreign official assetsin U.S. (increase, +)
a. G-10 countries
b. OPEC countries
c. All other countries
2. Change in U.S. official reserveassets (decrease, +)
Private financial flows
Banks
3. Change in net foreign positionsof banking offices in the U.S.'
Securities 2
4. Foreign net purchases of U.S.securities (+)
a. Treasury securities
b. Agency bonds
c. Corporate and municipal bonds
d. Corporate stocks
5. U.S. net acquisitions (-) of foreignsecurities
a. Bonds
b. Stock purchases
c. Stock swaps 3
Other flows (quarterly data, s.a.)
6. U.S. direct investment(-) abroad
7. Foreign direct investment in U.S.
8. Foreign holdings of U.S. currency
9. Other (inflow, + )4
1999 2000
55.0 39.3 22.1
46.4 39.6 22.7
49.7 123 11.1
2.0 10.7 5.7
-5.3 16.6 5.9
8.6 -.3 -.6
268.4 360.5 35.3
-12.4 15.3 -29.8
319.0 414.4 122.9
-19.9 -52.3 -9.2
71.9 111.9 26.0
158.8 180.4 44.0
108.2 173.8 62.1
-113.0 -97.2 -25.2
-5.7 -3.9 -9.4
15.6 -9.3 -1 8-122.9 -84.0 .0
-150.9 -161.6 -43.0
275.5 316.5 49.1
22.4 1.1 -6.8
-72.2 -128.7 -31.9
2000 2001
Q2 Q3
9.0 12.2
7.0 12.5
5.6 -4.2
1.1 3.4
.4 13.3
2.0 -.3
143.6 90.4
46.2 -11.8
Q4 Dec. Jan.
-4.0 -4.2 17.9
-2.6 -3.1 18.3
-.2 -4.1 -1.3
.6 -.5 3.6
-3.0 1.5 16.0
-1.4 -1.1 -.4
90.9
10.8 -32.4 -35.8
67.2 110.4 113.8
-20.4 -12.4 -10.3
19.0 28.6 38.3
41.6 45.7 49.1
27.0 48.5 36.2
-32.0 -18.7 -21.1
10.8 -9.0 3.8
5.2 -4.0 5.4
-48.0 -5.7 -30.3
-37.5 -36.2 -45.0
100.4 72.7 94.4
1.0 .8 6.2
-1.7 -26.8 -68.4
U.S. current account balance (s.a. -331.5 -435.4 -101.5 -105.0 -113.8 -115.3
Capital account balance (s.a.) -3.5 .7 .2 .2 .2 .2
Statistical discrepancy (s.a.) 11.6 35.6 43.9 -47.8 11.0 28.4
NOTE. The sum of official and private financial flows, the current account balance, the capital account balance, and the statisticaldiscrepancy is zero. Details may not sum to totals because of rounding.
1. Changes in dollar-denominated positions of all depository institutions and bank holding companies plus certain transactions betweenbroker-dealers andunaffiliated foreigners (particularly borrowing and lending under repurchase agreements). Includes changes in cusodyliabilities other than U S. Treasury bills
2. Includes commissions on securities transactions and excludes adjustments BEA makes to account for incomplete coverage: thereforedoes not match exactly the data on U.S. intemational transactions published by the Department of Commerce.
3. U.S. acquisitionsof foreign equities associated with foreign takeovers of U.S firms.4. Transactions by nonbanking concerns and other bankingand official transactions not shown elsewhere plus amounts resulting from
adjustments made by the Department of Commerce and revisions in lines I through 5 since puhlication ofthe quarterly data in the Survey ofCurrent Business
5. Consists oftransactions in nonproduced nonfinancial assets and capital transfers.n.a. Not available ... Notapplicable.
37.8
-10.3
11.2
12.9
24.1
-8. 1
-1.4
-2.9
-3.8