Embed Size (px)
Citation preview
Prefatory Note
The attached document represents the most complete and accurate version available based on original copies culled from the files of the FOMC Secretariat at the Board of Governors of the Federal Reserve System. This electronic document was created through a comprehensive digitization process which included identifying the best-preserved paper copies, scanning those copies,1 and then making the scanned versions text-searchable.2 Though a stringent quality assurance process was employed, some imperfections may remain.
Please note that this document may contain occasional gaps in the text. These gaps are the result of a redaction process that removed information obtained on a confidential basis. All redacted passages are exempt from disclosure under applicable provisions of the Freedom of Information Act.
1 In some cases, original copies needed to be photocopied before being scanned into electronic format. All scanned images were deskewed (to remove the effects of printer- and scanner-introduced tilting) and lightly cleaned (to remove dark spots caused by staple holes, hole punches, and other blemishes caused after initial printing). 2 A two-step process was used. An advanced optimal character recognition computer program (OCR) first created electronic text from the document image. Where the OCR results were inconclusive, staff checked and corrected the text as necessary. Please note that the numbers and text in charts and tables were not reliably recognized by the OCR process and were not checked or corrected by staff.

Confidential (FR) Class II FOMC
Part 1 October 30, 2002
CURRENT ECONOMICAND FINANCIAL CONDITIONS
Summary and Outlook
Prepared for the Federal Open Market Committeeby the staff of the Board of Governors of the Federal Reserve System

Confidential (FR) Class II FOMC
October 30, 2002
Summary and Outlook
Prepared for the Federal Open Market Committeeby the staff of the Board of Governors of the Federal Reserve System
Domestic Developments
Prospects for economic activity over the next several quarters look weaker thanthey did at the time of the September Greenbook. Consumer spending appearsto have been surprisingly muted in September and early October, and the recentdata and anecdotes about business investment have also been downbeat. Inaddition, the demand for labor has remained lackluster, and industrialproduction has receded somewhat in the past few months. One encouragingsign has been strong activity in housing markets. Altogether, the news has beendisappointing and suggests that the economy will expand at only a tepid pace forsome time. We now expect real GDP to increase at an annual rate of 1 percentin the fourth quarter and a bit below 2-1/2 percent in the first half of 2003. Wehave marked down, relative to the September Greenbook, the current-quarterforecast by a full percentage point and the forecast for the first half of next yearby more than 1/2 percentage point.
Although we are less sanguine than at the time of the previous projection, wehave not read the recent softness of sales and production as suggesting thataggregate economic activity is at serious risk of a cumulative contraction. Withinventories having been brought into much better alignment with sales and withcapital stocks apparently much closer to firms’ desired levels, the imbalancesthat had contributed most significantly to the declines in output last year havelargely been corrected. Nevertheless, a number of factors seem to be weighingon the vigor of the economic recovery. For both businesses and households,uncertainties about a potential military conflict have been layered on top ofongoing worries about economic activity and corporate earnings. Firms appearreluctant to commit to increases in capital spending in this environment, andconsumer spending seems to be damped both by these concerns and by thesizable hit that household balance sheets have taken. Meanwhile, the economiesof our major trading partners are showing little forward momentum, andexpectations of a pickup in their real output growth depend heavily on anacceleration of activity in the United States.
These restraining influences are expected to abate over the course of next year. Improving sentiment and a waning of the drag from past declines in equityprices should boost consumer expenditures. Business investment is also likelyto accelerate as the current uncertainties subside and firms take advantage ofprofit opportunities associated with rising demand and continued technologicaladvance. Aided further by an accommodative monetary policy and additionalstimulus from fiscal policy, a gradual strengthening of economic activity isexpected to take hold. Real GDP is projected to accelerate to a pace of about3-1/2 percent in the second half of 2003 and of almost 4 percent in 2004.
Even so, we expect real GDP to expand more slowly than its potential over thenext several quarters. Accordingly, the slack in resource utilization should

I-2 Part 1: Summary and Outlook, October 30, 2002
continue to rise over the first half of next year before beginning to ebb. Theforecast shows the unemployment rate rising to 6-1/4 percent in early 2003 andremaining there for a couple of quarters before moving down to 5-3/4 percent bythe end of the forecast period. With considerable slack in the economy andstrong growth in structural productivity, core PCE inflation is anticipated todecline to 1-1/4 percent in 2004.
Our forecast does not incorporate the economic implications of a militaryconflict with Iraq. Very little is known at this point about what the timing,duration, and cost of such a war might be. Moreover, the uncertainty aboutmilitary operations is compounded by uncertainty about the way households andbusinesses would react to a conflict. As a result, our assessment is that we canmore clearly portray the underlying fundamentals of the macroeconomicsituation leaving aside the potential effects of any war. Of course, some aspectsof a potential military conflict are unavoidable in our forecast to the extent thatprivate and public sector behavior has already been influenced.
Key Background FactorsIn light of the somewhat weaker outlook for economic activity in thisGreenbook, we have eliminated the tightening previously built in for 2004 andnow assume that the federal funds rate will remain at its current level throughoutthe forecast period. In contrast, futures quotes suggest that market participantsexpect some easing in the near term followed by a significant increase in thefunds rate over the second half of 2003 and in 2004. The convergence ofinvestor expectations to our assumed path would damp the rise in Treasury andmortgage rates. Accordingly, we anticipate that these rates will remain fairlyflat over the forecast period.
Net business financing remains weak. This weakness seems to be due largely tosubdued demand for credit. However, the supply of funding appears to havetightened somewhat further, especially for riskier credits. Most bond spreadshave widened over the intermeeting period owing to the additional deteriorationin corporate credit quality and the volatile conditions in financial markets;spreads on BBB-rated and speculative-grade bonds currently are at their highestlevels in more than a decade. In addition, the latest Senior Loan Officer surveyreported that banks have imposed some additional net tightening of standardsand terms for corporate lending. We expect these supply constraints to easeover the forecast period, albeit slowly, as the economy strengthens and concernsabout potential defaults recede.
In the household sector, borrowing has remained on a strong uptrend, led byfurther robust gains in mortgage debt. Although bankruptcy filings anddelinquency rates for nonprime borrowers remain at elevated levels, the affected
Domestic Developments I-3
group seems to be small, and most households appear to have ready access tocredit.
Equity prices dropped sharply in late September and early October, but theyhave since reversed course and regained all of the ground lost since the lastGreenbook. As a result, we assume that stock prices will follow essentially thesame path going forward as in our previous forecast. This path has share pricesincreasing nearly 7 percent annually from their current level, which roughlymaintains risk-adjusted parity with the return on safe bonds.
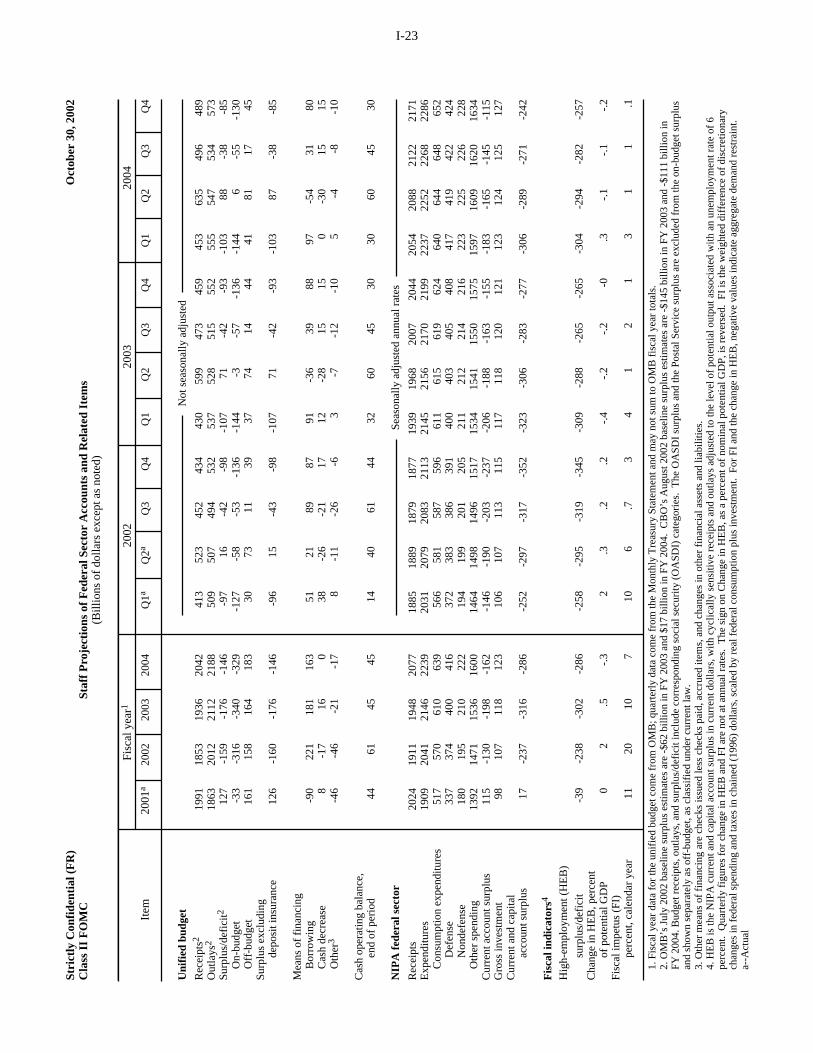
Under our baseline assumption of no war with Iraq, we expect the federalunified budget deficit for fiscal year 2003 to be $176 billion, a little largerdeficit than the $159 billion for the fiscal year just ended. Before breaking forthe elections, the Congress passed only the two military appropriations bills forthe new fiscal year (accounting for about half of discretionary spending),leaving the eleven nonmilitary bills for future action; a continuing resolution isfunding operations through November 22. We expect that discretionary outlaysfor this fiscal year will ultimately be closer to the Senate’s budget plans, whichcall for a bit more spending than the President had requested. For fiscal year2004, we expect that the projected pickup in economic growth will reduce theunified deficit to $146 billion. We estimate that fiscal policy will provide asmall positive stimulus to real GDP growth in 2003 and again in 2004.
Economic activity abroad appears to be slightly weaker in the second half of thisyear than we had projected in the September Greenbook, and we have edgeddown our projection of foreign real GDP growth in 2003 to 2.9 percent. Weexpect foreign output to rise 3.4 percent in 2004. Our current-quarter averagefor the real trade-weighted foreign exchange value of the dollar is now1-3/4 percent higher than in the September Greenbook. However, we continueto assume that the value of the dollar will decline a bit more than 1 percent peryear from its current level.
Crude oil prices currently stand near $27 per barrel for West Texas intermediate(WTI), about $2.50 below the forecast for the current quarter in the SeptemberGreenbook. Market participants have apparently interpreted recent news assuggesting slightly lower odds of U.S. military action against Iraq. Oilproduction from OPEC, including Iraq, has been increasing as well. Lookingahead, we have assumed (in line with futures quotes) that the price of WTI willfall to around $23.50 per barrel by the end of 2003 and about $22.50 per barrelby the end of 2004.
I-4 Part 1: Summary and Outlook, October 30, 2002
1. West Coast port disruptions are expected to have a very small effect on real GDP in thefourth quarter.
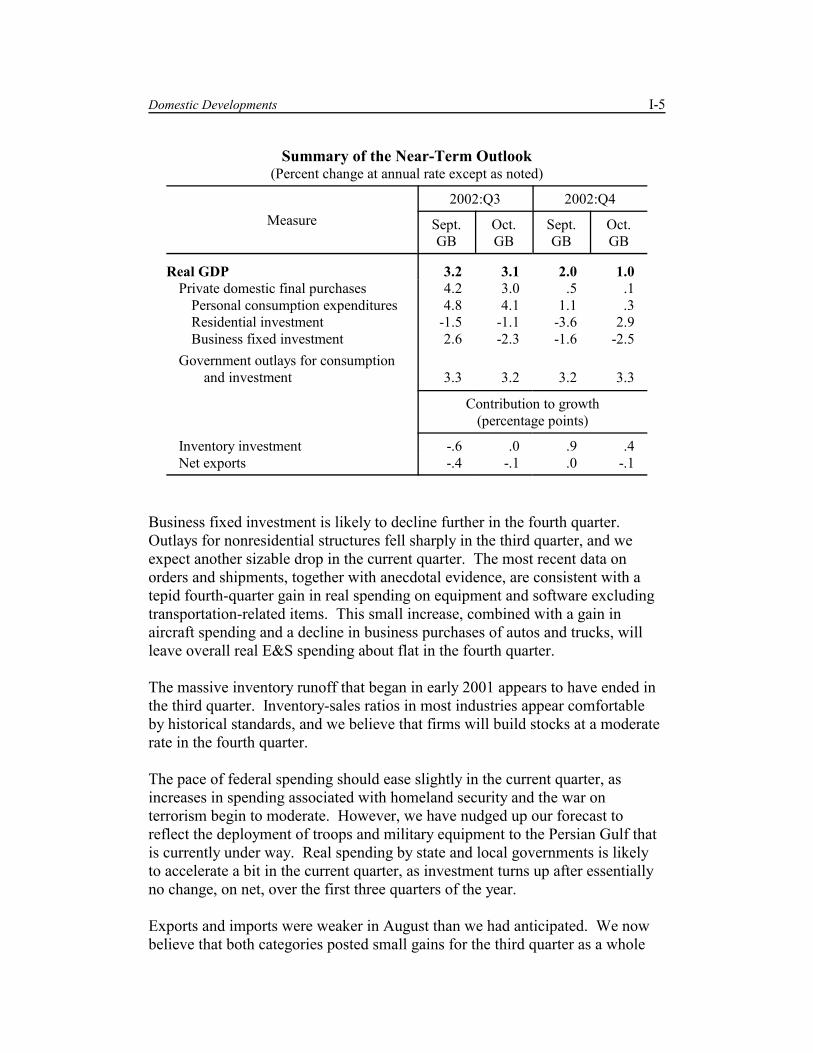
Recent Developments and the Near-Term ForecastWe project that real GDP will rise at an annual rate of 1 percent in the currentquarter after increasing about 3 percent in the third quarter.1 A key element ofthis slowdown is a drop in motor vehicle production from its elevated third-quarter level. We anticipate that this decline will be accompanied by an evenlarger reduction in household and business purchases of motor vehicles, leavingroom for automakers to rebuild stocks, which are currently on the lean side.
As noted, our outlook for real GDP growth in the current quarter represents adownward revision of roughly 1 percentage point relative to the SeptemberGreenbook. Indicators of final demand have been less favorable than we hadexpected, and recent news on the production side has been discouraging. Inparticular, manufacturing industrial production fell 1/4 percentage point more inSeptember than we had expected a month ago and appears to have declinedagain in October.
Personal consumption expenditures have entered the fourth quarter on a veryshallow trajectory. After a robust gain in July, real consumer spending wasroughly flat in August and appears to have dropped markedly in September. Purchases of light motor vehicles were much lower in September and, accordingto confidential reports from automakers, in October than they had been in Julyand August. This decline seems to reflect both reduced sales incentives(because the discounts on 2003 models are smaller than the sizable discounts onnow-scarce 2002 models) and a disappointing response to the incentives that arebeing offered—which suggests some weakening in the underlying demand formotor vehicles. We expect household spending on motor vehicles to remainclose to its recent level for the remainder of the quarter. On the basis ofwidespread weakness in the September retail sales report, as well as apronounced drop in consumer sentiment in October, we see consumption ofother items advancing at about the same modest pace as in the third quarter. Alltold, we project that total real PCE will edge up at an annual rate of only1/4 percent in the fourth quarter, after a gain of roughly 4 percent in the thirdquarter.
The good news from the household sector is that home sales and residentialconstruction remain robust. Although the torrid reading on single-family startsin September likely overstates the underlying pace of activity, the sizableincrease in permit issuance and large number of unused permits suggest thathomebuilding will retain some strength this quarter; we expect that housingstarts will equal the average level in the third quarter.
Domestic Developments I-5
Summary of the Near-Term Outlook(Percent change at annual rate except as noted)
Measure2002:Q3 2002:Q4
Sept.GB
Oct.GB
Sept.GB
Oct.GB
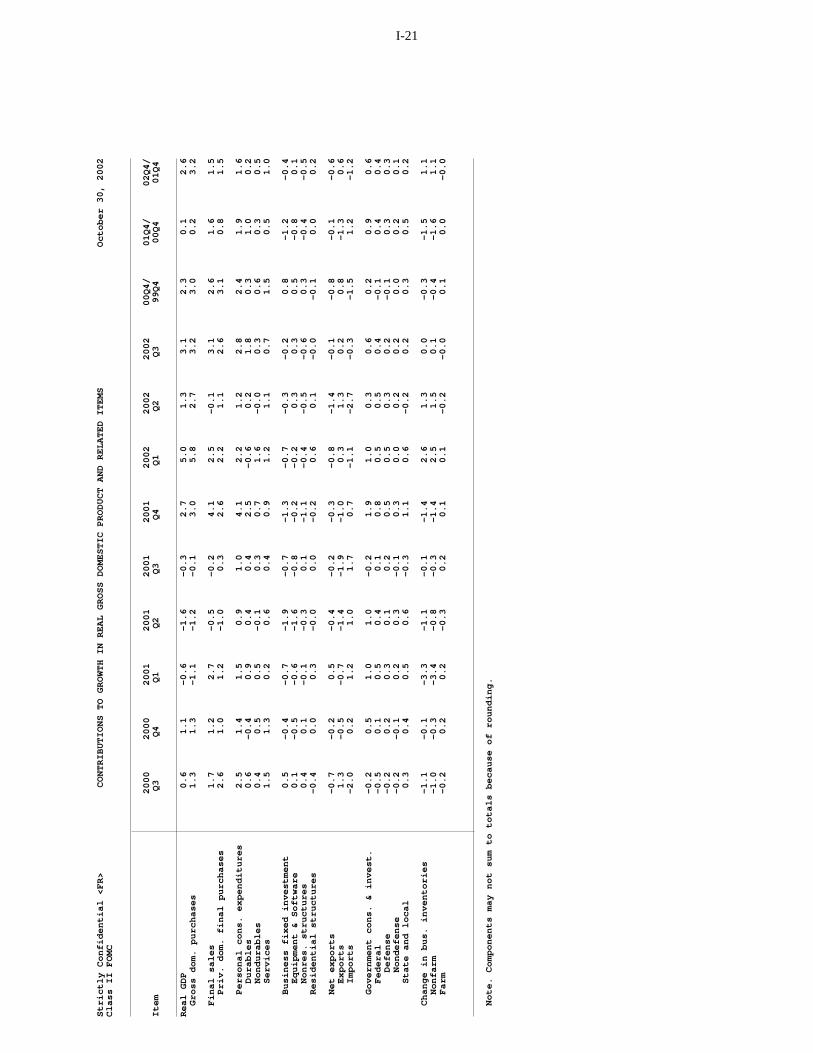
Real GDP 3.2 3.1 2.0 1.0Private domestic final purchases 4.2 3.0 .5 .1
Personal consumption expenditures 4.8 4.1 1.1 .3Residential investment -1.5 -1.1 -3.6 2.9Business fixed investment 2.6 -2.3 -1.6 -2.5
Government outlays for consumptionand investment 3.3 3.2 3.2 3.3
Contribution to growth(percentage points)
Inventory investment -.6 .0 .9 .4Net exports -.4 -.1 .0 -.1
Business fixed investment is likely to decline further in the fourth quarter. Outlays for nonresidential structures fell sharply in the third quarter, and weexpect another sizable drop in the current quarter. The most recent data onorders and shipments, together with anecdotal evidence, are consistent with atepid fourth-quarter gain in real spending on equipment and software excludingtransportation-related items. This small increase, combined with a gain inaircraft spending and a decline in business purchases of autos and trucks, willleave overall real E&S spending about flat in the fourth quarter.
The massive inventory runoff that began in early 2001 appears to have ended inthe third quarter. Inventory-sales ratios in most industries appear comfortableby historical standards, and we believe that firms will build stocks at a moderaterate in the fourth quarter.
The pace of federal spending should ease slightly in the current quarter, asincreases in spending associated with homeland security and the war onterrorism begin to moderate. However, we have nudged up our forecast toreflect the deployment of troops and military equipment to the Persian Gulf thatis currently under way. Real spending by state and local governments is likelyto accelerate a bit in the current quarter, as investment turns up after essentiallyno change, on net, over the first three quarters of the year.
Exports and imports were weaker in August than we had anticipated. We nowbelieve that both categories posted small gains for the third quarter as a whole
I-6 Part 1: Summary and Outlook, October 30, 2002
2. The Bureau of Labor Statistics has reported a drop in initial claims for unemploymentinsurance in recent weeks, but the seasonal factors that the BLS uses appear to have beendistorted by the sharp increase in claims that followed the events of September 11, 2001. Usingseasonal factors that remove the influence of that period, claims have been running higher.
and that net exports had a small negative effect on the change in real GDP. Forthe fourth quarter, we project that net exports will again make a small arithmeticdeduction from the change in real GDP, with both exports and importsaccelerating.
Labor markets have yet to improve materially. Private payrolls have risen onlya bit from their April trough, and aggregate hours have been roughly flat, on net,since the beginning of the year. The unemployment rate fell again inSeptember, to 5.6 percent, but the recent decline in this rate is anomalous inlight of the very small job gains recorded in the employer survey and theweakness in other indicators of labor market conditions. Claims remain at alevel that we interpret as consistent with little or no change in employment inthe fourth quarter.2 We expect the unemployment rate to move up to 5.9 percentby year-end.
Both wage inflation and core consumer price inflation have remained subdued. However, a sharp rise in energy prices should push up overall consumer priceinflation somewhat in the fourth quarter. Although we do not expect a furtherincrease in the price of crude oil in the next several months, low inventories ofgasoline and heating oil are boosting refiners’ margins. We project that corePCE inflation will edge down to an annual rate of 1.5 percent in the fourthquarter while overall PCE inflation will pick up to a rate of 2.1 percent.
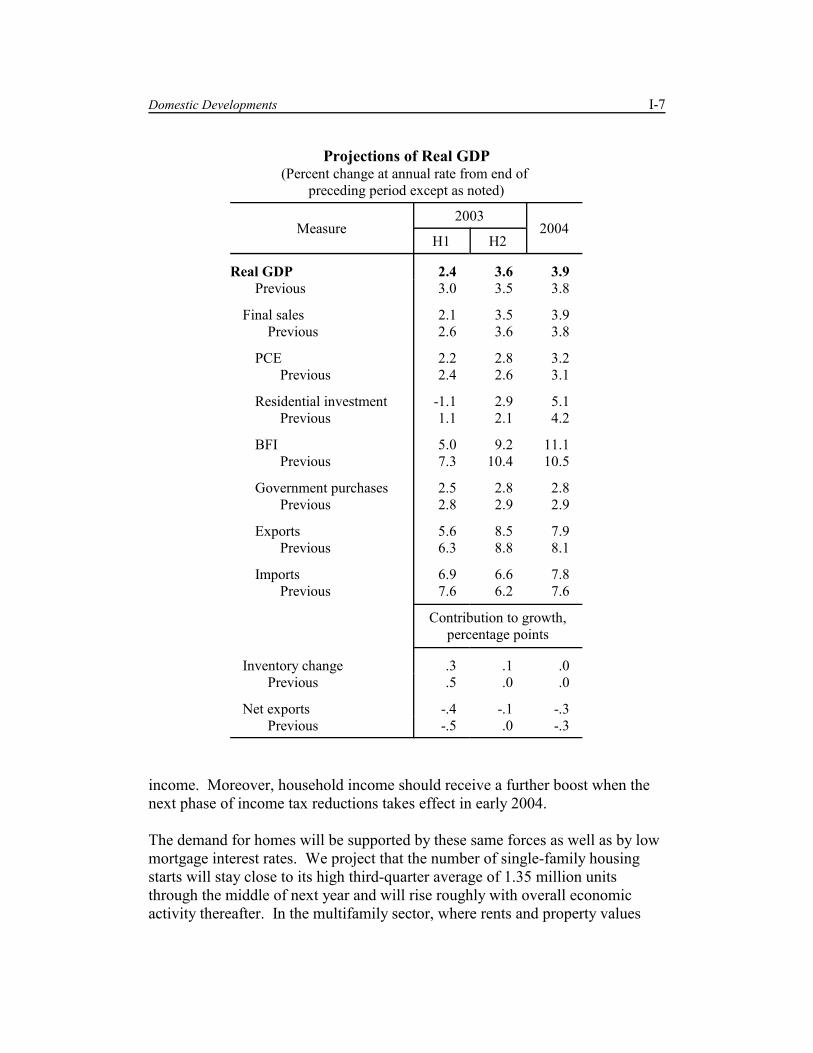
The Longer-Term Outlook for the EconomyWe project that real GDP will rise 3 percent in 2003 and nearly 4 percent in2004. Low consumer confidence and business hesitancy to hire and investappear to be currently holding down aggregate demand. However, we expectthese forces—and most of the drag on consumer spending from past declines inwealth—to wane next year. As that process unfolds, the ongoing impetus fromstrong underlying productivity growth, accommodative monetary policy, andstimulative fiscal policy should translate into increasingly robust gains in realGDP.
Household spending. We now expect real PCE to increase at an annual rate of2-1/4 percent in the first half of 2003, a pace similar to the average one expectedin the second half of this year. Spending growth should pick up to 2-3/4 percentin the second half of 2003 and to 3-1/4 percent in 2004. Several factors feedthis projected acceleration. Besides the diminishing drag from wealth effectsnoted above, improving labor market conditions are expected to bolster personal
Domestic Developments I-7
Projections of Real GDP(Percent change at annual rate from end of
preceding period except as noted)
Measure2003
2004H1 H2
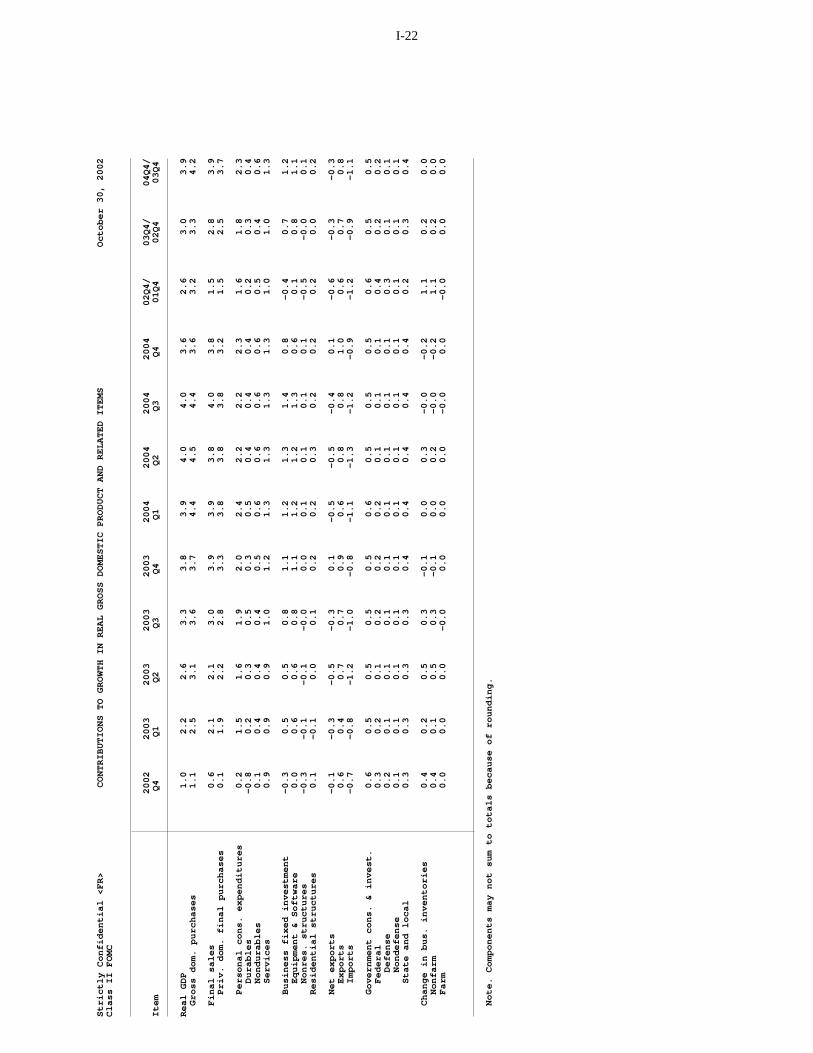
Real GDP 2.4 3.6 3.9Previous 3.0 3.5 3.8
Final sales 2.1 3.5 3.9Previous 2.6 3.6 3.8
PCE 2.2 2.8 3.2Previous 2.4 2.6 3.1
Residential investment -1.1 2.9 5.1Previous 1.1 2.1 4.2
BFI 5.0 9.2 11.1Previous 7.3 10.4 10.5
Government purchases 2.5 2.8 2.8Previous 2.8 2.9 2.9
Exports 5.6 8.5 7.9Previous 6.3 8.8 8.1
Imports 6.9 6.6 7.8Previous 7.6 6.2 7.6
Contribution to growth,percentage points
Inventory change .3 .1 .0Previous .5 .0 .0
Net exports -.4 -.1 -.3Previous -.5 .0 -.3
income. Moreover, household income should receive a further boost when thenext phase of income tax reductions takes effect in early 2004.
The demand for homes will be supported by these same forces as well as by lowmortgage interest rates. We project that the number of single-family housingstarts will stay close to its high third-quarter average of 1.35 million unitsthrough the middle of next year and will rise roughly with overall economicactivity thereafter. In the multifamily sector, where rents and property values
I-8 Part 1: Summary and Outlook, October 30, 2002
3. The partial-expensing incentives, which are scheduled to expire in late 2004, will inducebusinesses to pull forward investments that would otherwise have been made later. This effectwill boost investment spending through the third quarter of 2004 and then depress spending inthe fourth quarter of that year and in 2005 as well.
have been stagnant and vacancy rates are high, starts are expected to be fairlyflat over the next two years at a level a little below the 2002 average.
Business fixed investment. Our outlook for business fixed investment issomewhat weaker than in the last Greenbook but continues to show a significantrebound over the next two years. We project that real spending on equipmentand software will increase at an annual rate of about 8 percent in the first half of2003, up from an anticipated 2-1/4 percent rise in the second half of this year. The acceleration is led by gains in the transportation sector, where outlays(particularly for motor vehicles) should recover somewhat after falling, on net,in the latter part of this year. Excluding transportation equipment, the step-up inreal E&S is less abrupt, consistent with fairly weak orders data and anecdotalevidence from business contacts that capital spending is advancing only slowly.
We expect that real E&S outlays will increase at an annual rate of 12 percent inthe second half of 2003 and a touch faster in 2004.3 Rising sales should boostdesired capital stocks, and stronger cash flow and the partial-expensing taxincentives will also encourage investment. To be sure, these positive influenceshave been at work to some degree for a while; however, we expect them totranslate into material increases in capital outlays only as some of theuncertainties facing businesses dissipate and confidence improves. Among thecategories of investment, real purchases of communications equipment willlikely be weak at least through next year, but real outlays for computers andsoftware are expected to remain on a strong uptrend that steepens somewhatover the course of the forecast period. Outside the high-tech area, we arelooking for a gradual strengthening of spending.
For nonresidential structures, we project a further small drop in real spending in2003, reflecting the effects of the low rates of industrial capacity utilization andthe high vacancy rates for office buildings. In 2004, we expect nonresidentialinvestment to move up at a moderate pace of 4-1/4 percent.
Inventory investment. We expect firms to continue building their inventoriesnext year as the expansion gains traction. However, stocks are likely to increasemore slowly than sales, putting inventory-sales ratios on a downward trend. Inour projection, inventory investment contributes about 1/4 percentage point tothe growth rate of real GDP during 2003 and is a neutral influence in 2004.
Domestic Developments I-9
Government spending. With much of the step-up in security-related spendingcompleted by the end of 2002 and with the federal budget outlook less rosy nowthan in previous years, we anticipate only moderate increases in federal outlaysover the projection period. Under our baseline assumption of no war with Iraq,real defense spending is projected to rise 2-1/4 percent in 2003 and1-1/2 percent in 2004, down from an anticipated 7-1/2 percent advance in 2002. Growth in nondefense spending is also expected to slow—albeit lessdramatically—from a projected pace of 5-1/4 percent in 2002 to around3-1/2 percent in 2003 and 2004. In contrast, the spending of states andlocalities, which we estimate will increase just 1.6 percent over the four quartersof 2002, should accelerate gradually over the next couple of years, as theexpanding economy reduces strains on these governments’ budgets.
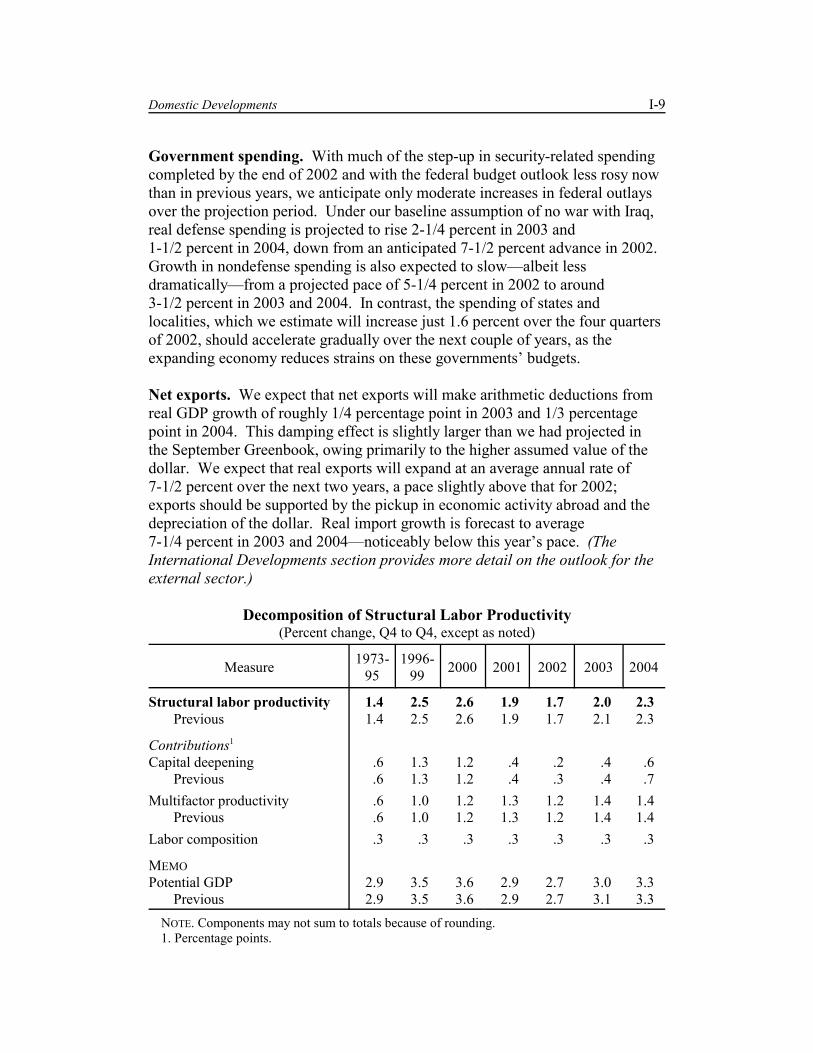
Net exports. We expect that net exports will make arithmetic deductions fromreal GDP growth of roughly 1/4 percentage point in 2003 and 1/3 percentagepoint in 2004. This damping effect is slightly larger than we had projected inthe September Greenbook, owing primarily to the higher assumed value of thedollar. We expect that real exports will expand at an average annual rate of 7-1/2 percent over the next two years, a pace slightly above that for 2002;exports should be supported by the pickup in economic activity abroad and thedepreciation of the dollar. Real import growth is forecast to average7-1/4 percent in 2003 and 2004—noticeably below this year’s pace. (TheInternational Developments section provides more detail on the outlook for theexternal sector.)
Decomposition of Structural Labor Productivity(Percent change, Q4 to Q4, except as noted)
Measure 1973-95
1996-99 2000 2001 2002 2003 2004
Structural labor productivity 1.4 2.5 2.6 1.9 1.7 2.0 2.3Previous 1.4 2.5 2.6 1.9 1.7 2.1 2.3
Contributions1 Capital deepening .6 1.3 1.2 .4 .2 .4 .6
Previous .6 1.3 1.2 .4 .3 .4 .7Multifactor productivity .6 1.0 1.2 1.3 1.2 1.4 1.4
Previous .6 1.0 1.2 1.3 1.2 1.4 1.4Labor composition .3 .3 .3 .3 .3 .3 .3
MEMOPotential GDP 2.9 3.5 3.6 2.9 2.7 3.0 3.3
Previous 2.9 3.5 3.6 2.9 2.7 3.1 3.3NOTE. Components may not sum to totals because of rounding.1. Percentage points.
I-10 Part 1: Summary and Outlook, October 30, 2002
Aggregate Supply, the Labor Market, and Prospects for InflationWe project that actual GDP growth will run below our estimate of potentialGDP growth through the middle of next year, causing the current slack inresource utilization to increase a little further. The pickup in output growth thatwe foresee for the second half of next year and for 2004 is sufficient to narrowthe output gap somewhat over that period. Still, the degree of slack in ourforecast generates a deceleration in labor compensation and core consumer priceinflation over the next couple of years.
Productivity and the labor market. We estimate that labor productivity in thenonfarm business sector rose roughly 5 percent over the four quarters ending in2002:Q3 and that its level is now well above its structural level. We continue tobelieve that this pattern reflects firms’ decisions—against a backdrop ofuncertainty about the strength of the expansion—to use their existing labor andcapital more intensively instead of hiring additional workers. Reflecting thepersistently good performance of productivity this year, our forecast calls foractual productivity to stay above its estimated structural level to an unusualextent and for a longer period of time than is typical of previous expansions.
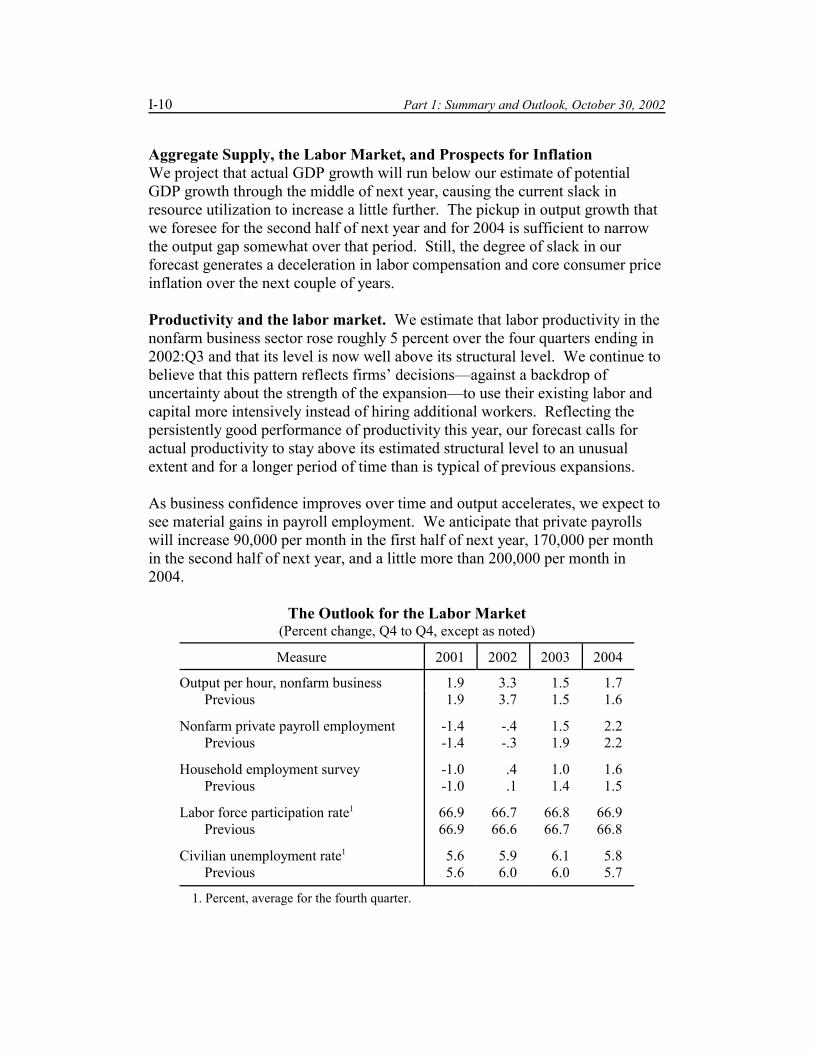
As business confidence improves over time and output accelerates, we expect tosee material gains in payroll employment. We anticipate that private payrollswill increase 90,000 per month in the first half of next year, 170,000 per monthin the second half of next year, and a little more than 200,000 per month in2004.
The Outlook for the Labor Market(Percent change, Q4 to Q4, except as noted)
Measure 2001 2002 2003 2004
Output per hour, nonfarm business 1.9 3.3 1.5 1.7Previous 1.9 3.7 1.5 1.6
Nonfarm private payroll employment -1.4 -.4 1.5 2.2Previous -1.4 -.3 1.9 2.2
Household employment survey -1.0 .4 1.0 1.6Previous -1.0 .1 1.4 1.5
Labor force participation rate1 66.9 66.7 66.8 66.9Previous 66.9 66.6 66.7 66.8
Civilian unemployment rate1 5.6 5.9 6.1 5.8Previous 5.6 6.0 6.0 5.7
1. Percent, average for the fourth quarter.
Domestic Developments I-11
4. Once again, we assume that the availability of extended unemployment benefits booststhe projected unemployment rate a little throughout the forecast period by encouragingunemployed individuals to be more selective about taking a job offer and by drawing somepeople into the labor force to become eligible for these benefits. Moreover, an implication of ourassumption that productivity will persist above its structural level is that the unemployment ratewill be higher than would be expected given the output gap.
The unemployment rate is projected to reach 6-1/4 percent next year and then tomove down to around 5-3/4 percent by the end of 2004. This path for theunemployment rate is slightly above that in the September Greenbook, althoughless so than would be warranted solely by the revision to the output gap becausewe are placing some weight on the surprisingly low readings of theunemployment rate in recent months.4
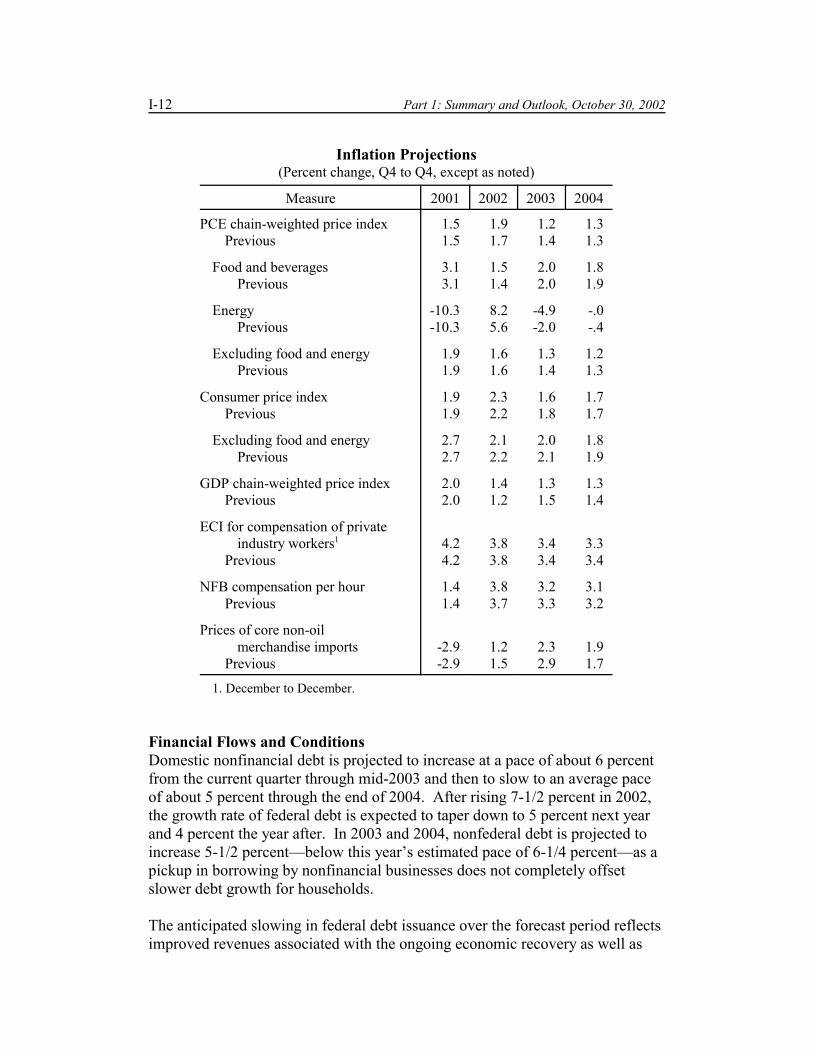
Prices and wages. We anticipate that four-quarter inflation as measured by thecore PCE price index will come in at 1.6 percent in 2002, decline to 1.3 percentin 2003, and then edge down further to 1.2 percent in 2004. The decelerationstems mainly from the persistence of slack in labor and product markets. Inaddition, the anticipated pickup in structural productivity growth next year andin 2004 should help trim firms' costs over the forecast period. Total PCE inflation has been boosted this year by rising energy prices. However, we expect gasoline prices to reverse about half of this year’s run-up in2003 (and a little more in 2004), bringing down overall consumer energy prices. As a result, we are projecting a larger deceleration in total PCE prices than incore prices, from a pace of 1.9 percent in 2002 to a pace of 1-1/4 percent in2003 and 2004.
Over the forecast period, the easing in price inflation—coupled with thecontinued slack in labor markets—should be reflected in slower growth inwages and salaries. However, benefit costs are expected to accelerate over theforecast period owing to more-rapid increases in health insurance premiums andsome firming of bonuses. All told, we project that compensation per hour in thenonfarm business sector will rise 3.8 percent in 2002 and then slow to a rise of3.2 percent in 2003 and 3.1 percent in 2004. For the employment cost index, weexpect a rise of 3.8 percent in 2002 followed by an increase of 3.4 percent in2003 and 3.3 percent in 2004.
I-12 Part 1: Summary and Outlook, October 30, 2002
Inflation Projections(Percent change, Q4 to Q4, except as noted)
Measure 2001 2002 2003 2004
PCE chain-weighted price index 1.5 1.9 1.2 1.3Previous 1.5 1.7 1.4 1.3
Food and beverages 3.1 1.5 2.0 1.8Previous 3.1 1.4 2.0 1.9
Energy -10.3 8.2 -4.9 -.0Previous -10.3 5.6 -2.0 -.4
Excluding food and energy 1.9 1.6 1.3 1.2Previous 1.9 1.6 1.4 1.3
Consumer price index 1.9 2.3 1.6 1.7Previous 1.9 2.2 1.8 1.7
Excluding food and energy 2.7 2.1 2.0 1.8Previous 2.7 2.2 2.1 1.9
GDP chain-weighted price index 2.0 1.4 1.3 1.3Previous 2.0 1.2 1.5 1.4
ECI for compensation of privateindustry workers1 4.2 3.8 3.4 3.3
Previous 4.2 3.8 3.4 3.4
NFB compensation per hour 1.4 3.8 3.2 3.1Previous 1.4 3.7 3.3 3.2
Prices of core non-oilmerchandise imports -2.9 1.2 2.3 1.9
Previous -2.9 1.5 2.9 1.7
1. December to December.
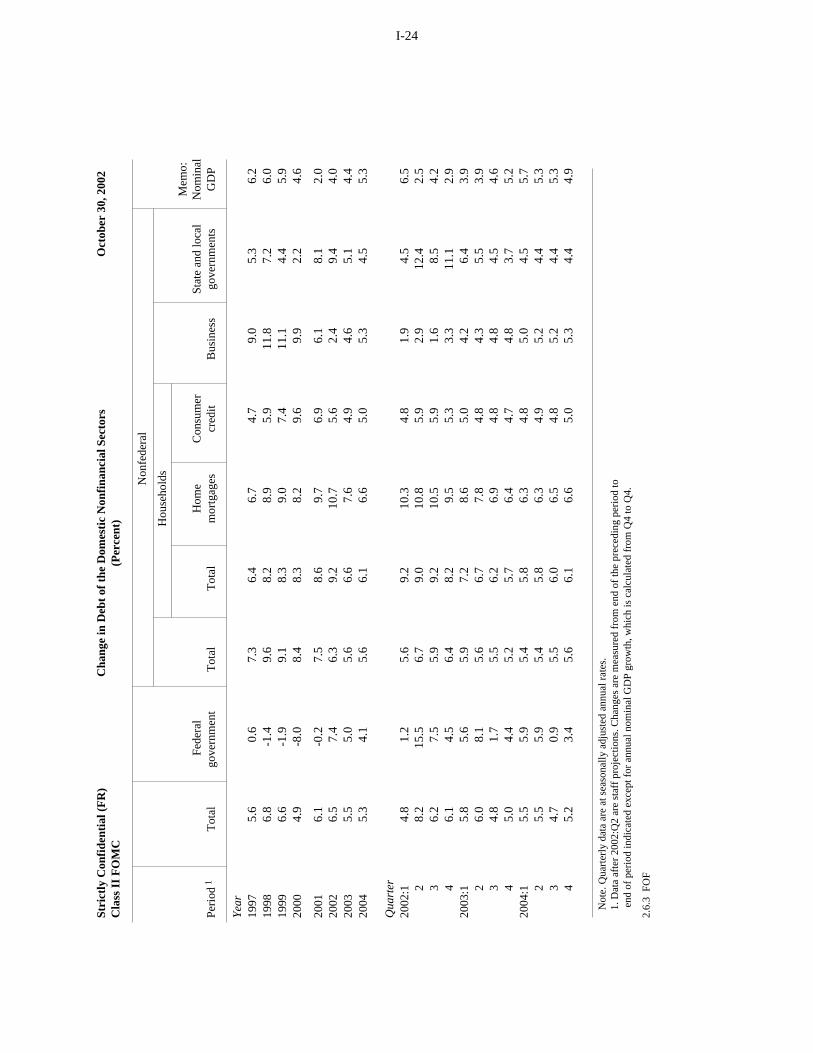
Financial Flows and ConditionsDomestic nonfinancial debt is projected to increase at a pace of about 6 percentfrom the current quarter through mid-2003 and then to slow to an average paceof about 5 percent through the end of 2004. After rising 7-1/2 percent in 2002,the growth rate of federal debt is expected to taper down to 5 percent next yearand 4 percent the year after. In 2003 and 2004, nonfederal debt is projected toincrease 5-1/2 percent—below this year’s estimated pace of 6-1/4 percent—as apickup in borrowing by nonfinancial businesses does not completely offsetslower debt growth for households.
The anticipated slowing in federal debt issuance over the forecast period reflectsimproved revenues associated with the ongoing economic recovery as well as

Domestic Developments I-13
more moderate growth in outlays over the projection period. Growth in the debtof state and local governments is also expected to moderate in 2003 and 2004from this year’s heavy borrowing, which has been driven in large part byparticularly attractive opportunities for advance refunding and a significantdeterioration in budget conditions.
Mortgage rates dipped to historically low levels in the intermeeting period andhave backed up only a little since then. The relatively attractive rates seen allyear have supported rapid growth of household mortgage debt—at a pace ofmore than 10 percent in the past three quarters. Given the current backlog ofapplications for refinancing, mortgage borrowing will likely remain briskthrough year-end. Looking further ahead, slow growth in residential investmentnext year, together with a continued deceleration in house prices, should dampmortgage borrowing over the projection period. Consumer credit has expandedat a relatively moderate rate of 5-1/2 percent this year. We expect the growth inconsumer credit to slow to an average pace of 5 percent in 2003 and 2004, inkeeping with our projection of relatively sluggish increases in nominal spendingon autos and other durable goods.
Borrowing by nonfinancial businesses has been extremely light so far this year,especially in recent months, reflecting a combination of weak demand for fundsand some stringency on the part of lenders and the markets. We expect thedemand for external funds to turn up in coming quarters, as firms deplete largecushions of cash and as investment spending increases more rapidly thanprofits. In addition, credit conditions should ease somewhat as the expansionshows greater vigor. Thus, we expect the pace of borrowing to strengthen overthe forecast period, reaching a 5-1/4 percent pace in 2004.
M2 has continued to increase fairly rapidly, on average, in recent months. Although the lagged effects on M2 of previous policy easings have about playedout, liquid deposits are still getting a substantial boost from the effects ofmortgage refinancings. M2 is expected to decelerate in the months ahead owingto slow growth of nominal spending. Over the next two years, the opportunitycost of holding M2 assets is projected to be stable, and special factors, such asmortgage refinancing and foreign demands for U.S. currency, are expected tohave little effect on M2 growth. At the same time, the gradual improvement inthe stock market assumed in this Greenbook siphons some funds out of M2. Asa result, the staff forecast has M2 increasing a bit less than nominal GDP.
Alternative SimulationsIn this section, we use simulations of the FRB/US model to examine severalrisks to the forecast. The first pair of simulations focuses on the state ofaggregate demand: One scenario posits that both business and householdspending will be significantly more restrained through 2003 than we project in
I-14 Part 1: Summary and Outlook, October 30, 2002
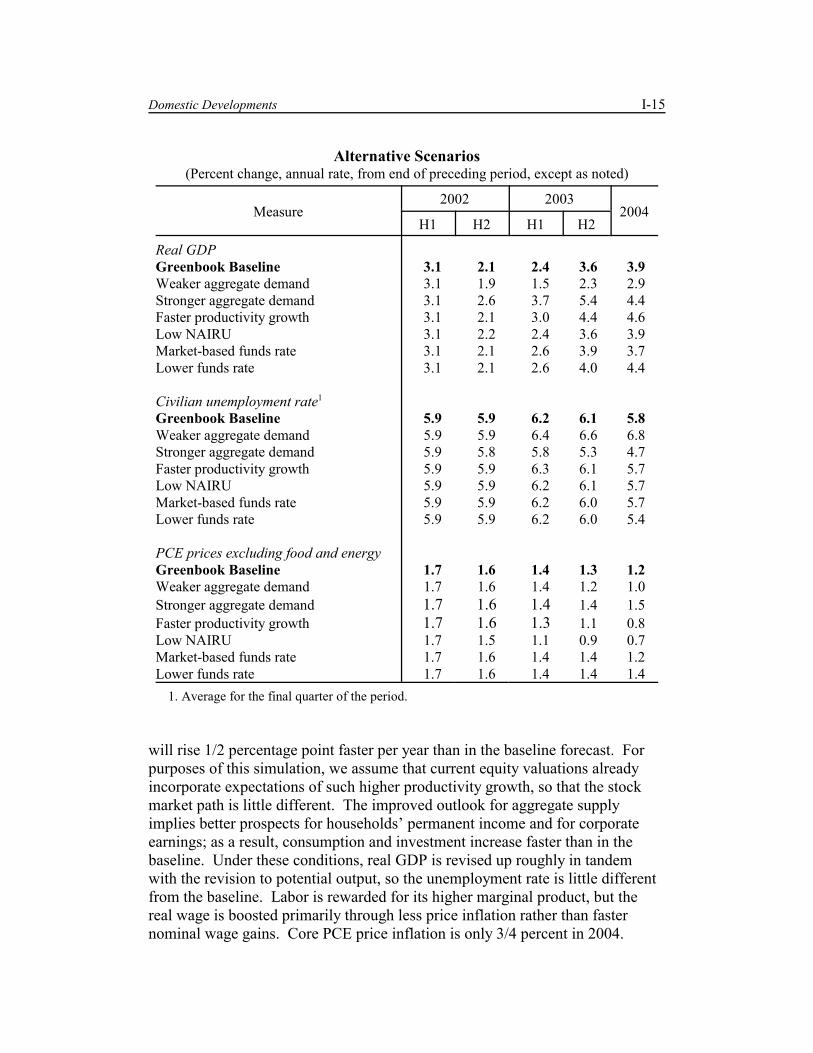
the baseline forecast, and the other scenario considers the consequences of amore robust rebound in private final demand. The next pair of scenarios allowsfor a more favorable configuration of supply-side factors. In one, recentimpressive gains in output per hour are assumed to herald an additional pickupin structural productivity growth; in the other, we assume that the NAIRU iswell below the staff’s estimate. In these four scenarios, we assume that thefederal funds rate follows the baseline path. The final pair of scenariosconsiders alternative stances for monetary policy, with the first showing theeffects of a market-based forecast of the funds rate and the seconddemonstrating the effects of a policy easing.
Weaker investment and consumption. Consumer spending has slowed oflate, and business investment has yet to increase decisively. This combinationunderscores the risk that household outlays will flag before the economy isboosted by the substantial pickup in business investment that we are expecting. This scenario assumes that households are less confident over the coming yearabout income and employment prospects than we believe and hence will raisetheir saving. As a result, real PCE increases only 1-1/2 percent in 2003 and2-1/2 percent in 2004 (including multiplier effects), compared with2-1/2 percent and 3-1/4 percent, respectively, in the baseline forecast. The E&Srebound is also delayed in this scenario, with real outlays rising only 3 percentin 2003—a little below the pace seen in the past half year—and increasing10 percent in 2004. The net effect of this weakness in aggregate demand is tolower growth of real GDP about 1 percentage point in both 2003 and 2004. Theunemployment rate rises to 6-3/4 percent by the end of 2004, and the coreinflation rate drops to 1 percent in 2004.
Stronger aggregate demand. Although the real federal funds rate is assumedto remain very low, our forecast shows only a modest recovery in economicactivity. This scenario considers the possibility that the factors now weighingon the economy, and holding down the equilibrium real funds rate, will fadeaway more quickly than we project and, accordingly, that aggregate demandwill turn out to be significantly stronger. To illustrate the risk that theeconomy’s equilibrium real rate will turn out to be much closer to its historicalaverage than is implicitly assumed in the staff forecast, we impose positiveshocks on consumption and investment. Under these circumstances, real GDPincreases about 4-1/2 percent in 2003 and 2004, and the unemployment ratefalls below the NAIRU in 2004. Inflation begins to edge up, but the capitaldeepening associated with the stronger investment path boosts productivity,limiting the additional pressure on prices.
Stronger productivity. Productivity growth has been impressive over the pastyear even as capital spending and the increase in output have been subpar. Inthis scenario, we consider the possibility that structural multifactor productivity
Domestic Developments I-15
Alternative Scenarios(Percent change, annual rate, from end of preceding period, except as noted)
Measure2002 2003
2004H1 H2 H1 H2
Real GDPGreenbook Baseline 3.1 2.1 2.4 3.6 3.9Weaker aggregate demand 3.1 1.9 1.5 2.3 2.9Stronger aggregate demand 3.1 2.6 3.7 5.4 4.4Faster productivity growth 3.1 2.1 3.0 4.4 4.6Low NAIRU 3.1 2.2 2.4 3.6 3.9Market-based funds rate 3.1 2.1 2.6 3.9 3.7Lower funds rate 3.1 2.1 2.6 4.0 4.4
Civilian unemployment rate1
Greenbook Baseline 5.9 5.9 6.2 6.1 5.8Weaker aggregate demand 5.9 5.9 6.4 6.6 6.8Stronger aggregate demand 5.9 5.8 5.8 5.3 4.7Faster productivity growth 5.9 5.9 6.3 6.1 5.7Low NAIRU 5.9 5.9 6.2 6.1 5.7Market-based funds rate 5.9 5.9 6.2 6.0 5.7Lower funds rate 5.9 5.9 6.2 6.0 5.4
PCE prices excluding food and energyGreenbook Baseline 1.7 1.6 1.4 1.3 1.2Weaker aggregate demand 1.7 1.6 1.4 1.2 1.0Stronger aggregate demand 1.7 1.6 1.4 1.4 1.5Faster productivity growth 1.7 1.6 1.3 1.1 0.8Low NAIRU 1.7 1.5 1.1 0.9 0.7Market-based funds rate 1.7 1.6 1.4 1.4 1.2Lower funds rate 1.7 1.6 1.4 1.4 1.4
1. Average for the final quarter of the period.
will rise 1/2 percentage point faster per year than in the baseline forecast. Forpurposes of this simulation, we assume that current equity valuations alreadyincorporate expectations of such higher productivity growth, so that the stockmarket path is little different. The improved outlook for aggregate supplyimplies better prospects for households’ permanent income and for corporateearnings; as a result, consumption and investment increase faster than in thebaseline. Under these conditions, real GDP is revised up roughly in tandemwith the revision to potential output, so the unemployment rate is little differentfrom the baseline. Labor is rewarded for its higher marginal product, but thereal wage is boosted primarily through less price inflation rather than fasternominal wage gains. Core PCE price inflation is only 3/4 percent in 2004.
I-16 Part 1: Summary and Outlook, October 30, 2002
Low NAIRU. This scenario assumes that the NAIRU is 4-1/4 percent(3/4 percentage point less than in the baseline) and has been at that level forsome time. The lower NAIRU puts significant downward pressure on prices,shaving roughly 1/2 percentage point off PCE inflation by 2004. Because weassume that the funds rate path is the same as in the baseline, the lower inflationrate generates a higher path for the real interest rate and reduces investmentspending. In the event, actual GDP is virtually unchanged from the baselinedespite the positive implications of the lower NAIRU for potential output.
Market-based funds rate. Futures quotes are consistent with a decline in thefederal funds rate through the middle of next year, followed by a relatively steepupward trajectory thereafter. The market-based funds rate averages roughly40 basis points below the baseline over the next several quarters but about3/4 percentage point above the baseline in 2004. This contour adds1/4 percentage point to the increase in real GDP in 2003 and shaves a similaramount off the increase in 2004; unemployment and inflation would be littleaffected.
Lower funds rate. In this scenario, the federal funds rate is lowered 50 basispoints to 1-1/4 percent by the end of this year and remains at this level throughthe end of 2004. Relative to the baseline, real GDP rises 1/4 percentage pointmore rapidly in 2003 and 1/2 percentage point more rapidly in 2004. Theunemployment rate drops to 5.4 percent by the end of 2004, and PCE prices rise1/4 percentage point more rapidly in 2004.
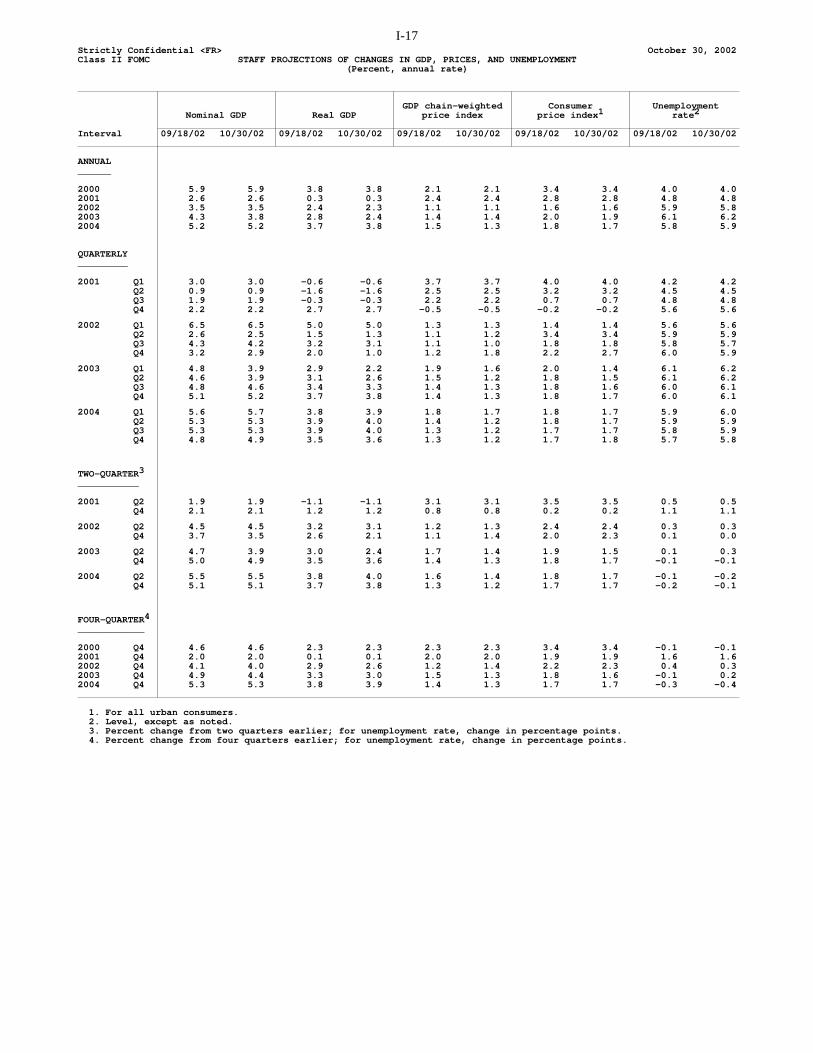
I-17Strictly Confidential <FR> October 30, 2002Class II FOMC STAFF PROJECTIONS OF CHANGES IN GDP, PRICES, AND UNEMPLOYMENT
(Percent, annual rate)
GDP chain-weighted Consumer Unemployment Nominal GDP Real GDP price index price index 1 rate 2
Interval 09/18/02 10/30/02 09/18/02 10/30/02 09/18/02 10/30/02 09/18/02 10/30/02 09/18/02 10/30/02
ANNUAL______
2000 5.9 5.9 3.8 3.8 2.1 2.1 3.4 3.4 4.0 4.02001 2.6 2.6 0.3 0.3 2.4 2.4 2.8 2.8 4.8 4.82002 3.5 3.5 2.4 2.3 1.1 1.1 1.6 1.6 5.9 5.82003 4.3 3.8 2.8 2.4 1.4 1.4 2.0 1.9 6.1 6.22004 5.2 5.2 3.7 3.8 1.5 1.3 1.8 1.7 5.8 5.9
QUARTERLY_________
2001 Q1 3.0 3.0 -0.6 -0.6 3.7 3.7 4.0 4.0 4.2 4.2 Q2 0.9 0.9 -1.6 -1.6 2.5 2.5 3.2 3.2 4.5 4.5 Q3 1.9 1.9 -0.3 -0.3 2.2 2.2 0.7 0.7 4.8 4.8 Q4 2.2 2.2 2.7 2.7 -0.5 -0.5 -0.2 -0.2 5.6 5.6
2002 Q1 6.5 6.5 5.0 5.0 1.3 1.3 1.4 1.4 5.6 5.6 Q2 2.6 2.5 1.5 1.3 1.1 1.2 3.4 3.4 5.9 5.9 Q3 4.3 4.2 3.2 3.1 1.1 1.0 1.8 1.8 5.8 5.7 Q4 3.2 2.9 2.0 1.0 1.2 1.8 2.2 2.7 6.0 5.9
2003 Q1 4.8 3.9 2.9 2.2 1.9 1.6 2.0 1.4 6.1 6.2 Q2 4.6 3.9 3.1 2.6 1.5 1.2 1.8 1.5 6.1 6.2 Q3 4.8 4.6 3.4 3.3 1.4 1.3 1.8 1.6 6.0 6.1 Q4 5.1 5.2 3.7 3.8 1.4 1.3 1.8 1.7 6.0 6.1
2004 Q1 5.6 5.7 3.8 3.9 1.8 1.7 1.8 1.7 5.9 6.0 Q2 5.3 5.3 3.9 4.0 1.4 1.2 1.8 1.7 5.9 5.9 Q3 5.3 5.3 3.9 4.0 1.3 1.2 1.7 1.7 5.8 5.9 Q4 4.8 4.9 3.5 3.6 1.3 1.2 1.7 1.8 5.7 5.8
TWO-QUARTER3
___________
2001 Q2 1.9 1.9 -1.1 -1.1 3.1 3.1 3.5 3.5 0.5 0.5 Q4 2.1 2.1 1.2 1.2 0.8 0.8 0.2 0.2 1.1 1.1
2002 Q2 4.5 4.5 3.2 3.1 1.2 1.3 2.4 2.4 0.3 0.3 Q4 3.7 3.5 2.6 2.1 1.1 1.4 2.0 2.3 0.1 0.0
2003 Q2 4.7 3.9 3.0 2.4 1.7 1.4 1.9 1.5 0.1 0.3 Q4 5.0 4.9 3.5 3.6 1.4 1.3 1.8 1.7 -0.1 -0.1
2004 Q2 5.5 5.5 3.8 4.0 1.6 1.4 1.8 1.7 -0.1 -0.2 Q4 5.1 5.1 3.7 3.8 1.3 1.2 1.7 1.7 -0.2 -0.1
FOUR-QUARTER4
____________
2000 Q4 4.6 4.6 2.3 2.3 2.3 2.3 3.4 3.4 -0.1 -0.12001 Q4 2.0 2.0 0.1 0.1 2.0 2.0 1.9 1.9 1.6 1.62002 Q4 4.1 4.0 2.9 2.6 1.2 1.4 2.2 2.3 0.4 0.32003 Q4 4.9 4.4 3.3 3.0 1.5 1.3 1.8 1.6 -0.1 0.22004 Q4 5.3 5.3 3.8 3.9 1.4 1.3 1.7 1.7 -0.3 -0.4
1. For all urban consumers. 2. Level, except as noted. 3. Percent change from two quarters earlier; for unemployment rate, change in percentage points. 4. Percent change from four quarters earlier; for unemployment rate, change in percentage points.
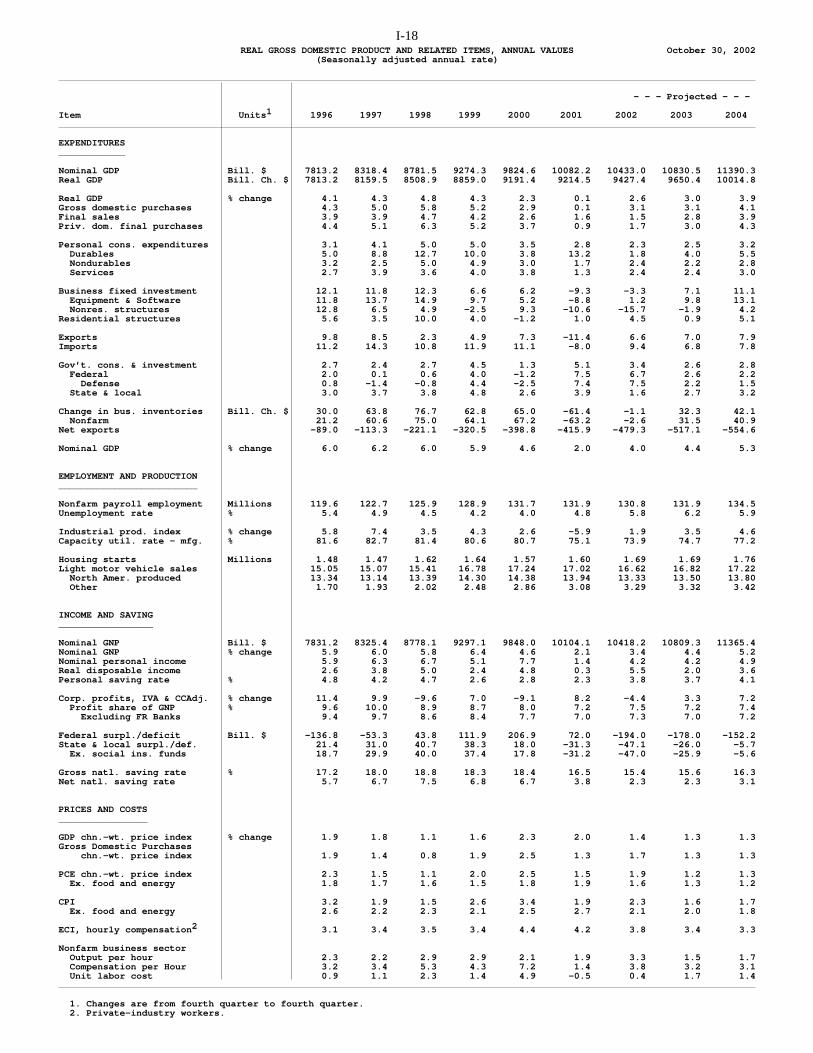
I-18REAL GROSS DOMESTIC PRODUCT AND RELATED ITEMS, ANNUAL VALUES October 30, 2002
(Seasonally adjusted annual rate)
- - - Projected - - -
Item Units 1 1996 1997 1998 1999 2000 2001 2002 2003 2004
EXPENDITURES____________
Nominal GDP Bill. $ 7813.2 8318.4 8781.5 9274.3 9824.6 10082.2 10433.0 10830.5 11390.3Real GDP Bill. Ch. $ 7813.2 8159.5 8508.9 8859.0 9191.4 9214.5 9427.4 9650.4 10014.8
Real GDP % change 4.1 4.3 4.8 4.3 2.3 0.1 2.6 3.0 3.9Gross domestic purchases 4.3 5.0 5.8 5.2 2.9 0.1 3.1 3.1 4.1Final sales 3.9 3.9 4.7 4.2 2.6 1.6 1.5 2.8 3.9Priv. dom. final purchases 4.4 5.1 6.3 5.2 3.7 0.9 1.7 3.0 4.3
Personal cons. expenditures 3.1 4.1 5.0 5.0 3.5 2.8 2.3 2.5 3.2 Durables 5.0 8.8 12.7 10.0 3.8 13.2 1.8 4.0 5.5 Nondurables 3.2 2.5 5.0 4.9 3.0 1.7 2.4 2.2 2.8 Services 2.7 3.9 3.6 4.0 3.8 1.3 2.4 2.4 3.0
Business fixed investment 12.1 11.8 12.3 6.6 6.2 -9.3 -3.3 7.1 11.1 Equipment & Software 11.8 13.7 14.9 9.7 5.2 -8.8 1.2 9.8 13.1 Nonres. structures 12.8 6.5 4.9 -2.5 9.3 -10.6 -15.7 -1.9 4.2Residential structures 5.6 3.5 10.0 4.0 -1.2 1.0 4.5 0.9 5.1
Exports 9.8 8.5 2.3 4.9 7.3 -11.4 6.6 7.0 7.9Imports 11.2 14.3 10.8 11.9 11.1 -8.0 9.4 6.8 7.8
Gov’t. cons. & investment 2.7 2.4 2.7 4.5 1.3 5.1 3.4 2.6 2.8 Federal 2.0 0.1 0.6 4.0 -1.2 7.5 6.7 2.6 2.2 Defense 0.8 -1.4 -0.8 4.4 -2.5 7.4 7.5 2.2 1.5 State & local 3.0 3.7 3.8 4.8 2.6 3.9 1.6 2.7 3.2
Change in bus. inventories Bill. Ch. $ 30.0 63.8 76.7 62.8 65.0 -61.4 -1.1 32.3 42.1 Nonfarm 21.2 60.6 75.0 64.1 67.2 -63.2 -2.6 31.5 40.9Net exports -89.0 -113.3 -221.1 -320.5 -398.8 -415.9 -479.3 -517.1 -554.6
Nominal GDP % change 6.0 6.2 6.0 5.9 4.6 2.0 4.0 4.4 5.3
EMPLOYMENT AND PRODUCTION_________________________
Nonfarm payroll employment Millions 119.6 122.7 125.9 128.9 131.7 131.9 130.8 131.9 134.5Unemployment rate % 5.4 4.9 4.5 4.2 4.0 4.8 5.8 6.2 5.9
Industrial prod. index % change 5.8 7.4 3.5 4.3 2.6 -5.9 1.9 3.5 4.6Capacity util. rate - mfg. % 81.6 82.7 81.4 80.6 80.7 75.1 73.9 74.7 77.2
Housing starts Millions 1.48 1.47 1.62 1.64 1.57 1.60 1.69 1.69 1.76Light motor vehicle sales 15.05 15.07 15.41 16.78 17.24 17.02 16.62 16.82 17.22 North Amer. produced 13.34 13.14 13.39 14.30 14.38 13.94 13.33 13.50 13.80 Other 1.70 1.93 2.02 2.48 2.86 3.08 3.29 3.32 3.42
INCOME AND SAVING_________________
Nominal GNP Bill. $ 7831.2 8325.4 8778.1 9297.1 9848.0 10104.1 10418.2 10809.3 11365.4Nominal GNP % change 5.9 6.0 5.8 6.4 4.6 2.1 3.4 4.4 5.2Nominal personal income 5.9 6.3 6.7 5.1 7.7 1.4 4.2 4.2 4.9Real disposable income 2.6 3.8 5.0 2.4 4.8 0.3 5.5 2.0 3.6Personal saving rate % 4.8 4.2 4.7 2.6 2.8 2.3 3.8 3.7 4.1
Corp. profits, IVA & CCAdj. % change 11.4 9.9 -9.6 7.0 -9.1 8.2 -4.4 3.3 7.2 Profit share of GNP % 9.6 10.0 8.9 8.7 8.0 7.2 7.5 7.2 7.4 Excluding FR Banks 9.4 9.7 8.6 8.4 7.7 7.0 7.3 7.0 7.2
Federal surpl./deficit Bill. $ -136.8 -53.3 43.8 111.9 206.9 72.0 -194.0 -178.0 -152.2State & local surpl./def. 21.4 31.0 40.7 38.3 18.0 -31.3 -47.1 -26.0 -5.7 Ex. social ins. funds 18.7 29.9 40.0 37.4 17.8 -31.2 -47.0 -25.9 -5.6
Gross natl. saving rate % 17.2 18.0 18.8 18.3 18.4 16.5 15.4 15.6 16.3Net natl. saving rate 5.7 6.7 7.5 6.8 6.7 3.8 2.3 2.3 3.1
PRICES AND COSTS________________
GDP chn.-wt. price index % change 1.9 1.8 1.1 1.6 2.3 2.0 1.4 1.3 1.3Gross Domestic Purchases chn.-wt. price index 1.9 1.4 0.8 1.9 2.5 1.3 1.7 1.3 1.3
PCE chn.-wt. price index 2.3 1.5 1.1 2.0 2.5 1.5 1.9 1.2 1.3 Ex. food and energy 1.8 1.7 1.6 1.5 1.8 1.9 1.6 1.3 1.2
CPI 3.2 1.9 1.5 2.6 3.4 1.9 2.3 1.6 1.7 Ex. food and energy 2.6 2.2 2.3 2.1 2.5 2.7 2.1 2.0 1.8
ECI, hourly compensation 2 3.1 3.4 3.5 3.4 4.4 4.2 3.8 3.4 3.3
Nonfarm business sector Output per hour 2.3 2.2 2.9 2.9 2.1 1.9 3.3 1.5 1.7 Compensation per Hour 3.2 3.4 5.3 4.3 7.2 1.4 3.8 3.2 3.1 Unit labor cost 0.9 1.1 2.3 1.4 4.9 -0.5 0.4 1.7 1.4
1. Changes are from fourth quarter to fourth quarter. 2. Private-industry workers.
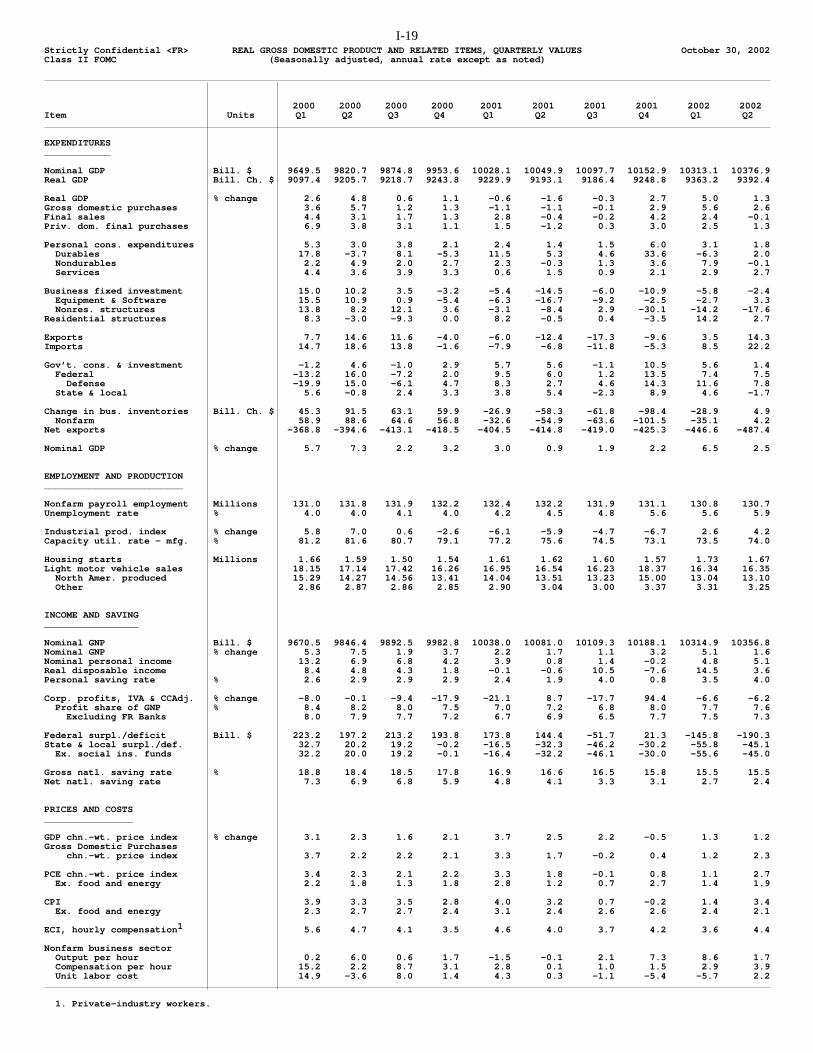
I-19Strictly Confidential <FR> REAL GROSS DOMESTIC PRODUCT AND RELATED ITEMS, QUARTERLY VALUES October 30, 2002Class II FOMC (Seasonally adjusted, annual rate except as noted)
2000 2000 2000 2000 2001 2001 2001 2001 2002 2002Item Units Q1 Q2 Q3 Q4 Q1 Q2 Q3 Q4 Q1 Q2
EXPENDITURES____________
Nominal GDP Bill. $ 9649.5 9820.7 9874.8 9953.6 10028.1 10049.9 10097.7 10152.9 10313.1 10376.9Real GDP Bill. Ch. $ 9097.4 9205.7 9218.7 9243.8 9229.9 9193.1 9186.4 9248.8 9363.2 9392.4
Real GDP % change 2.6 4.8 0.6 1.1 -0.6 -1.6 -0.3 2.7 5.0 1.3Gross domestic purchases 3.6 5.7 1.2 1.3 -1.1 -1.1 -0.1 2.9 5.6 2.6Final sales 4.4 3.1 1.7 1.3 2.8 -0.4 -0.2 4.2 2.4 -0.1Priv. dom. final purchases 6.9 3.8 3.1 1.1 1.5 -1.2 0.3 3.0 2.5 1.3
Personal cons. expenditures 5.3 3.0 3.8 2.1 2.4 1.4 1.5 6.0 3.1 1.8 Durables 17.8 -3.7 8.1 -5.3 11.5 5.3 4.6 33.6 -6.3 2.0 Nondurables 2.2 4.9 2.0 2.7 2.3 -0.3 1.3 3.6 7.9 -0.1 Services 4.4 3.6 3.9 3.3 0.6 1.5 0.9 2.1 2.9 2.7
Business fixed investment 15.0 10.2 3.5 -3.2 -5.4 -14.5 -6.0 -10.9 -5.8 -2.4 Equipment & Software 15.5 10.9 0.9 -5.4 -6.3 -16.7 -9.2 -2.5 -2.7 3.3 Nonres. structures 13.8 8.2 12.1 3.6 -3.1 -8.4 2.9 -30.1 -14.2 -17.6Residential structures 8.3 -3.0 -9.3 0.0 8.2 -0.5 0.4 -3.5 14.2 2.7
Exports 7.7 14.6 11.6 -4.0 -6.0 -12.4 -17.3 -9.6 3.5 14.3Imports 14.7 18.6 13.8 -1.6 -7.9 -6.8 -11.8 -5.3 8.5 22.2
Gov’t. cons. & investment -1.2 4.6 -1.0 2.9 5.7 5.6 -1.1 10.5 5.6 1.4 Federal -13.2 16.0 -7.2 2.0 9.5 6.0 1.2 13.5 7.4 7.5 Defense -19.9 15.0 -6.1 4.7 8.3 2.7 4.6 14.3 11.6 7.8 State & local 5.6 -0.8 2.4 3.3 3.8 5.4 -2.3 8.9 4.6 -1.7
Change in bus. inventories Bill. Ch. $ 45.3 91.5 63.1 59.9 -26.9 -58.3 -61.8 -98.4 -28.9 4.9 Nonfarm 58.9 88.6 64.6 56.8 -32.6 -54.9 -63.6 -101.5 -35.1 4.2Net exports -368.8 -394.6 -413.1 -418.5 -404.5 -414.8 -419.0 -425.3 -446.6 -487.4
Nominal GDP % change 5.7 7.3 2.2 3.2 3.0 0.9 1.9 2.2 6.5 2.5
EMPLOYMENT AND PRODUCTION_________________________
Nonfarm payroll employment Millions 131.0 131.8 131.9 132.2 132.4 132.2 131.9 131.1 130.8 130.7Unemployment rate % 4.0 4.0 4.1 4.0 4.2 4.5 4.8 5.6 5.6 5.9
Industrial prod. index % change 5.8 7.0 0.6 -2.6 -6.1 -5.9 -4.7 -6.7 2.6 4.2Capacity util. rate - mfg. % 81.2 81.6 80.7 79.1 77.2 75.6 74.5 73.1 73.5 74.0
Housing starts Millions 1.66 1.59 1.50 1.54 1.61 1.62 1.60 1.57 1.73 1.67Light motor vehicle sales 18.15 17.14 17.42 16.26 16.95 16.54 16.23 18.37 16.34 16.35 North Amer. produced 15.29 14.27 14.56 13.41 14.04 13.51 13.23 15.00 13.04 13.10 Other 2.86 2.87 2.86 2.85 2.90 3.04 3.00 3.37 3.31 3.25
INCOME AND SAVING_________________
Nominal GNP Bill. $ 9670.5 9846.4 9892.5 9982.8 10038.0 10081.0 10109.3 10188.1 10314.9 10356.8Nominal GNP % change 5.3 7.5 1.9 3.7 2.2 1.7 1.1 3.2 5.1 1.6Nominal personal income 13.2 6.9 6.8 4.2 3.9 0.8 1.4 -0.2 4.8 5.1Real disposable income 8.4 4.8 4.3 1.8 -0.1 -0.6 10.5 -7.6 14.5 3.6Personal saving rate % 2.6 2.9 2.9 2.9 2.4 1.9 4.0 0.8 3.5 4.0
Corp. profits, IVA & CCAdj. % change -8.0 -0.1 -9.4 -17.9 -21.1 8.7 -17.7 94.4 -6.6 -6.2 Profit share of GNP % 8.4 8.2 8.0 7.5 7.0 7.2 6.8 8.0 7.7 7.6 Excluding FR Banks 8.0 7.9 7.7 7.2 6.7 6.9 6.5 7.7 7.5 7.3
Federal surpl./deficit Bill. $ 223.2 197.2 213.2 193.8 173.8 144.4 -51.7 21.3 -145.8 -190.3State & local surpl./def. 32.7 20.2 19.2 -0.2 -16.5 -32.3 -46.2 -30.2 -55.8 -45.1 Ex. social ins. funds 32.2 20.0 19.2 -0.1 -16.4 -32.2 -46.1 -30.0 -55.6 -45.0
Gross natl. saving rate % 18.8 18.4 18.5 17.8 16.9 16.6 16.5 15.8 15.5 15.5Net natl. saving rate 7.3 6.9 6.8 5.9 4.8 4.1 3.3 3.1 2.7 2.4
PRICES AND COSTS________________
GDP chn.-wt. price index % change 3.1 2.3 1.6 2.1 3.7 2.5 2.2 -0.5 1.3 1.2Gross Domestic Purchases chn.-wt. price index 3.7 2.2 2.2 2.1 3.3 1.7 -0.2 0.4 1.2 2.3
PCE chn.-wt. price index 3.4 2.3 2.1 2.2 3.3 1.8 -0.1 0.8 1.1 2.7 Ex. food and energy 2.2 1.8 1.3 1.8 2.8 1.2 0.7 2.7 1.4 1.9
CPI 3.9 3.3 3.5 2.8 4.0 3.2 0.7 -0.2 1.4 3.4 Ex. food and energy 2.3 2.7 2.7 2.4 3.1 2.4 2.6 2.6 2.4 2.1
ECI, hourly compensation 1 5.6 4.7 4.1 3.5 4.6 4.0 3.7 4.2 3.6 4.4
Nonfarm business sector Output per hour 0.2 6.0 0.6 1.7 -1.5 -0.1 2.1 7.3 8.6 1.7 Compensation per hour 15.2 2.2 8.7 3.1 2.8 0.1 1.0 1.5 2.9 3.9 Unit labor cost 14.9 -3.6 8.0 1.4 4.3 0.3 -1.1 -5.4 -5.7 2.2
1. Private-industry workers.
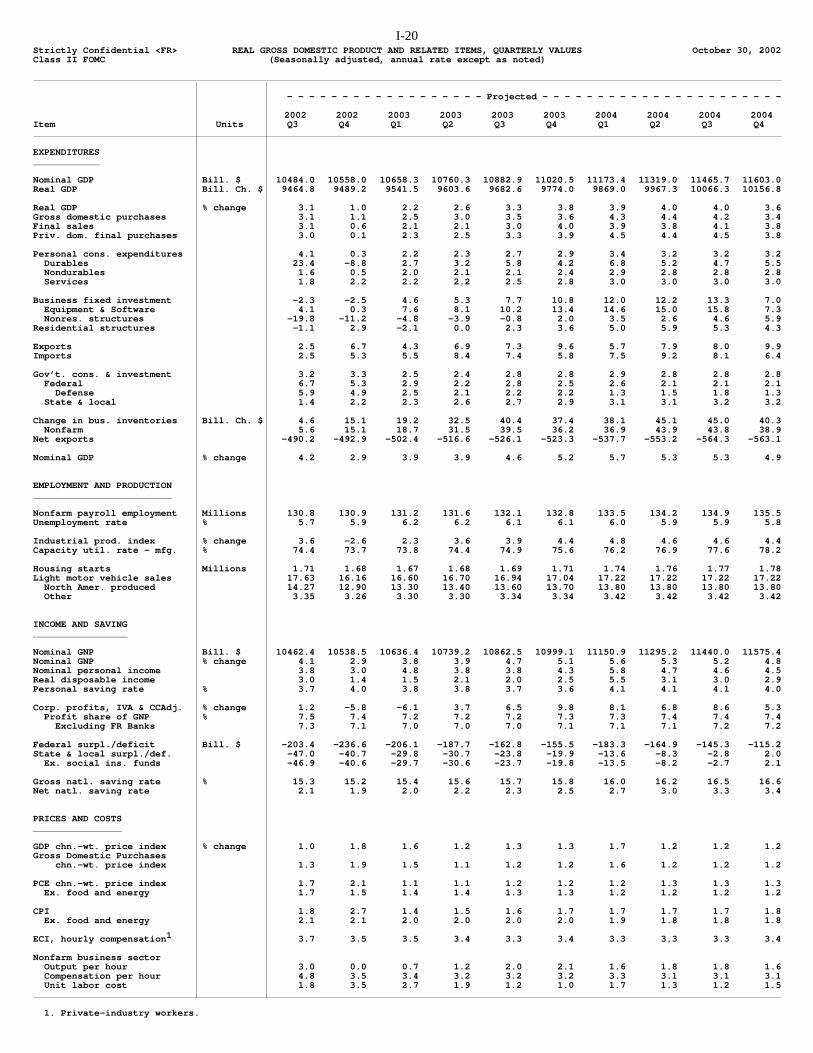
I-20Strictly Confidential <FR> REAL GROSS DOMESTIC PRODUCT AND RELATED ITEMS, QUARTERLY VALUES October 30, 2002Class II FOMC (Seasonally adjusted, annual rate except as noted)
- - - - - - - - - - - - - - - - - - Projected - - - - - - - - - - - - - - - - - - - - - -
2002 2002 2003 2003 2003 2003 2004 2004 2004 2004Item Units Q3 Q4 Q1 Q2 Q3 Q4 Q1 Q2 Q3 Q4
EXPENDITURES____________
Nominal GDP Bill. $ 10484.0 10558.0 10658.3 10760.3 10882.9 11020.5 11173.4 11319.0 11465.7 11603.0Real GDP Bill. Ch. $ 9464.8 9489.2 9541.5 9603.6 9682.6 9774.0 9869.0 9967.3 10066.3 10156.8
Real GDP % change 3.1 1.0 2.2 2.6 3.3 3.8 3.9 4.0 4.0 3.6Gross domestic purchases 3.1 1.1 2.5 3.0 3.5 3.6 4.3 4.4 4.2 3.4Final sales 3.1 0.6 2.1 2.1 3.0 4.0 3.9 3.8 4.1 3.8Priv. dom. final purchases 3.0 0.1 2.3 2.5 3.3 3.9 4.5 4.4 4.5 3.8
Personal cons. expenditures 4.1 0.3 2.2 2.3 2.7 2.9 3.4 3.2 3.2 3.2 Durables 23.4 -8.8 2.7 3.2 5.8 4.2 6.8 5.2 4.7 5.5 Nondurables 1.6 0.5 2.0 2.1 2.1 2.4 2.9 2.8 2.8 2.8 Services 1.8 2.2 2.2 2.2 2.5 2.8 3.0 3.0 3.0 3.0
Business fixed investment -2.3 -2.5 4.6 5.3 7.7 10.8 12.0 12.2 13.3 7.0 Equipment & Software 4.1 0.3 7.6 8.1 10.2 13.4 14.6 15.0 15.8 7.3 Nonres. structures -19.8 -11.2 -4.8 -3.9 -0.8 2.0 3.5 2.6 4.6 5.9Residential structures -1.1 2.9 -2.1 0.0 2.3 3.6 5.0 5.9 5.3 4.3
Exports 2.5 6.7 4.3 6.9 7.3 9.6 5.7 7.9 8.0 9.9Imports 2.5 5.3 5.5 8.4 7.4 5.8 7.5 9.2 8.1 6.4
Gov’t. cons. & investment 3.2 3.3 2.5 2.4 2.8 2.8 2.9 2.8 2.8 2.8 Federal 6.7 5.3 2.9 2.2 2.8 2.5 2.6 2.1 2.1 2.1 Defense 5.9 4.9 2.5 2.1 2.2 2.2 1.3 1.5 1.8 1.3 State & local 1.4 2.2 2.3 2.6 2.7 2.9 3.1 3.1 3.2 3.2
Change in bus. inventories Bill. Ch. $ 4.6 15.1 19.2 32.5 40.4 37.4 38.1 45.1 45.0 40.3 Nonfarm 5.6 15.1 18.7 31.5 39.5 36.2 36.9 43.9 43.8 38.9Net exports -490.2 -492.9 -502.4 -516.6 -526.1 -523.3 -537.7 -553.2 -564.3 -563.1
Nominal GDP % change 4.2 2.9 3.9 3.9 4.6 5.2 5.7 5.3 5.3 4.9
EMPLOYMENT AND PRODUCTION_________________________
Nonfarm payroll employment Millions 130.8 130.9 131.2 131.6 132.1 132.8 133.5 134.2 134.9 135.5Unemployment rate % 5.7 5.9 6.2 6.2 6.1 6.1 6.0 5.9 5.9 5.8
Industrial prod. index % change 3.6 -2.6 2.3 3.6 3.9 4.4 4.8 4.6 4.6 4.4Capacity util. rate - mfg. % 74.4 73.7 73.8 74.4 74.9 75.6 76.2 76.9 77.6 78.2
Housing starts Millions 1.71 1.68 1.67 1.68 1.69 1.71 1.74 1.76 1.77 1.78Light motor vehicle sales 17.63 16.16 16.60 16.70 16.94 17.04 17.22 17.22 17.22 17.22 North Amer. produced 14.27 12.90 13.30 13.40 13.60 13.70 13.80 13.80 13.80 13.80 Other 3.35 3.26 3.30 3.30 3.34 3.34 3.42 3.42 3.42 3.42
INCOME AND SAVING_________________
Nominal GNP Bill. $ 10462.4 10538.5 10636.4 10739.2 10862.5 10999.1 11150.9 11295.2 11440.0 11575.4Nominal GNP % change 4.1 2.9 3.8 3.9 4.7 5.1 5.6 5.3 5.2 4.8Nominal personal income 3.8 3.0 4.8 3.8 3.8 4.3 5.8 4.7 4.6 4.5Real disposable income 3.0 1.4 1.5 2.1 2.0 2.5 5.5 3.1 3.0 2.9Personal saving rate % 3.7 4.0 3.8 3.8 3.7 3.6 4.1 4.1 4.1 4.0
Corp. profits, IVA & CCAdj. % change 1.2 -5.8 -6.1 3.7 6.5 9.8 8.1 6.8 8.6 5.3 Profit share of GNP % 7.5 7.4 7.2 7.2 7.2 7.3 7.3 7.4 7.4 7.4 Excluding FR Banks 7.3 7.1 7.0 7.0 7.0 7.1 7.1 7.1 7.2 7.2
Federal surpl./deficit Bill. $ -203.4 -236.6 -206.1 -187.7 -162.8 -155.5 -183.3 -164.9 -145.3 -115.2State & local surpl./def. -47.0 -40.7 -29.8 -30.7 -23.8 -19.9 -13.6 -8.3 -2.8 2.0 Ex. social ins. funds -46.9 -40.6 -29.7 -30.6 -23.7 -19.8 -13.5 -8.2 -2.7 2.1
Gross natl. saving rate % 15.3 15.2 15.4 15.6 15.7 15.8 16.0 16.2 16.5 16.6Net natl. saving rate 2.1 1.9 2.0 2.2 2.3 2.5 2.7 3.0 3.3 3.4
PRICES AND COSTS________________
GDP chn.-wt. price index % change 1.0 1.8 1.6 1.2 1.3 1.3 1.7 1.2 1.2 1.2Gross Domestic Purchases chn.-wt. price index 1.3 1.9 1.5 1.1 1.2 1.2 1.6 1.2 1.2 1.2
PCE chn.-wt. price index 1.7 2.1 1.1 1.1 1.2 1.2 1.2 1.3 1.3 1.3 Ex. food and energy 1.7 1.5 1.4 1.4 1.3 1.3 1.2 1.2 1.2 1.2
CPI 1.8 2.7 1.4 1.5 1.6 1.7 1.7 1.7 1.7 1.8 Ex. food and energy 2.1 2.1 2.0 2.0 2.0 2.0 1.9 1.8 1.8 1.8
ECI, hourly compensation 1 3.7 3.5 3.5 3.4 3.3 3.4 3.3 3.3 3.3 3.4
Nonfarm business sector Output per hour 3.0 0.0 0.7 1.2 2.0 2.1 1.6 1.8 1.8 1.6 Compensation per hour 4.8 3.5 3.4 3.2 3.2 3.2 3.3 3.1 3.1 3.1 Unit labor cost 1.8 3.5 2.7 1.9 1.2 1.0 1.7 1.3 1.2 1.5
1. Private-industry workers.
I-21
Str
ictly
Co
nfid
en
tial <
FR
>C
ON
TR
IBU
TIO
NS
TO
GR
OW
TH
IN
RE
AL
GR
OS
S D
OM
ES
TIC
PR
OD
UC
T A
ND
RE
LA
TE
D I
TE
MS
Oct
ob
er
30
, 2
00
2C
lass
II
FO
MC
20
00
20
00
20
01
20
01
20
01
20
01
20
02
20
02
20
02
00
Q4
/0
1Q
4/
02
Q4
/It
em
Q3
Q
4
Q1
Q
2
Q3
Q
4
Q1
Q
2
Q3
9
9Q
40
0Q
40
1Q
4
Re
al G
DP
0
.61
.1-0
.6-1
.6-0
.32
.75
.01
.33
.12
.30
.12
.6
Gro
ss d
om
. p
urc
ha
ses
1
.31
.3-1
.1-1
.2-0
.13
.05
.82
.73
.23
.00
.23
.2
F
ina
l sa
les
1
.71
.22
.7-0
.5-0
.24
.12
.5-0
.13
.12
.61
.61
.5
P
riv.
do
m.
fina
l pu
rch
ase
s
2.6
1.0
1.2
-1.0
0.3
2.6
2.2
1.1
2.6
3.1
0.8
1.5
Pe
rso
na
l co
ns.
exp
en
ditu
res
2
.51
.41
.50
.91
.04
.12
.21
.22
.82
.41
.91
.6
Du
rab
les
0
.6-0
.40
.90
.40
.42
.5-0
.60
.21
.80
.31
.00
.2
No
nd
ura
ble
s
0.4
0.5
0.5
-0.1
0.3
0.7
1.6
-0.0
0.3
0.6
0.3
0.5
S
erv
ice
s
1.5
1.3
0.2
0.6
0.4
0.9
1.2
1.1
0.7
1.5
0.5
1.0
Bu
sin
ess
fix
ed
inve
stm
en
t
0.5
-0.4
-0.7
-1.9
-0.7
-1.3
-0.7
-0.3
-0.2
0.8
-1.2
-0.4
E
qu
ipm
en
t &
So
ftw
are
0
.1-0
.5-0
.6-1
.6-0
.8-0
.2-0
.20
.30
.30
.5-0
.80
.1
No
nre
s. s
tru
ctu
res
0
.40
.1-0
.1-0
.30
.1-1
.1-0
.4-0
.5-0
.60
.3-0
.4-0
.5
R
esi
de
ntia
l str
uct
ure
s
-0.4
0.0
0.3
-0.0
0.0
-0.2
0.6
0.1
-0.0
-0.1
0.0
0.2
Ne
t e
xpo
rts
-0
.7-0
.20
.5-0
.4-0
.2-0
.3-0
.8-1
.4-0
.1-0
.8-0
.1-0
.6
Exp
ort
s
1.3
-0.5
-0.7
-1.4
-1.9
-1.0
0.3
1.3
0.2
0.8
-1.3
0.6
Im
po
rts
-2
.00
.21
.21
.01
.70
.7-1
.1-2
.7-0
.3-1
.51
.2-1
.2
Go
vern
me
nt
con
s. &
inve
st.
-0
.20
.51
.01
.0-0
.21
.91
.00
.30
.60
.20
.90
.6
Fe
de
ral
-0
.50
.10
.50
.40
.10
.80
.50
.50
.4-0
.10
.40
.4
D
efe
nse
-0
.20
.20
.30
.10
.20
.50
.50
.30
.2-0
.10
.30
.3
N
on
de
fen
se
-0.2
-0.1
0.2
0.3
-0.1
0.3
0.0
0.2
0.2
0.0
0.2
0.1
S
tate
an
d lo
cal
0
.30
.40
.50
.6-0
.31
.10
.6-0
.20
.20
.30
.50
.2
C
ha
ng
e in
bu
s. in
ven
torie
s
-1.1
-0.1
-3.3
-1.1
-0.1
-1.4
2.6
1.3
0.0
-0.3
-1.5
1.1
No
nfa
rm
-1.0
-0.3
-3.4
-0.8
-0.3
-1.4
2.5
1.5
0.1
-0.4
-1.6
1.1
Fa
rm
-0.2
0.2
0.2
-0.3
0.2
0.1
0.1
-0.2
-0.0
0.1
0.0
-0.0
N
ote
. C
om
po
ne
nts
ma
y n
ot
sum
to
to
tals
be
cau
se o
f ro
un
din
g.
I-22
Str
ictly
Co
nfid
en
tial <
FR
>C
ON
TR
IBU
TIO
NS
TO
GR
OW
TH
IN
RE
AL
GR
OS
S D
OM
ES
TIC
PR
OD
UC
T A
ND
RE
LA
TE
D I
TE
MS
Oct
ob
er
30
, 2
00
2C
lass
II
FO
MC
20
02
20
03
20
03
20
03
20
03
20
04
20
04
20
04
20
04
02
Q4
/0
3Q
4/
04
Q4
/It
em
Q4
Q
1
Q2
Q
3
Q4
Q
1
Q2
Q
3
Q4
0
1Q
40
2Q
40
3Q
4
Re
al G
DP
1
.02
.22
.63
.33
.83
.94
.04
.03
.62
.63
.03
.9
Gro
ss d
om
. p
urc
ha
ses
1
.12
.53
.13
.63
.74
.44
.54
.43
.63
.23
.34
.2
F
ina
l sa
les
0
.62
.12
.13
.03
.93
.93
.84
.03
.81
.52
.83
.9
P
riv.
do
m.
fina
l pu
rch
ase
s
0.1
1.9
2.2
2.8
3.3
3.8
3.8
3.8
3.2
1.5
2.5
3.7
Pe
rso
na
l co
ns.
exp
en
ditu
res
0
.21
.51
.61
.92
.02
.42
.22
.22
.31
.61
.82
.3
Du
rab
les
-0
.80
.20
.30
.50
.30
.50
.40
.40
.40
.20
.30
.4
No
nd
ura
ble
s
0.1
0.4
0.4
0.4
0.5
0.6
0.6
0.6
0.6
0.5
0.4
0.6
S
erv
ice
s
0.9
0.9
0.9
1.0
1.2
1.3
1.3
1.3
1.3
1.0
1.0
1.3
Bu
sin
ess
fix
ed
inve
stm
en
t
-0.3
0.5
0.5
0.8
1.1
1.2
1.3
1.4
0.8
-0.4
0.7
1.2
E
qu
ipm
en
t &
So
ftw
are
0
.00
.60
.60
.81
.11
.21
.21
.30
.60
.10
.81
.1
No
nre
s. s
tru
ctu
res
-0
.3-0
.1-0
.1-0
.00
.00
.10
.10
.10
.1-0
.5-0
.00
.1
R
esi
de
ntia
l str
uct
ure
s
0.1
-0.1
0.0
0.1
0.2
0.2
0.3
0.2
0.2
0.2
0.0
0.2
Ne
t e
xpo
rts
-0
.1-0
.3-0
.5-0
.30
.1-0
.5-0
.5-0
.40
.1-0
.6-0
.3-0
.3
Exp
ort
s
0.6
0.4
0.7
0.7
0.9
0.6
0.8
0.8
1.0
0.6
0.7
0.8
Im
po
rts
-0
.7-0
.8-1
.2-1
.0-0
.8-1
.1-1
.3-1
.2-0
.9-1
.2-0
.9-1
.1
Go
vern
me
nt
con
s. &
inve
st.
0
.60
.50
.50
.50
.50
.60
.50
.50
.50
.60
.50
.5
Fe
de
ral
0
.30
.20
.10
.20
.20
.20
.10
.10
.10
.40
.20
.2
D
efe
nse
0
.20
.10
.10
.10
.10
.10
.10
.10
.10
.30
.10
.1
N
on
de
fen
se
0.1
0.1
0.1
0.1
0.1
0.1
0.1
0.1
0.1
0.1
0.1
0.1
S
tate
an
d lo
cal
0
.30
.30
.30
.30
.40
.40
.40
.40
.40
.20
.30
.4
C
ha
ng
e in
bu
s. in
ven
torie
s
0.4
0.2
0.5
0.3
-0.1
0.0
0.3
-0.0
-0.2
1.1
0.2
0.0
No
nfa
rm
0.4
0.1
0.5
0.3
-0.1
0.0
0.2
-0.0
-0.2
1.1
0.2
0.0
Fa
rm
0.0
0.0
0.0
-0.0
0.0
0.0
0.0
-0.0
0.0
-0.0
0.0
0.0
N
ote
. C
om
po
ne
nts
ma
y n
ot
sum
to
to
tals
be
cau
se o
f ro
un
din
g.
I-23
Str
ictly
Con
fiden
tial (
FR
)O
ctob
er 3
0, 2
002
Cla
ss II
FO
MC
Sta
ff P
roje
ctio
ns o
f Fed
eral
Sec
tor
Acc
ount
s an
d R
elat
ed It
ems
(Bill
ions
of d
olla
rs e
xcep
t as
note
d)
Fis
cal y
ear1
2002
2003
2004
Item
2001
a20
0220
0320
04Q
1aQ
2aQ
3Q
4Q
1Q
2Q
3Q
4Q
1Q
2Q
3Q
4
Uni
fied
budg
et
N
ot s
easo
nally
adj
uste
d
Rec
eipt
s219
9118
5319
3620
42
413
523
452
434
430
599
473
459
453
635
496
489
Out
lays
218
6320
1221
1221
88
509
507
494
532
537
528
515
552
555
547
534
573
Sur
plus
/def
icit2
127
-159
-176
-146
-9
716
-42
-98
-107
71-4
2-9
3-1
0388
-38
-85
O
n-bu
dget
-3
3-3
16-3
40-3
29
-127
-58
-53
-136
-144
-3-5
7-1
36-1
446
-55
-130
O
ff-bu
dget
16
115
816
418
3
3073
1139
3774
1444
4181
1745
Sur
plus
exc
ludi
ng
d
epos
it in
sura
nce
126
-160
-176
-146
-9
615
-43
-98
-107
71-4
2-9
3-1
0387
-38
-85
Mea
ns o
f fin
anci
ng
Bor
row
ing
-9
022
118
116
3
5121
8987
91-3
639
8897
-54
3180
C
ash
decr
ease
8-1
716
0
38-2
6-2
117
12-2
815
150
-30
1515
O
ther3
-46
-46
-21
-17
8
-11
-26
-63
-7-1
2-1
05
-4-8
-10
Cas
h op
erat
ing
bala
nce,
end
of p
erio
d
4461
4545
14
4061
4432
6045
3030
6045
30
NIP
A fe
dera
l sec
tor
Sea
sona
lly a
djus
ted
annu
al r
ates
Rec
eipt
s
20
2419
1119
4820
77
1885
1889
1879
1877
1939
1968
2007
2044
2054
2088
2122
2171
Exp
endi
ture
s
1909
2041
2146
2239
20
3120
7920
8321
1321
4521
5621
7021
9922
3722
5222
6822
86
Con
sum
ptio
n ex
pend
iture
s
517
570
610
639
56
658
158
759
661
161
561
962
464
064
464
865
2
D
efen
se
33
737
440
041
6
372
383
386
391
400
403
405
408
417
419
422
424
Non
defe
nse
18
019
521
022
2
194
199
201
205
211
212
214
216
223
225
226
228
O
ther
spe
ndin
g
1392
1471
1536
1600
14
6414
9814
9615
1715
3415
4115
5015
7515
9716
0916
2016
34C
urre
nt a
ccou
nt s
urpl
us
11
5-1
30-1
98-1
62
-146
-190
-203
-237
-206
-188
-163
-155
-183
-165
-145
-115
Gro
ss in
vest
men
t
9810
711
812
3
106
107
113
115
117
118
120
121
123
124
125
127
Cur
rent
and
cap
ital
acc
ount
sur
plus
17
-237
-316
-286
-2
52-2
97-3
17-3
52-3
23-3
06-2
83-2
77-3
06-2
89-2
71-2
42
Fis
cal i
ndic
ator
s4
Hig
h-em
ploy
men
t (H
EB
)
sur
plus
/def
icit
-3
9-2
38-3
02-2
86
-258
-295
-319
-345
-309
-288
-265
-265
-304
-294
-282
-257
Cha
nge
in H
EB
, per
cent
of p
oten
tial G
DP
0
2.5
-.3
2
.3.2
.2-.
4-.
2-.
2-0
.3-.
1-.
1-.
2F
isca
l im
petu
s (F
I)
p
erce
nt, c
alen
dar
year
1120
107
10
6.
73
41
21
31
1.1
1
. Fis
cal y
ear
data
for
the
unifi
ed b
udge
t com
e fr
om O
MB
; qua
rter
ly d
ata
com
e fr
om th
e M
onth
ly T
reas
ury
Sta
tem
ent a
nd m
ay n
ot s
um to
OM
B fi
scal
yea
r to
tals
.
2. O
MB
’s J
uly
2002
bas
elin
e su
rplu
s es
timat
es a
re -
$62
billi
on in
FY
200
3 an
d $1
7 bi
llion
in F
Y 2
004.
CB
O’s
Aug
ust 2
002
base
line
surp
lus
estim
ates
are
-$1
45 b
illio
n in
FY
200
3 an
d -$
111
billi
on in
F
Y 2
004.
Bud
get r
ecei
pts,
out
lays
, and
sur
plus
/def
icit
incl
ude
corr
espo
ndin
g so
cial
sec
urity
(O
AS
DI)
cat
egor
ies.
The
OA
SD
I s
urpl
us a
nd th
e P
osta
l Ser
vice
sur
plus
are
exc
lude
d fr
om th
e on
-bud
get s
urpl
us
and
sho
wn
sepa
rate
ly a
s of
f-bu
dget
, as
clas
sifie
d un
der
curr
ent l
aw.
3
. Oth
er m
eans
of f
inan
cing
are
che
cks
issu
ed le
ss c
heck
s pa
id, a
ccru
ed it
ems,
and
cha
nges
in o
ther
fina
ncia
l ass
ets
and
liab
ilitie
s.
4. H
EB
is th
e N
IPA
cur
rent
and
cap
ital a
ccou
nt s
urpl
us in
cur
rent
dol
lars
, with
cyc
lical
ly s
ensi
tive
rece
ipts
and
out
lays
adj
uste
d to
the
leve
l of p
oten
tial o
utpu
t ass
ocia
ted
with
an
unem
ploy
men
t rat
e of
6
per
cent
. Q
uart
erly
figu
res
for
chan
ge in
HE
B a
nd F
I are
not
at a
nnua
l rat
es.
The
sig
n on
Cha
nge
in H
EB
, as
a pe
rcen
t of n
omin
al p
oten
tial G
DP
, is
reve
rsed
. F
I is
the
wei
ghte
d di
ffere
nce
of d
iscr
etio
nary
c
hang
es in
fede
ral s
pend
ing
and
taxe
s in
cha
ined
(19
96)
dolla
rs, s
cale
d by
rea
l fed
eral
con
sum
ptio
n pl
us in
vest
men
t. F
or F
I and
the
chan
ge in
HE
B, n
egat
ive
valu
es in
dica
te a
ggre
gate
dem
and
rest
rain
t.
a--
Act
ual
I-24
Str
ictly
Con
fiden
tial (
FR
)C
hang
e in
Deb
t of t
he D
omes
tic N
onfin
anci
al S
ecto
rsO
ctob
er 3
0, 2
002
Cla
ss II
FO
MC
(Per
cent
)
Non
fede
ral
Hou
seho
lds
Mem
o:F
eder
alH
ome
Con
sum
erS
tate
and
loca
lN
omin
alP
erio
d 1T
otal
go
vern
men
t T
otal
T
otal
mor
tgag
escr
edit
Bus
ines
sgo
vern
men
tsG
DP
Ye
ar
1997
5.6
0.6
7.3
6.4
6.7
4.7
9.0
5.3
6.2
1998
6.8
-1.4
9.6
8.2
8.9
5.9
11.8
7.2
6.0
1999
6.6
-1.9
9.1
8.3
9.0
7.4
11.1
4.4
5.9
2000
4.9
-8.0
8.4
8.3
8.2
9.6
9.9
2.2
4.6
2001
6.1
-0.2
7.5
8.6
9.7
6.9
6.1
8.1
2.0
2002
6.5
7.4
6.3
9.2
10.7
5.6
2.4
9.4
4.0
2003
5.5
5.0
5.6
6.6
7.6
4.9
4.6
5.1
4.4
2004
5.3
4.1
5.6
6.1
6.6
5.0
5.3
4.5
5.3
Qu
art
er
2002
:14.
81.
25.
69.
210
.34.
81.
94.
56.
52
8.2
15.5
6.7
9.0
10.8
5.9
2.9
12.4
2.5
36.
27.
55.
99.
210
.55.
91.
68.
54.
24
6.1
4.5
6.4
8.2
9.5
5.3
3.3
11.1
2.9
2003
:15.
85.
65.
97.
28.
65.
04.
26.
43.
92
6.0
8.1
5.6
6.7
7.8
4.8
4.3
5.5
3.9
34.
81.
75.
56.
26.
94.
84.
84.
54.
64
5.0
4.4
5.2
5.7
6.4
4.7
4.8
3.7
5.2
2004
:15.
55.
95.
45.
86.
34.
85.
04.
55.
72
5.5
5.9
5.4
5.8
6.3
4.9
5.2
4.4
5.3
34.
70.
95.
56.
06.
54.
85.
24.
45.
34
5.2
3.4
5.6
6.1
6.6
5.0
5.3
4.4
4.9
N
ote.
Qua
rter
ly d
ata
are
at s
easo
nally
adj
uste
d an
nual
rat
es.
1.
Dat
a af
ter
2002
:Q2
are
staf
f pro
ject
ions
. Cha
nges
are
mea
sure
d fr
om e
nd o
f the
pre
cedi
ng p
erio
d to
e
nd o
f per
iod
indi
cate
d ex
cept
for
annu
al n
omin
al G
DP
gro
wth
, whi
ch is
cal
cula
ted
from
Q4
to Q
4.
2.6.
3 F
OF
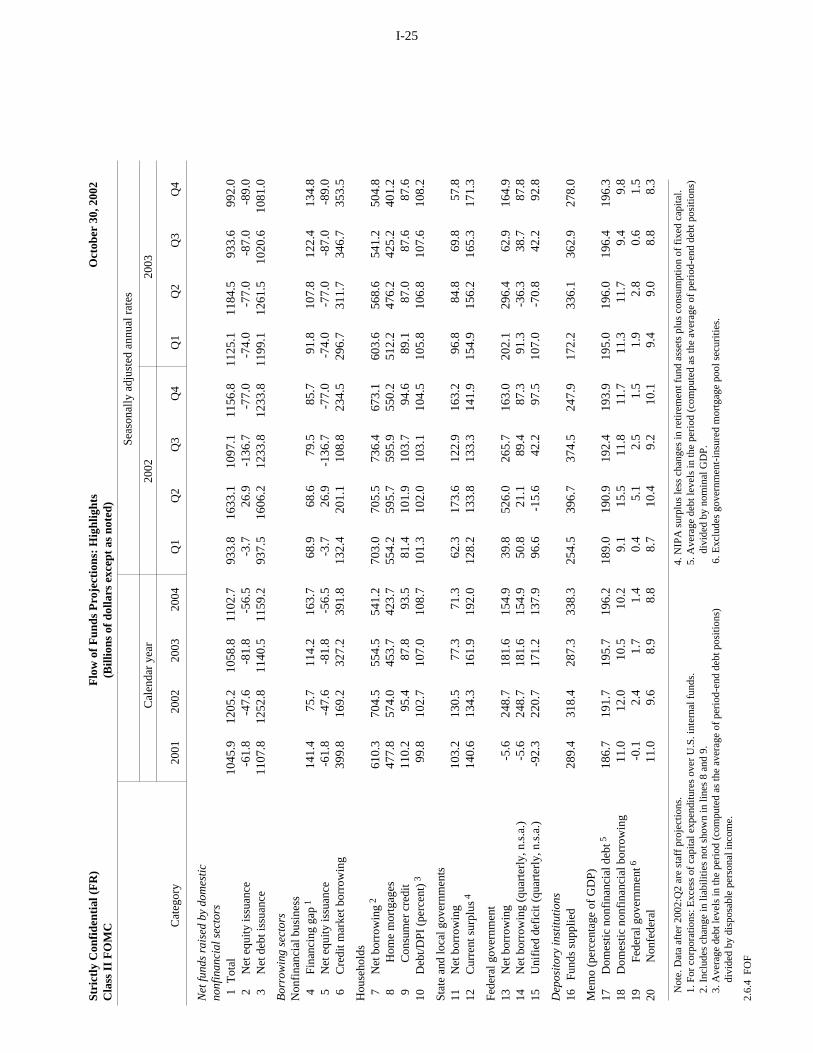
I-25
Str
ictly
Con
fiden
tial (
FR
)F
low
of F
unds
Pro
ject
ions
: Hig
hlig
hts
Oct
ober
30,
200
2 C
lass
II F
OM
C(B
illio
ns o
f dol
lars
exc
ept a
s no
ted)
S
easo
nally
adj
uste
d an
nual
rat
es
Cal
enda
r ye
ar20
0220
03
Cat
egor
y20
0120
0220
0320
04Q
1 Q
2 Q
3 Q
4 Q
1 Q
2 Q
3 Q
4
Ne
t fu
nd
s ra
ise
d b
y d
om
est
icn
on
fina
nci
al s
ect
ors
1 T
otal
1045
.912
05.2
1058
.811
02.7
933.
816
33.1
1097
.111
56.8
1125
.111
84.5
933.
699
2.0
2
Net
equ
ity is
suan
ce-6
1.8
-47.
6-8
1.8
-56.
5-3
.726
.9-1
36.7
-77.
0-7
4.0
-77.
0-8
7.0
-89.
0 3
N
et d
ebt i
ssua
nce
1107
.812
52.8
1140
.511
59.2
937.
516
06.2
1233
.812
33.8
1199
.112
61.5
1020
.610
81.0
Bo
rro
win
g s
ect
ors
Non
finan
cial
bus
ines
s 4
F
inan
cing
gap 1
141.
475
.711
4.2
163.
768
.968
.679
.585
.791
.810
7.8
122.
413
4.8
5
Net
equ
ity is
suan
ce-6
1.8
-47.
6-8
1.8
-56.
5-3
.726
.9-1
36.7
-77.
0-7
4.0
-77.
0-8
7.0
-89.
0 6
C
redi
t mar
ket b
orro
win
g39
9.8
169.
232
7.2
391.
813
2.4
201.
110
8.8
234.
529
6.7
311.
734
6.7
353.
5
Hou
seho
lds
7
Net
bor
row
ing 2
610.
370
4.5
554.
554
1.2
703.
070
5.5
736.
467
3.1
603.
656
8.6
541.
250
4.8
8
Hom
e m
ortg
ages
477.
857
4.0
453.
742
3.7
554.
259
5.7
595.
955
0.2
512.
247
6.2
425.
240
1.2
9
Con
sum
er c
redi
t11
0.2
95.4
87.8
93.5
81.4
101.
910
3.7
94.6
89.1
87.0
87.6
87.6
10
Deb
t/DP
I (pe
rcen
t) 399
.810
2.7
107.
010
8.7
101.
310
2.0
103.
110
4.5
105.
810
6.8
107.
610
8.2
Sta
te a
nd lo
cal g
over
nmen
ts11
N
et b
orro
win
g10
3.2
130.
577
.371
.362
.317
3.6
122.
916
3.2
96.8
84.8
69.8
57.8
12
Cur
rent
sur
plus 4
140.
613
4.3
161.
919
2.0
128.
213
3.8
133.
314
1.9
154.
915
6.2
165.
317
1.3
Fed
eral
gov
ernm
ent
13
Net
bor
row
ing
-5.6
248.
718
1.6
154.
939
.852
6.0
265.
716
3.0
202.
129
6.4
62.9
164.
914
N
et b
orro
win
g (q
uart
erly
, n.s
.a.)
-5.6
248.
718
1.6
154.
950
.821
.189
.487
.391
.3-3
6.3
38.7
87.8
15
Uni
fied
defic
it (q
uart
erly
, n.s
.a.)
-92.
322
0.7
171.
213
7.9
96.6
-15.
642
.297
.510
7.0
-70.
842
.292
.8
De
po
sito
ry in
stitu
tion
s16
F
unds
sup
plie
d28
9.4
318.
428
7.3
338.
325
4.5
396.
737
4.5
247.
917
2.2
336.
136
2.9
278.
0
Mem
o (p
erce
ntag
e of
GD
P)
17
Dom
estic
non
finan
cial
deb
t 5
186.
719
1.7
195.
719
6.2
189.
019
0.9
192.
419
3.9
195.
019
6.0
196.
419
6.3
18
Dom
estic
non
finan
cial
bor
row
ing
11.0
12.0
10.5
10.2
9.1
15.5
11.8
11.7
11.3
11.7
9.4
9.8
19
Fed
eral
gov
ernm
ent
6-0
.12.
41.
71.
40.
45.
12.
51.
51.
92.
80.
61.
520
N
onfe
dera
l11
.09.
68.
98.
88.
710
.49.
210
.19.
49.
08.
88.
3
N
ote.
Dat
a af
ter
2002
:Q2
are
staf
f pro
ject
ions
.
4. N
IPA
sur
plus
less
cha
nges
in r
etire
men
t fun
d as
sets
plu
s co
nsum
ptio
n of
fixe
d ca
pita
l.
1. F
or c
orpo
ratio
ns: E
xces
s of
cap
ital e
xpen
ditu
res
over
U.S
. int
erna
l fun
ds.
5. A
vera
ge d
ebt l
evel
s in
the
perio
d (c
ompu
ted
as th
e av
erag
e of
per
iod-
end
debt
pos
ition
s)
2. In
clud
es c
hang
e in
liab
ilitie
s no
t sho
wn
in li
nes
8 an
d 9.
div
ided
by
nom
inal
GD
P.
3.
Ave
rage
deb
t lev
els
in th
e pe
riod
(com
pute
d as
the
aver
age
of p
erio
d-en
d de
bt p
ositi
ons)
6
. Exc
lude
s go
vern
men
t-in
sure
d m
ortg
age
pool
sec
uriti
es.
div
ided
by
disp
osab
le p
erso
nal i
ncom
e.
2.6.
4 F
OF

(This page intentionally blank.)
International Developments
Continued weak economic data have led us to shave a bit off the outlook forforeign growth, despite some modest improvements in financial marketconditions. Foreign equity markets plunged to new multiyear lows in earlyOctober, but have more than reversed the decline since then, except in Japan. The price of oil has declined since our September forecast. However, industrialproduction and exports appear to have decelerated from their first-half pace in awide range of countries, and declining business confidence suggests that foreignfirms will remain cautious about investing and hiring.
Summary of Staff Projections(Percent change from end of previous period, s.a.a.r.)
Indicator2001
2002:H1
Projection
H1 H2 2002:H2 2003 2004
Foreign output -0.1 0.3 3.2 2.3 2.9 3.4Previous GB -0.1 0.3 3.1 2.7 3.2 3.4
Foreign CPI 2.6 0.8 2.6 2.1 2.0 1.9Previous GB 2.6 0.8 2.6 2.3 2.1 1.9NOTE. Changes for years are measured as Q4/Q4; for half years, Q2/Q4 or
Q4/Q2.
Domestic demand has remained weak in Japan and the euro area, as businesseshave cut back spending and consumers have failed to take up the slack. In Japan,details of proposed reforms announced this morning are too sketchy to alter ouroutlook for the economy. Uncertainties concerning prospects for resolvingJapan’s longstanding problems will likely weigh on private spending whilemonetary and fiscal policies are unlikely to provide much offsetting stimulus. Inthe euro area, despite disagreements about the implementation of the Stabilityand Growth Pact, fiscal policy is likely to turn contractionary. On the otherhand, we now project that the European Central Bank will lower interest rates byearly next year, providing some support to domestic demand. We project thateuro-area growth will remain anemic in the first half of 2003 but will strengthenin the second half of 2003 and in 2004.
In Canada, Mexico, and emerging Asia, we estimate that output growth hasslowed in the second half from the rapid pace earlier in the year, and we projectit to rise moderately in 2003 and 2004 in line with growth in U.S. demand. InSouth America, economic and financial conditions will likely continue to bequite fragile, and it remains to be seen whether Brazil’s newly elected presidentwill be able to restore investor confidence and keep the economy from slidinginto financial crisis.
I-28 Part 1: Summary and Outlook, October 30, 2002
The past run-up in oil prices has boosted foreign consumer price inflation thisyear, but we expect that continued excess capacity abroad and a gradual declinein oil prices will lower foreign inflation over the forecast period. In light ofreduced inflation pressures and heightened uncertainty about the growth outlook,we have lowered the projected path for policy interest rates in several countries.
After appreciating in the days preceding the September FOMC meeting, theforeign exchange value of the dollar has declined slightly on net over theintermeeting period. We continue to project modest depreciation of the dollarover the forecast period, taking the broad real dollar down about 2½ percent overthe next two years. The negative arithmetic contribution from net exports to U.S.GDP growth is expected to be just over ¼ percentage point (annual rate) onaverage over the forecast period, about the same as in the September Greenbook.
Oil PricesThe current spot price of West Texas intermediate (WTI) crude oil is about $27per barrel. After hovering around $29 per barrel through most of September andthe beginning of October, the spot price decreased, reflecting increased suppliesfrom OPEC and the market’s reaction to statements by the Bush administrationthat a diplomatic solution in Iraq may be possible. We project that, in line withrecent quotes from futures markets, the spot price of WTI will decrease to about$22.50 per barrel by the end of the forecast period. Compared with theSeptember Greenbook, the current projection is $2 per barrel lower in the fourthquarter of 2002 and about $1 per barrel lower by December 2004.
International Financial MarketsThe foreign exchange value of the dollar, as measured by the staff’s majorcurrencies index, is about ½ percent lower than at the time of the SeptemberFOMC meeting. The dollar edged lower against all the major currencies, led bya 1 percent depreciation against the Canadian dollar. Against the currencies ofour other important trading partners, the dollar was little changed on net, as a1 percent depreciation versus the Mexican peso offset a 5 percent appreciation ofthe dollar against the Brazilian real.
Because the pace of the dollar’s depreciation during the intermeeting period hasbeen slower than we had projected, we have adjusted up the projected value ofthe dollar 1¾ percent in the fourth quarter. We project that the rate of dollardepreciation beyond the current quarter will be about the same as previouslyassumed, just over 1 percent per year. As in past Greenbooks, we continue to beconcerned about the willingness of investors to hold a large and growing stock ofU.S. external liabilities at current exchange rates for the indefinite future.
Along with U.S. share prices, foreign equities tumbled further early in theintermeeting period but most subsequently recovered, resulting in net gains from
International Developments I-29
3 to 7 percent on the major exchanges. Mildly encouraging quarterly earningsreports released by several large corporations helped trigger the turnaround. Theexception was Japan, where the Nikkei fell almost 8 percent on balance ascontinued government indecision over the nature and scope of banking reformand fiscal stimulus weighed on share prices. In concert with the recovery ofshare prices in Europe and North America, yields on long-term governmentbonds rose about 20 basis points in Europe and 40 basis points in Canada. Again, Japanese securities were the exception to the rule, with the yield on thebenchmark ten-year government bond falling 25 basis points.
The yield spread of emerging-market sovereign debt over U.S. Treasuriesnarrowed on balance over the intermeeting period, with Brazilian and ArgentineEMBI+ yield spreads declining 400 and 625 basis points, respectively, whileshowing considerable day-to-day volatility. Share prices in Brazil andArgentina gained about 3 and 16 percent, respectively. The upbeat tone in LatinAmerican financial markets may, in part, be due to the fact that the winner ofBrazil’s presidential election was perceived to have moderated his stance on anumber of fiscal and financial market concerns.
. TheDesk did not intervene during the period for the accounts of the System or theTreasury.
Foreign Industrial CountriesIn response to recent data, forecasts for growth in the major foreign industrialcountries have been marked down in the near term. Declining businessconfidence and volatility in financial markets have contributed to a slowing ingrowth from above 3 percent in the first half of 2002 to just under 2 percent inthe second half. The weakness in the global recovery has led us to push backprojected monetary policy tightening in several countries and to project aneasing in euro-area interest rates by early next year. GDP growth is projected toedge up over the forecast period as monetary policy remains stimulative, theU.S. recovery strengthens, and the effects of previous financial volatilitydissipate, with growth near 2½ percent in both 2003 and 2004.
Headline inflation rates in the foreign industrial countries have ticked up sinceearlier in the year, reflecting the pass-through of higher energy prices. By earlynext year, however, twelve-month inflation rates should begin to decline asprice pressures are attenuated by declining oil prices, continuing excess capacityin most countries, and the past and projected further appreciation of many majorforeign currencies against the dollar.
In Japan, a lack of detail about government plans to reform the troubled bankingsector and about the accompanying package of social safety net measures has
I-30 Part 1: Summary and Outlook, October 30, 2002
added considerable uncertainty to our projection for economic growth. Weassume only a slight step-up in the pace of bank reform, and against thebackground of weak incoming data we forecast growth below 1 percent in 2003as consumption growth slows and unemployment rises in response to someamount of actual or anticipated corporate restructuring. Projected growth risesslightly in 2004. Japan’s output gap is expected to widen, and deflation isexpected to continue throughout the forecast period.
Euro-area growth is projected to remain anemic through the middle of 2003before picking up to a bit above 2½ percent in the second half of 2003 and in2004. Weakening business confidence going into the fourth quarter suggeststhat businesses will remain hesitant to increase capital spending and hiring in thenear term. Despite the recent debate over a more flexible implementation of theStability and Growth Pact, fiscal policy is likely to turn contractionary inGermany as the government attempts to bring its deficit back below the3 percent deficit limit. Consumption spending was depressed early this year,especially in Germany, by consumer perceptions that prices were pushed upsignificantly during the introduction of euro notes and coins. Consumptionspending has begun to recover but is likely to be restrained by sluggish labormarket conditions. With growth subdued, inflation is expected to fall below theECB’s 2 percent target ceiling early next year and to remain there throughoutthe forecast period.
In the United Kingdom, fourth-quarter growth is expected to be slower than inthe third quarter as the contribution from the change in inventories subsides andconsumption growth moderates. In 2003, growth is forecast to increase asinvestment turns up after two years of decline. A possible correction inbooming U.K. house prices remains a downside risk to the forecast. Inflation isexpected to remain at or near the Bank of England’s 2½ percent targetthroughout the forecast period, and the Bank is projected to begin tightening in2004.
After having exhibited brisk growth through the first part of the year, theCanadian economy is projected to slow in the fourth quarter, as bothconsumption and investment decelerate. Automobile sales and residentialconstruction are expected to retreat from the elevated levels reached earlier thisyear. Domestic demand, however, should receive continued support fromCanada’s robust labor market. Output growth is expected to move back up overthe course of 2003 and to reach 3 percent in 2004, in line with the U.S. recovery. The Bank of Canada has left its target for the overnight rate unchanged throughits last two policy meetings, most recently on October 16, following three movesup of 25 basis points each earlier in the year. The Bank of Canada is expectedto keep rates steady through the end of 2003 in reaction to the uncertain
International Developments I-31
environment for global growth before starting to tighten again in the second halfof 2004.
Other CountriesThere is little sign of any significant improvement in economic, financial, andpolitical conditions in South America. As expected, Lula was elected presidentof Brazil on October 27, winning a run-off against José Serra, the candidatepreferred by most market participants. Brazilian financial markets remainedvolatile over the intermeeting period, and uncertainty about future economicpolicies continues to be high. Accordingly, we continue to project a weakeconomy, with output declining in the second half of the year and rising slowlythereafter, but more severe outcomes are a distinct possibility. Prospects alsoremain dim elsewhere in South America. Although economic activity may havebottomed out in Argentina, major impediments to a sustained recovery remain. Political tensions in Venezuela have again intensified, and Moody’s hasdowngraded its sovereign debt.
Mexico is a relatively bright spot in Latin America, although recent indicatorssuggest that the pace of recovery slowed in the third quarter, as evidenced byonly modest increases in industrial production and exports. The Bank ofMexico tightened monetary policy in late September because inflation wasrunning about a percentage point above the government's target of 4-1/2 percentfor this year. The tighter monetary policy, together with deceleration in the U.S.economy, should restrain Mexican growth in the second half of this year toabout 3 percent. Growth is projected to pick up over the next two years, in linewith the pattern of U.S. growth. The outlook is somewhat weaker than that inthe September Greenbook, in light of downward revisions to U.S. growth and alower path for oil prices.
In most of emerging Asia, growth has continued at a robust pace, although thereare signs of some moderation in the third quarter. Industrial production andexports were strong in Korea in the third quarter, driven in part by gains in theauto sector. Export growth has generally weakened in the ASEAN countries, inpart reflecting softening demand for high-tech goods. In China, real GDPposted a gain of 7.5 percent in the third quarter, reflecting strength in bothexports and domestic demand. Hong Kong is lagging behind the rest ofemerging Asia with weak domestic demand, depressed asset markets, and a highunemployment rate. In Indonesia, the October bombing in Bali has heighteneduncertainty and clouded the country's outlook, raising concerns about thetourism industry and foreign investment. Reflecting this uncertainty, theoutlook for Indonesia has been revised down some. Indonesia's problems arelikely to be localized, however, and we have not built in any significantspillover to the rest of emerging Asia. Overall, we expect growth in Asia toslow to about 4¼ percent in the second half of this year, a bit below the
I-32 Part 1: Summary and Outlook, October 30, 2002
September Greenbook projection, before rising to a little over 5 percent nextyear and to 5½ percent in 2004. This projection continues to be driven largelyby the outlook for U.S. demand and the expected recovery in the global high-tech sector.
We expect average consumer price inflation in the developing countries of about3 percent over the forecast period, with inflation in Asia being significantlylower than in Latin America. The relatively low inflation rates in developingcountries reflect our projection that excess capacity will persist over the forecastperiod in the vast majority of the countries. However, in some countries, mostnotably Argentina and Venezuela, currency depreciations are expected to lead tohigh inflation rates over the forecast period.
Prices of Internationally Traded GoodsThe price index for U.S. imports of non-oil core goods is estimated to have risenabout 1¾ percent at an annual rate in the third quarter, the second consecutivequarterly increase following a year of decline. The turnaround in prices largelyreflects the behavior of prices of non-petroleum industrial supplies, which rosesharply in the spring and have edged up a bit further since, following a declineof nearly 20 percent between January 2001 and February 2002. In addition,prices of non-high-tech machinery rose about 2 percent at an annual rate in thethird quarter, and prices of automotive products and consumer goods postedsmall increases. The price of core goods imports is expected to increase atabout a 3¼ percent rate in the fourth quarter, reflecting the depreciation of thedollar since last spring and sharp increases in commodity prices. In 2003 and2004, the rate of core import price inflation is expected to drop back to around 2percent as commodity price increases are projected to moderate, in line withquotes on futures exchanges.
The price index for exports of U.S. core goods is estimated to have risen at anannual rate of about 4 percent in the third quarter, a bit faster than in the secondquarter. We project that export price inflation will slow to around 1 percentnext year and remain around that rate in 2004, in line with projected U.S.producer price inflation.
International Developments I-33
Selected Trade Prices(Percent change from end of previous period except as noted; s.a.a.r.)
Trade category2001
2002:H1
Projection
H1 H2 2002:H2 2003 2004
ExportsCore goods -0.6 -2.6 1.2 3.0
0.9 1.1
ImportsNon-oil core goods -1.3 -4.5 -0.1 2.5 2.3 1.9Oil (dollars per barrel) 24.21 18.39 24.04 25.84 21.53 20.11
NOTE. Prices for core exports and non-oil core imports, which exclude computersand semiconductors, are on a NIPA chain-weighted basis.
The price of imported oil for multi-quarter periods is the price for the final quarterof the period.
Trade in Goods and ServicesWe estimate that real exports of goods and services rose around 2½ percent atan annual rate in the third quarter, following a surge of 14 percent in the secondquarter. Exports of services were little changed in the third quarter followingsizable gains in the two preceding quarters; goods exports rose at about a3½ percent rate, with gains widespread across major categories. Exports ofgoods and services are expected to accelerate somewhat in the near term,averaging 5½ percent growth this quarter and next. Exports of core goodscontinue the cyclical rebound begun earlier this year in response to improvedactivity abroad. Over the remainder of the forecast period, their growth isprojected to average around 5 percent, boosted by a pickup in foreign growthand a small decline in the value of the dollar. Exports of services should resumetheir upward trend over the forecast period.
As with exports, real imports of goods and services are estimated to have risenaround 2½ percent at an annual rate in the third quarter following a surge in thesecond quarter. All of the increase was in imports of goods, as service importsfell for a second consecutive quarter following a very large increase in the firstquarter. The third-quarter rise in goods imports was concentrated in industrialsupplies and consumer goods and may partly incorporate an acceleration of
I-34 Part 1: Summary and Outlook, October 30, 2002
1. We have seen anecdotal reports that suggest that some large retailers such as Wal-Martdid bring stocks in early, although we do not have estimates of the amount. August trade datashow an increase in imported goods of about $1.5 billion (monthly rate). We have assumed forthe purposes of the forecast that about $500 million of the August increase was a result ofaccelerated imports. (West Coast ports account for about 20 percent of total goods imports, orabout $18 billion at a monthly rate.) Some acceleration of imports likely occurred in Septemberas well, but the ports were closed for three days at the end of the month, so we have assumed thatthese effects were roughly offsetting. Thus, the $500 million in monthly August importstranslates into about $2 billion at an annual rate in additional imports for the third quarter. Wehave assumed that imports are reduced by an equal amount in the fourth quarter.
Because the docks were closed for eight days in October and the backlog has not been fullycleared, we have assumed that monthly imports in October will be depressed by about$1.7 billion at a monthly rate, about 10 percent of the total amount of imports that pass throughthe affected ports. Although the ports were closed for about 25 percent of the month, somemake-up in imports is apparently occurring, despite reports of continued work slowdowns, as thebacklog of ships is reportedly dropping. We have assumed that the backlog will be cleared bythe end of November.
A similar but much smaller adjustment was made for exports, which are only about one-fifththe value of imports for West Coast ports.
shipments through West Coast ports as a work stoppage began to appear morelikely.1
Growth of merchandise imports is expected to pick up in the fourth quarter,reflecting both some increase in oil imports and some pickup in growth of high-tech imports, which slowed in the third quarter following rapid increases earlierin the year. Imported core goods are projected to grow about 5¼ percent in thefourth quarter and to expand on average nearly 6 percent over the remainder ofthe forecast period, as the effects of continued recovery in the U.S. economy andthe cyclical rebound from last year’s sharp fall in the level of imports are onlyslightly offset by the effect of past and projected dollar depreciation. Realimports of computers and semiconductors should also contribute significantly toimport growth over the next two years, and service imports are expected to pickup gradually.
The U.S. current account deficit as a share of nominal GDP is projected to risefrom 5 percent in the second quarter of this year to 5¼ percent by the fourthquarter and to 5½ percent by the end of 2004. Most of the increase in the deficitis in the balance on goods and services, although net investment income is alsoexpected to continue to decline in response to the growing net liability position.
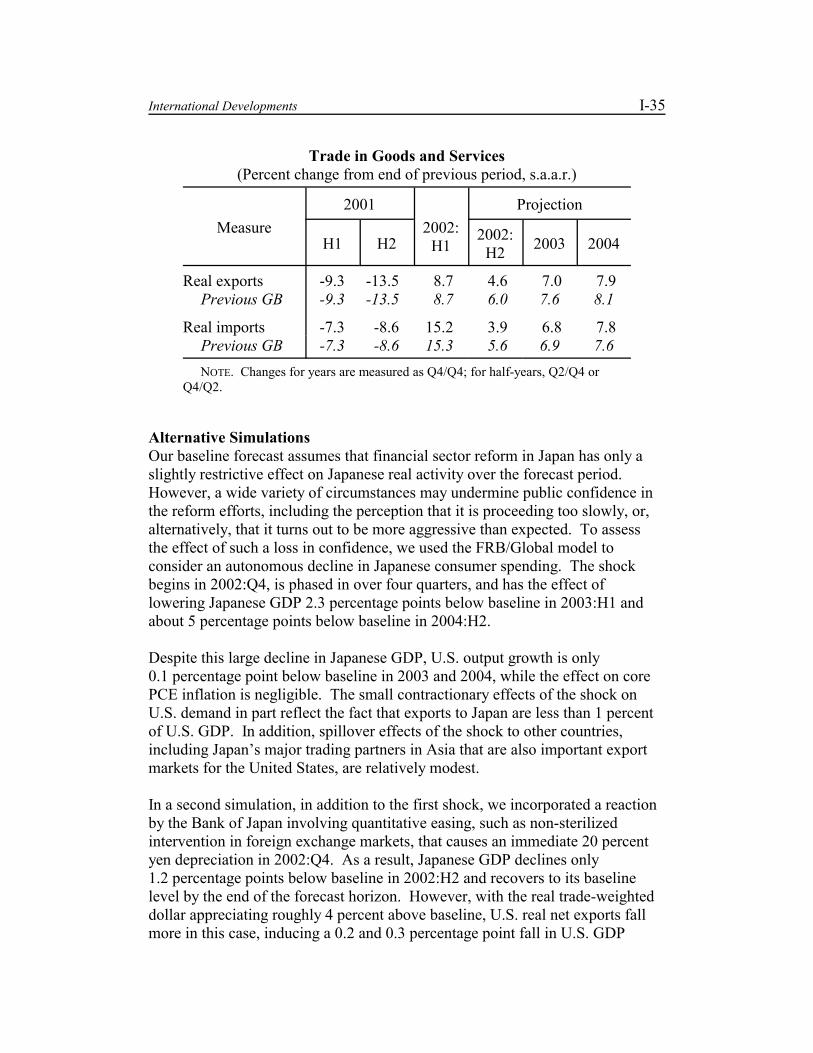
International Developments I-35
Trade in Goods and Services(Percent change from end of previous period, s.a.a.r.)
Measure2001
2002:H1
Projection
H1 H2 2002:H2 2003 2004
Real exports -9.3 -13.5 8.7 4.6 7.0 7.9Previous GB -9.3 -13.5 8.7 6.0 7.6 8.1
Real imports -7.3 -8.6 15.2 3.9 6.8 7.8Previous GB -7.3 -8.6 15.3 5.6 6.9 7.6NOTE. Changes for years are measured as Q4/Q4; for half-years, Q2/Q4 or
Q4/Q2.
Alternative SimulationsOur baseline forecast assumes that financial sector reform in Japan has only aslightly restrictive effect on Japanese real activity over the forecast period. However, a wide variety of circumstances may undermine public confidence inthe reform efforts, including the perception that it is proceeding too slowly, or,alternatively, that it turns out to be more aggressive than expected. To assessthe effect of such a loss in confidence, we used the FRB/Global model toconsider an autonomous decline in Japanese consumer spending. The shockbegins in 2002:Q4, is phased in over four quarters, and has the effect oflowering Japanese GDP 2.3 percentage points below baseline in 2003:H1 andabout 5 percentage points below baseline in 2004:H2.
Despite this large decline in Japanese GDP, U.S. output growth is only0.1 percentage point below baseline in 2003 and 2004, while the effect on corePCE inflation is negligible. The small contractionary effects of the shock onU.S. demand in part reflect the fact that exports to Japan are less than 1 percentof U.S. GDP. In addition, spillover effects of the shock to other countries,including Japan’s major trading partners in Asia that are also important exportmarkets for the United States, are relatively modest.
In a second simulation, in addition to the first shock, we incorporated a reactionby the Bank of Japan involving quantitative easing, such as non-sterilizedintervention in foreign exchange markets, that causes an immediate 20 percentyen depreciation in 2002:Q4. As a result, Japanese GDP declines only1.2 percentage points below baseline in 2002:H2 and recovers to its baselinelevel by the end of the forecast horizon. However, with the real trade-weighteddollar appreciating roughly 4 percent above baseline, U.S. real net exports fallmore in this case, inducing a 0.2 and 0.3 percentage point fall in U.S. GDP
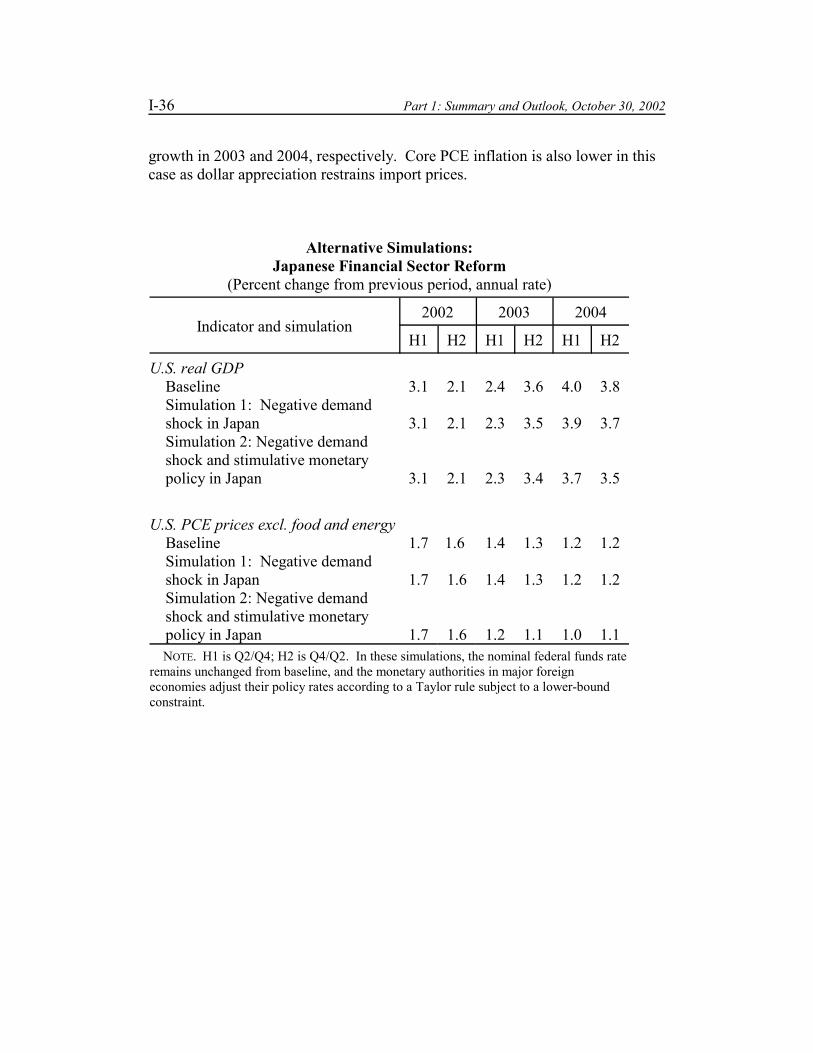
I-36 Part 1: Summary and Outlook, October 30, 2002
growth in 2003 and 2004, respectively. Core PCE inflation is also lower in thiscase as dollar appreciation restrains import prices.
Alternative Simulations:Japanese Financial Sector Reform
(Percent change from previous period, annual rate)
Indicator and simulation2002 2003 2004
H1 H2 H1 H2 H1 H2
U.S. real GDP Baseline 3.1 2.1 2.4 3.6 4.0 3.8 Simulation 1: Negative demand shock in Japan 3.1 2.1 2.3 3.5 3.9 3.7 Simulation 2: Negative demand shock and stimulative monetary policy in Japan 3.1 2.1 2.3 3.4 3.7 3.5
U.S. PCE prices excl. food and energy Baseline 1.7 1.6 1.4 1.3 1.2 1.2 Simulation 1: Negative demand shock in Japan 1.7 1.6 1.4 1.3 1.2 1.2 Simulation 2: Negative demand shock and stimulative monetary policy in Japan 1.7 1.6 1.2 1.1 1.0 1.1 NOTE. H1 is Q2/Q4; H2 is Q4/Q2. In these simulations, the nominal federal funds rateremains unchanged from baseline, and the monetary authorities in major foreigneconomies adjust their policy rates according to a Taylor rule subject to a lower-boundconstraint.
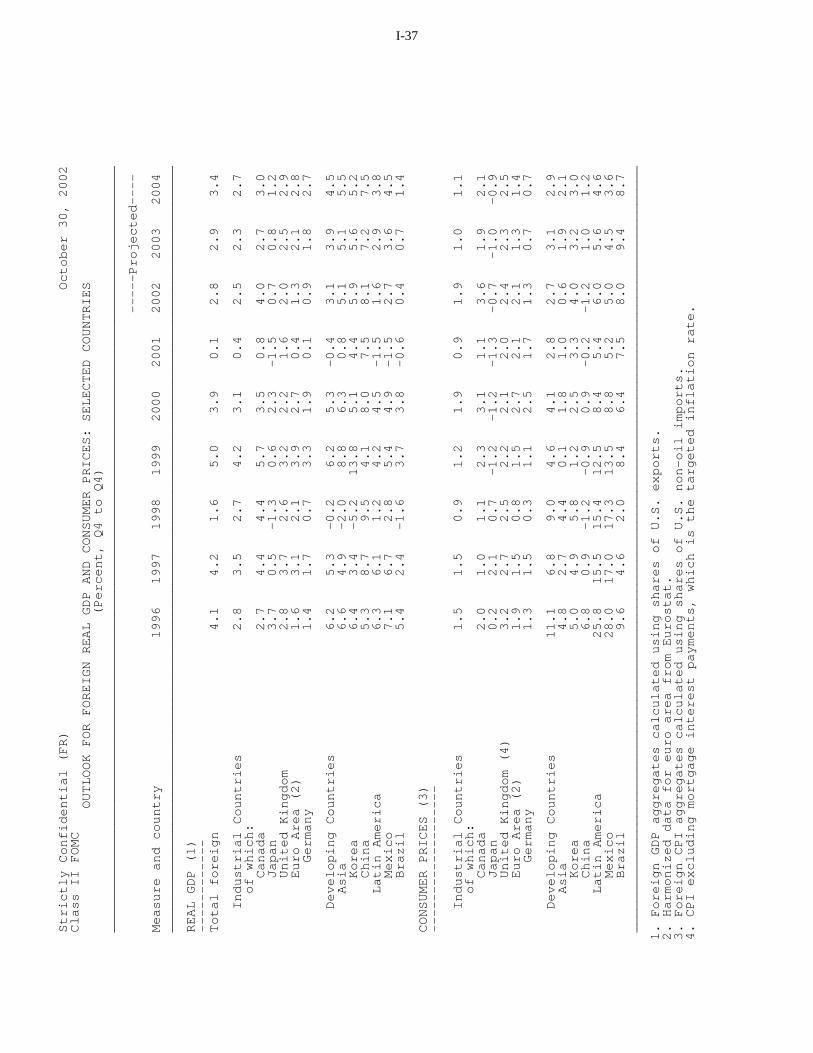
I-37
Strictly Confidential (FR) October 30, 2002
Class II FOMC
OUTLOOK FOR FOREIGN REAL GDP AND CONSUMER PRICES: SELECTED COUNTRIES
(Percent, Q4 to Q4)
___________________________________________________________________________________________________
-----Projected----
Measure and country 1996 1997 1998 1999 2000 2001 2002 2003 2004
___________________________________________________________________________________________________
REAL GDP (1)
------------
Total foreign 4.1 4.2 1.6 5.0 3.9 0.1 2.8 2.9 3.4
Industrial Countries 2.8 3.5 2.7 4.2 3.1 0.4 2.5 2.3 2.7
of which:
Canada 2.7 4.4 4.4 5.7 3.5 0.8 4.0 2.7 3.0
Japan 3.7 0.5 -1.3 0.6 2.3 -1.5 0.7 0.8 1.2
United Kingdom 2.8 3.7 2.6 3.2 2.2 1.6 2.0 2.5 2.9
Euro Area (2) 1.6 3.1 2.1 3.9 2.7 0.4 1.3 2.1 2.8
Germany 1.4 1.7 0.7 3.3 1.9 0.1 0.9 1.8 2.7
Developing Countries 6.2 5.3 -0.2 6.2 5.3 -0.4 3.1 3.9 4.5
Asia 6.6 4.9 -2.0 8.8 6.3 0.8 5.1 5.1 5.5
Korea 6.4 3.4 -5.2 13.8 5.1 4.4 5.9 5.6 5.2
China 5.3 8.7 9.5 4.1 8.0 7.5 8.1 7.2 7.5
Latin America 6.3 6.1 1.2 4.2 4.5 -1.5 1.6 2.9 3.8
Mexico 7.1 6.7 2.8 5.4 4.9 -1.5 2.7 3.6 4.5
Brazil 5.4 2.4 -1.6 3.7 3.8 -0.6 0.4 0.7 1.4
CONSUMER PRICES (3)
-------------------
Industrial Countries 1.5 1.5 0.9 1.2 1.9 0.9 1.9 1.0 1.1
of which:
Canada 2.0 1.0 1.1 2.3 3.1 1.1 3.6 1.9 2.1
Japan 0.2 2.1 0.7 -1.2 -1.2 -1.3 -0.7 -1.0 -0.9
United Kingdom (4) 3.2 2.7 2.5 2.2 2.1 2.0 2.4 2.3 2.5
Euro Area (2) 1.9 1.5 0.8 1.5 2.7 2.1 2.1 1.3 1.4
Germany 1.3 1.5 0.3 1.1 2.5 1.7 1.3 0.7 0.7
Developing Countries 11.1 6.8 9.0 4.6 4.1 2.8 2.7 3.1 2.9
Asia 4.8 2.7 4.4 0.1 1.8 1.0 0.6 1.9 2.1
Korea 5.0 4.9 5.8 1.2 2.5 3.3 4.0 3.2 3.0
China 6.8 0.9 -1.2 -0.9 0.9 -0.2 -1.2 1.0 1.2
Latin America 25.8 15.5 15.4 12.5 8.4 5.4 6.0 5.6 4.6
Mexico 28.0 17.0 17.3 13.5 8.8 5.2 5.0 4.5 3.6
Brazil 9.6 4.6 2.0 8.4 6.4 7.5 8.0 9.4 8.7
___________________________________________________________________________________________________
1. Foreign GDP aggregates calculated using shares of U.S. exports.
2. Harmonized data for euro area from Eurostat.
3. Foreign CPI aggregates calculated using shares of U.S. non-oil imports.
4. CPI excluding mortgage interest payments, which is the targeted inflation rate.
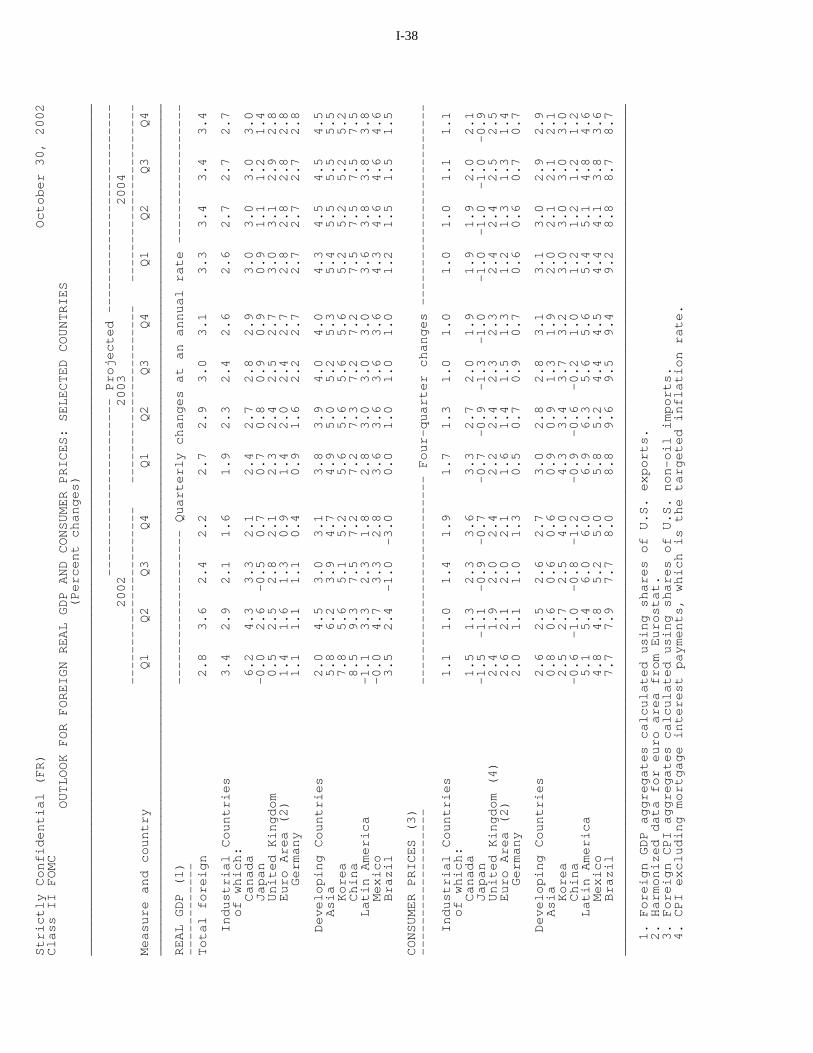
I-38 Strictly Confidential (FR) October 30, 2002
Class II FOMC
OUTLOOK FOR FOREIGN REAL GDP AND CONSUMER PRICES: SELECTED COUNTRIES
(Percent changes)
______________________________________________________________________________________________________________
----------------------- Projected ---------------------------
2002 2003 2004
----------------------- ----------------------- -----------------------
Measure and country Q1 Q2 Q3 Q4 Q1 Q2 Q3 Q4 Q1 Q2 Q3 Q4
______________________________________________________________________________________________________________
REAL GDP (1) -------------------- Quarterly changes at an annual rate ------------------
------------
Total foreign 2.8 3.6 2.4 2.2 2.7 2.9 3.0 3.1 3.3 3.4 3.4 3.4
Industrial Countries 3.4 2.9 2.1 1.6 1.9 2.3 2.4 2.6 2.6 2.7 2.7 2.7
of which:
Canada 6.2 4.3 3.3 2.1 2.4 2.7 2.8 2.9 3.0 3.0 3.0 3.0
Japan -0.0 2.6 -0.5 0.7 0.7 0.8 0.9 0.9 0.9 1.1 1.2 1.4
United Kingdom 0.5 2.5 2.8 2.1 2.3 2.4 2.5 2.7 3.0 3.1 2.9 2.8
Euro Area (2) 1.4 1.6 1.3 0.9 1.4 2.0 2.4 2.7 2.8 2.8 2.8 2.8
Germany 1.1 1.1 1.1 0.4 0.9 1.6 2.2 2.7 2.7 2.7 2.7 2.8
Developing Countries 2.0 4.5 3.0 3.1 3.8 3.9 4.0 4.0 4.3 4.5 4.5 4.5
Asia 5.8 6.2 3.9 4.7 4.9 5.0 5.2 5.3 5.4 5.5 5.5 5.5
Korea 7.8 5.6 5.1 5.2 5.6 5.6 5.6 5.6 5.2 5.2 5.2 5.2
China 8.5 9.3 7.5 7.2 7.2 7.3 7.2 7.2 7.5 7.5 7.5 7.5
Latin America -1.1 3.3 2.3 1.8 2.8 3.0 3.0 3.0 3.6 3.8 3.8 3.8
Mexico -0.0 4.7 3.3 2.8 3.6 3.6 3.6 3.6 4.3 4.6 4.6 4.6
Brazil 3.5 2.4 -1.0 -3.0 0.0 1.0 1.0 1.0 1.2 1.5 1.5 1.5
CONSUMER PRICES (3)
------------------- --------------------------- Four-quarter changes --------------------------
Industrial Countries 1.1 1.0 1.4 1.9 1.7 1.3 1.0 1.0 1.0 1.0 1.1 1.1
of which:
Canada 1.5 1.3 2.3 3.6 3.3 2.7 2.0 1.9 1.9 1.9 2.0 2.1
Japan -1.5 -1.1 -0.9 -0.7 -0.7 -0.9 -1.3 -1.0 -1.0 -1.0 -1.0 -0.9
United Kingdom (4) 2.4 1.9 2.0 2.4 2.2 2.4 2.3 2.3 2.4 2.4 2.5 2.5
Euro Area (2) 2.6 2.1 2.0 2.1 1.6 1.4 1.5 1.3 1.2 1.3 1.3 1.4
Germany 2.0 1.1 1.0 1.3 0.5 0.7 0.9 0.7 0.6 0.6 0.7 0.7
Developing Countries 2.6 2.5 2.6 2.7 3.0 2.8 2.8 3.1 3.1 3.0 2.9 2.9
Asia 0.8 0.6 0.6 0.6 0.9 0.9 1.3 1.9 2.0 2.1 2.1 2.1
Korea 2.5 2.7 2.5 4.0 4.3 3.4 3.7 3.2 3.0 3.0 3.0 3.0
China -0.6 -1.0 -0.8 -1.2 -0.9 -0.6 -0.2 1.0 1.2 1.2 1.2 1.2
Latin America 5.1 5.4 6.0 6.0 6.9 6.3 5.6 5.6 5.4 5.1 4.8 4.6
Mexico 4.8 4.8 5.2 5.0 5.8 5.2 4.4 4.5 4.4 4.1 3.8 3.6
Brazil 7.7 7.9 7.7 8.0 8.8 9.6 9.5 9.4 9.2 8.8 8.7 8.7
______________________________________________________________________________________________________________
1. Foreign GDP aggregates calculated using shares of U.S. exports.
2. Harmonized data for euro area from Eurostat.
3. Foreign CPI aggregates calculated using shares of U.S. non-oil imports.
4. CPI excluding mortgage interest payments, which is the targeted inflation rate.
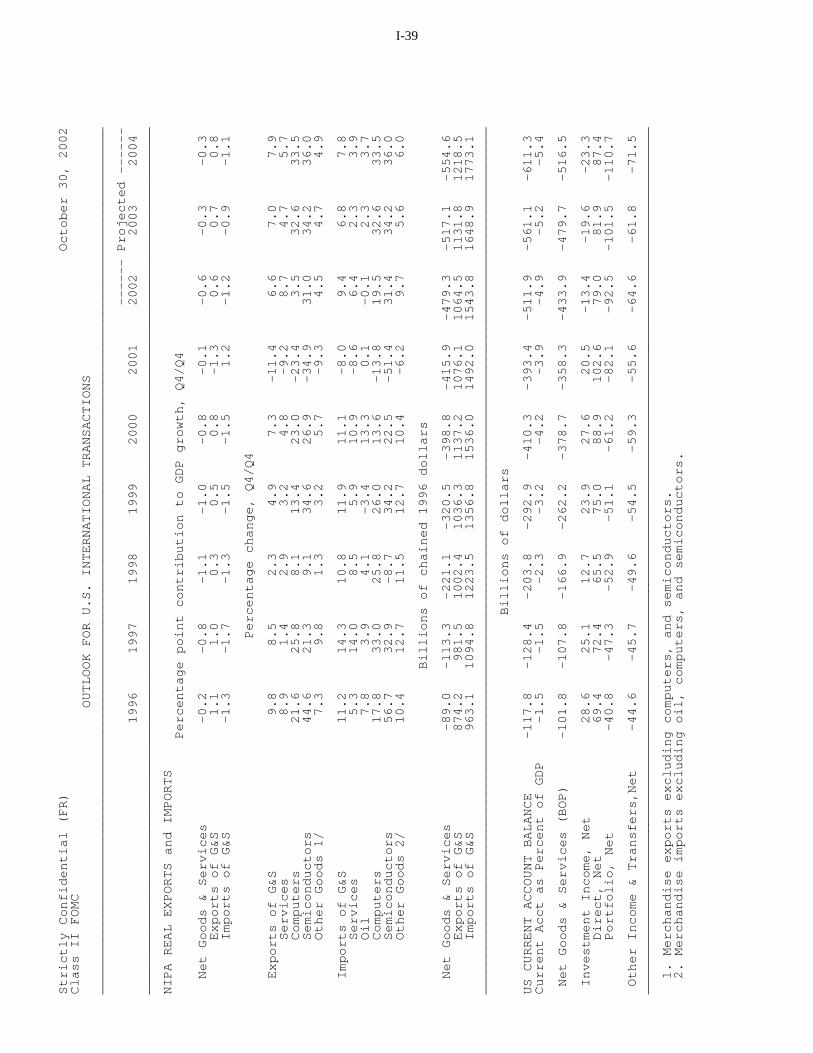
I-39
Strictly Confidential (FR) October 30, 2002
Class II FOMC
OUTLOOK FOR U.S. INTERNATIONAL TRANSACTIONS
________________________________________________________________________________________________________________
------ Projected ------
1996 1997 1998 1999 2000 2001 2002 2003 2004
________________________________________________________________________________________________________________
NIPA REAL EXPORTS and IMPORTS
Percentage point contribution to GDP growth, Q4/Q4
Net Goods & Services -0.2 -0.8 -1.1 -1.0 -0.8 -0.1 -0.6 -0.3 -0.3
Exports of G&S 1.1 1.0 0.3 0.5 0.8 -1.3 0.6 0.7 0.8
Imports of G&S -1.3 -1.7 -1.3 -1.5 -1.5 1.2 -1.2 -0.9 -1.1
Percentage change, Q4/Q4
Exports of G&S 9.8 8.5 2.3 4.9 7.3 -11.4 6.6 7.0 7.9
Services 8.9 1.4 2.9 3.2 4.8 -9.2 8.7 4.7 5.7
Computers 21.6 25.8 8.1 13.4 23.0 -23.4 3.5 32.6 33.5
Semiconductors 44.6 21.3 9.1 34.6 26.9 -34.9 31.0 34.2 36.0
Other Goods 1/ 7.3 9.8 1.3 3.2 5.7 -9.3 4.5 4.7 4.9
Imports of G&S 11.2 14.3 10.8 11.9 11.1 -8.0 9.4 6.8 7.8
Services 5.3 14.0 8.5 5.9 10.9 -8.6 6.4 2.3 3.9
Oil 7.8 3.9 4.1 -3.4 13.3 0.1 -0.1 2.3 3.7
Computers 17.8 33.0 25.8 26.0 13.6 -13.8 19.5 32.6 33.5
Semiconductors 56.7 32.9 -8.7 34.2 22.5 -51.4 31.4 34.2 36.0
Other Goods 2/ 10.4 12.7 11.5 12.7 10.4 -6.2 9.7 5.6 6.0
Billions of chained 1996 dollars
Net Goods & Services -89.0 -113.3 -221.1 -320.5 -398.8 -415.9 -479.3 -517.1 -554.6
Exports of G&S 874.2 981.5 1002.4 1036.3 1137.2 1076.1 1064.5 1131.8 1218.5
Imports of G&S 963.1 1094.8 1223.5 1356.8 1536.0 1492.0 1543.8 1648.9 1773.1
________________________________________________________________________________________________________________
Billions of dollars
US CURRENT ACCOUNT BALANCE -117.8 -128.4 -203.8 -292.9 -410.3 -393.4 -511.9 -561.1 -611.3
Current Acct as Percent of GDP -1.5 -1.5 -2.3 -3.2 -4.2 -3.9 -4.9 -5.2 -5.4
Net Goods & Services (BOP) -101.8 -107.8 -166.9 -262.2 -378.7 -358.3 -433.9 -479.7 -516.5
Investment Income, Net 28.6 25.1 12.7 23.9 27.6 20.5 -13.4 -19.6 -23.3
Direct, Net 69.4 72.4 65.5 75.0 88.9 102.6 79.0 81.9 87.4
Portfolio, Net -40.8 -47.3 -52.9 -51.1 -61.2 -82.1 -92.5 -101.5 -110.7
Other Income & Transfers,Net -44.6 -45.7 -49.6 -54.5 -59.3 -55.6 -64.6 -61.8 -71.5
________________________________________________________________________________________________________________
1. Merchandise exports excluding computers, and semiconductors.
2. Merchandise imports excluding oil, computers, and semiconductors.
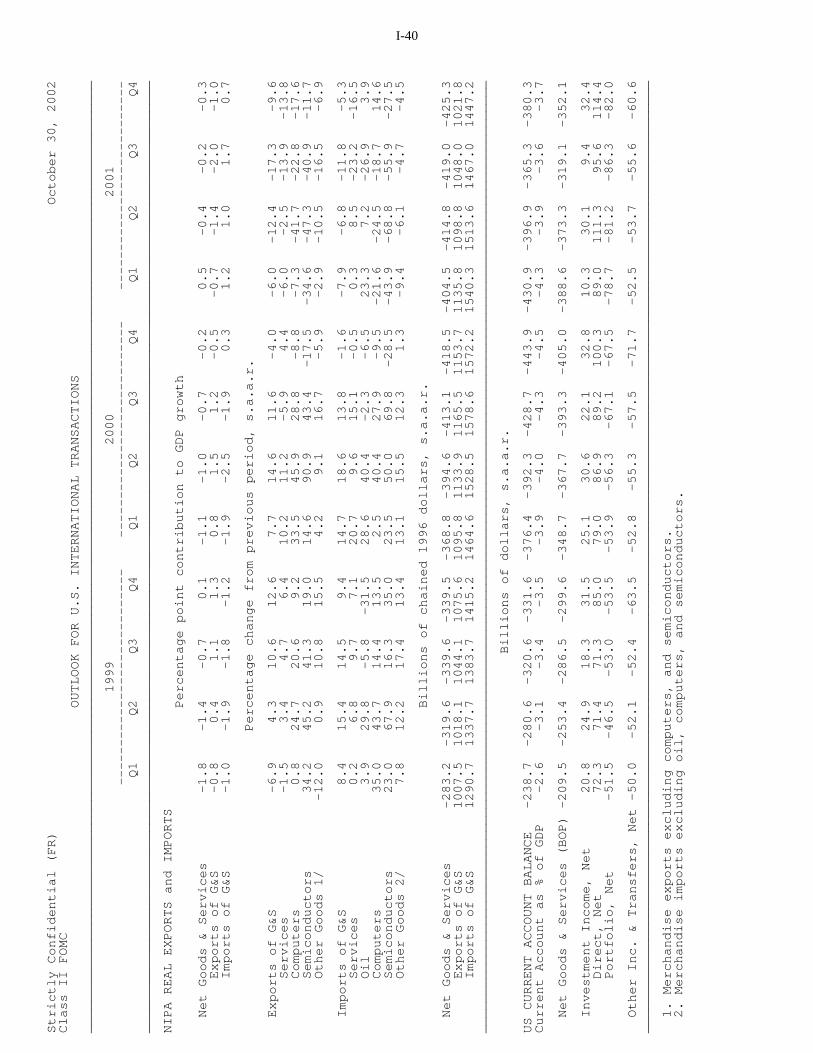
I-40Strictly Confidential (FR) October 30, 2002
Class II FOMC
OUTLOOK FOR U.S. INTERNATIONAL TRANSACTIONS
___________________________________________________________________________________________________________________________
1999 2000 2001
---------------------------- ---------------------------- ---------------------------
Q1 Q2 Q3 Q4 Q1 Q2 Q3 Q4 Q1 Q2 Q3 Q4
___________________________________________________________________________________________________________________________
NIPA REAL EXPORTS and IMPORTS
Percentage point contribution to GDP growth
Net Goods & Services -1.8 -1.4 -0.7 0.1 -1.1 -1.0 -0.7 -0.2 0.5 -0.4 -0.2 -0.3
Exports of G&S -0.8 0.4 1.1 1.3 0.8 1.5 1.2 -0.5 -0.7 -1.4 -2.0 -1.0
Imports of G&S -1.0 -1.9 -1.8 -1.2 -1.9 -2.5 -1.9 0.3 1.2 1.0 1.7 0.7
Percentage change from previous period, s.a.a.r.
Exports of G&S -6.9 4.3 10.6 12.6 7.7 14.6 11.6 -4.0 -6.0 -12.4 -17.3 -9.6
Services -1.5 3.4 4.7 6.4 10.2 11.2 -5.9 4.4 -6.0 -2.5 -13.9 -13.8
Computers 0.8 24.7 20.6 9.2 33.5 45.9 28.8 -8.8 -7.3 -41.7 -22.8 -17.6
Semiconductors 34.2 45.2 41.3 19.0 14.6 90.9 43.4 -17.5 -34.6 -47.3 -40.9 -11.7
Other Goods 1/ -12.0 0.9 10.8 15.5 4.2 9.1 16.7 -5.9 -2.9 -10.5 -16.5 -6.9
Imports of G&S 8.4 15.4 14.5 9.4 14.7 18.6 13.8 -1.6 -7.9 -6.8 -11.8 -5.3
Services 0.2 6.8 9.7 7.1 20.7 9.6 15.1 -0.5 0.3 8.5 -23.2 -16.5
Oil 3.9 29.8 -5.8 -31.5 28.6 40.4 -2.3 -6.5 23.3 7.2 -26.9 3.9
Computers 35.0 43.7 14.4 13.5 2.5 40.4 27.9 -9.5 -21.6 -24.5 -18.7 14.6
Semiconductors 23.0 67.9 16.3 35.0 23.5 50.0 69.8 -28.5 -43.9 -68.8 -55.9 -27.5
Other Goods 2/ 7.8 12.2 17.4 13.4 13.1 15.5 12.3 1.3 -9.4 -6.1 -4.7 -4.5
Billions of chained 1996 dollars, s.a.a.r.
Net Goods & Services -283.2 -319.6 -339.6 -339.5 -368.8 -394.6 -413.1 -418.5 -404.5 -414.8 -419.0 -425.3
Exports of G&S 1007.5 1018.1 1044.1 1075.6 1095.8 1133.9 1165.5 1153.7 1135.8 1098.8 1048.0 1021.8
Imports of G&S 1290.7 1337.7 1383.7 1415.2 1464.6 1528.5 1578.6 1572.2 1540.3 1513.6 1467.0 1447.2
___________________________________________________________________________________________________________________________
Billions of dollars, s.a.a.r.
US CURRENT ACCOUNT BALANCE -238.7 -280.6 -320.6 -331.6 -376.4 -392.3 -428.7 -443.9 -430.9 -396.9 -365.3 -380.3
Current Account as % of GDP -2.6 -3.1 -3.4 -3.5 -3.9 -4.0 -4.3 -4.5 -4.3 -3.9 -3.6 -3.7
Net Goods & Services (BOP) -209.5 -253.4 -286.5 -299.6 -348.7 -367.7 -393.3 -405.0 -388.6 -373.3 -319.1 -352.1
Investment Income, Net 20.8 24.9 18.3 31.5 25.1 30.6 22.1 32.8 10.3 30.1 9.4 32.4
Direct, Net 72.3 71.4 71.3 85.0 79.0 86.9 89.2 100.3 89.0 111.3 95.6 114.4
Portfolio, Net -51.5 -46.5 -53.0 -53.5 -53.9 -56.3 -67.1 -67.5 -78.7 -81.2 -86.3 -82.0
Other Inc. & Transfers, Net -50.0 -52.1 -52.4 -63.5 -52.8 -55.3 -57.5 -71.7 -52.5 -53.7 -55.6 -60.6
___________________________________________________________________________________________________________________________
1. Merchandise exports excluding computers, and semiconductors.
2. Merchandise imports excluding oil, computers, and semiconductors.
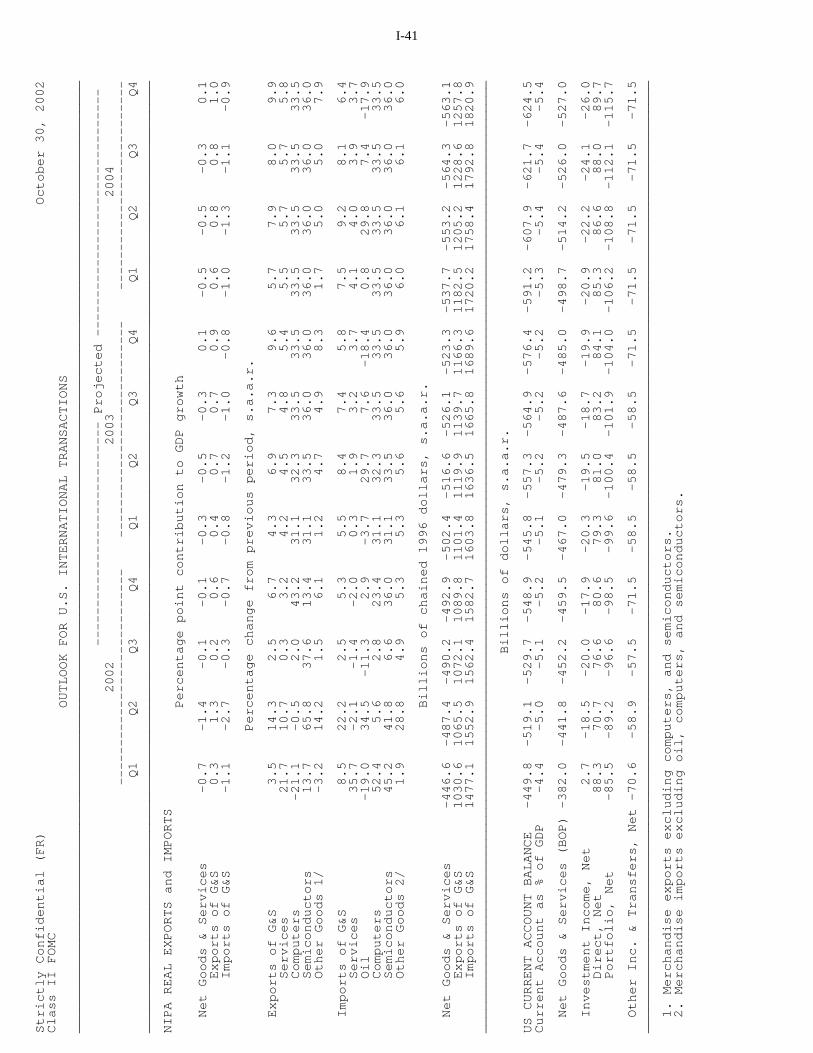
I-41Strictly Confidential (FR) October 30, 2002
Class II FOMC
OUTLOOK FOR U.S. INTERNATIONAL TRANSACTIONS
___________________________________________________________________________________________________________________________
----------------------------- Projected --------------------------------
2002 2003 2004
---------------------------- ---------------------------- ---------------------------
Q1 Q2 Q3 Q4 Q1 Q2 Q3 Q4 Q1 Q2 Q3 Q4
___________________________________________________________________________________________________________________________
NIPA REAL EXPORTS and IMPORTS
Percentage point contribution to GDP growth
Net Goods & Services -0.7 -1.4 -0.1 -0.1 -0.3 -0.5 -0.3 0.1 -0.5 -0.5 -0.3 0.1
Exports of G&S 0.3 1.3 0.2 0.6 0.4 0.7 0.7 0.9 0.6 0.8 0.8 1.0
Imports of G&S -1.1 -2.7 -0.3 -0.7 -0.8 -1.2 -1.0 -0.8 -1.0 -1.3 -1.1 -0.9
Percentage change from previous period, s.a.a.r.
Exports of G&S 3.5 14.3 2.5 6.7 4.3 6.9 7.3 9.6 5.7 7.9 8.0 9.9
Services 21.7 10.7 0.3 3.2 4.2 4.5 4.8 5.4 5.5 5.7 5.7 5.8
Computers -21.1 -0.5 2.0 43.2 31.1 32.3 33.5 33.5 33.5 33.5 33.5 33.5
Semiconductors 13.7 65.8 37.6 13.4 31.1 33.5 36.0 36.0 36.0 36.0 36.0 36.0
Other Goods 1/ -3.2 14.2 1.5 6.1 1.2 4.7 4.9 8.3 1.7 5.0 5.0 7.9
Imports of G&S 8.5 22.2 2.5 5.3 5.5 8.4 7.4 5.8 7.5 9.2 8.1 6.4
Services 35.7 -2.1 -1.4 -2.0 0.3 1.9 3.2 3.7 4.1 4.0 3.9 3.7
Oil -19.0 34.5 -11.3 2.9 -3.7 29.7 7.6 -18.4 0.8 29.8 7.4 -17.9
Computers 52.4 5.6 2.8 23.4 31.1 32.3 33.5 33.5 33.5 33.5 33.5 33.5
Semiconductors 45.2 41.8 6.6 36.0 31.1 33.5 36.0 36.0 36.0 36.0 36.0 36.0
Other Goods 2/ 1.9 28.8 4.9 5.3 5.3 5.6 5.6 5.9 6.0 6.1 6.1 6.0
Billions of chained 1996 dollars, s.a.a.r.
Net Goods & Services -446.6 -487.4 -490.2 -492.9 -502.4 -516.6 -526.1 -523.3 -537.7 -553.2 -564.3 -563.1
Exports of G&S 1030.6 1065.5 1072.1 1089.8 1101.4 1119.9 1139.7 1166.3 1182.5 1205.2 1228.6 1257.8
Imports of G&S 1477.1 1552.9 1562.4 1582.7 1603.8 1636.5 1665.8 1689.6 1720.2 1758.4 1792.8 1820.9
___________________________________________________________________________________________________________________________
Billions of dollars, s.a.a.r.
US CURRENT ACCOUNT BALANCE -449.8 -519.1 -529.7 -548.9 -545.8 -557.3 -564.9 -576.4 -591.2 -607.9 -621.7 -624.5
Current Account as % of GDP -4.4 -5.0 -5.1 -5.2 -5.1 -5.2 -5.2 -5.2 -5.3 -5.4 -5.4 -5.4
Net Goods & Services (BOP) -382.0 -441.8 -452.2 -459.5 -467.0 -479.3 -487.6 -485.0 -498.7 -514.2 -526.0 -527.0
Investment Income, Net 2.7 -18.5 -20.0 -17.9 -20.3 -19.5 -18.7 -19.9 -20.9 -22.2 -24.1 -26.0
Direct, Net 88.3 70.7 76.6 80.6 79.3 81.0 83.2 84.1 85.3 86.6 88.0 89.7
Portfolio, Net -85.5 -89.2 -96.6 -98.5 -99.6 -100.4 -101.9 -104.0 -106.2 -108.8 -112.1 -115.7
Other Inc. & Transfers, Net -70.6 -58.9 -57.5 -71.5 -58.5 -58.5 -58.5 -71.5 -71.5 -71.5 -71.5 -71.5
___________________________________________________________________________________________________________________________
1. Merchandise exports excluding computers, and semiconductors.
2. Merchandise imports excluding oil, computers, and semiconductors.