Embed Size (px)
Citation preview
Prefatory Note
The attached document represents the most complete and accurate version available based on original copies culled from the files of the FOMC Secretariat at the Board of Governors of the Federal Reserve System. This electronic document was created through a comprehensive digitization process which included identifying the best-preserved paper copies, scanning those copies,1 and then making the scanned versions text-searchable.2 Though a stringent quality assurance process was employed, some imperfections may remain.
Please note that this document may contain occasional gaps in the text. These gaps are the result of a redaction process that removed information obtained on a confidential basis. All redacted passages are exempt from disclosure under applicable provisions of the Freedom of Information Act.
1 In some cases, original copies needed to be photocopied before being scanned into electronic format. All scanned images were deskewed (to remove the effects of printer- and scanner-introduced tilting) and lightly cleaned (to remove dark spots caused by staple holes, hole punches, and other blemishes caused after initial printing). 2 A two-step process was used. An advanced optimal character recognition computer program (OCR) first created electronic text from the document image. Where the OCR results were inconclusive, staff checked and corrected the text as necessary. Please note that the numbers and text in charts and tables were not reliably recognized by the OCR process and were not checked or corrected by staff.
Confidential (FR) Class III FOMC
May 12, 2000
CURRENT ECONOMICAND FINANCIAL CONDITIONS
Supplemental Notes
Prepared for the Federal Open Market Committeeby the staff of the Board of Governors of the Federal Reserve System
Contents
The Domestic Nonfinancial Economy .......................... 1Producer Prices .................................. . 1Consumer Sentiment .................... ............ 3Business Inventories ................................. 3
TablesRecent Changes in Producer Prices ........................ 2Michigan Survey of Consumer Attitudes ................... . 4Changes in Manufacturing and Trade Inventories ............. 5
ChartsInventory-Sales Ratios, by Major Sector .................... 6
U.S. International Transactions ............................. 7Prices of Internationally Traded Goods ..................... 7
TablesPrices of U.S. Imports and Exports ........................ 9
The Financial Economy ................................... 10
TablesSelected Financial Market Quotations .................... 10Commercial Bank Credit ............................ . 11
Supplemental Notes
The Domestic Nonfinancial Economy
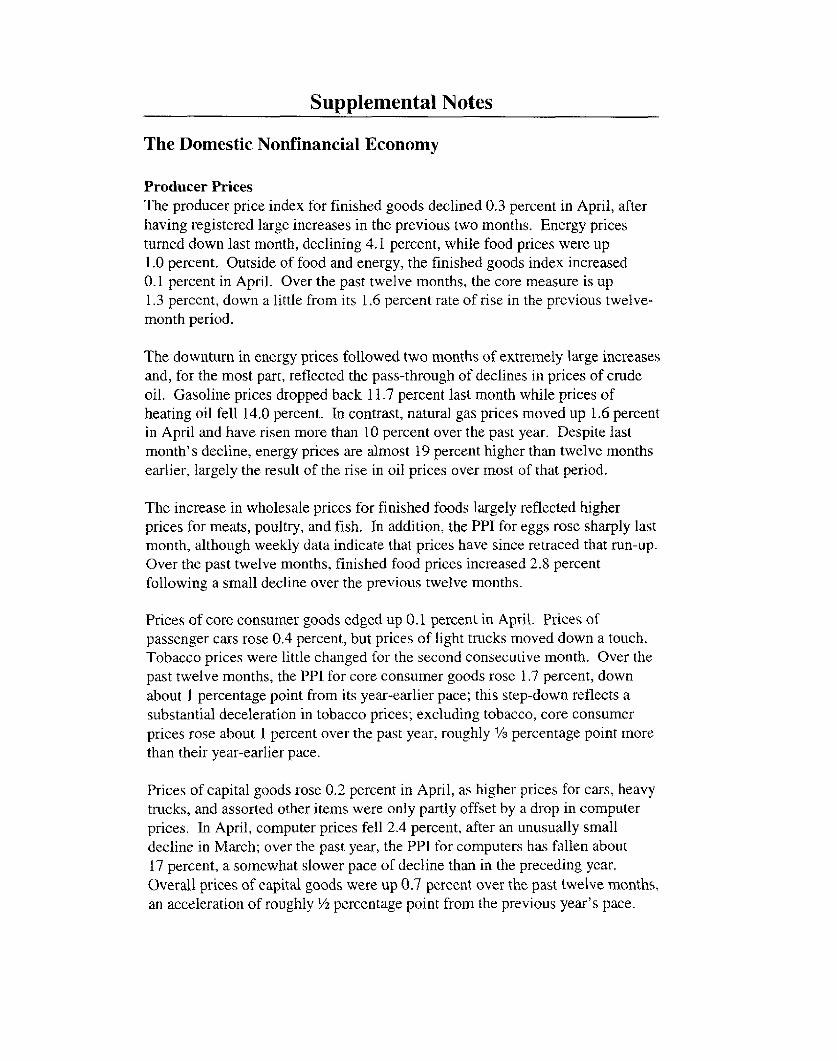
Producer PricesThe producer price index for finished goods declined 0.3 percent in April, afterhaving registered large increases in the previous two months. Energy pricesturned down last month, declining 4.1 percent, while food prices were up1.0 percent. Outside of food and energy, the finished goods index increased0.1 percent in April. Over the past twelve months, the core measure is up1.3 percent, down a little from its 1.6 percent rate of rise in the previous twelve-month period.
The downturn in energy prices followed two months of extremely large increasesand, for the most part, reflected the pass-through of declines in prices of crudeoil. Gasoline prices dropped back 11.7 percent last month while prices ofheating oil fell 14.0 percent. In contrast, natural gas prices moved up 1.6 percentin April and have risen more than 10 percent over the past year. Despite lastmonth's decline, energy prices are almost 19 percent higher than twelve monthsearlier, largely the result of the rise in oil prices over most of that period.
The increase in wholesale prices for finished foods largely reflected higherprices for meats, poultry, and fish. In addition, the PPI for eggs rose sharply lastmonth, although weekly data indicate that prices have since retraced that run-up.Over the past twelve months, finished food prices increased 2.8 percentfollowing a small decline over the previous twelve months.
Prices of core consumer goods edged up 0.1 percent in April. Prices ofpassenger cars rose 0.4 percent, but prices of light trucks moved down a touch.Tobacco prices were little changed for the second consecutive month. Over thepast twelve months, the PPI for core consumer goods rose 1.7 percent, downabout 1 percentage point from its year-earlier pace; this step-down reflects asubstantial deceleration in tobacco prices; excluding tobacco, core consumerprices rose about 1 percent over the past year, roughly 1/ percentage point morethan their year-earlier pace.
Prices of capital goods rose 0.2 percent in April, as higher prices for cars, heavytrucks, and assorted other items were only partly offset by a drop in computerprices. In April, computer prices fell 2.4 percent, after an unusually smalldecline in March; over the past year, the PPI for computers has fallen about17 percent, a somewhat slower pace of decline than in the preceding year.Overall prices of capital goods were up 0.7 percent over the past twelve months,an acceleration of roughly 1/2 percentage point from the previous year's pace.
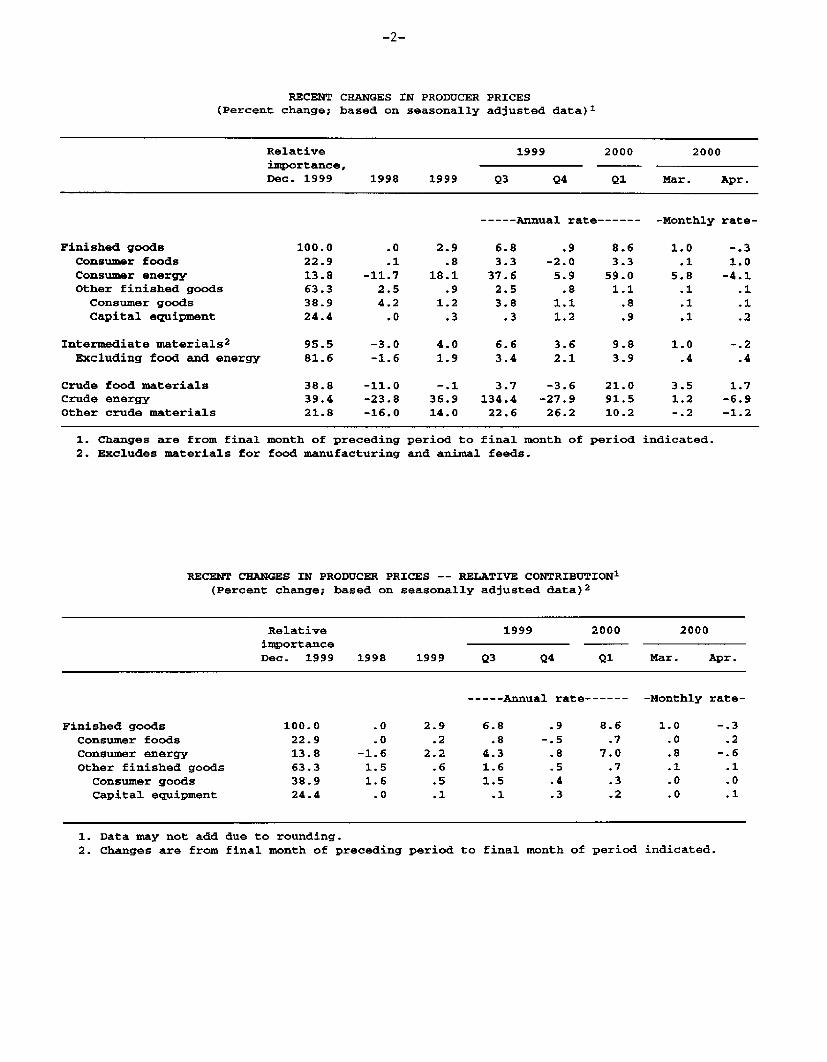
RECENT CHANGES IN PRODUCER PRICES(Percent change; based on seasonally adjusted data)1
Relative 1999 2000 2000importance,Dec. 1999 1998 1999 Q3 Q4 Q1 Mar. Apr.
-----Annual rate------ -Monthly rate-
Finished goods 100.0 .0 2.9 6.8 .9 8.6 1.0 -.3Consumer foods 22.9 .1 .8 3.3 -2.0 3.3 .1 1.0Consumer energy 13.8 -11.7 18.1 37.6 5.9 59.0 5.8 -4.1Other finished goods 63.3 2.5 .9 2.5 .8 1.1 .1 .1Consumer goods 38.9 4.2 1.2 3.8 1.1 .8 .1 .1Capital equipment 24.4 .0 .3 .3 1.2 .9 .1 .2
Intermediate materials2 95.5 -3.0 4.0 6.6 3.6 9.8 1.0 -.2
Excluding food and energy 81.6 -1.6 1.9 3.4 2.1 3.9 .4 .4
Crude food materials 38.8 -11.0 -.1 3.7 -3.6 21.0 3.5 1.7Crude energy 39.4 -23.8 36.9 134.4 -27.9 91.5 1.2 -6.9Other crude materials 21.8 -16.0 14.0 22.6 26.2 10.2 -.2 -1.2
1. Changes are from final month of preceding period to final month of period indicated.2. Excludes materials for food manufacturing and animal feeds.
RECENT CHANGES IN PRODUCER PRICES -- RELATIVE CONTRIBUTION 1
(Percent change; based on seasonally adjusted data) 2
Relative 1999 2000 2000
importance ---
Dec. 1999 1998 1999 Q3 Q4 Q1 Mar. Apr.
----- Annual rate------ -Monthly rate-
Finished goods 100.0 .0 2.9 6.8 .9 8.6 1.0 -.3
Consumer foods 22.9 .0 .2 .8 -.5 .7 .0 .2
Consumer energy 13.8 -1.6 2.2 4.3 .8 7.0 .8 -.6
Other finished goods 63.3 1.5 .6 1.6 .5 .7 .1 .1
Consumer goods 38.9 1.6 .5 1.5 .4 .3 .0 .0
Capital equipment 24.4 .0 .1 .1 .3 .2 .0 .1
1. Data may not add due to rounding.2. Changes are from final month of preceding period to final month of period indicated.
At earlier stages of processing, the PPI for intermediate goods excluding foodand energy rose 0.4 percent in April, continuing the steady string of increasesseen since early last year. These prices have risen 3.3 percent over the past year,up noticeably from the 1.5 percent decline in the year-earlier period. Prices ofcore crude goods declined 1.2 percent last month, following small declines in thepreceding two months; over the past year, however, these prices are up15.4 percent.
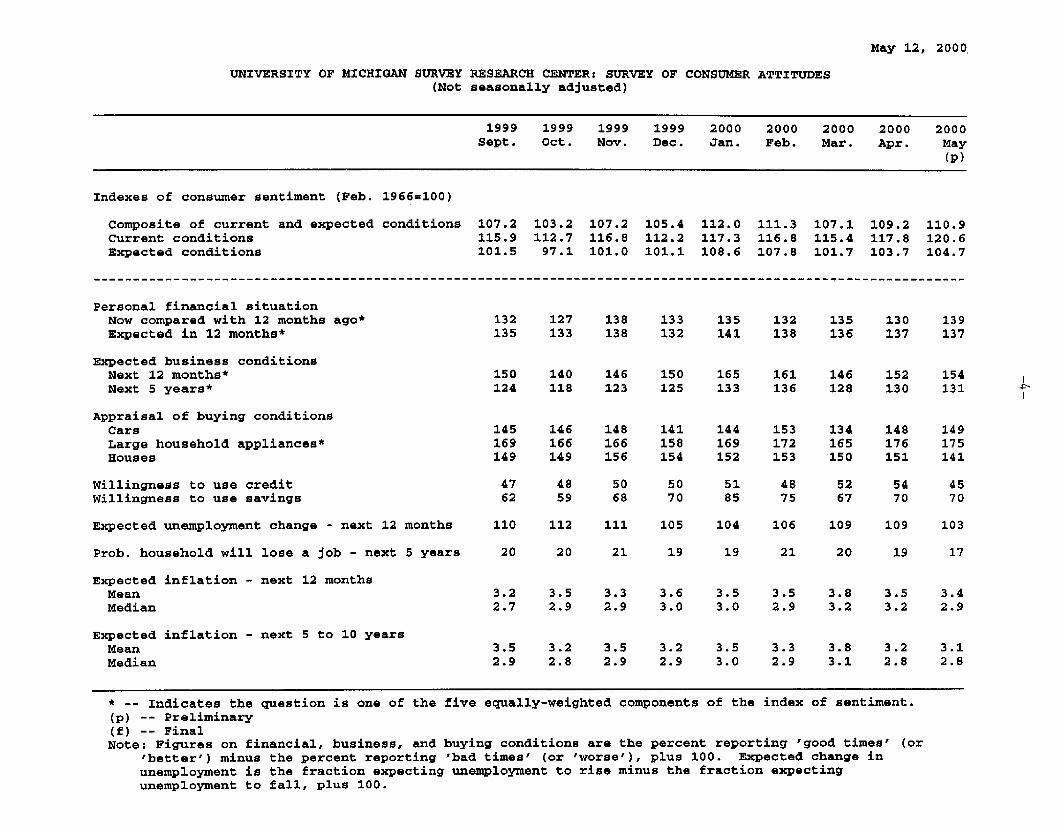
Consumer SentimentAccording to the preliminary results, the Michigan Survey Research Centerindex of consumer sentiment edged higher in early May. Respondents'assessments of their current personal financial situations were markedly moreupbeat this month while their views on their expected finances one year fromnow were unchanged. Expectations of future business conditions improved a bitin early May and have now moved higher for the past two months following asharp drop in March. Appraisals of buying conditions for large householdappliances ticked down this month but still remained at a very positive level.
Among those questions not in the overall measure, the index of expectedunemployment change dropped five points in early May, suggesting a noticeableimprovement in views on the labor market over the next year. Appraisals of carbuying conditions edged higher this month. However, assessments of buyingconditions for homes fell sharply to the lowest level since June 1995, reflectingless favorable views on interest rates and house prices. Indeed, the share ofrespondents that felt that now was not a good time to buy because mortgage rateswere too high was 15 percent in early May. Last May, only three percent ofrespondents felt that interest rates were too high.
Inflation expectations eased a bit in early May. The mean of expected inflationover the next twelve months edged down 0.1 percentage point to 3.4 percent,and the median dropped 1/4 percentage point to 2.9 percent. The mean ofexpected inflation over the next five to ten years also ticked down 0.1 percentagepoint this month to 3.1 percent while the median was unchanged at 2.8 percent.
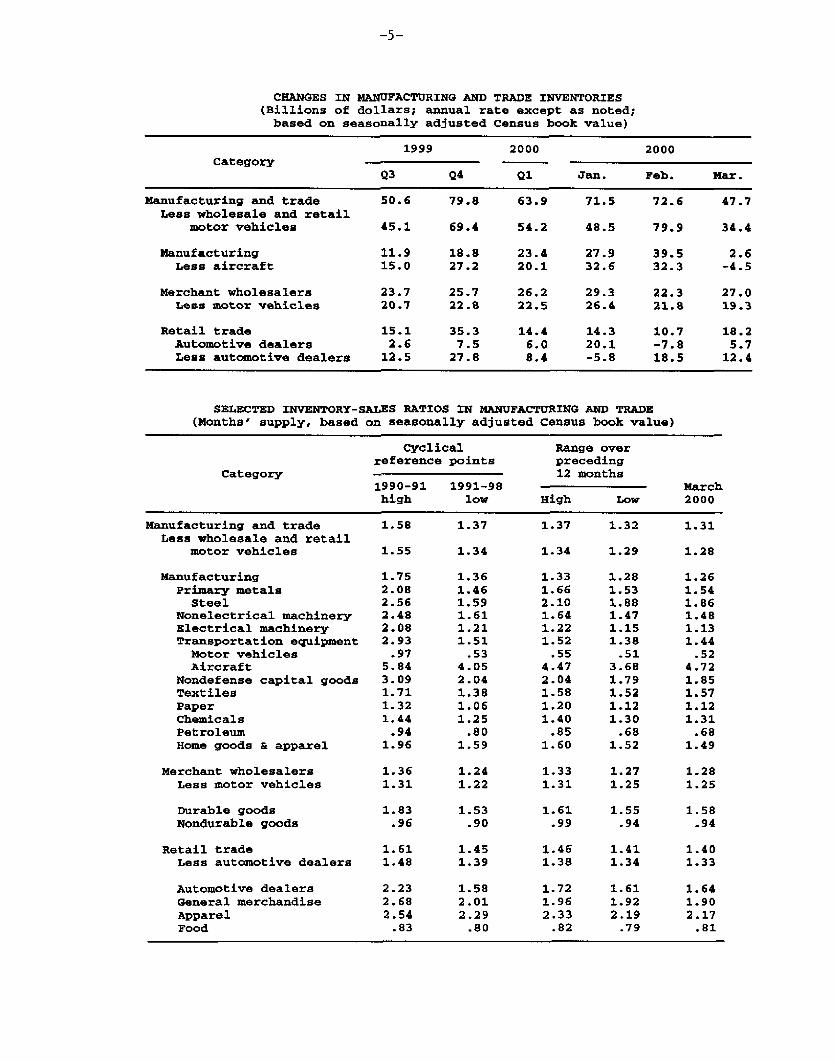
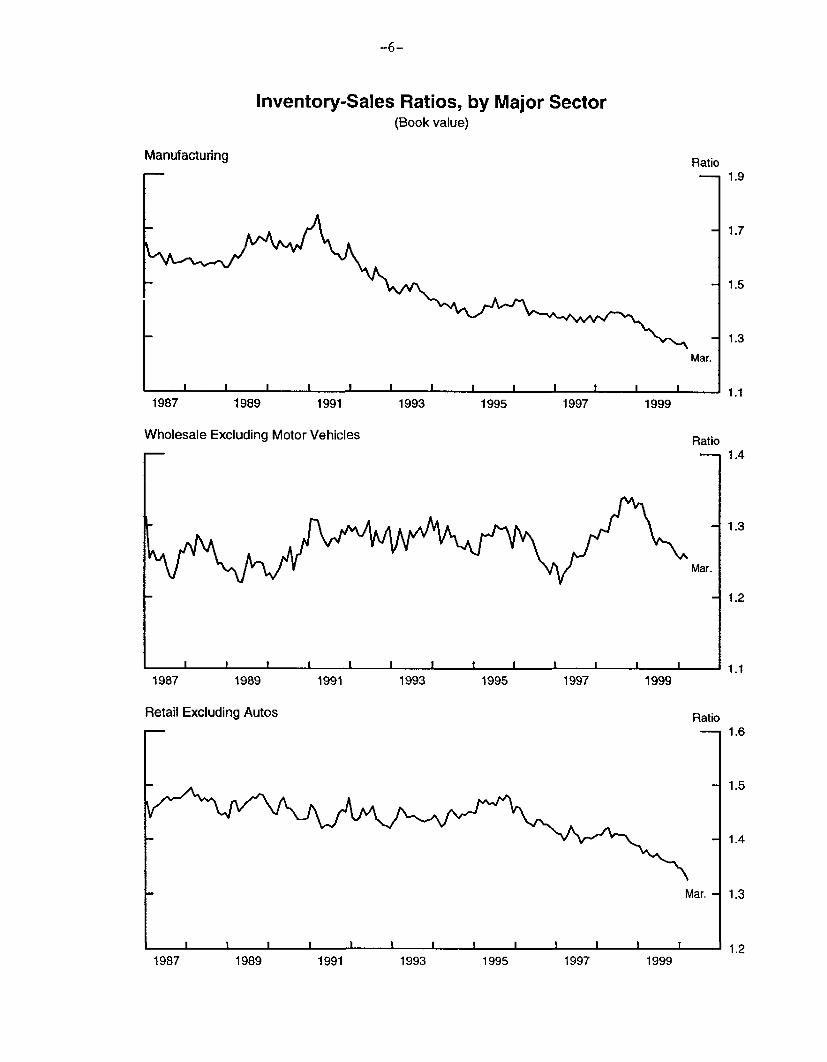
Business InventoriesThe book value of retail inventories rose at an annual rate of $18.2 billion inMarch; excluding motor vehicles, retail inventories increased at an annual rate of$12.4 billion. For the first quarter as a whole, non-auto retail inventoriesaccumulated at an $8.4 billion rate, down from a $27.8 billion pace in the fourthquarter of 1999. With sales increasing 1.2 percent in March, the inventory-salesratio at non-auto retailers edged down to 1.33 months. This ratio has declinedsubstantially since early last year and is now at a very lean level by historicalstandards.
May 12, 2000
UNIVERSITY OF MICHIGAN SURVEY RESEARCH CENTER: SURVEY OF CONSUMER ATTITUDES(Not seasonally adjusted)
1999 1999 1999 1999 2000 2000 2000 2000 2000Sept. Oct. Nov. Dec. Jan. Feb. Mar. Apr. May
(p)
Indexes of consumer sentiment (Feb. 1966=100)
Composite of current and expected conditions 107.2 103.2 107.2 105.4 112.0 111.3 107.1 109.2 110.9Current conditions 115.9 112.7 116.8 112.2 117.3 116.8 115.4 117.8 120.6Expected conditions 101.5 97.1 101.0 101.1 108.6 107.8 101.7 103.7 104.7
Personal financial situationNow compared with 12 months ago* 132 127 138 133 135 132 135 130 139Expected in 12 months* 135 133 138 132 141 138 136 137 137
Expected business conditionsNext 12 months* 150 140 146 150 165 161 146 152 154Next 5 years* 124 118 123 125 133 136 128 130 131
Appraisal of buying conditionsCars 145 146 148 141 144 153 134 148 149Large household appliances* 169 166 166 158 169 172 165 176 175Houses 149 149 156 154 152 153 150 151 141
Willingness to use credit 47 48 50 50 51 48 52 54 45Willingness to use savings 62 59 68 70 85 75 67 70 70
Expected unemployment change - next 12 months 110 112 111 105 104 106 109 109 103
Prob. household will lose a job - next 5 years 20 20 21 19 19 21 20 19 17
Expected inflation - next 12 monthsMean 3.2 3.5 3.3 3.6 3.5 3.5 3.8 3.5 3.4Median 2.7 2.9 2.9 3.0 3.0 2.9 3.2 3.2 2.9
Expected inflation - next 5 to 10 yearsMean 3.5 3.2 3.5 3.2 3.5 3.3 3.8 3.2 3.1Median 2.9 2.8 2.9 2.9 3.0 2.9 3.1 2.8 2.8
* -- Indicates the question is one of the five(p) -- Preliminary(f) -- Final
equally-weighted components of the index of sentiment.
Note: Figures on financial, business, and buying conditions are the percent reporting 'good times' (or'better') minus the percent reporting 'bad times' (or 'worse'), plus 100. Expected change inunemployment is the fraction expecting unemployment to rise minus the fraction expectingunemployment to fall, plus 100.
CHANGES IN MANUFACTURING AND TRADE INVENTORIES(Billions of dollars; annual rate except as noted;based on seasonally adjusted Census book value)
1999 2000 2000category
Q3 Q4 Q1 Jan. Feb. Mar.
Manufacturing and trade 50.6 79.8 63.9 71.5 72.6 47.7Less wholesale and retail
motor vehicles 45.1 69.4 54.2 48.5 79.9 34.4
Manufacturing 11.9 18.8 23.4 27.9 39.5 2.6Less aircraft 15.0 27.2 20.1 32.6 32.3 -4.5
Merchant wholesalers 23.7 25.7 26.2 29.3 22.3 27.0Less motor vehicles 20.7 22.8 22.5 26.4 21.8 19.3
Retail trade 15.1 35.3 14.4 14.3 10.7 18.2Automotive dealers 2.6 7.5 6.0 20.1 -7.8 5.7Less automotive dealers 12.5 27.8 8.4 -5.8 18.5 12.4
SELECTED INVENTORY-SALES RATIOS IN MANUFACTURING AND TRADE(Months' supply, based on seasonally adjusted Census book value)
Cyclical Range overreference points preceding
Category 12 months1990-91 1991-98 Marchhigh low High Low 2000
Manufacturing and trade 1.58 1.37 1.37 1.32 1.31Less wholesale and retail
motor vehicles 1.55 1.34 1.34 1.29 1.28
Manufacturing 1.75 1.36 1.33 1.28 1.26Primary metals 2.08 1.46 1.66 1.53 1.54
Steel 2.56 1.59 2.10 1.88 1.86Nonelectrical machinery 2.48 1.61 1.64 1.47 1.48Electrical machinery 2.08 1.21 1.22 1.15 1.13Transportation equipment 2.93 1.51 1.52 1.38 1.44Motor vehicles .97 .53 .55 .51 .52Aircraft 5.84 4.05 4.47 3.68 4.72
Nondefense capital goods 3.09 2.04 .0 .04 1.79 1.85Textiles 1.71 1.38 1.58 1.52 1.57Paper 1.32 1.06 1.20 1.12 1.12Chemicals 1.44 1.25 1.40 1.30 1.31Petroleum .94 .80 .85 .68 .68Home goods & apparel 1.96 1.59 1.60 1.52 1.49
Merchant wholesalers 1.36 1.24 1.33 1.27 1.28Less motor vehicles 1.31 1.22 1.31 1.25 1.25
Durable goods 1.83 1.53 1.61 1.55 1.58Nondurable goods .96 .90 .99 .94 .94
Retail trade 1.61 1.45 1.46 1.41 1.40Less automotive dealers 1.48 1.39 1.38 1.34 1.33
Automotive dealers 2.23 1.58 1.72 1.61 1.64General merchandise 2.68 2.01 1.96 1.92 1.90Apparel 2.54 2.29 2.33 2.19 2.17Food .83 .80 .82 .79 .81
Inventory-Sales Ratios, by Major Sector(Book value)
Manufacturing Ratio
Mar.
.I I I i I _I i I I I I I
1987 1989 1991
Wholesale Excluding Motor Vehicles
1993 1995 1997 1999
Ratio
1987 1989 1991 1993 1995 1997 1999
Retail Excluding Autos Ratio
Mar. -
-1 - 1I . 11. . I I I-i I - T
1991 1993 19951987 1989 1997 1999
The increase in non-auto retail stocks in March was concentrated at furnitureoutlets and in the other durables category, a grouping that includes stores sellingsporting goods, toys, and jewelry. Sales at furniture and other durables storeswere relatively weak in March compared with their recent trends, and inventory-sales ratios for both of these categories moved up. In contrast, stocks at generalmerchandisers fell sharply in March.
Total manufacturing and trade inventories excluding auto dealers rose at anannual rate of $34.4 billion in March, following a $79.9 billion increase inFebruary. With total non-vehicle shipments and sales up 1.4 percent in March,the inventory-sales ratio for this aggregate fell to 1.28 months. For the firstquarter as a whole, total book-value manufacturing and trade inventoriesexcluding motor vehicles increased at an annual rate of $54.2 billion. This isabout $7 billion less than BEA had assumed when preparing the advanceestimate of first-quarter GDP. A lower-than-expected rate of stockbuilding bymanufacturers accounts for this difference. Today's retail inventory figures werein line with what the BEA had assumed and with the staffs assumptions in theMay Greenbook.
U.S. International Transactions
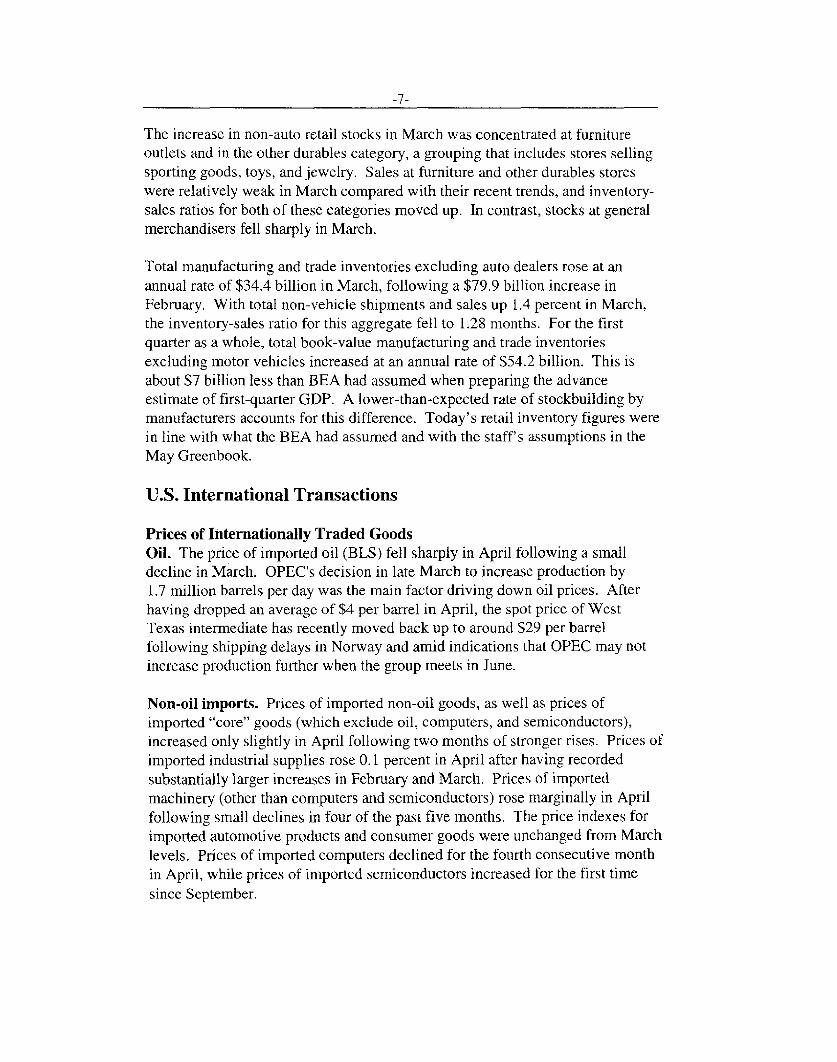
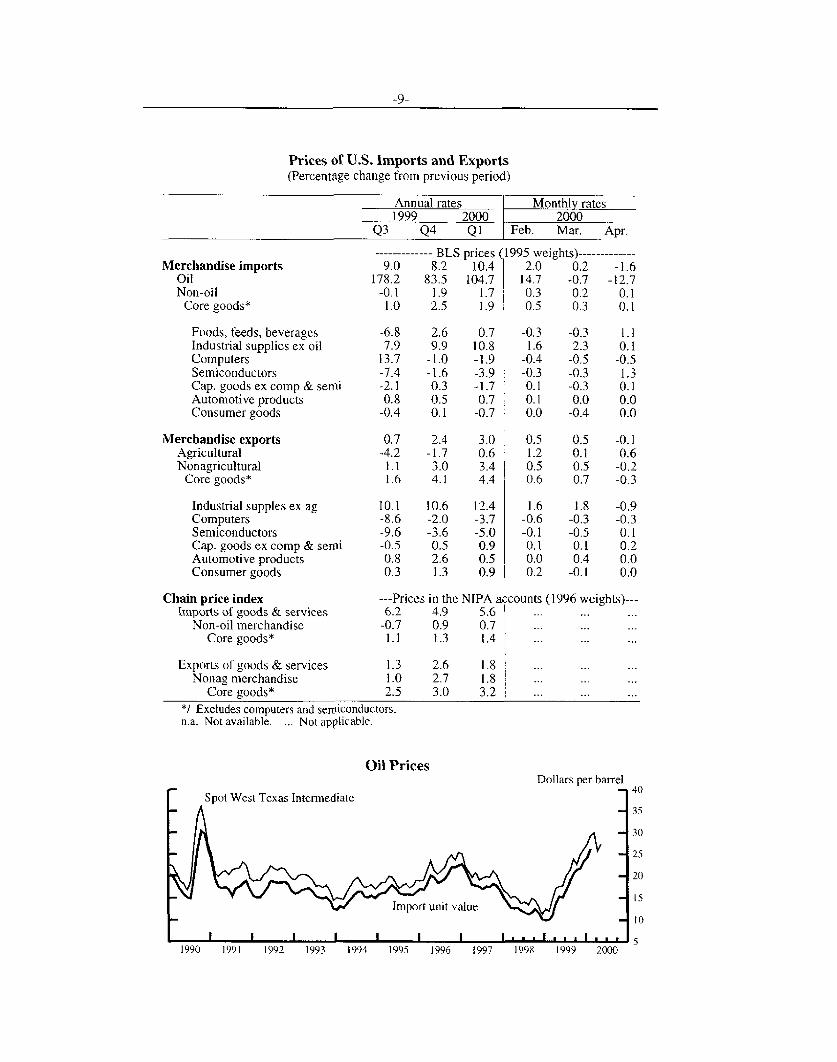
Prices of Internationally Traded GoodsOil. The price of imported oil (BLS) fell sharply in April following a smalldecline in March. OPEC's decision in late March to increase production by1.7 million barrels per day was the main factor driving down oil prices. Afterhaving dropped an average of $4 per barrel in April, the spot price of WestTexas intermediate has recently moved back up to around $29 per barrelfollowing shipping delays in Norway and amid indications that OPEC may notincrease production further when the group meets in June.
Non-oil imports. Prices of imported non-oil goods, as well as prices ofimported "core" goods (which exclude oil, computers, and semiconductors),increased only slightly in April following two months of stronger rises. Prices ofimported industrial supplies rose 0.1 percent in April after having recordedsubstantially larger increases in February and March. Prices of importedmachinery (other than computers and semiconductors) rose marginally in Aprilfollowing small declines in four of the past five months. The price indexes forimported automotive products and consumer goods were unchanged from Marchlevels. Prices of imported computers declined for the fourth consecutive monthin April, while prices of imported semiconductors increased for the first timesince September.
-8-
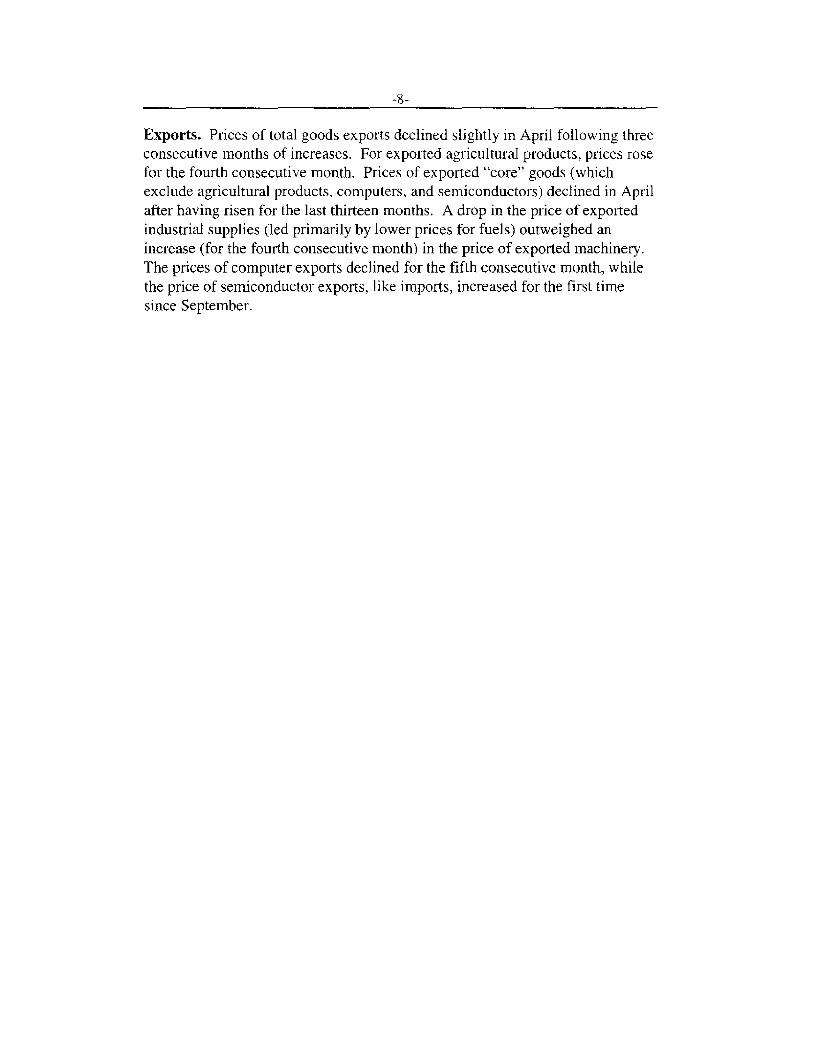
Exports. Prices of total goods exports declined slightly in April following threeconsecutive months of increases. For exported agricultural products, prices rosefor the fourth consecutive month. Prices of exported "core" goods (whichexclude agricultural products, computers, and semiconductors) declined in Aprilafter having risen for the last thirteen months. A drop in the price of exportedindustrial supplies (led primarily by lower prices for fuels) outweighed anincrease (for the fourth consecutive month) in the price of exported machinery.The prices of computer exports declined for the fifth consecutive month, whilethe price of semiconductor exports, like imports, increased for the first timesince September.
Prices of U.S. Imports and Exports(Percentage change from previous period)
Annual rates Monthly rates1999 2000 2000
Q3 Q4 Q1 Feb. Mar. Apr.
Merchandise importsOilNon-oil
Core goods*
Foods, feeds, beveragesIndustrial supplies ex oilComputersSemiconductorsCap. goods ex comp & semiAutomotive productsConsumer goods
Merchandise exportsAgriculturalNonagricultural
Core goods*
Industrial supples ex agComputersSemiconductorsCap. goods ex comp & semiAutomotive productsConsumer goods
---------- BLS prices (1995 weights)------------9.0 8.2 10.4 2.0 0.2 -1.6
178.2 83.5 104.7 14.7 -0.7 -12.7-0.1 1.9 1.7 0.3 0.2 0.1
1.0 2.5 1.9 0.5 0.3 0.1
-6.8 2.6 0.7 -0.3 -0.3 1.17.9 9.9 10.8 1.6 2.3 0.1
13.7 -1.0 -1.9 -0.4 -0.5 -0.5-7.4 -1.6 -3.9 -0.3 -0.3 1.3-2.1 0.3 -1.7 0.1 -0.3 0.10.8 0.5 0.7 0.1 0.0 0.0
-0.4 0.1 -0.7 0.0 -0.4 0.0
0.7 2.4 3.0-4.2 -1.7 0.6
1.1 3.0 3.41.6 4.1 4.4
10.1 10.6 12.4-8.6 -2.0 -3.7-9.6 -3.6 -5.0-0.5 0.5 0.90.8 2.6 0.50.3 1.3 0.9
0.5 0.5 -0.11.2 0.1 0.60.5 0.5 -0.20.6 0.7 -0.3
1.6 1.8 -0.9-0.6 -0.3 -0.3-0.1 -0.5 0.10.1 0.1 0.20.0 0.4 0.00.2 -0.1 0.0
Chain price indexImports of goods & services
Non-oil merchandiseCore goods*
Exports of goods & servicesNonag merchandise
Core goods*
*/ Excludes computers and semiconductors.n.a. Not available. ... Not applicable.
Oil Prices
---Prices in the NIPA accounts (1996 weights)---6.2 4.9 5.6
-0.7 0.9 0.71.1 1.3 1.4
1.3 2.6 1.81.0 2.7 1.8 12.5 3.0 3.2
Dollars per barrel
Spot West Texas Intermediate
1990 1991 1992 1993 1994 1995 1996 1997 1998 1999 2000
-10-
Selected Financial Market Quotations(One-day quotes in percent except as noted)
Change to May 11 from1999 2000 selected dates (percentage points)
Instrument FOMC* 1999 1999 FOMC*June 29 Dec. 31 Mar. 21 May 11 June 29 Dec. 31 Mar. 21
Short-termFOMC intended federal funds rate 4.75 5.50 5.75 6.00 1.25 .50 .25
Treasury bills 1
3-month 4.70 5.17 5.74 5.96 1.26 .79 .226-month 4.92 5.49 5.89 6.15 1.23 66 .261-year 4.89 5.63 5.87 6.00 1.11 .37 .13
Commercial paper1-month 5.18 5.13 6.00 6.37 1.19 1.24 .373-month 5.12 5.75 6.04 6.54 1.42 .79 .50
Large negotiable CDs 1
1-month 5.21 5.72 6.07 6.50 1.29 .78 .433-month 5.32 5.90 6.18 6.68 1.36 .78 .506-month 5.43 6.08 6.38 6.89 1.46 .81 .51
Eurodollar deposits 21-month 5.13 5.69 6.06 6.47 1.34 .78 .413-month 5.25 5.88 6.16 6.69 1.44 .81 .53
Bank prime rate 7.75 8.50 8.75 9.00 1.25 .50 .25
Intermediate- and long-termU.S. Treasury (constant maturity)
2-year 5.68 6.24 6.52 6.82 1.14 .58 .3010-year 5.93 6.45 6.18 6.43 .50 -.02 .2530-year 6.07 6.48 5.99 6.16 .09 -.32 .17
U.S. Treasury 10-year indexed note 4.01 4.33 4.16 4.15 .14 -.18 -.01
Municipal revenue (Bond Buyer) 5.62 6.23 6.16 6.23 .61 .00 .07
Corporate bonds. Moody's seasoned Baa 8.05 8.18 8.32 8.92 .87 .74 .60
High-yield corporate 4 10.53 10.94 11.14 11.90 1.37 .96 .76
Home mortgages (FHLMC survey rate) 5
30-year fixed 7.63 8.06 8.24 8.52 .89 46 .28I-year adjustable 5.93 6.56 6.68 6.96 1.03 .40 .28
Change to May 11Record high 1999 2000 from selected dates (percent)
Stock exchange index FOMC* Record FOMC*Level Date Dec. 31 Mar. 21 May 11 high Dec. 31 Mar. 21
Dow-Jones Industrial 11,723 1-14-00 11,497 10,680 10,546 -10.04 -8.27 -1,26S&P 500 Composite 1,527 3-24-00 1,469 1,457 1,408 -7.83 -4.18 -3.35Nasdaq (OTC) 5,049 3-10-00 4,069 4,610 3.500 -30.68 -14.00 -24.09
Russell 2000 606 3-9-00 505 549 489 -19.26 -3.04 -10.89
Wilshire 5000 14,752 3-24-00 13,813 14.053 13,041 -11.59 -5.58 -7.20
I. Secondary market.2. Bid rates for Eurodollar deposits collected around 9:30 a.m. Eastern time.3. Most recent Thursday quote.4. Merrill Lynch 175 high-yield bond index composite.5. For week ending Friday previous to date shown.* Data are as of the close on March 20, 2000.
BA:DAM
-11-
Commercial Bank Credit(Percent change, annual rate, except as noted; seasonally adjusted)
Level,Type of credit 1999 Q4 Q1 Feb. Mar. Apr. Apr. 2000
1999 2000 2000 2000 2000 ($ billions)
Total1. Adjusted1 5.4 9.2 11.3 8.4 8.9 12.1 4,8302. Reported 4.0 9.0 10.8 8.8 9.3 10.7 4,902
Securities3. Adjusted' 8.0 4.3 7.2 .4 5.6 10.3 1,2094. Reported 2.8 3.7 5.6 2.4 7.4 5.0 1,2815. U.S. government 2.4 -5.8 3.5 3.7 -2.8 -4.3 8096. Other 2 3.5 22.1 9.4 -.3 25.7 21.2 472
Loans3
7. Total 4.5 11.0 12.7 11.0 10.0 12.7 3,6218. Business 4.9 9.0 10.9 10.8 10.5 9.8 1,0399. Real estate 9.1 15.6 17.6 14.2 13.4 16.0 1,541
10. Home equity -2.8 5.2 22.6 25.3 29.2 40.6 11311. Other 10.2 16.4 17.2 13.4 12.2 14.2 1,428
12. Consumer -2.2 2.8 12.9 11.6 7.4 9.3 50913. Adjusted 4 4.5 8.1 7.6 2.1 7.2 7.9 80714. Other5 -1.6 9.8 2.2 2.3 2.1 12.3 532
Note. All data are adjusted for breaks caused by reclassifications. Monthly levels are pro rata averages of weekly (Wednesday)levels. Quarterly levels (not shown) are simple averages of monthly levels. Annual levels (not shown) are levels for the fourthquarter. Growth rates are percentage changes in consecutive levels, annualized but not compounded. These data have beenbenchmarked to the December 1999 Call Report.
1. Adjusted to remove effects of mark-to-market accounting rules (FIN 39 and FIN 115).2. Includes securities of corporations, state and local governments, and foreign governments and any trading account assets that
are not U.S. government securities.3. Excludes interbank loans.4. Includes an estimate of outstanding loans securitized by commercial banks.5. Includes security loans and loans to farmers, state and local governments, and all others not elsewhere classified. Also includes
lease financing receivables.
BA:LRC