Embed Size (px)
Citation preview

Prefatory Note
The attached document represents the most complete and accurate version available based on original copies culled from the files of the FOMC Secretariat at the Board of Governors of the Federal Reserve System. This electronic document was created through a comprehensive digitization process which included identifying the best-preserved paper copies, scanning those copies,1 and then making the scanned versions text-searchable.2 Though a stringent quality assurance process was employed, some imperfections may remain.
Please note that this document may contain occasional gaps in the text. These gaps are the result of a redaction process that removed information obtained on a confidential basis. All redacted passages are exempt from disclosure under applicable provisions of the Freedom of Information Act.
1 In some cases, original copies needed to be photocopied before being scanned into electronic format. All scanned images were deskewed (to remove the effects of printer- and scanner-introduced tilting) and lightly cleaned (to remove dark spots caused by staple holes, hole punches, and other blemishes caused after initial printing). 2 A two-step process was used. An advanced optimal character recognition computer program (OCR) first created electronic text from the document image. Where the OCR results were inconclusive, staff checked and corrected the text as necessary. Please note that the numbers and text in charts and tables were not reliably recognized by the OCR process and were not checked or corrected by staff.

CONFIDENTIAL (FR)CLASS III - FOMC
November 13, 1992
SUPPLEMENT
CURRENT ECONOMIC AND FINANCIAL CONDITIONS
Prepared for theFederal Open Market Committee
By the StaffBoard of Governors
of the Federal Reserve System

TABLE OF CONTENTS
Page
THE DOMESTIC NONFINANCIAL ECONOMY
Retail sales . . . . . . . . . . . . . . . . . . . . . 1Consumer attitudes . . . . .. . . . . . . . . . . . . 1Consumer price index . . . ... . .. . . . . . . . .. 2
Tables
Retail sales . . . . . . . . . . . . . . . . . . . 4University of Michigan Survey Research Center:
Survey of consumer attitudes . . . . . . . . . . . . 5Recent changes in producer prices. . . . . . . . . 6Recent changes in consumer prices . . . . . . . . . . 6
Charts
Personal saving rate . . . . . ... .. . . . . . . . . 7Consumer attitudes . . . . . . . . . . . . . .. . . . 7
THE FINANCIAL ECONOMY
The November 1992 Senior Loan Officer Opinion Survey . 8
Tables
Monetary aggregates . . . . . . . . . ... . . . . . .12Commercial bank credit and short- and
intermediate-term business credit. . ..... . . ..13Selected financial market quotations . . . . ... . ..14

SUPPLEMENTAL NOTES
THE DOMESTIC NONFINANCIAL ECONOMY
Retail Sales
According to the Census Bureau's advance estimate, nominal
retail sales rose 0.9 percent in October, led by an increase in
sales at automotive dealers of nearly 3 percent. In the retail
control category, which excludes automotive dealers and building
material and supply stores, nominal sales advanced 0.4 percent. In
addition, the figures for both August and September were revised up.
The revised retail sales data imply about a $2-1/2 billion upward
revision to the estimate of third-quarter real PCE.
Within the retail control in October, higher sales at general
merchandisers, apparel outlets, furniture and appliance stores, and
grocery stores more than offset lower spending at eating and
drinking establishments, drug stores, and establishments in the
"other durable goods" category. Nominal retail sales at gasoline
stations were reported to have edged up 0.3 percent in October;
however, separate physical-product data from the Department of
Energy indicate that real gasoline expenditures fell back last month
from a relatively high September level.
Consumer Attitudes
According to preliminary, partial-sample data, the University
of Michigan's composite index of consumer sentiment rose 10.3 index
points in the first half of November. The preliminary November
results are based on about two-thirds of the sample of participants.
The Survey Research Center reported that sentiment improved during
the weekend prior to the election and then remained at the higher
level through mid-month. The November increase more than offsets
the declines that occurred between June and October; at 83.6, the
-2-
index is at its highest level since the spike in sentiment following
the conclusion of the Gulf War.
Among the components of the composite index, perceptions of
current economic conditions rose 14.2 index points, reflecting more
optimistic assessments of personal financial situations and buying
conditions for household durables. The expected conditions
component rose 7.6 points; while respondents held a more favorable
outlook of future business conditions, there was no change in their
expectations of personal financial situations one year from now. In
other questions not included in the composite index, perceptions of
buying conditions for cars and homes improved, and there was a sharp
decline in the number of respondents expecting higher unemployment
over the next year. However, respondents' expectations of inflation
over the next twelve months rose 1.0 percentage point to
4.6 percent, the highest reading since November 1991. In contrast,
long-run inflation expectations were essentially unchanged at
5.0 percent.
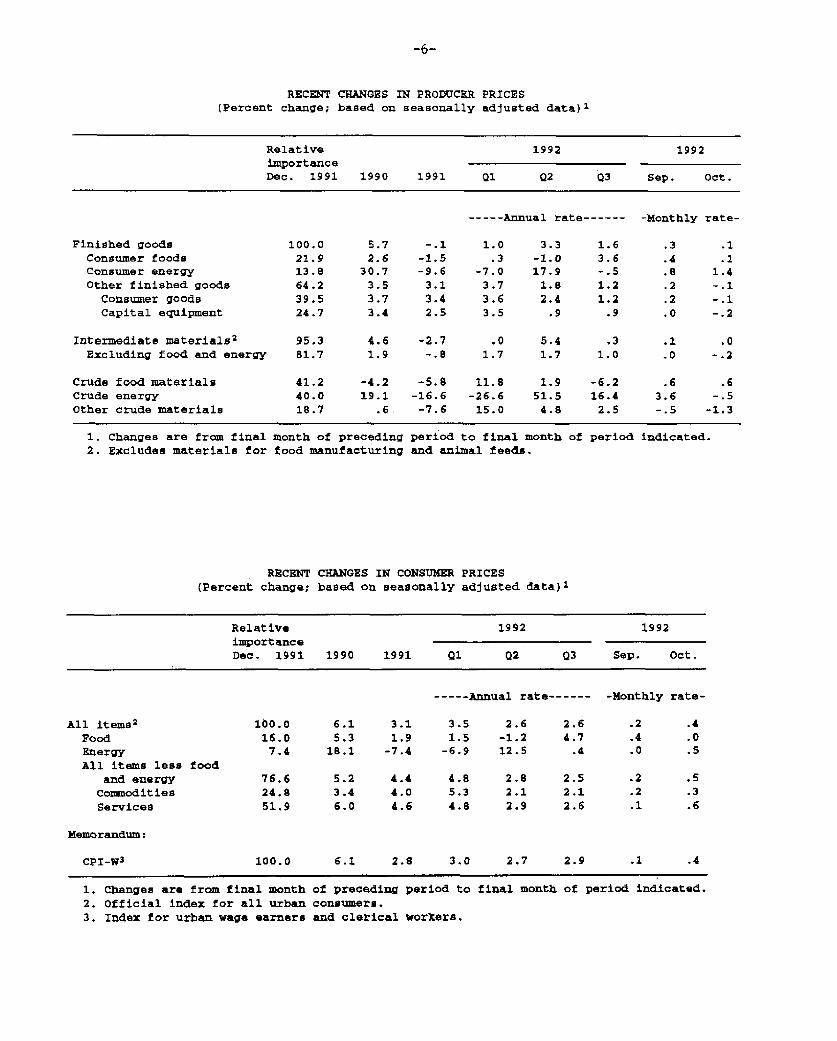
Consumer Price Index
The CPI rose 0.4 percent in October, its largest increase since
March. Energy prices advanced 0.5 percent, mainly owing to an
increase in gasoline prices of 0.6 percent, while food prices were
unchanged. Excluding food and energy, the index rose 0.5 percent,
breaking a string of five consecutive increases of 0.2 percent.
The jump in the index excluding food and energy was
concentrated in services, with the index for nonenergy services up
0.6 percent--its largest increase since January 1991. Owners'
equivalent rent rose 1/2 percent in October after posting a small
decline in September, and residential rent showed a similar pattern;
the swing in these two components added about 0.2 percentage point
to the overall CPI. Still, the index for owners' equivalent rent is

-3-
up at only a 2-3/4 percent annual pace so far in 1992, compared with
3-3/4 for all of 1991. Airline fares also made a significant
contribution to the increase in October; air fares surged nearly
8 percent, after falling about 9 percent over the preceding five
months. Elsewhere, the CPI for consumer commodities other than food
and energy rose 0.3 percent in October.

RETAIL SALES(Seasonally adjusted percentage change)
1992 1992
Q1 Q2 Q3 Aug. Sep. Oct.
Total salesPrevious estimate
Retail control 1Previous estimate
Total excl. automotive groupPrevious estimate
GAF 2Previous estimate
Durable goods storesPrevious estimate
Bldg. material and supplyAutomotive dealersFurniture and appliancesOther durable goods
Nondurable goods storesPrevious estimate
ApparelFoodGeneral merchandise 3
Gasoline stationsOther nondurables 4
2.7
2.2
2.5
.2 1.51.3
.3 1.71.5
.3 1.51.3
5.4 -. 6 3.4 -.23.6 -.3
3.9
7.53.33.92.3
2.0
3.9.2
6.7-.5
1.5
.5 1.7 -.61.6 -.5
.3.0
-. 5
3.8
-1.01.53.24.2
.1 1.41.1
2.0.5
-1.82.2-.3
3.8.9
3.4.5.3
-1.3-.7
-. 8
1.1
.5
.2
-1.11.0.4
-1.01.1
.9
.4
.4
1.3
1.7
.72.92.0-2.2
.4
1.6-1.0
.3
.31.0
1. Total retail sales less building material and supply stores andautomotive dealers, except auto and home supply stores.2. General merchandise, apparel, furniture, and appliance stores.3. General merchandise excludes mail order nonstores; mail order
sales are also excluded in the GAF grouping.4. Includes sales at eating and drinking places, drug and proprietary
stores.

November 13, 1992
UNIVERSITY OF MICHIGAN SURVEY RESEARCH CENTER: SURVEY OF CONSUMER ATTITUDES(Not seasonally adjusted)
1992 1992 1992 1992 1992 1992 1992 1992 1992Mar Apr May Jun Jul Aug Sep Oct Nov
(P)
Indexes of consumer sentiment (Feb. 1966=100)
Composite of current and expected conditions 76.0 77.2 79.2 80.4 76.6 76.1 75.6 73.3 83.6
Current conditionsExpected conditions
84.9 87.7 91.5 95.4 90.6 86.2 88.3 82.5 96.770.3 70.5 71.2 70.7 67.6 69.5 67.4 67.5 75.1
Personal financial situation
Now compared with 12 months ago*Expected in 12 months*
Expected business conditions
93 97 97 100 96 91 102 90 109113 129 122 125 125 121 123 121 121
Next 12 months*Next 5 years*
Appraisal of buying conditions
CarsLarge household appliances*Houses
Willingness to use creditWillingness to use savings
Average expected increase in prices duringthe next 12 months
Average expected increase in pricesover the next 5 to 10 years
(per year)
125 131 135 144 128 129 130 121 132126 130 139 147 138 132 126 123 141153 162 159 163 153 159 162 148 163
3.3 3.7 3.4 4.2 3.9 4.0 4.1 3.6 4.6
4.6 4.9 5.5 4.7 4.7 S.0 5.0 5.1 5.0
* -- Indicates the question is one of the five(p) -- Preliminary(f) -- Final
equally-weighted components of the index of sentiment.
Note: Figures on financial, business, and buying conditions are the percent reporting 'good times' (or'better') minus the percent reporting 'bad times' (or 'worse'), plus 100. Asterisk (*) indicatesthe question is one of the five equally-weighted components of the index of sentiment.
RECENT CHANGES IN PRODUCER PRICES(Percent change; based on seasonally adjusted data) 1
Relative 1992 1992importanceDec. 1991 1990 1991 Q1 Q2 Q3 Sep. Oct.
----- Annual rate------ -Monthly rate-
Finished goods 100.0 5.7 -. 1 1.0 3.3 1.6 .3 .1Consumer foods 21.9 2.6 -1.5 .3 -1.0 3.6 .4 .1Consumer energy 13.8 30.7 -9.6 -7.0 17.9 -.5 .8 1.4Other finished goods 64.2 3.5 3.1 3.7 1.8 1.2 .2 -.1Consumer goods 39.5 3.7 3.4 3.6 2.4 1.2 .2 -.1Capital equipment 24.7 3.4 2.5 3.5 .9 .9 .0 -.2
Intermediate materials 2 95.3 4.6 -2.7 .0 5.4 .3 .1 .0Excluding food and energy 81.7 1.9 -.8 1.7 1.7 1.0 .0 -.2
Crude food materials 41.2 -4.2 -5.8 11.8 1.9 -6.2 .6 .6Crude energy 40.0 19.1 -16.6 -26.6 51.5 16.4 3.6 -.5Other crude materials 18.7 .6 -7.6 15.0 4.8 2.5 -.5 -1.3
1. Changes are from final month of preceding2. Excludes materials for food manufacturing
period to final month of period indicated.and animal feeds.
RECENT CHANGES IN CONSUMER PRICES(Percent change; based on seasonally adjusted data) 1
Relative 1992 1992importanceDec. 1991 1990 1991 Ql Q2 Q3 Sep. Oct.
----- Annual rate------ -Monthly rate-
All items2 100.0 6.1 3.1 3.5 2.6 2.6 .2 .4Food 16.0 5.3 1.9 1.5 -1.2 4.7 .4 .0Energy 7.4 18.1 -7.4 -6.9 12.5 .4 .0 .5All items less food
and energy 76.6 5.2 4.4 4.8 2.8 2.5 .2 .5Commodities 24.8 3.4 4.0 5.3 2.1 2.1 .2 .3Services 51.9 6.0 4.6 4.8 2.9 2.6 .1 .6
Memorandum:
CPI-W 3 100.0 6.1 2.8 3.0 2.7 2.9 .1 .4
1. Changes are from final month2. Official index for all urban3. Index for urban wage earners
of preceding period to final month of period indicated.consumers.and clerical workers.

PERSONAL SAVING RATEPercent
14
QuarterlyFour-quarter moving average
1964 1968 1972 1976 1980 1984 1988 1992
CONSUMER ATTITUDES IndexS 150S12.. .. .. ....
. 1 .., .. .110
Si l i:!!: t\ /? iL150
:^\ :-::--::- /illl Michigan survey Ip AI I 8017 1i980 1982 18 1986--ii: I1988 1990i 19-09....... ...150.. ... .•. .... .. .iihiai !....-i ..-... '-. -'. :- ... ' """...
1990 19921982 1984 1986 19881978 1980

THE FINANCIAL ECONOMY
The November 1992 Senior Loan Officer Opinion Survey on Bank Lending
Practices
The November 1992 Senior Loan Officer Opinion Survey on Bank
Lending Practices suggests that the market for loans to businesses
has not greatly changed over the last three months, while the market
for loans to households has continued to expand. A large majority
of respondents reported no changes in terms and standards on
commercial and industrial loans and commercial real estate loans.
Similarly, most respondents indicated that the demand for loans by
businesses has been unchanged since August, although a small number
reported increased demand by large and medium-sized borrowers. In
contrast, the respondents reported a slight easing of standards on
home mortgage loans, and an increase in their willingness to make
loans to individuals relative to three months ago. In addition,
large fractions of respondents reported increased demand for
residential mortgages, home equity lines of credit, and consumer
loans. As in the August survey, almost all of the respondents
claimed that they were fairly comfortable or very comfortable with
their bank's capital position. About half of the respondents,
however, reported taking actions over the last quarter to improve
their capital position.
Business Lending
Nonmerger-related commercial and industrial loans. As was the
case in both the May and August surveys, most domestic banks
reported unchanged standards for approving commercial and industrial
loans over the last three months. There was a very small net
tightening of standards on loans to large and medium-sized
borrowers. In contrast, a few banks reported easing standards on
loans to small businesses while none reported tightening them.

As in May and August, most domestic banks reported that lending
terms on commercial and industrial loans and lines of credit were
basically unchanged over the last three months. More banks reported
cutting the cost of credit lines than increasing them, although the
net change for medium-sized and small borrowers was very slight.
Spreads of loan rates over base rates, which had widened in the
August survey, narrowed for medium-sized and small firms. As in
August, there was a small net increase in the use of loan covenants
for large and medium-sized borrowers. For small borrowers, however,
the use of covenants declined somewhat. There was little change in
collateral requirements over the past quarter.
U.S. branches and agencies of foreign banks reported slightly
tighter standards and terms over the past quarter, much as they did
in the August survey. The branches and agencies reported a small
net decline in the sizes of credit lines, and a small net increase
in their cost. There were also small net increases in spreads, and
in the use of loan covenants and collateral.
Real estate loans. Domestic respondents reported a small net
tightening of standards on commercial real estate loans, as they did
in August. U.S. branches and agencies of foreign banks also
reported a small net tightening of standards on real estate loans of
all types. In August the foreign branches and agencies reported no
change in standards on these loans.
Demand. Most domestic respondents reported that business loan
demand changed little over the last quarter, although there was a
small strengthening of demand reported at large and medium-sized
firms. The primary reason given by the respondents for the stronger
demand by these firms was increased capital investment, although
inventory financing needs and weaker competition from other banks

-10-
were also noted. U.S. branches and agencies of foreign banks
reported no net change in the demand for loans.
Lending to Households
As in the last two surveys, the respondents reported increases
both in their willingness to lend to households and in the demand
for credit by households. About a sixth of the respondents reported
increased willingness to provide general purpose consumer loans, a
smaller proportion than in August. A similar fraction reported
increased willingness to provide consumer installment credit, also
down a bit from the August survey. As in August, there was a small
net easing of standards on residential mortgages over the past
three months. About half of the respondents reported a pick up in
the demand for mortgages to purchase homes. More than twenty
percent of the respondents indicated that the demand for home equity
lines of credit and consumer installment loans had increased
relative to the previous quarter.
Capital Ratios
The responses to the questions on capital adequacy indicate
that the respondents' capital positions have improved since August.
More than 90 percent of the domestic banks reported that both their
risk-based capital ratio and their tier-i capital ratio were either
"fairly comfortable" or "very comfortable." None of the respondents
reported that either ratio was tight, as a few banks did in the
August survey. As in August, only about 10 percent of the
respondents reporting comfortable capital levels--for the most part
banks with assets exceeding $10 billion--said that they took a more
aggressive lending stance as a result. About half of the
respondents reported taking steps over the last quarter to improve
their capital positions. About a third of them issued capital, and
about 10 percent increased loan sales and securitizations. Another

-11-
10 percent reported that they maintained tight lending standards and
terms over the last quarter in order to bolster their capital.
Most of the U.S. branches and agencies of foreign banks
reported that the capital position of their parent institution was
only "adequate," and one institution reported a fairly tight capital
position. Nonetheless, these responses were an improvement over the
responses in the August survey. At that time almost a quarter of
the respondents indicated that their parent's capital position was
"fairly tight." About half of the respondents reported that they
maintained tight lending standards in order to strengthen their
parent firm's capital position. Of the four branches and agencies
that reported "comfortable" or "very comfortable" capital positions,
only one reported lending more aggressively as a result.

-12-
MONETARY AGGREGATES(based on seasonally adjusted data unless otherwise noted)
Growth1992 1992 1992 1992 1992 04 91-
1991
Q2 Q3 Aug Sep Oct p Oct 92 p
1. Ml2. M23. M3
Selected components
4. Ml-A
5. Currency6. Demand deposits
----------- Percent change at annual rates---------------------
8.0 9.8 10.3 15.6 19.1 22.7 14.42.8 0.4 0.3 3.2 3.6 5.3 2.21.2 -1.3 -0.2 3.4 1.7 0.8 0.5
Levels------------ Percent change at annual rates------------ bil. $
Oct 92p
5.6 9.1 11.2 17.1 22.8 21.2 633.5
8.4 5.8 11.2 14.6 17.4 8.4 288.43.4 12.5 11.5 19.4 26.6 31.8 336.5
7. Other checkable deposits
8. M2 minus M1 2
9. Overnight RPs and Eurodollars, NSA10. General purpose and broker/dealer money
market mutual fund shares11. Commercial banks12. Savings deposits (including MMDAs)13. Small time deposits14. Thrift institutions15. Savings deposits (including MMDAs)
16. Small time deposits
17. M3 minus M2 3
18. Large time deposits19. At commercial banks, net 4
20. At thrift institutions21. Institution-only money market
mutual fund shares22. Term RPs, NSA23. Term Eurodollars, NSA
MEMORANDA: 5
24. Managed liabilities at commercialbanks (25+26)
25. Large time deposits, gross26. Nondeposit funds27. Net due to related foreign
institutions28. Others
29. U.S. government deposits at commercialbanks
7
12.4 11.0 8.8 13.4 12.9 25.2 373.8
1.1 -3.0 -3.5 -1.6 -2.5 -1.6 2490.4
-6.9 -27.1 16.8 54.3 -25.2 25.7 76.2
3.9 -3.9 -7.2 -5.8 -17.1 10.8 348.87.1 0.5 -1.6 -0.5 2.6 0.7 1263.0
13.3 12.0 10.0 13.4 16.7 14.4 743.21.1 -13.3 -16.3 -18.8 -16.6 -18.4 519.8
-6.9 -6.7 -5.1 -4.7 -2.8 -8.6 805.79.3 18.9 8.3 9.2 10.8 8.8 428.2
-16.8 -29.4 -18.7 -19.3 -17.4 -27.6 377.5
-11.7-5.1
-31.7
33.4-22.0-11.0
-9.5
-18.9-14.8-37.0
20.16.1
-22.7
-2.8 4.1 -7.9 -21.5 685.2
-16.2
-16.0-16.8
39.9-2.2-33.1
-11.7-10.2-22.4
54.95.0
-23.9
-14.7-16.7-3.5
0.023.4-58.4
-21.5-25.8
-3.5
-65.240.9-7.7
373.2305.367.8
205.475.846.6
----- Average monthly change in billions of dollars----
-0.6 -3.1-0.2 -4.8-0.4 1.7
0.4-0.8
0.2
0.3 2.4 3.4 -8.8-3.7 -1.5 -3.4 -7.94.0 3.9 6.8 -0.9
677.0373.3303.7
5.0 0.6 -3.4 3.2 2.6 64.6-3.3 3.3 7.3 3.6 -3.3 239.2
1.3 -0.1 10.7 -7.2 -2.9 22.5
. Amounts shown are from fourth quarter to fourth quarter.SNontransactions M2 is seasonally adjusted as a whole.SThe non-M2 component of M3 is seasonally adjusted as a whole.SNet of large denomination time deposits held by money market mutual funds and thrift institutions..Dollar amounts shown under memoranda are calculated on an end-month-of-quarter basis.SConsists of borrowing from other than commercial banks in the form of federal funds purchased, securitiessold under agreements to repurchase, and other liabilities for borrowed money (including borrowing from theFederal Reserve and unaffiliated foreign banks, loan RPs and other minor items). Data are partially estimated.Consists of Treasury demand deposits and note balances at commercial banks.
- preliminary
COMMERCIAL BANK CREDIT AND SHORT- AND INTERMEDIATE-TERM BUSINESS CREDIT 1(Percentage change at annual rate, based on seasonally adjusted data)
1990 Level,Dec. to 1992 1992 1992 1992 1992 bil.$
Category 1991 Q2 Q3 Aug. Sep. Oct. p 1992Dec. Oct. p
Commercial bank credit
1. Total loans and securities at banks 3.9 3.0 4.1 5.4 6.8 4.1 2,922.9
2. Securities 17.7 16.4 14.9 22.0 7.7 10.9 824.0
3. U.S. government 23.8 21.9 17.7 28.1 9.1 12.0 645.1
4. Other 1.6 -1.8 5.7 0.7 2.7 6.7 178.9
5. Loans -0.2 -1.8 0.0 -1.0 6.4 1.5 2,098.9
6. Business -2.8 -4.2 -0.8 -4.0 5.2 -0.8 603.1
7. Real estate 2.9 0.2 0.4 -0.8 5.1 5.2 886.1
8. Consumer -4.0 -2.9 -2.6 -4.0 -2.4 -4.0 355.4
9. Security 21.3 22.4 12.5 35.6 71.0 -7.3 65.8
10. Other -2.8 -9.0 1.7 1.9 12.3 5.8 188.6
Short- and intermediate-term business credit
11. Business loans net of bankers -2.4 -3.7 -1.1 -3.8 5.6 -3.0 596.2acceptances
12. Loans at foreign branches2 -1.6 26.3 1.6 -42.9 4.9 14.8 24.7
13. Sum of lines 11 and 12 -2.4 -2.6 -0.9 -5.2 5.6 -2.3 621.0
14. Commercial paper issued by -10.4 -3.9 7.1 15.3 1.7 20.2 145.3nonfinancial firms
15. Sum of lines 13 and 14 -3.9 -2.9 0.6 -1.3 4.9 1.9 766.3
16. Bankers acceptances, U.S. trade- -16.2 -27.3 -19.5 -29.4 -25.1 n.a. 23.4 5related3,4
17. Finance company loans to business4 1.4 -1.6 7.4 12.0 0.8 n.a. 304.2 5
18. Total (sum of lines 15,16, and 17) -2.9 -3.1 2.0 1.7 3.2 n.a. 1,092.7 5
1. Average of Wednesdays. Data are adjusted for breaks caused by reclassifications.2. Loans at foreign branches are loans made to U.S. firms by foreign branches of domestically chartered banks.3. Consists of acceptances that finance U.S. imports, U.S. exports, and domestic shipment and storage of goods.4. Based on average of data for current and preceding ends of month.5. September 1992.p-Preliminary.n.a.Not available.
-13-

-14-1
SELECTED FINANCIAL MARKET QUOTATIONS(percent)
....................................................................................
1992 1992 1992 Change from:
FOMC FOMCSept 4 Oct 6 Nov 12 Sept 4 Oct 6
Short-term rates
Federal funds 2
Treasury bills 3
3-month6-month1-year
Commercial paper1-month3-month
3.19 3.24 3.04
2.922.963.06
2.732.842.93
3.063.283.42
3.22 3.14 3.283.22 3.14 3.60
-0.15 -0.20
0.140.320.36
0.330.440.49
0.06 0.140.38 0.46
Large negotiable CDs3
1-month3-month6-month
Eurodollar deposits 4
1-month3-month
Bank prime rate
Intermediate- and long-term rates
U.S. Treasury (constant maturity)3-year10-year30-year
Municipal revenue(Bond Buyer)
Corporate--A utilityrecently offered
3.063.063.11
2.973.043.05
3.143.523.53
3.31 2.94 3.133.31 3.06 3.63
6.00 6.00 6.00
4.386.407.29
4.246.307.41
5.006.797.57
6.31 6.45 6.57
8.06 8.26 8.57
0.080.460.42
0.170.480.48
-0.18 0.190.32 0.57
0.00 0.00
0.620.390.28
0.760.490.16
0.26 0.12
0.51 0.31
Home mortgage rates 6
FHLMC 30-yr. FRM 7.84 7.93 8.29FHLMC 1-yr. ARM 5.15 5.01 5.17
...................................................................
1989 1992
Record Lows FOMChighs Date Jan 3 Oct 6 Nov 12
------------------------.----------------.-.----------------------
0.45 0.360.02 0.16
Percent change from:--------------------------
Record 1989 FOMChighs lows Oct 6--------------------------
Stock prices
Dow-Jones Industrial 3413.21 6/1/92 2144.64 3178.19 3239.79 -5.08 51.06 1.94NYSE Composite 233.73 9/14/92 154.00 224.09 232.83 -0.39 51.19 3.90AMEX Composite 418.99 2/12/92 305.24 367.71 389.23 -7.10 27.52 5.85NASDAQ (OTC) 644.92 2/12/92 378.56 570.55 634.37 -1.64 67.57 11.19Wilshire 4121.28 1/15/92 2718.59 3928.03 4133.84 0.30 52.06 5.24
- - - - - - - - - - - - - - . - - - - - - - - - - - - - . . - - - - - - - - - - - - - - - - - - - - - - - - - - - - - - - - - - - - - - - - - - - - - - - - - - - - - - - - - - - - - - - -
One-day quotes except as noted.Average for two-week reserve maintenance periodclosest to date shown. Last observation is averagefor maintenance period ending November 11, 1992.
3/ Secondary market.4/ Bid rates for Eurodollar
deposits at 11 a.m. London time.5/ Based on one-day Thursday quotes
and futures market index changes.6/ Quotes for week ending
Friday previous to date shown.