Embed Size (px)
Citation preview

Prefatory Note
The attached document represents the most complete and accurate version available based on original copies culled from the files of the FOMC Secretariat at the Board of Governors of the Federal Reserve System. This electronic document was created through a comprehensive digitization process which included identifying the best-preserved paper copies, scanning those copies,1 and then making the scanned versions text-searchable.2 Though a stringent quality assurance process was employed, some imperfections may remain.
Please note that this document may contain occasional gaps in the text. These gaps are the result of a redaction process that removed information obtained on a confidential basis. All redacted passages are exempt from disclosure under applicable provisions of the Freedom of Information Act.
1 In some cases, original copies needed to be photocopied before being scanned into electronic format. All scanned images were deskewed (to remove the effects of printer- and scanner-introduced tilting) and lightly cleaned (to remove dark spots caused by staple holes, hole punches, and other blemishes caused after initial printing). 2 A two-step process was used. An advanced optimal character recognition computer program (OCR) first created electronic text from the document image. Where the OCR results were inconclusive, staff checked and corrected the text as necessary. Please note that the numbers and text in charts and tables were not reliably recognized by the OCR process and were not checked or corrected by staff.
CONFIDENTIAL (FR)CLASS III - FOMC
June 26, 1992
SUPPLEMENT
CURRENT ECONOMIC AND FINANCIAL CONDITIONS
Prepared for theFederal Open Market Committee
By the StaffBoard of Governors
of the Federal Reserve System
TABLE OF CONTENTS
Page
THE DOMESTIC NONFINANCIAL ECONOMY
Real GDP in 1992:Q1. . . . . . . . . . . . . .. . . . . 1Income and consumption . . . . . .. . . . . . .... . 1Housing . . . . . . . . . . . . . . . . ... . . . . . 2Labor markets. . . . . . . . . . . . . . . . .... ... 2
Tables
The market for existing homes. . . . . . . . . . . .. 2Real gross domestic product and related items .. . . 3Personal income. . . . . . . . . . . . . . . . . . . . 4Real personal consumption expenditures . . . . . . . . 4
Charts
Personal consumption expenditures. . . . . . . ... 5Unemployment insurance . . . . . . . . . . . . . . . . 6
THE FINANCIAL ECONOMY
Tables
Monetary aggregates . . . . . . . . . . . . . . . . . 7Commercial bank credit and short- andintermediate-term business credit. . . . . . . . . . 8
Selected financial market quotations . . . . . . . . . 9
THE INTERNATIONAL ECONOMY
Prices of exports and non-oil imports. . . . . . . ... 10
Import and export price measures . . ..
SUPPLEMENTAL NOTES
THE DOMESTIC NONFINANCIAL ECONOMY
Real GDP in 1992:Q1
In its final estimate for the first quarter, the Bureau of
Economic Analysis revised up slightly its estimate of real GDP
growth from 2.4 percent to 2.7 percent (at an annual rate). There
was a small downward adjustment to personal consumption
expenditures, but it was more than offset by upward revisions to
most other major components of GDP. In addition, corporate profits
(with inventory valuation and capital consumption adjustments) are
now estimated to have risen $40 billion in the first quarter, an
upward revision of about $8 billion from the preliminary estimate.
Income and Consumption
Nominal personal income rose $14 billion at an annual rate in
May, following a slow $3.6 billion increase in April. A rebound in
wages and salaries accounted for most of the gain in May. Increases
in other labor income, transfer payments, nonfarm proprietors'
income, and dividends more than offset declines in interest income
and farm proprietors' income. After accounting for taxes and
inflation, real disposable personal income edged up 0.1 percent in
May, after falling 0.2 percent in April.
Real personal consumption expenditures rose 0.3 percent in May,
lifted mainly by higher outlays on motor vehicles. As suggested by
the May retail sales report, spending for goods other than
motor vehicles in April and May was slightly below the first-quarter
average. Outlays for services rose slowly for a second month in
May.

Housing
Sales of existing homes edged down 1.7 percent in May. At
3.43 million units (annual rate), sales in May remained near the
three-year high recorded in the March-April period. The change in
sales volume was small in all regions.
Prices of existing homes sold in May were down slightly from a
year earlier: The average sales price was off 1.8 percent, and the
median sales price declined 0.4 percent. These are the first year-
over-year price declines since early 1991. In May, as in April,
prices were particularly weak in the West.
THE MARKET FOR EXISTING HOMES
1991 1992 1992
1991 Q4 Q1 Mar. Apr p Aprr Mayp
Sales volumeThousands of units, SAAR 3,220 3,230 3,407 3,510 3,500 3.490 3,430
(Percent change fromprevious period) .3 1.3 5.5 .6 -.3 -.6 -1.7
Sales priceAverage ($1,000, NSA) 128.4 126.2 129.8 130.2 129.9 130.6 128.5
(Percent changefrom year earlier) n.a. n.a. 5.4 4.1 .7 1.2 -1.8
Median ($1,000, NSA) 100.3 99.1 103.1 104.0 102.7 103.3 100.9(Percent changefrom year earlier) 5.0 7.5 6.7 5.4 2.2 2.8 -.4
1. Because of a change in survey design, average sales prices beginning inJanuary 1991 are not strictly comparable with previous periods. Medianprices are not affected by this change.
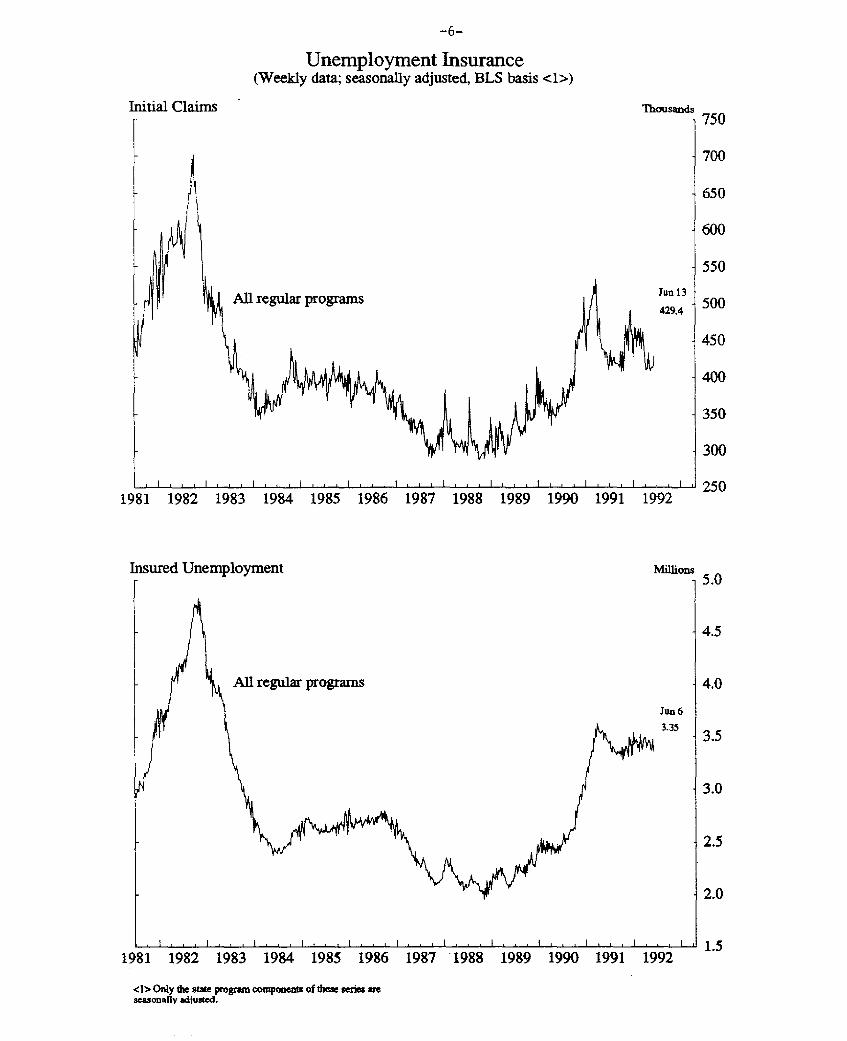
Labor Markets
Initial claims for unemployment insurance totaled 429,000 for
the week ended June 13, after holding in the range of 410,000 to
415,000 over the previous five weeks. The level of insured
unemployment under all regular programs fell about 120,000 to
3.35 million in the week ended June 6.

6/25/92
-3-
REAL GROSS DOMESTIC PRODUCT AND RELATED ITEMS(Percent change from previous period at compound annual rates;
based on seasonally adjusted data, measured in 1987 dollars)
1990-Q4 to 1991-Q4 1992-Q1 1992-Q11991-Q4 Final Preliminary Final
1. Gross domestic product .3 .4 2.4 2.7
2. Final sales -. 5 -. 2 4.6 4.8
3. Consumer spending .6 .0 5.4 5.04. Excluding motor vehicles 1.0 .1 4.6 4.4
5. Business fixed investment -7.1 -3.4 1.7 3.16. Producers' durable equipment -3.7 -1.6 3.7 3.57. Nonresidential structures -14.7 -7.8 -3.0 2.5
8. Residential investment -. 9 12.3 8.4 11.7
9. Government purchases -1.6 -5.4 3.1 2.9
10. Exports of goods and services 6.8 9.7 -. 9 2.5
11. Imports of goods and services 4.6 2.1 -. 2 1.5
ADDENDA:12. Nonfarm inventory investment 1 -13.92 9.2 -18.1 -16.313. Retail autos 1 -7.72 -8.1 -8.9 -6.014. Excluding retail autos 1 -6.2 2 17.3 -9.2 -10.3
15. Net exports of goods and services 1 -20.9 2 -21.3 -22.3 -20.1
16. Nominal GDP 3.3 2.2 5.5 5.8
17. GDP fixed-weight price index 3.4 2.1 3.4 3.3
18. GDP implicit price deflator 3.0 1.7 3.1 3.1
19. Corporate profits 3 306.8 315.6 347.0 355.4
20. Profit share (percent) 4 5.4 2 5.5 5.9 6.1
21. Personal saving rate 5.2 5.2 4.9 5.0
1. Level, billions of 1987 dollars.2. Annual average.3. With inventory valuation and capital consumption adjustments; level, billions of dollars.4. Economic profit as a share of nominal GNP.

PERSONAL INCOME(Average monthly change at an annual rate; billions of dollars)
1991 1992 1992
1991 Q4 Q1 Mar. Apr. May
Total personal income 11.3 17.6 21.7 22.3 3.6 14.0
Wages and salaries 4.7 5.6 9.6 10.9 -1.7 11.5Private 3.1 3.9 7.0 10.0 -2.5 10.6
Other labor income 1.4 1.4 1.4 1.3 1.4 1.4
Proprietors' income 2.1 3.7 6.2 10.7 2.2 -7.0Farm -. 5 2.0 2.2 8.6 -. 1 -8.3
Rent .1 2.3 -. 2 .4 -1.5 1.9Dividend .1 .1 .1 .3 1.1 1.2Interest -3.1 -4.9 -5.7 -4.7 -4.0 -3.5
Transfer payments 7.1 9.9 12.0 4.0 6.1 9.3
Less: Personal contributionsfor social insurance 1.0 .4 1.7 .8 -.1 .8
Less: Personal tax and nontaxpayments -.8 .5 -7.2 -22.3 4.0 1.2
Equals: Disposable personal income 12.2 17.1 28.9 44.5 -.4 12.9
Memo: Real disposable income 1.7 7.1 12.3 20.1 -7.7 3.3
REAL PERSONAL CONSUMPTION EXPENDITURES(Percent change from the preceding period)
1991 1992 1992
1991 Q4 Q1 Mar. Apr. May
-Annual rate- ----Monthly rate----Personal consumption
expenditures .6 .0 5.0 -.6 .2 .3
Durable goods -2.8 -5.7 15.9 -2.9 .1 1.6Excluding motor vehicles -.7 -7.7 15.0 -1.0 .4 .2
Nondurable goods -.9 -3.9 5.3 -1.3 .5 .0Excluding gasoline -.9 -4.2 6.3 -1.7 .5 -.2
Services 2.2 3.7 2.5 .4 .1 .1Excluding energy 2.2 3.4 3.8 .1 .1 .0
Memo:Personal saving rate
(percent) 5.2 5.2 5.0 5.8 5.4 5.3

Personal Consumption Expenditures for Goods excluding Motor Vehicles
F * Quarterly Average
1989 1990
Personal Consumption Expenditures for Motor Vehicles
F * Quarterly Average
Billions of 1987 dollars
1991 1992
Billions of 1987 dollars
1330
1320
1310
1300
1290
1280
1270
250
- 220
May
I I I1
Personal Consumption Expenditures for Services
F * Quarterly Average
Billions of 1987 dollars
May
1989 1990 1991-1992
1920
1860
1800
1740
1989 1990 1991 1992
Unemployment Insurance(Weekly data; seasonally adjusted, BLS basis <1>)
Initial Claims
All regular programs
Thousands750
700
650
600
550
Jun 13
429.4 5
t 450
400
350
300
' 2501981 1982 1983 1984 1985 1986 1987 1988 1989 1990 1991 1992
Insured Unemployment
All regular programs
Millions5.0
4.5
4.0
Jun 6
3.353.5
3.0
2.5
2.0
1.5
<1> Only the state program component of these series areseasonally adjusted.
1981 1982 1983 1984 1985 1986 1987 1988 1989 1990 1991 1992
-7-
MONETARY AGGREGATES(based on seasonally adjusted data unless otherwise noted)
Growth1992 1992 1992 1992 1992 Q4 91-
1991 1 Q1 Q2pe Apr May Junpe Jun 9 2pe
------------ Percent change at annual rates---------------------
8.0 16.5 102.8 4.3 01.2 2.2 -13
5.0 14.8-2.1 0.6
-3.9 -0.4
------------ Percent change at annual rates----------
Selected components
4. M1-A
5. Currency6. Demand deposits
7. Other checkable deposits
8. M2 minus M1 2
9. Overnight RPs and Eurodollars, NSA10. General purpose and broker/dealer money
market mutual fund shares11. Commercial banks12. Savings deposits (including MMOAs)13. Small time deposits14. Thrift institutions15. Savings deposits (including MMDAs)16. Small time deposits
17. M3 minus M23
5.6 14.9 94 6.9 10.1
8.4 7.4 63.4 22.2 12N
7.9 4.86.2 15.0
12.4 19.2 114 1.7 22.6
0.0 -3% -4.7 -4.8
-7.9 15.4 -364 -41.0 -61.2
3.97.1
13.31.1
-6.99.3
-16.8
1.00.9
19.2-18.9-3.622.4
-24.2
12¾-134-6A19¾-29
-29
-13.14.5
13.8-7.0-12.615.8
-39.3
3.0-3.37.8
-17.2-2.919.4
-24.3
-5.6 -7.2 -9 -13.0 -5.1
Levels-- bil. $
May 92
-4 597.9
7 274.7-15 315.2
4 356.6
-4 2515.1
14 67.0
355.01265.7
707.9557.8825.6414.6411.0
-5 706.6
Large time depositsAt commercial banks, net 4
At thrift institutionsInstitution-only money marketmutual fund shares
Term RPs, NSATerm Eurodollars, NSA
-11.7-5.1
-31.7
33.4-21.7-10.6
-20.4-18.2-29.6
27.0-6.0
-25.7
-184-14-37n
-20.9-17.5
-36.3
20% 25.3-3% -22.8-7 -32.7
-13.3-7.2
-42.3
35.5-10.0-31.5
401.2329.971.2
33 194.8-13 71.7-15 55.6
----- Average monthly change in billions of dollars---MEMORANDA:5
24. Managed liabilities at commercialbanks (25+26)
25. Large time deposits, gross26. Nondeposit funds27. Net due to related foreign
institutions28. Other6
29. U.S. government deposits at commercialbanks
7
-0.6-0.2-0.5
-2.8 -34-5.7 -4i2.8 1
-4.7 -2.4-7.1 -3.22.4 0.8
0.4 2.0 3J 4.5 5.3-0.9 0.8 -2% -2.1 -4.5
0.2 -1.5 1¾ -1.9 -2.9
1. Amounts shown are froe fourth quarter to fourth quarter.2. Nontransactions M2 is seasonally adjusted as a whole.3. The non-MZ component of M3 is seasonally adjusted as a whole.4. Net of large denomination time deposits held by money market mutual funds and thrift institutions.5. Oollar amounts shown under memoranda are calculated on an end-month-of-quarter basis.6. Consists of borrowing from other than commercial banks in the form of federal funds purchased, securities
sold under agreements to repurchase, and other liabilities for borrowed money Iincluding borrowing from theFederal Reserve and unaffiliated foreign banks, loan RPs and other minor items). Data are partially estimated.
7. Consists of Treasury demand deposits and note balances at comercial banks.pe - preliminary estimate
1. Ml
2. M23. M3
689.1396.6292.5
2 55.1-2 237.4
8 17.0

COMMERCIAL BANK CREDIT AND SHORT- AND INTERMEDIATE-TERM BUSINESS CREDIT 1(Percentage change at annual rate, based on seasonally adjusted data)
Dec.1990to
Dec.1991
1991 1992 1992 1992 1992Q4 Q1 Mar. Apr. May.
Levelsbil.$1992May.
1. Total loansand securitiesat banks
2. Securities
3. U.S. government
4. Other
5. Loans
6. Business
7. Real estate
8. Consumer
9. Security
10. Other
Commercial bank credit
3.9
17.6
23.8
1.4
-0.2
-2.9
2.9
-3.9
21.9
-3.0
7.0
24.4
30.3
6.6
1.1
-2.1
2.5
-4.1
36.0
6.3
2.1
6.6
11.1
-7.9
0.5
-6.3
2.4
-0.8
44.0
4.3
2.7
8.5
16.6
-18.3
0.6
-4.7
1.5
-4.6
71.5
1.9
5.2
20.1
24.7
6.2
-0.2
-5.9
1.6
-3.0
89.3
-13.3
-0.8
11.8
15.8
-2.7
-5.4
-7.3
1.4
-5.0
-59.1
-12.8
11. Business loansnet ofbankers acceptances
12. Loans at foreignbranches2
13. Sum of lines 11 and 12
14. Commercial paperissued bynonfinancial firms
15. Sum of lines 13 and 14
16. Bankers acceptances,U.S. trade-related3
17. Finance companyloans to business 4
18. Total (sum oflines 15, 16,and 17)
Short- and intermediate-term business credit
-2.5 -2.3 -6.4 -4.6 -5.6 -7.8 595.6
-1.6
-2.4
-10.4
-3.9
34.2
-0.9
-6.3
-1.9
-40.9
-7.8
14.9
-3.8
-30.8
-5.5
18.9
-1.3
0.0
-5.4
-5.1
-5.2
-5.3
-7.7
-12.7
-8.6
-16.2 -4.2 -22.9 -31.0 -18.2 -27.7
22.7
618.3
139.7
758.0
25.4
1.4 -4.2 -1.9 -9.5 -9.6 n.a. 297.55
-2.9 -2.6 -3.7 -4.3 -6.8 n.a. 1,087.05
1. Average of Wednesdays. Data are adjusted for breaks caused by reclassifications.2. Loans at foreign branches are loans made to U.S. firms-by foreign branches of
domestically chartered banks.3. Consists of acceptances that finance U.S. imports, U.S. exports, and domestic
shipment and storage of goods. Based on average of data for current and precedingends of month.
4. Based on average of data for current and preceding ends of month.5. April 1992 data.p--Preliminary.n.a.--Not available.
Category
2,863.5
773.4
598.9
174.5
2,090.1
602.2
881.1
359.7
61.8
185.3
SELECTED FINANCIAL MARKET QUOTATIONS(percent)
1989 1992 1992 Change from:March - - --- - - - - - - -- - - -
Marchhighs
Short-term rates
FOMC Dec-JanMay 19 Lows Jun 25
Mar 89 Dec-Janhighs Lows
FOMCMay 19
Federal funds 2
Treasury bills3
3-month6-month1-year
Commercial paper1-month3-month
Large negotiable CDs3
1-month3-month6-month
Eurodollar deposits1-month3-month
Bank prime rate
9.85
9.10
9.119.05
10.0510.15
10.0710.3210.08
10.1910.50
11.50
3.80 3.94 3.72
3.543.623.81
3.723.763.81
-6.13 -0.22 -0.08
3.623.703.88
-5.48-5.41-5.17
3.81 4.01 3.873.82 3.94 3.88
3.743.753.85
3.953.893.89
-0.10-0.060.07
0.080.080.07
-6.18 -0.14 0.06-6.27 -0.06 0.06
3.813.833.90
-6.26-6.49-6.18
3.75 3.94 3.753.81 3.88 3.81
6.50 6.50 6.50
-0.14-0.060.01
0.070.080.05
-6.44 -0.19 0.00-6.69 -0.07 0.00
-5.00 0.00 0.00
Intermediate- and long-term rates
U.S. Treasury (constant maturity)3-year 9.8810-year 9.5330-year 9.31
Municipal revenue(Bond Buyer)
Corporate--A utilityrecently offered
Home mortgage rates 6
FHLMC 30-yr. FRMFHLMC 1-yr. ARM
7.95
10.47
11.229.31
6.70 6.53 6.58
8.60 8.46 8.64
8.64 8.23 8.485.97 5.79 5.86
-1.37 0.05 -0.12
-1.83 0.18 0.04
-2.74 0.25 -0.16-3.45 0.07 -0.11
1989 1992 Percent change from:
Record Lows FOMC Record 1989 FOMChighs Date Jan 3 May 19 Jun 25 highs lows May 19
Stock prices
Dow-Jones Industrial 3413.21 6/1/92 2144.64 3397.99 3284.01 -3.79 53.13 -3.35NYSE Composite 231.85 1/15/92 154.00 229.32 221.53 -4.45 43.85 -3.40AMEX Composite 418.99 2/12/92 305.24 392.37 374.15 -10.70 22.58 -4.64NASDAQ (OTC) 644.92 2/12/92 378.56 578.05 548.20 -15.00 44.81 -5.16Wilshire 4121.28 1/15/92 2718.59 4025.84 3873.33 -6.02 42.48 -3.79
..............................................................................................
1/ One-day quotes except as noted.2/ Average for two-week reserve maintenance period
closest to date shown. Last observation is averagefor maintenance period ending June 24. 1992.
3/ Secondary market.4/ Bid rates for Eurodollar
deposits at 11 a.m. London time.5/ Based on one-day Thursday quotes
and futures market index changes6/ Quotes for week ending
Friday previous to date shown.
5.597.207.77
5.056.717.39
5.417.147.78
-4.47-2.39-1.53
0.360.430.39
-0.18-0.060.01

-10-
THE INTERNATIONAL ECONOMY
Prices of Exports and Non-oil Imports
In May, prices of non-oil imports fell for the third
consecutive month, the result of declines in prices of imports of
foods, feeds, and beverages, automotive products, and capital goods.
The three consecutive months of declining prices of non-oil imports
follow six consecutive months of increase and likely reflect a
lagged adjustment to the rise in the exchange value of the dollar in
the first quarter.
Prices of exports increased 0.3 percent in May, with prices of
nonagricultural exports rising 0.5 percent. Prices of exports of
industrial supplies and consumer goods posted the largest increases
in May. Prices of exports of industrial supplies have risen for
four consecutive months, paced by increases in prices of exports of
building materials.

-11-
IMPORT AND EXPORT PRICE MEASURES(percent change from previous period, annual rate)
Year Quarters Months1992-Q1 1991 1992 19921991-01 Q3 Q4 Q1 Apr May
(Quarterly Average, AR) (Monthly Rates)
--------------------- BLS Prices---------------------
Imports, Total -1.9 -3.5 5.2 -1.5 -0.2 0.3Foods, Feeds, Bev. 3.2 -3.5 3.7 10.1 -3.4 -2.5Industrial Supplies -10.0 -6.7 3.1 -15.7 1.1 1.9
Ind Supp Ex Oil* -2.9 -7.3 -4.3 4.8 0.0 0.0Capital Goods 0.2 -4.4 6.5 4.6 -0.7 -0.1Automotive Products 2.0 -1.0 7.4 0.7 -0.6 -0.3Consumer Goods 1.5 -0.6 5.1 6.2 -0.4 0.3
Memo:Oil -22.8 -5.9 19.5 -46.5 4.1 6.2Non-oil 0.6 -3.2 3.9 4.5 -0.7 -0.2
Exports, Total -0.6 -2.5 2.5 -1.3 -0.2 0.3Foods, Feeds, Bev. 4.3 -5.8 17.6 -1.2 -2.2 -0.1Industrial Supplies -7.4 -8.0 -3.0 -6.4 0.5 0.9Capital Goods 2.0 1.6 2.2 0.6 -0.1 0.1Automotive Products 2.2 2.1 3.0 1.6 0.1 0.1Consumer Goods 3.0 -2.3 2.5 5.9 0.3 0.6
Memo:Agricultural 1.1 -8.5 10.8 -3.3 -1.8 0.2Nonagricultural -1.1 -1.8 1.2 -1.1 0.2 0.5
------------- Prices in the NIPA Accounts------------
Fixed-WeightImports, Total -1.8 -1.4 4.0 -0.4
Oil -24.7 -1.2 22.0 -49.4Non-oil 1.0 -1.4 2.5 6.2
Exports, Total -0.2 -3.6 2.6 1.8Ag 1.3 -9.1 11.6 -5.1Nonag -0.4 -2.9 1.9 2.6
DeflatorsImports, Total -3.4 -2.9 4.0 -3.2
Oil -24.8 -1.5 21.7 -49.4Non-oil -0.9 -3.2 1.9 2.9
Exports, Total -1.5 -3.9 0.7 -0.0
Ag -1.7 -6.3 6.3 -6.1Nonag -1.5 -3.9 0.3 0.5
*/ Months not for publication.

STRICTLY CONFIDENTIAL (FR)CLASS II FOMC
BOARD OF GOVERNORS OF THE FEDERAL RESERVE SYSTEMDIVISION OF RESEARCH AND STATISTICS
Date: June 26. 1992
To: The Federal Open Market Committee
From: Michael Prell
Subject: Greensheets
Attached are revised Greensheets that incorporate the
revised NIPA data and show projections in which the levels have
been adjusted for the differences between the preliminary and
final first-quarter estimates.

Strictly Confidential (FR)Class II FOMC
STAFF PROJECTIONS OF CHANGES IN GDP, PRICES, AND UNEMPLOYMENT(Percent, annual rate) June 26, 1992
Unenemploymentrate
GDP fixed-weight Consumer (level exceptNominal GDP Real GDP price index price index 1 as noted)
Interval 5/14/92 6/26/92 5/14/92 6/26/92 5/14/92 6/26/92 5/14/92 6/26/92 5/14/92 6/26/92
ANNUAL
19892 7.0 7.0 2.5 2.5 4.3 4.3 4.8 4.8 5.3 5.319902 5.1 5.1 1.0 1.0 4.3 4.3 5.4 5.4 5.5 5.519912 2.9 2.9 -. 7 -. 7 4.0 4.0 4.2 4.2 6.7 6.71992 4.5 4.5 1.9 1.9 2.8 2.8 3.3 3.3 7.1 7.21993 5.7 5.6 2.9 2.8 3.0 2.9 3.3 3.3 6.8 6.9
QUARTERLY
1990 012
Q22Q32
042
1991 012022Q32Q42
1992 012020304
1993 01020304
TWO-QUARTER 3
1990 022
Q42
1991 Q22Q42
1992 Q204
1993 Q2Q4
FOUR-QUARTER4
1989 Q421990 Q421991 Q42
1992 Q41993 Q4
1.71.6
.2-3.9
-2.51.41.8
.4
2.02.03.13.1
2.92.92.82.8
6.2 6.2 1.71.9 1.9 -1.8
3.5 3.5 -. 63.1 3.1 1.1
4.9 5.36.0 5.2
5.7 5,85.2 5.7
1.71.6
.2-3.9
-2.51.41.8
.4
2.72.02.32.7
2.82.93.13.2
1.7-1.8
-. 6 4.41.1 2.4
4.8 5.63.9 7.0
4.4 2.92.4 3.1
-.1 -.1.7 .7
.7 .7
.2 .2
.3 .4-. 2 -. 1
-. 2 -. 3-. 2 -. 2
2.9 2.9 3.13.2 3.2 2.7
1. For all urban consumers.2. Actual.3. Percent change frcm two quarters earlier, for unemployment rate, change In percentage points.4. Percent change from four quarters earlier, for unemployment rate, change in percentage points.

Strictly Confidential (FR)Class II FOMC
REAL GROSS DOMESTIC PRODUCT AND RELATED ITEMS,(Seasonally adjusted, annual rate)
ANNUAL VALUES
June 26, 1992
Projected
Item Unit1 1985 1986 1987 1988 1989 1990 1991 1992 1993
EXPENDITURES
Nominal GDPReal GDP
Real GDPGross domestic purchasesFinal salesPrivate dom. final purch.
Personal cons. expend.DurablesNondurablesServices
Business fixed invest.Producers' dur. equip.Nonres. structures
Res. structures
ExportsImports
Government purchasesFederal
DefenseState and local
Change in bus. invent.Nonfarm
Net exports
Nominal GDP
EMPLOYMENT AND PRODUCTION
Nonfarm payroll employ.Unemployment rate
Industrial prod. indexCapacity util. rate-mfg.
Housing startsAuto sales in U.S.
North American producedOther
INCOME AND SAVING
Nominal GNPNominal GNPNominal personal incomeReal disposable incomePersonal saving rate
Corp. profits, IVA&CCAdjProfit share of GNP
Federal surpl./def.State/local surpl./def.
Ex. social ins. funds
PRICES AND COSTS
GDP implicit deflatorGDP fixed-wt. price indexGross domestic purchases
fixed-wt. price indexCPIEx. food and energy
ECI, hourly compensation2
Nonfarm business sector
Output per hour
Compensation per hourUnit labor cost
Bill. $Bill. 87$
% change
Bill. 87$
% change
Millions%
%change
Millions
Bill. $% change
% change
Bill. $
% change
4038.7 4268.64279.8 4404.5
3.3
3.83.83.9
4.06.32.74.2
3.12.24.6
4.3
-. 3
5.2
5.96.47.05.4
22.119.8
-145.3
7.0
97.5
7.2
1.979.5
1.74
11.048.202.84
4053.66.86.61.96.5
9.06.9
-181.456.19.2
3.63.6
3.53.54.3
3.9
.74.73.9
2.22.13.33.0
4.012.5
3.32.5
-5.7-.7
-14.111.1
9.96.7
4.13.83.74.4
8.610.6
-155.1
4.7
99.57.0
1.479.0
1.8111.458.223.24
4277.84.45.52.86.0
-7.16.4
-201.154.31.5
2.62.5
2.31.33.9
3.2
1.24.63.4
4539.94540.0
4.53.92.71.9
2.1-2.61.43.7
3.02.44.4
-3.1
12.64.7
3.33.74.52.9
26.332.7
-143.0
8.0
102.26.2
6.581.4
1.6210.247.073.18
4544.58.17.42.14.3
29.77.0
-151.840.1
-14.7
4900.44718.6
3.32.54.24.2
4.28.53.23.7
5.59.1
-1.2.9
13.53.6
.2-3.4-3.22.9
19.926.9
-104.0
7.7
105.55.5
4.583.9
1.4910.637.543.09
4908.27.87.13.34.4
10.27.4
-136.638.4
-18.4
5244.04836.9
1.71.01.5.6
1.2-. 8
..8
2.0
.5-. 11.7
-7.7
10.92.7
1.6-1.2-2.03.6
32.633.3
-75.7
5.9
108.35.3
1.183.9
1.389.917.09
2.83
5248.25.96.71.44.4
-11.56.7
-124.241.1
-19.2
3.3 4.2 4.23.4 4.2 4.2
3.9 4.1 4.24.5 4.3 4.64.3 4.5 4.4
3.3 4.8 4.8
5513.8 5672.64884.9 4848.8
-. 1 .3-. 9 .11.2 -.5-.3 -.5
.3 .6-2.7 -2.8-1.0 --91.9 2.2
.6 -7.13.1 -3.7-4.6 -14.7-11.8 -.9
7.6 6.8-. 4 4.6
3.2 -1.62.3 -3.1.8 -4.7
3.8 -.5
.2 -13.9-1.5 -13.9-51.4 -20.9
4.1 3.3
109.85.. 5
.382.3
1.199.516.902.60
5524.64.36.51.05.1
-11.55.8
-165.325.7
-38.1
4.24.4
5.16.35.3
4.6
108.36.7
-. 5
78.2
1.018.396.142.25
5685.83.02.7.5
5.2
6.65.4
-201.630.0
-35.3
3.03.4
2.63.04.5
4.4
.5 -1.5 .4 1.33.8 3.0 6.5 3.33.3 4.6 6.0 2.1
5928.44942.0
2.52.72.33.3
2.86.21.82.5
5.28.1-1.87.0
4.05.8
-.4-1.5-4.5
.3
1.61.0
-28.6
5.3
108.67.2
3.078.2
1.228.496.312.19
5948.45.45.02.35.0
24.36.3
-282.247.1
-18.7
2.82.9
3.03.53.7'
3.8
6259.95079.5
3.03.12.63.5
2.85.82.02.6
5.67.7-. 18.6
6.76.8
-.8-4.1-6.9
1.4
27.3
25,4-34.9
5.8
110.46.9
4.079.5
1.349.166.932.24
6283.15.86.43.15.1
7.76.5
-257.760.9-6.6
2.62.9
2.83.13.2
3.5
1.8 1.53.4 3.71.6 2.2
1. Percent changes are from fourth quarter to fourth quarter.II
2. Private-industry workers.

Strictly Confidential (FR)Class II FOMC
REAL GROSS DOMESTIC PRODUCT AND RELATED ITEMS, QUARTERLY VALUES(Seasonally adjusted, annual rate except as noted) June 26, 1992
1989 1990 1991
Item Unit Q1 Q2 Q3 Q4 Q1 Q2 Q3 Q4 Q1 Q2
EXPENDITURES
Nominal GDPReal GDP
Real GDPCross domestic purchasesFinal salesPrivate dom. final purch.
Personal cons. expend.DurablesNondurablesServices
Business fixed invest.Producers' dur. equip.Nonres. structures
Res. structures
ExportsImports
Government purchasesFederalDefense
State and local
Change in bus. invent.Nonfarm
Net exports
Nominal GDP
EMPLOYMENT AND PRODUCTION
Nonfarm payroll employ.Unemployment ratel
Industrial prod. indexCapacity util. rate-mfg. 1
Housing startsAuto sales in U.S.
North American producedOther
INCOME AND SAVING
Nominal GNPNominal GNPNominal personal incomeReal disposable incomePersonal saving rate 1
Corp. profits, IVA&CCAdj:Profit share of GNPI
Federal govt. surpl./def.State/local surpl./def.
Ex. social ins. funds
PRICES AND COSTS
GDP implicit deflatorGDP fixed-wt. price index
Cross domestic purchasesfixed-wt. price index
CPIEx. food and energy
ECI, hourly corpensation2
Nonfarm business sectorOutput per hourCompensation per hourUnit labor cost
Bill. $Bill. 87$
% change
Bill. 87$
% change
Millions
t change
Millions
Bill. $t change
t change
Bill. $
* change
1. Not at an annual rate.
5139.9 5218.5 5277.3 5340.4 5422.4 5504.7 5570.5 5557.5 5589.0 5652.64809.8 4832.4 4845.6 4859.7 4880.8 4900.3 4903.3 4855.1 4824.0 4840.7
2.5 1.9 1.1 1.2 1.7 1.6 .2 -3.9 -2.5 1.4.7 1.1 1.7 .3 .6 1.3 1.3 -6.5 -3.5 .9.8 2.1 2.7 .4 4.6 -.5 .9 -.3 -2.4 1.2
-.4 .4 3.1 -.7 2.7 -1.5 2.5 -4.7 -4.8 .8
-.2 1.0 4.1 .1 2.1 .0 2.8 -3.5 -1.3 1.4-5.0 5.9 13.8 -15.5 16.7 -11.8 1.5 -14.0 -11.9 -1.8
.1 -1.4 3.1 1.5 -.3 -1.5 1.3 -3.4 -.3 .9
.8 1.2 2.3 3.6 .3 4.1 4.1 -.9 .7 2.5
.9 2.7 .8 -2.5 7.1 -4.6 8.5 -7.7 -17.4 -3.3-1.0 7.3 -2.5 -3.9 6.4 -3.2 11.5 -1.6 -18.1 .04.9 -6.2 8.0 .4 8.5 -7.3 2.5 -19.7 -15.7 -10.3
-5.9 -11.9 -5.6 -7.3 .6 -15.7 -16.2 -15.0 -24.8 3.1
12.4 17.2 .9 13.7 8.8 4.8 -. 4 17.7 -7.4 19.4-6.1 6.9 6.8 4.0 -2.5 1.7 9.6 -9.3 -15.4 13.3
-3.4 5.2 4.1 .7 6.4 2.2 -.3 4.6 2.8 -.1-9.5 7.9 5.1 -7.2 5.9 4.3 -5.0 4.5 9.9 1.0-12.8 5.6 10.1 -9.2 2.3 3.3 -7.9 5.9 10.9 -3.3
1.3 3.4 3.3 6.6 6.7 .8 3.2 4.6 -1.9 -.7
41.2 38.9 20.2 30.0 -4.0 22.1 13.9 -31.2 -32.8 -30.435.8 33.4 25.9 38.1 -5.5 15.5 9.9 -25.7 -31.1 -30.8
-81.2 -71.9 -79.8 -70.0 -56.0 -52.5 -65.7 -31.2 -18.6 -12.3
7.8 6.3 4.6 4.9 6.3 6.2 4.9 -.9 2.3 4.6
107.7 108.2 108.5 109.0 109.8 110.2 109.9 109.3 108.6 108.2
5.2 5.2 5.3 5.4 5.2 5.3 5.6 6.0 6.5 6.7
2.7 2.8 -1.2 .2 .6 4.2 3.9 -7.0 -9.7 2.684.7 84.5 83.7 82.9 82.7 82.8 82.9 80.8 78.0 77.9
1.49 1.36 1.35 1.34 1.46 1.20 1.13 1.03 .92 1.0010.03 10.26 10.20 9.09 9.92 9.53 9.60 9.00 8.33 8.43
7.08 7.26 7.36 6.56 7.12 6.82 7.08 6.60 6.09 6.112.95 3.00 2.84 2.53 2.80 2.71 2.51 2.39 2.25 2.32
5144.3 5217.7 5279.8 5350.9 5432.7 5505.5 5576.8 5583.2 5611.7 5660.67.3 5.8 4.8 5.5 6.3 5.5 5.3 .5 2.1 3.5
10.8 4.5 3.7 7.8 9.8 6.6 5.7 3.9 .3 4.53.6 -2.6 1.9 3.0 4.5 1.6 .2 -2.0 -1.7 2.65.2 4.3 3.7 4.4 4.9 5.4 4.8 5.2 5.1 5.4
-12.2 -5.6 -16.6 -11.4 6.7 -.5 -39.4 -4.8 8.4 1.97.1 6.9 6.5 6.3 6.3 6.2 5.4 5.3 5.4 5,4
-114.5 -110.5 -128.4 -143.3 -160.8 -156.9 -149.7 -193.6 -146.4 -206.742.4 45.1 42.6 34.4 30.3 28.5 26.1 18.0 20.4 27.6
-16.4 -14.8 -18.3 -27.4 -32.2 -34.9 -38.2 -46.9 -44.7 -38.0
-3.3 -2.0 -.22.9 1.3 3.66.5 3.3 3.8
2. Private-industry workers.
4.7 3.24.8 3.2
5.0 5.87.0 6.95.9 4.2
4.7 3.8
2.7 -1.2 .28.9 7.1 4.86.1 9.4 4.6

Strictly Confidential (FR)Class II FOMC
REAL GROSS DOMESTIC PRODUCT AND RELATED ITEMS, QUARTERLY VALUES(Seasonally adjusted, annual rate except as noted) June 26, 1992
Projected
1991 1992 1993
Item Units Q3 Q4 Q1 Q2 Q3 Q4 Q1 Q2 Q3 Q4
Bill. $Bill. 87$
Real GDPGross domestic purchasesFinal salesPrivate don. final purch.
Personal cons. expend.DurablesNondurablesServices
Business fixed invest.Producers' dur. equip.Nonres. structures
Res. structures
ExportsImports
Government purchasesFederal
DefenseState and local
Change in bus. invent.Nonfarn
Net exports
Nominal GDP
EMPLOYMENT AND PRODUCTION
Nonfarm payroll employ.Unenployment rateI
Industrial prod. indexCapacity util. rate-mfg
Housing startsAuto sales in U.S.North American producedOther
INCOME AND SAVING
Nominal GNPNominal GNPNominal personal incomeReal disposable incomePersonal saving rateI
Corp. profits. IVA&CCAdJProfit share of GNPI
Federal govt. surpl./def.State/local surpl./def.
Ex. social ins. funds
PRICES AND COSTS
GDP implicit deflatorGDP fixed-wt. price index
Gross domestic purchasesfixed-wt. price index
CPIEx. food and energy
ECI, hourly compensation2
Nonfarm business sectorOutput per hourCompensation per hourUnit labor cost
I change
Bill. 87$
i change
Millions
I change
Millions
Bill. $t change
* change
a1. S
a change
EXPENDITURES
Nominal GDPReal GDP
1.7 3.12.1 3.3
2.2 3.03.6 2.93.7 3.9
4.0 4.0
1.7 1.33.5 2.21.7 .9
2.7 2.5 2.8 3.2 2.52.7 2.8 2.9 3.4 2.7
3.0 3.3 2.9 3.1 2.73.6 4.1 3.4 3.0 3.1
4.0 3.5 3.4 3.3 3.2
3.8 3.7 3.7 3.6 3.5
1.3 1.7 1.43.7 3.7 4.02.4 2.0 2.6
1.5 1.63.6 3.62.1 2.0
1. Not at an annual rate. 2. Private-industry workers.
5709.2 5739.7 5820.6 5890.2 5960.7 6042.1 6132.3 6215.8 6301.9 6389.84862.7 4868.0 4900.9 4925.6 4953.9 4987.6 5022.5 5059.0 5097.9 5138.6
1.8 .4 2.7 2.0 2.3 2.7 2.8 2.9 3.1 3.23.4 -.4 2.6 2.8 2.6 2.7 2.9 3.0 3.2 3.1-.7 -.2 4.8 .5 1.8 2.3 2.3 2.5 2.8 3.11.9 .1 5.1 1.9 2.7 3.4 3.3 3.4 3.6 3.6
2.3 .0 5.0 1.0 2.3 2.8 2.8 2.8 2.8 2.99.5 -5.7 15.9 -1.0 4.2 6.5 5.9 5.9 5.5 5.9.0 -3.9 5.3 -.8 1.1 1.7 1-9 2-0 2.0 2.0
2.2 3.7 2.5 2.5 2.5 2.5 2.5 2.6 2.6 2.6
-3.7 -3.4 3.1 6.4 5.9 5.4 5.4 5.3 5.9 5.96.7 -1.6 3.5 10.6 9.6 8.6 8.3 7.7 7.5 7.4
-23.9 -7.8 2.5 -3.6 -3.1 -2.8 -2.1 -1.2 1.4 1.810.9 12.3 11.7 5.9 1.6 9.2 6.4 7.2 11.4 9.4
7.3 9.7 2.5 3.0 4.8 5.7 6.3 6.7 6.9 7.022.3 2.1 1.5 9.5 6.9 5.4 6.6 7.1 7.5 5.8
-3.4 -5.4 2.9 -1.4 -.9 -2.3 -1.9 -1.0 -.3 .1-8.1 -13.6 1.1 -.6 -.9 -5.4 -5.1 -4.4 -3.8 -3.0-8.9 -15.7 -3.4 -3.7 -2.4 -8.6 -8.3 -7.3 -6.5 -5.3-.1 .8 4.1 -1.8 -1.0 -.1 .4 1.3 1.9 2.1
.1 7.6 -26.6 1.4 8.2 13.2 20.3 26.0 30.3 32.6-2.8 9.2 -16.3 .8 7.3 12.0 18.7 24.3 28.3 30.4
-31.1 -21.3 -20.1 -29.3 -32.6 -32.6 -33.5 -34.7 -36.3 -35.0
4.1 2.2 5.8 4.9 4.9 5.6 6.1 5.6 5.7 5.7
108.3 108.2 108.1 108.5 108.8 109.2 109.6 110.1 110.6 111.26.8 6.9 7.2 7.3 7.3 7.2 7.1 6.9 6.8 6.7
6.6 -.7 -2.8 5.8 4.2 5.0 4.7 4.2 3.7 3.578.7 78.2 77.3 78.1 78.4 78.9 79.3 79.4 79.6 79.8
1.04 1.10 1.26 1.17 1.22 1.26 1.29 1.32 1.36 1.398.60 8.19 8.28 8.41 8.55 8.73 8.90 9.07 9.25 9.436.31 6.06 6.03 6.25 6.40 6.55 6.70 6.85 7.00 7.152.29 2.13 2.25 2.16 2.15 2.18 2.20 2.22 2.25 2.28
5720.1 5750.7 5840.7 5908.6 5982.4 6062.7 6155.9 6238.5 6326.8 6411.24.3 2.2 6.4 4.7 5.1 5.4 6.4 5.5 5.8 5.42.7 3.5 5.3 4 4. 4 .4 6.1 7.4 5.9 5.9 6.4.3 .9 3.8 2.1 .6 2.7 3.8 2.7 2.6 3.1
5.0 5.2 5.0 5.3 4.9 4.9 5.1 5.1 5.0 5.1
3.5 13.0 60.8 14.9 8.8 18.8 7.3 8.6 3.4 11.65.4 5.5 6.1 6.2 6.3 6.5 6.5 6.5 6.5 6.6
-210.2 -243.1 -284.4 -292.2 -278.9 -273.3 -272.8 -263.6 -249.8 -244.831.8 40.3 38.9 44.5 51.2 53.8 58.1 59.0 63.0 63.5
-33.8 -24.8 -26.2 -21.1 -14.8 -12.6 -8.7 -8.2 -4.7 -4.8
2. Private-industry workers.1. Not at an annual rate.

Strictly Confidential (FR)Class II FOMC
NET CHANGES IN REAL GROSS DOMESTIC PRODUCT AND RELATED ITEMS 1(Billions of 1987 dollars) June 26, 1992
1989 1990 1991
Item Q1 Q2 Q3 Q4 Q1 Q2 Q3 Q4 Q1 Q2 1988 1989 1990 1991
Real CDOPGross domestic purchases
Final salesPrivate dom. final purch.
Personal cone. expend.DurablesNondurableaServices
Business fixed invest.Producers' dur. equip.Nonres. structures
Res. structures
change In bus. invent.NonfarmFarm
Net exportsExportsImports
Government purchasesFederal
DefenseNondefenee
State and local
30.1 32.6 13.2 14.1 21.1 19.5 3.0 -48.2 -31.1 16.78.6 13.3 21.1 4.3 7.1 16.0 16.2 -82.7 -43.7 10.4
9.8 25.0 31.9 4.3 55.1 -6,7 11.3 -3.1 -29.5 14.4-4.1 4,3 30.7 -7.0 27.0 -15.3 25.1 -48.0 -48.7 8.3
-2.0 7.7 32.5 .5-5.6 6,3 14.4 -18.7.3 -3.8 8.1 3.9
3.4 5.1 10.0 15.3
17.2 -.217.1 -14.0-.9 -4.11.1 17.8
1.2 3.6 1.1 -3.4 9.4-.9 6.4 -2.3 -3.6 5.72.1 -2.8 3.4 .2 3.7
-3.4 -6.9 -3.1 -4.0 .3
20.3 -2.3 -18.75.3 -2.4 -7.5
15.1 .0 -11.2
9.8 -34.012.2 -43.6-2.4 9.6
22.6 -29.41.6 -16.33.4 -9.0
17.7 -4.2
-6.4 11.2 -11.0-3.0 10.1 -1.5-3.4 1.1 -9.6-8.7 -8.6 -7.6
26.1 -8.2 -45.121.0 -5.6 -35.65.2 -2.7 -9.5
-10.7-13.2
-. 8
3.2
-25.4-18.2
-7.1-12.6
-1.6 2.4-5.4 .33.8 2.1
21.5 9.3 -7.9 9.8 14.0 3.5 -13.2 34.5 12.6,13.0 18.3 1.0 15.3 10.4 5.9 -.5 20.9 -10.0-8.5 8.9 9.0 5.4 -3.5 2.3 12.9 -13.7 -22.6
1.5-7.0-6.8-.2
8.5
14.15.41.63.78.8
-. 6-4.9-5.8
.94.3
6.323.216.9
-. 2
1.0-2.43.4
-1.0
154.2 80.0 -4.6120.9 47.3 -43.4
193.1 71.0 56.6158.3 23.9 -11.2
128.234.532.261.4
28.230.4-2.22.0
-39.0-31.6-7.4
33.352.118.8
1.5-13.2
-9.3-3.914.7
38.7-3.68.5
33.8
2.5-.42.9
-17.4
9.17.61.5
32.747.614.8
14.4-4.5-5.8
1.318.8
10.2-11.6-10.6
32.4
3.211.3-8.2
-24.6
-61.2-63.8
2.6
38.836.7-2.0
29.08.72.16.6
20.4
12.93.0
-26.0-21.3
19.3-11.8
-8.940.0
-38.9-13.9-25.0-1.6
38.834.9
3.9
9.935.525.6
-14.6-11.9-13.3
1.4-2.6
1. Annual changes are from Q4 to 04.

Strictly Confidential (FR)Class II FOMC
NET CHANGES IN REAL GROSS DOMESTIC PRODUCT AND RELATED ITEMS 1(Billions of 1987 dollars)
Projected
1991 1992 1993 Projected
Item Q1 Q4 Q1 Q2 Q3 Q4 Q1 Q2 Q3 Q4 1990 1991 1992 1993
Real GDPGross domestic purchase
Final salesPrivate dom. final purch.
Personal cons. expend.DurablesNondurablesServices
Businese fixed invest.Producers' dur. equip.Nonres. structures
Res. structures
Change in bus. invent.NonfarmFarm
Net exportsExportsImports
Government purchasesFederal
DefenseNondefense
State and local
5.3 32.9 24.7 28.4 33.7 34.9 36.6 38.9 40.7-4.5 31.7 33.9 31.7 33.6 35.8 37.7 40.5 39.5
,-3.3 57.2 6.7 21.6 28.7 27.8 30.9 34.6 38.4.7 49.3 19.0 27.1 33.9 33.0 34.2 36.9 37.0
40.2 8.4 18.8 22.8 22.9 23.8 23.6 24.215.5 -1.1 4.4 6.8 6.3 6.4 6.1 6.613.4 -2.1 2.9 4.4 5.0 5.3 5.3 5.311.3 11.5 11.4 11.5 11.6 12.1 12.2 12.3
-4.4 3.9 8.0 7.5 6.9 7.1-1.5 3.1 9.3 8.7 7.9 7.8-3.0 .9 -1.3 -1.1 -1.0 -.85.2 5.1 2.7 .8 4.2 3.1
18.0 6.817.1 6.5
.9 .3
5.0 7.14.7 6.7
.3 .4
-9.2 -3.3 .0 -.94.1. 6.6 8.0 8.9
13.3 9.9 8.0 9.9
-2.2-. 8-1.6
.8-1.4
-4.3-4.9-5.5
.7
.5
7.0 7.97.4 7.4-. 4 .53.5 5.5
5.7 4.35.6 4.0
.1 .3
-1.2 -1.6 1.29.6 10.0 10.310.8 11.6 9.1
-. 8-3.4-4.1
.72.6
.2-2.7-3.3
.62.9
30.5 7.5 -24.228.0 12.0 -25.52.5 -4.5 1.3
-18.8 9.8 1.29.5 12.8 3.428.3 3.0 2.2
-3.2-. 6
-2.51.9-2.6
-4.6 12.9 119.6 151.d-43.4 3.0 130.9 153.5
56.6 -26.0 114.1 131.6-11.2 -21.3 129.3 141.1
10.2-11.6-10.632.4
3.211.3-8.2
-24.6
-61.2-63.82.6
38.836.7-2.0
29.08.72.16.6
20.4
19.3-11.8-8.940.0
-38.9-13.9-25.0
-1.6
38.834.9
3.9
9.935.525.6
-14.6-11.9-13.3
1.4-2.6
90.1 94.425.7 25.418.6 20.845.8 48.1
26.3 30.029.0 30.1-2.6 -.112.8 16.7
5.62.82.8
-11.322.133.4
-4.0-5.5
-12.26.71.4
19.410.4
1.0
-2.5
38.941.4
-7.1-14.9-17.62.77.8
1. Annual changes are from Q4 to Q4.
33 0
S-8.618.4~:
18.8 -.19.4 -6.1-.1 -10.39.6 16.3
-4.85.8
-10.54,5
-12.8-13.8-11.7-2.1
1.1
June 26, 1992