Embed Size (px)
Citation preview
Prefatory Note
The attached document represents the most complete and accurate version available based on original copies culled from the files of the FOMC Secretariat at the Board of Governors of the Federal Reserve System. This electronic document was created through a comprehensive digitization process which included identifying the best-preserved paper copies, scanning those copies,1 and then making the scanned versions text-searchable.2 Though a stringent quality assurance process was employed, some imperfections may remain.
Please note that this document may contain occasional gaps in the text. These gaps are the result of a redaction process that removed information obtained on a confidential basis. All redacted passages are exempt from disclosure under applicable provisions of the Freedom of Information Act.
1 In some cases, original copies needed to be photocopied before being scanned into electronic format. All scanned images were deskewed (to remove the effects of printer- and scanner-introduced tilting) and lightly cleaned (to remove dark spots caused by staple holes, hole punches, and other blemishes caused after initial printing). 2 A two-step process was used. An advanced optimal character recognition computer program (OCR) first created electronic text from the document image. Where the OCR results were inconclusive, staff checked and corrected the text as necessary. Please note that the numbers and text in charts and tables were not reliably recognized by the OCR process and were not checked or corrected by staff.
CONFIDENTIAL (FR)CLASS III - FOMC
August 17, 1990
SUPPLEMENT
CURRENT ECONOMIC AND FINANCIAL CONDITIONS
Prepared for theFederal Open Market Committee
By the StaffBoard of Governors
of the Federal Reserve System
TABLE OF CONTENTS
THE DOMESTIC NONFINANCIAL ECONOMY
Consumer prices. . . . . . . . . . . . . .Housing starts . . . . . . . . . . . . . .Estimated revisions to second-quarter GNP.
Table
Private housing activity . . . . . . . . .
Chart
Private housing starts . . . . . . . . . . . . . . . . . .
THE FINANCIAL ECONOMY
The August 1990 senior loan officer opinion survey on banklending practices . . . . . . . . . . . . . . . . . . .
Tables
Percent of domestic respondent banks reporting tighteninglending standards/terms on nonmerger-related businesslending in the May-August period . . . . . . . . . . . .
Outstanding loans sold or participated to others bydomestic LPS respondents as of June 30, 1990 . . . . . .
Senior loan officer opinion survey on bank lendingpractices at selected large banks in the United States
Senior loan officer opinion survey on bank lendingpractices at selected branches and agencies offoreign banks in the United States . . . . . . . . . . .
Monetary aggregates . . . . . . . . . . . . . . . . . . .Commercial bank credit and short- and
intermediate-term business credit . . . . . . . . . . .
Selected financial market quotations . . . . . . . . . . .
THE INTERNATIONAL ECONOMY
U.S. merchandise trade . . . . . . . . .
Table
Merchandise trade: Census-based data. .
ERRATA . . . . . . . . . . . . . . . . . . .
22. . . . . . . . . 1. . . . . . . . . 2. . . . . . . . . 2
. . .. . . . 4
4
5
. . .. . 28
. . . . . . . . . . 3 0
SUPPLEMENTAL NOTES
THE DOMESTIC NONFINANCIAL ECONOMY
Consumer Prices
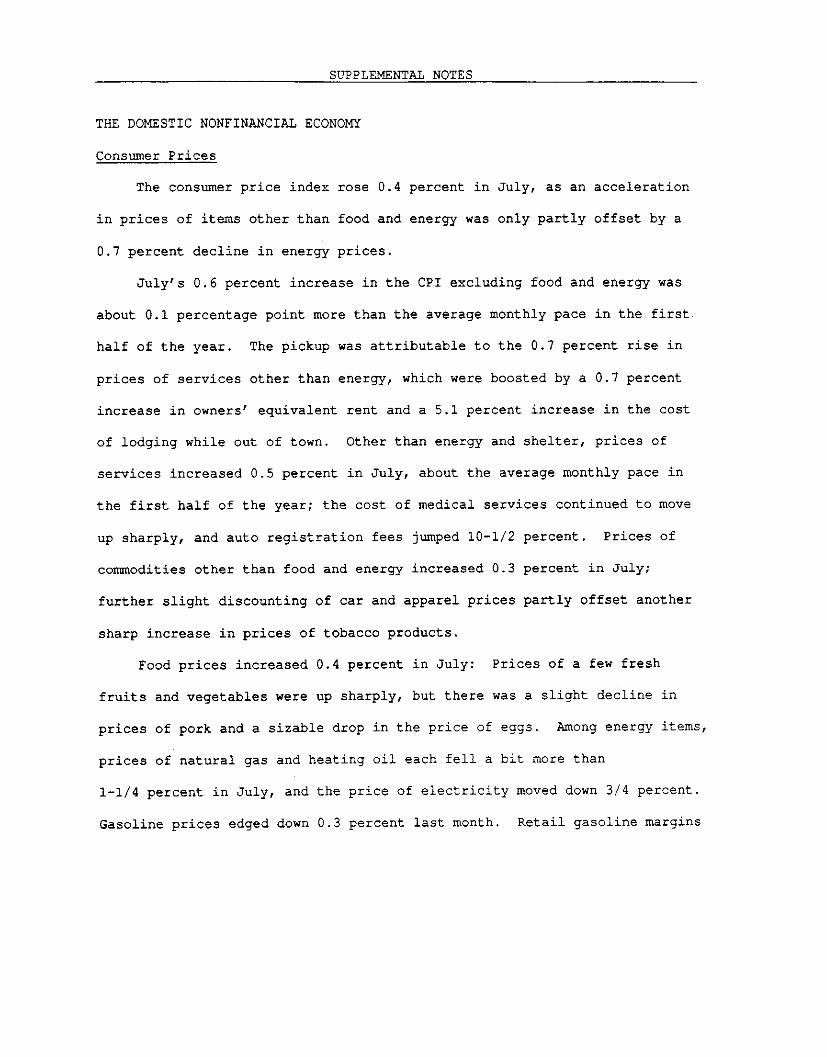
The consumer price index rose 0.4 percent in July, as an acceleration
in prices of items other than food and energy was only partly offset by a
0.7 percent decline in energy prices.
July's 0.6 percent increase in the CPI excluding food and energy was
about 0.1 percentage point more than the average monthly pace in the first
half of the year. The pickup was attributable to the 0.7 percent rise in
prices of services other than energy, which were boosted by a 0.7 percent
increase in owners' equivalent rent and a 5.1 percent increase in the cost
of lodging while out of town. Other than energy and shelter, prices of
services increased 0.5 percent in July, about the average monthly pace in
the first half of the year; the cost of medical services continued to move
up sharply, and auto registration fees jumped 10-1/2 percent. Prices of
commodities other than food and energy increased 0.3 percent in July;
further slight discounting of car and apparel prices partly offset another
sharp increase in prices of tobacco products.
Food prices increased 0.4 percent in July: Prices of a few fresh
fruits and vegetables were up sharply, but there was a slight decline in
prices of pork and a sizable drop in the price of eggs. Among energy items,
prices of natural gas and heating oil each fell a bit more than
1-1/4 percent in July, and the price of electricity moved down 3/4 percent.
Gasoline prices edged down 0.3 percent last month. Retail gasoline margins
-2-
had remained relatively high through June as stocks of gasoline were tight,
but in July the retail margin appears to have narrowed a bit.
Housing Starts
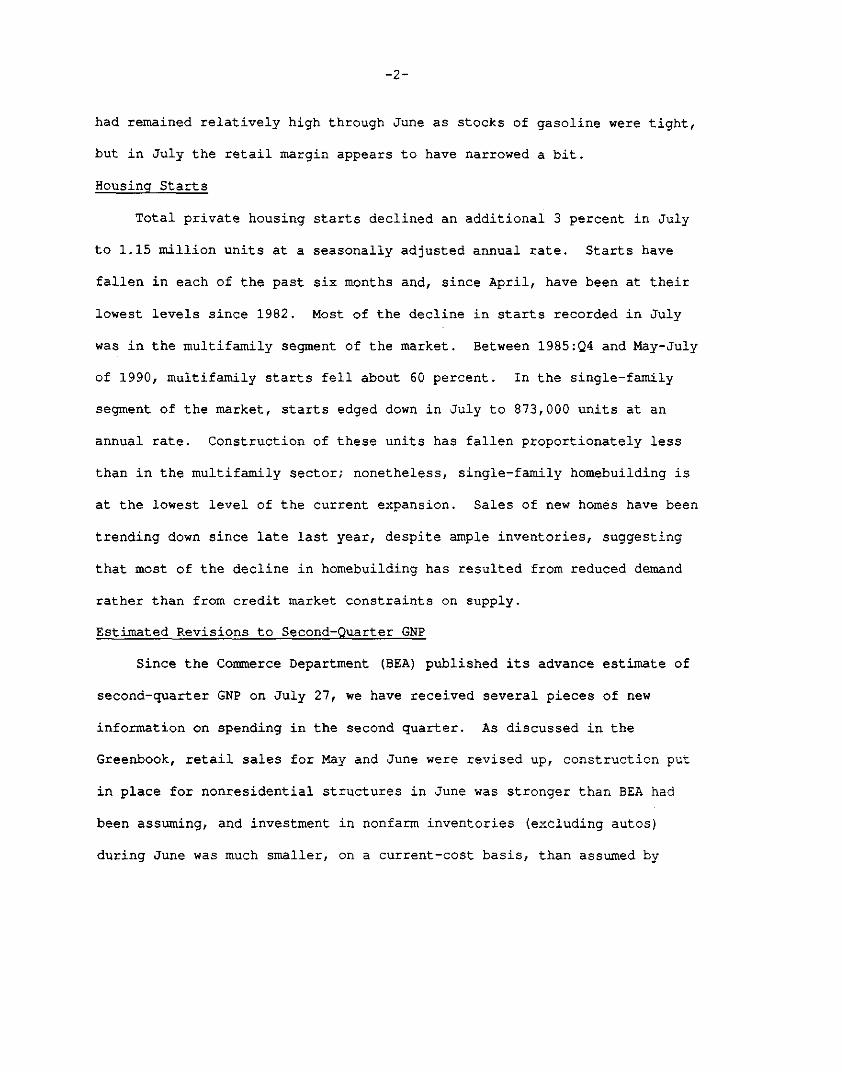
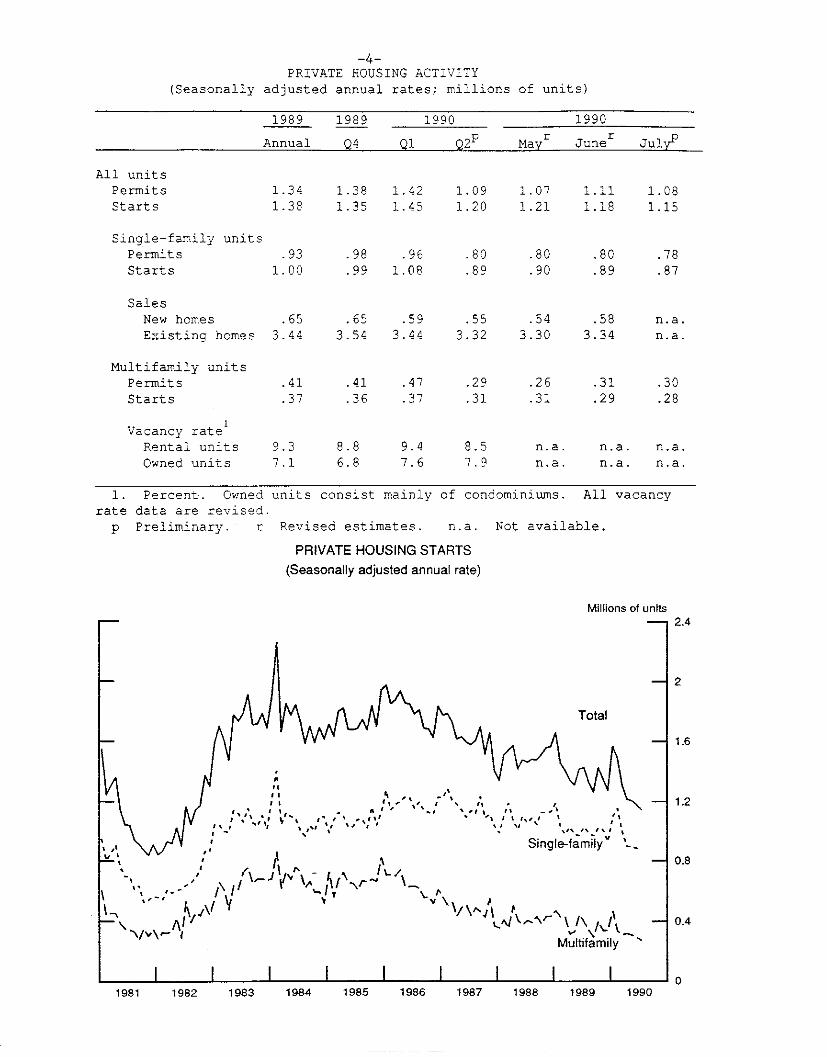
Total private housing starts declined an additional 3 percent in July
to 1.15 million units at a seasonally adjusted annual rate. Starts have
fallen in each of the past six months and, since April, have been at their
lowest levels since 1982. Most of the decline in starts recorded in July
was in the multifamily segment of the market. Between 1985:Q4 and May-July
of 1990, multifamily starts fell about 60 percent. In the single-family
segment of the market, starts edged down in July to 873,000 units at an
annual rate. Construction of these units has fallen proportionately less
than in the multifamily sector; nonetheless, single-family homebuilding is
at the lowest level of the current expansion. Sales of new homes have been
trending down since late last year, despite ample inventories, suggesting
that most of the decline in homebuilding has resulted from reduced demand
rather than from credit market constraints on supply.
Estimated Revisions to Second-Quarter GNP
Since the Commerce Department (BEA) published its advance estimate of
second-quarter GNP on July 27, we have received several pieces of new
information on spending in the second quarter. As discussed in the
Greenbook, retail sales for May and June were revised up, construction put
in place for nonresidential structures in June was stronger than BEA had
been assuming, and investment in nonfarm inventories (excluding autos)
during June was much smaller, on a current-cost basis, than assumed by
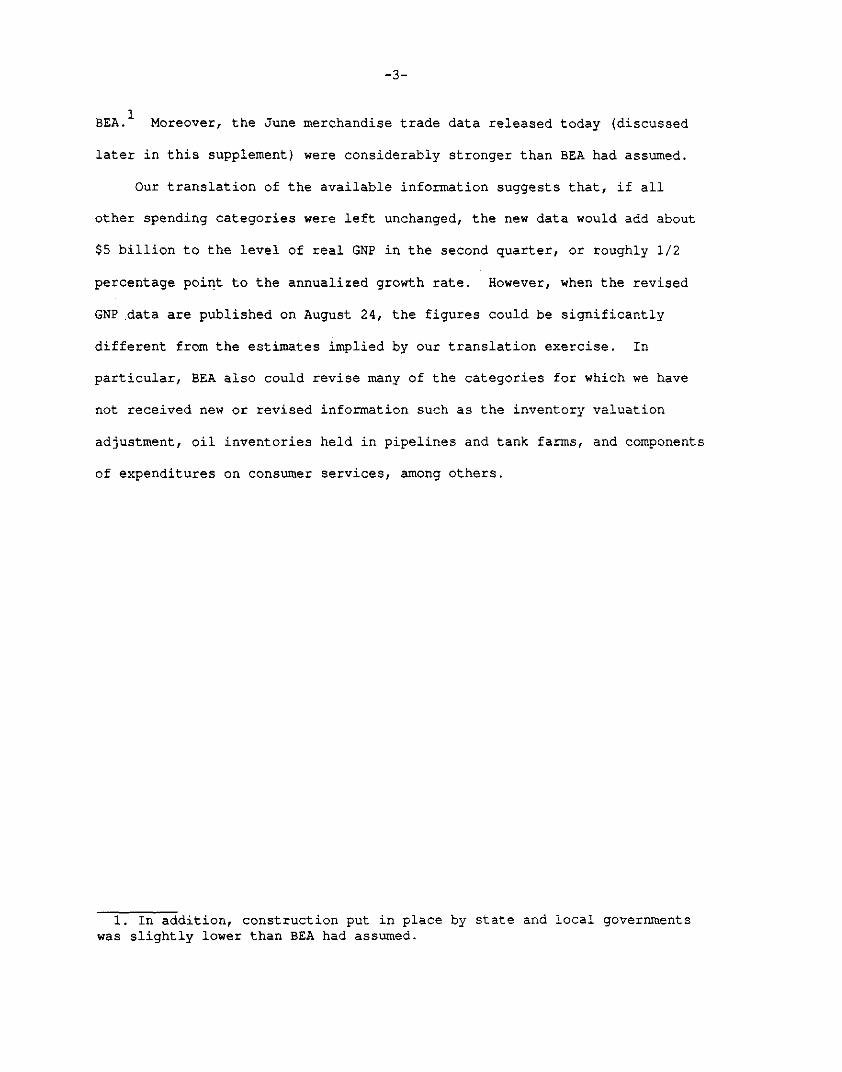
BEA. Moreover, the June merchandise trade data released today (discussed
later in this supplement) were considerably stronger than BEA had assumed.
Our translation of the available information suggests that, if all
other spending categories were left unchanged, the new data would add about
$5 billion to the level of real GNP in the second quarter, or roughly 1/2
percentage point to the annualized growth rate. However, when the revised
GNP data are published on August 24, the figures could be significantly
different from the estimates implied by our translation exercise. In
particular, BEA also could revise many of the categories for which we have
not received new or revised information such as the inventory valuation
adjustment, oil inventories held in pipelines and tank farms, and components
of expenditures on consumer services, among others.
1. In addition, construction put in place by state and local governmentswas slightly lower than BEA had assumed.
-4-PRIVATE HOUSING ACTIVITY
(Seasonally adjusted annual rates; millions of units)
1989 1989 1990 1990
Annual Q4 Q1 Q2P May r Juner July p
All unitsPermits 1.34 1.38 1.42 1.09 1.07 1.11 1.08Starts 1.38 1.35 1.45 1.20 1.21 1.18 1.15
Single-family unitsPermits .93 .98 .96 .80 .80 .80 .78Starts 1.00 .99 1.08 .89 .90 .89 .87
SalesNew homes .65 .65 .59 .55 .54 .58 n.a.Existing homes 3.44 3.54 3.44 3.32 3.30 3.34 n.a.
Multifamily unitsPermits .41 .41 .47 .29 .26 .31 .30Starts .37 .36 .37 .31 .31 .29 .28
Vacancy rateRental units 9.3 8.8 9.4 8.5 n.a. n.a. n.a.Owned units 7.1 6.8 7.6 7.9 n.a. n.a. n.a.
1. Percent. Owned units consist mainly of condominiums. All vacancyrate data are revised.p Preliminary. r Revised estimates. n.a. Not available.
PRIVATE HOUSING STARTS(Seasonally adjusted annual rate)
Millions of units
1981 1982 1983 1984 1985 1986 1987 1988 1989 1990
THE FINANCIAL ECONOMY
The August 1990 Senior Loan Officer Opinion Survey on Bank Lending Practices
The August Senior Loan Officer Opinion Survey on Bank Lending Practices
(LPS) examined changes in bank business lending policies since May. The
results, along with those from the May 1990 LPS, suggest that the weakness
in growth of commercial and industrial (C&I) loans this year owes in some
part to a reduced willingness on the part of banks to lend. The August
survey also addressed recent developments in the market for business loan
sales, the fifth annual survey of this market. The responses indicate that
earlier very rapid growth in this market has moderated and that some loan
quality problems have emerged. Commencing with this survey, 18 U.S.
branches and agencies of foreign banks have joined 60 domestically chartered
banks as LPS respondents.
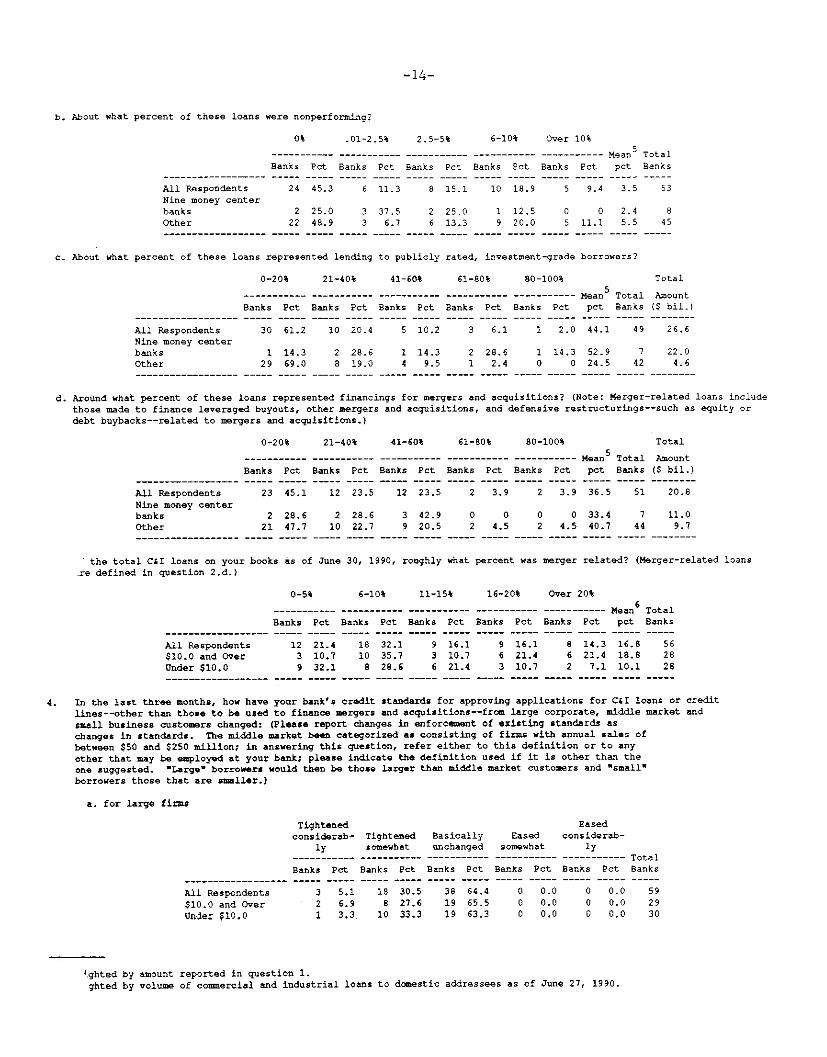
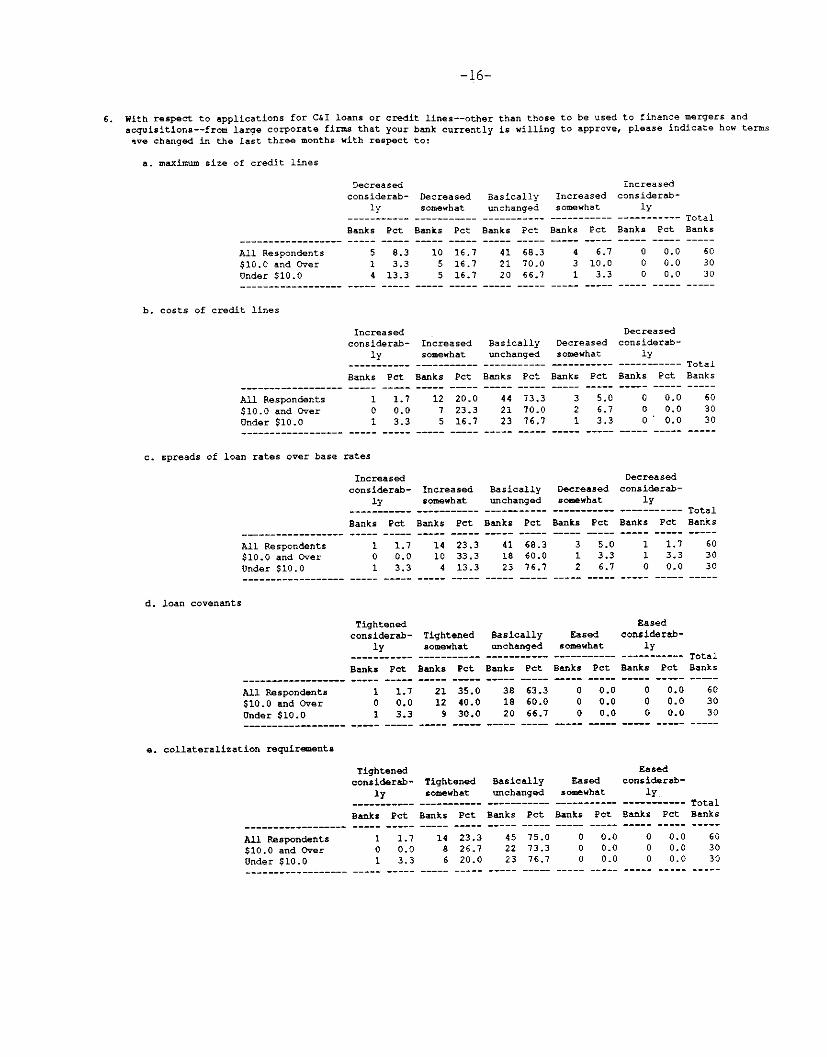
Changes in Banks' Lending Practices Since May
Business lending. Domestic respondent banks indicated that since May
they have further tightened lending standards and terms with respect to
nonmerger-related business loans.1 The tighter stance was particularly
noticeable for lending to middle market firms but was significant for larger
and smaller firms as well. With respect to approving loan applications for
nonmerger-related purposes, 43 percent of respondents indicated that they
had established more stringent standards for their middle market customers
and over a third reported tighter standards for both large and small
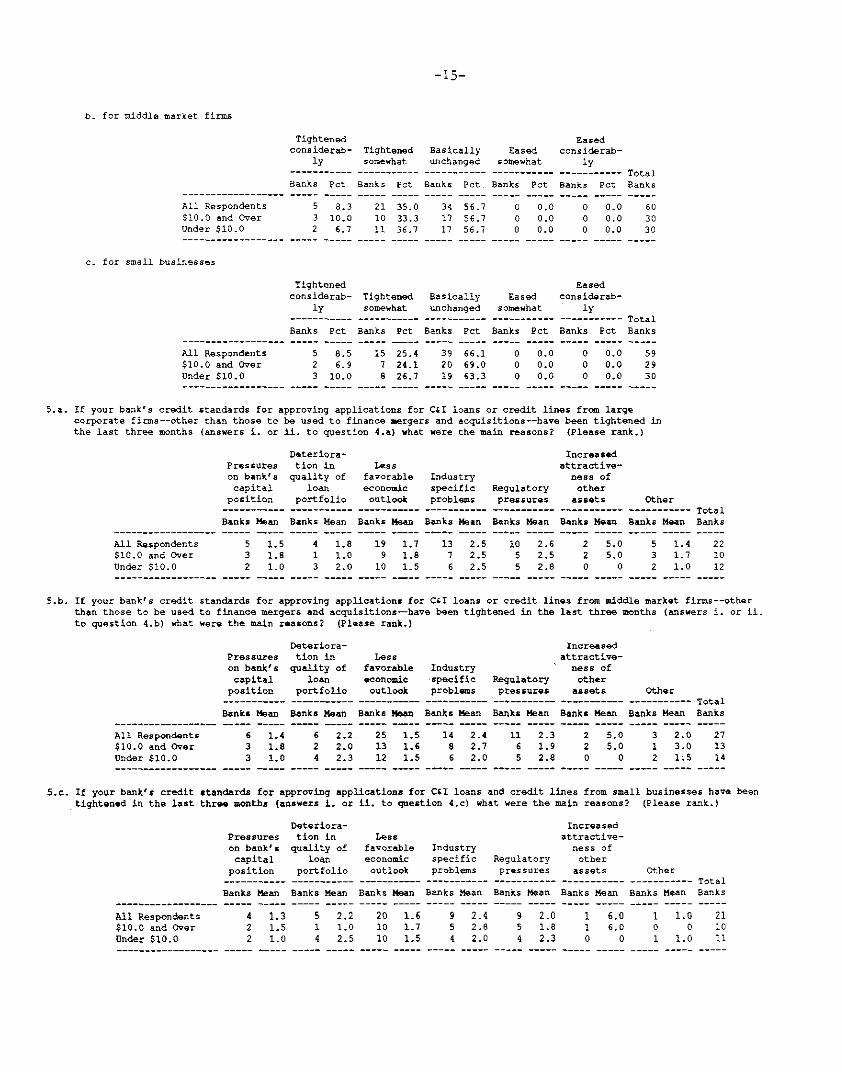
customer firms. As for terms on loans respondents actually are making, the
1. Changes in banks' willingness to make merger-related loans wereaddressed in the January 1990 Senior Loan Officer Opinion Survey. At thattime over 70 percent of respondents indicated that they had tightened theircredit standards for approving loan applications related to mergers andacquisitions compared to six months earlier.
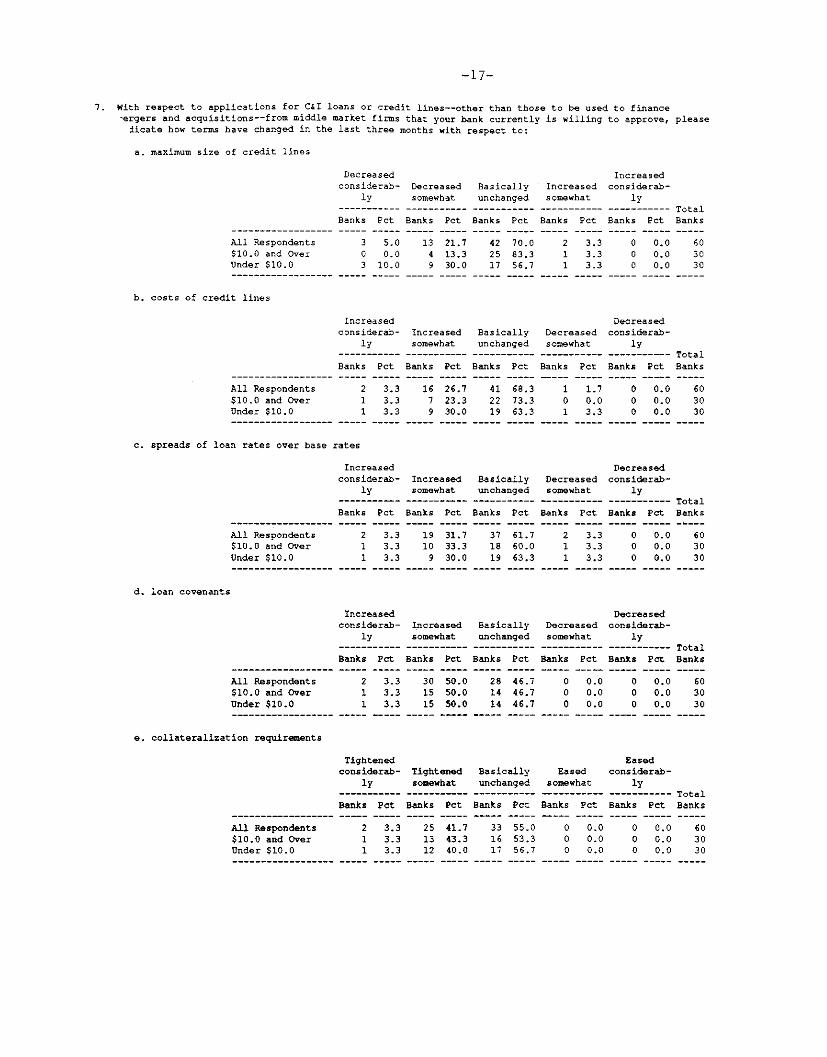
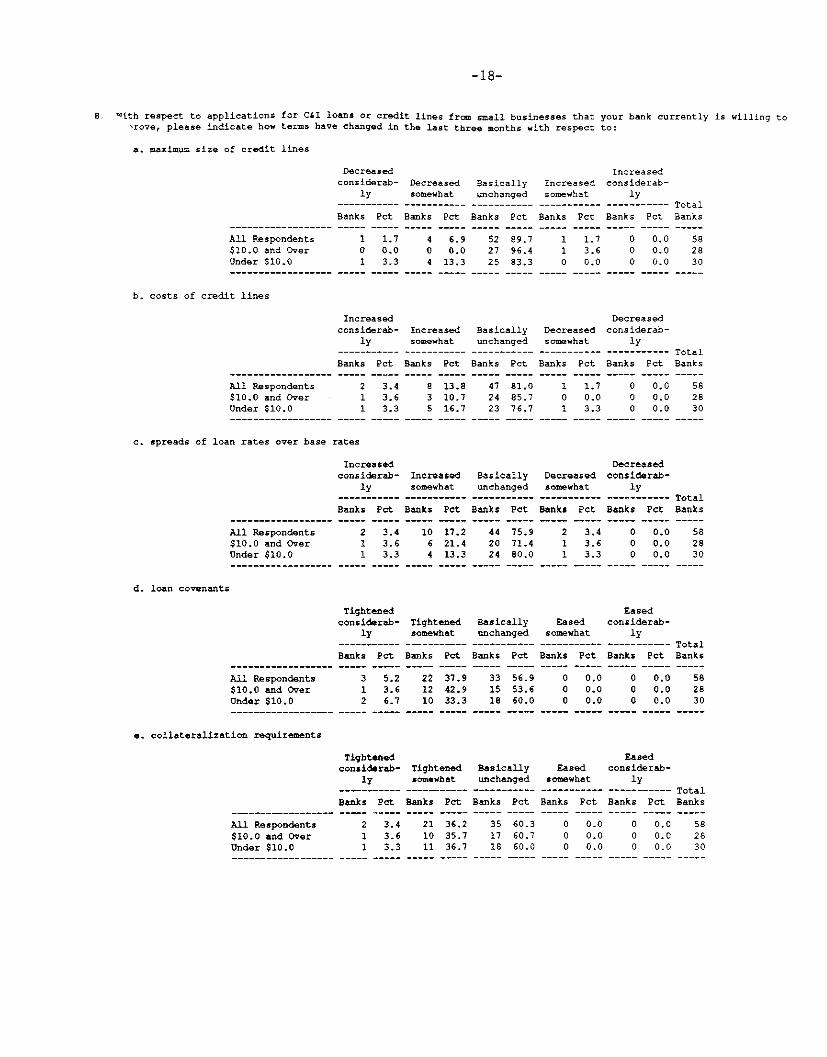
most noticeable area of tightening was with respect to loan covenants: 53
percent of domestic LPS banks reported tightening covenants for their middle
market customers and well over a third did so for their large borrowers. A
significant number of domestic respondents tightened in other ways as well,
including reducing the maximum size of credit lines and increasing their
cost, raising spreads of loan rates over base rates, and increasing
collateral requirements. These actions applied to borrowers of all sizes,
but again were somewhat more commonly reported for banks' middle market
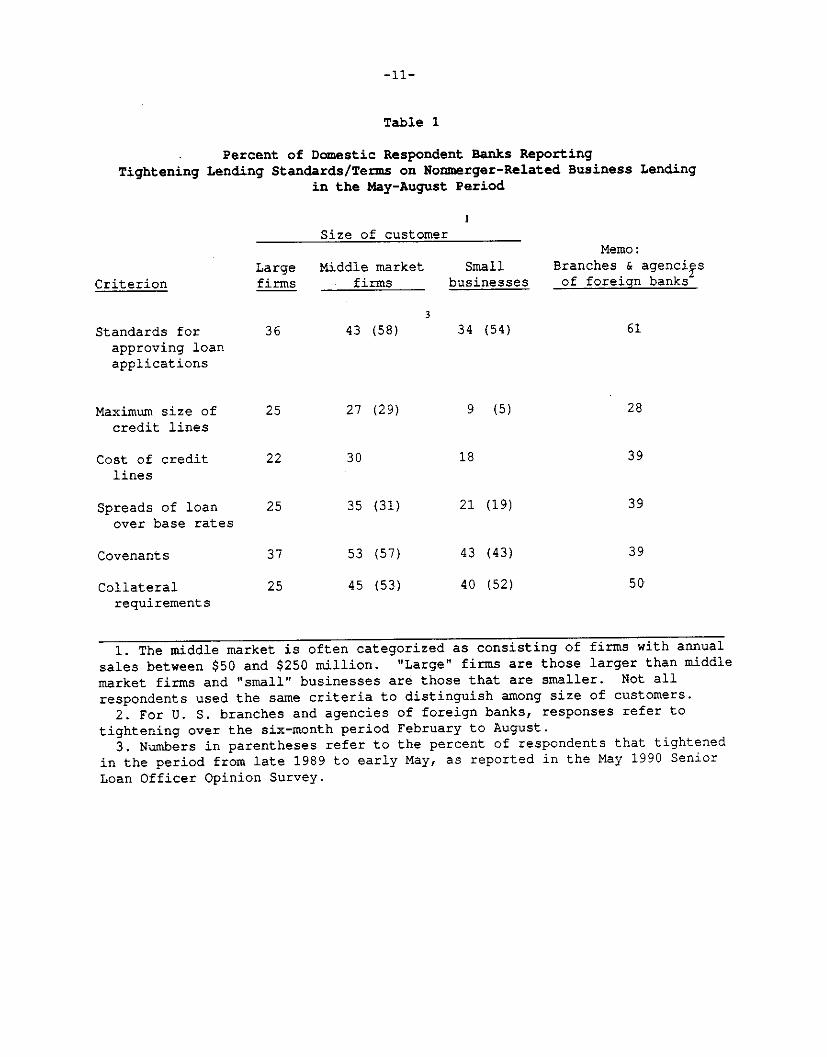
customers. As shown in table 1, for middle market and small firms, the
tightening of lending standards and terms over the last three months
followed a similar reported tightening over the early months of the year.
Branches and agencies of foreign banks reported that, on balance, they
too have moved to restrict the availability of business credit. Sixty
percent of these institutions reported that they had raised their standards
for approving nonmerger-related credit applications in the six months ending
with August. These banks also reported that they had tightened terms on
nonmerger-related C&I loans in the last six months. Over a quarter
restricted the maximum size of credit lines and between 40 and 50 percent
acted to increase the cost of credit lines, to raise loan rates relative to
base rates, to tighten covenants, and to increase collateral requirements
(table 1).
By far the most important reasons domestic respondents gave for
tightening their credit standards in the last three months were a less
1. See the May 1990 Senior Loan Officer Opinion Survey; this survey didnot address changes in bank lending practices with respect to respondents'large customers. However, the January Senior Loan Officer Opinion Surveyrevealed that very few banks at that time had moved to restrict nonmerger-related credit to their investment-grade customers.
favorable economic outlook and industry specific problems. Also important
were current pressures on banks' capital positions and capital pressures
anticipated to result from a deterioration in the quality of their loan
portfolios. Many banks also mentioned regulatory pressures. (Domestic
respondents provided similar motivations for the tightening that occurred
earlier in the year.) As for the tightening of lending standards at
branches and agencies of foreign banks, the reasons given were similar to
those provided by domestic reporters, although only one branch and agency
cited regulatory pressures.
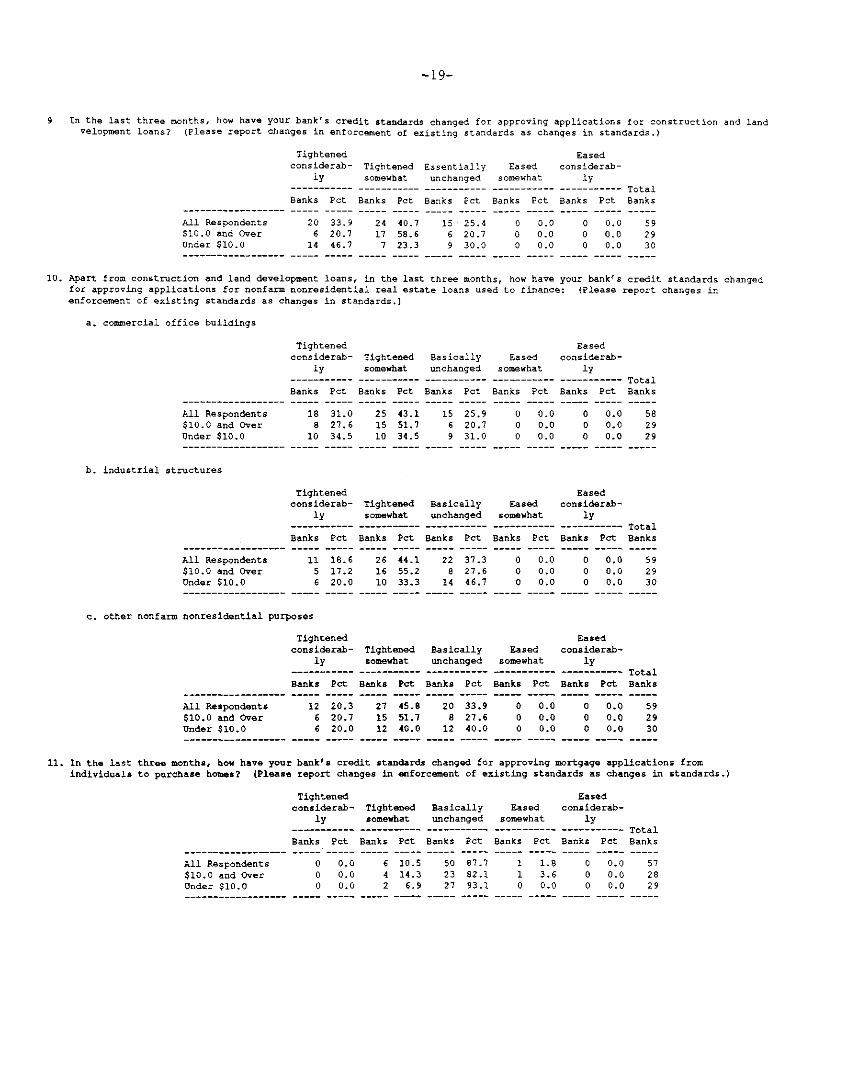
Commercial real estate lending. As in the May survey, a large majority
of domestic respondents indicated that they had tightened their credit
standards for commercial real estate lending. About three-quarters of
respondents reported that they had imposed tighter credit standards for
applications to finance commercial office buildings in the last three
months, compared to 80 percent of banks that reported tightening in this
area in the May LPS. In both surveys, a large number of respondents reported
tightening "considerably." Almost two-thirds of respondents to the August
LPS indicated tighter standards for loans secured by industrial structures
and for other commercial mortgages, and three-quarters reported tightening
standards for approving applications for construction and land development
loans. A large majority of branches and agency respondents also reported
a reduced willingness to make commercial real estate loans. Compared to six
months ago, three-quarters of these banks had tightened standards with
1. By contrast, there is only a little evidence of reduced willingness tomake residential mortgages. Six LPS respondents indicated they hadtightened somewhat standards for approving applications from individuals forresidential mortgages over the last three months, while one respondentindicated it had eased its standards.
respect to construction and land development loans and 60 percent for
mortgages secured by office buildings.
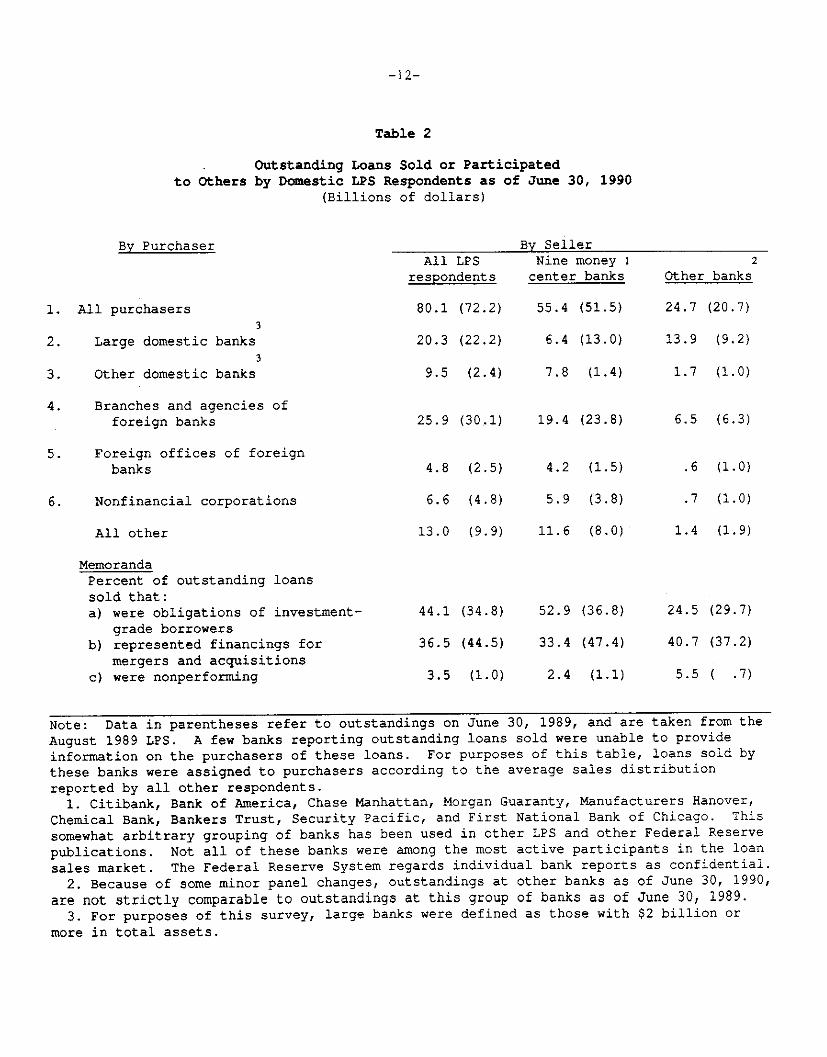
The Loan Sales Market
After about half a decade of rapid expansion, growth of the loan sales
market appears to have moderated in the last year. As shown in table 2,
domestic respondents reported an aggregate of $80 billion in outstanding C&I
loans sold or participated to others as of June 30, 1990, an increase of $8
billion from a year earlier. This increase was about evenly split between
nine money center banks and other domestic respondents. By contrast,
outstandings rose about $20 billion in the year ending in June 1989.
Perhaps reflecting purchasers' concerns about credit quality, the share of
outstanding loans sold that represented obligations of investment-grade
borrowers rose to 44 percent, up from about 35 percent a year earlier.
Merger-related loans continued to constitute an important source of loans
sold, but with merger activity off since late last year, their share of
outstanding loans sold in June was about 37 percent, down from around 45
percent a year earlier.1 Although their holdings were down noticeably
from last year, branches and agencies of foreign banks continued to be the
largest purchasers of these loans. Smaller domestic banks significantly
increased their holdings in the year ending June 30.
The share of outstanding loans sold that were nonperforming rose to 3-
1/2 percent as of June 30, 1990, up from 1 percent a year earlier. This
mainly reflected a deterioration in loans sold by LPS respondents other than
the nine money center banks. A smaller percentage of the loans sold by
1. Merger-related loans represented approximately 16-3/4 percent of theC&I loans on domestic LPS respondents' books as of June 30, 1990.
-9-
these banks represents the obligations of investment-grade borrowers than is
the case for the money center banks.
U.S. branches and agencies of foreign banks are active as both buyers
and sellers of C&I loans. As of June 30, the 18 branch and agency
respondents reported just over $7 billion of loans sold outstanding and an
almost equal amount of loans purchased on their books. Of their loans sold,
only about 23 percent represented obligations of investment-grade borrowers,
well below the share at domestically chartered banks. The share accounted
for by merger-related loans was similar, however, at 36 percent. Of the C&I
loans purchased by branch and agency respondents, about one-third were
obligations of investment-grade borrowers and 30 percent were merger-
related.1
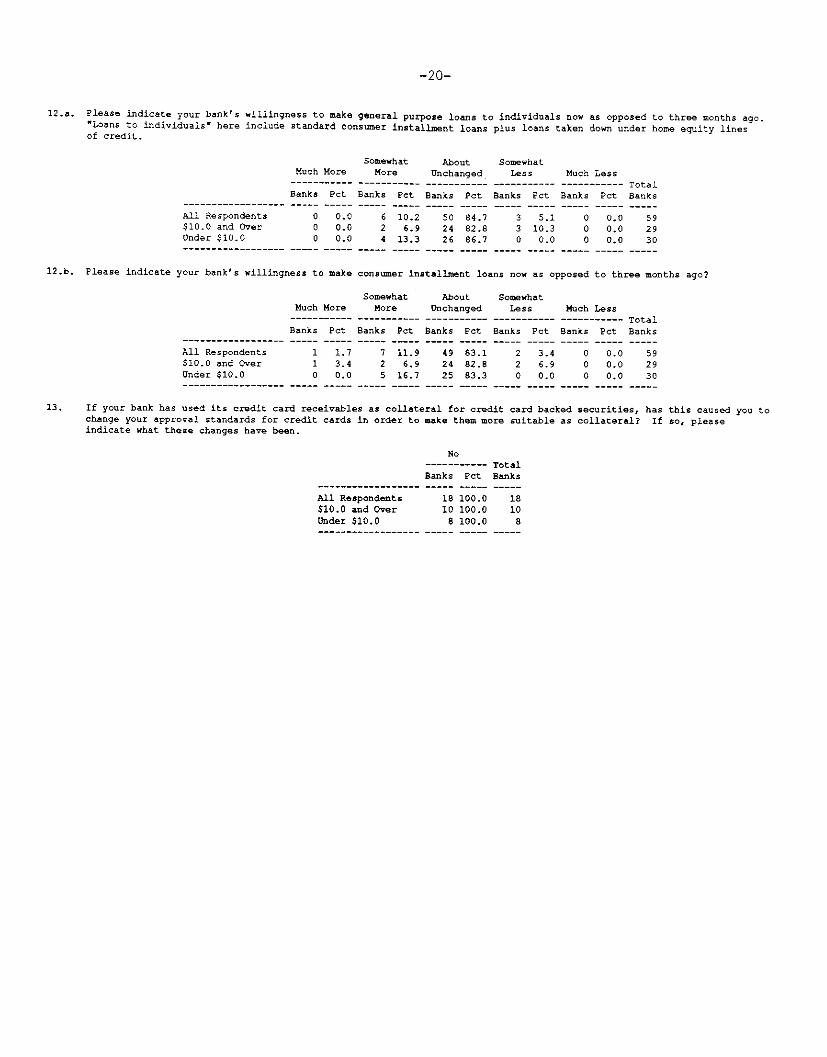
Lending to Households
As in recent surveys, several more banks reported that they had become
more willing to extend consumer installment credit than had become less
willing, although most respondent banks indicated no change in their
willingness to extend consumer credit in the three months ending with the
survey date. 2 Respondents also continued to indicate that they had become
more willing on balance to extend consumer credit defined more broadly to
include home equity loans. In this case, however, the margin by which banks
indicating greater willingness to lend exceeded the number indicating a
1. Merger-related loans represented approximately 22 percent of C&I loanson the books of branches and agency respondents as of June 30, 1990.
2. For some banks, willingness to extend consumer credit has probably beenincreased by their ability to securitize consumer receivables. The 16 LPSrespondents that have used their credit card receivables as collateral forsecurities indicated, however, that they had not changed their approvalstandards for credit cards in order to make the associated receivables moresuitable as collateral.
-10-
reduced willingness was smaller than for consumer credit more narrowly
defined. The three preceding surveys also had suggested that banks'
preference for lending to consumers has shifted away from home equity loans.
A different picture had been found in the results from most of the surveys
taken in the 1987 to mid-1989 period, when enthusiasm for making consumer
loans defined to include home equity lines exceeded that for the narrower
class of loans. This apparent relative de-emphasis of home equity lending,
which is consistent with the cessation of promotional programs associated
with this market, may be attributable to a number of factors, including some
recent slowing in the appreciation of home prices and increases in
delinquency rates on home equity lines of credit.
-11-
Table 1
Percent of Domestic Respondent Banks Reporting
Tightening Lending Standards/Terms on Nonmerger-Related Business Lendingin the May-August Period
1Size of customer
Memo:
Large Middle market Small Branches & agencies
Criterion firms firms businesses of foreign banks
3
Standards for 36 43 (58) 34 (54) 61
approving loanapplications
Maximum size of 25 27 (29) 9 (5) 28
credit lines
Cost of credit 22 30 18 39
lines
Spreads of loan 25 35 (31) 21 (19) 39
over base rates
Covenants 37 53 (57) 43 (43) 39
Collateral 25 45 (53) 40 (52) 50
requirements
1. The middle market is often categorized as consisting of firms with annual
sales between $50 and $250 million. "Large" firms are those larger than middle
market firms and "small" businesses are those that are smaller. Not all
respondents used the same criteria to distinguish among size of customers.
2. For U. S. branches and agencies of foreign banks, responses refer to
tightening over the six-month period February to August.
3. Numbers in parentheses refer to the percent of respondents that tightened
in the period from late 1989 to early May, as reported in the May 1990 Senior
Loan Officer Opinion Survey.
-12-
Table 2
Outstanding Loans Sold or Participatedto Others by Domestic LPS Respondents as of June 30, 1990
(Billions of dollars)
By Purchaser
1. All purchasers
2. Large domestic banks3
3. Other domestic banks
4. Branches and agencies offoreign banks
5. Foreign offices of foreignbanks
6. Nonfinancial corporations
All other
MemorandaPercent of outstanding loanssold that:a) were obligations of investment-
grade borrowersb) represented financings for
mergers and acquisitionsc) were nonperforming
All LPSrespondents
80.1 (72.2)
20.3 (22.2)
9.5 (2.4)
25.9 (30.1)
4.8 (2.5)
6.6 (4.8)
13.0 (9.9)
44.1 (34.8)
By SellerNine money Icenter banks
55.4 (51.5)
6.4 (13.0)
7.8 (1.4)
19.4 (23.8)
4.2 (1.5)
5.9 (3.8)
11.6 (8.0)
52.9 (36.8)
36.5 (44.5) 33.4 (47.4)
3.5 (1.0) 2.4 (1.1)
Other banks
24.7 (20.7)
13.9 (9.2)
1.7 (1.0)
6.5 (6.3)
.6 (1.0)
.7 (1.0)
1.4 (1.9)
24.5 (29.7)
40.7 (37.2)
5.5 ( .7)
Note: Data in parentheses refer to outstandings on June 30, 1989, and are taken from the
August 1989 LPS. A few banks reporting outstanding loans sold were unable to provide
information on the purchasers of these loans. For purposes of this table, loans sold by
these banks were assigned to purchasers according to the average sales distribution
reported by all other respondents.1. Citibank, Bank of America, Chase Manhattan, Morgan Guaranty, Manufacturers Hanover,
Chemical Bank, Bankers Trust, Security Pacific, and First National Bank of Chicago. This
somewhat arbitrary grouping of banks has been used in other LPS and other Federal Reserve
publications. Not all of these banks were among the most active participants in the loan
sales market. The Federal Reserve System regards individual bank reports as confidential.
2. Because of some minor panel changes, outstandings at other banks as of June 30, 1990,
are not strictly comparable to outstandings at this group of banks as of June 30, 1989.
3. For purposes of this survey, large banks were defined as those with $2 billion or
more in total assets.

-13-
Table 3
SENIOR LOAN OFFICER OPINION SURVEY ON BANK LENDING PRACTICESAT SELECTED LARGE BANKS IN THE UNITED STATES
(Status of policy as of August 1990)(Number of banks and percent of banks answering question)
(By volume of total domestic assets, in $ billions, as of June 27, 1990)1
(By type of bank)2
1. Approximately what was the dollar volume of commercial and industrial loans outstanding on June 30, 1990 that your bank hadoriginated and then sold to others through participations or assignments? (Exclude sales and participations of any C&Iloans that for purposes of the Call Report were retained on your books because, for example, they were sold with recourse.)
$101-250 $251-500 $501 mil.-$0-100 mil. mil. mil $1 bil.----------- ----------- ----------- -----------
Banks Pet Banks Pet Banks Pct Banks Pct
All Respondents 14 25.0 10 17.9 12 21.4 4 7.1Nine money center
Over $1bil.
-----------Banks Pct
16 28.6
TotalAmount
($ bil.)
80.1
banks 0 0 0 0 0 0 0 00 9 100.0 9 55.4Other 14 29.8 10 21.3 12 25.5 4 8.5 7 14.9 47 24.7
2. Of the outstanding C&I loans that were sold or participated to others as reported in question 1.
a. please indicate the approximate percentage distribution of these loans by purchasers. (Percentages should add to 100.)
All RespondentsSmoney centers
-r
Domestic CommercialBanks with Assetsless than $2 billion
Mean3
Amount4
Banks pet ($ bil.)
44 11.8 8.6
6 14.1 6.938 7.3 1.8
Domestic CommercialBanks with Assetsgreater than $2 billion
Mean AmountBanks pet ($ bil.)
48 25.4 18.6
Foreign Banks
Agencies and Branches Foreign Offices
MeanBanks pct
36 32.4
Amount($ bil.)
23.7
MeanBanks pet
17 6.0
4Amount($ bil.)
4.4
7 11.6 5.6 8 35.1 17.1 7 7.6 3.741 52.6 12.9 28 27.2 6.7 10 2.8 0.7
Nonfinancial Corp.
All RespondentsNine money centerbanksOther
MeanBanks pet
2 8.2
1 10.71 3.1
Amount 4
($ bil.) Banks
6.0 24
3 4Mean Amount
pct ($ bil.)
16.2 11.8
5.2 7 20.9 10.20.8 17 7.0 1.7
Amount($ bil.)
73.1
8 48.645 24.5
1 As of June 27, 1990, 30 respondents had domestic assets of $10 billion or more; combined assets of these bankstotaled $765 billion, compared to $964 billion for the entire panel of 60 banks, and $2.94 trillion for alldomestically chartered federally insured commercial banks.
2 Money center banks are Citibank, Bank of America, Chase Manhattan, Morgan Guaranty, Manufactures Hanover,Chemical Bank, Bankers Trust, Security Pacific, and First National Bank of Chicago. This is a somewhat arbitrarygrouping which has been used in other Federal Reserve publications. Not all of these banks were among the mostactive sellers. The Federal Reserve System regards individual bank responses to this survey as confidential.
'ghted by amount reported in question 1.als reported percentage times the amount reported in question 1. Components may not add due to rounding.
Other
I
-14-
b. About what percent of these loans were nonperforming?
0% .01-2.5% 2.5-5%
All RespondentsNine money centerbanksOther
6-10% Over 10%
----------- ----------- ----------- ---------------------- Mean TotalBanks Pet Banks Pet Banks Pet Banks Pet Banks Pet pet Banks
24 45.3 6 11.3 8 15.1 10 18.9 5 9.4 3.5 53
2 25.0 3 37.5 2 25.0 1 12.5 0 0 2.4 822 48.9 3 6.7 6 13.3 9 20.0 5 11.1 5.5 45
c. About what percent of these loans represented lending to publicly rated, investment-grade borrowers?
0-20% 21-40% 41-60% 61-80% 80-100%5
--------- -------- ---------- ---------- ----------- MeanBanks Pet Banks Pet Banks Pet Banks Pet Banks Pet pet
All Respondents 30 61.2 10 20.4 5 10.2 3 6.1 1 2.0 44.1Nine money centerbanks 1 14.3 2 28.6 1 14.3 2 28.6 1 14.3 52.9Other 29 69.0 8 19.0 4 9.5 1 2.4 0 0 24.5
Total
Amount(S bil.)
26.6
7 22.042 4.6
d. Around what percent of these loans represented financings for mergers and acquisitions? (Note: Merger-related loans includethose made to finance leveraged buyouts, other mergers and acquisitions, and defensive restructurings--such as equity ordebt buybacks--related to mergers and acquisitions.)
All RespondentsNine money centerbanksOther
0-20% 21-40% 41-60% 61-80% 80-100%
------ ------- ------ ----- -------- MeanBanks Pet Banks Pet Banks Pet Banks Pet Banks Pet pet
23 45.1 12 23.5 12 23.5 2 3.9 2 3.9 36.5
2 28.6 2 28.6 3 42.921 47.7 10 22.7 9 20.5
Total
Total AmountBanks ($ bil.)
51 20.8
0 0 0 0 33.4 7 11.02 4.5 2 4.5 40.7 44 9.7
the total C&I loans on your books as of June 30, 1990, roughly what percent was merger related? (Merger-related loansre defined in question 2.d.)
All Respondents$10.0 and OverUnder $10.0
0-5% 6-10% 11-15% 16-20% Over 20%6------- ------ ------ ------- ------- Mean
Banks Pet Banks Pet Banks Pet Banks Pet Banks Pet pet
12 21.4 18 32.1 9 16.1 9 16.1 8 14.3 16.8
3 10.7 10 35.7 3 10.7 6 21.4 6 21.4 18.8
9 32.1 8 28.6 6 21.4 3 10.7 2 7.1 10.1
4. In the last three months, how have your bank's credit standards for approving applications for C&I loans or creditlines--other than those to be used to finance mergers and acquisitions--from large corporate, middle market andsmall business customers changed: (Please report changes in enforcement of existing standards aschanges in standards. The middle market been categorized as consisting of firms with annual sales ofbetween $50 and $250 million; in answering this question, refer either to this definition or to any
other that may be employed at your bank; please indicate the definition used if it is other than theone suggested. "Large" borrowers would then be those larger than middle market customers and "small"
borrowers those that are smaller.)
a. for large firms
Tightenedconsiderab-
ly-----------
Tightened Basicallysomewhat unchanged----------- -----------
Banks Pet Banks Pet
All Respondents 3 5.1 18 30.5
$10.0 and Over 2 6.9 8 27.6
Under $10.0 1 3.3 10 33.3
Easedsomewhat
Easedconsiderab-
ly----------- ----------- TotalBanks Pet Banks Pet Banks
0 0.0 0 0.0 590 0.0 0 0.0 290 0.0 0 0.0 30
4ghted by amount reported in question 1.ghted by volume of comercial and industrial loans to domestic addressees as of June 27, 1990.
------------------
--- --- -- -- --- ---
b. for middle market firms
All Respondents$10.0 and OverUnder $10.0
c. for small businesses
All Respondents$10.0 and OverUnder $10.0
Tightenedconsiderab- Tightened Basically Eased
ly somewhat unchanged somewhat
Banks Pct Banks Pet Banks Pet Banks Pct
5 8.3 21 35.0 34 56.7 0 0.03 10.0 10 33.3 17 56.7 0 0.02 6.7 11 36.7 17 56.7 0 0.0
Tightenedconsiderab- Tightened Basically Eased
ly somewhat unchanged somewhat
Banks Pet Banks Pct Banks Pet Banks Pet
Easedconsiderab-
ly
Easedconsiderab-
ly
15 25.4 397 24.1 208 26.7 19
5.a. If your bank's credit standards for approving applications for C&I loans or credit lines from largecorporate firms--other than those to be used to finance mergers and acquisitions--have been tightened inthe last three months (answers i. or ii. to question 4.a) what were the main reasons? (Please rank.)
All Respondents$10.0 and OverUnder $10.0
Pressureson bank'scapital
position------- ----Banks Mean
5 1.53 1.82 1.0
Deteriora-tion inquality of
loanportfolio-----------Banks Mean
4 1.81 1.03 2.0
Lessfavorableeconomic
outlook
Banks Mean
19 1.79 1.8
10 1.5
Industryspecificproblems
Banks Mean
Increasedattractive-
ness ofRegulatory otherpressures assets
----------- ----------
Banks Mean Banks
2.6 22.5 22.8 0
Other---------- TotalBanks Mean Banks
5 1.4 223 1.7 102 1.0 12
5.b. If your bank's creditthan those to be usedto question 4.b) what
standards for approving applications for C&I loans or credit lines from middle market firms--otherto finance mergers and acquisitions-have been tightened in the last three months (answers i. or ii.were the main reasons? (Please rank.)
All Respondents$10.0 and OverUnder $10.0
Pressureson bank'scapital
position-----------Banks Mean
6 1.43 1.83 1.0
Deteriora-tion in Less
quality of favorableloan economic
portfolio outlook-- -------- ------ - _
Banks Mean Banks Mean
6 2.2 25 1.52 2.0 13 1.64 2.3 12 1.5
Industryspecific Regulatoryproblems pressures----------- -----------Banks Mean Banks Mean
14 2.4 11 2.38 2.7 6 1.96 2.0 5 2.8
Increasedattractive-ness ofother
assets
Banks Mean
Other---------- TotalBanks Mean Banks
3 2.0 271 3.0 132 1.5 14
5.c. If your bank's credit standards for approving applications for C&I loans and credit lines from small businesses have beentightened in the last three months (answers i. or ii. to question 4.c) what were the main reasons? (Please rank.)
All Respondents$10.0 and OverUnder $10.0
Pressureson bank'scapital
position
Banks Mean
4 1.32 1.52 1.0
Deteriora-tion in Less
quality of favorableloan economic
portfolio outlook
Banks Mean Banks Mean
5 2.2 20 1.61 1.0 10 1.74 2.5 10 1.5
Industryspecificproblems
Banks Mean
9 2.45 2.84 2.0
Regulatorypressures
Banks Mean
9 2.05 1.84 2.3
Increasedattractive-
ness ofother
assets
Banks Mean
1 6.01 6.00 0
Other
Banks Mean
1 1.00 01 1.0
-16-
6. With respect to applications for C&I loans or credit lines--other than those to be used to finance mergers and
acquisitions--from large corporate firms that your bank currently is willing to approve, please indicate how terms
ive changed in the last three months with respect to:
a. maximum size of credit lines
Decreasedconsiderab-
lyDecreased Basically Increasedsomewhat unchanged somewhat
Banks Pet Banks Pet Banks Pet Banks-----. -. --- .- -. -. --- . - .- -- -. ----- .- ---
Increasedconsiderab-
ly
Pet
All Respondents$10.0 and OverUnder $10.0
5 8.3 10 16.71 3.3 5 16.74 13.3 5 16.7
b. costs of credit lines
All Respondents$10.0 and OverUnder $10.0
Increased Decreased
considerab- Increased Basically Decreased considerab-ly somewhat unchanged somewhat ly
Banks Pet Banks Pet Banks Pct Banks Pet Banks Pet
1 1.7 12 20.0 44 73.3 3 5.0 0 0.00 0.0 7 23.3 21 70.0 2 6.7 0 0.01 3.3 5 16.7 23 76.7 1 3.3 0 0.0
-----. -. ---. --. -. - - - . .- ---. --- - ..- --- . .- -- .- - . -- .- - .-
c. spreads of loan rates over base rates
Increasedconsiderab-
lyIncreased Basically Decreasedsomewhat unchanged somewhat
Decreasedconsiderab-
ly
All Respondents$10.0 and OverUnder $10.0
d. loan covenants
Tightenedconsiderab-
lyTightened Basically Easedsomewhat unchanged somewhat
Easedconsiderab-
ly
All Respondents$10.0 and OverUnder $10.0
Banks Pet Banks
1 1.7 210 0.0 121 3.3 9
e. collateralization requirements
All Respondents$10.0 and OverUnder $10.0
Tightenedconsiderab-
ly
Banks Pot
1 1.70 0.01 3.3
Tightened Basicallysomewhat unchanged
Banks Pet Banks Pet
14 23.3 45 75.08 26.7 22 73.36 20.0 23 76.7
4 6.73 10.01 3.3
Easedsomewhat
Banks Pet
0 0.00 0.00 0.0
Easedconsiderab-
ly
Banks Pet
0 0.00 0.00 0.0
-17-
7. With respect to applications for C&I loans or credit lines--other than those to be used to finance-ergers and acquisitions--from middle market firms that your bank currently is willing to approve, please
dicate how terms have changed in the last three months with respect to:
a. maximum size of credit lines
Decreasedconsiderab- Decreased Basically Increased
ly somewhat unchanged somewhat
Increasedconsiderab-
ly
All Respondents$10.0 and OverUnder $10.0
Banks Pct Banks
3 5.0 130 0.0 43 10.0 9
Banks Pot Banks
b. costs of credit lines
All Respondents$10.0 and OverUnder $10.0
Increasedconsiderab-
ly
Banks Pet
2 3.31 3.31 3.3
Increased Basically Decreasedsomewhat unchanged somewhat
c. spreads of loan rates over base rates
All Respondents$10.0 and OverUnder $10.0
Increasedconsiderab- Increased
ly somewhat
Banks Pet Banks Pet
2 3.3 19 31.71 3.3 10 33.31 3.3 9 30.0
DecreasedBasically Decreased considerab-unchanged somewhat ly
d. loan covenants
Increasedconsiderab-
lyIncreased Basically Decreasedsomewhat unchanged somewhat
Banks Pet Banks Pet Banks Pet
All Respondents$10.0 and OverUnder $10.0
2 3.31 3.31 3.3
30 50.015 50.015 50.0
Pet Banks Pet
0.0 0 0.00.0 0 0.00.0 0 0.0
e. collateralization requirements
Tightenedconsiderab- Tightened Basically Eased
ly somewhat unchanged somewhat
All Respondents$10.0 and OverUnder $10.0
Banks Pet Banks
2 3.3 251 3.3 131 3.3 12
Pet Banks
41.7 3343.3 1640.0 17
Pet Banks Pet
Easedconsiderab-
ly
Banks Pet
0 0.00 0.00 0.0
Decreasedconsiderab-
ly
Decreasedconsiderab-
ly
-18-
8 with respect to applications for C&I loans or credit lines from small businesses that your bank currently is willing torove, please indicate how terms have changed in the last three months with respect to:
a. maximum size of credit lines
Decreased Increasedconsiderab- Decreased Basically Increased considerab-
ly somewhat unchanged somewhat ly
All Respondents$10.0 and OverUnder $10.0
Banks Pet
1 1.70 0.01 3.3
Banks Pet
0 0.00 0.00 0.0
b. costs of credit lines
All Respondents$10.0 and OverUnder $10.0
Increased Decreasedconsiderab- Increased Basically Decreased considerab-
ly somewhat unchanged somewhat ly--------------------- ------- ------ Total
Banks Pet Banks Pet Banks Pet Banks Pet Banks Pet Banks
2 3.4 8 13.8 47 81.0 1 1.7 0 0.0 581 3.6 3 10.7 24 85.7 0 0.0 0 0.0 281 3.3 5 16.7 23 76.7 1 3.3 0 0.0 30
c. spreads of loan rates over base rates
Increasedconsiderab-
ly
All Respondents$10.0 and OverUnder $10.0
Increased Basically Decreasedsomewhat unchanged somewhat----------- ----------- -----------
Banks Pet Banks Pet
2 3.4 10 17.21 3.6 6 21.41 3.3 4 13.3
Banks Pet
44 75.920 71.424 80.0
Decreasedconsiderab-
ly---------- TotalBanks Pet Banks
0 0.0 580 0.0 280 0.0 30
d. loan covenants
Tightenedconsiderab-
lyTightened Basically Easedsomewhat unchanged somewhat
Easedconsiderab-
ly
Banks Pet Banks Pct Banks Pet Banks Pet
All Respondents$10.0 and OverUnder $10.0
e. collateralization requirements
Tightenedconsiderab-
ly
All Respondents$10.0 and OverUnder $10.0
Tightened Basically Easedsomewhat unchanged somewhat----------- ----------- -----------
Banks Pet Banks Pet
2 3.4 21 36.21 3.6 10 35.71 3.3 11 36.7
Easedconsiderab-
ly---------- TotalBanks Pet Banks
0 0.0 580 0.0 280 0.0 30
-19-
9 In the last three months, how have your bank's credit standards changed for approving applications for construction and landvelopment loans? (Please report changes in enforcement of existing standards as changes in standards.)
Tightened Easedconsiderab- Tightened Essentially Eased considerab-
ly somewhat unchanged somewhat ly--------------- ----------- ----------- ----------- ----------- TotalBanks Pet Banks Pet Banks Pct Banks Pet Banks Pet Banks
All Respondents 20 33.9 24 40.7 15 25.4 0 0.0 0 0.0 59$10.0 and Over 6 20.7 17 58.6 6 20.7 0 0.0 0 0.0 29Under $10.0 14 46.7 7 23.3 9 30.0 0 0.0 0 0.0 30
10. Apart from construction and land development loans, in the last three months, how have your bank's credit standards changedfor approving applications for nonfarm nonresidential real estate loans used to finance: (Please report changes inenforcement of existing standards as changes in standards.)
a. commercial office buildings
Tightened Easedconsiderab- Tightened Basically Eased considerab-
ly somewhat unchanged somewhat ly--------- ------- ----------------- -------- -- ----------- TotalBanks Pet Banks Pet Banks Pet Banks Pet Banks Pet Banks
All Respondents 18 31.0 25 43.1 15 25.9 0 0.0 0 0.0 58$10.0 and Over 8 27.6 15 51.7 6 20.7 0 0.0 0 0.0 29Under $10.0 10 34.5 10 34.5 9 31.0 0 0.0 0 0.0 29
b. industrial structures
Tightened Easedconsiderab- Tightened Basically Eased considerab-
ly somewhat unchanged somewhat ly----------- ---------- ----------- ----------- ----------- Total
Banks Pet Banks Pet Banks Pet Banks Pet Banks Pet Banks
All Respondents 11 18.6 26 44.1 22 37.3 0 0.0 0 0.0 59$10.0 and Over 5 17.2 16 55.2 8 27.6 0 0.0 0 0.0 29Under $10.0 6 20.0 10 33.3 14 46.7 0 0.0 0 0.0 30
c. other nonfarm nonresidential purposes
Tightened Easedconsiderab- Tightened Basically Eased considerab-
ly somewhat unchanged somewhat ly--------- ------ - ------- ----------- --------- TotalBanks Pet Banks Pot Banks Pet Banks Pet Banks Pot Banks
All Respondents 12 20.3 27 45.8 20 33.9 0 0.0 0 0.0 59$10.0 and Over 6 20.7 15 51.7 8 27.6 0 0.0 0 0.0 29Under $10.0 6 20.0 12 40.0 12 40.0 0 0.0 0 0.0 30
11. In the last three months, how have your bank's credit standards changed for approving mortgage applications fromindividuals to purchase homes? (Please report changes in enforcement of existing standards as changes in standards.)
Tightened Easedconsiderab- Tightened Basically Eased considerab-
ly somewhat unchanged somewhat ly---------- ----------------------- ------------ ----------- TotalBanks Pet Banks Pet Banks Pet Banks Pet Banks Pet Banks
All Respondents 0 0.0 6 10.5 50 87.7 1 1.8 0 0.0 57$10.0 and Over 0 0.0 4 14.3 23 82.1 1 3.6 0 0.0 28Under $10.0 0 0.0 2 6.9 27 93.1 0 0.0 0 0.0 29
-20-
12.a. Please indicate your bank's willingness to make general purpose loans to individuals now as opposed to three months ago."Loans to individuals" here include standard consumer installment loans plus loans taken down under home equity linesof credit.
All Respondents$10.0 and OverUnder $10.0
Somewhat About SomewhatMuch More More Unchanged Less Much Less
--------- ---------- ----------- ----------- --------- TotalBanks Pct Banks Pet Banks Pct Banks Pet Banks Pet Banks
0 0.0 6 10.2 50 84.7 3 5.1 0 0.0 590 0.0 2 6.9 24 82.8 3 10.3 0 0.0 290 0.0 4 13.3 26 86.7 0 0.0 0 0.0 30
-----. -. --- . --. -. ---. - .- ---. ----- .- - --. -. --- .- .- -. ---. - .- -- .
12.b. Please indicate your bank's willingness to make consumer installment loans now as opposed to three months ago?
All Respondents$10.0 and OverUnder $10.0
Somewhat About SomewhatMuch More More Unchanged Less Much Less
---- -- --------- ----------- ----------- ----------- TotalBanks Pct Banks Pet Banks Pet Banks Pct Banks Pet Banks
1 1.7 7 11.9 49 83.1 2 3.4 0 0.0 591 3.4 2 6.9 24 82.8 2 6.9 0 0.0 290 0.0 83.3 0 0.0 0 0.0 30
13. If your bank has used its credit card receivables as collateral for credit card backed securities, has this caused you tochange your approval standards for credit cards in order to make them more suitable as collateral? If so, pleaseindicate what these changes have been.
All Respondents$10.0 and OverUnder $10.0
No---------- TotalBanks Pet Banks
18 100.0 1810 100.0 108 100.0 8
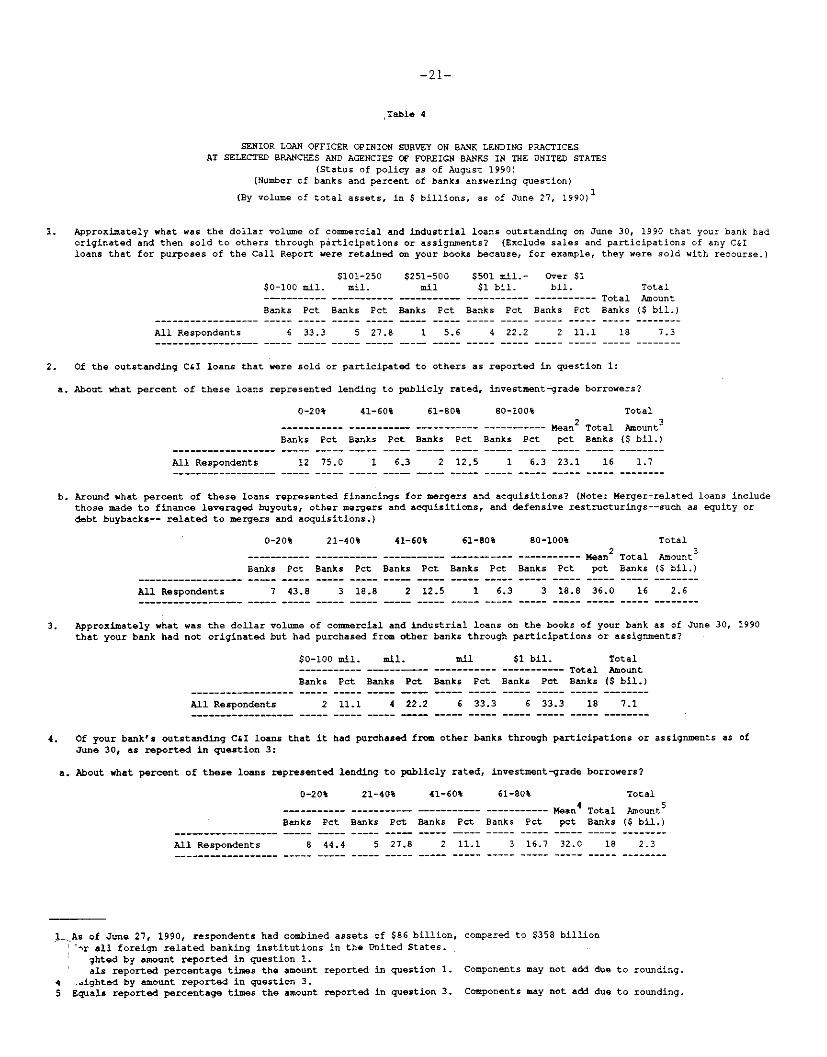
-21-
Table 4
SENIOR LOAN OFFICER OPINION SURVEY ON BANK LENDING PRACTICESAT SELECTED BRANCHES AND AGENCIES OF FOREIGN BANKS IN THE UNITED STATES
(Status of policy as of August 1990)(Number of banks and percent of banks answering question)
(By volume of total assets, in $ billions, as of June 27, 1990)1
1. Approximately what was the dollar volume of commercial and industrial loans outstanding on June 30, 1990 that your bank hadoriginated and then sold to others through participations or assignments? (Exclude sales and participations of any C&Iloans that for purposes of the Call Report were retained on your books because, for example, they were sold with recourse.)
$101-250 $251-500 $501 mil.- Over $1$0-100 mil. mil. mil $1 bil. bil. Total----------- ----------- ---------- ------- --------- Total AmountBanks Pet Banks Pct Banks Pet Banks Pet Banks Pct Banks ($ bil.)
All Respondents 6 33.3 5 27.8 1 5.6 4 22.2 2 11.1 18 7.3
2. Of the outstanding C&I loans that were sold or participated to others as reported in question 1:
a. About what percent of these loans represented lending to publicly rated, investment-grade borrowers?
0-20% 41-60% 61-80% 80-100% Total2 3---------- --------- ----------- --------- Mean2
Total AmountBanks Pot Banks Pet Banks Pet Banks Pet pot Banks ($ bil.)
All Respondents 12 75.0 1 6.3 2 12.5 1 6.3 23.1 16 1.7
b. Around what percent of these loans represented financings for mergers and acquisitions? (Note: Merger-related loans includethose made to finance leveraged buyouts, other mergers and acquisitions, and defensive restructurings--such as equity ordebt buybacks-- related to mergers and acquisitions.)
0-20% 21-40% 41-60% 61-80% 80-100%2----------- ---------- ---------- ------------- ----------- Mean2
Banks Pot Banks Pet Banks Pet Banks Pet Banks Pet pet
All Respondents 7 43.8 3 18.8 2 12.5 1 6.3 3 18.8 36.0
Total
Amount($ bil.)
2.6
3. Approximately what was the dollar volume of commercial and industrial loans on the books of your bank as of June 30, 1990that your bank had not originated but had purchased from other banks through participations or assignments?
$0-100 mil. mil. mil $1 bil. Total------ --- --- --- --- ------ Total Amount
Banks Pet Banks Pet Banks Pet Banks Pet Banks ($ bil.)
All Respondents 2 11.1 4 22.2 6 33.3 6 33.3 18 7.1
4. Of your bank's outstanding C&I loans that it had purchased from other banks through participations or assignments as ofJune 30, as reported in question 3:
a. About what percent of these loans represented lending to publicly rated, investment-grade borrowers?
0-20% 21-40% 41-60% 61-80%
----------- -- ------- -----------
Banks Pet Banks Pet Banks Pet
All Respondents 8 44.4 5 27.8 2 11.1
----------- Mean 4
Banks Pet pct
3 16.7 32.0
TotalBanks
Total
Amount($ bil.)
18 2.3
l As of June 27, 1990, respondents had combined assets of $86 billion, compared to $358 billionfor all foreign related banking institutions in the United States.
ghted by amount reported in question 1.als reported percentage times the amount reported in question 1. Components may not add due to rounding.
4 .eighted by amount reported in question 3.5 Equals reported percentage times the amount reported in question 3. Components may not add due to rounding.
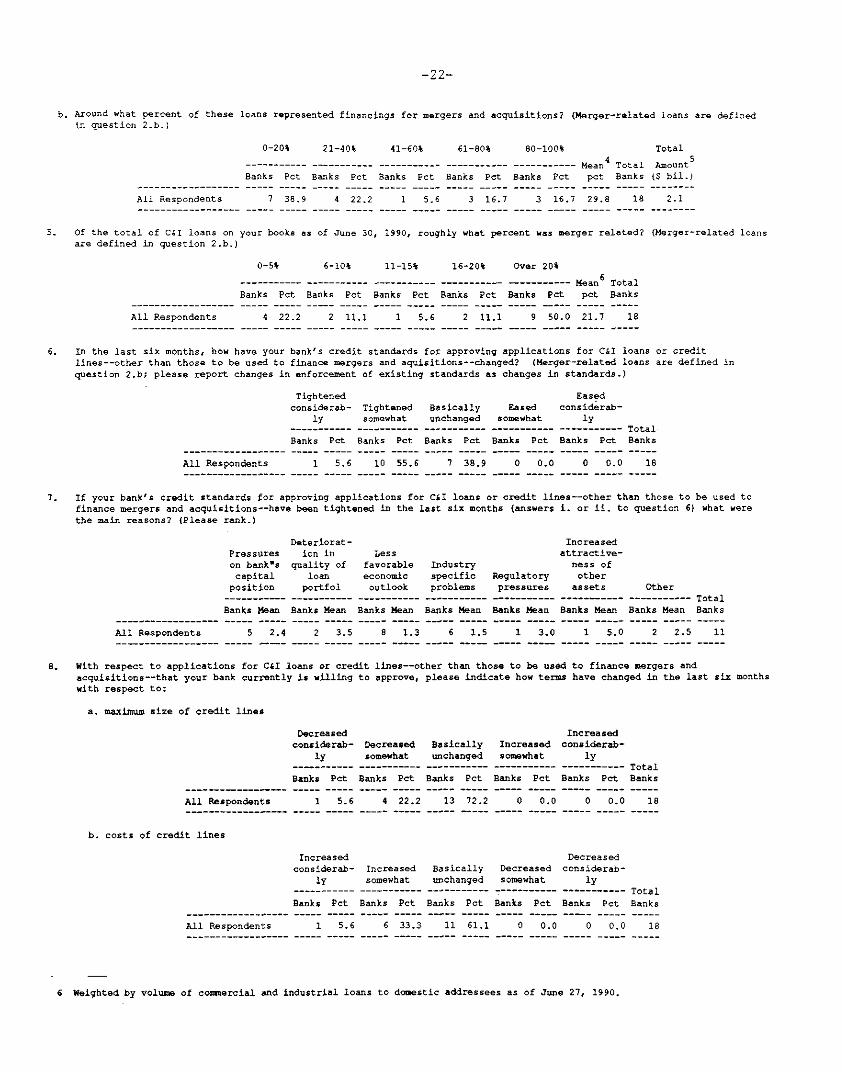
-22-
b. Around what percent of these loans represented financings for mergers and acquisitions? (Merger-related loans are definedin question 2.b.)
All Respondents
0-20% 21-40% 41-60% 61-80% 80-100%
--- ----------- ----------- - --------------- Mean 4 TotalBanks Pot Banks Pet Banks Pet Banks Pet Banks Pet pet Banks
7 38.9 4 22.2 1 5.6 3 16.7 3 16.7 29.8 18
5. Of the total of C&I loans on your books as of June 30, 1990, roughly what percent was merger related? (Merger-related loansare defined in question 2.b.)
0-5% 6-10% 11-15% 16-20% Over 20%
---------- ----------- ----------- --------- -------- Mean TotalBanks Pet Banks Pet Banks Pet Banks Pet Banks Pet pot Banks
All Respondents 4 22.2 2 11.1 1 5.6 2 11.1 9 50.0 21.7 18
6. In the last six months, how have your bank's credit standards for approving applications for C&I loans or creditlines--other than those to be used to finance mergers and aquisitions--changed? (Merger-related loans are defined in
question 2.b; please report changes in enforcement of existing standards as changes in standards.)
Tightened Easedconsiderab- Tightened Basically Eased considerab-
ly somewhat unchanged somewhat ly
Banks Pet Banks Pet
All Respondents 1 5.6 10 55.6
Banks Pet Banks Pot Banks Pet
7 38.9 0 0.0 0 0.0 18
7. If your bank's credit standards for approving applications for C&I loans or credit lines--other than those to be used tofinance mergers and acquisitions--have been tightened in the last six months (answers i. or ii. to question 6) what werethe main reasons? (Please rank.)
Pressureson bank'scapital
position
Deteriorat-ion in
quality ofloan
portfol----------- -----------Banks Mean Banks Mean
All Respondents 5 2.4 2 3.5
Lessfavorable Industry
Increasedattractive-
ness ofeconomic specific Regulatory oti
outlook problems pressures ass----------- ----------- ----------- -----Banks Mean Banks Mean Banks Mean Banks
8 1.3 6 1.5 1 3.0 1
ets Other------ ---------- TotalMean Banks Mean Banks
5.0 2 2.5 11
8. With respect to applications for C&I loans or credit lines--other than those to be used to finance mergers andacquisitions--that your bank currently is willing to approve, please indicate how terms have changed in the last six monthswith respect to:
a. maximum size of credit lines
Decreasedconsiderab- Decreased Basically Increased
ly somewhat unchanged somewhat----------- ----------- ----------- -----------
All Respondents
Banks Pet
1 5.6
Banks Pet
13 72.2
Banks Pet
0 0.0
b. costs of credit lines
All Respondents
Increasedconsiderab-
ly-----------
Banks Pet
1 5.6
Increased Basically Decreasedsomewhat unchanged somewhat----------- ----------- -----------
Banks Pet
6 33.3
Banks Pet
11 61.1
Increasedconsiderab-
ly---------- TotalBanks Pet Banks
0 0.0 18
Decreasedconsiderab-
ly---------- TotalBanks Pet Banks
0 0.0 18
6 Weighted by volume of commercial and industrial loans to domestic addressees as of June 27, 1990.
Total
Amount(S bil.)
2.1
------------------ ----- ----- ----- ----- ----- -----
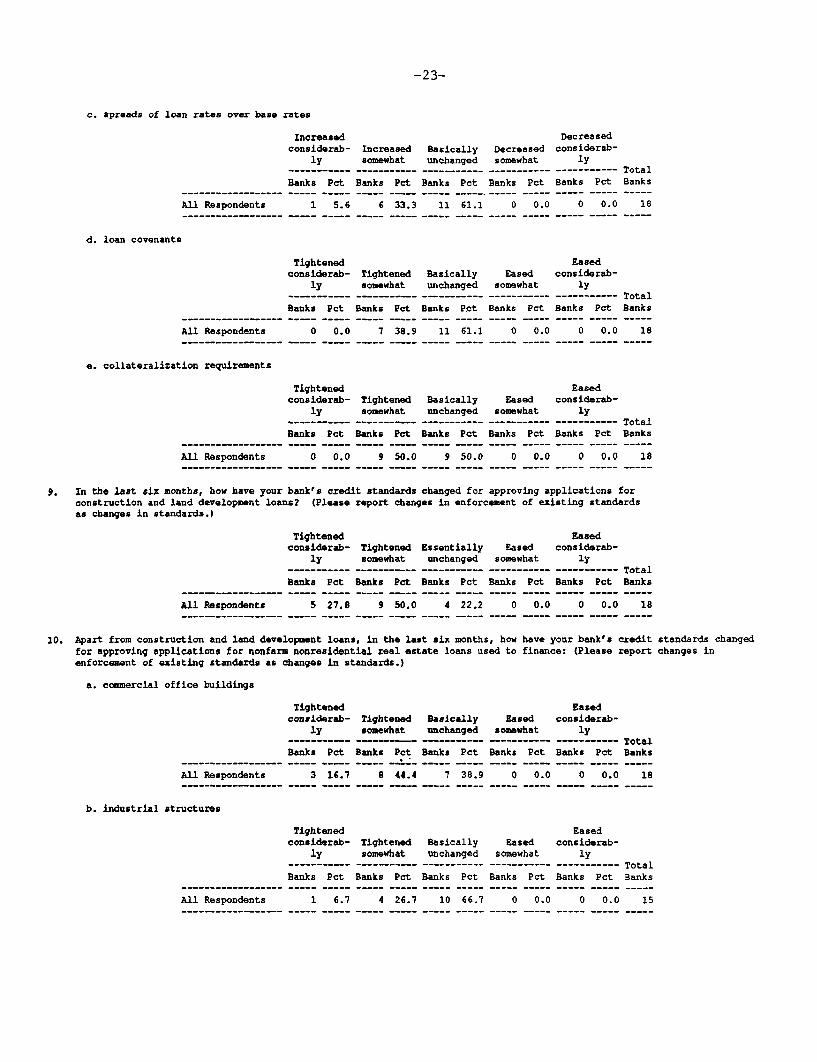
-23-
c. spreads of loan rates over base rates
Increased Decreasedconsiderab- Increased Basically Decreased considerab-
ly somewhat unchanged somewhat ly------ ----- ----------- ----------- ----------- -----------
Banks Pet Banks Pet Banks Pet Banks Pet Banks Pet
All Respondents 1 5.6 6 33.3 11 61.1 0 0.0 0 0.0
d. loan covenants
Tightened Easedconsiderab- Tightened Basically Eased considerab-
ly somewhat unchanged somewhat ly---------- ---------- ---------- ----------- ----------
Banks Pet Banks Pet Banks Pet Banks Pet Banks Pet
All Respondents 0 0.0 7 38.9 11 61.1 0 0.0 0 0.0
e. collateralization requirements
Tightenedconsiderab- Tightened
ly somewhat----------- -----------Banks Pet Banks Pet
All Respondents 0 0.0 9 50.0
EasedBasically Eased considerab-unchanged somewhat ly----------- ----------- -----------
Banks Pet Banks Pet Banks Pet
9 50.0 0 0.0 0 0.0
9. In the last six months, how have your bank's credit standards changed for approving applications forconstruction and land development loans? (Please report changes in enforcement of existing standardsas changes in standards.)
Tightenedconsiderab-
ly-----------
Banks Pet
All Respondents 5 27.8
EasedTightened Essentially Eased considerab-somewhat unchanged somewhat ly----------- ----------- ----------- -----------
Banks Pet Banks Pet Banks Pet Banks Pet
9 50.0 4 22.2 0 0.0 0 0.0
10. Apart from construction and land development loans, in the last six months, how have your bank's credit standards changedfor approving applications for nonfarm nonresidential real estate loans used to finance: (Please report changes inenforcement of existing standards as changes in standards.)
a. commercial office buildings
Tightened Easedconsiderab- Tightened Basically Eased considerab-
ly somewhat unchanged somewhat lyS------ ----- - - ---------- ---------- Total
Banks Pet Banks Pet Banks Pet Banks Pet Banks Pet Banks
All Respondents 3 16.7 8 44.4 7 38.9 0 0.0 0 0.0 18
b. industrial structures
Tightened Easedconsiderab- Tightened Basically Eased considerab-
ly somewhat unchanged somewhat ly----------- ----------- ----------- ----------- ----------- TotalBanks Pet Banks Pet Banks Pet Banks Pet Banks Pet Banks
All Respondents 1 6.7 4 26.7 10 66.7 0 0.0 0 0.0 15
TotalBanks
18
TotalBanks
18
TotalBanks
18
TotalBanks
18
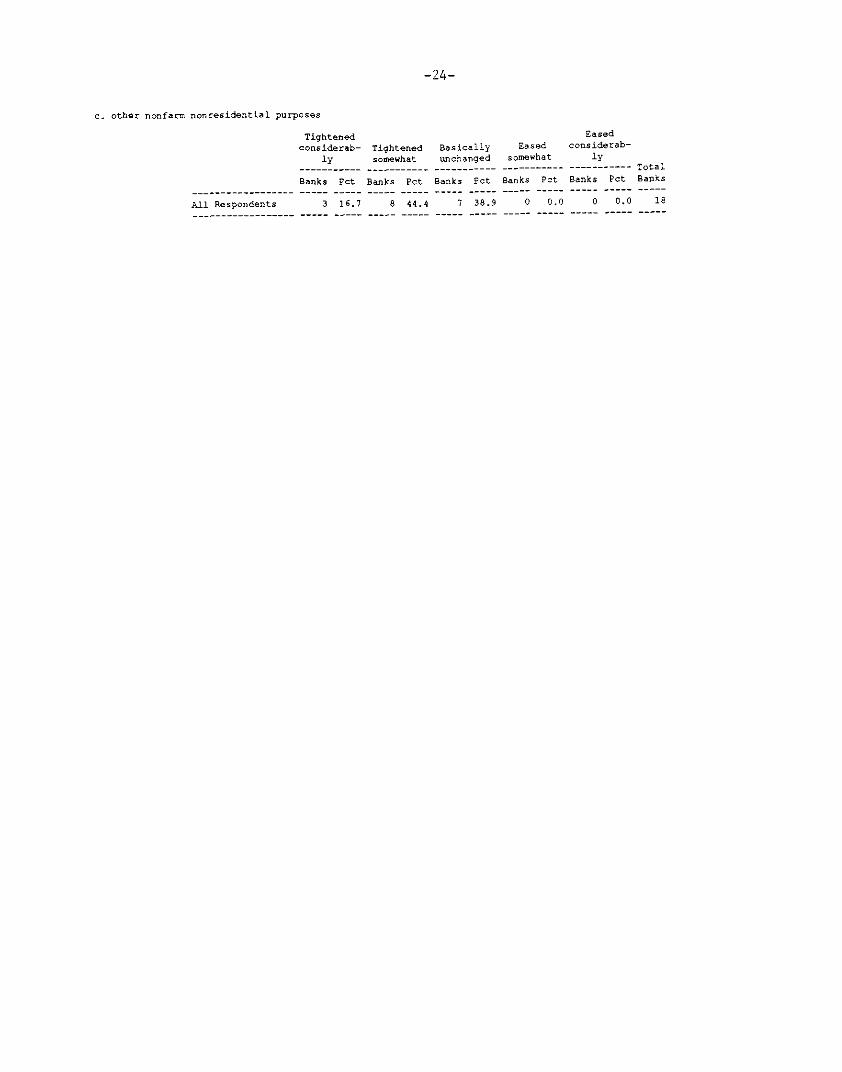
c. other nonfarm nonresidential purposes
All Respondents
Tightenedconsiderab-
ly
Banks Pct
3 16.7
Tightenedsomewhat
Banks Pct
8 44.4
Basicallyunchanged
Banks Pct
7 38.9
Easedsomewhat
Banks Pet
0 0.0
Easedconsiderab-
ly
Banks Pct
0 0.0
-25-
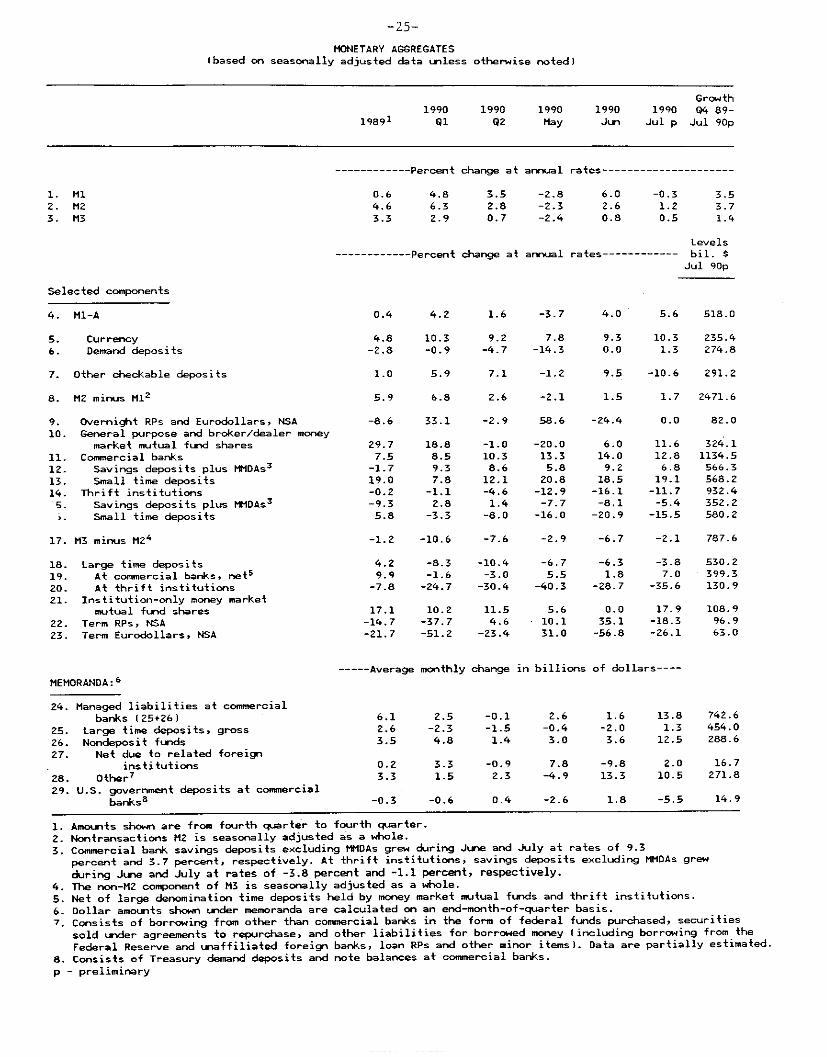
MONETARY AGGREGATES(based on seasonally adjusted data unless otherwise noted)
Growth1990 1990 1990 1990 1990 04 89-
19891 91 Q2 May Jun Jul p Jul 90p
------------ Percent change at annual rates---------------------
----------- Percent change at annualLevels
rates---------- bil. $Jul 90p
Selected components
4. Ml-A 0.4 4.2
5. Currency6. Demand deposits
7. Other checkable deposits
8. M2 minus M12
9. Overnight RPs and Eurodollars, NSA10. General purpose and broker/dealer money
market mutual fund shares11. Commercial banks12. Savings deposits plus MMDAs
3
13. Small time deposits14. Thrift institutions5. Savings deposits plus MMDAs
3
1. Small time deposits
17. M3 minus M24
18. Large time deposits19. At commercial banks, net 5
20. At thrift institutions21. Institution-only money market
mutual fund shares22. Term RPs, NSA23. Term Eurodollars, NSA
MEMORANDA: 6
24. Managed liabilities at commercialbanks (25+26)
25. Large time deposits, gross26. Nondeposit funds27. Net due to related foreign
institutions28. Other 7
29. U.S. government deposits at commercialbanks 8
1.6 -3.7
4.8 10.3-2.8 -0.9
1.0 5.9 7.1 -1.2
5.9 6.8 2.6 -2.1
-8.6 33.1 -2.9 58.6 -24.4
5.6 518.0
9.3 10.3 235.40.0 1.3 274.8
9.5 -10.6 291.2
1.5 1.7 2471.6
0.0 82.0
-1.2 -10.6 -7.6 -2.9 -6.7 -2.1 787.6
4.2 -8.39.9 -1.6
-7.8 -24.7
5.6 0.0 17.910.1 35.1 -18.331.0 -56.8 -26.1
----- Average monthly change in billions of dollars----
6.1 2.5 -0.1 2.6 1.6 13.8 742.62.6 -2.3 -1.5 -0.4 -2.0 1.3 454.03.5 4.8 1.4 3.0 3.6 12.5 288.6
0.2 3.3 -0.93.3 1.5 2.3
-0.3 -0.6
7.8 -9.8-4.9 13.3
0.4 -2.6
2.0 16.710.5 271.8
1.8 -5.5 14.9
1. Amounts shown are from fourth quarter to fourth quarter.2. Nontransactions M2 is seasonally adjusted as a whole.
3. Commercial bank savings deposits excluding MMDAs grew during June and July at rates of 9.3
percent and 3.7 percent, respectively. At thrift institutions, savings deposits excluding MMDAs grew
during June and July at rates of -3.8 percent and -1.1 percent, respectively.
4. The non-M2 component of M3 is seasonally adjusted as a whole.
5. Net of large denomination time deposits held by money market mutual funds and thrift institutions.
6. Dollar amounts shown under memoranda are calculated on an end-month-of-quarter basis.
7. Consists of borrowing from other than commercial banks in the form of federal funds purchased, securities
sold under agreements to repurchase, and other liabilities for borrowed money (including borrowing from the
Federal Reserve and unaffiliated foreign banks, loan RPs and other minor items). Data are partially estimated.
8. Consists of Treasury demand deposits and note balances at commercial banks.
p - preliminary
-26-
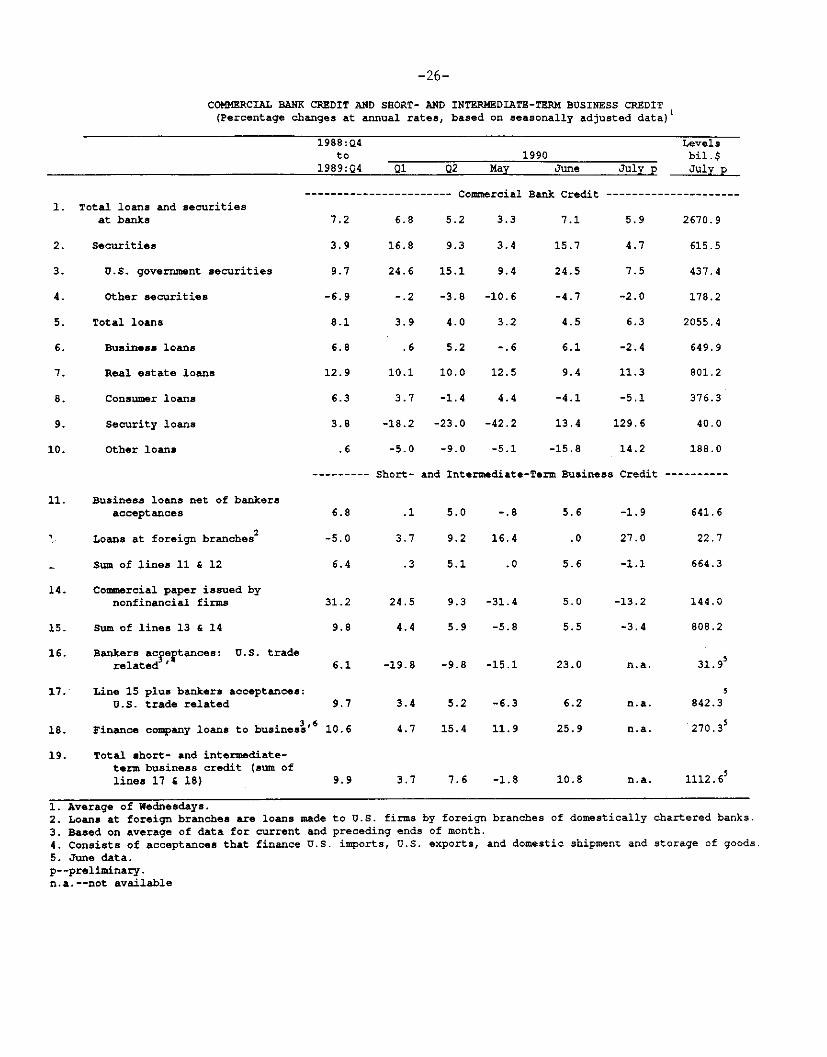
COMMERCIAL BANK CREDIT AND SHORT- AND INTERMEDIATE-TERM BUSINESS CREDIT(Percentage changes at annual rates, based on seasonally adjusted data)
1988:Q4to 1990
1989:Q4 Q1 Q2 May June
1. Total loans and securitiesat banks
2. Securities
3. U.S. government securities
4. Other securities
5. Total loans
6. Business loans
7. Real estate loans
8. Consumer loans
9. Security loans
.0. Other loans
1.
------------------- Commercial Bank Credit -
7.2 6.8 5.2 3.3 7.1
3.9 16.8 9.3 3.4 15.7
9.7 24.6 15.1 9.4 24.5
6.9 -.2 -3.8 -10.6 -4.7
8.1 3.9 4.0 3.2 4.5
6.8 .6 5.2 -.6 6.1
2.9 10.1 10.0 12.5 9.4
6.3 3.7 -1.4 4.4 -4.1
3.8 -18.2 -23.0 -42.2 13.4
.6 -5.0 -9.0 -5.1 -15.8
------ hort- and Intermediate-Term Business
r
11. Business loans net of bankersacceptances
S Loans at foreign branches
Sum of lines 11 & 12
14. Conmmercial paper issued bynonfinancial firms
15. Sum of lines 13 & 14
16. Bankers acceptances: U.S. traderelated '
17. Line 15 plus bankers acceptances:U.S. trade related
18. Finance company loans to business'
19. Total short- and intermediate-term business credit (sum oflines 17 & 18)
1. Average of Wednesdays.
24.5 9.3
4.4 5.9
6.1 -19.8 -9.8 -15.1
5.2 -6.3
15.4 11.9
9.9 3.7 7.6 -1.8
2. Loans at foreign branches are loans made to U.S. firms by foreign branches3. Based on average of data for current and preceding ends of month.
of domestically chartered banks.
4. Consists of acceptances that finance U.S. imports, U.S. exports, and domestic shipment and storage of goods.
5. June data.p--preliminary.n.a.--not available
Levelsbil.$
July p July p
--------------------
5.9 2670.9
4.7 615.5
7.5 437.4
-2.0 178.2
6.3 2055.4
-2.4 649.9
11.3 801.2
-5.1 376.3
129.6 40.0
14.2 188.0
Credit----------
----
n.a. 1112.65
-27-
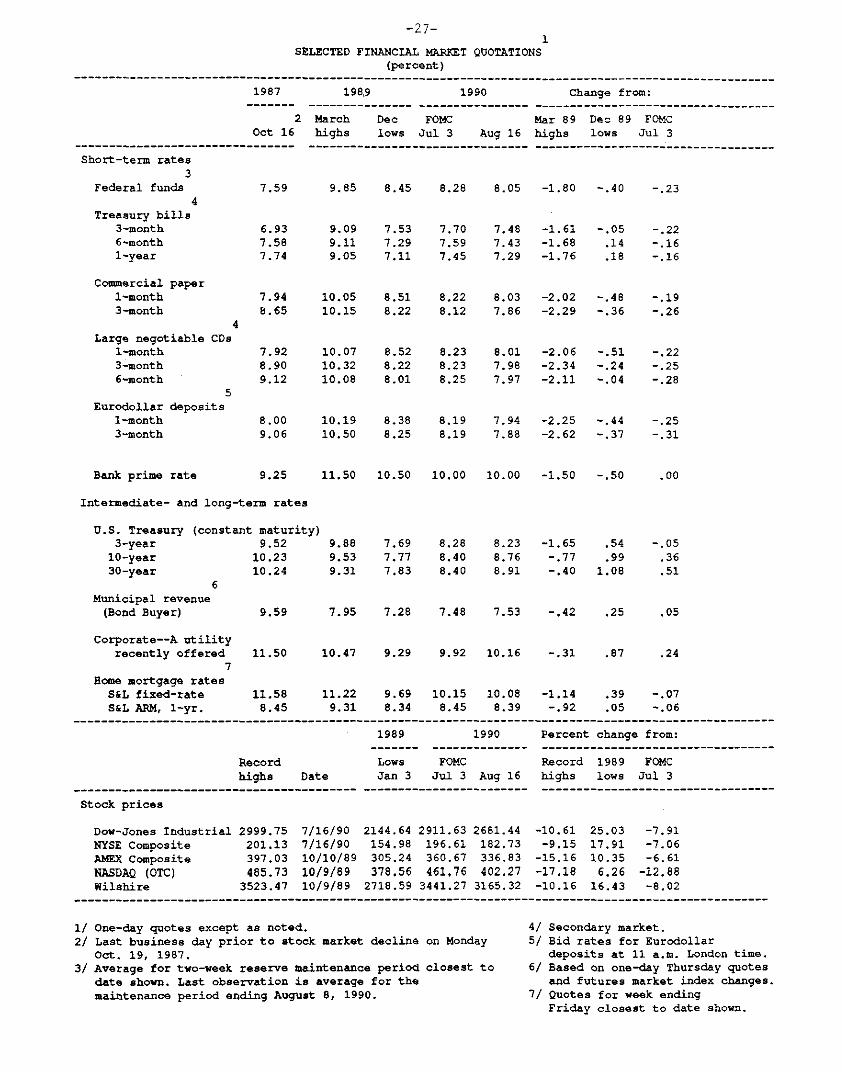
SELECTED FINANCIAL MARKET QUOTATIONS(percent)
1987 1989 1990
2 March Dec FOMCOct 16 highs lows Jul 3 Aug 16
Short-term rates3
Federal funds4
Treasury bills3-month6-month1-year
Commercial paper1-month3-month
Large negotiable CDs1-month3-month6-month
5Eurodollar deposits
1-month3-month
Bank prime rate
Change from:
Mar 89 Dec 89 FOMChighs lows Jul 3
9.85 8.45 8.28 8.05 -1.80 -.40 -.23
9.09 7.539.11 7.299.05 7.11
7.48 -1.617.43 -1.687.29 -1.76
-.05 -.22.14 -.16.18 -.16
7.94 10.05 8.51 8.22 8.03 -2.02 -.48 -.198.65 10.15 8.22 8.12 7.86 -2.29 -.36 -.26
8.01 -2.067.98 -2.347.97 -2.11
8.00 10.19 8.38 8.19 7.94 -2.25 -.44 -.259.06 10.50 8.25 8.19 7.88 -2.62 -.37 -.31
9.25 11.50 10.50 10.00 10.00 -1.50 -.50 .00
Intermediate- and long-term rates
U.S. Treasury (constant maturity)3-year 9.52
10-year 10.2330-year 10.24
9.88 7.699.53 7.779.31 7.83
8.28 8.23 -1.658.40 8.76 -.778.40 8.91 -.40
Municipal revenue(Bond Buyer)
Corporate--A utilityrecently offered
7Home mortgage rates
S&L fixed-rateS&L ARM, 1-yr.
9.59 7.95 7.28 7.48 7.53 -.42 .25 .05
11.50 10.47 9.29 9.92 10.16 -.31 .87 .24
11.58 11.22 9.69 10.15 10.08 -1.14 .39 -.078.45 9.31 8.34 8.45 8.39 -.92 .05 -.06
1989 1990 Percent change from:
Record Lows FOMC Record 1989 FOMChighs Date Jan 3 Jul 3 Aug 16 highs lows Jul 3
Stock prices
Dow-Jones Industrial 2999.75 7/16/90 2144.64 2911.63 2681.44 -10.61 25.03 -7.91NYSE Composite 201.13 7/16/90 154.98 196.61 182.73 -9.15 17.91 -7.06AMEX Composite 397.03 10/10/89 305.24 360.67 336.83 -15.16 10.35 -6.61NASDAQ (OTC) 485.73 10/9/89 378.56 461.76 402.27 -17.18 6.26 -12.88Wilshire 3523.47 10/9/89 2718.59 3441.27 3165.32 -10.16 16.43 -8.02
1/ One-day quotes except as noted.2/ Last business day prior to stock market decline on Monday
Oct. 19, 1987.3/ Average for two-week reserve maintenance period closest to
date shown. Last observation is average for themaintenance period ending August 8, 1990.
4/ Secondary market.5/ Bid rates for Eurodollar
deposits at 11 a.m. London time.6/ Based on one-day Thursday quotes
and futures market index changes.7/ Quotes for week ending
Friday closest to date shown.

-28-
THE INTERNATIONAL ECONOMY
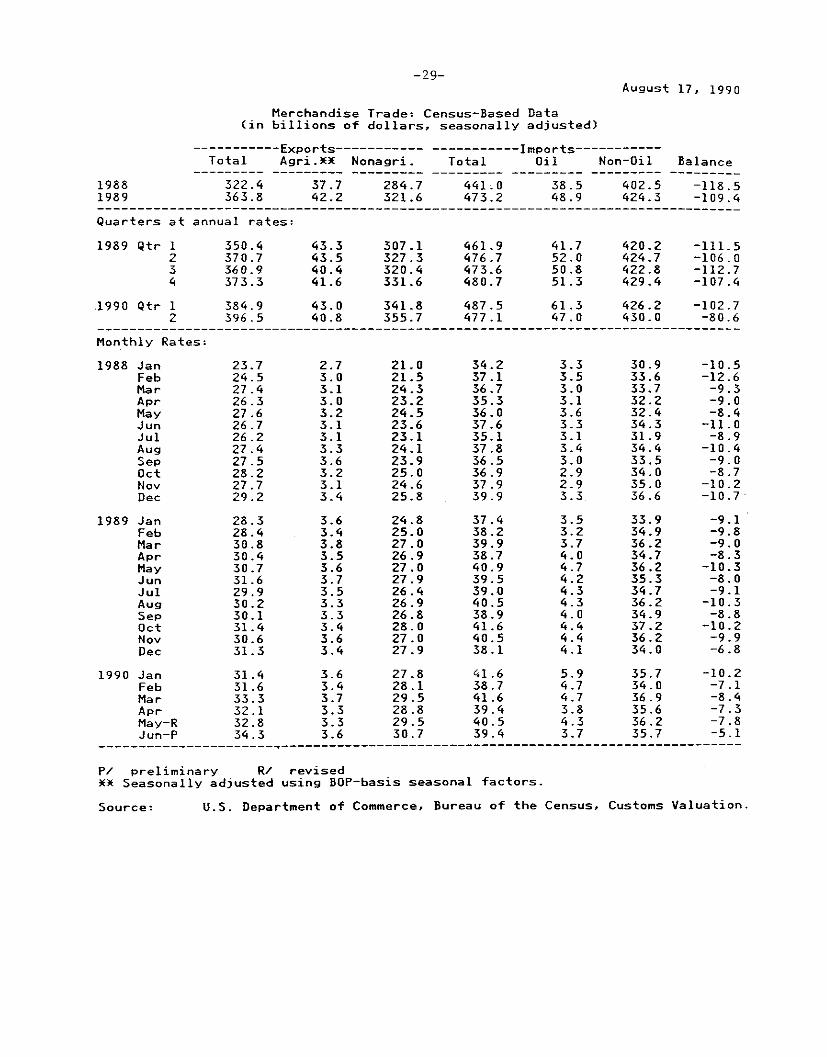
U.S. Merchandise Trade
Preliminary data for June indicate that the deficit for U.S.
merchandise trade narrowed to $5.1 billion (seasonally adjusted, Census
basis) from a deficit in May of $7.8 billion (revised). For the second
quarter, the deficit was substantially less than in the first quarter, and
was the lowest quarterly average recorded since 1983.
The value of exports rose nearly 5 percent in June from the May level,
with most of the increase in civilian aircraft and parts, consumer goods,
and agricultural products. For the second quarter as a whole, exports
increased 3 percent (not at an annual rate)--the third consecutive strong
quarterly gain. Nearly all of the increase in the second quarter was in
consumer goods, capital goods, and automotive products; the value of
agricultural exports declined. Exports to Western Europe were particularly
strong in the first half. Exports to Mexico also expanded at a strong rate.
The value of imports declined in June, with about half of the decrease
in oil (about equally split between price and quantity) and the remainder
spread among a broad range of categories. For the second quarter, imports
declined 2 percent. Most of the drop was in oil imports, as prices fell by
more than $3.75 per barrel reflecting strong OPEC production in the face of
a marginal increase in world demand, and the quantity imported decreased by
5 percent. Non-oil imports rose 1 percent in the second quarter; declines
in food, consumer goods, computers and semiconductors, were more than offset
by increases in automotive products (primarily from Canada), and industrial
supplies.
-29-August 17, 1990
Merchandise Trade: Census-Based Data(in billions of dollars, seasonally adjusted)
----------- Exports----------------------Imports--------Total Agri.XX Nonagri. Total Oil Non-Oil Balance
1988 322.4 37.7 284.7 441.0 38.5 402.5 -118.51989 363.8 42.2 321.6 473.2 48.9 424.3 -109.4
Quarters at annual rates:
1989 Qtr 1234
350.4370.7360.9373.3
307.1327.3320.4331.6
-111.5-106.0-112.7-107.4
1990 Qtr 1 384.92 396.5
Monthly Rates:
43.0 341.8 487.540.8 355.7 477.1
61.3 426.2 -102.747.0 430.0 -80.6
-10.5-12.6-9.3-9.0-8.4
-11.0-8.9
-10.4-9.0-8.7
-10.2-10.7
-9.1-9.8-9.0-8.3
-10.3-8.0-9.1
-10.3-8.8
-10.2-9.9-6.8
1988 JanFebMarAprMayJunJulAugSepOctNovDec
1989 JanFebMarAprMayJunJulAugSepOctNovDec
1990 JanFebMarAprMay-RJun-P
P/ preliminary R/ revised** Seasonally adjusted using BOP-basis seasonal factors.
U.S. Department of Commerce, Bureau of the Census, Customs Valuation.Source:
-30-
ERRATA
1. The first paragraph on page I-12 of the Greenbook should have read:
"The current account deficit in the alternative scenario is about
$10 billion greater in the second quarter of 1991 than shown in the current
Greenbook forecast. However, this difference diminishes after mid-1991 as
the level of GNP in the alternative scenario continues to fall below the
Greenbook path and reduces demand for imports."
2. The first sentence of the Domestic Financial Developments section
of Part 1 should have read:
"Short-term interest rates fell during July in response to the
announcement of a possible System easing and the subsequent 1/4 percentage
point drop in the federal funds rate on July 13."