Embed Size (px)
Citation preview
Prefatory Note
The attached document represents the most complete and accurate version available based on original copies culled from the files of the FOMC Secretariat at the Board of Governors of the Federal Reserve System. This electronic document was created through a comprehensive digitization process which included identifying the best-preserved paper copies, scanning those copies,1 and then making the scanned versions text-searchable.2 Though a stringent quality assurance process was employed, some imperfections may remain.
Please note that this document may contain occasional gaps in the text. These gaps are the result of a redaction process that removed information obtained on a confidential basis. All redacted passages are exempt from disclosure under applicable provisions of the Freedom of Information Act.
1 In some cases, original copies needed to be photocopied before being scanned into electronic format. All scanned images were deskewed (to remove the effects of printer- and scanner-introduced tilting) and lightly cleaned (to remove dark spots caused by staple holes, hole punches, and other blemishes caused after initial printing). 2 A two-step process was used. An advanced optimal character recognition computer program (OCR) first created electronic text from the document image. Where the OCR results were inconclusive, staff checked and corrected the text as necessary. Please note that the numbers and text in charts and tables were not reliably recognized by the OCR process and were not checked or corrected by staff.

CONFIDENTIAL (FR)CLASS III - FOMC
September 27, 1991
SUPPLEMENT
CURRENT ECONOMIC AND FINANCIAL CONDITIONS
Prepared for theFederal Open Market Committee
By the StaffBoard of Governors
of the Federal Reserve System
TABLE OF CONTENTS
Page
THE DOMESTIC NONFINANCIAL ECONOMY
Real GNP . . . . . . . . . . . . . . . . .. . . . .. . 1Personal income and outlays. .. . . . . . . . . . . . 2Insured unemployment . . . . . . . . . . . . . . . . . 3Erratum. . . . . . . . . . . . . . . . . ... . . .. . 4
TablesReal gross national product and related items . . . . 5Personal income. . . . . . . . . . . . . . . . . . . . 6Real personal consumption expenditures . . . . . . . . 6
Charts
Unemployment insurance . . . . . . . . . . . . . . . . 7Nonresidential construction and selected indicators. . 8
THE FINANCIAL ECONOMY
Erratum. . . . .. . . . . . . . . . . . . . . . . . . 9
Tables
Monetary aggregates . . . . . . . . ... . . . . . . . 10Commercial bank credit and short- and
intermediate-term business credit. . . . . . . . ... 11Selected financial market quotations . . . . . . . .. 12
THE INTERNATIONAL ECONOMY
Prices of imports and exports. . . . . . . . . . . .. .13Erratum. . . . . . . . . . . . . . ... .. . . . . . . 13
Table
Import and export price measures . . . . . . . . . . 1 4
SUPPLEMENTAL NOTES
THE DOMESTIC NONFINANCIAL ECONOMY
Real GNP
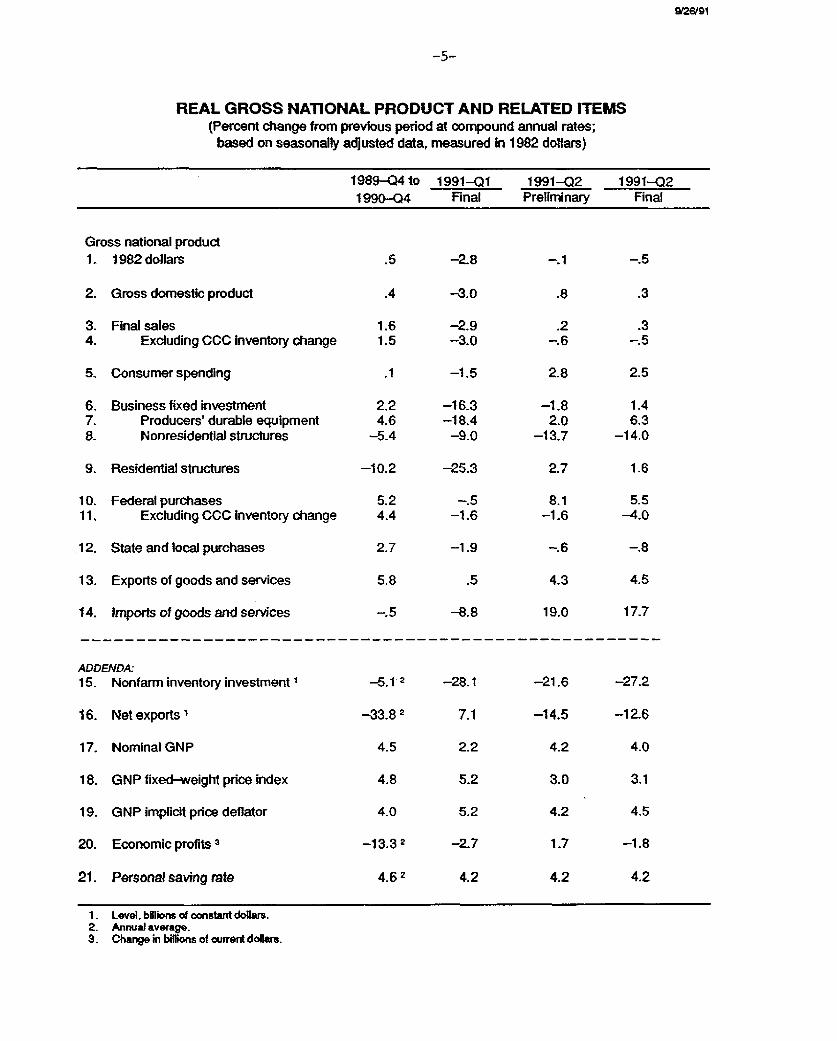
The BEA now estimates that real GNP declined at a 0.5 percent
annual rate in the second quarter, a downward revision of
0.4 percentage point from the previous estimate; real GDP is now
estimated to have edged up at a 0.3 percent rate. The revised
figures show a sharper liquidation of nonfarm inventories; these
stocks are now estimated to have run off at a $27.2 billion annual
rate in the second quarter, compared with the previous estimate of a
$21.6 billion drawdown. The estimate of final sales was essentially
unchanged, on balance, from the previous report; excluding changes
in CCC inventories, final sales are still shown to have edged down
in the second quarter, after having fallen at a 3 percent annual
rate in the first quarter. Prices, as measured by the GNP fixed-
weight index, rose at an annual rate of 3.1 percent in the second
quarter, up 0.1 percentage point from the previous estimate.
Based on more complete data, the BEA now estimates that
economic profits edged down 0.6 percent to a $284.4 billion annual
rate in the second quarter, a downward revision of $3-1/2 billion
from last month's estimate. Profits of domestic corporations are
still estimated to have turned up in the second quarter, though a
bit less strongly than previously reported, while profits from
foreign operations fell somewhat more sharply than was indicated in
the earlier estimate.
-2-
When measured in 1987 dollars, the BEA estimates that real GNP
edged up 0.4 percent at an annual rate in the second quarter, after
falling at a 2.8 percent rate in the first quarter.
Personal Income and Outlays
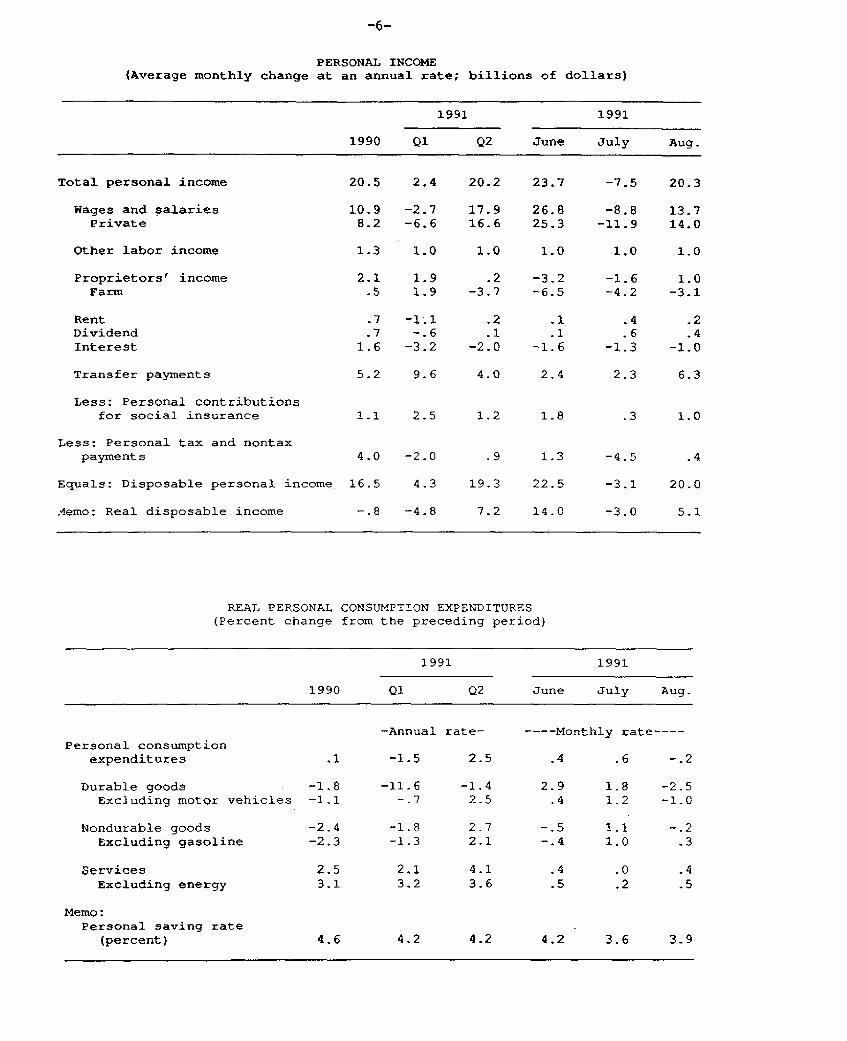
Personal income rose $20.3 billion at an annual rate in August,
after a decline of $7.5 billion in July. Private wages and salaries
increased $14 billion at an annual rate in August, accounting for
the bulk of the rise in personal income. Real disposable personal
income rose $5.1 billion in August, more than reversing the July
decrease of $3.0 billion. The average level of real DPI in July and
August was about 1/2 percent above its second-quarter average,
consistent with the staff's expectation that this series would post
a moderate gain in the third quarter.
Personal outlays rose only $3.3 billion in nominal terms in
August, with the increase held down by a decline in spending for
motor vehicles and parts. As a result of the small rise in outlays
relative to the increase in disposable income, the personal saving
rate moved up in August to 3.9 percent, from the 3.6 percent reading
in July.
Real personal consumption expenditures decreased 0.2 percent in
August, after rising 0.6 percent in July. In addition to the
decline in spending on motor vehicles and parts, a downturn in
outlays for furniture and appliances contributed to a
2.5 percent drop in spending for durable goods. Expenditures for
nondurable goods fell 0.2 percent, pushed down by lower outlays for
gasoline and oil. Meanwhile, spending on services increased 0.4
percent, reflecting gains in all major components. All told, the
average level of real PCE in July and August was nearly 1 percent

-3-
above its second-quarter average, supporting the staff's Greenbook
projection of a sizable rise in third-quarter consumer spending.
Insured Unemployment
Initial claims for unemployment insurance during the week ended
September 14, as seasonally adjusted by the staff, were unchanged
for a fifth week, suggesting little change in labor market
conditions since the mid-August reference week for the household and
payroll surveys. The official BLS series, which uses different
seasonal factors, rose sharply in the week ended September 14, after
declining noticeably in the preceding week. The FRB seasonal
adjustment procedures are specifically designed to deal with moving
holidays, and BLS officials currently are reviewing a proposal by
their staff to adopt methods of seasonal adjustment based on our
approach.
House and Senate conferees reached agreement on an unemployment
compensation bill that would provide a temporary package of extended
UI benefits to unemployed individuals who have exhausted their
regular benefits. The bill would provide a minimum of seven weeks
of additional benefits in all states, 13 weeks in states with total
unemployment rates of at least 7 percent, and a maximum of 20 weeks
of benefits in states with total unemployment rates of 8 percent or
more; the compromise would cover jobless workers who have exhausted
their regular UI benefits at any time since March 1, 1991. In
addition, the bill would automatically designate a budget emergency,
permitting the release of funds for the program. The conference
report now goes to the Senate and House floors for approval before
being sent to the President, who is expected to veto the
legislation.
-4-
In addition, the appendix to the nonfinancial Greenbook
included a chart on the Department of Labor's UI benefit exhaustion
rate. That rate is defined as the number of persons who exhausted
their UI benefits in a given month as a percentage of the number of
persons who began receiving benefits six months earlier (first
payments). The rate is reported as a 12-month moving average to
eliminate seasonal fluctuations.
Erratum
On page I-7 in part 1 of the Greenbook, the sentence at the
bottom of the page should read: "Constraints on credit availability
are expected to ease gradually as the expansion progresses and asset
quality improves."
1. First payments are approximately equal to the number ofinitial claims excluding those declared ineligible for benefits,lagged one or two weeks to reflect the time between the initialclaim and the issuance of the first UI benefit check.
9/26/91
-5-
REAL GROSS NATIONAL PRODUCT AND RELATED ITEMS(Percent change from previous period at compound annual rates;
based on seasonally adjusted data, measured in 1982 dollars)
1989-Q4 to 1991-01 1991-Q2 1991-Q21990-Q4 Final Preliminary Final
Gross national product1. 1982 dollars .5 -2.8 -. 1 -. 5
2. Gross domestic product .4 -3.0 .8 .3
3. Final sales 1.6 -2.9 .2 .34. Excluding CCC Inventory change 1.5 -3.0 -. 6 -. 5
5. Consumer spending .1 -1.5 2.8 2.5
6. Business fixed investment 2.2 -16.3 -1.8 1.47. Producers' durable equipment 4.6 -18.4 2.0 6.38. Nonresidential structures -5.4 -9.0 -13.7 -14.0
9. Residential structures -10.2 -25.3 2.7 1.6
10. Federal purchases 5.2 -. 5 8.1 5.511, Excluding CCC inventory change 4.4 -1.6 -1.6 -4.0
12. State and local purchases 2.7 -1.9 -. 6 -. 8
13. Exports of goods and services 5.8 .5 4.3 4.5
14. Imports of goods and services -. 5 -8.8 19.0 17.7
ADDENDA:15. Nonfarm inventory investment -5.1 2 -28.1 -21.6 -27.2
16. Net exports 1 -33.82 7.1 -14.5 -12.6
17. Nominal GNP 4.5 2.2 4.2 4.0
18. GNP fixed-weight price index 4.8 5.2 3.0 3.1
19. GNP implicit price deflator 4.0 5.2 4.2 4.5
20. Economic profits 3 -13.32 -2.7 1.7 -1.8
21. Personal saving rate 4.62 4.2 4.2 4.2
1. Level, bIlions of constant dollars.2. Annualaverage.3. Change in billions of current dollars.
PERSONAL INCOME(Average monthly change at an annual rate; billions of dollars)
1991 1991
1990 Q1 Q2 June July Aug.
Total personal income 20.5 2.4 20.2 23.7 -7.5 20.3
Wages and salaries 10.9 -2.7 17.9 26.8 -8.8 13.7Private 8.2 -6.6 16.6 25.3 -11.9 14.0
Other labor income 1.3 1.0 1.0 1.0 1.0 1.0
Proprietors' income 2.1 1.9 .2 -3.2 -1.6 1.0Farm .5 1.9 -3.7 -6.5 -4.2 -3.1
Rent .7 -1.1 .2 .1 .4 .2Dividend .7 -.6 .1 .1 .6 .4Interest 1.6 -3.2 -2.0 -1.6 -1.3 -1.0
Transfer payments 5.2 9.6 4.0 2.4 2.3 6.3
Less: Personal contributionsfor social insurance 1.1 2.5 1.2 1.8 .3 1.0
Less: Personal tax and nontaxpayments 4.0 -2.0 .9 1.3 -4.5 .4
Equals: Disposable personal income 16.5 4.3 19.3 22.5 -3.1 20.0
Aemo: Real disposable income -.8 -4.8 7.2 14.0 -3.0 5.1
REAL PERSONAL CONSUMPTION EXPENDITURES(Percent change from the preceding period)
1991 1991
1990 Q1 Q2 June July Aug.
-Annual rate- ----Monthly rate----Personal consumption
expenditures .1 -1.5 2.5 .4 .6 -.2
Durable goods -1.8 -11.6 -1.4 2.9 1.8 -2.5Excluding motor vehicles -1.1 -.7 2.5 .4 1.2 -1.0
Nondurable goods -2.4 -1.8 2.7 -.5 1.1 -.2Excluding gasoline -2.3 -1.3 2.1 -. 4 1.0 .3
Services 2.5 2.1 4.1 .4 .0 .4Excluding energy 3.1 3.2 3.6 .5 .2 .5
Memo:Personal saving rate
(percent) 4.6 4.2 4.2 4.2 3.6 3,9

-7-
9/27/91
Unemployment InsuranceSeasonally Adjusted
INITIAL CLAIMS Thousands
wtth FRB seasonals- --- with BLS seasonals
, - 500
1 i i
II
V tI' I I i i
II I 415
/ / i sep. 14
\• ? VRegular state programs
3001990 1991
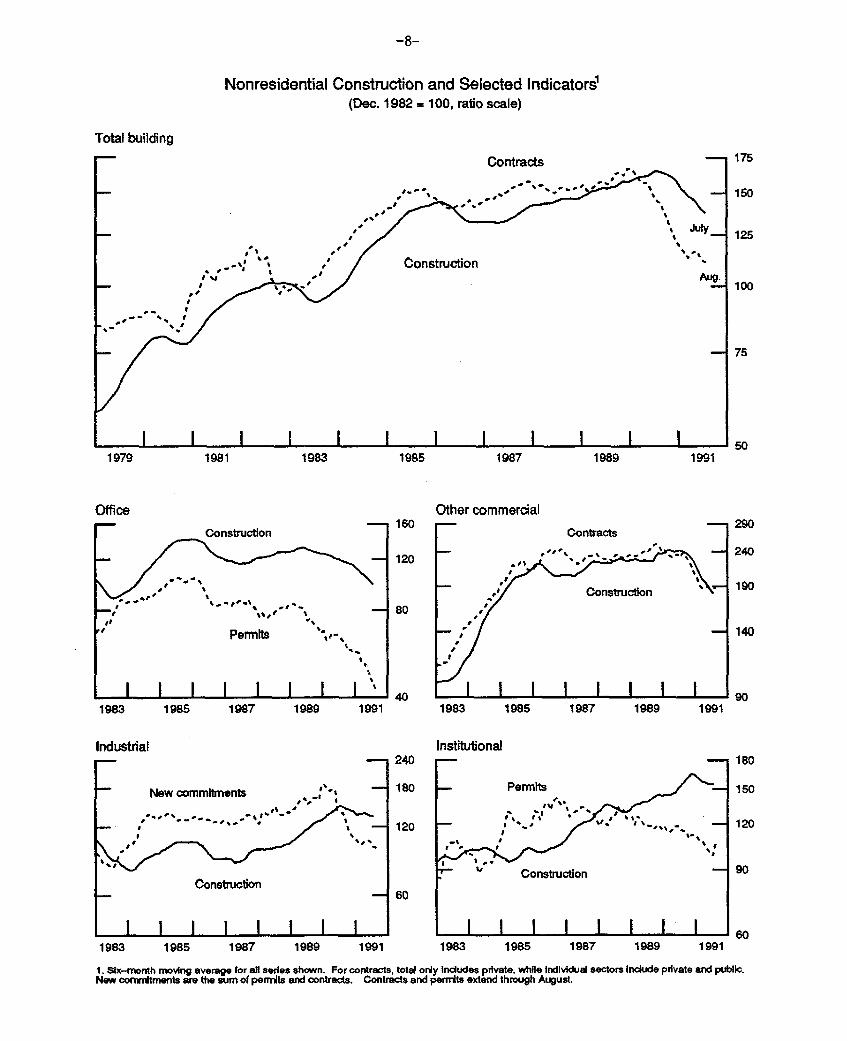
Nonresidential Construction and Selected Indicators 1(Dec. 1982 = 100, ratio scale)
Total building
1979 1981 1983 1985 1987 1989 1991
- 160Construction
" Permits .I %/
I I~ I I 1 I 1 1 "1983 1985 1987 1989
180
1991
Industrial-- i 240
- New commitments r 180
I '
Construction
1 I I I I I I I
- 60
Other commercial
1983 1985 1987 1989 1991
Institutional- - 180
-Permits -_ 150
Construction 90
I I I I L I I I1983 1985 1987 1989 1991 1983 1985 1987 1989 1991
1. Six-month moving average for all series shown. For contracts, total only indudes private, while individual sectors include private and public.New conrftments are the sum of permits and contracts. Contracts and permits extend through August.
Officei-
-9-
THE FINANCIAL ECONOMY
Erratum
On page III-1 in part 2 of the Greenbook the second sentence in
the second paragraph should read: "M2 was about unchanged last
month, and for the third quarter as a whole its velocity appears
likely to increase at around a 4 percent rate, despite the decline
in market interest rates over the past several quarters."
-10-
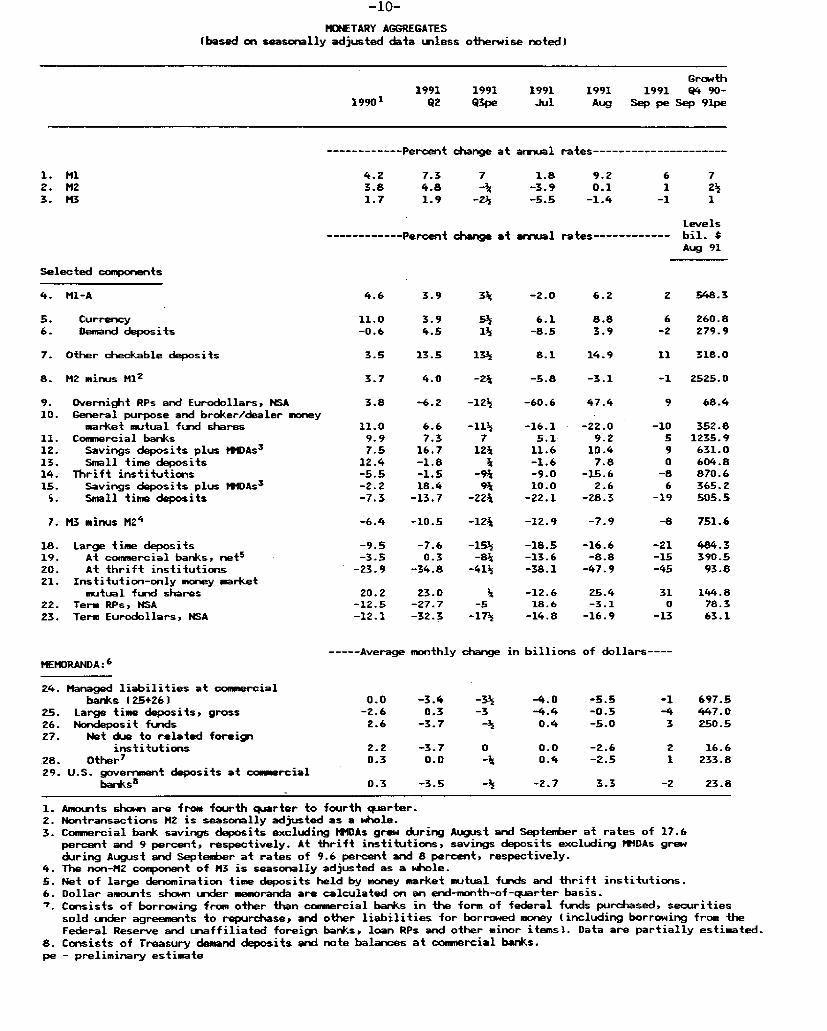
MONETARY AGGREGATES(based on seasonally adjusted data unless otherwise noted)
1991 1991 199119901 Q2 Q3pe Jul
----------- Percent change at annual
Growth1991 1991 04 90-
Aug Sep pe Sep 91pe
rates---------------------
4.2 7.33.8 4.81.7 1.9
7 1.8-¾ -3.9
-24 -5.5
------------ Percent change at annualLevels
rates------------ bil. *Aug 91
Selected components
4. MN-A
5. Currency6. Demand deposits
3.9 3- -2.0 6.2
11.0 3.9 5 6.1 8.8-0.6 4.5 14 -8.5 3.9
7. Other checkable deposits
8. M2 minus M12
Overnight RPs and Eurodollars, NSA0. General purpose and broker/dealer money
market mutual fund shares1. Commercial banks2. Savings deposits plus MMDAs
3
3. Small time deposits4. Thrift institutions5. Savings deposits plus MMDAs
3
S. Small time deposits
7. M3 minus M24
18. Large time deposits19. At commercial banks, net s
20. At thrift institutions21. Institution-only money market
mutual fund shares22. Term RPs, NSA23. Term Eurodollars, NSA
3.5 13.5 13h 8.1 14.9
3.7 4.0 -2J -5.8 -3.1
3.8 -6.2 -12½ -60.6 47.4
11.09.97.5
12.4-5.5-2.2-7.3
6.67.3
16.7-1.8-1.518.4
-13.7
-16.15.111.6-1.6-9.010.0
-22.1
2 548.3
6 260.8-2 279.9
11 318.0
-1 2525.0
9 68.4
-22.09.2
10.47.8
-15.62.6
-28.3
-6.4 -10.5 -121 -12.9 -7.9
-9.5-3.5
-23.9
20.2-12.5-12.1
-7.60.3
-34.8
23.0-27.7-32.3
-15' -18.5-8E -13.6-414 -38.1
-5-174
-12.618.6
-14.8
-16.6-8.8
-47.9
25.4-3.1
-16.9
352.81235.9631.0604.8870.6365.2505.5
----- Average monthly change in billions of dollars----MEMORANDA:
24. Managed liabilities at commercialbanks (25+26)
25. Large time deposits, gross26. Nondeposit funds27. Net due to related foreign
institutions28. Other
7
29. U.S. government deposits at commercialbanks8
0.0 -3.4 -3h -4.0-2.6 0.3 -3 -4.42.6 -3.7 -4 0.4
2.2 -3.70.3 0.0
0.3 -3.5
-5.5-0.5-5.0
0 0.0 -2.6-4 0.4 -2.5
-k -2.7 3.3
1. Amounts shown are from fourth quarter to fourth quarter.2. Nontransactions MH is seasonally adjusted as a whole.3. Commercial bank savings deposits excluding HMDAs grew during August and September at rates of 17.6
percent and 9 percent, respectively. At thrift institutions, savings deposits excluding MMDAs grewduring August and September at rates of 9.6 percent and 8 percent, respectively.
4. The non-M2 component of M3 is seasonally adjusted as a whole.5. Net of large denomination time deposits held by money market mutual funds and thrift institutions.6. Dollar amounts shown under memoranda are calculated on an end-month-of-quarter basis.7. Consists of borrowing from other than commercial banks in the form of federal funds purchased, securities
sold under agreements to repurchase, and other liabilities for borrowed money (including borrowing from theFederal Reserve and unaffiliated foreign banks, loan RPs and other minor items). Data are partially estimated.
8. Consists of Treasury demand deposits and note balances at commercial banks.pe - preliminary estimate
1. Ml2. M23. M3
9.20.1
-1.4
6 71 24
-1 1
-8 751.6
-21 484.3-15 390.5-45 93.8
31 144.80 78.3
-13 63.1
697.5447.0250.5
2 16.61 233.8
-2 23.8
-11-
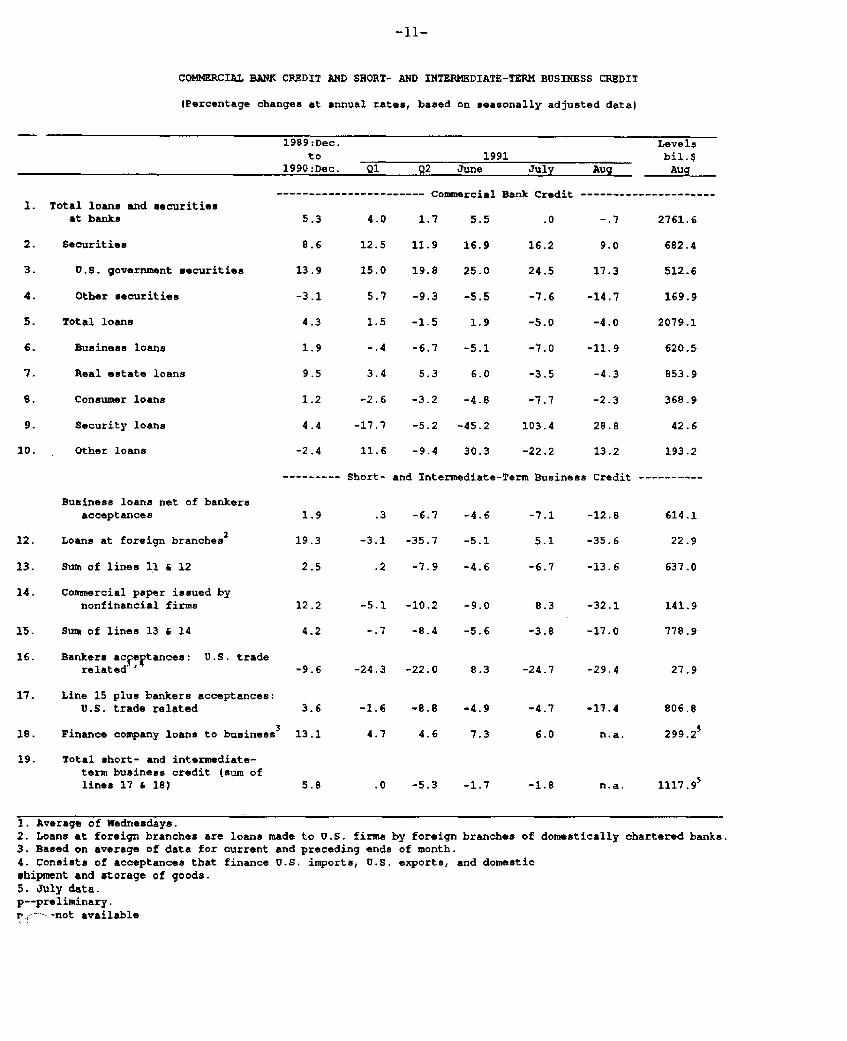
COMMERCIAL BANK CREDIT AND SHORT- AND INTERMEDIATE-TERM BUSINESS CREDIT
(Percentage changes at annual rates, based on seasonally adjusted data)
1989:Dec.to
1990:Dec. Q1 02 June
1. Total loans and securitiesat banks
2. Securities
3. U.S. government securities
4. Other securities
5. Total loans
6. Business loans
7. Real estate loans
S. Consumer loans
9. Security loans
LO. Other loans
5.3
8.6
13.9
-3.1
4.3
1.9
9.5
1.2
4.4
-2.4
1
1
-1
1
Sho
1991July
--------- Commercial Bank Credit -
4.0 1.7 5.5 .0
2.5 11.9 16.9 16.2
.5.0 19.8 25.0 24.5
5.7 -9.3 -5.5 -7.6
1.5 -1.5 1.9 -5.0
-. 4 -6.7 -5.1 -7.0
3.4 5.3 6.0 -3.5
2.6 -3.2 -4.8 -7.7
.7.7 -5.2 -45.2 103.4
1.6 -9.4 30.3 -22.2
.rt- and Intermediate-Term Business
Business loans net of bankersacceptances
12. Loans at foreign branches2
13. Sum of lines 11 & 12
14. Commercial paper issued bynonfinancial firms
15. Sum of lines 13 & 14
16. Bankers acceptances: U.S. traderelated '
17. Line 15 plus bankers acceptances:U.S. trade related
18. Finance company loans to business3
19. Total short- and intermediate-term business credit (sum oflines 17 & 18)
1,9
19.3
2.5
12.2
4.2
.3
-3.1
.2
-6.7
-35.7
-7.9
-5.1 -10.2
-.7 -8.4
-4.6
-5.1
-4.6
-9.0
-5.6
-7.1
5.1
-6.7
8.3 -32.1
-3.8 -17.0
-9.6 -24.3 -22.0 8.3 -24.7 -29.4
3.6
13.1
5.8
-1.6 -8.8
4.7 4.6
-4.9
7.3
.0 -5.3 -1.7
-4.7
6.0
-1.8
1. Average of Wednesdays.2. Loans at foreign branches are loans made to U.S. firms by foreign branches of3. Based on average of data for current and preceding ends of month.4. Consists of acceptances that finance U.S. imports, U.S. exports, and domesticshipment and storage of goods.5. July data.p--preliminary.P' -- not available
domestically chartered banks.
-12.8
-35.6
-13.6
614.1
22.9
637.0
141.9
778.9
27.9
806.8
299.25
-17.4
n.a.
__ __
-
Levelsbil.$
Aug Aug
--------------------
-.7 2761.6
9.0 682.4
17.3 512.6
-14.7 169.9
-4.0 2079.1
-11.9 620.5
-4.3 853.9
-2.3 368.9
28.8 42.6
13.2 193.2
Credit ----------
n.a. 1117.9 5
-12-
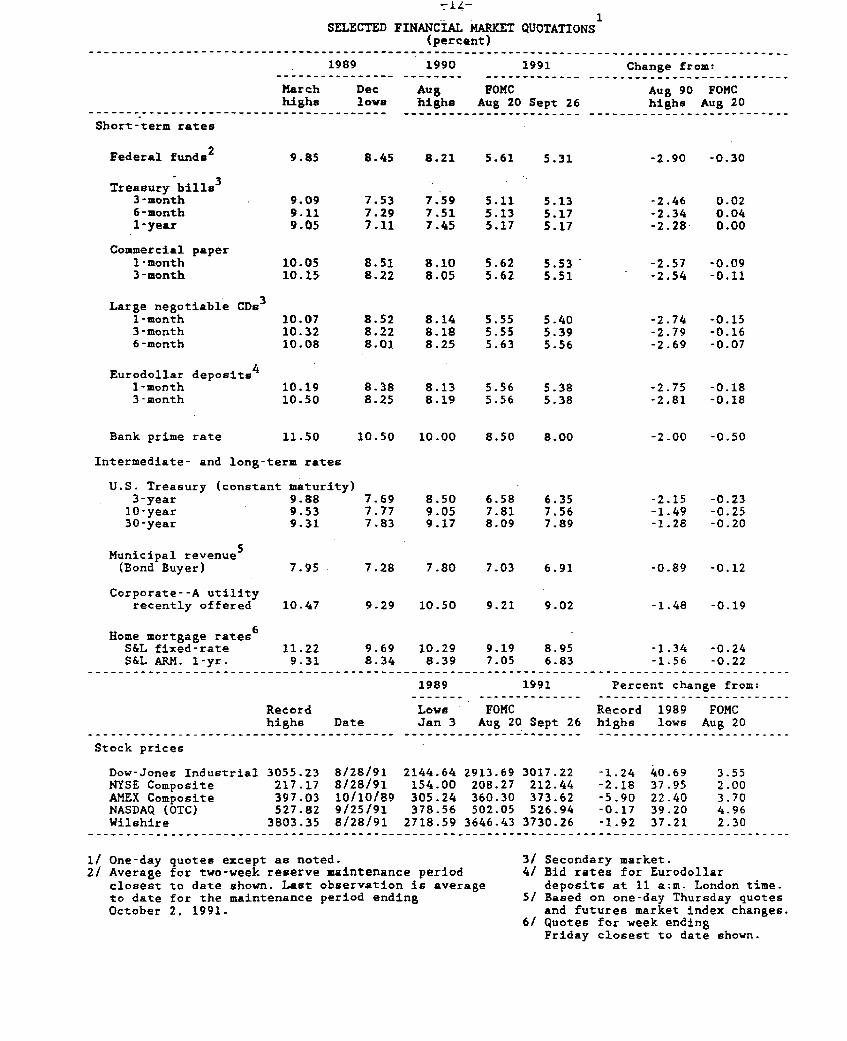
SELECTED FINANCIAL MARKET QUOTATIONS(percent)
1989
March Dechighs lowe
1990 1991
Aug FOMChighs Aug 20 Sept 26
Change from:
Aug 90 FOMChighs Aug 20
Short-term rates
Federal funds 2
Treasury bills 3
3-month6-month1-year
Commercial paper1-month3-month
Large negotiable CDs3
1-month3-month6-month
Eurodollar deposits4
1-month3-month
Bank prime rate
9.85
9.099.119.05
10.0510.15
10.0710.3210.08
10.1910.50
11.50
8.45 8.21 5.61 5.31
7.537.297.11
7.597.517.45
5.115.135.17
-2.90 -0.30
5.135.175.17
-2.46-2.34-2.28
8.51 8-10 5.62 5.538.22 8.05 5.62 5.51
8.528.228.01
8.148.188.25
5.555.555.63
5.405.395.56
0.020.040.00
-2.57 -0.09-2.54 -0.11
-2.74-2.79-2.69
8.38 8.13 5.56 5.388.25 8.19 5.56 5.38
10.50 10.00 8.50 8.00
-0.15-0.16-0.07
-2.75 -0.18-2.81 -0.18
-2-00 -0.50
Intermediate- and long-term rates
U.S. Treasury (constant maturity)3-year 9.8810-year 9.5330-year 9.31
Municipal revenue5
(Bond Buyer)
Corporate--A utilityrecently offered
Home mortgage rates6
S&L fixed-rateS&L ARM. 1-yr.
7.95
10.47
11.229.31
Recordhighs Date
-----------------------------------------
7.28 7.80 7.03 6.91
9.29 10.50 9.21 9.02
9.69 10.29 9.19 8.958.34 8.39 7.05 6.83
1989 1991
Lowv FOMCJan 3 Aug 20 Sept 26
-0.89 -0.12
-1.48 -0.19
-1.34 -0.24-1.56 -0.22
Percent change from:
Record 1989 FOMChighs lows Aug 20- - - - - - - - - - - - - - - - - - - - - - . .
Stock prices
Dow-Jones Industrial 3055.23 8/28/91 2144.64 2913.69 3017.22 -1.24 40.69 3.55NYSE Composite 217.17 8/28/91 154.00 208.27 212.44 -2.18 37.95 2.00AMEX Composite 397.03 10/10/89 305.24 360.30 373.62 -5.90 22.40 3.70NASDAQ (OTC) 527.82 9/25/91 378.56 502.05 526.94 -0.17 39.20 4.96Wilshire 3803.35 8/28/91 2718.59 3646.43 3730.26 -1.92 37.21 2.30
One-day quotes except as noted.Average for two-week reserve maintenance periodclosest to date shown. Last observation is averageto date for the maintenance period endingOctober 2. 1991.
3/ Secondary market.4/ Bid rates for Eurodollar
deposits at 11 a;m. London time.5/ Based on one-day Thursday quotes
and futures market index changes.6/ Quotes for week ending
Friday closest to date shown.
7.697.777.83
8.509.059.17
6.587.818.09
6.357.567.89
-2.15-1.49-1.28
-0.23-0.25-0.20
-13-
THE INTERNATIONAL ECONOMY
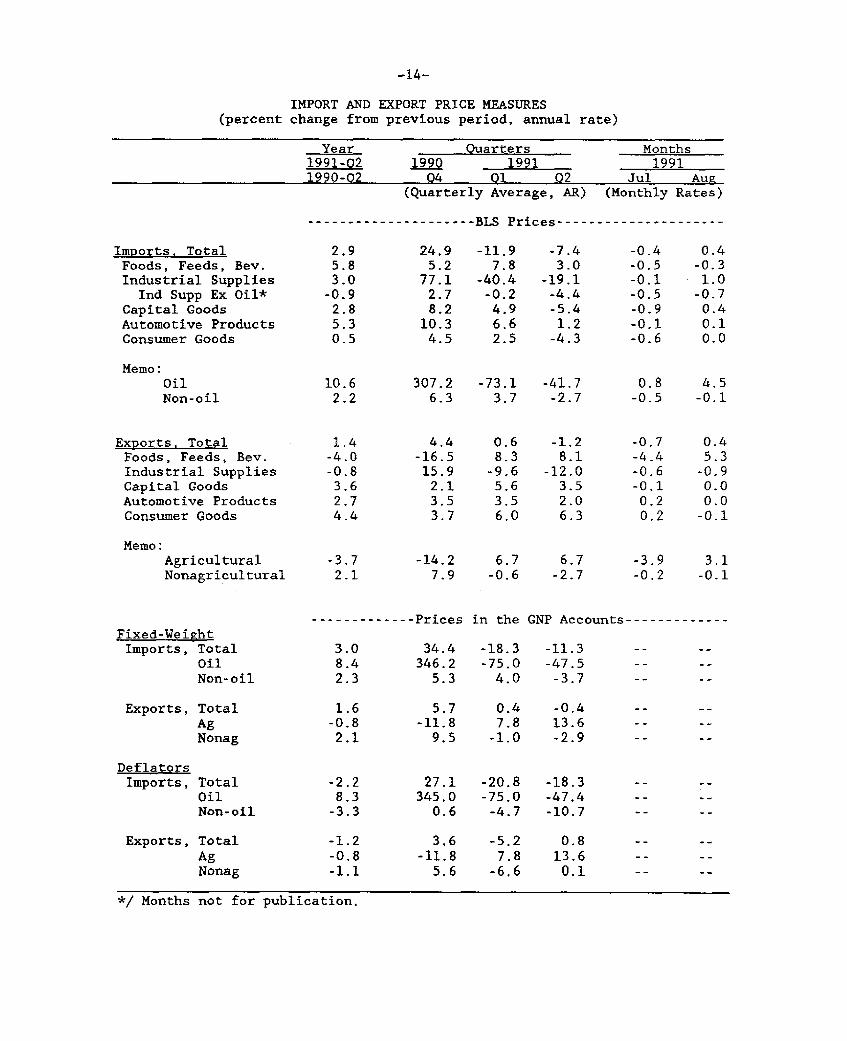
Prices of Imports and Exports
Import prices reported by the Bureau of Labor Statistics showed
a rise of 0.4 percent in August. The price of oil imports rose
sharply, and that of non-oil imports fell slightly, with declines
concentrated in food and industrial supplies.
Non-agricultural export prices also fell slightly in August,
with declines concentrated in industrial supplies.
Erratum
On page 1-34 in part 1 of the Greenbook, the sentence at the
bottom of the page should read: "Exports of corn to the Soviet
Union increased sharply in July, and weekly data from the Department
of Agriculture indicate continued strength through the first half of
September."
-14-
IMPORT AND EXPORT PRICE MEASURES(percent change from previous period, annual rate)
Year Quarters Months1991-Q2 1990 1991 19911990-Q2 Q4 Q1 Q2 Jul Aug
(Quarterly Average, AR) (Monthly Rates)
--------------------- BLS Prices---------------------
Imports, Total 2.9 24.9 -11.9 -7.4 -0.4 0.4Foods, Feeds, Bev. 5.8 5.2 7.8 3.0 -0.5 -0.3Industrial Supplies 3.0 77.1 -40.4 -19.1 -0.1 1.0
Ind Supp Ex Oil* -0.9 2.7 -0.2 -4.4 -0.5 -0.7Capital Goods 2.8 8.2 4.9 -5.4 -0.9 0.4Automotive Products 5.3 10.3 6.6 1.2 -0.1 0.1Consumer Goods 0.5 4.5 2.5 -4.3 -0.6 0.0
Memo:Oil 10.6 307.2 -73.1 -41.7 0.8 4.5Non-oil 2.2 6.3 3.7 -2.7 -0.5 -0.1
Exports, Total 1.4 4.4 0.6 -1.2 -0.7 0.4Foods, Feeds, Bev. -4.0 -16.5 8.3 8.1 -4.4 5.3Industrial Supplies -0.8 15.9 -9.6 -12.0 -0.6 -0.9Capital Goods 3.6 2.1 5.6 3.5 -0.1 0.0Automotive Products 2.7 3.5 3.5 2.0 0.2 0.0Consumer Goods 4.4 3.7 6.0 6.3 0.2 -0.1
Memo:Agricultural -3.7 -14.2 6.7 6.7 -3.9 3.1Nonagricultural 2.1 7.9 -0.6 -2.7 -0.2 -0.1
------------- Prices in the GNP Accounts-------------Fixed-WeightImports, Total 3.0 34.4 -18.3 -11.3
Oil 8.4 346.2 -75.0 -47.5Non-oil 2.3 5.3 4.0 -3.7
Exports, Total 1.6 5.7 0.4 -0.4
Ag -0.8 -11.8 7.8 13.6Nonag 2.1 9.5 -1.0 -2.9
DeflatorsImports, Total -2.2 27.1 -20.8 -18.3
Oil 8.3 345.0 -75.0 -47.4Non-oil -3.3 0.6 -4.7 -10.7
Exports, Total -1.2 3.6 -5.2 0.8
Ag -0.8 -11.8 7.8 13.6Nonag -1.1 5.6 -6,6 0.1
*/ Months not for publication.