Embed Size (px)
Citation preview

Prefatory Note
The attached document represents the most complete and accurate version available based on original copies culled from the files of the FOMC Secretariat at the Board of Governors of the Federal Reserve System. This electronic document was created through a comprehensive digitization process which included identifying the best-preserved paper copies, scanning those copies,1 and then making the scanned versions text-searchable.2 Though a stringent quality assurance process was employed, some imperfections may remain.
Please note that this document may contain occasional gaps in the text. These gaps are the result of a redaction process that removed information obtained on a confidential basis. All redacted passages are exempt from disclosure under applicable provisions of the Freedom of Information Act.
1 In some cases, original copies needed to be photocopied before being scanned into electronic format. All scanned images were deskewed (to remove the effects of printer- and scanner-introduced tilting) and lightly cleaned (to remove dark spots caused by staple holes, hole punches, and other blemishes caused after initial printing). 2 A two-step process was used. An advanced optimal character recognition computer program (OCR) first created electronic text from the document image. Where the OCR results were inconclusive, staff checked and corrected the text as necessary. Please note that the numbers and text in charts and tables were not reliably recognized by the OCR process and were not checked or corrected by staff.
Confidential (FR) Class III FOMC
March 15, 2002
CURRENT ECONOMICAND FINANCIAL CONDITIONS
Supplemental Notes
Prepared for the Federal Open Market Committeeby the staff of the Board of Governors of the Federal Reserve System

Contents
Domestic Nonfinancial Economy . . . . . . . . . . . . . . . . . . . . . . . . . . . . . . . 1
Industrial Production . . . . . . . . . . . . . . . . . . . . . . . . . . . . . . . . . . . 1Business Inventories . . . . . . . . . . . . . . . . . . . . . . . . . . . . . . . . . . . . 3Consumer Sentiment . . . . . . . . . . . . . . . . . . . . . . . . . . . . . . . . . . . . 6Producer Prices . . . . . . . . . . . . . . . . . . . . . . . . . . . . . . . . . . . . . . . 6
TablesSelected Components of Industrial Production . . . . . . . . . . 2Capacity Utilization . . . . . . . . . . . . . . . . . . . . . . . . . . . . . . 2Changes in Manufacturing and Trade Inventories . . . . . . . . 4Selected Inventory-Sales Ratios in Manufacturing
and Trade . . . . . . . . . . . . . . . . . . . . . . . . . . . . . . . . . . . 4University of Michigan Survey Research Center:
Survey of Consumer Attitudes . . . . . . . . . . . . . . . . . . . 7Recent Changes in Producer Prices . . . . . . . . . . . . . . . . . . 9Recent Changes in Producer Prices—
Relative Contribution . . . . . . . . . . . . . . . . . . . . . . . . . . 9
ChartInventory-Sales Ratios . . . . . . . . . . . . . . . . . . . . . . . . . . . . 5
The Domestic Financial Economy . . . . . . . . . . . . . . . . . . . . . . . . . . . . . 10
TableSelected Financial Market Quotations . . . . . . . . . . . . . . . 11Commercial Bank Credit . . . . . . . . . . . . . . . . . . . . . . . . . 12
The International Economy . . . . . . . . . . . . . . . . . . . . . . . . . . . . . . . . . . 13
Prices of Internationally Traded Goods . . . . . . . . . . . . . . . . . . . . 13Oil . . . . . . . . . . . . . . . . . . . . . . . . . . . . . . . . . . . . . . . . . . . . . 13Non-oil Imports . . . . . . . . . . . . . . . . . . . . . . . . . . . . . . . . . . . 13Exports . . . . . . . . . . . . . . . . . . . . . . . . . . . . . . . . . . . . . . . . . . 13U.S. Current Account Through 2001:Q4 . . . . . . . . . . . . . . . . . 13
U.S. International Financial Transactions . . . . . . . . . . . . . . . . . . . 15
TablesPrices of U.S. Imports and Exports . . . . . . . . . . . . . . . . . . 14
i
U.S. Current Account . . . . . . . . . . . . . . . . . . . . . . . . . . . . 15Summary of U.S. International Transactions . . . . . . . . . . . 17
ChartOil Prices . . . . . . . . . . . . . . . . . . . . . . . . . . . . . . . . . . . . . 14
ii
1. Production in the fourth quarter was also revised up, in large part due to stronger outputof semiconductors.
2. Scheduled completions by producers of civilian aircraft suggest that the steep declines inproduction in that industry will persist in the near term.
Supplemental Notes
The Domestic Nonfinancial Economy
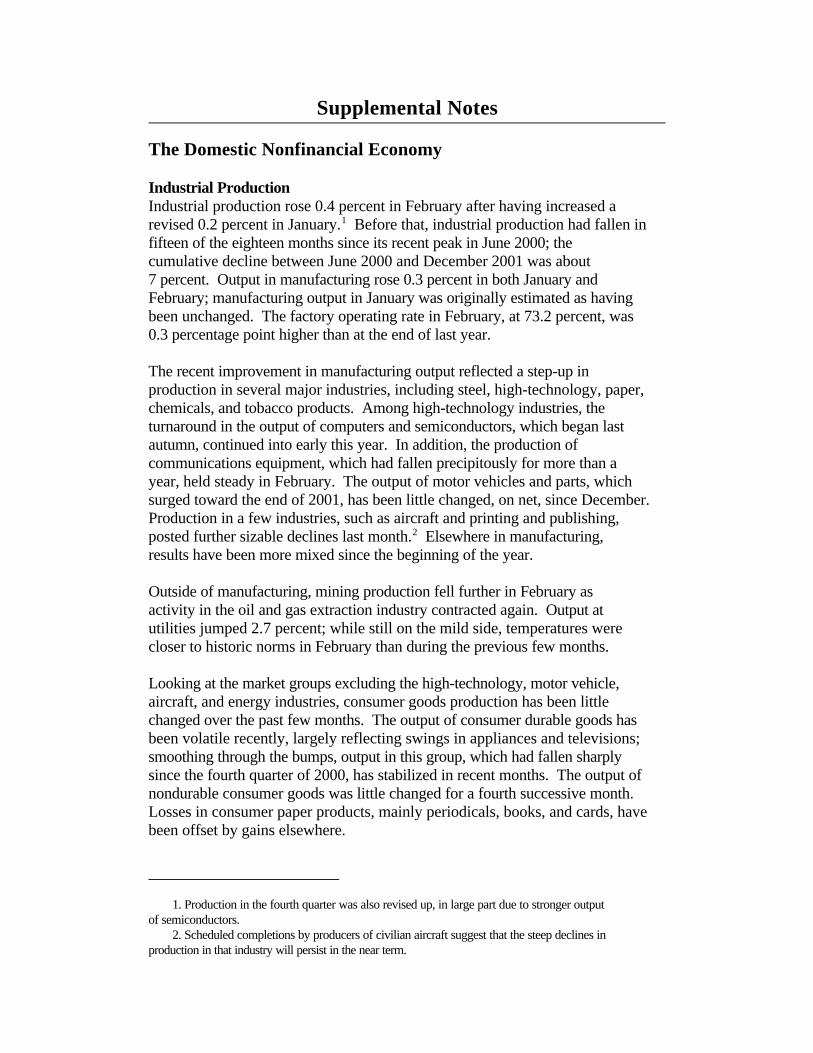
Industrial ProductionIndustrial production rose 0.4 percent in February after having increased arevised 0.2 percent in January.1 Before that, industrial production had fallen infifteen of the eighteen months since its recent peak in June 2000; thecumulative decline between June 2000 and December 2001 was about7 percent. Output in manufacturing rose 0.3 percent in both January andFebruary; manufacturing output in January was originally estimated as havingbeen unchanged. The factory operating rate in February, at 73.2 percent, was0.3 percentage point higher than at the end of last year.
The recent improvement in manufacturing output reflected a step-up inproduction in several major industries, including steel, high-technology, paper,chemicals, and tobacco products. Among high-technology industries, theturnaround in the output of computers and semiconductors, which began lastautumn, continued into early this year. In addition, the production ofcommunications equipment, which had fallen precipitously for more than ayear, held steady in February. The output of motor vehicles and parts, whichsurged toward the end of 2001, has been little changed, on net, since December. Production in a few industries, such as aircraft and printing and publishing,posted further sizable declines last month.2 Elsewhere in manufacturing,results have been more mixed since the beginning of the year. Outside of manufacturing, mining production fell further in February asactivity in the oil and gas extraction industry contracted again. Output atutilities jumped 2.7 percent; while still on the mild side, temperatures werecloser to historic norms in February than during the previous few months.
Looking at the market groups excluding the high-technology, motor vehicle,aircraft, and energy industries, consumer goods production has been littlechanged over the past few months. The output of consumer durable goods hasbeen volatile recently, largely reflecting swings in appliances and televisions;smoothing through the bumps, output in this group, which had fallen sharplysince the fourth quarter of 2000, has stabilized in recent months. The output ofnondurable consumer goods was little changed for a fourth successive month. Losses in consumer paper products, mainly periodicals, books, and cards, havebeen offset by gains elsewhere.
Selected Components of Industrial Production (Percent change from preceding comparable period)
20012 20013 20023
Proportion 20011
Component 2001 Q3 Q4 Dec. Jan. Feb.
Total 100.0 -5.8 -4.7 -6.6 -.3 .2 .4
Manufacturing 85.8 -6.1 -4.9 -6.3 -.3 .3 .3 Ex. motor veh. and parts 79.5 -6.6 -5.8 -6.0 -.6 .3 .2 Ex. high-tech industries 72.3 -5.5 -4.0 -6.7 -.7 .2 .2
Mining 7.1 -2.5 -4.1 -12.0 -1.8 -.3 -.7Utilities 7.1 -5.6 -3.0 -5.0 .9 -.3 2.7
Selected industriesHigh technology 7.3 -15.7 -21.8 1.2 .3 1.7 1.2 Computers 1.7 -8.2 -14.7 3.6 1.9 1.1 1.5 Communication equipment 1.6 -24.5 -28.1 -26.2 -3.6 -1.3 .1 Semiconductors4 3.9 -14.9 -22.2 14.4 1.1 3.1 1.5
Motor vehicles and parts 6.3 -.4 6.6 -10.1 3.7 -.1 .5
Aircraft and parts 2.6 -11.8 -14.8 -27.0 -4.7 -2.8 -2.6
Market groups excludingenergy and selected industriesConsumer goods 23.3 -1.7 -1.7 -3.1 .3 -.2 .1 Durables 3.4 -8.1 -5.8 -11.0 1.3 -1.4 1.1 Nondurables 19.9 -.5 -1.0 -1.7 .1 .0 -.1
Business equipment 7.7 -10.7 -15.0 -8.1 -2.4 1.3 -.5Defense and space equipment 2.0 .2 -.7 3.9 .4 .5 .3
Construction supplies 6.4 -3.9 -1.5 -9.5 .9 .0 .9Business supplies 6.9 -8.5 -4.6 -5.2 -1.2 -.3 .1
Materials 23.6 -6.9 -2.0 -9.2 -1.3 .6 .5 Durables 16.0 -7.3 -3.6 -12.4 -1.1 .4 .4 Nondurables 7.6 -6.0 1.4 -2.3 -1.6 1.2 .6
1. Fourth-quarter to fourth-quarter change. 2. Annual rate. 3. Monthly rate. 4. Includes related electronic components.
Capacity Utilization (Percent of capacity)
1967- 1990- 2001 20022001 1982 91
Sector average low low Q2 Q3 Q4 Jan. Feb.
Total industry 81.9 71.1 78.1 77.4 76.2 74.7 74.5 74.8
Manufacturing 80.9 69.0 76.6 75.6 74.5 73.1 73.0 73.2 High-tech industries 80.0 77.3 72.4 66.4 61.3 60.7 61.2 61.5 Excluding high-tech industries 81.0 68.0 76.8 76.7 76.1 74.7 74.6 74.7
Utilities 87.6 75.9 83.4 88.1 86.3 84.1 82.9 84.8
2
The output of business equipment has been choppy recently, but, on balance,has continued to slide; the farm, metalworking, and special industrial machineryindustries have been particularly weak. The output of construction supplies hasimproved recently, with a cumulative gain of nearly 2 percent over the threemonths ending in February. The production of business supplies edged up inFebruary even though the output of job printing fell further. The output ofmaterials posted solid gains in both January and February, led by higherproduction in steel, paper, and chemicals. According to our industry contacts,the recent increases in steel output likely reflect a pull-ahead in demand fromsteel service centers in an attempt to build inventories in advance of tariff-related price hikes.
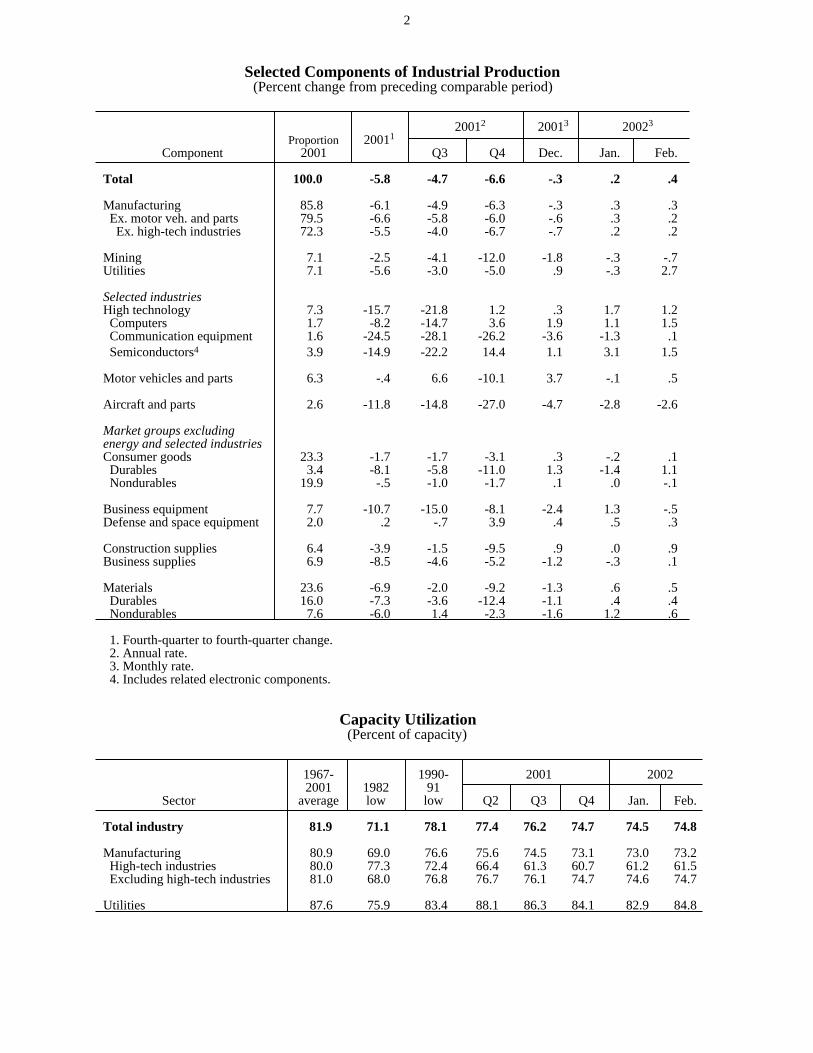
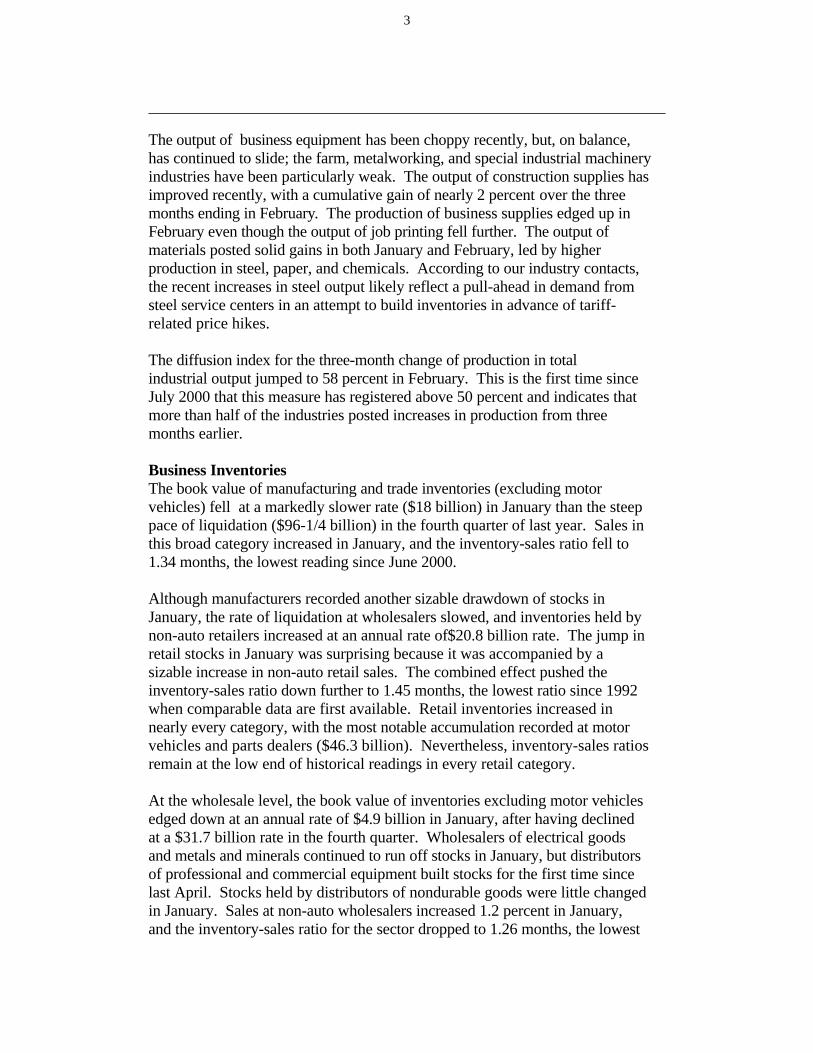
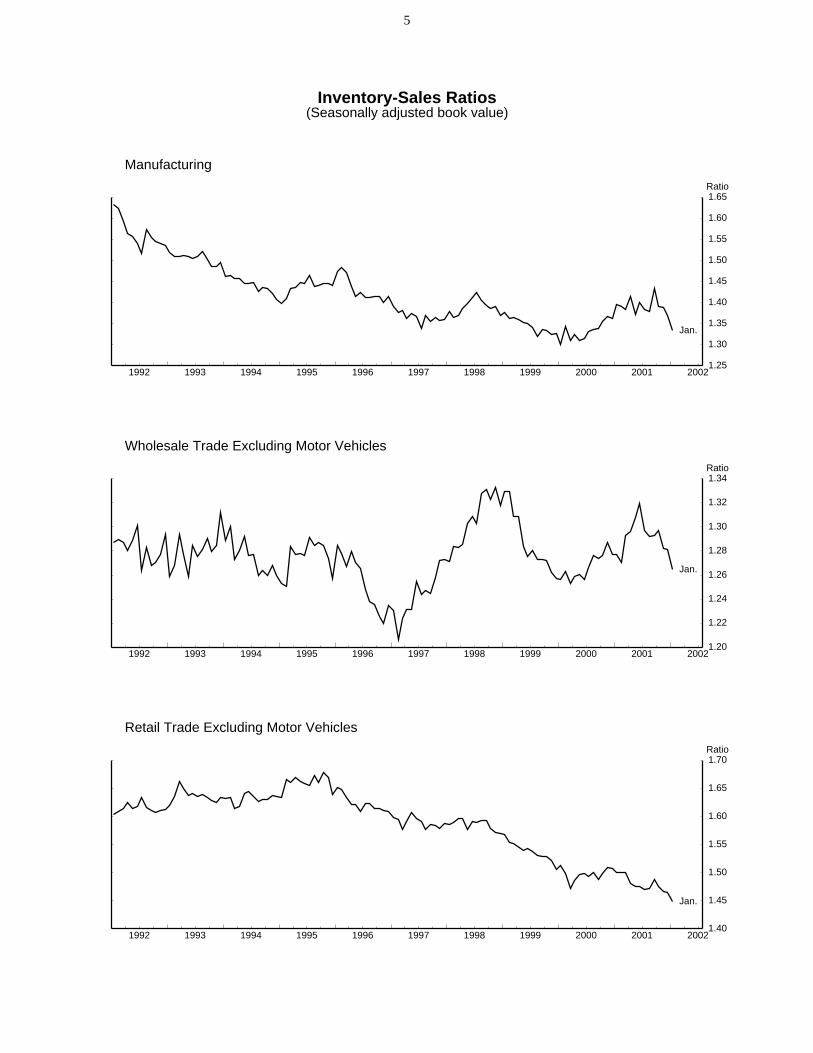
The diffusion index for the three-month change of production in totalindustrial output jumped to 58 percent in February. This is the first time sinceJuly 2000 that this measure has registered above 50 percent and indicates thatmore than half of the industries posted increases in production from threemonths earlier. Business InventoriesThe book value of manufacturing and trade inventories (excluding motorvehicles) fell at a markedly slower rate ($18 billion) in January than the steeppace of liquidation ($96-1/4 billion) in the fourth quarter of last year. Sales inthis broad category increased in January, and the inventory-sales ratio fell to1.34 months, the lowest reading since June 2000.
Although manufacturers recorded another sizable drawdown of stocks inJanuary, the rate of liquidation at wholesalers slowed, and inventories held bynon-auto retailers increased at an annual rate of$20.8 billion rate. The jump inretail stocks in January was surprising because it was accompanied by asizable increase in non-auto retail sales. The combined effect pushed theinventory-sales ratio down further to 1.45 months, the lowest ratio since 1992when comparable data are first available. Retail inventories increased innearly every category, with the most notable accumulation recorded at motorvehicles and parts dealers ($46.3 billion). Nevertheless, inventory-sales ratiosremain at the low end of historical readings in every retail category.
At the wholesale level, the book value of inventories excluding motor vehiclesedged down at an annual rate of $4.9 billion in January, after having declinedat a $31.7 billion rate in the fourth quarter. Wholesalers of electrical goodsand metals and minerals continued to run off stocks in January, but distributorsof professional and commercial equipment built stocks for the first time sincelast April. Stocks held by distributors of nondurable goods were little changedin January. Sales at non-auto wholesalers increased 1.2 percent in January,and the inventory-sales ratio for the sector dropped to 1.26 months, the lowest
3
CHANGES IN MANUFACTURING AND TRADE INVENTORIES (Billions of dollars; annual rate except as noted; based on seasonally adjusted Census book value) ————————————————————————————————————————————————————————————————————————————————— 2001 2001 2002 Category ———————————————————————— ——————————————— —————— Q2 Q3 Q4 Nov. Dec. Jan. ————————————————————————————————————————————————————————————————————————————————— Manufacturing and trade -43.3 -61.5 -151.2 -165.0 -61.7 25.0 Less wholesale and retail motor vehicles -40.4 -66.2 -96.3 -129.7 -67.1 -18.0
Manufacturing -34.4 -45.3 -53.5 -71.7 -49.2 -33.9
Merchant wholesalers .2 -18.8 -35.1 -44.4 -18.6 -8.3 Less motor vehicles 3.3 -19.1 -31.7 -34.2 -14.8 -4.9
Retail trade -9.0 2.6 -62.5 -48.9 6.1 67.2 Automotive dealers .3 4.4 -51.5 -25.1 9.2 46.3 Less automotive dealers -9.3 -1.8 -11.0 -23.8 -3.0 20.8 —————————————————————————————————————————————————————————————————————————————————
SELECTED INVENTORY-SALES RATIOS IN MANUFACTURING AND TRADE (Months’ supply, based on seasonally adjusted Census book value) —————————————————————————————————————————————————————————————————————————————————— 2001 2001 2002 Category ———————————————————————— ——————————————— —————— Q2 Q3 Q4 Nov. Dec. Jan. —————————————————————————————————————————————————————————————————————————————————— Manufacturing and trade 1.42 1.42 1.38 1.39 1.39 1.38 Less wholesale and retail motor vehicles 1.38 1.38 1.37 1.38 1.37 1.34
Manufacturing 1.38 1.38 1.37 1.39 1.37 1.33 Primary metals 1.76 1.73 1.76 1.79 1.81 1.69 Steel 2.20 2.19 2.17 2.23 2.19 2.10 Machinery 2.06 2.09 2.12 2.16 2.18 2.04 Computers and electronics 1.52 1.56 1.47 1.53 1.45 1.41 Electrical equipment 1.39 1.46 1.48 1.53 1.48 1.50 Transportation equipment 1.42 1.42 1.39 1.38 1.36 1.32 Motor vehicles .59 .58 .55 .55 .54 .51 Aircraft 3.84 3.77 3.80 3.62 3.78 3.92 Fabricated metals 1.69 1.67 1.62 1.65 1.63 1.60 Textiles 1.68 1.60 1.56 1.56 1.57 1.58 Paper 1.18 1.20 1.23 1.25 1.26 1.21 Chemicals 1.43 1.46 1.45 1.45 1.47 1.46 Petroleum .68 .70 .72 .75 .72 .69 Rubber and plastics 1.22 1.18 1.16 1.19 1.16 1.13
Merchant wholesalers 1.32 1.30 1.29 1.30 1.30 1.28 Less motor vehicles 1.31 1.29 1.28 1.28 1.28 1.26
Durable goods 1.61 1.59 1.56 1.57 1.56 1.54 Nondurable goods 1.03 1.02 1.02 1.02 1.03 1.02
Retail trade 1.56 1.57 1.47 1.48 1.49 1.51 Less automotive dealers 1.47 1.48 1.46 1.47 1.46 1.45
Automotive dealers 1.80 1.83 1.48 1.52 1.55 1.68 General merchandise 1.92 1.91 1.86 1.89 1.84 1.81 Apparel 2.41 2.44 2.30 2.36 2.26 2.28 Food .86 .85 .84 .85 .84 .83
Memo: Manufacturing and trade shipments and sales 834.5 824.1 821.8 817.3 817.6 826.4 (billions of dollars) ——————————————————————————————————————————————————————————————————————————————————
4
Inventory-Sales Ratios(Seasonally adjusted book value)
1992 1993 1994 1995 1996 1997 1998 1999 2000 2001 20021.25
1.30
1.35
1.40
1.45
1.50
1.55
1.60
1.65
1.25
1.30
1.35
1.40
1.45
1.50
1.55
1.60
1.65Ratio
Jan.
Manufacturing
1992 1993 1994 1995 1996 1997 1998 1999 2000 2001 20021.20
1.22
1.24
1.26
1.28
1.30
1.32
1.34
1.20
1.22
1.24
1.26
1.28
1.30
1.32
1.34Ratio
Jan.
Wholesale Trade Excluding Motor Vehicles
1992 1993 1994 1995 1996 1997 1998 1999 2000 2001 20021.40
1.45
1.50
1.55
1.60
1.65
1.70
1.40
1.45
1.50
1.55
1.60
1.65
1.70Ratio
Jan.
Retail Trade Excluding Motor Vehicles
5
ratio since June 2000. Nevertheless, stocks remain high relative to shipmentsat wholesalers of machinery and metals and minerals.
The book value of manufacturers’ inventories decreased at an annual rate of$33.9 billion in January. Stocks held by manufacturers of durable goodsdeclined in every major industry grouping except lumber and wood products,which accumulated inventories in January for the first time in six months. Thelargest drawdowns occurred at producers of transportation equipment, primarymetals, and machinery. Notably, the pace of liquidation at makers ofcomputers and electronic products abated considerably. With the increase infactory shipments in January, the overall inventory-sales ratio dropped to1.33 months in January—its lowest level since July 2000. Nevertheless,stocks remain high relative to shipments at manufacturers of electricalequipment, chemicals, and leather and allied products.
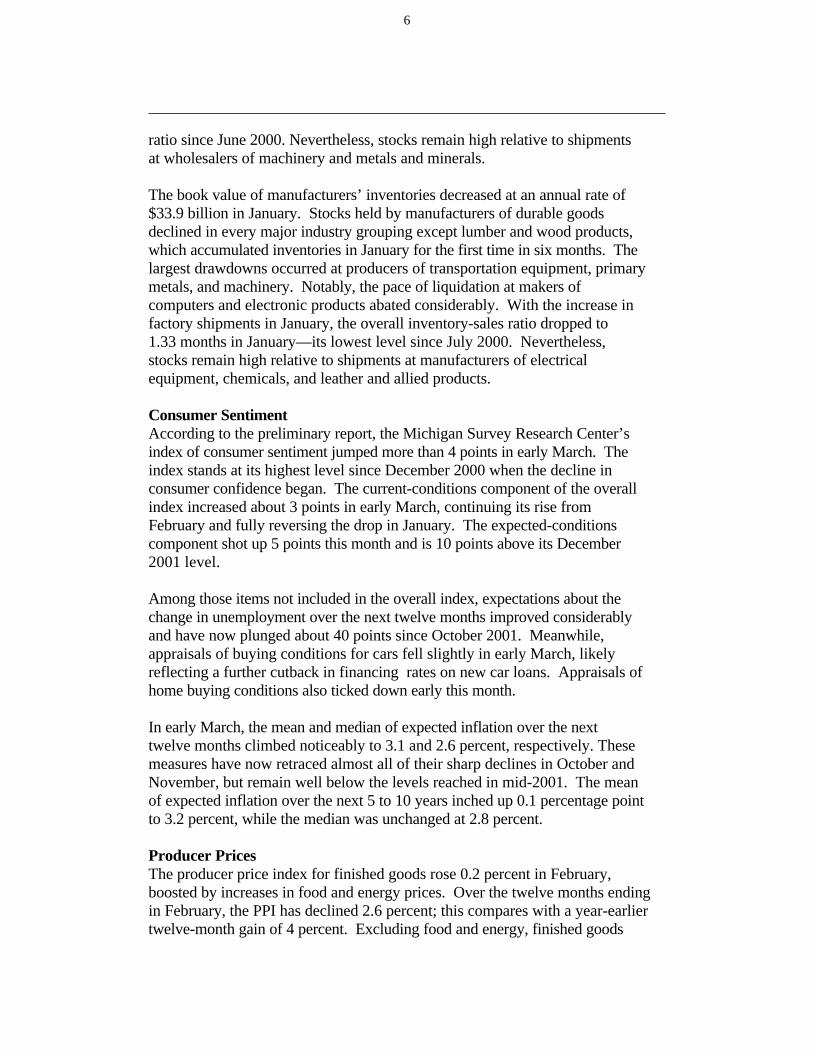
Consumer SentimentAccording to the preliminary report, the Michigan Survey Research Center’sindex of consumer sentiment jumped more than 4 points in early March. Theindex stands at its highest level since December 2000 when the decline inconsumer confidence began. The current-conditions component of the overallindex increased about 3 points in early March, continuing its rise fromFebruary and fully reversing the drop in January. The expected-conditionscomponent shot up 5 points this month and is 10 points above its December2001 level.
Among those items not included in the overall index, expectations about thechange in unemployment over the next twelve months improved considerablyand have now plunged about 40 points since October 2001. Meanwhile,appraisals of buying conditions for cars fell slightly in early March, likelyreflecting a further cutback in financing rates on new car loans. Appraisals ofhome buying conditions also ticked down early this month.
In early March, the mean and median of expected inflation over the nexttwelve months climbed noticeably to 3.1 and 2.6 percent, respectively. Thesemeasures have now retraced almost all of their sharp declines in October andNovember, but remain well below the levels reached in mid-2001. The meanof expected inflation over the next 5 to 10 years inched up 0.1 percentage pointto 3.2 percent, while the median was unchanged at 2.8 percent.
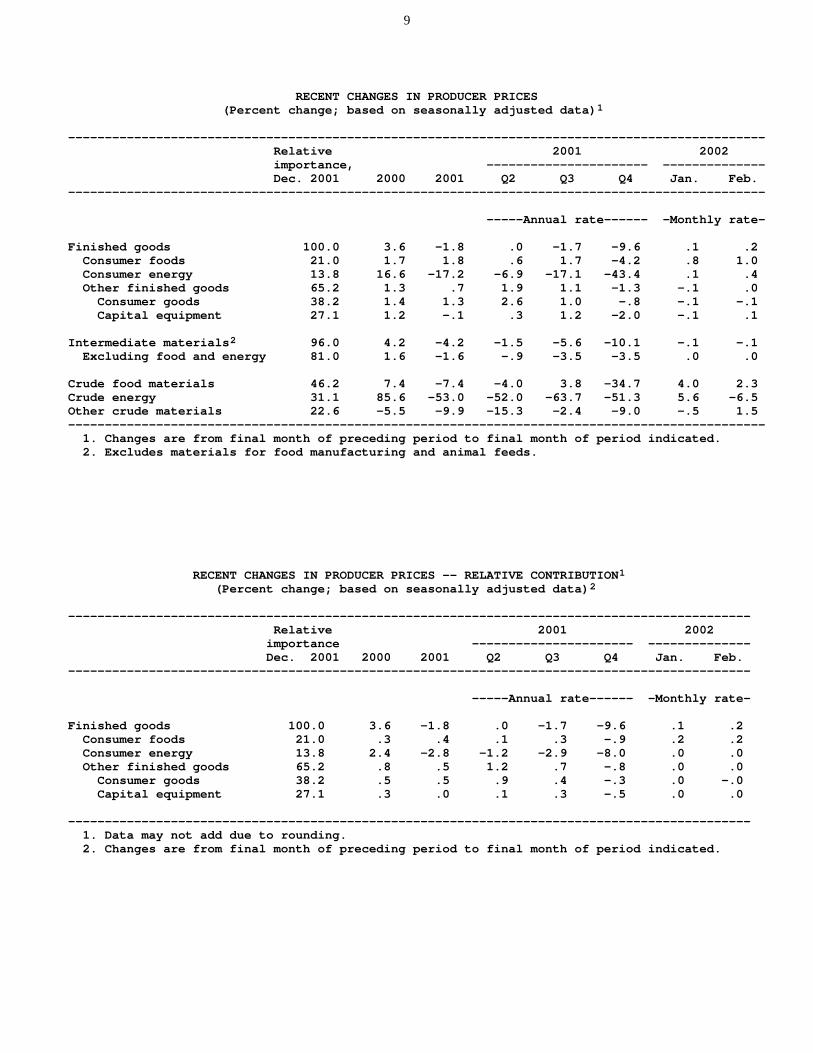
Producer PricesThe producer price index for finished goods rose 0.2 percent in February,boosted by increases in food and energy prices. Over the twelve months endingin February, the PPI has declined 2.6 percent; this compares with a year-earliertwelve-month gain of 4 percent. Excluding food and energy, finished goods
6
March 15, 2002
UNIVERSITY OF MICHIGAN SURVEY RESEARCH CENTER: SURVEY OF CONSUMER ATTITUDES (Not seasonally adjusted)
—————————————————————————————————————————————————————————————————————————————————————————————————————— 2001 2001 2001 2001 2001 2001 2002 2002 2002 July Aug. Sept. Oct. Nov. Dec. Jan. Feb. Mar (p) ——————————————————————————————————————————————————————————————————————————————————————————————————————
Indexes of consumer sentiment (Feb. 1966=100)
Composite of current and expected conditions 92.4 91.5 81.8 82.7 83.9 88.8 93.0 90.7 95.0 Current conditions 98.6 101.2 94.6 94.0 95.3 99.0 95.7 96.2 99.3 Expected conditions 88.4 85.2 73.5 75.5 76.6 82.3 91.3 87.2 92.3
------------------------------------------------------------------------------------------------------
Personal financial situation Now compared with 12 months ago* 114 118 108 107 107 108 105 106 111 Expected in 12 months* 133 127 128 128 134 138 141 137 133
Expected business conditions Next 12 months* 115 102 71 77 76 86 111 106 119 Next 5 years* 107 113 95 98 97 106 115 107 120
Appraisal of buying conditions Cars 138 132 133 152 164 163 156 156 150 Large household appliances* 141 144 136 136 140 148 143 143 146 Houses 149 154 149 159 161 167 161 164 163
Willingness to use credit 41 47 39 52 54 44 39 45 42 Willingness to use savings 60 55 47 62 56 55 55 63 57
Expected unemployment change - next 12 months 140 142 151 150 143 135 123 124 110
Prob. household will lose a job - next 5 years 24 23 24 21 24 23 23 24 24
Expected inflation - next 12 months Mean 3.0 3.1 3.2 1.6 1.0 1.9 2.2 2.4 3.1 Median 2.6 2.7 2.8 1.0 .4 1.8 1.9 2.1 2.6
Expected inflation - next 5 to 10 years Mean 3.4 3.6 3.4 2.8 3.2 3.4 3.0 3.1 3.2 Median 2.9 3.0 2.9 2.7 2.8 3.0 2.7 2.8 2.8
—————————————————————————————————————————————————————————————————————————————————————————————————————— * -- Indicates the question is one of the five equally-weighted components of the index of sentiment. (p) -- Preliminary (f) -- Final Note: Figures on financial, business, and buying conditions are the percent reporting ’good times’ (or ’better’) minus the percent reporting ’bad times’ (or ’worse’), plus 100. Expected change in unemployment is the fraction expecting unemployment to rise minus the fraction expecting unemployment to fall, plus 100.
7
prices were unchanged last month; this left the twelve-month change in the corePPI at 0.5 percent, compared with a year-earlier increase of 1.3 percent.
The PPI for energy rose 0.4 percent in February, following a tiny increase inJanuary and a string of sharp declines in earlier months. Gasoline prices jumped4-1/2 percent last month, following a 3.4 percent increase in January. Fuel oilprices also rose last month; by contrast, prices for natural gas and electricitydeclined. Overall, producer energy prices have tumbled more than 20 percentover the past year.
Producer food prices rose 1 percent, with prices of vegetables, fish, and beef andveal posting especially large increases. However, the twelve-month change inthe PPI for food stood at 1.9 percent in February, down a percentage point froma year earlier.
The PPI for core consumer goods edged down 0.1 percent in February. Appareland tobacco prices were flat, and a 0.2 percent decline in passenger car pricespartly offset a 0.6 percent increase in light truck prices. The PPI for coreconsumer goods rose 0.7 percent over the twelve months ending in February,and has decelerated nearly a percentage point over this period.
Producer prices of capital goods ticked up 0.1 percent last month. Withincapital equipment, prices for communication equipment moved up 0.5 percent,but this index was still 0.7 percent below a year earlier. Computer pricesdropped 4.1 percent in February, and were down 28-1/2 percent over theprevious twelve months.
At earlier stages of processing, the PPI for core intermediate materials was flatlast month. Core intermediate prices have decelerated about 3 percentage pointsover the past year, and the twelve-month decline in this index was 1.8 percent inFebruary. Core crude materials rose 1-1/2 percent in February, but were downnearly 7 percent relative to a year earlier.
8
RECENT CHANGES IN PRODUCER PRICES (Percent change; based on seasonally adjusted data)1 ——————————————————————————————————————————————————————————————————————————————————————————————— Relative 2001 2002 importance, —————————————————————— —————————————— Dec. 2001 2000 2001 Q2 Q3 Q4 Jan. Feb. ———————————————————————————————————————————————————————————————————————————————————————————————
-----Annual rate------ -Monthly rate-
Finished goods 100.0 3.6 -1.8 .0 -1.7 -9.6 .1 .2 Consumer foods 21.0 1.7 1.8 .6 1.7 -4.2 .8 1.0 Consumer energy 13.8 16.6 -17.2 -6.9 -17.1 -43.4 .1 .4 Other finished goods 65.2 1.3 .7 1.9 1.1 -1.3 -.1 .0 Consumer goods 38.2 1.4 1.3 2.6 1.0 -.8 -.1 -.1 Capital equipment 27.1 1.2 -.1 .3 1.2 -2.0 -.1 .1
Intermediate materials2 96.0 4.2 -4.2 -1.5 -5.6 -10.1 -.1 -.1 Excluding food and energy 81.0 1.6 -1.6 -.9 -3.5 -3.5 .0 .0
Crude food materials 46.2 7.4 -7.4 -4.0 3.8 -34.7 4.0 2.3 Crude energy 31.1 85.6 -53.0 -52.0 -63.7 -51.3 5.6 -6.5 Other crude materials 22.6 -5.5 -9.9 -15.3 -2.4 -9.0 -.5 1.5 ——————————————————————————————————————————————————————————————————————————————————————————————— 1. Changes are from final month of preceding period to final month of period indicated. 2. Excludes materials for food manufacturing and animal feeds.
RECENT CHANGES IN PRODUCER PRICES -- RELATIVE CONTRIBUTION1 (Percent change; based on seasonally adjusted data)2 ————————————————————————————————————————————————————————————————————————————————————————————— Relative 2001 2002 importance —————————————————————— —————————————— Dec. 2001 2000 2001 Q2 Q3 Q4 Jan. Feb. —————————————————————————————————————————————————————————————————————————————————————————————
-----Annual rate------ -Monthly rate-
Finished goods 100.0 3.6 -1.8 .0 -1.7 -9.6 .1 .2 Consumer foods 21.0 .3 .4 .1 .3 -.9 .2 .2 Consumer energy 13.8 2.4 -2.8 -1.2 -2.9 -8.0 .0 .0 Other finished goods 65.2 .8 .5 1.2 .7 -.8 .0 .0 Consumer goods 38.2 .5 .5 .9 .4 -.3 .0 -.0 Capital equipment 27.1 .3 .0 .1 .3 -.5 .0 .0
————————————————————————————————————————————————————————————————————————————————————————————— 1. Data may not add due to rounding. 2. Changes are from final month of preceding period to final month of period indicated.
9
The Domestic Financial Economy
Erratum. On page III-1 of the Greenbook, the second sentence of the lastparagraph should read: “Spreads edged down, however, on net for most of theinvestment-grade market and actually fell to the lowest level since late 2000 fora broad index of speculative-grade firms.”
10
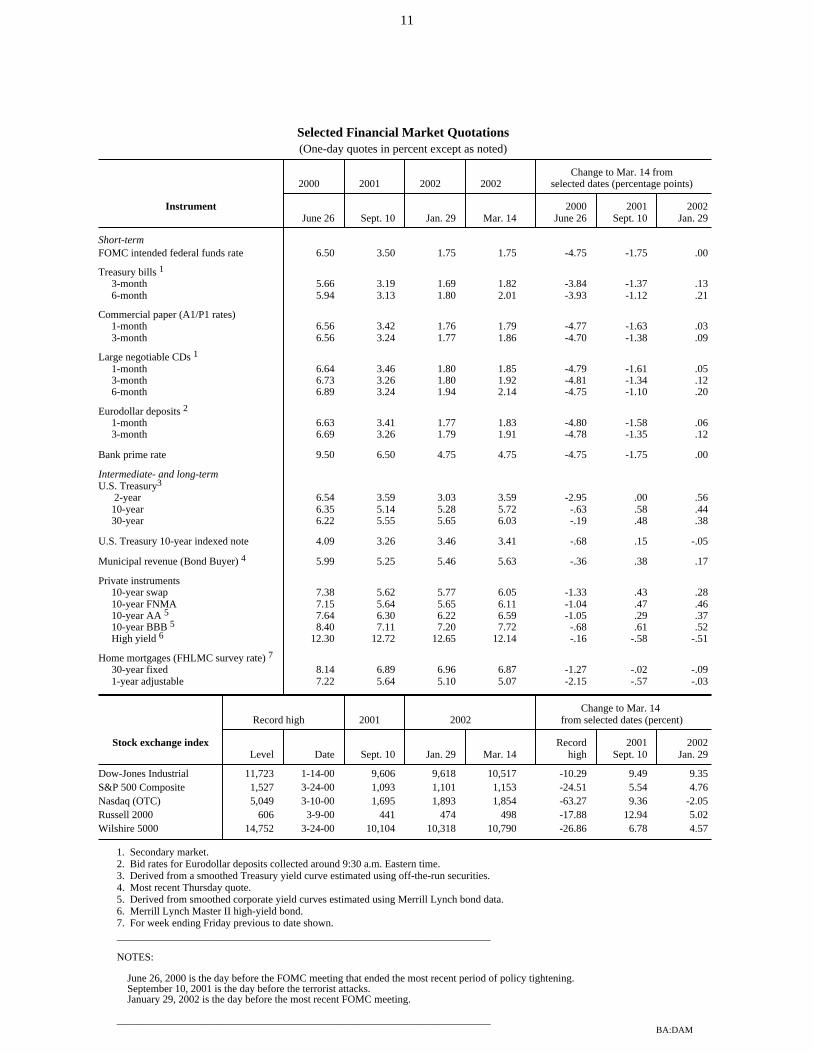
Selected Financial Market Quotations(One-day quotes in percent except as noted)
Change to Mar. 14 from2000 2001 2002 2002 selected dates (percentage points)
Instrument 2000 2001 2002 June 26 Sept. 10 Jan. 29 Mar. 14 June 26 Sept. 10 Jan. 29
Short-termFOMC intended federal funds rate 6.50 3.50 1.75 1.75 -4.75 -1.75 .00
Treasury bills 1
3-month 5.66 3.19 1.69 1.82 -3.84 -1.37 .13 6-month 5.94 3.13 1.80 2.01 -3.93 -1.12 .21
Commercial paper (A1/P1 rates) 1-month 6.56 3.42 1.76 1.79 -4.77 -1.63 .03 3-month 6.56 3.24 1.77 1.86 -4.70 -1.38 .09
Large negotiable CDs 1
1-month 6.64 3.46 1.80 1.85 -4.79 -1.61 .05 3-month 6.73 3.26 1.80 1.92 -4.81 -1.34 .12 6-month 6.89 3.24 1.94 2.14 -4.75 -1.10 .20
Eurodollar deposits 2
1-month 6.63 3.41 1.77 1.83 -4.80 -1.58 .06 3-month 6.69 3.26 1.79 1.91 -4.78 -1.35 .12
Bank prime rate 9.50 6.50 4.75 4.75 -4.75 -1.75 .00
Intermediate- and long-termU.S. Treasury3
2-year 6.54 3.59 3.03 3.59 -2.95 .00 .56 10-year 6.35 5.14 5.28 5.72 -.63 .58 .44 30-year 6.22 5.55 5.65 6.03 -.19 .48 .38
U.S. Treasury 10-year indexed note 4.09 3.26 3.46 3.41 -.68 .15 -.05
Municipal revenue (Bond Buyer) 4 5.99 5.25 5.46 5.63 -.36 .38 .17
Private instruments 10-year swap 7.38 5.62 5.77 6.05 -1.33 .43 .28 10-year FNMA 7.15 5.64 5.65 6.11 -1.04 .47 .46 10-year AA 5 7.64 6.30 6.22 6.59 -1.05 .29 .37 10-year BBB 5 8.40 7.11 7.20 7.72 -.68 .61 .52 High yield 6 12.30 12.72 12.65 12.14 -.16 -.58 -.51
Home mortgages (FHLMC survey rate) 7
30-year fixed 8.14 6.89 6.96 6.87 -1.27 -.02 -.09 1-year adjustable 7.22 5.64 5.10 5.07 -2.15 -.57 -.03
Change to Mar. 14 Record high 2001 2002 from selected dates (percent)
Stock exchange index Record 2001 2002 Level Date Sept. 10 Jan. 29 Mar. 14 high Sept. 10 Jan. 29
Dow-Jones Industrial 11,723 1-14-00 9,606 9,618 10,517 -10.29 9.49 9.35S&P 500 Composite 1,527 3-24-00 1,093 1,101 1,153 -24.51 5.54 4.76Nasdaq (OTC) 5,049 3-10-00 1,695 1,893 1,854 -63.27 9.36 -2.05Russell 2000 606 3-9-00 441 474 498 -17.88 12.94 5.02Wilshire 5000 14,752 3-24-00 10,104 10,318 10,790 -26.86 6.78 4.57
1. Secondary market. 2. Bid rates for Eurodollar deposits collected around 9:30 a.m. Eastern time. 3. Derived from a smoothed Treasury yield curve estimated using off-the-run securities. 4. Most recent Thursday quote. 5. Derived from smoothed corporate yield curves estimated using Merrill Lynch bond data. 6. Merrill Lynch Master II high-yield bond. 7. For week ending Friday previous to date shown. _______________________________________________________________________
NOTES:
June 26, 2000 is the day before the FOMC meeting that ended the most recent period of policy tightening. September 10, 2001 is the day before the terrorist attacks. January 29, 2002 is the day before the most recent FOMC meeting.
_______________________________________________________________________ BA:DAM
11
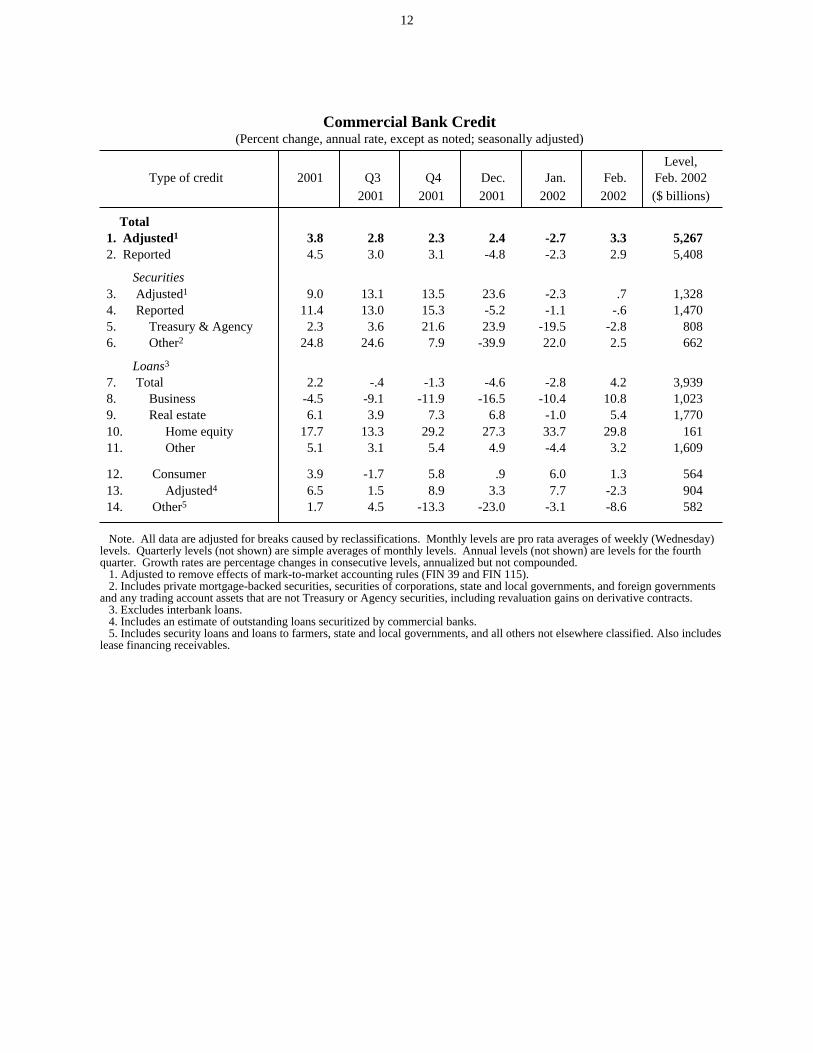
Commercial Bank Credit(Percent change, annual rate, except as noted; seasonally adjusted)
Level,Type of credit 2001 Q3 Q4 Dec. Jan. Feb. Feb. 2002
2001 2001 2001 2002 2002 ($ billions)
Total 1. Adjusted1 3.8 2.8 2.3 2.4 -2.7 3.3 5,267 2. Reported 4.5 3.0 3.1 -4.8 -2.3 2.9 5,408
Securities 3. Adjusted1 9.0 13.1 13.5 23.6 -2.3 .7 1,328 4. Reported 11.4 13.0 15.3 -5.2 -1.1 -.6 1,470 5. Treasury & Agency 2.3 3.6 21.6 23.9 -19.5 -2.8 808 6. Other2 24.8 24.6 7.9 -39.9 22.0 2.5 662
Loans3
7. Total 2.2 -.4 -1.3 -4.6 -2.8 4.2 3,939 8. Business -4.5 -9.1 -11.9 -16.5 -10.4 10.8 1,023 9. Real estate 6.1 3.9 7.3 6.8 -1.0 5.4 1,770 10. Home equity 17.7 13.3 29.2 27.3 33.7 29.8 161 11. Other 5.1 3.1 5.4 4.9 -4.4 3.2 1,609
12. Consumer 3.9 -1.7 5.8 .9 6.0 1.3 564 13. Adjusted4 6.5 1.5 8.9 3.3 7.7 -2.3 904 14. Other5 1.7 4.5 -13.3 -23.0 -3.1 -8.6 582
Note. All data are adjusted for breaks caused by reclassifications. Monthly levels are pro rata averages of weekly (Wednesday)levels. Quarterly levels (not shown) are simple averages of monthly levels. Annual levels (not shown) are levels for the fourthquarter. Growth rates are percentage changes in consecutive levels, annualized but not compounded. 1. Adjusted to remove effects of mark-to-market accounting rules (FIN 39 and FIN 115). 2. Includes private mortgage-backed securities, securities of corporations, state and local governments, and foreign governmentsand any trading account assets that are not Treasury or Agency securities, including revaluation gains on derivative contracts. 3. Excludes interbank loans. 4. Includes an estimate of outstanding loans securitized by commercial banks. 5. Includes security loans and loans to farmers, state and local governments, and all others not elsewhere classified. Also includeslease financing receivables.
12
The International Economy
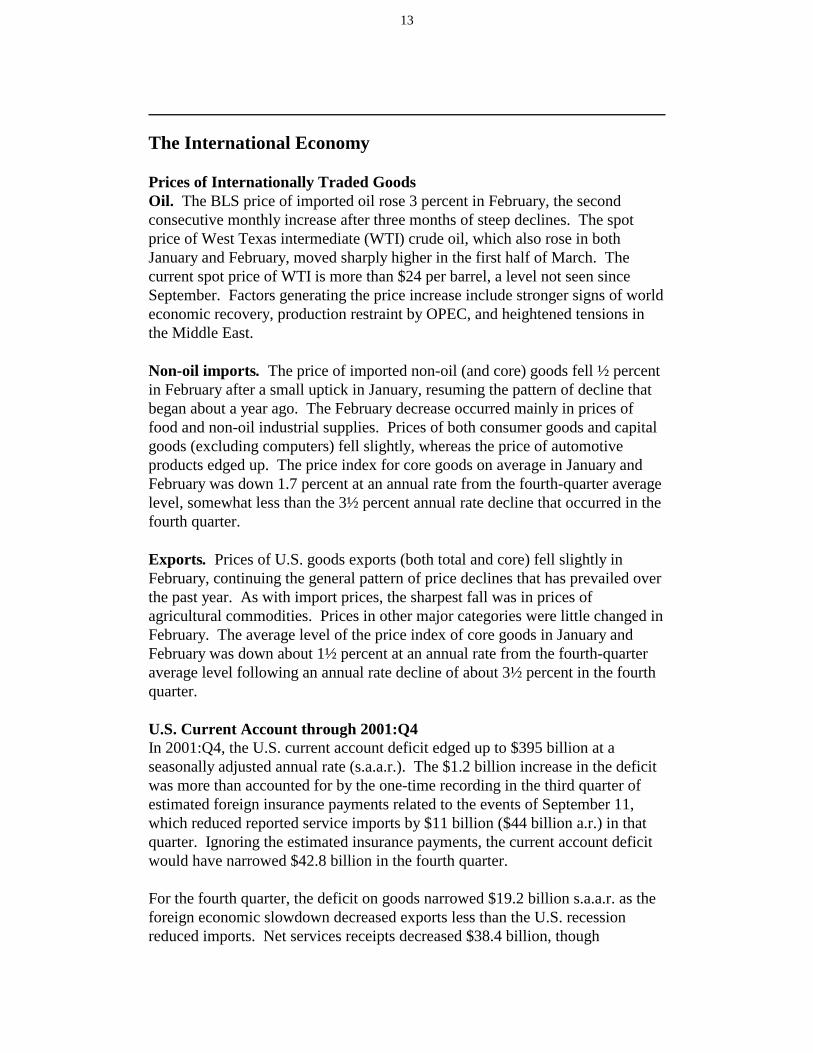
Prices of Internationally Traded GoodsOil. The BLS price of imported oil rose 3 percent in February, the secondconsecutive monthly increase after three months of steep declines. The spotprice of West Texas intermediate (WTI) crude oil, which also rose in bothJanuary and February, moved sharply higher in the first half of March. Thecurrent spot price of WTI is more than $24 per barrel, a level not seen sinceSeptember. Factors generating the price increase include stronger signs of worldeconomic recovery, production restraint by OPEC, and heightened tensions inthe Middle East.
Non-oil imports. The price of imported non-oil (and core) goods fell ½ percentin February after a small uptick in January, resuming the pattern of decline thatbegan about a year ago. The February decrease occurred mainly in prices offood and non-oil industrial supplies. Prices of both consumer goods and capitalgoods (excluding computers) fell slightly, whereas the price of automotiveproducts edged up. The price index for core goods on average in January andFebruary was down 1.7 percent at an annual rate from the fourth-quarter averagelevel, somewhat less than the 3½ percent annual rate decline that occurred in thefourth quarter.
Exports. Prices of U.S. goods exports (both total and core) fell slightly inFebruary, continuing the general pattern of price declines that has prevailed overthe past year. As with import prices, the sharpest fall was in prices ofagricultural commodities. Prices in other major categories were little changed inFebruary. The average level of the price index of core goods in January andFebruary was down about 1½ percent at an annual rate from the fourth-quarteraverage level following an annual rate decline of about 3½ percent in the fourthquarter.
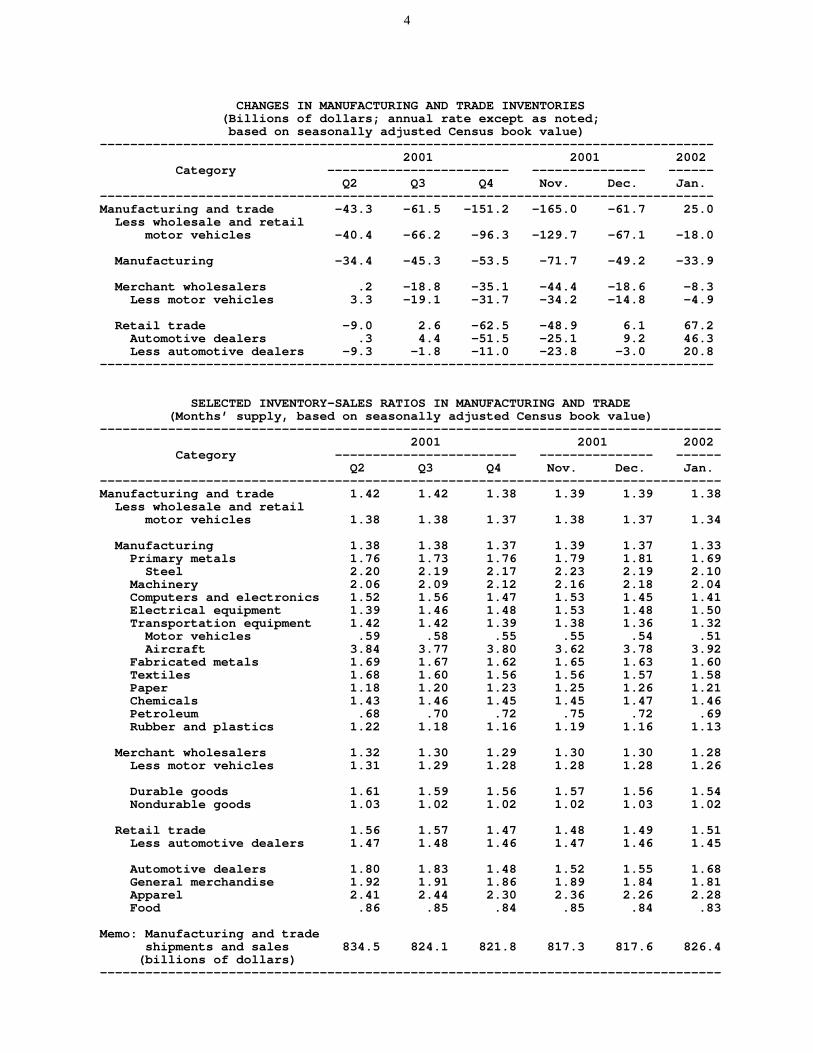
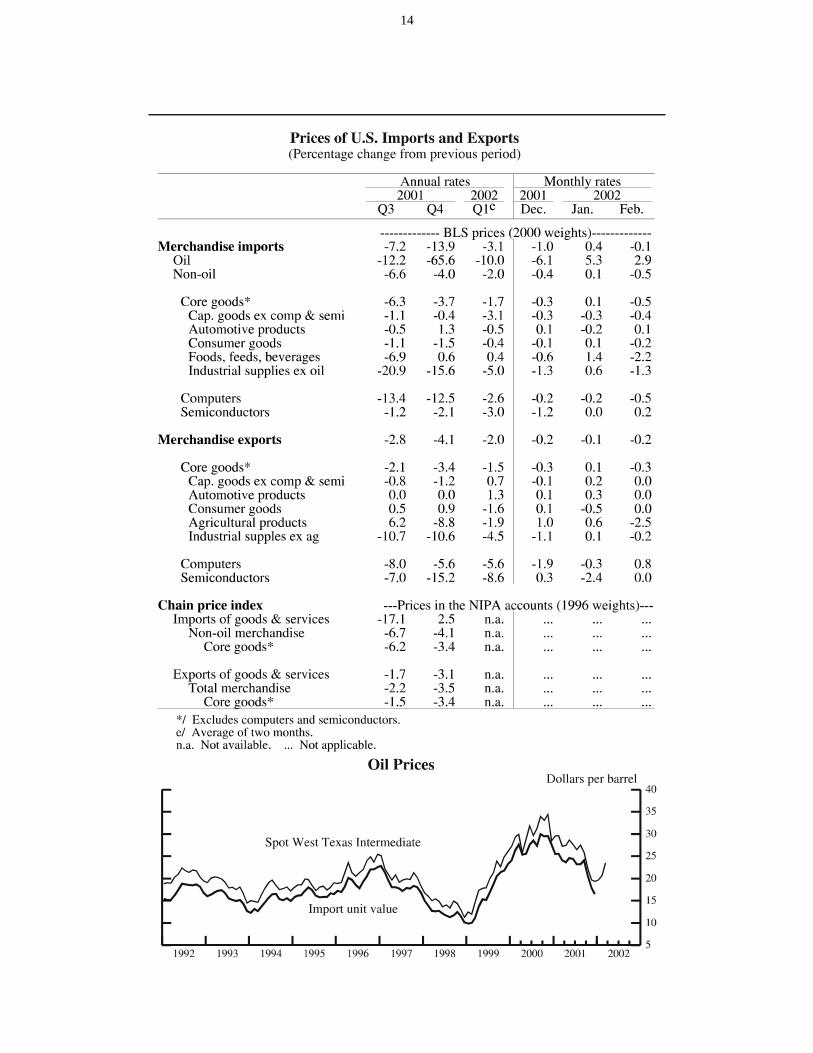
U.S. Current Account through 2001:Q4In 2001:Q4, the U.S. current account deficit edged up to $395 billion at aseasonally adjusted annual rate (s.a.a.r.). The $1.2 billion increase in the deficitwas more than accounted for by the one-time recording in the third quarter ofestimated foreign insurance payments related to the events of September 11,which reduced reported service imports by $11 billion ($44 billion a.r.) in thatquarter. Ignoring the estimated insurance payments, the current account deficitwould have narrowed $42.8 billion in the fourth quarter.
For the fourth quarter, the deficit on goods narrowed $19.2 billion s.a.a.r. as theforeign economic slowdown decreased exports less than the U.S. recessionreduced imports. Net services receipts decreased $38.4 billion, though
13
14
Annual2000 -375.7 -9.6 -59.3 -444.72001 -347.8 -13.8 -55.9 -417.4
Quarterly2001:Q1 -381.2 -14.6 -52.7 -448.5
Q2 -363.3 -14.5 -53.8 -431.7Q3 -313.8 -24.4 -55.9 -394.1Q4 -332.9 -1.5 -61.0 -395.3
ChangeQ1-Q4 19.9 -22.4 19.3 16.8Q2-Q1 17.9 0.0 -1.1 16.8Q3-Q1 49.5 -9.8 -2.1 37.6Q4-Q3 -19.1 22.9 -5.0 -1.2
Source: U.S. Department of Commerce, Bureau of Economic Analysis.
Period
U.S. Current Account(Billions of dollars, seasonally adjusted annual rate)
Otherincome and
transfers, net
Currentaccountbalance
Investmentincome,
net
Goods andservices,
net
disregarding the estimated insurance payment, the balance on services wouldhave increased by $5.6 billion. The balance on income, which was negativethroughout 2001, also narrowed $22.9 billion, as income receipts decreased lessthan income payments. Other income and transfers increased $5 billion,contributing to the widening of the current account deficit.
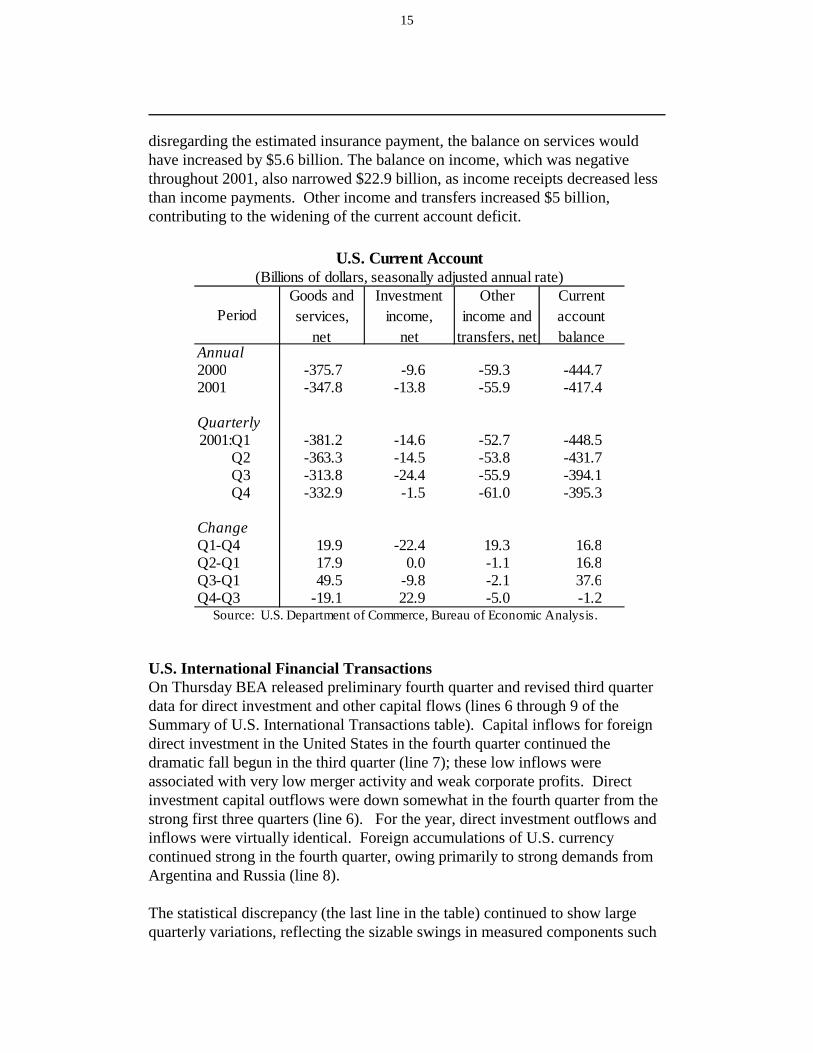
U.S. International Financial TransactionsOn Thursday BEA released preliminary fourth quarter and revised third quarterdata for direct investment and other capital flows (lines 6 through 9 of theSummary of U.S. International Transactions table). Capital inflows for foreigndirect investment in the United States in the fourth quarter continued thedramatic fall begun in the third quarter (line 7); these low inflows wereassociated with very low merger activity and weak corporate profits. Directinvestment capital outflows were down somewhat in the fourth quarter from thestrong first three quarters (line 6). For the year, direct investment outflows andinflows were virtually identical. Foreign accumulations of U.S. currencycontinued strong in the fourth quarter, owing primarily to strong demands fromArgentina and Russia (line 8).
The statistical discrepancy (the last line in the table) continued to show largequarterly variations, reflecting the sizable swings in measured components such
15

as those for banking (line 3). For the year, the statistical discrepancy totalednegative $39 billion, indicating some combination of underreporting of thecurrent account deficit or overreporting of net capital inflows.
16
17