Embed Size (px)
Citation preview
Prefatory Note The attached document represents the most complete and accurate version available based on original copies culled from the files of the FOMC Secretariat at the Board of Governors of the Federal Reserve System. This electronic document was created through a comprehensive digitization process which included identifying the best-preserved paper copies, scanning those copies,1
and then making the scanned versions text-searchable.2
Though a stringent quality assurance process was employed, some imperfections may remain. Please note that some material may have been redacted from this document if that material was received on a confidential basis. Redacted material is indicated by occasional gaps in the text or by gray boxes around non-text content. All redacted passages are exempt from disclosure under applicable provisions of the Freedom of Information Act. 1 In some cases, original copies needed to be photocopied before being scanned into electronic format. All scanned images were deskewed (to remove the effects of printer- and scanner-introduced tilting) and lightly cleaned (to remove dark spots caused by staple holes, hole punches, and other blemishes caused after initial printing). 2 A two-step process was used. An advanced optical character recognition computer program (OCR) first created electronic text from the document image. Where the OCR results were inconclusive, staff checked and corrected the text as necessary. Please note that the numbers and text in charts and tables were not reliably recognized by the OCR process and were not checked or corrected by staff.
Content last modified 5/20/2009.
Confidential (FR) Class III FOMC
September 12, 2003
CURRENT ECONOMICAND FINANCIAL CONDITIONS
Supplemental Notes
Prepared for the Federal Open Market Committeeby the staff of the Board of Governors of the Federal Reserve System
Contents
The Domestic Nonfinancial Economy . . . . . . . . . . . . . . . . . . . . . . . . . . 1Personal Income and Consumer Spending . . . . . . . . . . . . . . . . . . . 1Producer Prices . . . . . . . . . . . . . . . . . . . . . . . . . . . . . . . . . . . . . . . 4
TablesRetail Sales . . . . . . . . . . . . . . . . . . . . . . . . . . . . . . . . . . . . . 2University of Michigan Survey Research Center:
Survey of Consumer Attitudes . . . . . . . . . . . . . . . . 3Recent Changes in Producer Prices . . . . . . . . . . . . . . . . . . 5Recent Changes in Producer Prices –
Relative Contribution . . . . . . . . . . . . . . . . . . . . . . 5
The Domestic Financial Economy . . . . . . . . . . . . . . . . . . . . . . . . . . . . . 6
TablesCommercial Bank Credit . . . . . . . . . . . . . . . . . . . . . . . . . . 6Selected Financial Market Quotations . . . . . . . . . . . . . . . . 7
The International Economy . . . . . . . . . . . . . . . . . . . . . . . . . . . . . . . . . . 8Trade in Goods and Services . . . . . . . . . . . . . . . . . . . . . . . . . . . . . 8Prices of Internationally Traded Goods . . . . . . . . . . . . . . . . . . . . . 9Non-oil imports . . . . . . . . . . . . . . . . . . . . . . . . . . . . . . . . . 9Oil . . . . . . . . . . . . . . . . . . . . . . . . . . . . . . . . . . . . . . . . 9Exports . . . . . . . . . . . . . . . . . . . . . . . . . . . . . . . . . . . . . . . . 9
TablesNet Trade in Goods and Services . . . . . . . . . . . . . . . . . . . . 8U.S. Exports and Imports of Goods and Services . . . . . . 11Prices of U.S. Imports and Exports . . . . . . . . . . . . . . . . . 12
ChartsU.S. International Trade in Goods and Services . . . . . . . 10Oil Prices . . . . . . . . . . . . . . . . . . . . . . . . . . . . . . . . . . . . . 12

Supplemental Notes
The Domestic Nonfinancial Economy
Personal Income and Consumer SpendingTotal nominal retail sales rose 0.6 percent in August after having surged 1.3 percent in July. Sales rose 0.5 percent at motor vehicles and parts dealersbut fell a touch at building material and supply stores. Nominal sales in theretail control group of stores, which excludes those outlets, advanced 0.8 percentin August. In addition, the increases in the retail control category in June andJuly were revised up slightly to 1 percent and 0.9 percent, respectively. Thesedata are broadly consistent with the current-quarter estimate for real purchasesof goods excluding cars and trucks that we wrote down in the SeptemberGreenbook.
The increase in nominal sales within the retail control category in August wasfairly broad-based. Sales at general merchandise stores, electronics andappliance outlets, gasoline stations, and food services posted strong gains. Theonly downturns were recorded at clothing and accessories stores and at nonstoreretailers (which include electronic shopping and mail order houses).
According to the preliminary report, the Michigan Survey Research Center’s(SRC) index of consumer sentiment ticked down about 1 point in earlySeptember relative to August’s final report. The SRC index has been relativelyflat since June and stands well above its March low. Both the current and expected conditions components of the overall indexslipped in early September. For current conditions, consumers’ assessments ofbuying conditions for large household appliances and of their current personalfinances both dipped. For expected conditions, a drop in expected businessconditions over the next twelve months was only partly offset by animprovement in consumers’ appraisals of their expected personal finances.
Among those items not included in the overall index, expectations about thechange in unemployment over the next twelve months deteriorated slightly,partly reversing their improvement in August. Assessments of buyingconditions for houses dropped to their lowest level since March while appraisalsof buying conditions for cars were unchanged.
In early September, the mean of expected inflation over the next twelve monthsjumped to 3.6 percent, and the median rose to 2.9 percent after having increasednoticeably in August. Both measures are at their highest levels since March. Incontrast, the mean of expected inflation over the next five to ten years slid to2.8 percent while the median edged down to 2.6 percent, its lowest level sincelast September.

September 12, 2003
Retail Sales(Percent change; seasonally adjusted)
2002 2003 2003
Q4 Q1 Q2 June July Aug.
Total retail trade and food services .5 1.4 1.4 .9 1.3 .6 Previous estimate 1.3 .9 1.4
Retail control1 1.1 1.9 .1 1.0 .9 .8 Previous estimate .1 .8 .8
Furniture and home furnishing 1.3 -1.0 4.7 1.3 .5 .7 Electronics and appliances 1.4 -1.0 3.5 1.5 1.6 1.4 Clothing and accessories 2.7 .3 .5 1.2 1.2 -1.4 General merchandise 1.0 1.0 .7 .8 1.3 1.1 Food and beverage stores .3 2.1 .2 1.0 .8 .4
Gasoline stations 3.1 7.6 -6.4 1.2 1.8 2.7 Health & personal care .7 1.6 1.3 1.3 1.1 .3 Nonstore retailers2 2.2 2.5 -1.7 1.5 .0 -.5 Other retailers3 -1.0 -.8 .7 .6 -.3 .8
Food services 1.1 2.3 2.3 .6 .5 1.4
Other aggregates of retail sales: Total excluding motor vehicles 1.1 1.7 .5 1.2 1.0 .7 Previous estimate .4 1.0 .8
GAF 4 1.3 .2 1.3 1.2 1.1 .6 Previous estimate 1.1 .7 .8
Building material and supply stores 1.2 -.3 3.5 2.6 1.6 -.2 Motor vehicles and parts -1.6 .4 4.3 .1 2.4 .5
1. Total retail trade and food services sales less sales at building material and supply storesand automobile and other motor vehicle dealers. 2. Includes electronic shopping and mail order houses. 3. Includes miscellaneous retailers and sporting goods, hobby, book, and music stores. 4. Comprises furniture and home furnishings, electronics and appliances, computers, clothingand accessories, sporting goods, hobby, book, music, and general merchandise.
- 2 -

September 12, 2003
University of Michigan Survey Research Center: Survey of Consumer Attitudes Indexes of consumer sentiment
(Not seasonally adjusted)
2003
Category Feb. Mar. Apr. May June July Aug. Sept.P
Composite of current and expected conditions1 79.9 77.6 86.0 92.1 89.7 90.9 89.3 88.2 Current conditions1 95.4 90.0 96.4 93.2 94.7 102.1 99.7 98.9 Expected conditions1 69.9 69.6 79.3 91.4 86.4 83.7 82.5 81.3
Personal financial situation Now compared with 12 months ago2 102 96 111 97 102 110 109 108 Expected in 12 months2 127 128 131 138 136 135 124 130
Expected business conditions Next 12 months2 66 63 87 120 111 106 111 100 Next 5 years2 86 87 99 110 100 95 97 96
Appraisal of buying conditions Cars 140 141 149 160 157 160 150 150 Large household appliances2 145 136 139 144 143 155 150 148 Houses 165 153 157 175 166 169 165 155
Expected unemployment change - next 12 months 130 130 120 107 115 116 111 114
Prob. household will lose a job - next 5 years 26 24 25 26 25 24 24 26
Expected inflation - next 12 months Mean 3.2 3.8 2.7 2.5 2.5 2.3 2.8 3.6 Median 2.7 3.1 2.4 2.0 2.1 1.7 2.5 2.9
Expected inflation - next 5 to 10 years Mean 3.1 2.9 3.1 3.1 3.0 3.2 3.0 2.8 Median 2.7 2.8 2.7 2.8 2.7 2.7 2.7 2.6
Note. Figures on financial, business, and buying conditions are the percent reporting ’good times’ (or’better’) minus the percent reporting ’bad times’ (or ’worse’), plus 100. Expected change in unemployment is the fraction expecting unemployment to rise minus the fraction expecting unemployment to fall, plus 100. P Preliminary. 1. Feb. 1966 = 100. 2. Indicates the question is one of the five equally-weighted components of the index of sentiment.
- 3 -

1. Based on daily data on rack prices for gasoline, we expect to see a decline in the PPI forgasoline in September.
Producer PricesThe producer price index for finished goods rose 0.4 percent in August, led byan increase of 0.7 percent in food prices and a rise of 1.2 percent in energyprices. Excluding food and energy, the finished-goods PPI edged up 0.1 percentlast month following July’s rise of 0.2 percent. August’s increase in the corewas about in line with our expectations and left core PPI inflation at 0.4 percenton a twelve-month change basis, up 0.8 percentage point from a year earlier. Last month’s increase in the PPI for energy reflected a jump of 6.3 percent ingasoline prices as well as smaller gains in fuel oil and electricity prices; bycontrast, natural gas prices fell 1.5 percent.1 Over the year ending in August, thePPI for energy rose more than 14 percent compared with a year-earlier declineof 5-1/2 percent.
The August rise in food prices came on the heels of a small decline in July; largeincreases in prices for fresh fruit and vegetables and for beef and veal contributed importantly to last month’s jump. Over the twelve months ending inAugust, the PPI for food rose 5 percent after having fallen 2.3 percent over theyear-earlier period.
Prices for consumer goods excluding food and energy ticked up 0.1 percent lastmonth and were essentially unchanged relative to a year earlier. The PPI forcapital equipment edged up 0.1 percent as well, with increases in car and lighttruck prices largely offsetting a decline in prices of communications equipment. After having fallen 1 percent between August 2001 and August 2002, prices forcapital goods rose 0.8 percent over the twelve months ending in August 2003,reflecting an acceleration in prices in most categories.
At earlier stages of processing, the PPI for core intermediate materials edged up0.1 percent in August and was up 1.8 percent from a year earlier. Prices of corecrude material prices jumped 3.7 percent, boosted by large increases in scrapmetal prices; core crude prices were up 8.3 percent relative to a year earlier.
- 4 -

Recent Changes in Producer Prices(Percent change; based on seasonally adjusted data)1
12-month change3 2003 2003
Product Weights2 Aug. 2002 Aug. 2003 Q1 Q2 June July Aug.
Annual rate Monthly rate
Finished goods 100.0 -1.5 3.4 16.8 -5.9 .5 .1 .4 Consumer foods 20.7 -2.3 5.0 10.1 5.1 .4 -.2 .7 Consumer energy 15.0 -5.5 14.2 96.8 -27.8 3.4 .3 1.2 Other finished goods 64.4 -.4 .4 3.5 -2.4 -.1 .2 .1 Consumer goods 37.7 .0 .1 4.1 -3.0 -.1 .1 .1 Capital equipment 26.7 -1.0 .8 2.9 -1.7 -.1 .4 .1
Intermediate materials4 96.0 -.9 4.3 24.0 -10.6 .5 .1 .6 Excluding food and energy 79.5 .2 1.8 6.0 -.9 .0 -.1 .1
Crude food materials 38.7 -8.6 11.8 18.0 10.1 -.5 -3.0 3.7 Crude energy 41.0 -1.8 38.2 579.5 -61.3 10.7 -4.4 -7.4 Other crude materials 20.3 9.0 8.3 19.0 -9.4 .6 .8 3.7
1. Changes are from final month of preceding period to final month of period indicated. 2. Relative importance weights for December 2002, which are based on 1997 shipment levels.Years prior to 2002 are based on 1992 shipment weights. 3. Not seasonally adjusted. 4. Excludes materials for food manufacturing and animal feeds.
Recent Changes in Producer Prices -- Relative Contribution1(Percent change; based on seasonally adjusted data)2
12-month change4 2003 2003
Product Weights3 Aug. 2002 Aug. 2003 Q1 Q2 June July Aug.
Annual rate Monthly rate
Finished goods 100.0 -1.5 3.4 16.8 -5.9 .5 .1 .4 Consumer foods 20.7 -.5 1.0 2.0 1.0 .1 -.0 .1 Consumer energy 15.0 -.9 2.1 11.5 -5.2 .5 .0 .2 Other finished goods 64.4 -.3 .3 2.3 -1.5 -.1 .1 .1 Consumer goods 37.7 .0 .0 1.5 -1.1 -.0 .0 .0 Capital equipment 26.7 -.3 .2 .8 -.4 -.0 .1 .0
1. Data may not add due to rounding. 2. Changes are from final month of preceding period to final month of period indicated. 3. Relative importance weights for December 2002, which are based on 1997 shipment levels.Years prior to 2002 are based on 1992 shipment weights. 4. Not seasonally adjusted.
- 5 -

Commercial Bank Credit(Percent change, annual rate, except as noted; seasonally adjusted)
Level,Type of credit 2002 Q4 Q1 Feb. Mar. Apr.p Apr. 2003p
2002 2003 2003 2003 2003 ($ billions)
Total 1. Adjusted1 7.1 12.4 7.4 13.9 7.0 8.0 5,834 2. Reported 7.1 11.8 8.1 15.3 6.0 4.4 6,017
Securities 3. Adjusted1 13.3 16.1 11.9 26.3 11.1 14.3 1,575 4. Reported 12.7 13.5 14.0 29.8 7.3 1.5 1,757 5. Treasury and agency 19.2 25.2 17.1 30.3 11.2 26.7 1,081 6. Other2 4.4 -2.6 9.5 29.1 1.4 -36.6 677
Loans3
7. Total 5.0 11.1 5.8 9.4 5.5 5.7 4,259 8. Business -6.9 -4.0 -5.9 -9.7 -8.7 -2.5 944 9. Real estate 13.1 20.4 13.4 17.9 7.3 7.9 2,103 10. Home equity 36.7 24.7 26.2 25.4 38.3 19.9 233 11. Other 10.8 19.9 11.9 17.1 3.6 6.4 1,870
12. Consumer 5.5 8.6 4.2 2.2 -6.1 -3.7 589 13. Adjusted4 4.1 4.9 7.7 7.4 .5 -.3 950 14. Other5 1.4 8.5 .3 17.8 33.4 20.2 623
Note. All data are adjusted for breaks caused by reclassifications. Monthly levels are pro rata averages of weekly (Wednesday)levels. Quarterly levels (not shown) are simple averages of monthly levels. Annual levels (not shown) are levels for the fourthquarter. Growth rates are percentage changes in consecutive levels, annualized but not compounded. The conversion from a thriftto a commercial bank charter added approximately $37 billion to the assets and liabilities of domestically chartered commercialbanks in the week ending May 8, 2002. 1. Adjusted to remove effects of mark-to-market accounting rules (FIN 39 and FIN 115). 2. Includes private mortgage-backed securities, securities of corporations, state and local governments, and foreign governmentsand any trading account assets that are not Treasury or agency securities, including revaluation gains on derivative contracts. 3. Excludes interbank loans. 4. Includes an estimate of outstanding loans securitized by commercial banks. 5. Includes security loans and loans to farmers, state and local governments, and all others not elsewhere classified. Also includeslease financing receivables. p Preliminary.
- 6 -
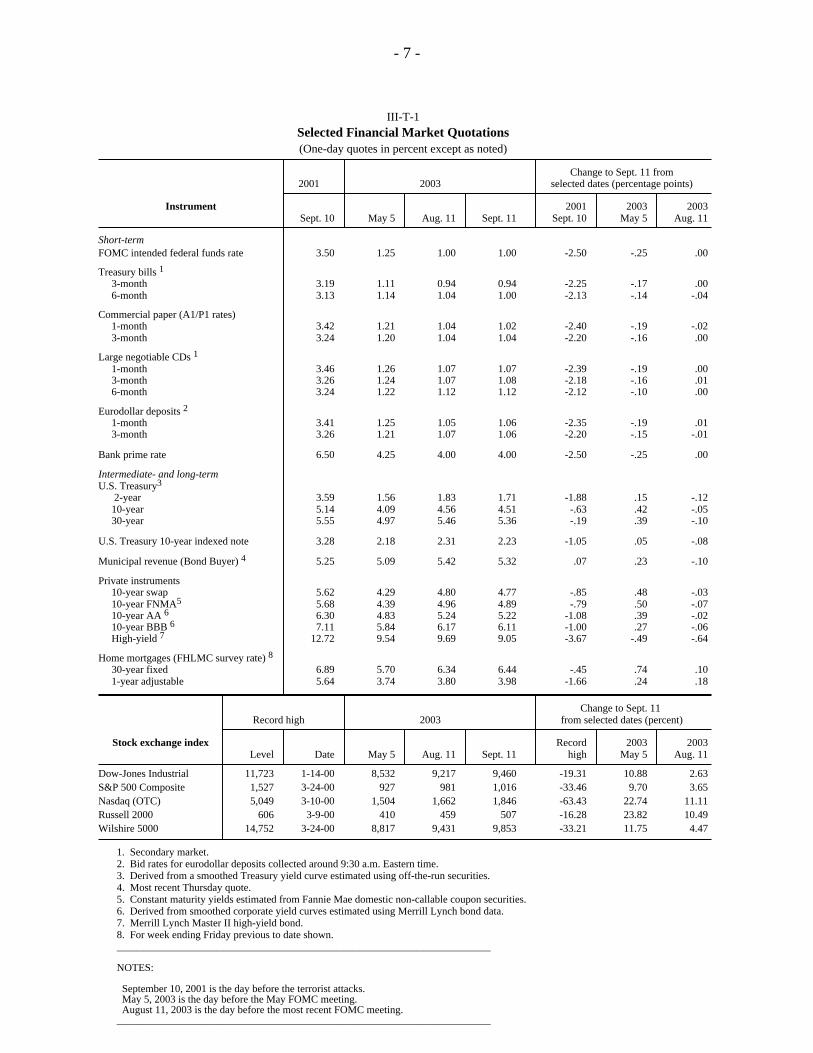
III-T-1Selected Financial Market Quotations(One-day quotes in percent except as noted)
Change to Sept. 11 from2001 2003 selected dates (percentage points)
Instrument 2001 2003 2003 Sept. 10 May 5 Aug. 11 Sept. 11 Sept. 10 May 5 Aug. 11
Short-termFOMC intended federal funds rate 3.50 1.25 1.00 1.00 -2.50 -.25 .00
Treasury bills 1
3-month 3.19 1.11 0.94 0.94 -2.25 -.17 .00 6-month 3.13 1.14 1.04 1.00 -2.13 -.14 -.04
Commercial paper (A1/P1 rates) 1-month 3.42 1.21 1.04 1.02 -2.40 -.19 -.02 3-month 3.24 1.20 1.04 1.04 -2.20 -.16 .00
Large negotiable CDs 1
1-month 3.46 1.26 1.07 1.07 -2.39 -.19 .00 3-month 3.26 1.24 1.07 1.08 -2.18 -.16 .01 6-month 3.24 1.22 1.12 1.12 -2.12 -.10 .00
Eurodollar deposits 2
1-month 3.41 1.25 1.05 1.06 -2.35 -.19 .01 3-month 3.26 1.21 1.07 1.06 -2.20 -.15 -.01
Bank prime rate 6.50 4.25 4.00 4.00 -2.50 -.25 .00
Intermediate- and long-termU.S. Treasury3
2-year 3.59 1.56 1.83 1.71 -1.88 .15 -.12 10-year 5.14 4.09 4.56 4.51 -.63 .42 -.05 30-year 5.55 4.97 5.46 5.36 -.19 .39 -.10
U.S. Treasury 10-year indexed note 3.28 2.18 2.31 2.23 -1.05 .05 -.08
Municipal revenue (Bond Buyer) 4 5.25 5.09 5.42 5.32 .07 .23 -.10
Private instruments 10-year swap 5.62 4.29 4.80 4.77 -.85 .48 -.03 10-year FNMA5 5.68 4.39 4.96 4.89 -.79 .50 -.07 10-year AA 6 6.30 4.83 5.24 5.22 -1.08 .39 -.02 10-year BBB 6 7.11 5.84 6.17 6.11 -1.00 .27 -.06 High-yield 7 12.72 9.54 9.69 9.05 -3.67 -.49 -.64
Home mortgages (FHLMC survey rate) 8
30-year fixed 6.89 5.70 6.34 6.44 -.45 .74 .10 1-year adjustable 5.64 3.74 3.80 3.98 -1.66 .24 .18
Change to Sept. 11 Record high 2003 from selected dates (percent)
Stock exchange index Record 2003 2003 Level Date May 5 Aug. 11 Sept. 11 high May 5 Aug. 11
Dow-Jones Industrial 11,723 1-14-00 8,532 9,217 9,460 -19.31 10.88 2.63S&P 500 Composite 1,527 3-24-00 927 981 1,016 -33.46 9.70 3.65Nasdaq (OTC) 5,049 3-10-00 1,504 1,662 1,846 -63.43 22.74 11.11Russell 2000 606 3-9-00 410 459 507 -16.28 23.82 10.49Wilshire 5000 14,752 3-24-00 8,817 9,431 9,853 -33.21 11.75 4.47
1. Secondary market. 2. Bid rates for eurodollar deposits collected around 9:30 a.m. Eastern time. 3. Derived from a smoothed Treasury yield curve estimated using off-the-run securities. 4. Most recent Thursday quote. 5. Constant maturity yields estimated from Fannie Mae domestic non-callable coupon securities. 6. Derived from smoothed corporate yield curves estimated using Merrill Lynch bond data. 7. Merrill Lynch Master II high-yield bond. 8. For week ending Friday previous to date shown. _______________________________________________________________________
NOTES:
September 10, 2001 is the day before the terrorist attacks. May 5, 2003 is the day before the May FOMC meeting. August 11, 2003 is the day before the most recent FOMC meeting. _______________________________________________________________________
- 7 -
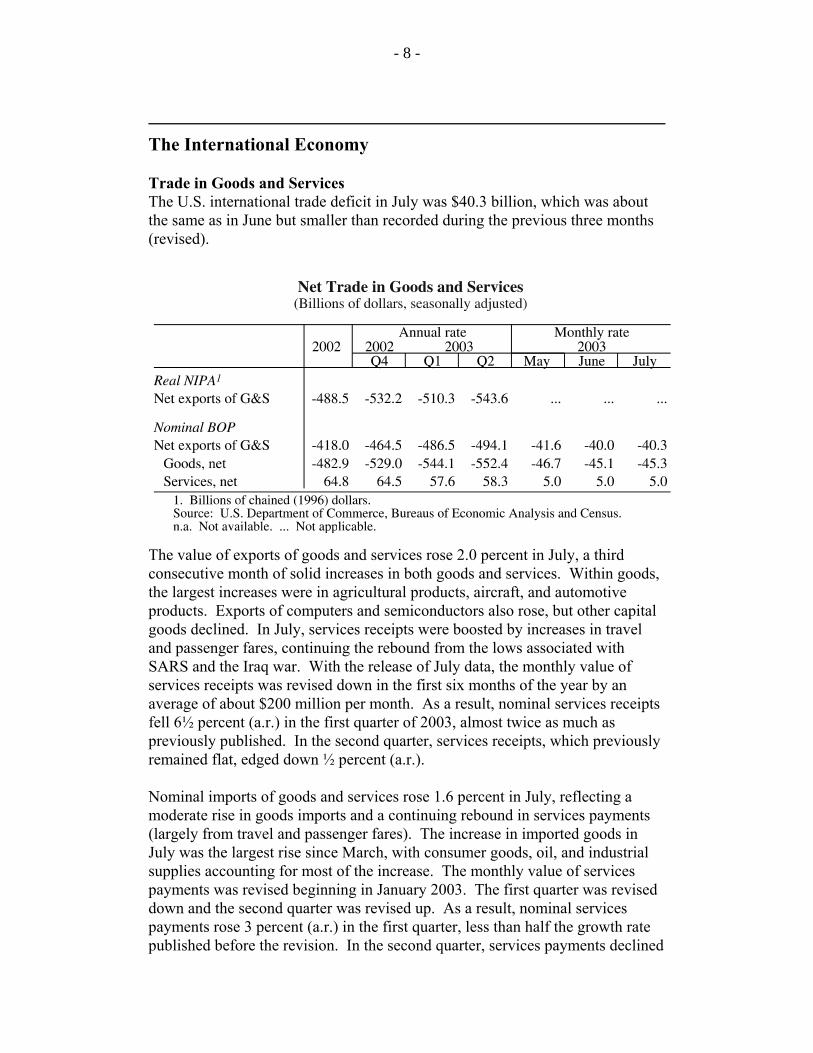
The International Economy
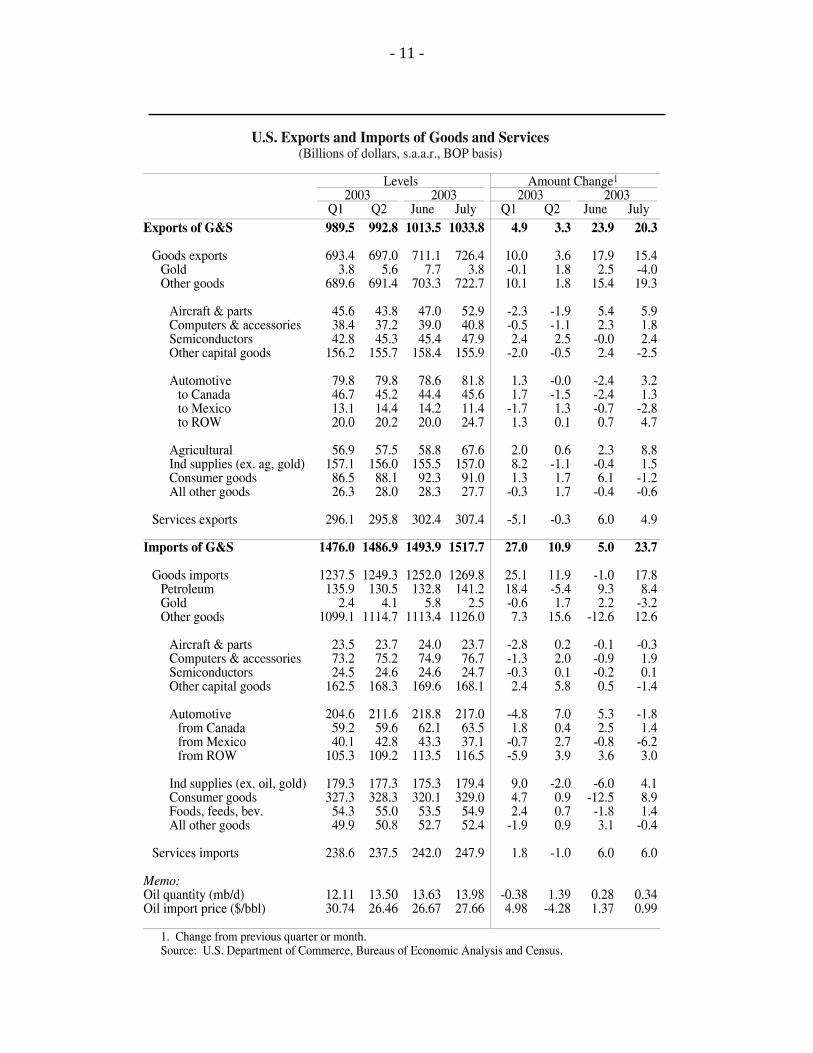
Trade in Goods and ServicesThe U.S. international trade deficit in July was $40.3 billion, which was aboutthe same as in June but smaller than recorded during the previous three months(revised).
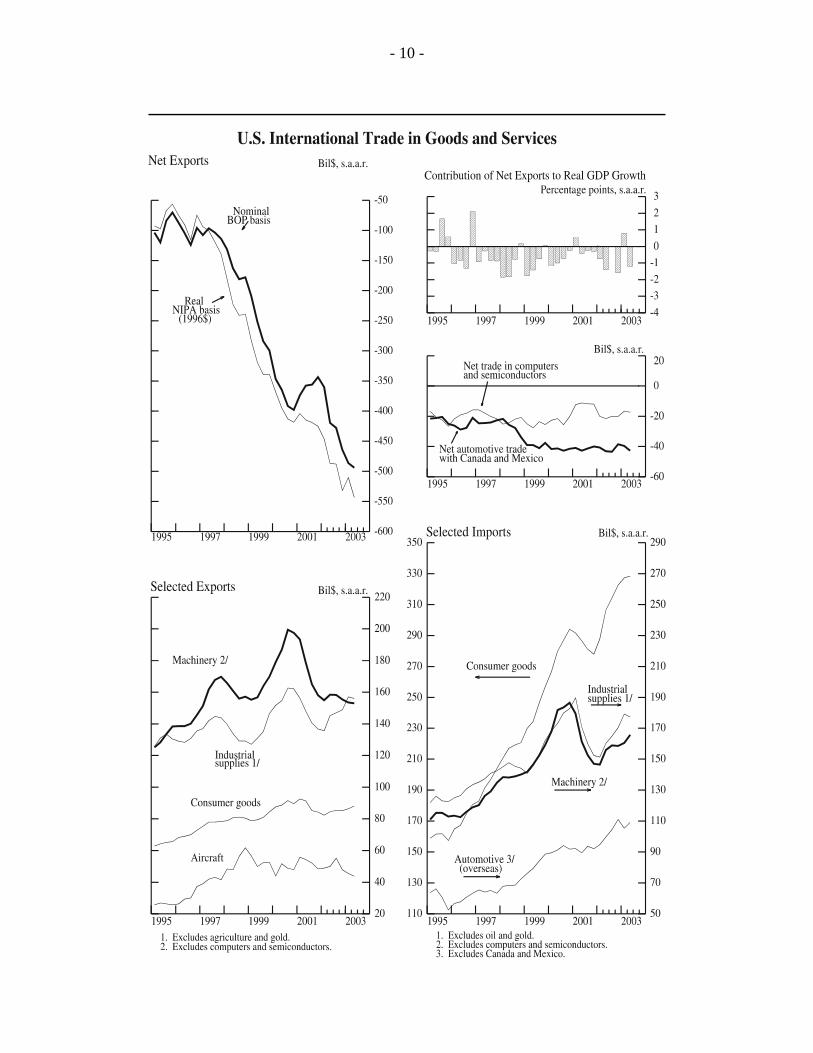
The value of exports of goods and services rose 2.0 percent in July, a thirdconsecutive month of solid increases in both goods and services. Within goods,the largest increases were in agricultural products, aircraft, and automotiveproducts. Exports of computers and semiconductors also rose, but other capitalgoods declined. In July, services receipts were boosted by increases in traveland passenger fares, continuing the rebound from the lows associated withSARS and the Iraq war. With the release of July data, the monthly value ofservices receipts was revised down in the first six months of the year by anaverage of about $200 million per month. As a result, nominal services receiptsfell 6½ percent (a.r.) in the first quarter of 2003, almost twice as much aspreviously published. In the second quarter, services receipts, which previouslyremained flat, edged down ½ percent (a.r.).
Nominal imports of goods and services rose 1.6 percent in July, reflecting amoderate rise in goods imports and a continuing rebound in services payments(largely from travel and passenger fares). The increase in imported goods inJuly was the largest rise since March, with consumer goods, oil, and industrialsupplies accounting for most of the increase. The monthly value of servicespayments was revised beginning in January 2003. The first quarter was reviseddown and the second quarter was revised up. As a result, nominal servicespayments rose 3 percent (a.r.) in the first quarter, less than half the growth ratepublished before the revision. In the second quarter, services payments declined
- 8 -

1¾ percent (a.r.), compared with the previously published decline of nearly6 percent (a.r.).
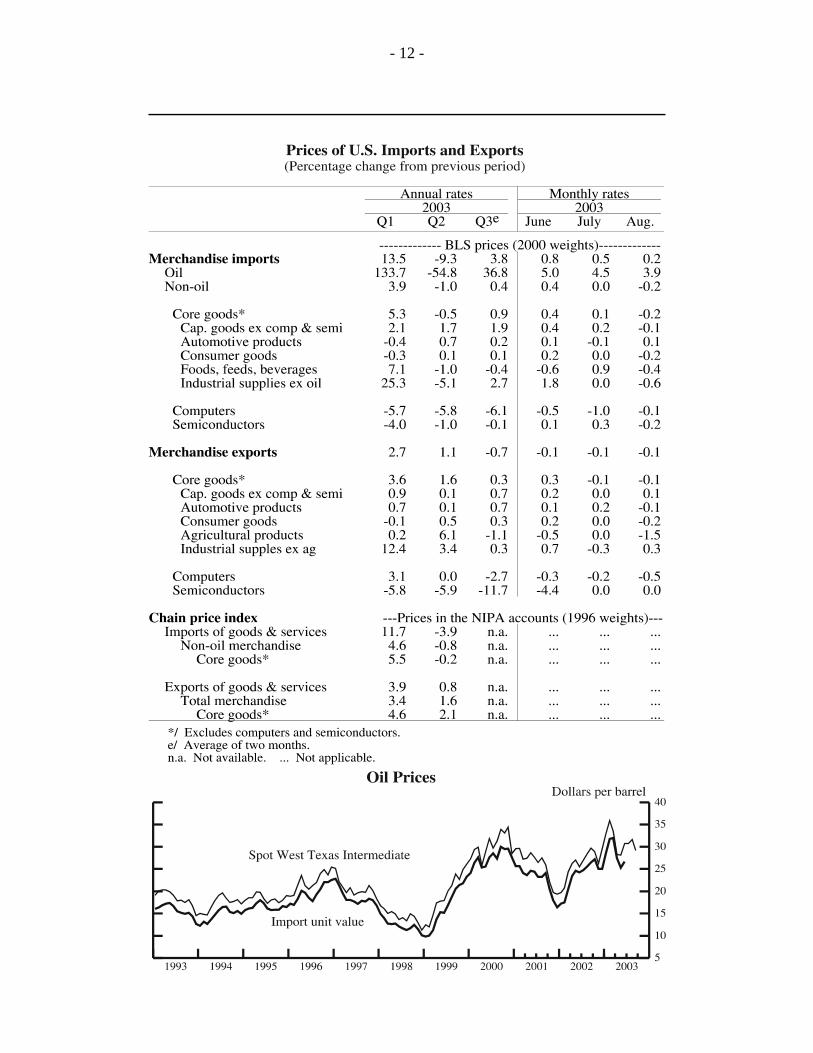
Prices of Internationally Traded GoodsNon-oil imports. In August, the prices of U.S. imports of non-oil goods and ofcore goods both fell 0.2 percent, following revised July growth rates of 0.0 and0.1 percent, respectively. Within core goods, the largest price changes were inindustrial supplies and foods, feeds and beverages. After a 0.9 percent increasein July, prices of foods, feeds and beverages fell 0.4 percent in August, led bylower prices for vegetables. The 0.6 percent decline in the price of industrialsupplies was the result of a lower price for natural gas, which offset increases inmetals, building materials, and paper. In other major trade categories withincore goods, prices generally edged down, with the exception of automotiveproducts which rose slightly. The prices of U.S. imports of computers continuedto decline in August, and semiconductor prices also fell.
Oil. The BLS price of imported oil rose 3.9 percent in August, following arevised 4.5 percent increase in July. The spot price of West Texas Intermediate(WTI) crude oil was also higher in August, averaging $31.60 per barrel, upabout 80 cents from July. Thus far in September, the spot price has fallen,closing at $28.83 per barrel on September 11. The recent decline may reflectthe lack of supply disruptions from tropical storms and heightened marketconcern about expected increases in non-OPEC oil supply. However, pricesremain elevated, relative to historical norms, owing to the slow return of Iraqiexports and low global oil inventories.
Exports. In August, for the second consecutive month, the prices of U.S.exports of total goods and of core goods both fell 0.1 percent. Falling prices ofagricultural products, particularly soybeans and corn, were responsible for muchof the August decline. However, from the first week of August when the BLScollected their price data to the end of the month, the spot prices of soybeansand corn each rose about 9 percent. Export prices also moved down slightly forconsumer goods but edged upward for industrial supplies. The prices of U.S.exports of computers fell 0.5 percent; prices of semiconductors were unchanged.
- 9 -
- 10 -
- 11 -
- 12 -