Embed Size (px)
Citation preview
Prefatory Note
The attached document represents the most complete and accurate version available based on original copies culled from the files of the FOMC Secretariat at the Board of Governors of the Federal Reserve System. This electronic document was created through a comprehensive digitization process which included identifying the best-preserved paper copies, scanning those copies,1 and then making the scanned versions text-searchable.2 Though a stringent quality assurance process was employed, some imperfections may remain.
Please note that this document may contain occasional gaps in the text. These gaps are the result of a redaction process that removed information obtained on a confidential basis. All redacted passages are exempt from disclosure under applicable provisions of the Freedom of Information Act.
1 In some cases, original copies needed to be photocopied before being scanned into electronic format. All scanned images were deskewed (to remove the effects of printer- and scanner-introduced tilting) and lightly cleaned (to remove dark spots caused by staple holes, hole punches, and other blemishes caused after initial printing). 2 A two-step process was used. An advanced optimal character recognition computer program (OCR) first created electronic text from the document image. Where the OCR results were inconclusive, staff checked and corrected the text as necessary. Please note that the numbers and text in charts and tables were not reliably recognized by the OCR process and were not checked or corrected by staff.
CONFIDENTIAL (FR)CLASS III FOMC
May 17 1996
SUPPLEMENT
CURRENT ECONOMIC AND FINANCIAL CONDITIONS
Prepared for theFederal Open Market Committee
By the StaffBoard of Governors
of the Federal Reserve System
TABLE OF CONTENTS
Page
THE NONFINANCIAL ECONOMY
Consumer sentiment . .
Table
University of Michigan Survey Research Center:Survey of consumer attitudes . . . . . . . . . .
THE FINANCIAL ECONOMY
Erratum . . . . . . . . . . . . . . . . . . . . . .
Tables
Selected financial market quotations . . . . . . . .Commercial bank credit . . . . . . . . . . . . . . .
THE INTERNATIONAL ECONOMY
U.S. international trade in goods and services .
Tables
U.S. international trade in goods and services .U.S. trade in goods and services:
Summary details . . . . . . . . . . . . ... .Summary of months and quarters--dollar changesSummary of months and quarters--percent changes.
S 4S 5
6
. . . 1
SUPPLEMENTAL NOTES
THE DOMESTIC NONFINANCIAL ECONOMY
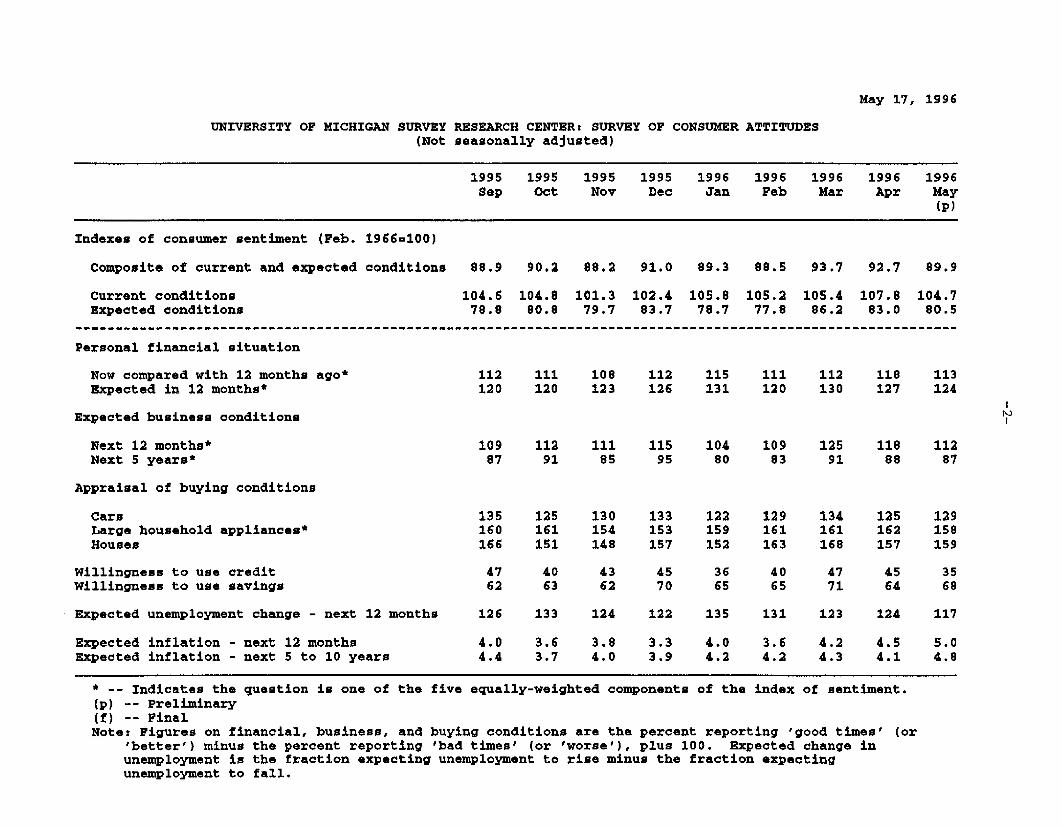
Consumer Sentiment
According to the preliminary report for May, the Michigan SRC
index of consumer sentiment fell three points to an index level
close to the lower end of the relatively favorable range seen since
early 1994. Respondents reported less favorable views of both
current and expected conditions.
Among questions not included in the overall index, results were
mixed in early May. Considerably fewer households said that they
expect an increase in unemployment over the coming year. In
addition, the indexes of buying conditions for cars and houses both
rebounded a bit after posting large declines in April. However,
respondents expressed noticeably less willingness to use credit to
make large purchases.
Respondents reported higher expectations of inflation over both
the coming year and the next five to ten years in early May. The
mean level of expected inflation over the coming year rose
1/2 percentage point in early May to 5 percent, and the median level
rose 0.1 percentage point to 3.1 percent. The mean level of
expected inflation over the next five to ten years rose
0.7 percentage point to 4.8 percent; the median level rose
0.3 percentage point to 3.3 percent. The medians of both inflation
measures are currently at their highest values in more than a year.
May 17, 1996
UNIVERSITY OF MICHIGAN SURVEY RESEARCH CENTER: SURVEY OF CONSUMER ATTITUDES(Not seasonally adjusted)
1995 1995 1995 1995 1996 1996 1996 1996 1996Sep Oct Nov Dec Jan Feb Mar Apr May
(P)
Indexes of consumer sentiment (Feb. 1966-100)
Composite of current and expected conditions 88.9 90.2 88.2 91.0 89.3 88.5 93.7 92.7 89.9
Current conditions 104.6 104.8 101.3 102.4 105.8 105.2 105.4 107.8 104.7Expected conditions 78.8 80.8 79.7 83.7 78.7 77.8 86.2 83.0 80.5
Personal financial situation
Now compared with 12 months ago* 112 111 108 112 115 111 112 118 113Expected in 12 months* 120 120 123 126 131 120 130 127 124
Expected business conditions
Next 12 months* 109 112 111 115 104 109 125 118 112Next 5 years* 87 91 85 95 80 83 91 88 87
Appraisal of buying conditions
Cars 135 125 130 133 122 129 134 125 129Large household appliances* 160 161 154 153 159 161 161 162 158Houses 166 151 148 157 152 163 168 157 159
Willingness to use credit 47 40 43 45 36 40 47 45 35Willingness to use savings 62 63 62 70 65 65 71 64 68
Expected unemployment change - next 12 months 126 133 124 122 135 131 123 124 117
Expected inflation - next 12 months 4.0 3.6 3.8 3.3 4.0 3.6 4.2 4.5 5.0Expected inflation - next 5 to 10 years 4.4 3.7 4.0 3.9 4.2 4.2 4.3 4.1 4.8
* -- Indicates the question is one of the five(p) -- Preliminary(f) -- Final
equally-weighted components of the index of sentiment.
Note: Figures on financial, business, and buying conditions are the percent reporting 'good times' (or'better') minus the percent reporting 'bad times' (or 'worse'), plus 100. Expected change inunemployment is the fraction expecting unemployment to rise minus the fraction expectingunemployment to fall.

-3-
THE FINANCIAL ECONOMY
Erratum
On page I-13 in Part 1 of the Greenbook, the first sentence of
the third paragraph should read: "The debt of domestic nonfinancial
sectors is projected to expand about 4-1/2 percent this year and
next, slightly less than nominal GDP."
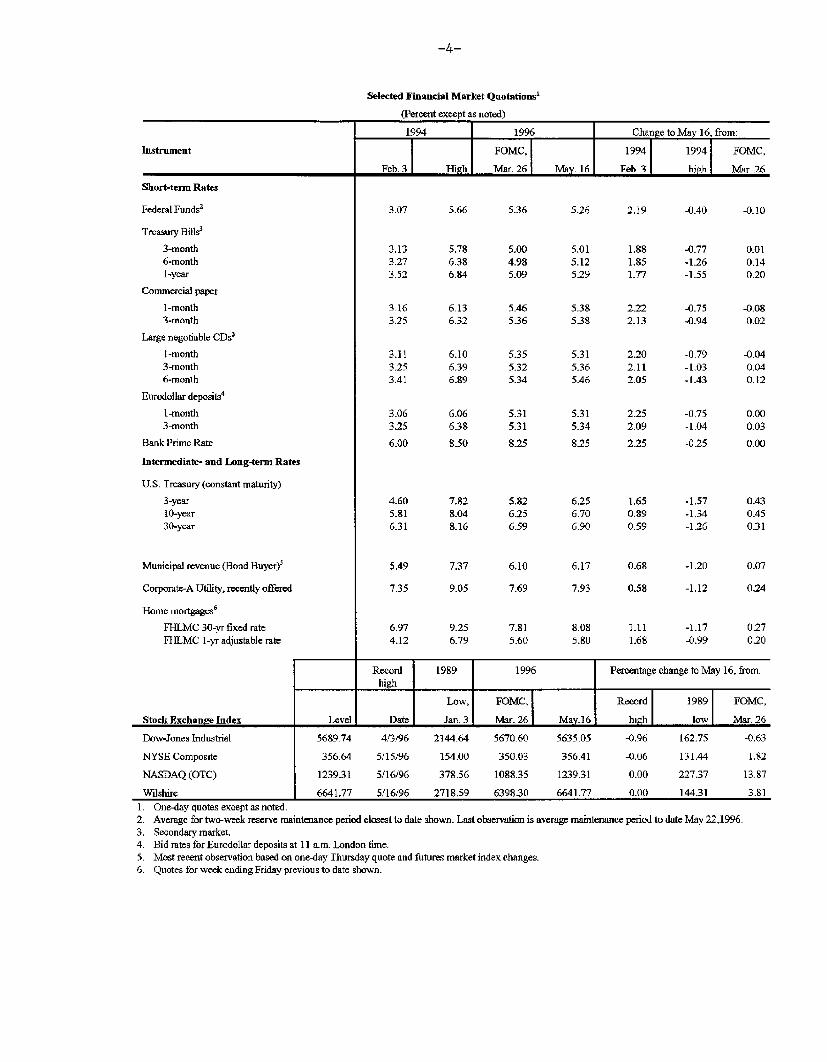
Selected Financial Market Quotations'
(Percent except as noted)
1994 1996 Change to May 16, from:
Instrument FOMC, 1994 1994 FOMC,
Feb. 3 High I Mar. 26 May. 16 Feb. 3 high Mar. 26
Short-term Rates
Federal Funds2
Treasury Bills3
3-month6-month1-year
Commercial paper
1-month3-month
Large negotiable CDs'
1-month3-month6-month
Eurodollar deposits4
1-month3-month
Bank Prime Rate
Intermediate- and Long-term Rates
U.S. Treasury (constant maturity)
3-year10-year30-year
Municipal revenue (Bond Buyer)5
Corporate-A Utility, recently offered
Home mortgages 6
FHLMC 30-yr fixed rateFHLMC 1-yr adjustable rate
1 vFel
5.66 5.36 5.26 2.19
538 2.22538 2.13
2.20 -0.792.11 -1.032.05 -1.43
2.25 -0.752.09 -1.04
2.25 -0.25
6.25 1.65 -1.576.70 0.89 -1.346.90 0.59 -1.26
8.08 1.11 -1.17 0.275.80 1.68 -0.99 0.20
Record 1989 1996 Percentage change to May 16, from:high I I I
Low, FOMC, [ Record 1989 FOMC,
Date Jan 3 Mar 26 May16 hioh Iow Mar 26
Dow-Jones Industrial 5689.74 4/3/96 2144.64 5670.60 5635.05 -0.96 162.75 -0.63
NYSE Composite 356.64 5/15/96 154.00 350.03 356.41 -0.06 131.44 1.82
NASDAQ (OTC) 123931 5/16/96 378.56 1088.35 1239.31 0.00 227.37 13.87
Wilshire 6641.77 5/16/96 2718.59 6398.30 6641.77 0.00 144.31 3.81
1. One-day quotes except as noted.2. Average for two-week reserve maintenance period closest to date shown. Last observation is average maintenance period to date May 22,1996.3. Secondary market.4. Bid rates for Eurodollar deposits at 11 a.m. London time.5. Most recent observation based on one-day Thursday quote and futures market index changes.6. Quotes for week ending Friday previous to date shown.
cotS k Exchan e Ind x
-5-
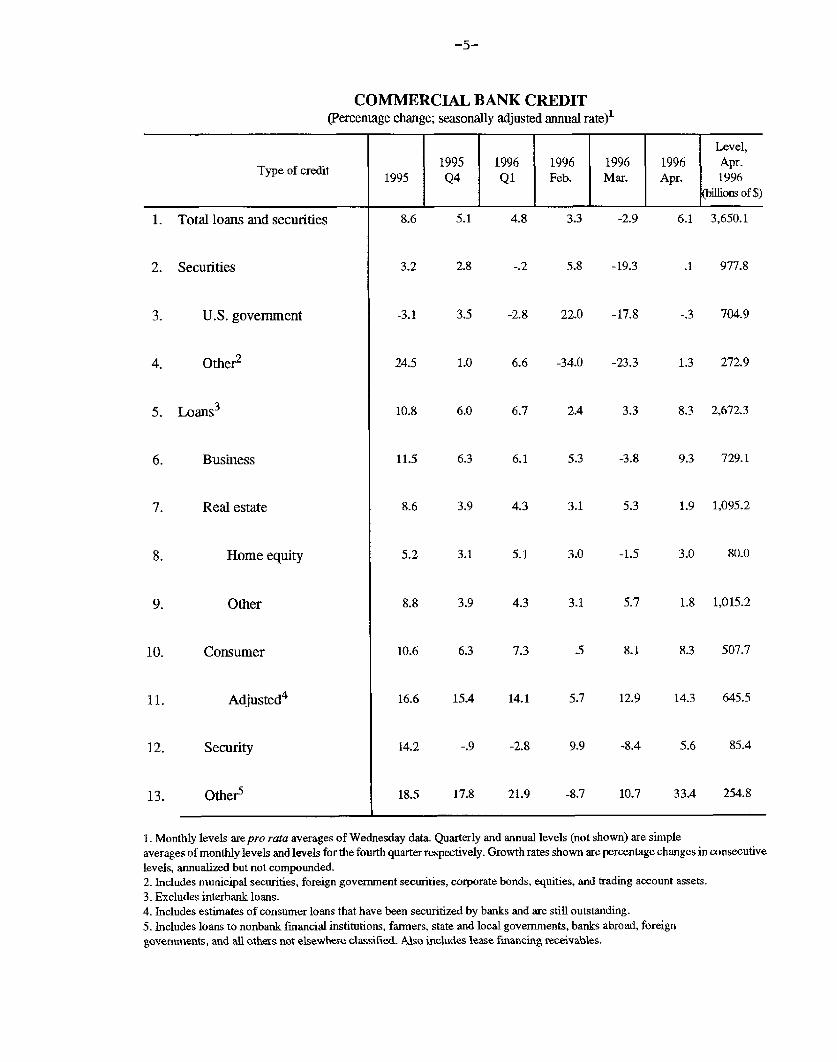
COMMERCIAL BANK CREDIT(Percentage change; seasonally adjusted annual rate) 1
Level,
1995 1996 1996 1996 1996 Apr.Type of credit 1995 Q4 Feb. Mar. Apr. 1996
(billions of $)
1. Total loans and securities
2. Securities
3. U.S. government
4. Other2
5. Loans3
6. Business
7. Real estate
8. Home equity
9. Other
10. Consumer
11. Adjusted 4
12. Security
13. Other5
8.6 5.1 4.8 3.3 -2.9 6.1 3,650.1
3.2
-3.1
24.5
10.8
11.5
8.6
5.2
2.8 -.2 5.8 -19.3
3.5 -2.8 22.0 -17.8
1.0 6.6 -34.0 -23.3
.1 977.8
-.3 704.9
1.3 272.9
6.0 6.7 2.4 3.3 8.3 2,672.3
6.3 6.1 5.3 -3.8 9.3 729.1
3.9 4.3 3.1 5.3 1.9 1,095.2
3.1 5.1 3.0 -1.5 3.0 80.0
8.8 3.9 4.3 3.1 5.7 1.8 1,015.2
10.6 6.3 7.3 5 8.1 8.3 507.7
16.6 15.4 14.1
-.9 -2.8
5.7 12.9 14.3 645.5
9.9 -8.4 5.6 85.4
18.5 17.8 21.9 -8.7 10.7 33.4 254.8
1. Monthly levels are pro rata averages of Wednesday data. Quarterly and annual levels (not shown) are simple
averages of monthly levels and levels for the fourth quarter respectively. Growth rates shown are percentage changes in consecutive
levels, annualized but not compounded.2. Includes municipal securities, foreign government securities, corporate bonds, equities, and trading account assets.
3. Excludes interbank loans.4. Includes estimates of consumer loans that have been securitized by banks and are still outstanding.
5. Includes loans to nonbank financial institutions, farmers, state and local governments, banks abroad, foreign
governments, and all others not elsewhere classified. Also includes lease financing receivables.
-6-
THE INTERNATIONAL ECONOMY
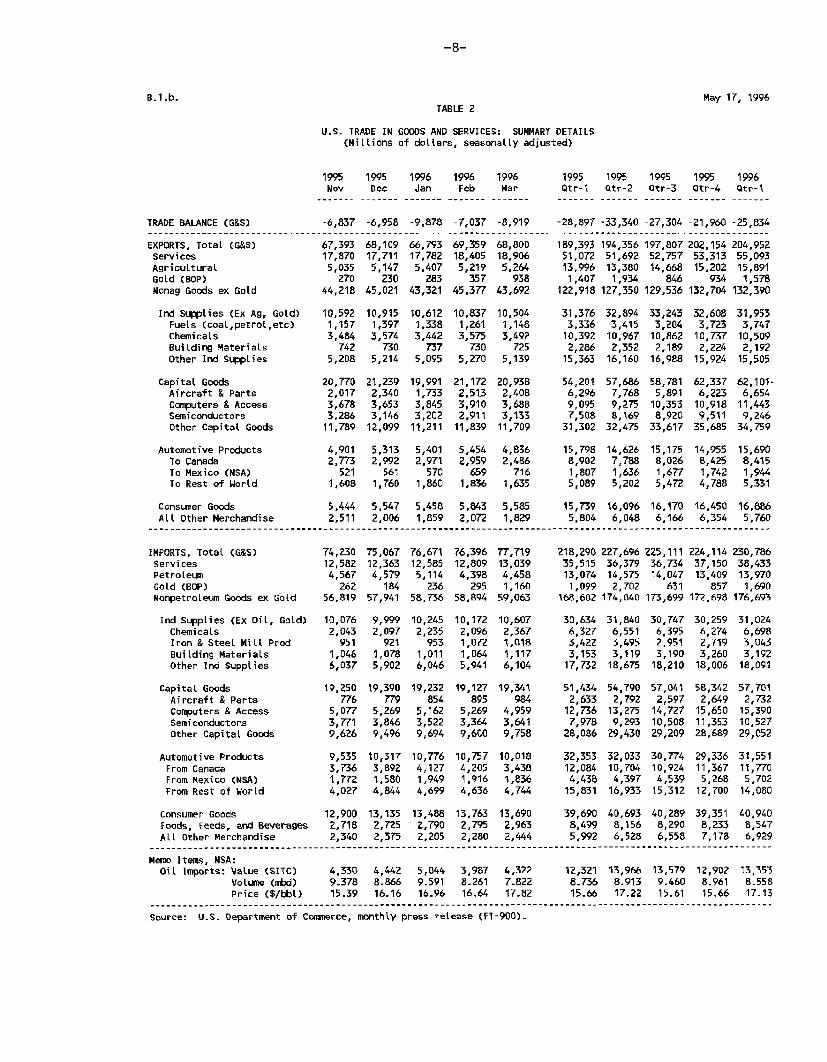
U.S. International Trade in Goods and Services
In March, the deficit in U.S. international trade in goods and
services widened noticeably from a revised February figure. Exports
fell almost 1 percent relative to a February level that was revised
up significantly: most categories of exports saw decreases. Imports
rose 1-3/4 percent; the increase was due almost entirely to a pickup
in imports of gold and industrial supplies.
For the first quarter, the deficit (at an annual rate) was
substantially larger than in the fourth quarter and about the same
as in the third quarter of last year. Exports grew at a
5-1/2 percent annual rate, much slower than the pace set in recent
quarters. Increases in service receipts and in agricultural and
automotive products were about offset by continued declines in
exported industrial supplies and machinery (other than computers).
In contrast, imports grew at a 12 percent annual rate in the first
quarter, after declining in the two previous quarters. Increases
were recorded in most trade categories with the exception of
computers.
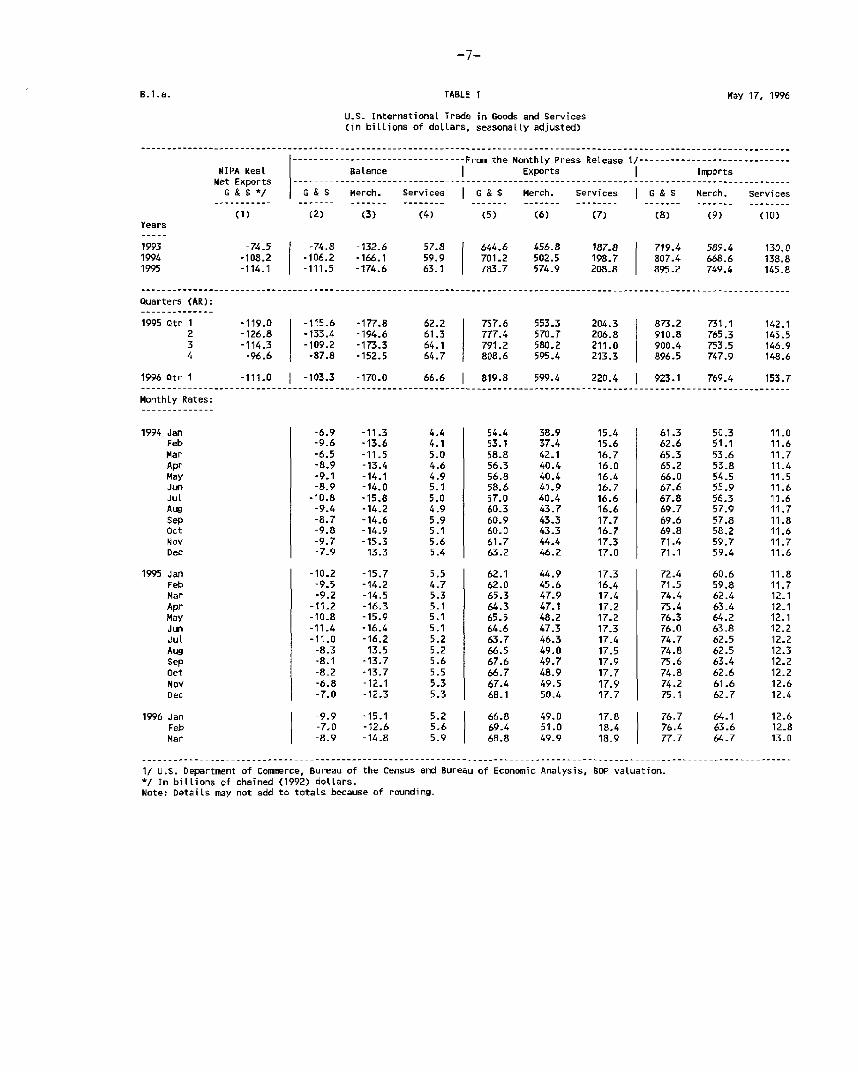
U.S. International Trade in Goods and Services(in billions of dollars, seasonally adjusted)
-..---------------------------From the Monthly Press Release 1/-------------------------NIPA Real Balance Exports I Imports
Met Exports --------------------------- ------------------------------------------------- ------.G & S */ G & S Merch. Services G & S Merch. Services G & S Merch. Services
(1) (2) (3) (4) (5) (6) (7) (8) (9) (10)Years
1993 -74.5 -74.8 -132.6 57.8 644.6 456.8 187.8 719.4 589.4 130.01994 -108.2 -106.2 -166.1 59.9 701.2 502.5 198.7 807.4 668.6 138.81995 -114.1 -111.5 -174.6 63.1 783.7 574.9 208.8 895.2 749.4 145.8
............................................................................................................................
Quarters (AR):
1995 Qtr 1 -119.0 -115.6 -177.8 62.2 757.6 553.3 204.3 873.2 731.1 142.12 -126.8 -133.4 -194.6 61.3 777.4 570.7 206.8 910.8 765.3 145.53 -114.3 -109.2 -173.3 64.1 791.2 580.2 211.0 900.4 753.5 146_9
-96.6 -87.8 -152.5 64.7 808.6 595.4 213.3 896.5 747.9 148.6
1996 Qtr 1 -111.0 -103.3 -170.0 66.6 | 819.8 599.4 220.4 | 923.1 769.4 153.7
Monthly Rates:
-6.9 -11.3-9.6 -13.6-6.5 -11.5-8.9 -13.4-9.1 -14.1-8.9 -14.0
-10.8 -15.8-9.4 -14.2-8.7 -14.6-9.8 -14.9-9.7 -15.3-7.9 -13.3
-10.2 -15.7-9.5 -14.2-9.2 -14.5
-11.2 -16.3-10.8 -15.9-11.4 -16.4-11.0 -16.2-8.3 -13.5-8.1 -13.7-8.2 -13.7-6.8 -12.1-7.0 -12.3
54.4 38.953.1 37.458.8 42.156.3 40.456.8 40.458.6 41.957.0 40.460.3 43.760.9 43.360.0 43.361.7 44.463.2 46.2
62.1 44.962.0 45.665.3 47.964.3 47.165.5 48.264.6 47.363.7 46.366.5 49.067.6 49.766.7 48.967.4 49.568.1 50.4
9.9 -15.1 5.2 66.8 49.0 17.8-7.0 -12.6 5.6 69.4 51.0 18.4-8.9 -14.8 5.9 68.8 49.9 18.9
61.3 50.362.6 51.165.3 53.665.2 53.866.0 54.567.6 55.967.8 56.369.7 57.969.6 57.869.8 58.271.4 59.771.1 59.4
72.4 60.671.5 59.874.4 62.475.4 63.476.3 64.276.0 63.874.7 62.574.8 62.575.6 63.474.8 62.674.2 61.675.1 62.7
76.7 64.176.4 63.677.7 64.7
1/ U.S. Department of Commerce, Bureau of the Census and Bureau of Economic Analysis, BOP valuation.*/ In billions of chained (1992) dollars.Note: Details may not add to totals because of rounding.
1994 JanFebMarAprMayJunJutAugSepOctNovDec
1995 JanFebMarAprMayJunJulAugSepOctNovDec
1996 JanFebMar
B.l.a. TABLE 1 May 17, 1996
May 17, 1996TABLE 2
U.S. TRADE IN GOODS AND SERVICES: SUMMARY DETAILS(Millions of dollars, seasonally adjusted)
1995 1995 1996 1996 1996Nov Dec Jan Feb Mar
1995 1995Qtr-1 Qtr-2
1995 1995 1996Qtr-3 Qtr-4 Otr-1-------.-.-----.-.----
TRADE BALANCE (G&S)---------------------
EXPORTS, Total (G&S)ServicesAgriculturalGold (BOP)Nonag Goods ex Gold
Ind Supplies (Ex Ag, Gold)Fuels (coal,petrol,etc)ChemicalsBuilding MaterialsOther Ind Supplies
Capital GoodsAircraft & PartsComputers & AccessSemiconductorsOther Capital Goods
Automotive ProductsTo CanadaTo Mexico (NSA)To Rest of World
Consumer GoodsAll Other Merchandise
------------------------------
IMPORTS, Total (G&S)ServicesPetroleumGold (BOP)Nonpetroleum Goods ex Gold
Ind Supplies (Ex Oil, Gold)ChemicalsIron & Steel Mill ProdBuilding MaterialsOther Ind Supplies
Capital GoodsAircraft & PartsComputers & AccessSemiconductorsOther Capital Goods
Automotive ProductsFrom CanadaFrom Mexico (NSA)From Rest of World
-6,837
67,39317,8705,035
27044,218
10,5921,1573,484
7425,208
20,7702,0173,6783,286
11,789
4,9012,773
5211,608
-6,958 -9,878 -7,037
68,109 66,793 69,35917,711 17,782 18,4055,147 5,407 5,219
230 283 35745,021 43,321 45,377
10,9151,3973,574
7305,214
21,2392,3403,6533,146
12,099
5,3132,992
5611,760
10,6121,3383,442
7375,095
19,9911,7333,8453,202
11,211
5,4012,971
5701,860
10,8371,2613,575
7305,270
21,1722,5133,9102,911
11,839
5,4542,959
6591,836
-8,919
68,80018,9065,264
93843,692
10,5041,1483,492
7255,139
20,9382,4083,6883,133
11,709
4,8362,486
7161,635
-28,897 -33,340 -27,304 -21,960 -25,834
189,393 194,356 197,807 202,154 204,95251,072 51,692 52,757 53,313 55,09313,996 13,380 14,668 15,202 15,8911,407 1,934 846 934 1,578
122,918 127,350 129,536 132,704 132,390
31,3763,33610,3922,28615,363
54,2016,2969,0957,508
31,302
15,7988,9021,8075,089
32,8943,415
10,9672,352
16,160
57,6867,7689,2758,16932,475
14,6267,7881,6365,202
33,2433,204
10,8622,189
16,988
58,7815,891
10,3538,920
33,617
15,1758,0261,6775,472
32,6083,72310,7372,224
15,924
62,3376,223
10,9189,511
35,685
14,9558,4251,7424,788
31,9533,747
10,5092,192
15,505
62,101-6,654
11,4439,246
34,759
15,6908,4151,9445,331
5,444 5,547 5,458 5,843 5,585 15,739 16,096 16,170 16,450 16,8862,511 2,006 1,859 2,072 1,829 5,804 6,048 6,166 6,354 5,760
74,23012,5824,567
26256,819
10,0762,043
9511,0466,037
19,250776
5,0773,7719,626
9,5353,7361,7724,027
75,06712,3634,579
18457,941
9,9992,097921
1,0785,902
19,390779
5,2693,8469,496
10,3173,8921,5804,844
76,67112,5855,114
23658,736
10,2452,235
9531,0116,046
19,232854
5,1623,5229,694
10,7764,1271,9494,699
76,39612,8094,398
29558,894
10,1722,0961,0721,0645,941
19,127895
5,2693,3649,600
10,7574,2051,9164,636
77,71913,0394,4581,160
59,063
10,6072,3671,0181,117
6,104
19,341984
4,9593,6419,758
10,0183,4381,8364,744
218,290 227,696 225,111 224,114 230,78635,515 36,379 36,734 37,150 38,43313,074 14,575 14,047 13,409 13,9701,099 2,702 631 857 1,690
168,602 174,040 173,699 172,698 176,693
30,6346,3273,4223,153
17,732
51,4342,633
12,7367,978
28,086
32,35312,0844,438
15,831
31,8406,5513,4953,119
18,675
54,7902,792
13,2759,29329,430
32,03310,7044,397
16,933
30,7476,3952,9513,19018,210
57,0412,597
14,72710,50829,209
30,77410,9244,53915,312
30,2596,2742,7193,260
18,006
58,3422,649
15,65011,35328,689
29,33611,3675,268
12,700
31,0246,6983,0433,192
18,091
57,7012,732
15,39010,52729,052
31,55111,7705,702
14,080
Consumer Goods 12,900 13,135 13,488 13,763 13,690 39,690 40,693 40,289 39,351 40,940Foods, Feeds, and Beverages 2,718 2,725 2,790 2,795 2,963 8,499 8,156 8,290 8,233 8,547
ALL Other Merchandise 2,340 2,375 2,205 2,280 2,444 5,992 6,528 6,558 7,178 6,929..................................................................................................................
Memo Items, NSA:Oil Imports: Value (SITC) 4,330 4,442 5,044 3,987 4,322 12,321 13,966 13,579 12,902 13,353
Volume (mbd) 9.378 8.866 9.591 8.261 7.822 8.736 8.913 9.460 8.961 8.558Price ($/bbl) 15.39 16.16 16.96 16.64 17.82 15.66 17.22 15.61 15.66 17.13
Source: U.S. Department of Com.erce, monthly press release (FT-900).Source: U.S. Department of Commnerce, monthly press release (FI-900).
B.1.b.
-9-
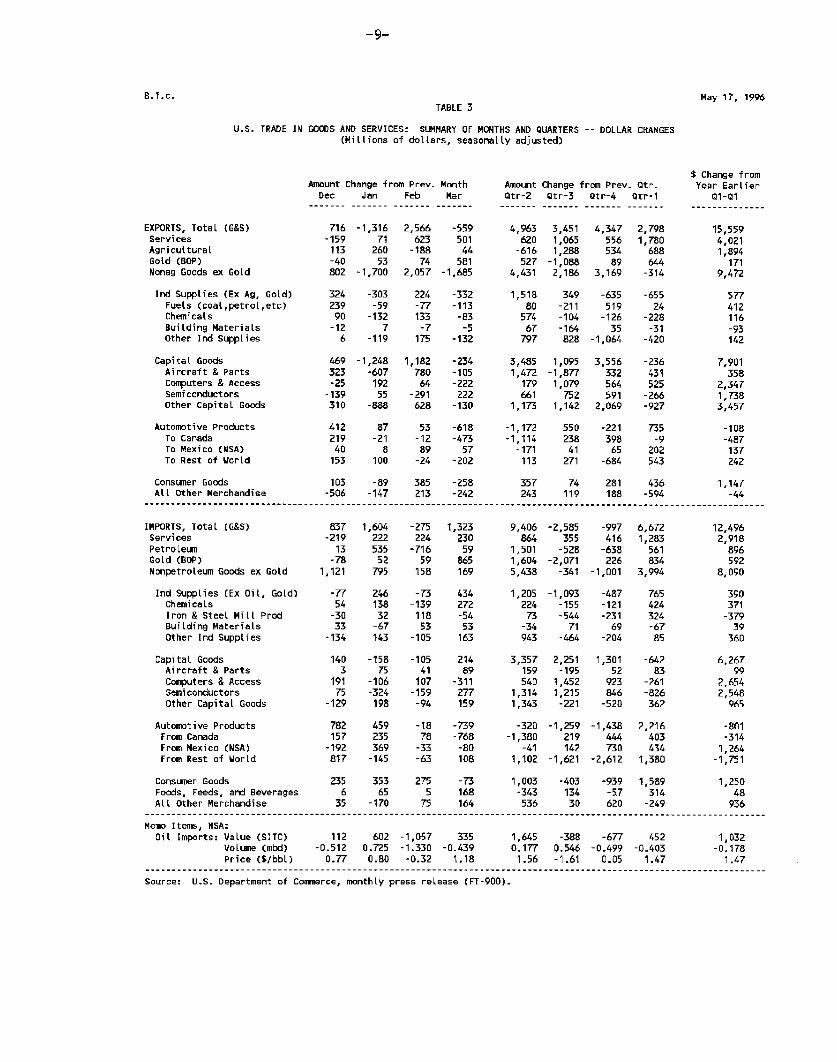
May 17, 1996TABLE 3
U.S. TRADE IN GOODS AND SERVICES: SUMMARY OF MONTHS AND QUARTERS -- DOLLAR CHANGES(Millions of dollars, seasonally adjusted)
$ Change fromAmount Change from Prev. Month Amount Change from Prev. Qtr. Year Earlier
Dec Jan Feb Mar Qtr-2 Qtr-3 Qtr-4 Qtr-1 01-01- - - - - - - -- - - - - - - - - - - - - - - - - - - - - - - - - -.-- - -.-.-- - -- -.-- - - - -.- - .-- - -- - -- .
EXPORTS, Total (G&S)ServicesAgriculturalGold (BOP)Nonag Goods ex Gold
Ind Supplies (Ex Ag, Gold)Fuels (coal,petrol,etc)ChemicalsBuilding MaterialsOther Ind Supplies
Capital GoodsAircraft & PartsComputers & AccessSemiconductorsOther Capital Goods
Automotive ProductsTo CanadaTo Mexico (NSA)To Rest of World
716 -1,316 2,566 -559-159 71 623 501113 260 -188 44-40 53 74 581802 -1,700 2,057 -1,685
324 -303 224 -332239 -59 -77 -11390 -132 133 -83
-12 7 -7 -56 -119 175 -132
469 -1,248 1,182 -234323 -607 780 -105-25 192 64 -222
-139 55 -291 222310 -888 628 -130
412 87 53 -618219 -21 -12 -47340 8 89 57153 100 -24 -202
4,963 3,451 4,347 2,798620 1,065 556 1,780
-616 1,288 534 688527 -1,088 89 644
4,431 2,186 3,169 -314
1,518 349 -635 -65580 -211 519 24
574 -104 -126 -22867 -164 35 -31
797 828 -1,064 -420
3,485 1,095 3,556 -2361,472 -1,877 332 431
179 1,079 564 525661 752 591 -266
1,173 1,142 2,069 -927
-1,172 550 -221 735-1,114 238 398 -9
-171 41 65 202113 271 -684 543
Consumer Goods 103 -89 385 -258 357 74 281 436 1,147All Other Merchandise -506 -147 213 -242 243 119 188 -594 -44
.....................................................................................................................
IMPORTS, Total (G&S)ServicesPetroleumGold (BOP)Nonpetroleum Goods ex Gold
Ind Supplies (Ex Oil, Gold)ChemicalsIron & Steel Mill ProdBuilding MaterialsOther Ind Supplies
Capital GoodsAircraft & PartsComputers & AccessSemiconductorsOther Capital Goods
Automotive ProductsFrom CanadaFrom Mexico (NSA)From Rest of World
837 1,604 -275 1,323-219 222 224 230
13 535 -716 59-78 52 59 865
1,121 795 158 169
-77 246 -73 43454 138 -139 272-30 32 118 -5433 -67 53 53
-134 143 -105 163
140 -158 -105 2143 75 41 89
191 -106 107 -31175 -324 -159 277
-129 198 -94 159
782 459 -18 -739157 235 78 -768
-192 369 -33 -80817 -145 -63 108
9,406 -2,585 -997 6,672864 355 416 1,283
1,501 -528 -638 5611,604 -2,071 226 8345,438 -341 -1,001 3,994
1,205 -1,093 -487 765224 -155 -121 42473 -544 -231 324
-34 71 69 -67943 -464 -204 85
3,357 2,251 1,301 -642159 -195 52 83540 1,452 923 -261
1,314 1,215 846 -8261,343 -221 -520 362
-320 -1,259 -1,438 2,216-1,380 219 444 403
-41 142 730 4341,102 -1,621 -2,612 1,380
Consumer Goods 235 353 275 -73 1,003 -403 -939 1,589 1,250Foods, Feeds, and Beverages 6 65 5 168 -343 134 -5,7 314 48All Other Merchandise 35 -170 75 164 536 30 620 -249 936
Memo Items, NSA:Oil Imports: Value (SITC) 112 602 -1,057 335 1,645 -388 -677 452 1,032
Volume (mbd) -0.512 0.725 -1.330 -0.439 0.177 0.546 -0.499 -0.403 -0.178Price ($/bbl) 0.77 0.80 -0.32 1.18 1.56 -1.61 0.05 1.47 1.47
Source: U.S. Department of Commerce, monthly press release (FT-900).
B.1.c.
15,5594,0211,894
1719,472
577412116-93142
7,901358
2,3471,7383,457
-108-487137242
12,4962,918896592
8,090
390371-37939
360
6,26799
2,6542,548
965
-801-314
1,264-1,751
-10-
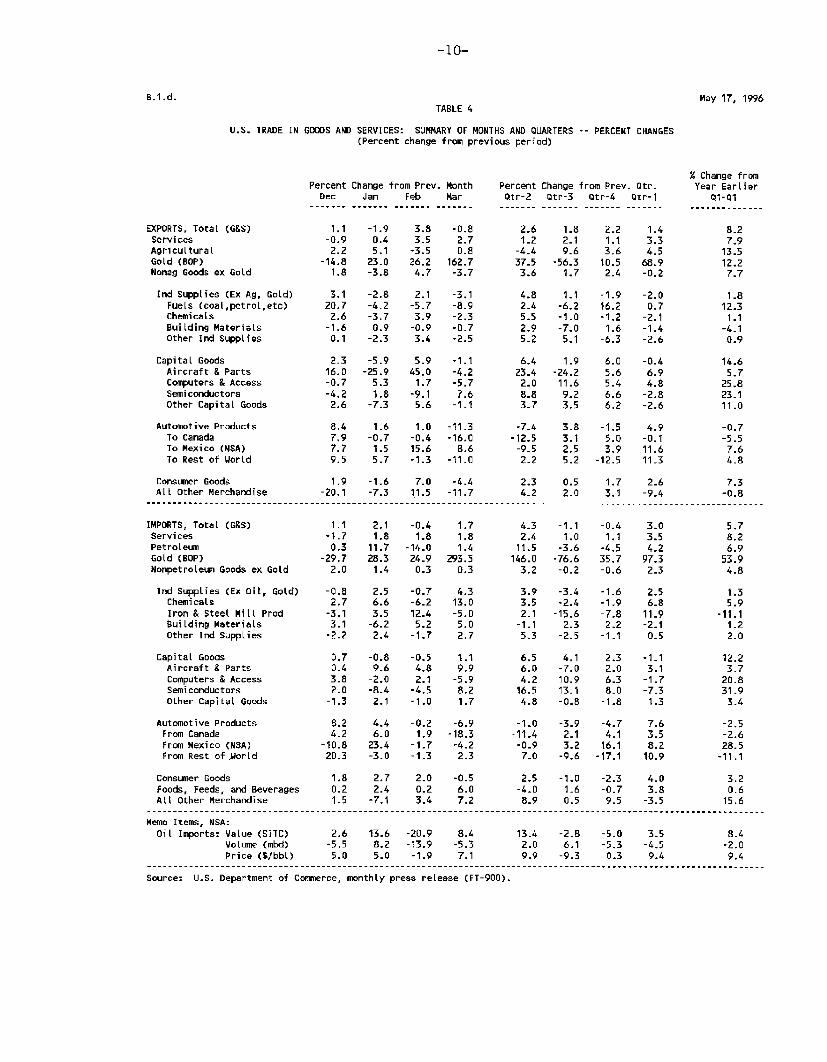
TABLE 4
U.S. TRADE IN GOODS AND SERVICES: SUMMARY OF MONTHS AND QUARTERS -- PERCENT CHANGES(Percent change from previous period)
EXPORTS, Total (G&S)ServicesAgriculturalGold (BOP)Nonag Goods ex Gold
Ind supplies (Ex Ag, Gold)Fuels (coal,petrol,etc)ChemicalsBuilding MaterialsOther Ind Supplies
Capital GoodsAircraft & PartsComputers & AccessSemiconductorsOther Capital Goods
Automotive ProductsTo CanadaTo Mexico (NSA)To Rest of World
Consumer GoodsALl Other Merchandise
IMPORTS, Total (G&S)ServicesPetroleumGold (BOP)Nonpetroleum Goods ex Gold
Ind Supplies (Ex Oil, Gold)ChemicalsIron & Steel Mill ProdBuilding MaterialsOther Ind Supplies
Capital GoodsAircraft & PartsComputers & AccessSemiconductorsOther Capital Goods
Automotive ProductsFrom CanadaFrom Mexico (NSA)From Rest of Wortd
Percent Change from Prev. MonthDec Jan Feb Mar
1.1 -1.9 3.8 -0.8-0.9 0.4 3.5 2.72.2 5.1 -3.5 0.8
-14.8 23.0 26.2 162.71.8 -3.8 4.7 -3.7
3.1 -2.8 2.1 -3.120.7 -4.2 -5.7 -8.92.6 -3.7 3.9 -2.3
-1.6 0.9 -0.9 -0.70.1 -2.3 3.4 -2.5
2.3 -5.9 5.9 -1.116.0 -25.9 45.0 -4.2-0.7 5.3 1.7 -5.7-4.2 1.8 -9.1 7.62.6 -7.3 5.6 -1.1
8.4 1.6 1.0 -11.37.9 -0.7 -0.4 -16.07.7 1.5 15.6 8.69.5 5.7 -1.3 -11.0
1.9 -1.6 7.0 -4.4-20.1 -7.3 11.5 -11.7
1.1 2.1 -0.4 1.7-1.7 1.8 1.8 1.80.3 11.7 -14.0 1.4
-29.7 28.3 24.9 293.52.0 1.4 0.3 0.3
-0.8 2.5 -0.7 4.32.7 6.6 -6.2 13.0
-3.1 3.5 12.4 -5.03.1 -6.2 5.2 5.0-2.2 2.4 -1.7 2.7
0.7 -0.8 -0.5 1.10.4 9.6 4.8 9.93.8 -2.0 2.1 -5.92.0 -8.4 -4.5 8.2-1.3 2.1 -1.0 1.7
8.2 4.4 -0.2 -6.94.2 6.0 1.9 -18.3
-10.8 23.4 -1.7 -4.220.3 -3.0 -1.3 2.3
Percent Change from Prev. Qtr.Qtr-2 Qtr-3 Qtr-4 Qtr-1
2.6 1.8 2.2 1.41.2 2.1 1.1 3.3
-4.4 9.6 3.6 4.537.5 -56.3 10.5 68.93.6 1.7 2.4 -0.2
4.8 1.1 -1.9 -2.02.4 -6.2 16.2 0.75.5 -1.0 -1.2 -2.12.9 -7.0 1.6 -1.45.2 5.1 -6.3 -2.6
6.4 1.923.4 -24.22.0 11.68.8 9.23-7 3.5
6.0 -0.45.6 6.95.4 4.86.6 -2.86.2 -2.6
-7.4 3.8 -1.5 4.9-12.5 3.1 5.0 -0.1-9.5 2.5 3.9 11.62.2 5.2 -12.5 11.3
2.3 0.5 1.7 2.64.2 2.0 3.1 -9.4
4.3 -1.1 -0.4 3.02.4 1.0 1.1 3.511.5 -3.6 -4.5 4.2
146.0 -76.6 35.7 97.33.2 -0.2 -0.6 2.3
3.9 -3.4 -1.6 2.53.5 -2.4 -1.9 6.82.1 -15.6 -7.8 11.9-1.1 2.3 2.2 -2.15.3 -2.5 -1.1 0.5
6.5 4.1 2.3 -1.16.0 -7.0 2.0 3.14.2 10.9 6.3 -1.716.5 13.1 8.0 -7.34.8 -0.8 -1.8 1.3
-1.0 -3.9 -4.7 7.6-11.4 2.1 4.1 3.5-0.9 3.2 16.1 8.27.0 -9.6 -17.1 10.9
Consumer Goods 1.8 2.7 2.0 -0.5 2.5 -1.0 -2.3 4.0 3.2Foods, Feeds, and Beverages 0.2 2.4 0.2 6.0 -4.0 1.6 -0.7 3.8 0.6All Other Merchandise 1.5 -7.1 3.4 7.2 8.9 0.5 9.5 -3.5 15.6
.....................................................................................................................
Memo Items, NSA:Oil Imports: Value (SITC) 2.6 13.6 -20.9 8.4 13.4 -2.8 -5.0 3.5 8.4
Volume (mbd) -5.5 8.2 -13.9 -5.3 2.0 6.1 -5.3 -4.5 -2.0Price (S/bbl) 5.0 5.0 -1.9 7.1 9.9 -9.3 0.3 9.4 9.4
Source: U.S. Department of Commerce, monthly press release (FT-900).Source: U.S. Department of Commerce, monthly press release (FT-900).
B.1.d. May 17, 1996
% Change fromYear Earlier
01-01
-0.7-5.57.64.8
7.3-0.8
5.78.26.9
53.94.8
1.35.9
-11.11.22.0
12.23.7
20.831.93.4
-2.5-2.628.5
-11.1