Embed Size (px)
Citation preview
Prefatory Note
The attached document represents the most complete and accurate version available based on original copies culled from the files of the FOMC Secretariat at the Board of Governors of the Federal Reserve System. This electronic document was created through a comprehensive digitization process which included identifying the best-preserved paper copies, scanning those copies,1 and then making the scanned versions text-searchable.2 Though a stringent quality assurance process was employed, some imperfections may remain.
Please note that this document may contain occasional gaps in the text. These gaps are the result of a redaction process that removed information obtained on a confidential basis. All redacted passages are exempt from disclosure under applicable provisions of the Freedom of Information Act.
1 In some cases, original copies needed to be photocopied before being scanned into electronic format. All scanned images were deskewed (to remove the effects of printer- and scanner-introduced tilting) and lightly cleaned (to remove dark spots caused by staple holes, hole punches, and other blemishes caused after initial printing). 2 A two-step process was used. An advanced optimal character recognition computer program (OCR) first created electronic text from the document image. Where the OCR results were inconclusive, staff checked and corrected the text as necessary. Please note that the numbers and text in charts and tables were not reliably recognized by the OCR process and were not checked or corrected by staff.
STRICTLY CONFIDENTIAL (FR) CLASS II FOMC
OCTOBER 31, 2002
MONETARY POLICY ALTERNATIVES
PREPARED FOR THE FEDERAL OPEN MARKET COMMITTEE
BY THE STAFF OF THE BOARD OF GOVERNORS OF THE FEDERAL RESERVE SYSTEM
1 The federal funds rate averaged close to 1-3/4 percent over the intermeeting period. Withcurrency growth quite low relative to historical trends, the Desk made no outright purchases duringthe period. Other market factors generally added reserves, and the Desk responded by reducing theoutstanding volume of long-term System RPs from $11 billion to $6 billion.
Strictly Confidential (F.R.) October 31, 2002Class II – FOMC
MONETARY POLICY ALTERNATIVES
Recent Developments
(1) Market participants had expected the FOMC to keep both the intended
federal funds rate unchanged and the risk assessment tilted toward economic
weakness at the September 24th meeting. But the inclusion of concerns about
“heightened geopolitical risks” in the announcement and the indication of two
dissenting votes favoring an easing of monetary policy led markets to expect a lower
trajectory for the policy rate. A subsequent rally in equity prices tended to buoy
market interest rates and policy expectations. In recent days, however, generally
weaker-than-anticipated economic data and press reports suggesting that the FOMC
was inclined to ease by year-end left the expected path of policy lower on net over the
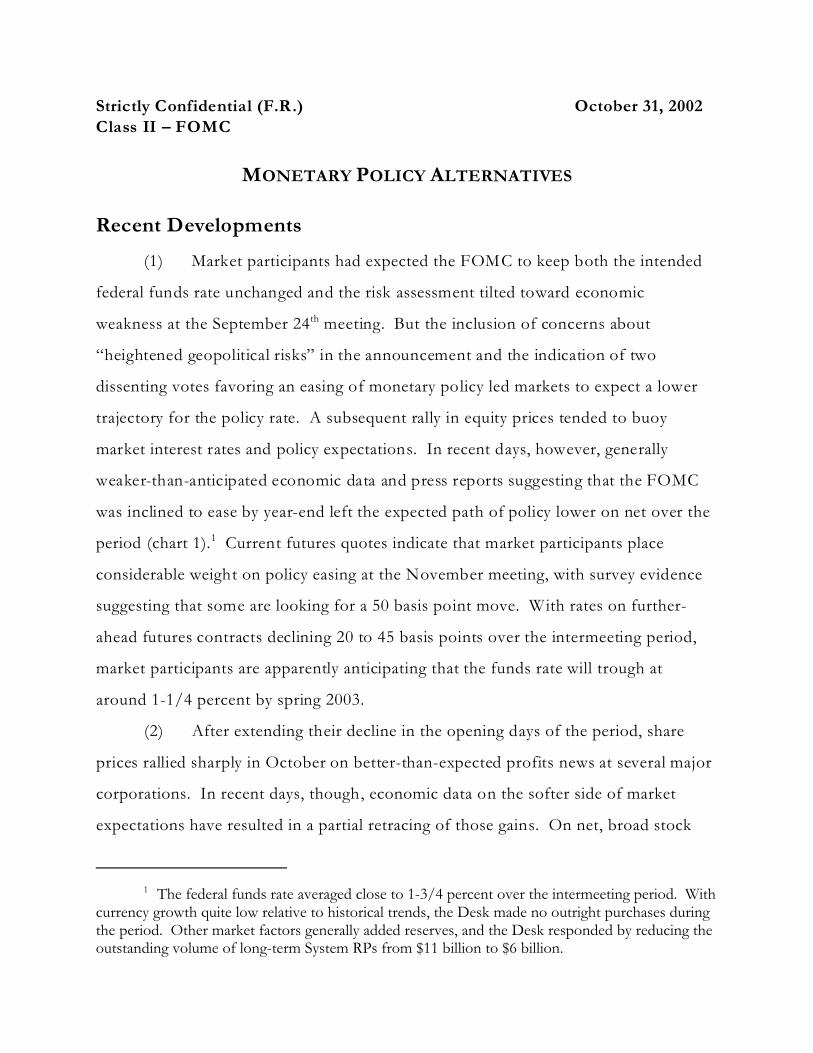
period (chart 1).1 Current futures quotes indicate that market participants place
considerable weight on policy easing at the November meeting, with survey evidence
suggesting that some are looking for a 50 basis point move. With rates on further-
ahead futures contracts declining 20 to 45 basis points over the intermeeting period,
market participants are apparently anticipating that the funds rate will trough at
around 1-1/4 percent by spring 2003.
(2) After extending their decline in the opening days of the period, share
prices rallied sharply in October on better-than-expected profits news at several major
corporations. In recent days, though, economic data on the softer side of market
expectations have resulted in a partial retracing of those gains. On net, broad stock
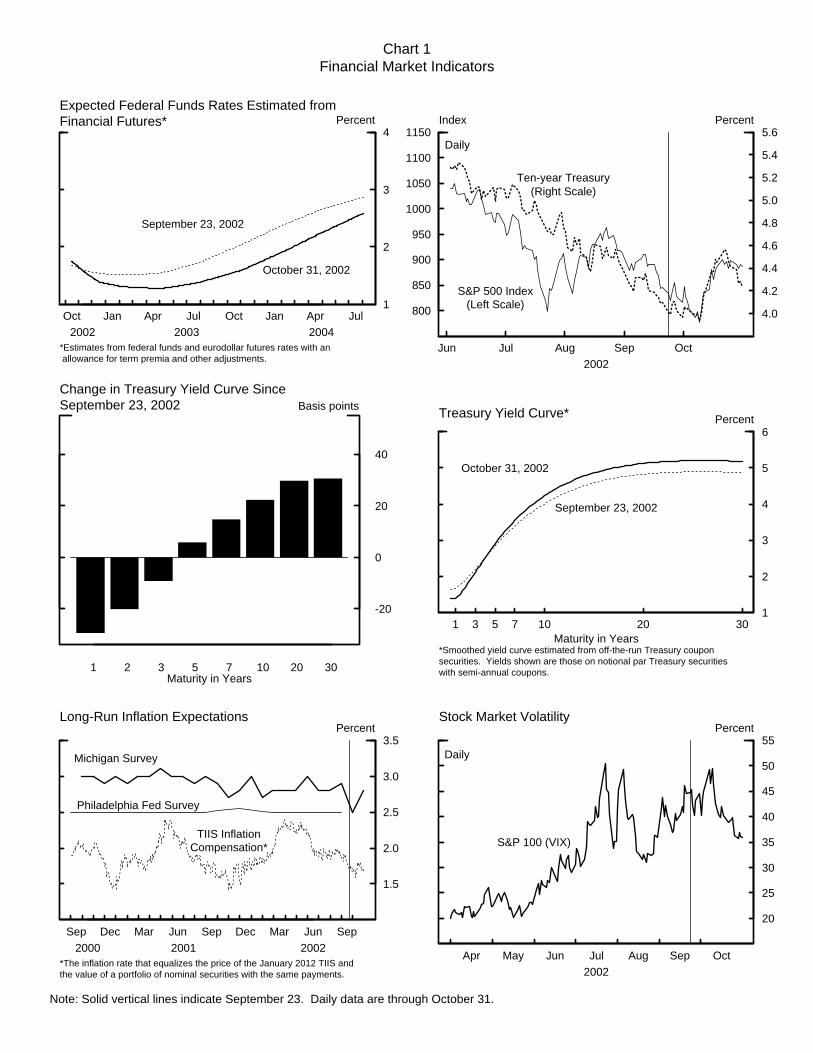
Chart 1Financial Market Indicators
Note: Solid vertical lines indicate September 23. Daily data are through October 31.
800
850
900
950
1000
1050
1100
1150
Jun Jul Aug Sep Oct2002
4.0
4.2
4.4
4.6
4.8
5.0
5.2
5.4
5.6Index Percent
S&P 500 Index(Left Scale)
Ten-year Treasury(Right Scale)
Daily
Oct Jan Apr Jul Oct Jan Apr Jul2002 2003 2004
1
2
3
4Percent
September 23, 2002
October 31, 2002
Expected Federal Funds Rates Estimated fromFinancial Futures*
*Estimates from federal funds and eurodollar futures rates with an allowance for term premia and other adjustments.
1 3 5 7 10 20 301
2
3
4
5
6 Percent
September 23, 2002
October 31, 2002
Treasury Yield Curve*
Maturity in Years*Smoothed yield curve estimated from off-the-run Treasury couponsecurities. Yields shown are those on notional par Treasury securitieswith semi-annual coupons.
Apr May Jun Jul Aug Sep Oct2002
20
25
30
35
40
45
50
55Percent
S&P 100 (VIX)
Stock Market Volatility
Daily
1 2 3 5 7 10 20 30
-20
0
20
40
Basis pointsChange in Treasury Yield Curve SinceSeptember 23, 2002
Maturity in Years
Sep Dec Mar Jun Sep Dec Mar Jun Sep2000 2001 2002
1.5
2.0
2.5
3.0
3.5Percent
Long-Run Inflation Expectations
Michigan Survey
Philadelphia Fed Survey
TIIS InflationCompensation*
*The inflation rate that equalizes the price of the January 2012 TIIS andthe value of a portfolio of nominal securities with the same payments.
2
price indexes increased about 6 percent over the period, while the tech-heavy Nasdaq
rose about 12 percent. Equity prices were quite volatile over the period and, judging
from options on stock futures contracts, are expected to remain so. As has been true
for a while, longer-term Treasury yields generally moved in tandem with equity prices.
On balance over the intermeeting period, intermediate- and longer-term yields
increased 5 to 30 basis points, with the swing in ten-year Treasury yields reportedly
magnified by the efforts of holders of mortgage securities to manage the duration of
their portfolios. Reflecting the heightened expectation of policy ease, though, yields
on Treasuries with maturities of two years or less fell on net.
(3) In the investment-grade corporate debt market, yields on higher-quality
bonds increased about as much as those on Treasuries over the intermeeting period
(chart 2). Risk spreads on lower-quality investment-grade debt climbed 15 basis
points, as auto manufacturers and their captive finance companies in that index
underperformed, and spreads on broad high-yield debt indexes rose about 30 basis
points, suggesting further deterioration in perceived creditworthiness. These elevated
spreads may also reflect a lack of liquidity in corporate markets, as bid-asked spreads
reportedly remained wide throughout the intermeeting period. (The box on the next
page examines market liquidity.)
(4) The dollar moved within narrow ranges against the major foreign
currencies during the intermeeting period, and its trade-weighted value edged lower.
Most foreign stock indexes and government bond yields followed the pattern seen in
U.S. markets, ending the period higher on net. European ten-year benchmark bond
yields rose 20 to 25 basis points over the intermeeting period despite economic data
pointing to lackluster growth, especially in Germany. Yields may have been
influenced by concerns over widening fiscal deficits in some key European
countries–including Germany and France–and the reopening of the debate over the
Chart 2Financial Market Indicators
Note: Solid vertical lines indicate September 23. Data are through October 31, except as noted.
Jan Feb Mar May Jun Aug Sep2002
200
300
400
500
600Basis points
Ten-year Corporate Yields less Ten-year Treasury
BBB
Ford
GM
Daily
Sep Dec Mar Jun Sep Dec Mar Jun Sep2000 2001 2002
50
100
150
200
250
300
350Basis points
Ten-year AA
Ten-year BBB
Ten-year Swap
Spreads of Selected Private Long-Term Yields
Daily
Note. Spreads measured over ten-year Treasury.
Sep Dec Mar Jun Sep Dec Mar Jun Sep2000 2001 2002
100
102
104
106
108
110
112
114Index(8/31/00 = 100)
Broad Index
MajorCurrencies Index
Other ImportantTrading Partners
Daily
Nominal Trade-Weighted DollarExchange Rates
Sep Dec Mar Jun Sep Dec Mar Jun Sep2000 2001 2002
1000
1500
2000
2500
3000Index
Overall
Brazil
Daily
EMBI+ Index
Note. Last observation for Brazil is October 30.
3
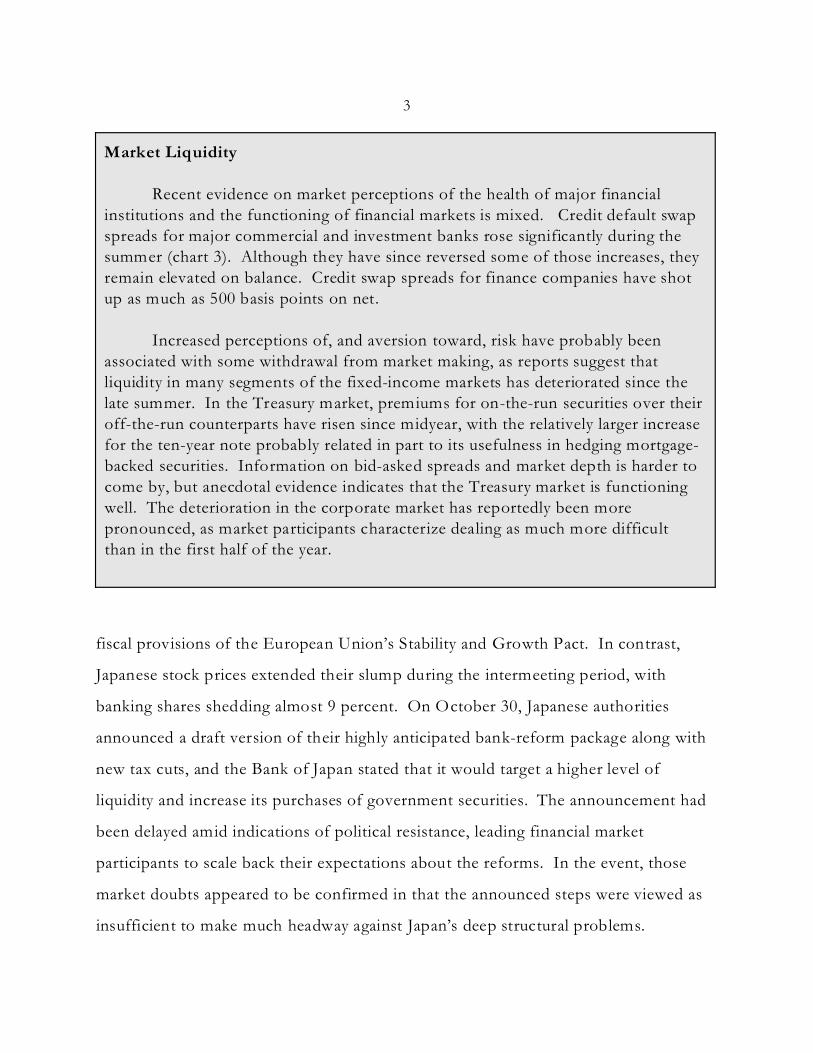
Market Liquidity
Recent evidence on market perceptions of the health of major financialinstitutions and the functioning of financial markets is mixed. Credit default swapspreads for major commercial and investment banks rose significantly during thesummer (chart 3). Although they have since reversed some of those increases, theyremain elevated on balance. Credit swap spreads for finance companies have shotup as much as 500 basis points on net.
Increased perceptions of, and aversion toward, risk have probably beenassociated with some withdrawal from market making, as reports suggest thatliquidity in many segments of the fixed-income markets has deteriorated since thelate summer. In the Treasury market, premiums for on-the-run securities over theiroff-the-run counterparts have risen since midyear, with the relatively larger increasefor the ten-year note probably related in part to its usefulness in hedging mortgage-backed securities. Information on bid-asked spreads and market depth is harder tocome by, but anecdotal evidence indicates that the Treasury market is functioningwell. The deterioration in the corporate market has reportedly been morepronounced, as market participants characterize dealing as much more difficultthan in the first half of the year.
fiscal provisions of the European Union’s Stability and Growth Pact. In contrast,
Japanese stock prices extended their slump during the intermeeting period, with
banking shares shedding almost 9 percent. On October 30, Japanese authorities
announced a draft version of their highly anticipated bank-reform package along with
new tax cuts, and the Bank of Japan stated that it would target a higher level of
liquidity and increase its purchases of government securities. The announcement had
been delayed amid indications of political resistance, leading financial market
participants to scale back their expectations about the reforms. In the event, those
market doubts appeared to be confirmed in that the announced steps were viewed as
insufficient to make much headway against Japan’s deep structural problems.
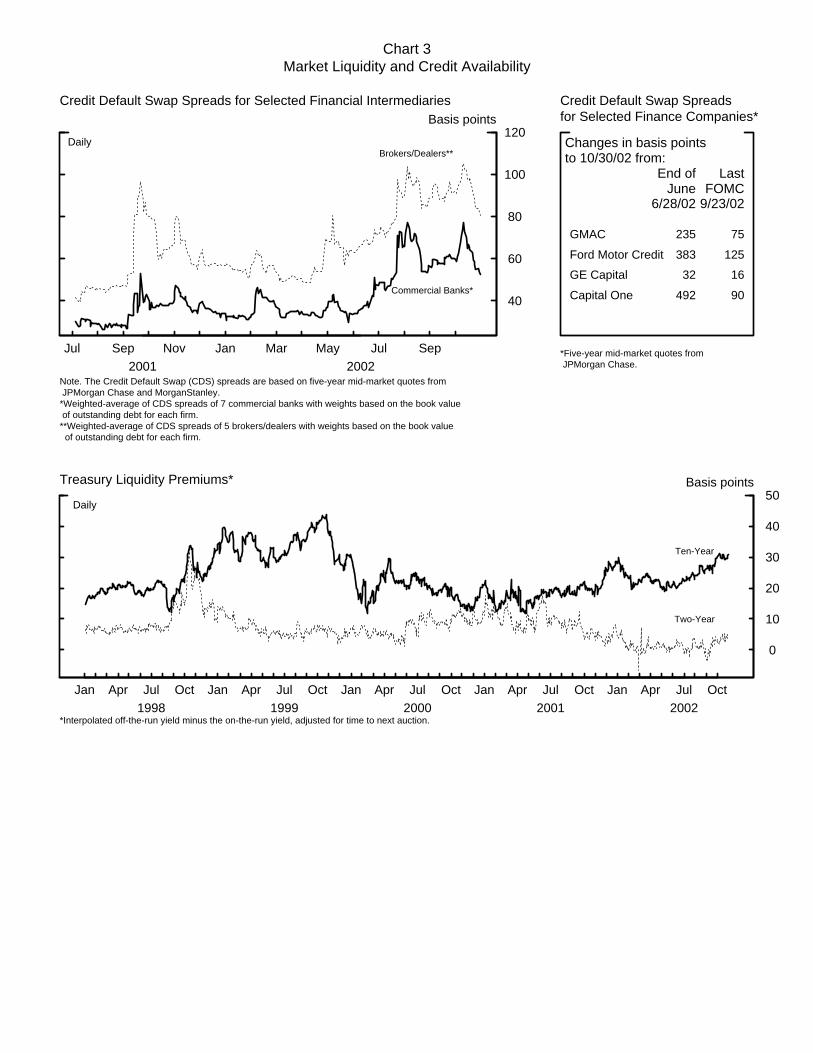
Chart 3Market Liquidity and Credit Availability
Jan Apr Jul Oct Jan Apr Jul Oct Jan Apr Jul Oct Jan Apr Jul Oct Jan Apr Jul Oct1998 1999 2000 2001 2002
0
10
20
30
40
50Basis points
Ten-Year
Two-Year
Treasury Liquidity Premiums*
Daily
*Interpolated off-the-run yield minus the on-the-run yield, adjusted for time to next auction.
Jul Sep Nov Jan Mar May Jul Sep2001 2002
40
60
80
100
120Basis points
Commercial Banks*
Brokers/Dealers**
Credit Default Swap Spreads for Selected Financial Intermediaries
Daily
Note. The Credit Default Swap (CDS) spreads are based on five-year mid-market quotes from JPMorgan Chase and MorganStanley.*Weighted-average of CDS spreads of 7 commercial banks with weights based on the book value of outstanding debt for each firm.**Weighted-average of CDS spreads of 5 brokers/dealers with weights based on the book value of outstanding debt for each firm.
GMAC
Ford Motor Credit
GE Capital
Capital One
End ofJune
6/28/02
LastFOMC
9/23/02
75
125
16
90
235
383
32
492
Changes in basis pointsto 10/30/02 from:
Credit Default Swap Spreadsfor Selected Finance Companies*
*Five-year mid-market quotes from JPMorgan Chase.
4
. The Desk did not intervene during the period for the
accounts of the System or Treasury.
(5) Against currencies of other important trading partners, the dollar was
about unchanged. In Brazil, financial market pressures that had built up ahead of the
first round of voting on October 6 eased somewhat on perceptions that the Worker’s
Party candidate Lula (who clinched victory in the second round vote on October 27)
might be more sympathetic to business interests and more fiscally responsible than
previously thought. Although the Brazilian real depreciated 1-1/2 percent against the
dollar over the period, Brazil’s EMBI+ spread over Treasuries narrowed about
3-1/2 percentage points (although it is still high at 18-1/2 percentage points), and its
major stock price index gained 9-1/2 percent. The Mexican peso appreciated 2
percent against the dollar, while Mexico’s EMBI+ spread narrowed 60 basis points, to
about 385 basis points. In emerging Asia, the rebound in technology share prices
helped Taiwan’s stock market gain 6 percent. Korean stock prices also participated in
the mid-October technology-driven recovery, but still moved down for the period as a
whole.
(6) The weakness in borrowing of nonfinancial businesses that became
notable during the summer intensified in recent months. Business loans, which had
leveled off in August, have been declining since then, and commercial paper
paydowns have continued (chart 4). Corporate bonds outstanding, which had been
running off over the summer, have only stabilized in recent months. The paucity of
borrowing appears mainly to reflect very limited needs to finance investment that
were met mainly by depleting stocks of liquid assets and tapping internally generated
funds. Indeed, the majority of bank respondents to the October Senior Loan Officer
survey reported that C&I loan demand had declined further over the previous three
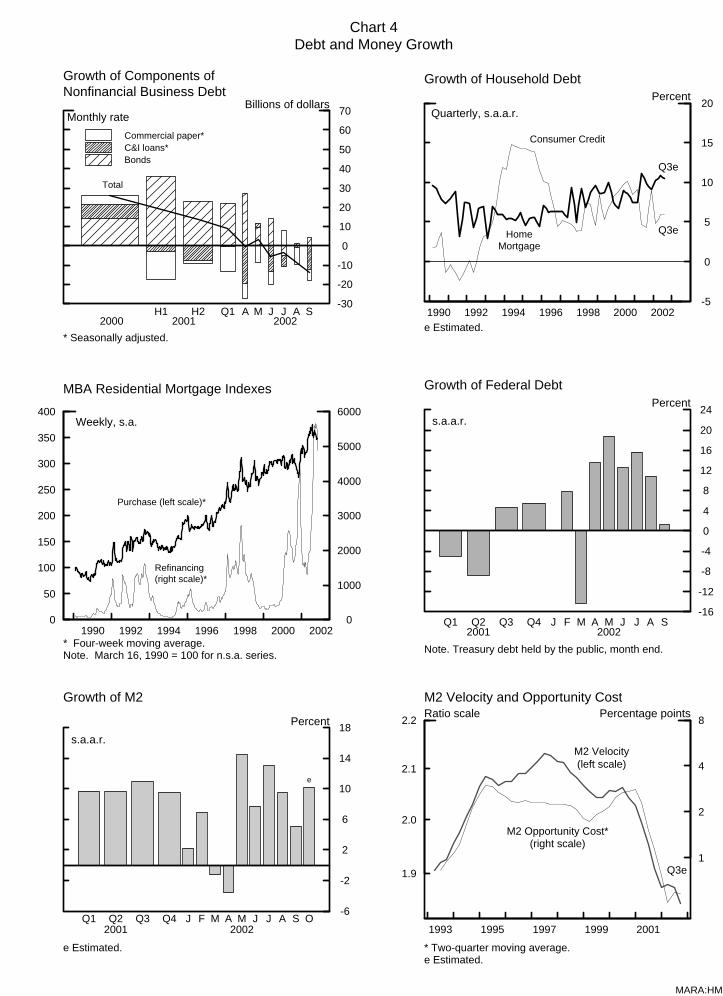
Chart 4 Debt and Money Growth
MARA:HM
1990 1992 1994 1996 1998 2000 2002 -5
0
5
10
15
20
Consumer Credit
HomeMortgage
Growth of Household DebtPercent
Quarterly, s.a.a.r.
e Estimated.
Q3e
Q3e
-30
-20
-10
0
10
20
30
40
50
60
70
Commercial paper*C&I loans*Bonds
Growth of Components ofNonfinancial Business Debt
Billions of dollars
Total
2000 2001 2002H1 H2 Q1 A M J J A S
Monthly rate
* Seasonally adjusted.
0
50
100
150
200
250
300
350
400
1990 1992 1994 1996 1998 2000 2002 0
1000
2000
3000
4000
5000
6000
Purchase (left scale)*
Refinancing(right scale)*
MBA Residential Mortgage Indexes
Weekly, s.a.
* Four-week moving average.Note. March 16, 1990 = 100 for n.s.a. series.
-16
-12
-8
-4
0
4
8
12
16
20
24
Growth of Federal Debt
s.a.a.r.
Percent
Q1 Q2 Q3 Q4 J F M A M J J A S2001 2002
Note. Treasury debt held by the public, month end.
-6
-2
2
6
10
14
18
Growth of M2
s.a.a.r.
Percent
e
e Estimated.
Q1 Q2 Q3 Q4 J F M A M J J A S O2001 2002
1.9
2.0
2.1
2.2
1993 1995 1997 1999 2001
1
2
4
8
M2 Opportunity Cost*(right scale)
M2 Velocity(left scale)
M2 Velocity and Opportunity CostRatio scale Percentage points
* Two-quarter moving average.e Estimated.
Q3e
5
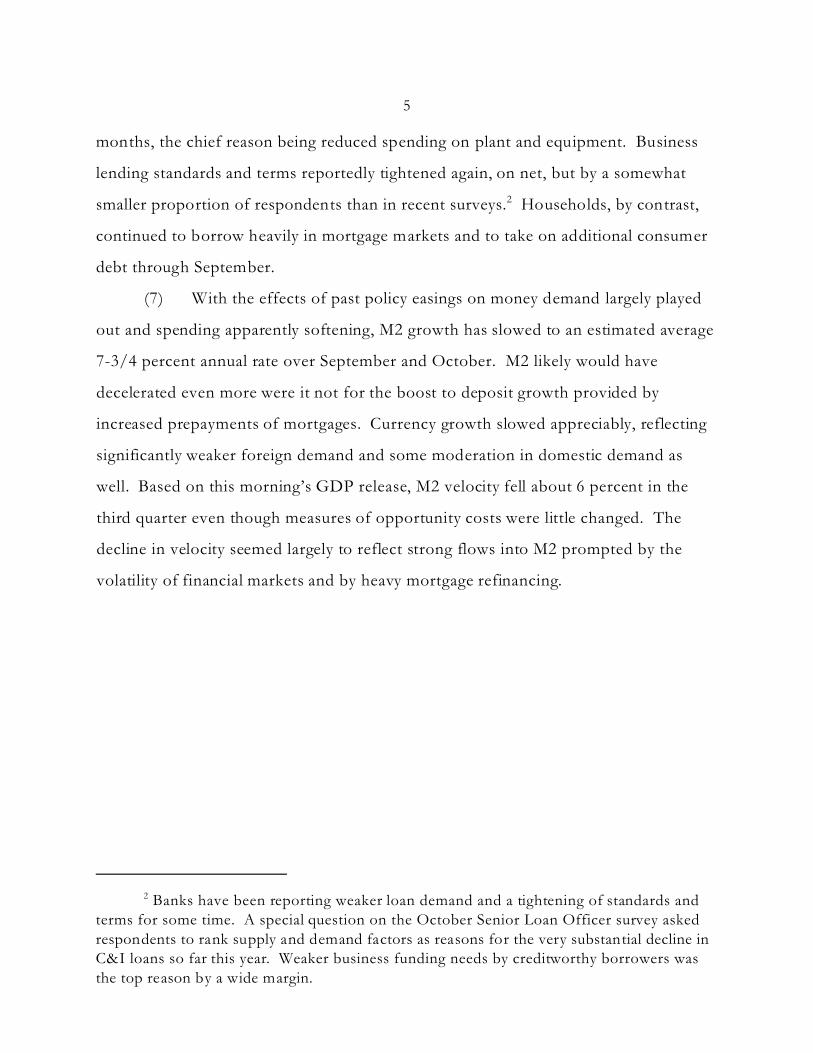
2 Banks have been reporting weaker loan demand and a tightening of standards andterms for some time. A special question on the October Senior Loan Officer survey askedrespondents to rank supply and demand factors as reasons for the very substantial decline inC&I loans so far this year. Weaker business funding needs by creditworthy borrowers wasthe top reason by a wide margin.
months, the chief reason being reduced spending on plant and equipment. Business
lending standards and terms reportedly tightened again, on net, but by a somewhat
smaller proportion of respondents than in recent surveys.2 Households, by contrast,
continued to borrow heavily in mortgage markets and to take on additional consumer
debt through September.
(7) With the effects of past policy easings on money demand largely played
out and spending apparently softening, M2 growth has slowed to an estimated average
7-3/4 percent annual rate over September and October. M2 likely would have
decelerated even more were it not for the boost to deposit growth provided by
increased prepayments of mortgages. Currency growth slowed appreciably, reflecting
significantly weaker foreign demand and some moderation in domestic demand as
well. Based on this morning’s GDP release, M2 velocity fell about 6 percent in the
third quarter even though measures of opportunity costs were little changed. The
decline in velocity seemed largely to reflect strong flows into M2 prompted by the
volatility of financial markets and by heavy mortgage refinancing.
6
Policy Alternatives
(8) Over the intermeeting period, incoming data provided further
disappointments on production and employment and, on the whole, seemed to
suggest some flagging in the growth of consumption when compared with the
September Greenbook. Accordingly, the staff has revised down its forecast for real
output growth over the next few quarters, but not to the point where continued
economic expansion seems to be in serious doubt. Real GDP growth, after running
at a projected rate of only 1 percent in the current quarter, is expected to strengthen
gradually over most of the forecast period, although it remains below that of potential
growth until the second half of next year. As a result, the civilian unemployment rate
is expected to move up to 6-1/4 percent early next year before edging lower after
mid-2003. With economic slack persisting, core inflation is projected to drift lower,
bringing the annual rise in core PCE prices down to about 1-1/4 percent in 2003 and
2004. This forecast assumes that the Committee keeps policy steady, as opposed to
the modest tightening built in toward the end of the forecast period in the September
Greenbook. An unchanged funds rate is assumed to hold yields on long-term
Treasury securities near current levels, while rates on corporate issues should in time
decline somewhat as a gradual strengthening of the economic expansion results in
some unwinding of credit concerns. Equity prices rise moderately over the forecast
period to keep risk-adjusted returns in line with those on fixed-income securities. The
foreign exchange value of the dollar is assumed to decline a little, albeit from a current
level that is slightly higher than projected in the last Greenbook.
(9) Should the Committee believe that the business climate is still likely to
improve gradually at the current stance of policy, as conveyed by its announcement
after the September meeting, it might choose to leave the federal funds rate
unchanged at this meeting. Such an outcome may be seen as broadly consistent with
7
3 The jagged movements in the real federal funds rate in the chart owe to swings inthe proxy for inflation expectations–the backward-looking four-quarter growth rate of corePCE prices. Core PCE prices were reduced significantly in the third quarter of 2001 by theimputed payment by insurers of claims related to the destruction of the World Trade Center. Over time, as that observation enters and exits the calculation of the four-quarter growthrate, PCE inflation and the associated real rate bounce around.
the Greenbook forecast, in which output growth slowly builds momentum. The
Committee may be particularly drawn to this policy approach if it views the current
degree of slack in resource use to be less pronounced than does the staff and hence
sees less scope for further disinflation than is embodied in the staff forecast. In
addition, while estimates of the equilibrium real short-term interest rate have moved
lower over the past year–and some have been revised down ex post–the actual real
rate has been below the lower bound of the range of estimates since mid-2001. Even
with the narrowing in that gap projected for the current quarter, the Committee may
be of the view that sufficient monetary stimulus is already in the pipeline given the
lags in the transmission of policy (chart 5).3 Indeed, the Committee may believe that
the Greenbook forecast, which is somewhat below the consensus outlook, is overly
pessimistic regarding prospects for aggregate demand. As noted in the box on page 8,
while the staff projection for the next two years shows lower inflation and a higher
unemployment rate than in the prior few Greenbooks, the recent realizations of those
variables have moved the other way. In the current quarter, higher energy prices have
boosted inflation and gains in estimates of household employment have been
associated with a lower unemployment rate than was thought likely a couple of
months ago. The Committee might be inclined to keep policy on hold if it put more
weight on those outcomes than on forecast revisions.
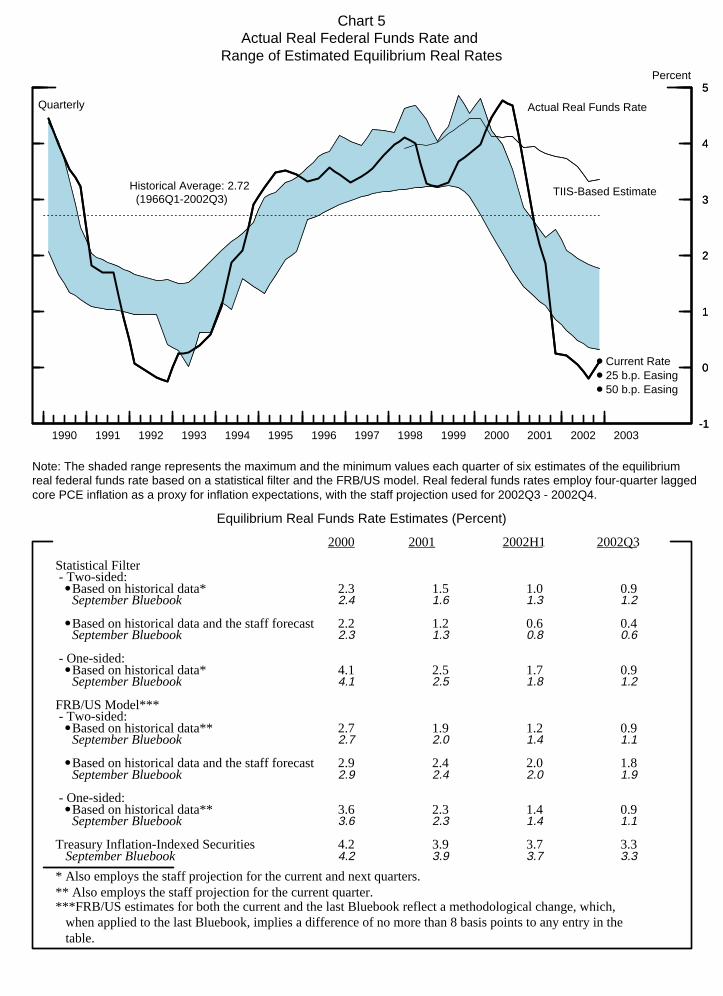
Chart 5Actual Real Federal Funds Rate and
Range of Estimated Equilibrium Real Rates
1990 1991 1992 1993 1994 1995 1996 1997 1998 1999 2000 2001 2002 2003-1
0
1
2
3
4
5Percent
Note: The shaded range represents the maximum and the minimum values each quarter of six estimates of the equilibrium real federal funds rate based on a statistical filter and the FRB/US model. Real federal funds rates employ four-quarter laggedcore PCE inflation as a proxy for inflation expectations, with the staff projection used for 2002Q3 - 2002Q4.
Quarterly
-1
0
1
2
3
4
5
Actual Real Funds Rate
TIIS-Based EstimateHistorical Average: 2.72 (1966Q1-2002Q3)
●
●
●
Current Rate25 b.p. Easing50 b.p. Easing
Equilibrium Real Funds Rate Estimates (Percent)
●
●
●
●
●
●
2000 2001 2002H1 2002Q3 ____ ____ ______ ______
September Bluebook
September Bluebook
September Bluebook
September Bluebook
September Bluebook
September Bluebook
September Bluebook
Statistical Filter - Two-sided: Based on historical data*
Based on historical data and the staff forecast
- One-sided: Based on historical data*
FRB/US Model*** - Two-sided: Based on historical data**
Based on historical data and the staff forecast
- One-sided: Based on historical data**
Treasury Inflation-Indexed Securities
2.4
2.3
4.1
2.7
2.9
3.6
4.2
2.3
2.2
4.1
2.7
2.9
3.6
4.2
1.6
1.3
2.5
2.0
2.4
2.3
3.9
1.5
1.2
2.5
1.9
2.4
2.3
3.9
1.3
0.8
1.8
1.4
2.0
1.4
3.7
1.0
0.6
1.7
1.2
2.0
1.4
3.7
1.2
0.6
1.2
1.1
1.9
1.1
3.3
0.9
0.4
0.9
0.9
1.8
0.9
3.3
* Also employs the staff projection for the current and next quarters.** Also employs the staff projection for the current quarter.***FRB/US estimates for both the current and the last Bluebook reflect a methodological change, which, when applied to the last Bluebook, implies a difference of no more than 8 basis points to any entry in the table.
8
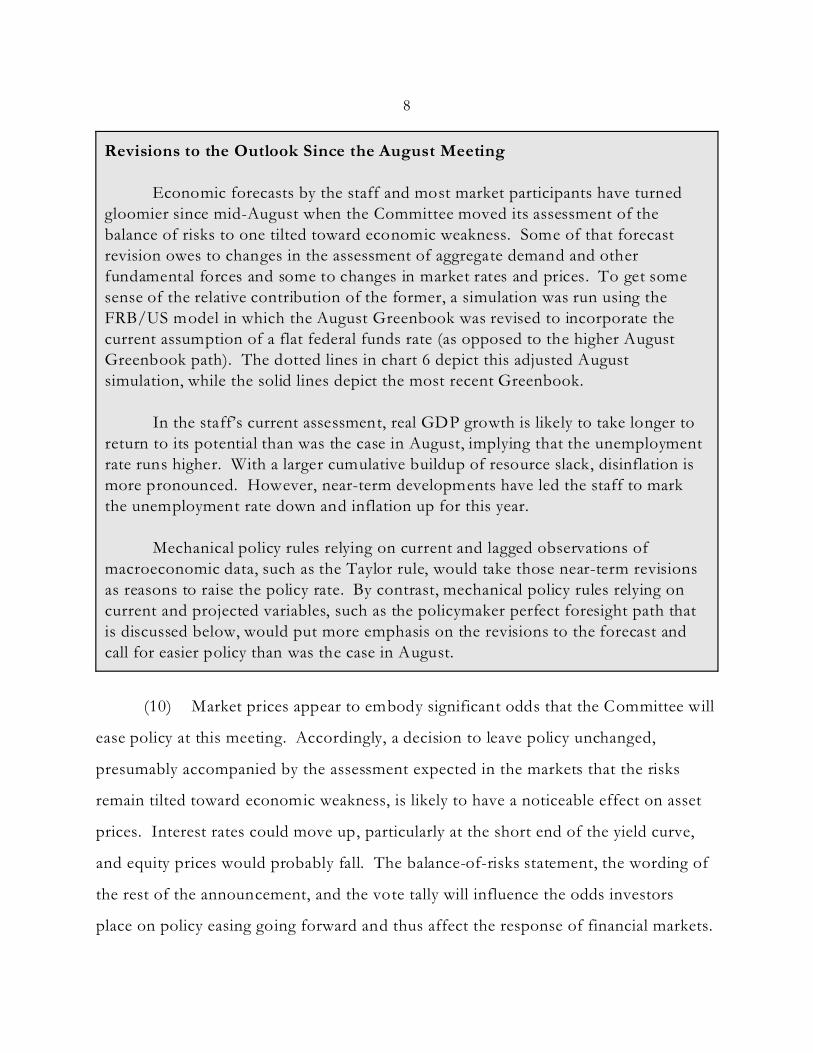
Revisions to the Outlook Since the August Meeting
Economic forecasts by the staff and most market participants have turnedgloomier since mid-August when the Committee moved its assessment of thebalance of risks to one tilted toward economic weakness. Some of that forecastrevision owes to changes in the assessment of aggregate demand and otherfundamental forces and some to changes in market rates and prices. To get somesense of the relative contribution of the former, a simulation was run using theFRB/US model in which the August Greenbook was revised to incorporate thecurrent assumption of a flat federal funds rate (as opposed to the higher AugustGreenbook path). The dotted lines in chart 6 depict this adjusted Augustsimulation, while the solid lines depict the most recent Greenbook.
In the staff’s current assessment, real GDP growth is likely to take longer toreturn to its potential than was the case in August, implying that the unemploymentrate runs higher. With a larger cumulative buildup of resource slack, disinflation ismore pronounced. However, near-term developments have led the staff to markthe unemployment rate down and inflation up for this year.
Mechanical policy rules relying on current and lagged observations ofmacroeconomic data, such as the Taylor rule, would take those near-term revisionsas reasons to raise the policy rate. By contrast, mechanical policy rules relying oncurrent and projected variables, such as the policymaker perfect foresight path thatis discussed below, would put more emphasis on the revisions to the forecast andcall for easier policy than was the case in August.
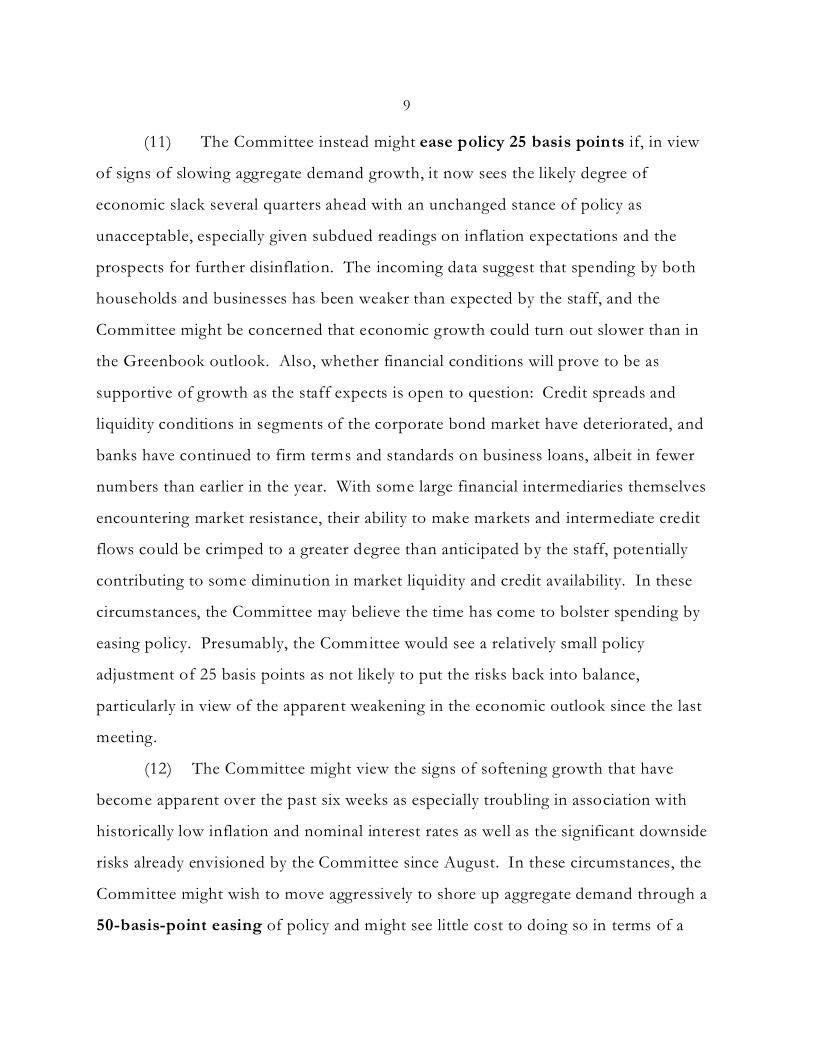
(10) Market prices appear to embody significant odds that the Committee will
ease policy at this meeting. Accordingly, a decision to leave policy unchanged,
presumably accompanied by the assessment expected in the markets that the risks
remain tilted toward economic weakness, is likely to have a noticeable effect on asset
prices. Interest rates could move up, particularly at the short end of the yield curve,
and equity prices would probably fall. The balance-of-risks statement, the wording of
the rest of the announcement, and the vote tally will influence the odds investors
place on policy easing going forward and thus affect the response of financial markets.
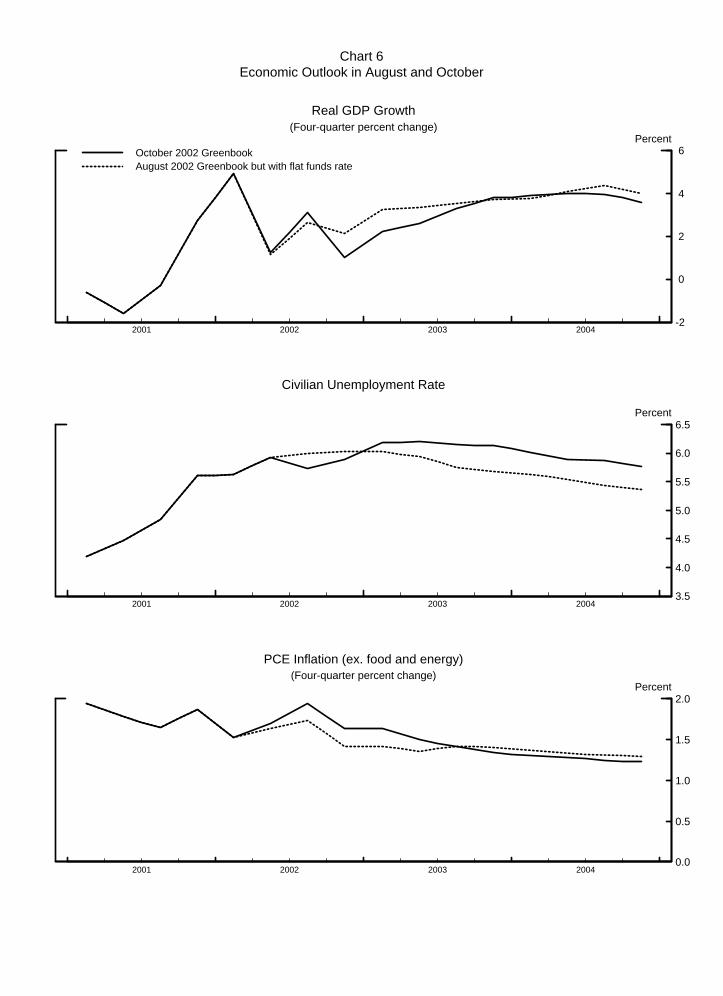
Chart 6Economic Outlook in August and October
2001 2002 2003 2004-2
0
2
4
6
Real GDP Growth(Four-quarter percent change)
PercentOctober 2002 GreenbookAugust 2002 Greenbook but with flat funds rate
2001 2002 2003 20040.0
0.5
1.0
1.5
2.0
PCE Inflation (ex. food and energy)(Four-quarter percent change)
Percent
2001 2002 2003 20043.5
4.0
4.5
5.0
5.5
6.0
6.5
Civilian Unemployment Rate
Percent
9
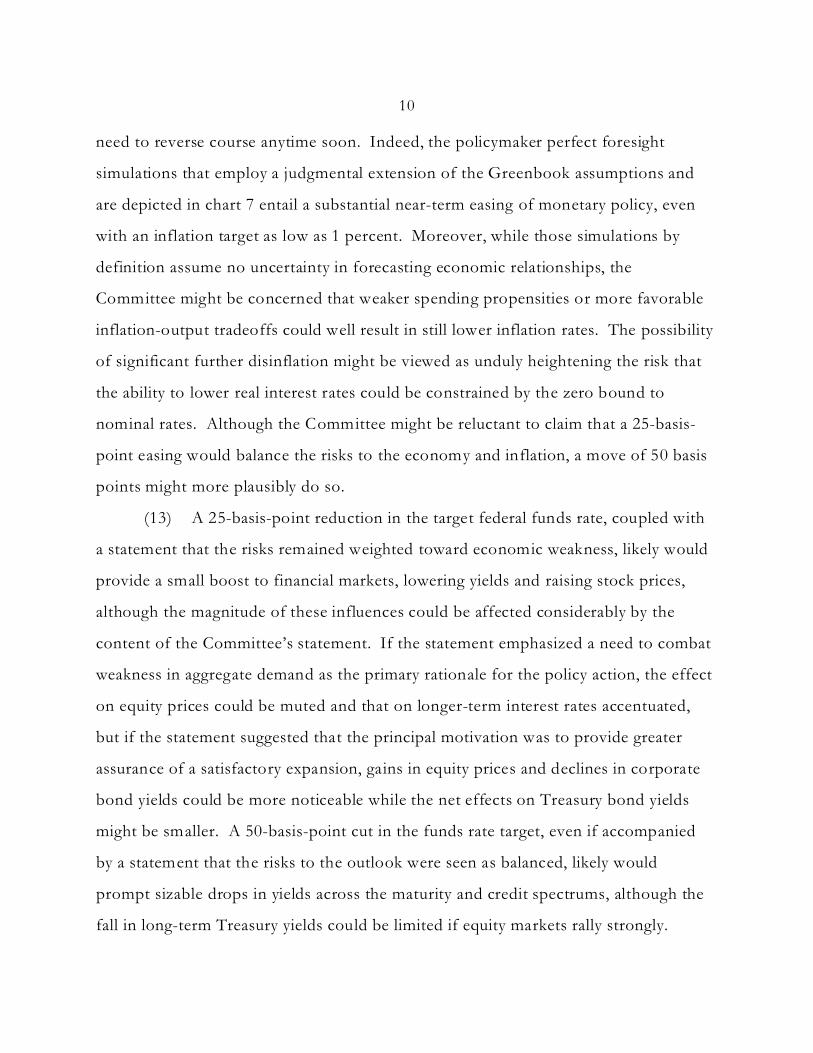
(11) The Committee instead might ease policy 25 basis points if, in view
of signs of slowing aggregate demand growth, it now sees the likely degree of
economic slack several quarters ahead with an unchanged stance of policy as
unacceptable, especially given subdued readings on inflation expectations and the
prospects for further disinflation. The incoming data suggest that spending by both
households and businesses has been weaker than expected by the staff, and the
Committee might be concerned that economic growth could turn out slower than in
the Greenbook outlook. Also, whether financial conditions will prove to be as
supportive of growth as the staff expects is open to question: Credit spreads and
liquidity conditions in segments of the corporate bond market have deteriorated, and
banks have continued to firm terms and standards on business loans, albeit in fewer
numbers than earlier in the year. With some large financial intermediaries themselves
encountering market resistance, their ability to make markets and intermediate credit
flows could be crimped to a greater degree than anticipated by the staff, potentially
contributing to some diminution in market liquidity and credit availability. In these
circumstances, the Committee may believe the time has come to bolster spending by
easing policy. Presumably, the Committee would see a relatively small policy
adjustment of 25 basis points as not likely to put the risks back into balance,
particularly in view of the apparent weakening in the economic outlook since the last
meeting.
(12) The Committee might view the signs of softening growth that have
become apparent over the past six weeks as especially troubling in association with
historically low inflation and nominal interest rates as well as the significant downside
risks already envisioned by the Committee since August. In these circumstances, the
Committee might wish to move aggressively to shore up aggregate demand through a
50-basis-point easing of policy and might see little cost to doing so in terms of a
10
need to reverse course anytime soon. Indeed, the policymaker perfect foresight
simulations that employ a judgmental extension of the Greenbook assumptions and
are depicted in chart 7 entail a substantial near-term easing of monetary policy, even
with an inflation target as low as 1 percent. Moreover, while those simulations by
definition assume no uncertainty in forecasting economic relationships, the
Committee might be concerned that weaker spending propensities or more favorable
inflation-output tradeoffs could well result in still lower inflation rates. The possibility
of significant further disinflation might be viewed as unduly heightening the risk that
the ability to lower real interest rates could be constrained by the zero bound to
nominal rates. Although the Committee might be reluctant to claim that a 25-basis-
point easing would balance the risks to the economy and inflation, a move of 50 basis
points might more plausibly do so.
(13) A 25-basis-point reduction in the target federal funds rate, coupled with
a statement that the risks remained weighted toward economic weakness, likely would
provide a small boost to financial markets, lowering yields and raising stock prices,
although the magnitude of these influences could be affected considerably by the
content of the Committee’s statement. If the statement emphasized a need to combat
weakness in aggregate demand as the primary rationale for the policy action, the effect
on equity prices could be muted and that on longer-term interest rates accentuated,
but if the statement suggested that the principal motivation was to provide greater
assurance of a satisfactory expansion, gains in equity prices and declines in corporate
bond yields could be more noticeable while the net effects on Treasury bond yields
might be smaller. A 50-basis-point cut in the funds rate target, even if accompanied
by a statement that the risks to the outlook were seen as balanced, likely would
prompt sizable drops in yields across the maturity and credit spectrums, although the
fall in long-term Treasury yields could be limited if equity markets rally strongly.
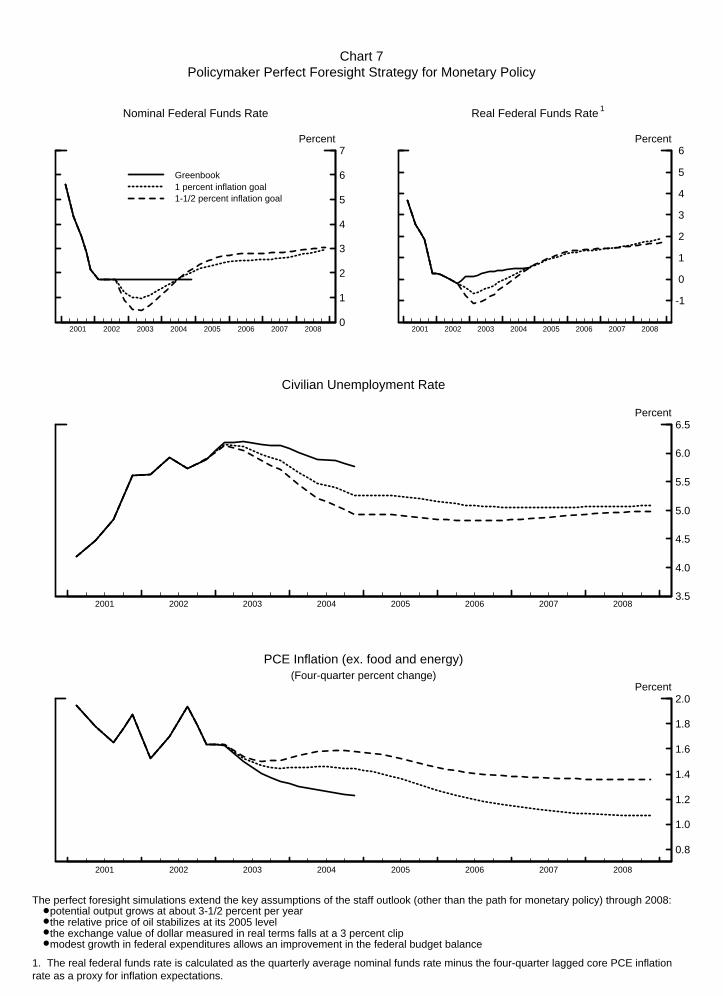
Chart 7Policymaker Perfect Foresight Strategy for Monetary Policy
1
2001 2002 2003 2004 2005 2006 2007 20080
1
2
3
4
5
6
7
Nominal Federal Funds Rate
Percent
Greenbook1 percent inflation goal1-1/2 percent inflation goal
2001 2002 2003 2004 2005 2006 2007 2008
-1
0
1
2
3
4
5
6
Real Federal Funds Rate
Percent
2001 2002 2003 2004 2005 2006 2007 2008
0.8
1.0
1.2
1.4
1.6
1.8
2.0
PCE Inflation (ex. food and energy)(Four-quarter percent change)
Percent
2001 2002 2003 2004 2005 2006 2007 20083.5
4.0
4.5
5.0
5.5
6.0
6.5
Civilian Unemployment Rate
Percent
The perfect foresight simulations extend the key assumptions of the staff outlook (other than the path for monetary policy) through 2008: ● potential output grows at about 3-1/2 percent per year ● the relative price of oil stabilizes at its 2005 level ● the exchange value of dollar measured in real terms falls at a 3 percent clip ● modest growth in federal expenditures allows an improvement in the federal budget balance
1. The real federal funds rate is calculated as the quarterly average nominal funds rate minus the four-quarter lagged core PCE inflationrate as a proxy for inflation expectations.
11
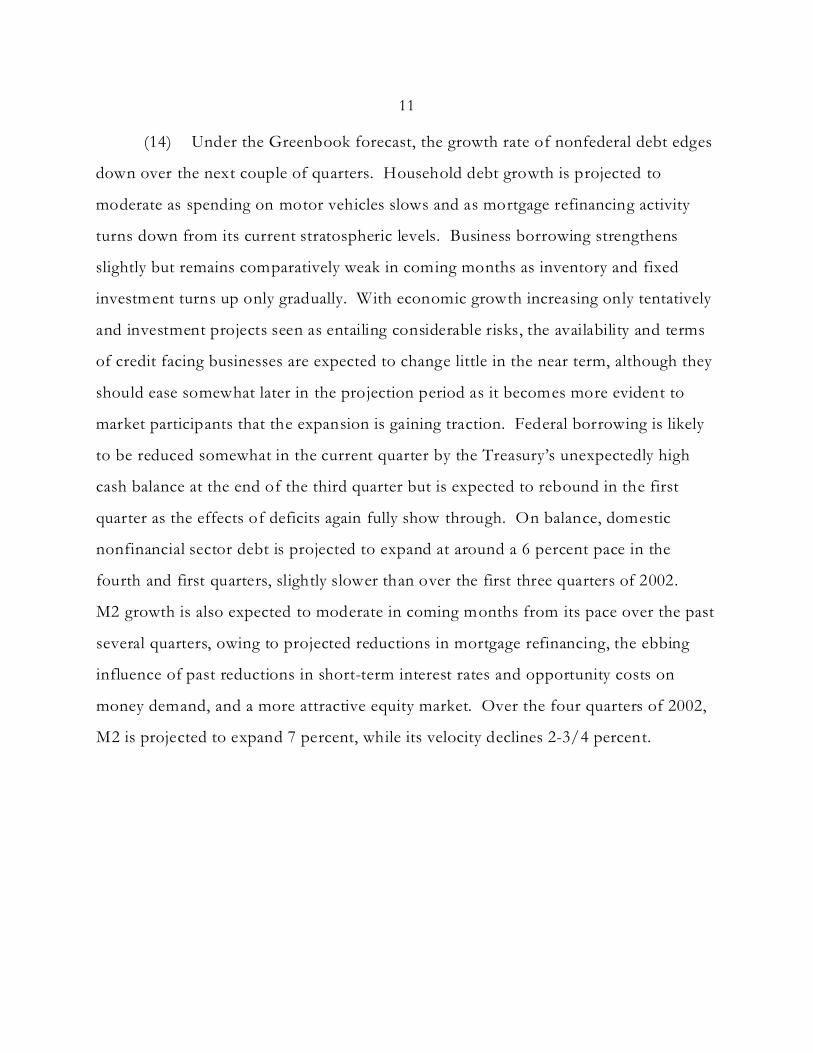
(14) Under the Greenbook forecast, the growth rate of nonfederal debt edges
down over the next couple of quarters. Household debt growth is projected to
moderate as spending on motor vehicles slows and as mortgage refinancing activity
turns down from its current stratospheric levels. Business borrowing strengthens
slightly but remains comparatively weak in coming months as inventory and fixed
investment turns up only gradually. With economic growth increasing only tentatively
and investment projects seen as entailing considerable risks, the availability and terms
of credit facing businesses are expected to change little in the near term, although they
should ease somewhat later in the projection period as it becomes more evident to
market participants that the expansion is gaining traction. Federal borrowing is likely
to be reduced somewhat in the current quarter by the Treasury’s unexpectedly high
cash balance at the end of the third quarter but is expected to rebound in the first
quarter as the effects of deficits again fully show through. On balance, domestic
nonfinancial sector debt is projected to expand at around a 6 percent pace in the
fourth and first quarters, slightly slower than over the first three quarters of 2002.
M2 growth is also expected to moderate in coming months from its pace over the past
several quarters, owing to projected reductions in mortgage refinancing, the ebbing
influence of past reductions in short-term interest rates and opportunity costs on
money demand, and a more attractive equity market. Over the four quarters of 2002,
M2 is projected to expand 7 percent, while its velocity declines 2-3/4 percent.
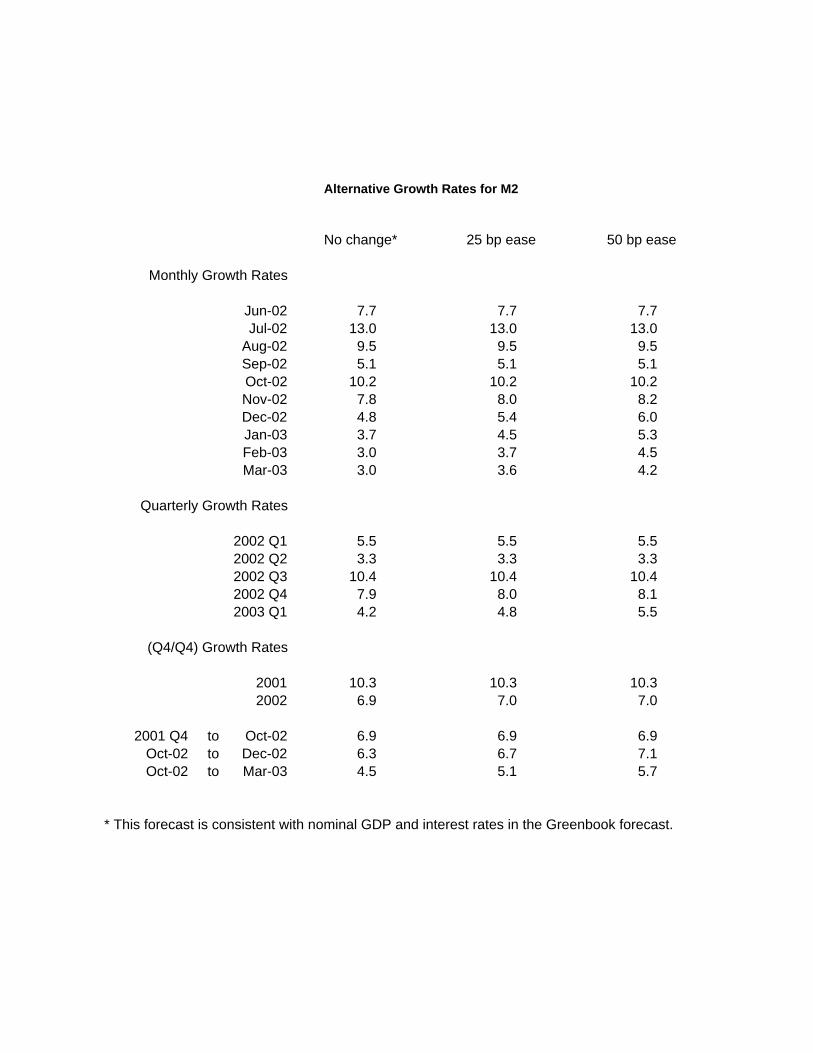
Monthly Growth Rates
Jun-02 7.7 7.7 7.7Jul-02 13.0 13.0 13.0
Aug-02 9.5 9.5 9.5Sep-02 5.1 5.1 5.1Oct-02 10.2 10.2 10.2Nov-02 7.8 8.0 8.2Dec-02 4.8 5.4 6.0Jan-03 3.7 4.5 5.3Feb-03 3.0 3.7 4.5Mar-03 3.0 3.6 4.2
Quarterly Growth Rates
2002 Q1 5.5 5.5 5.52002 Q2 3.3 3.3 3.32002 Q3 10.4 10.4 10.42002 Q4 7.9 8.0 8.12003 Q1 4.2 4.8 5.5
(Q4/Q4) Growth Rates
2001 10.3 10.3 10.32002 6.9 7.0 7.0
2001 Q4 to Oct-02 6.9 6.9 6.9Oct-02 to Dec-02 6.3 6.7 7.1Oct-02 to Mar-03 4.5 5.1 5.7
* This forecast is consistent with nominal GDP and interest rates in the Greenbook forecast.
No change* 25 bp ease 50 bp ease
Alternative Growth Rates for M2
12
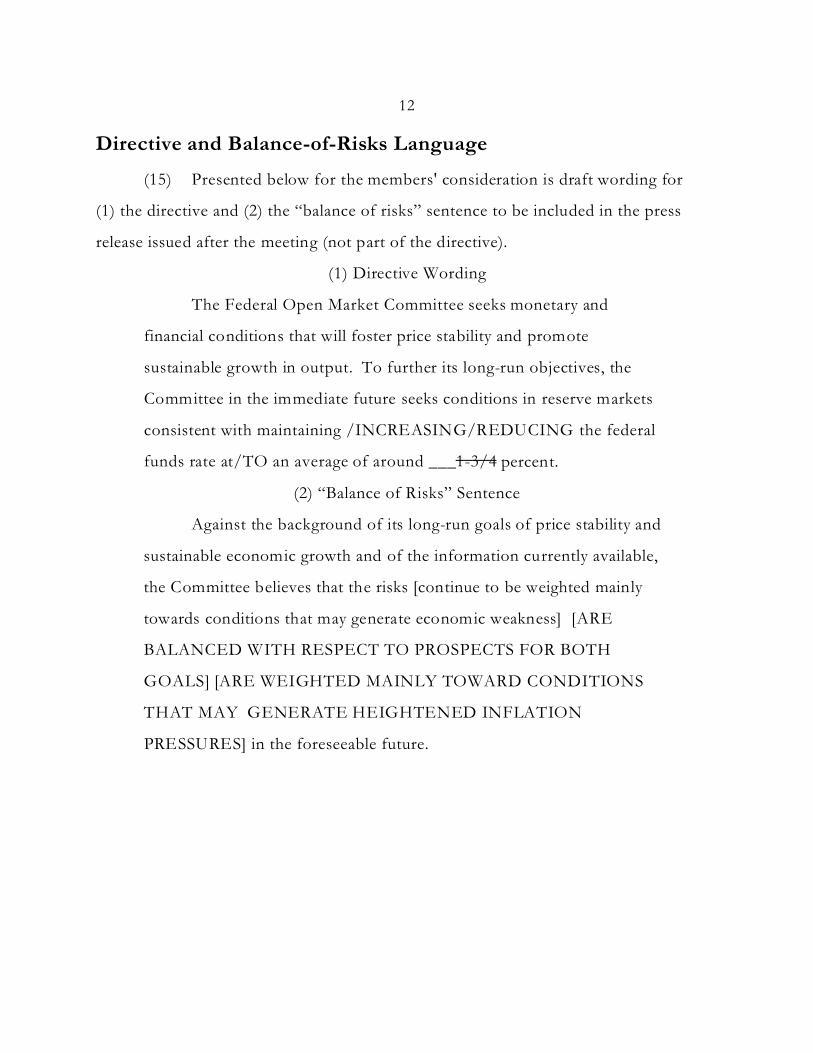
Directive and Balance-of-Risks Language
(15) Presented below for the members' consideration is draft wording for
(1) the directive and (2) the “balance of risks” sentence to be included in the press
release issued after the meeting (not part of the directive).
(1) Directive Wording
The Federal Open Market Committee seeks monetary and
financial conditions that will foster price stability and promote
sustainable growth in output. To further its long-run objectives, the
Committee in the immediate future seeks conditions in reserve markets
consistent with maintaining /INCREASING/REDUCING the federal
funds rate at/TO an average of around ___1-3/4 percent.
(2) “Balance of Risks” Sentence
Against the background of its long-run goals of price stability and
sustainable economic growth and of the information currently available,
the Committee believes that the risks [continue to be weighted mainly
towards conditions that may generate economic weakness] [ARE
BALANCED WITH RESPECT TO PROSPECTS FOR BOTH
GOALS] [ARE WEIGHTED MAINLY TOWARD CONDITIONS
THAT MAY GENERATE HEIGHTENED INFLATION
PRESSURES] in the foreseeable future.
Short-term Long-term
Federalfunds
Treasury billssecondary market
CDssecondary
market
Comm.paper Off-the-run Treasury yields Indexed yields Moody’s
Baa
MunicipalBondBuyer
Conventional homemortgages
primary market
4-week 3-month 6-month 3-month 1-month 2-year 5-year 10-year 30-year 5-year 10-year Fixed-rate ARM
1 2 3 4 5 6 7 8 9 10 11 12 13 14 15 16
5.99 3.66 5.51 5.30 5.96 6.12 4.91 5.11 5.68 5.99 3.59 3.61 8.20 5.65 7.24 6.861.74 1.69 1.69 1.77 1.79 1.76 2.47 3.66 4.58 5.06 2.65 2.96 7.62 5.20 6.45 5.06
1.80 1.80 1.85 2.12 1.97 1.79 3.69 4.94 5.69 6.00 3.31 3.54 8.18 5.67 7.18 5.261.62 1.55 1.51 1.48 1.65 1.62 1.77 2.79 4.01 4.91 1.27 2.17 7.37 5.02 5.98 4.22
2.49 2.27 2.20 2.17 2.31 2.40 2.79 3.93 4.86 5.41 2.75 3.10 7.91 5.34 6.62 5.282.09 1.99 1.91 1.93 2.03 2.03 2.83 4.05 4.94 5.34 2.91 3.19 7.81 5.30 6.66 5.201.82 1.71 1.72 1.82 1.83 1.84 3.12 4.52 5.40 5.77 3.28 3.54 8.05 5.56 7.07 5.23
1.73 1.67 1.68 1.77 1.74 1.70 3.03 4.45 5.32 5.71 3.14 3.45 7.87 5.48 7.00 5.181.74 1.74 1.76 1.86 1.82 1.76 3.01 4.36 5.24 5.62 2.91 3.32 7.89 5.43 6.89 5.031.73 1.79 1.82 2.05 1.91 1.78 3.52 4.80 5.60 5.93 2.94 3.36 8.11 5.61 7.01 5.061.75 1.72 1.75 1.97 1.87 1.76 3.40 4.69 5.49 5.87 2.64 3.16 8.03 5.59 6.99 4.961.75 1.74 1.76 1.91 1.82 1.75 3.24 4.54 5.40 5.82 2.50 3.10 8.09 5.54 6.81 4.791.75 1.71 1.73 1.83 1.81 1.74 2.97 4.24 5.16 5.71 2.46 3.08 7.95 5.44 6.65 4.651.73 1.72 1.71 1.74 1.79 1.74 2.52 3.86 4.90 5.60 2.23 2.92 7.90 5.34 6.49 4.511.74 1.68 1.65 1.64 1.73 1.72 2.12 3.37 4.54 5.27 1.80 2.51 7.58 5.30 6.29 4.381.75 1.67 1.66 1.64 1.76 1.73 1.98 3.01 4.16 4.97 1.45 2.25 7.40 5.10 6.09 4.29
1.78 1.70 1.68 1.68 1.76 1.72 2.17 3.35 4.48 5.19 1.77 2.46 7.51 5.25 6.22 4.341.79 1.68 1.65 1.62 1.75 1.72 1.98 3.08 4.25 5.01 1.54 2.31 7.40 5.16 6.15 4.351.73 1.70 1.69 1.68 1.77 1.73 2.09 3.16 4.29 5.04 1.56 2.31 7.43 5.15 6.18 4.321.72 1.67 1.68 1.67 1.77 1.72 2.00 3.01 4.13 4.94 1.47 2.24 7.37 5.05 6.05 4.281.75 1.66 1.65 1.61 1.75 1.73 1.91 2.88 4.04 4.91 1.32 2.17 7.39 5.05 5.99 4.221.78 1.60 1.58 1.53 1.72 1.73 1.77 2.80 4.03 4.92 1.27 2.18 7.44 5.03 6.01 4.291.73 1.60 1.59 1.56 1.72 1.72 1.78 2.79 4.01 4.94 1.31 2.23 7.57 5.02 5.98 4.231.75 1.65 1.67 1.68 1.78 1.72 2.10 3.21 4.42 5.23 1.66 2.52 7.86 5.23 6.15 4.271.75 1.67 1.67 1.68 1.78 1.73 2.14 3.29 4.50 5.34 1.79 2.60 7.95 5.33 6.31 4.30 -- 1.55 1.51 1.48 1.67 1.71 1.79 2.98 4.29 5.21 1.57 2.44 -- -- 6.13 4.25
1.88 1.65 1.68 1.69 1.76 1.72 2.12 3.17 4.37 5.18 1.58 2.45 7.81 -- -- --1.73 1.66 1.66 1.67 1.77 1.72 2.06 3.16 4.37 5.20 1.63 2.49 7.83 -- -- --1.74 1.65 1.67 1.69 1.79 1.72 2.13 3.26 4.47 5.27 1.71 2.56 7.89 -- -- --1.71 1.65 1.67 1.68 1.78 1.73 2.10 3.23 4.45 5.28 1.73 2.56 7.90 -- -- --1.73 1.68 1.71 1.72 1.77 1.71 2.22 3.35 4.53 5.34 1.78 2.60 7.94 -- -- --1.71 1.71 1.69 1.71 1.80 1.75 2.22 3.36 4.56 5.36 1.84 2.64 7.98 -- -- --1.76 1.69 1.68 1.69 1.78 1.71 2.19 3.34 4.54 5.38 1.81 2.63 7.99 -- -- --1.80 1.64 1.65 1.66 1.79 1.72 2.09 3.24 4.46 5.33 1.76 2.59 7.93 -- -- --1.82 1.63 1.64 1.62 1.77 1.76 2.00 3.17 4.41 5.28 1.74 2.56 7.90 -- -- --1.79 1.59 1.59 1.55 1.73 1.73 1.90 3.10 4.39 5.28 1.66 2.52 7.91 -- -- --1.75 1.58 1.51 1.46 1.69 1.74 1.80 2.96 4.27 5.19 1.54 2.41 7.82 -- -- --1.72 1.56 1.51 1.46 1.63 1.65 1.75 2.96 4.28 5.21 1.55 2.42 7.82 -- -- -- -- 1.48 1.44 1.43 1.61 -- 1.69 2.90 4.23 5.18 1.54 2.40 -- -- -- --
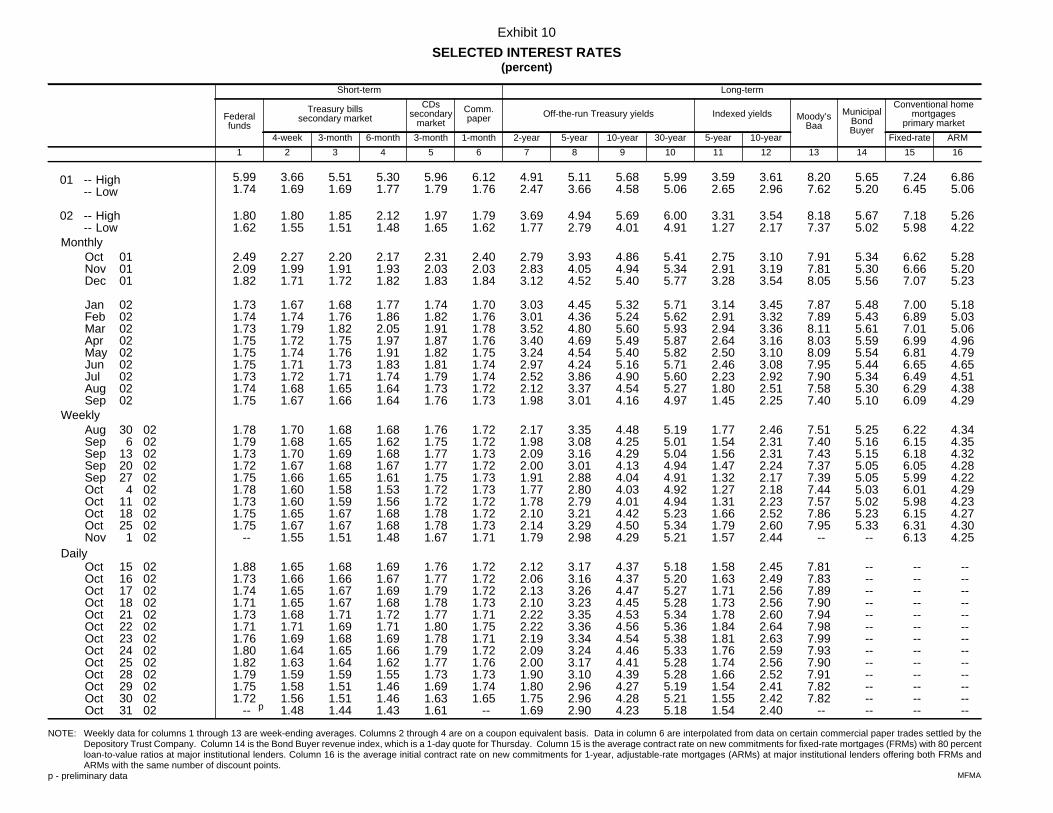
Exhibit 10
SELECTED INTEREST RATES(percent)
NOTE: Weekly data for columns 1 through 13 are week-ending averages. Columns 2 through 4 are on a coupon equivalent basis. Data in column 6 are interpolated from data on certain commercial paper trades settled by theDepository Trust Company. Column 14 is the Bond Buyer revenue index, which is a 1-day quote for Thursday. Column 15 is the average contract rate on new commitments for fixed-rate mortgages (FRMs) with 80 percentloan-to-value ratios at major institutional lenders. Column 16 is the average initial contract rate on new commitments for 1-year, adjustable-rate mortgages (ARMs) at major institutional lenders offering both FRMs andARMs with the same number of discount points.
p - preliminary data
Oct Nov Dec Jan Feb Mar Apr May Jun Jul Aug Sep
Aug Sep Sep Sep Sep Oct Oct Oct Oct Nov
Oct Oct Oct Oct Oct Oct Oct Oct Oct Oct Oct Oct Oct
010101
020202020202020202
306
132027
4111825
1
15161718212223242528293031
02020202020202020202
02020202020202020202020202
01 -- High-- Low
02 -- High-- Low
Monthly
Weekly
Daily
p
MFMA
Strictly Confidential (FR)-Class II FOMC
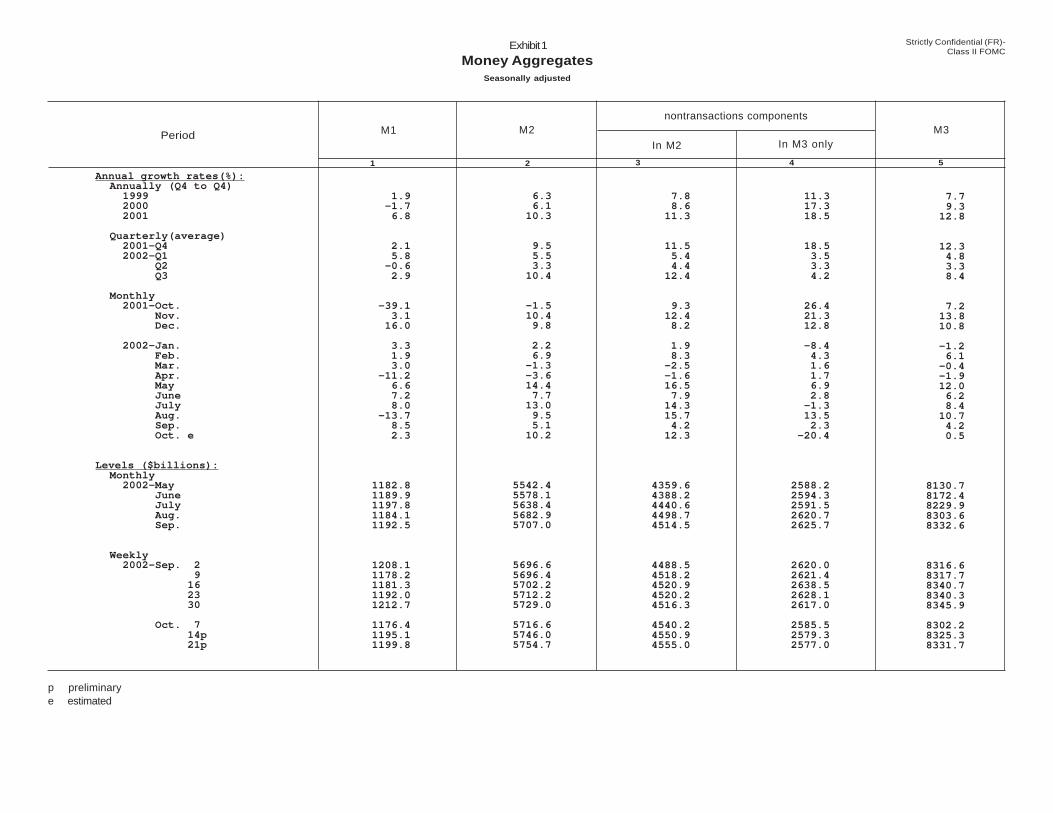
Exhibit 1
Money AggregatesSeasonally adjusted
nontransactions components
Annual growth rates(%):Annually (Q4 to Q4) 1999 2000 2001
Quarterly(average) 2001-Q4 2002-Q1 Q2 Q3
Monthly 2001-Oct. Nov. Dec. 2002-Jan. Feb. Mar. Apr. May June July Aug. Sep. Oct. e
Levels ($billions):Monthly 2002-May June July Aug. Sep.
Weekly 2002-Sep. 2 9 16 23 30 Oct. 7 14p 21p
1.9 -1.7 6.8
2.1 5.8 -0.6 2.9
-39.1 3.1
16.0 3.3 1.9 3.0 -11.2 6.6 7.2 8.0 -13.7 8.5 2.3
1182.8 1189.9 1197.8 1184.1 1192.5
1208.1 1178.2 1181.3 1192.0 1212.7 1176.4 1195.1 1199.8
6.3 6.1 10.3
9.5 5.5 3.3 10.4
-1.5 10.4
9.8 2.2 6.9 -1.3 -3.6 14.4 7.7 13.0 9.5 5.1 10.2
5542.4 5578.1 5638.4 5682.9 5707.0
5696.6 5696.4 5702.2 5712.2 5729.0 5716.6 5746.0 5754.7
7.8 8.6 11.3
11.5 5.4 4.4 12.4
9.3 12.4
8.2 1.9 8.3 -2.5 -1.6 16.5 7.9 14.3 15.7 4.2 12.3
4359.6 4388.2 4440.6 4498.7 4514.5
4488.5 4518.2 4520.9 4520.2 4516.3 4540.2 4550.9 4555.0
11.3 17.3 18.5
18.5 3.5 3.3 4.2
26.4 21.3
12.8 -8.4 4.3 1.6 1.7 6.9 2.8 -1.3 13.5 2.3 -20.4
2588.2 2594.3 2591.5 2620.7 2625.7
2620.0 2621.4 2638.5 2628.1 2617.0 2585.5 2579.3 2577.0
7.7 9.3 12.8
12.3 4.8 3.3 8.4
7.2 13.8
10.8 -1.2 6.1 -0.4 -1.9 12.0 6.2 8.4 10.7 4.2 0.5
8130.7 8172.4 8229.9 8303.6 8332.6
8316.6 8317.7 8340.7 8340.3 8345.9 8302.2 8325.3 8331.7
54321
PeriodIn M3 onlyIn M2
M3M2M1
p preliminary e estimated
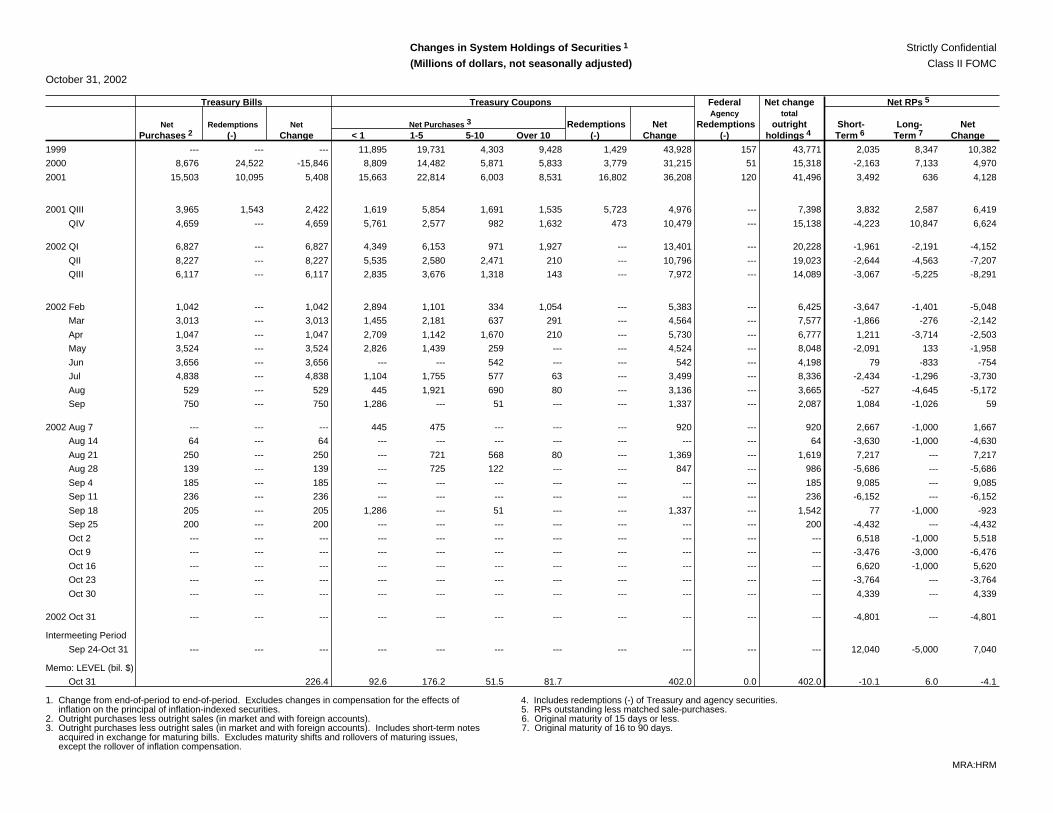
Changes in System Holdings of Securities 1 Strictly Confidential
(Millions of dollars, not seasonally adjusted) Class II FOMC
October 31, 2002
Treasury Bills Treasury Coupons Federal Net change Net RPs 5
Agency totalNet Redemptions Net Net Purchases 3 Redemptions Net Redemptions outright Short- Long- Net
Purchases 2 (-) Change < 1 1-5 5-10 Over 10 (-) Change (-) holdings 4 Term 6 Term 7 Change
1999 --- --- --- 11,895 19,731 4,303 9,428 1,429 43,928 157 43,771 2,035 8,347 10,382
2000 8,676 24,522 -15,846 8,809 14,482 5,871 5,833 3,779 31,215 51 15,318 -2,163 7,133 4,970
2001 15,503 10,095 5,408 15,663 22,814 6,003 8,531 16,802 36,208 120 41,496 3,492 636 4,128
2001 QIII 3,965 1,543 2,422 1,619 5,854 1,691 1,535 5,723 4,976 --- 7,398 3,832 2,587 6,419
QIV 4,659 --- 4,659 5,761 2,577 982 1,632 473 10,479 --- 15,138 -4,223 10,847 6,624
2002 QI 6,827 --- 6,827 4,349 6,153 971 1,927 --- 13,401 --- 20,228 -1,961 -2,191 -4,152
QII 8,227 --- 8,227 5,535 2,580 2,471 210 --- 10,796 --- 19,023 -2,644 -4,563 -7,207
QIII 6,117 --- 6,117 2,835 3,676 1,318 143 --- 7,972 --- 14,089 -3,067 -5,225 -8,291
2002 Feb 1,042 --- 1,042 2,894 1,101 334 1,054 --- 5,383 --- 6,425 -3,647 -1,401 -5,048
Mar 3,013 --- 3,013 1,455 2,181 637 291 --- 4,564 --- 7,577 -1,866 -276 -2,142
Apr 1,047 --- 1,047 2,709 1,142 1,670 210 --- 5,730 --- 6,777 1,211 -3,714 -2,503
May 3,524 --- 3,524 2,826 1,439 259 --- --- 4,524 --- 8,048 -2,091 133 -1,958
Jun 3,656 --- 3,656 --- --- 542 --- --- 542 --- 4,198 79 -833 -754
Jul 4,838 --- 4,838 1,104 1,755 577 63 --- 3,499 --- 8,336 -2,434 -1,296 -3,730
Aug 529 --- 529 445 1,921 690 80 --- 3,136 --- 3,665 -527 -4,645 -5,172
Sep 750 --- 750 1,286 --- 51 --- --- 1,337 --- 2,087 1,084 -1,026 59
2002 Aug 7 --- --- --- 445 475 --- --- --- 920 --- 920 2,667 -1,000 1,667
Aug 14 64 --- 64 --- --- --- --- --- --- --- 64 -3,630 -1,000 -4,630
Aug 21 250 --- 250 --- 721 568 80 --- 1,369 --- 1,619 7,217 --- 7,217
Aug 28 139 --- 139 --- 725 122 --- --- 847 --- 986 -5,686 --- -5,686
Sep 4 185 --- 185 --- --- --- --- --- --- --- 185 9,085 --- 9,085
Sep 11 236 --- 236 --- --- --- --- --- --- --- 236 -6,152 --- -6,152
Sep 18 205 --- 205 1,286 --- 51 --- --- 1,337 --- 1,542 77 -1,000 -923
Sep 25 200 --- 200 --- --- --- --- --- --- --- 200 -4,432 --- -4,432
Oct 2 --- --- --- --- --- --- --- --- --- --- --- 6,518 -1,000 5,518
Oct 9 --- --- --- --- --- --- --- --- --- --- --- -3,476 -3,000 -6,476
Oct 16 --- --- --- --- --- --- --- --- --- --- --- 6,620 -1,000 5,620
Oct 23 --- --- --- --- --- --- --- --- --- --- --- -3,764 --- -3,764
Oct 30 --- --- --- --- --- --- --- --- --- --- --- 4,339 --- 4,339
2002 Oct 31 --- --- --- --- --- --- --- --- --- --- --- -4,801 --- -4,801
Intermeeting Period
Sep 24-Oct 31 --- --- --- --- --- --- --- --- --- --- --- 12,040 -5,000 7,040
Memo: LEVEL (bil. $)
Oct 31 226.4 92.6 176.2 51.5 81.7 402.0 0.0 402.0 -10.1 6.0 -4.1
1. Change from end-of-period to end-of-period. Excludes changes in compensation for the effects of 4. Includes redemptions (-) of Treasury and agency securities. inflation on the principal of inflation-indexed securities. 5. RPs outstanding less matched sale-purchases.2. Outright purchases less outright sales (in market and with foreign accounts). 6. Original maturity of 15 days or less.3. Outright purchases less outright sales (in market and with foreign accounts). Includes short-term notes 7. Original maturity of 16 to 90 days. acquired in exchange for maturing bills. Excludes maturity shifts and rollovers of maturing issues, except the rollover of inflation compensation.
MRA:HRM