Embed Size (px)
Citation preview

Prefatory Note
The attached document represents the most complete and accurate version available based on original copies culled from the files of the FOMC Secretariat at the Board of Governors of the Federal Reserve System. This electronic document was created through a comprehensive digitization process which included identifying the best-preserved paper copies, scanning those copies,1 and then making the scanned versions text-searchable.2 Though a stringent quality assurance process was employed, some imperfections may remain.
Please note that this document may contain occasional gaps in the text. These gaps are the result of a redaction process that removed information obtained on a confidential basis. All redacted passages are exempt from disclosure under applicable provisions of the Freedom of Information Act.
1 In some cases, original copies needed to be photocopied before being scanned into electronic format. All scanned images were deskewed (to remove the effects of printer- and scanner-introduced tilting) and lightly cleaned (to remove dark spots caused by staple holes, hole punches, and other blemishes caused after initial printing). 2 A two-step process was used. An advanced optimal character recognition computer program (OCR) first created electronic text from the document image. Where the OCR results were inconclusive, staff checked and corrected the text as necessary. Please note that the numbers and text in charts and tables were not reliably recognized by the OCR process and were not checked or corrected by staff.

Confidential (FR) Class III FOMC
December 7, 2001
CURRENT ECONOMICAND FINANCIAL CONDITIONS
Supplemental Notes
Prepared for the Federal Open Market Committeeby the staff of the Board of Governors of the Federal Reserve System

Contents
Domestic Nonfinancial Economy ............................. 1
Labor Market Developments ............... ................ 1Employment and unemployment ...................... . . . .Productivity and labor costs ............... . ....... ...... 4
Consumer Sentiment ............................... ...... 6Manufacturers' Inventories ............... .................. 8
TablesChanges in Employment ....................... 2Selected Unemployment and Labor Force Participation
Rates .............. .................... . 3Labor Productivity and Costs ................... .... 5University of Michigan Survey Research Center:
Survey of Consumer Attitudes ................... 7Change in Mantufacturing Inventories ................ 9Manufacturers' Inventory-Shipments Ratios ........... 9
ChartPrivate Payroll Employment Growth ................. 2Aggregate Hours of Production or Nonsupervisory
Workers ....................... .......... 2Labor Force Participation Rate and Unemployment Rate . 3Joe Losers Unemployed for Less than 5 Weeks ........ 3
The International Economy .............................. . 10
U.S. International Financial Transactions ................. ...... 10
TableSummary of U.S. International Transactions .......... 11
The Domestic Financial Economy
TableSelected Financial Market Quotations ............... 12

Supplemental Notes
The Domestic Nonfinancial Economy
Labor Market Developments
Employment and unemployment. The labor market deteriorated further inNovember, as the economy continued to experience widespread job losses andrising unemployment. Employment on private nonfarm payrolls declined by325,000 last month, and October payrolls were revised down by 48,000,bringing the total job losses thus far in the fourth quarter to 812,000.1 Sincethe recent employment peak in 2001:Q1, the private nonfarm sector has shed1.5 million jobs, comparable to the loss experienced from 1990:Q2 through1991:Q2 (one quarter after the official trough). In the household survey, theunemployment rate increased 0.3 percentage point, to 5.7 percent, following a0.5 percentage point rise last month. The rise over the past three months is thefastest since the fall of 1982.
The manufacturing industry, shedding 163,000 jobs, accounted for the largestshare of job losses in employment in November. This was the biggest singlemonthly decline in factory payrolls since manufacturing employment began tofall in August 2000, and it brought the total job losses in manufacturing sincethen to nearly 1.4 million. The weakness in the manufacturing sector waswidespread, and the manufacturing diffusion index of one-month employmentchange fell to 25.4 in November, the lowest reading since May 1980.Moreover, wholesale trade and help supply, two industries closely tied tomanufacturing, also saw sizable employment losses in November.
Elsewhere, employment declines continued to be heavy in industries mostdirectly affected by the events of September 11. Transportation lost 54,000jobs, a loss comparable with last month's, with air transportation andtransportation services, which includes travel agencies, accounting for nearlyall the drop. Similarly, employment in amusement and recreation servicesposted a 25,000 decline, while hotel and other lodging places lost 7,000 jobs.In contrast, retail trade experienced a much smaller decline in employment lastmonth (-14,000), and health services continued to expand a rapid pace, adding32,000 jobs-above the average for 2001. Finance. insurance, and real estatealso added jobs in November-the third increase in four months-led by
1. These data incorporated the BLS's six-month update to the seasonal adjustment factorsfor the establishment survey data. The new seasonal factors cover September 2001 throughApril 2002 and thus were used in putting together the November estimates as well as incalculating the revisions to the September and October data. Most of the revision to the August-September change in employment was due to the change in the seasonal factors, although thefact that the estimates for these months are constructed from inconsistent seasonal factors makesthis revision difficult to interpret. The revision to the September-October change, which is basedon updated and consistent seasonal factors, was due largely to changes in the unadjusted data.

-2-
CHANGES IN EMPLOYMENT(Thousands of employees; based on seasonally adjusted data)
2000 2001 2001H1 H2 Q2 Q3 Sept. Oct.
Nonfarm payroll employment1Previous
PrivateMiningManufacturingConstructionTransportation and utilitiesRetail tradeWholesale tradeFinance, insurance, real estateServices
Help supply servicesTotal government
Total employment (household survey)Nonagricultural
--Average monthly267 66 -74267 66 -74178 121 -113
1 1 35 -29 -120
16 21 -2213 16 -331 21 359 8 -15-7 7 4
110 76 415 -19 -4490 -54 39
109 -283115 -227
change---67-83
-1181
-1032
-16-8-11116-1851
-165-213-141
0-8510
-12-47-22105-7-24
-468-415-487
0-124-17-53
-119-17-6
-151-101
19
Nov.
-331
-325-2
-163-2-58-14-25
9-70-87
-6
83 788 -619 -4788 685 -599 -387
Memo:Aggregate hours of private production
workers (percent change)1,2 2.1Average workweek (hours)1 34.5
Manufacturing (hours) 41.8
0.234.341.3
-1.534.240.8
-3.034.140.7
-0.134.140.6
-0.734.040.5
Note. Average change from final month of preceding period to final month of period indicated.
1. Survey of establishments.
2. Semi-annual data are percent change from Q4 to Q2 and from Q2 to Q4 at an annual rate.
Quarterly data are percent changes from preceding quarter at an annual rate. Monthly data
are percent change from preceding month.
Private Payroll Employment Growth(Strike-adjusted data)
Thousands of employees
Aggregate Hours of Production orNonsupervisory Workers
1982 =100
1997 1998 1999 2000 2001
-0.134.140.3
1997 1998 1999 2000
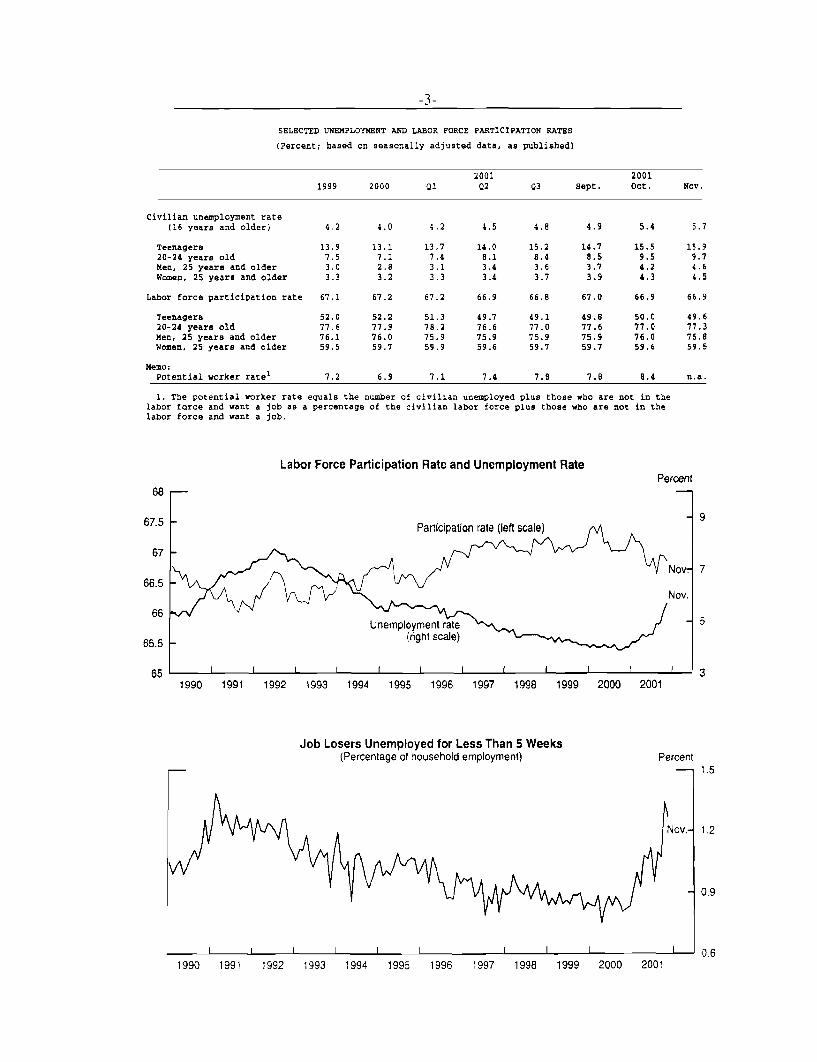
SELECTED UNEMPLOYMENT AND LABOR FORCE PARTICIPATION RATES
(Percent; based on seasonally adjusted data, as published)
20011999 2000 Q1 Q2
Civilian unemployment rate(16 years and older)
Teenagers20-24 years oldMen, 25 years and olderWomen, 25 years and older
Labor force participation rate
Teenagers20-24 years oldMen, 25 years and olderWomen, 25 years and older
Memo:Potential worker rate1
2001Q3 Sept. Oct. Nov.
4.2 4.0 4.2 4.5 4.8 4.9 5.4 5.7
13.9 13.1 13.77.5 7.1 7.43.0 2.8 3.13.3 3.2 3.3
67.1
14.0 15.2 14.7 15.5 15.98.1 8.4 8.5 9.5 9.73.4 3.6 3.7 4.2 4.63.4 3.7 3.9 4.3 4.5
67.2 67.2 66.9 66.8 67.0 66.9 66.9
52.0 52.2 51.3 49.7 49.1 49.8 50.0 49.677.6 77.9 78.2 76.6 77.0 77.6 77.0 77.376.1 76.0 75.9 75.9 75.9 75.9 76.0 75.859.5 59.7 59.9 59.6 59.7 59.7 59.6 59.5
7.2 6.9 7.1 7.4 7.8 7.8 8.4 n.a.
1. The potential worker rate equals the number of civilian unemployed plus those who are not in thelabor force and want a job as a percentage of the civilian labor force plus those who are not in thelabor force and want a job.
Labor Force Participation Rate and Unemployment RatePercent
Participation rate (left scale)
1990 1991 1992 1993 1994 1995 1996 1997 1998 1999 2000 2001
Job Losers Unemployed for Less Than 5 Weeks(Percentage of household employment)
1990 1991 1992 1993 1994 1995 1996 1997 1998 1999 2000 2001
Percent

further hiring at mortgage banks and brokers. Construction lost only 2,000jobs this month following a large loss last month; however, warm weather mayhave reduced the pace of layoffs somewhat.
The index of aggregate weekly hours of production or nonsupervisory workerson nonfarm payrolls declined 0.1 percent in November to its lowest level sinceSeptember 1999. The average workweek edged up 0.1 hour, to 34.1 hours. Incontrast, the manufacturing workweek declined 0.2 hour, to 40.3 hours, a levelequal to the trough this series reached in March of 1991.
In the household survey, the rise in the unemployment rate was accompaniedby a 478,000 drop in household employment. The labor force participationrate held steady at 66.9 percent. The proportion of the unemployed whoclassified themselves as job losers moved up to 56.4 percent, its highest levelsince October 1992, while the mean duration of unemployment rose to14.5 weeks, the longest since May 1998.
Initial claims for unemployment insurance under state programs declined18,000, to 475,000 for the week ended December 1 from an upward-revisedlevel of 493,000 in the previous week. The four-week moving average of initialclaims rose slightly to 461,000.2 The level of insured unemployment for theweek ended November 24 dropped 349,000, to 3.64 million, more thanreversing the jump in the previous week. Similarly, the insured unemploymentrate for the week ended November 24 dropped back 0.3 percentage point, to2.8 percent. Nonetheless, the insured unemployment rate remains at a level notsustained since 1992.
Productivity and labor costs. Output per hour of all persons in the nonfarmbusiness sector is now reported to have increased at an annual rate of 1.5percent in the third quarter, a downward revision of 1.2 percentage points fromthe 2.7 percent advance reported in the preliminary release. 3 The largerdecline in real output in the BEA's preliminary NIPA estimates accounted foralmost all of the downward revision. For the four quarters ended in 2001:Q3.productivity rose 1.5 percent, 2-1/2 percentage points less than the increaseposted over the four quarters ended in 2000:Q3. However, relative to the
2. Using the Board staffs alternative seasonal factors, initial claims decreased 28,000 to462,000, and the four-week average of initial claims edged up 5,000, to 456,000.
3. This release incorporated results from the 2000 Hours at Work survey. The results of thissurvey, which measures the ratio of hours worked to hours paid, led the BLS to revise down thepreviously estimated increases in hours in both 1999 and 2000. As a result, the increase inoutput per hour for the four quarters ended in 1999:Q4 was revised up 0.1 percentage point, to2.9 percent, and the rate for the four quarters ended in 2000:Q4 was revised up 0.3 percentagepoints to 2.6 percent.

LABOR PRODUCTIVITY AND COSTS(Percent change from preceding period at compound annual rate;
based on seasonally adjusted data)
2000 2001 2000:Q3to
19991 20001 Q4 Q1 Q2 Q3 2001:Q3
Output per hour
Total business 3.0 2.9 3.0 -.2 2.2 1.1 1.5Nonfarm business 2.9 2.6 2.3 -.1 2.1 1.5 1.5Manufacturing 5.5 4.9 2.8 -2.7 -.5 2.5 .5
Nonfinancial corporations 2 2.8 2.9 .7 .5 3.3 2.4 1.7
Compensation per hour
Total business 4.5 7.9 9.5 5.1 5.2 3.5 5.8Nonfarm business 4.5 7.8 8.9 4.9 4.7 3.8 5.6Manufacturing 4.6 9.1 12.7 6.0 6.1 3.6 7.0
Nonfinancial corporations2 4.5 7.8 9.6 5.5 6.1 4.9 6.5
Unit labor costs
Total business 1.4 4.9 6.3 5.3 3.0 2.4 4.2Nonfarm business 1.5 5.0 6.4 5.0 2.6 2.3 4.1Manufacturing -.8 4.0 9.7 8.9 6.7 1.1 6.5
Nonfinancial corporations2 1.6 4.7 8.9 5.0 2.7 2.5 4.7
1. Changes are from fourth quarter of preceding year to fourthquarter of year shown.2. The nonfinancial corporate sector includes all corporations doing
business in the United States with the exception of banks, stockand commodity brokers, finance and insurance companies; the sectoraccounts for about two-thirds of business employment.
sharp slowing in output, the deceleration in productivity over the past yearseems in line with historical experience.
The increase in hourly compensation in the third quarter was revised down0.7 percentage point to an annual rate of 3.8 percent, significantly below the4.8 percent pace seen in the first half of this year. Nonetheless, the largerdownward revision to productivity led to a 0.5 percentage point upwardrevision to the rise in unit labor costs last quarter, to an annual rate of 2.3percent. Over the last four quarters, unit labor costs increased 4.1 percent,about 1-1/2 percentage points more than the increase posted over the previousfour quarters.
The first estimate of productivity and costs in the nonfinancial corporate sectorfor the third quarter of 2001 showed that output per hour in this sector rose atan annual rate of 2.4 percent in the third quarter.4 Hourly compensation roseat a 4.9 percent rate in the third quarter, while unit labor costs were up at a rateof 2.5 percent.
Average hourly earnings of production or nonsupervisory workers rose0.3 percent in November. Since midyear, this measure of wage change hasincreased at an annual rate of 3.6 percent-down from 4 percent in the first halfof the year and 4.3 percent in 2000.
Consumer Sentiment
According to the preliminary report. the Michigan Survey Research Center's(SRC) index of consumer sentiment rose nearly 2 points in early December,following a smaller rise in November. In early December, the current-conditions component of the index was about unchanged at a level onlyslightly above September's reading. However, the expected-conditionscomponent continued to rise moderately and is currently about 6 points higherthan in September.
Among those items not included in the overall index, expectations about thechange in unemployment over the next twelve months improved a bit furtherin December and have now returned to the level of midsummer. Meanwhile,consumers' appraisals of buying conditions for automobiles remained at anelevated level, as manufacturers extended many of their relatively attractivefinancing incentives. Also, consumers' appraisals of homebuying conditions
4. Today's release incorporated the BEA's revisions to price indexes used to calculate realoutput for nonfinancial corporations back to the first quarter of 1998. The revisions lowered theestimated rise in output by 0.2 percentage point over the four quarters ended in 1999:Q4. and by1.6 percentage points over the four quarters ended in 2000:Q4.

December 7, 2001
UNIVERSITY OF MICHIGAN SURVEY RESEARCH CENTER: SURVEY OF CONSUMER ATTITUDES(Not seasonally adjusted)
2001 2001 2001 2001 2001 2001 2001 2001 2001Apr. May June July Aug. Sept. Oct. Nov. Dec
(p)
Indexes of consumer sentiment (Feb. 1966=100)
Composite of current and expected conditions 88.4 92.0 92.6 92.4 91.5 81.8 82.7 83.9 85.8Current conditions 98.0 102.2 101.6 98.6 101.2 94.6 94.0 95.3 95.9Expected conditions 82.2 85.4 86.9 88.4 85.2 73.5 75.5 76.6 79.3
Personal financial situationNow compared with 12 months ago* 110 112 117 114 118 108 107 107 102Expected in 12 months* 134 129 126 133 127 128 128 134 132
Expected business conditionsNext 12 months* 92 99 114 115 102 71 77 76 84
Next 5 years* 104 115 109 107 113 95 98 97 101
Appraisal of buying conditionsCars 129 133 127 138 132 133 152 164 165
Large household appliances* 143 152 146 141 144 136 136 140 146
Hoises .44 154 162 149 154 149 159 161 169
Willingness to use credit 34 45 43 41 47 39 52 54 36
Willingness to use savings 55 58 64 60 55 47 62 56 55
Expected unemployment change - next 12 months 146 138 135 140 142 151 150 143 141
Prob. household will lose a job - next 5 years 21 21 22 24 23 24 21 24 23
Expected inflation - next 12 monthsMean 3.7 3.9 4.0 3.0 3.1 3.2 1.6 1.0 1.6
Median 3.1 3.2 3.0 2.6 2.7 2.8 1.0 .4 1.6
Expedted inflation - next 5 to 10 yearsMean 3.6 3.6 3.6 3.4 3.6 3.4 2.8 3.2 3.0
Median 3.1 3.0 3.0 2.9 3.0 2.9 2.7 2.8 2.9
* -- Indicates the question is one of the five equally-weighted components of the index of sentiment.
(p) -- Preliminary
(f) -- Final
Note: Figures on financial, business, and buying conditions are the percent reporting 'good times' (or
'better') minus the percent reporting 'bad times' (or 'worse'), plus 100. Expected change in
unemployment is the fraction expecting unemployment to rise minus the fraction expecting
unemployment to fall, plus 100.

rose noticeably, with more respondents citing low interest rates as a reason tobuy.
In December, the mean of expected inflation over the next twelve months rose0.6 percentage point, to 1.6 percent, reversing its decline in November butremaining near its lowest level since the late 1950s. The median jumped1.2 percentage points, also to 1.6 percent. By contrast, both the mean and themedian of expected inflation over the next five years at 3 and 2.9 percentrespectively, were about unchanged in early December,.
Manufacturers' Inventories
The book value of manufacturers' inventories decreased at an annual rate of$23.8 billion in October following a $51.5 billion liquidation in September.Shipments increased 2.2 percent in October, and theinventory-sales ratiodropped to 1.40 months.
Durable goods inventories fell in every category except aircraft, with the mostnotable drawdown recorded at manufacturers of computers and electronicproducts. Although inventory-shipments ratios also moved down for everycategory except aircraft, stocks generally remain quite bloated relative toshipments, with October stock-to-shipments ratios in most categoriesexceeding the August reading. Nondurable goods inventories fell at a$9 billion pace in October, led by a large liquidation at petroleum and coalproducers. The inventory-shipments ratio in the nondurable goods sector inOctober was 1.13 months, greater than the August reading of 1.12 months.
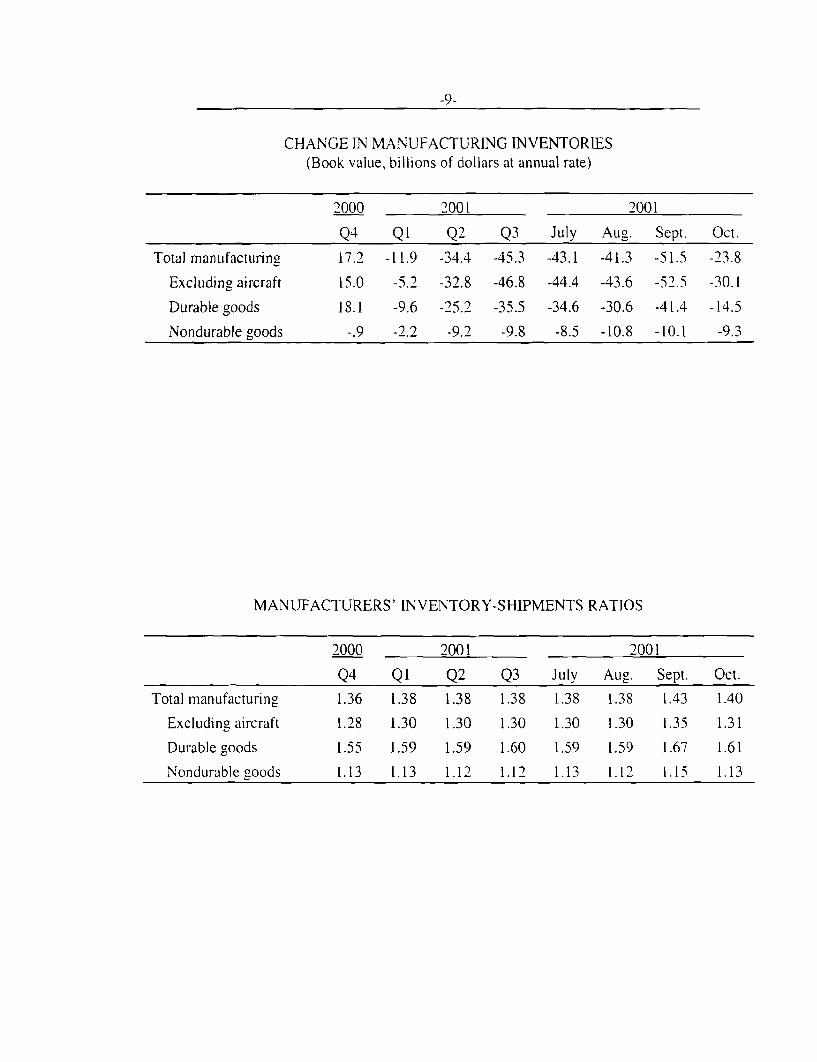
CHANGE IN MANUFACTURING INVENTORIES(Book value, billions of dollars at annual rate)
Total manufacturing
Excluding aircraft
Durable goods
Nondurable goods
2000
Q4
17.2
15.0
18.1
-.9
2001
QI Q2 Q3
-11.9 -34.4 -45.3
-5.2 -32.8 -46.8
-9.6 -25.2 -35.5
-2.2 -9.2 -9.8
MANUFACTURERS' INVENTORY-SHIPMENTS RATIOS
Total manufacturing
Excluding aircraft
Durable goods
Nondurable goods
2000
Q41.36
1.28
1.55
1.13
2001
QI Q2 Q3
1.38 1.38 1.38
1.30 1.30 1.30
1.59 1.59 1.60
1.13 1.12 1.12
July
-43.1
-44.4
-34.6
-8.5
2001
. Sept.
3 -51.5
6 -52.5
6 -41.4
8 -10.1
Aug
-41.
-43.
-30.
-10.
Oct.
-23.8
-30.1
-14.5
-9.3
July
1.38
1.30
1.59
1.13
Aug
1.3!
1.3(
1.5(
1.1
2001
. Sept.
8 1.43
0 1.35
9 1.67
2 1.15
Oct.
1.40
1.31
1.61
1.13

The International Economy
U.S. International Financial Transactions
We noted in the Greenbook that foreign private net purchases of U.S. securitiesfell substantially in the third quarter, with the falloff particularly strong inSeptember. Preliminary data now in hand indicate that foreign purchasesrebounded significantly in October, soaring to $66 billion (line 4 of the"Summary of U.S. International Transactions" table). The increases came inevery major category of security, but demand for agency bonds was mostdramatic as foreigners acquired a record $25 billion of these securities (line 4b).Agency bond issuance remained strong in October and included Freddy Mac'squarterly euro reference note. Foreigners returned to Treasuries in October andmade net acquisitions of $14 billion (line 4a), largely in Treasury bonds. Netforeign purchases of corporate bonds amounted to $20 billion (line 4c)-anumber more in line with levels recorded before the September terrorist attacks.Foreigners also resumed net purchases of U.S. stocks, buying $7 billion (line4b) in contrast to unusual net sales of $12 billion (revised) in September.
U.S. investors bought net $4 billion of foreign securities in October (line 5)compared with large net sales in September and the third quarter. The Octoberpurchases were mostly in foreign stocks (line 5b).
Foreign official assets in the United States increased $6 billion in October(line 1). The increase was attributed primarily to Japan.

Summary of U.S. International Transactions(Billions of dollars, not seasonally adjusted except as noted)
2000 20011999 2000 1 2
Q4 Ql Q2 Q3 Sept Oct
Official financial flows1. Change in foreign official assets
in the U.S. (increase. -)
a. G-10 countries
b. OPEC countriesc. All other countries
2. Change in U.S. official reserveassets (decrease, +)
Private financial flows
Banks3. Change in net foreign positions
of banking offices in the U.S!
Securities'4. Foreign net purchases of U.S.
securities (+)a. Treasury securitiesb. Agency bonds
c. Corporate and municipal bondsd. Corporate stocks 3
5. U.S. net acquisitions (-) offoreign securitiesa. Bonds
b. Stock purchasesc. Stock swaps'
Other flows (quarterly data, s.a.)
6. U.S. direct investment (-) abroad7. Foreign direct investment in U.S.8. Foreign holdings of U.S. currency
9. Other (inflow. -* )
U.S. current account balance (s.a.)Capital account balance (s.a.)'Statistical discrepancy (s.a.)
55.0 39.3 -5.4 4.8 -21.3 13.2 9.6 6.3
46.4 39.6 -4.0 4.6 -20.0 16.8 12.7 5.9
49.7 12.3 -.8 -5.5 -6.1 -5.6 1.6 10.5
2.0 10.7 .6 .8 -2.1 -4.7 -3.7 1.5
-5.3 16.6 -3.8 9.2 -11.8 27.0 14.8 -6.1
8.6 -.3 -1.4 .2 -1.3 -3.6 -3.1 .4
321.7 404.0 119.1 98.7 146.0 n.a. ...
-12.4 -6.8 13.3 -79.9 29.0 -12.1 -36.5 -28.4
333.2-19.9
71.9
158.8122.4
435.7-52.4111.9
182.1194.0
-112.9 -101.1-5.7 -4.115.6 -13.1
-122.9 -84.0
-155.4 -152.4301.0 287.7
22.4 1.1
-54.2 -60.0
-324.4-3.5
-48.8
-444.7.7.7
117.8-10.138.3
50.838.8
-17.83.33.6
-24.7
-39.184.76.2
-46.0
-116.3.2
2.4
148.9.6
38.8
68.940.7
-27.1-2.0
-22.6-2.6
-40.952.52.3
42.9
-111.8.2
8.1
125.8-8.529.470.434.5
-43.58.8
-18.1-34.2
-35.667.22.8
.3
-106.5.2
-18.4
.3-4.06.39.9
-11.8
14.610.34.2
.0
NOTF. The sum of official and private financial flows. the current account balance, the capital account balance, andthe statistical discrepancy is zero. Details may not sum to totals because of rounding.
1. Changes in dollar-denominated positions of all depository institutions and bank holding companies plus certaintransactions between broker-dealers and unaffiliated foreigners (particularly borrowing and lending under repurchaseagreements). Includes changes in custody liabilities other than U.S. Treasury bills.
2 Includes commissions on securities transactions and excludes adjustments BEA makes to account forincomplete cmerage: therefore does not match exactly the data on U.S. international transactions published by theDepartment ol Commerce.
3. Includes (4d) or represents (5c) stocksacquired through mergers.4. Transactions by nonbanking concerns and other banking and official transactions not shown elsewhere plus
.amounts resulting from adjustments made by the Department of Commerce and revisions in lines I through 5 sincepublication of the quarterly data in the Survey of Current Business
5 Consists of transactions in nonproduced nonfinancial assets and capital transfers.n.a. Not aailable Not applicable

III-T-l
Selected Financial Market Quotations
(One-day quotes in percent except as noted)
Instrument
Short-term
FOMC intended federal funds rate
Treasury bills I3-month6-month
Commercial paperI-month3-month
Large negotiable CDs1-month3-month6-month
Eurodollar deposits -1-month3-month
Bank prime rate
Intermediate- and long-termU.S. Treasury 3
2-year10-year30-year
U.S. Treasury 10-year indexed note
Municipal revenue (Bond Buyer) 4
Private instruments10-year swap10-year FNMA10-vear AA 510-vear BBB 5High yield 6
Home mortgages i FHLMC survey rate30-year fixedI-year adjustable
ige to Dec. 6 fromates (percentage pointsi
2001 2001Sept. 10 Nov. 5
6.50 3.50 2.50 2.00 -4.50 -1.50
5.66 3.19 1.97 1.72 -3.94 -1.475.94 3.13 1.91 1.87 -4.07 -1.26
6.56 3.42 2.11 1.89 -4.67 -1.536.56 3.24 2.04 1.80 -4.76 -1.44
-4.65 -1.47-4.81 -1.34-4.86 -1.21
-4.68 -1.46-4.78 -1.35
-4.50 -1.50
8.14 6.89 6.56 7.02 -1.127.22 5.64 5.26 5.22 -2.00
.13 46-.42 -04
Stock exchange index
Do,-Jones Industrial
S&P 500 Composite
Nasdaq iOTC)
Russell 2000
Wilshire 5000
:e to Dec. 6ed dates toercenti
Record 2001 2001Level Date Sept. 10 Nov. 5 Dec. 6 high Sept. 10 Nov. 5
11.723 1-14-00 9.606 0.441 10.099 -13.85 5.14 6.'7
1.527 3-24-00 1.093 1.103 1.167 -23.59 6.82 583
5.049 3-10-00 1.69 1.794 2.054 -59.31 21.17 14.53
606 3-9-00 441 438 482 -20.44 9.42 10.21
14,752 3-24-00 10.104 10.157 10.822 -26.64 -7,10 6 55
1. Secondary market.. Bid rates for Eurodollar deposits collected around 9:30 a.m. Eastern time.
3. Denved from a smoothed Treasury \ield cure estimated using off-the-run securities.4. Most recent Thursday quote.
. Denved from smoothed corporate yield cur'es estimated using Merrill L.nch bond data.(. Merrill L.nch 175 high-1ieid bond inde\ composite7. For tteek ending Frida preu ious to dale sho n.
lune 26. 2(00 is the day before the FOM(" :neelnL that ended !he moti recent period of pohlic tightening.September 10. 2001 is the da. before the terruonsi attacksNovember 5. 2001 is the dav before the most recent FOM( mieetmin
SN\ I) \\