Embed Size (px)
Citation preview
Prefatory Note
The attached document represents the most complete and accurate version available based on original copies culled from the files of the FOMC Secretariat at the Board of Governors of the Federal Reserve System. This electronic document was created through a comprehensive digitization process which included identifying the best-preserved paper copies, scanning those copies,1 and then making the scanned versions text-searchable.2 Though a stringent quality assurance process was employed, some imperfections may remain.
Please note that this document may contain occasional gaps in the text. These gaps are the result of a redaction process that removed information obtained on a confidential basis. All redacted passages are exempt from disclosure under applicable provisions of the Freedom of Information Act.
1 In some cases, original copies needed to be photocopied before being scanned into electronic format. All scanned images were deskewed (to remove the effects of printer- and scanner-introduced tilting) and lightly cleaned (to remove dark spots caused by staple holes, hole punches, and other blemishes caused after initial printing). 2 A two-step process was used. An advanced optimal character recognition computer program (OCR) first created electronic text from the document image. Where the OCR results were inconclusive, staff checked and corrected the text as necessary. Please note that the numbers and text in charts and tables were not reliably recognized by the OCR process and were not checked or corrected by staff.

CONFIDENTIAL (FR)CLASS III - FOMC
August 16, 1991
SUPPLEMENT
CURRENT ECONOMIC AND FINANCIAL CONDITIONS
Prepared for theFederal Open Market Committee
By the StaffBoard of Governors
of the Federal Reserve System
TABLE OF CONTENTS
Page
THE DOMESTIC NONFINANCIAL ECONOMY
Industrial production and capacity utilization . . . .Motor vehicle sales. . . . . . . . . . . . . . . . . .Consumer sentiment . . . . . . . . . . . . . . . . . .Housing markets . . . . . . . . . . . . . . . . . . .Real GNP in 1991:Q2 . . . . . . . . . . . . . . . . .
Tables
Growth in selected components of industrial productionCapacity utilization in manufacturing . . . . . . ...University of Michigan Survey Research Center:
Survey of consumer attitudes . . . . . . . . . . . .Private housing activity . . . . . . . . . . . . . . .
Charts
Private housing starts . . . . . . . . . . . . . . . .Unemployment insurance . . . . . . . . . . . . . . . .
THE FINANCIAL ECONOMY
Senior financial officer and loan officer surveys. .
Tables
Monetary aggregates . . . . . . . . . . . . . .Selected financial market quotations . . . . . . .
THE INTERNATIONAL ECONOMY
U.S. merchandise trade through June 1991 . . . .
Table
Merchandise trade: Census-based data. . . . . . .U.S. merchandise trade: summary of months
and quarters . . . . . . . . . . . . . . . . . .
. . 11
. . 12
. . 13

SUPPLEMENTAL NOTES
THE DOMESTIC NONFINANCIAL ECONOMY
Industrial Production and Capacity Utilization
The index of industrial production rose 0.5 percent in July.
During the past four months, the index has retraced nearly one-half of
the decline that occurred between last September and March of this
year. Since April, rising output of motor vehicles, construction
supplies, and related materials have been major factors in the
recovery of industrial production.
Last month, a 10 percent rise in motor vehicle assemblies
contributed 0.15 percentage point to the total increase in the index.
Excluding motor vehicles, output of durable consumer goods declined
because the production of appliances, which surged in June, fell back
in July; nonetheless, the level of appliance output in July was about
9 percent above its low of last December. In addition, production of
carpeting and furniture was flat in July after a strong showing in
June. The output of nondurable consumer goods edged up again in July,
mainly because of another gain in apparel production. Production of
business equipment firmed a bit last month, although apart from the
rise in motor vehicle assemblies and a surge in production of
turbines, the gains were small.
Production of construction supplies rose 0.6 percent in July,
somewhat less than the average monthly gain of more than 1 percent in
the preceding three months. A further increase in the production of
lumber was the principal contributor to the overall rise. Despite the
recent strong gains, the level of output of construction supplies was
still nearly 10 percent below its most recent high, which occurred in
early 1990.

-2-
Output of materials rose another 0.7 percent in July. Within
durables, materials related to motor vehicle production posted further
gains, along with basic metals. Among nondurables, textiles showed
another significant gain, and output of paper rose sharply for a
second month. Production of energy materials was little changed in
July: Increases in coal, electricity generation, and crude oil were
nearly offset by a sharp curtailment in output of natural gas.
Production in manufacturing advanced 0.6 percent in July: as a
result, capacity utilization in manufacturing increased 0.2 percentage
point to 78.4 percent. The overall factory operating rate remains a
percentage point below its level at year-end 1990 and 6-3/4 percentage
points below its recent high in January 1989.
Motor Vehicle Sales
After running close to 10-1/2 million units (annual rate) in June
and July, sales of new domestic cars and light trucks were 10 million
units (annual rate) during the first ten-day selling period in
August. 1 Auto sales dropped back to a 6-1/2 million unit rate after
averaging 6-3/4 million units (annual rate) in the preceding two
months; truck sales also moved slightly lower than their June-July
average.
Consumer Sentiment
Based on the first 323 (of an eventual 500) responses to the
University of Michigan's survey, the composite index of consumer
sentiment fell 3.3 points to a level of 79.6. Much of the slippage
occurred in the "expected conditions" component, although the "current
conditions" component declined as well. Respondents' average expected
1. Ten-day sales are seasonally adjusted using FRB factors proratedto BEA's monthly seasonal factors.

-3-
price increase during the next 12 months remained at 38 percent, but
the average expected annual increase over the next five to ten years
dropped from 5.5 percent in July to 4.8 percent in August.
Housing Markets
Private housing starts recovered further in July. As has been
the case so far in the current upturn, an increase in single-family
construction accounted for almost all the July rise in starts.
Single-family starts reached 894,000 units (annual rate) in July, the
highest level since May 1990. Moreover, permit issuance for single-
family homes rose further to 792,000 units (annual rate). Multifamily
starts edged up in July to 176,000 units (annual rate), a level that
remains close to the 30-year low recorded in May.
On a regional basis, total housing starts in July strengthened
noticeably in the South and were up in the West; in the Northeast, a
steep decline in new homebuilding likely represents a return to a more
sustainable level of activity following a surge in starts in June.
Real GNP in 1991:Q2
Based on the information received to date, the staff expects that
the preliminary estimate of real GNP to be released on August 28 will
be little changed from the advance release, which showed real GNP up
at a 0.4 percent annual rate and real GDP having risen at a
1.2 percent rate. However, the composition of real GNP likely will be
noticeably different than estimated earlier: Inventory liquidation
appears to have been somewhat greater than the BEA anticipated
earlier, and final sales appear to be stronger. The staff is
expecting upward revisions to net merchandise exports and personal
consumption expenditures that should more than offset a downward
adjustment to real spending on nonresidential construction.

-4-
GROWTH IN SELECTED COMPONENTS OF INDUSTRIAL PRODUCTION(Percent change from preceding comparable period)
Proportion 1990 1991 1991in
totalIP
1990:Q4 19901 Q4 Q1 Q2 May June July
---- Annual rate----
Total index 100.0 0.3 -7.0 -9.7 2.2 0.8 0.6 0.5
Excluding motor vehiclesand parts 96.2 0.8 -4.9 -8.6 0.7 0.7 0.5 0.3
Products, total 61.4 0.6 -5.3 -8.8 1.6 0.7 0.4 0.3Final products 46.9 1.1 -5.3 -7.3 2.2 0.4 0.3 0.4Consumer goods 25.7 -0.7 -3.8 -7.0 5.3 0.9 0.6 0.4
Automotive products 2.2 -7.3 -37.6 -24.6 40.3 3.2 2.8 3.4Other consumer goods 23.5 0.0 0.4 -5.3 2.6 0.7 0.4 0.1
Durables 3.0 -3.9 -16.2 -10.9 11.0 0.4 2.4 -0.6Nondurables 20.5 0.6 3.2 -4.4 1.4 0.8 0.1 0.2
Energy 2.7 -2.3 -2.4 -5.5 4.2 4.1 -1.1 0.4Other 17.8 1.0 4.1 -4.3 1.0 0.3 0.3 0.2
Business equipment 15.8 4.2 -7.6 -7.4 2.0 0.2 -0.0 0.8Motor vehicles 1.0 -9.4 -49.8 -42.2 66.6 4.2 3.3 6.4Other business equipment 14.8 5.3 -3.4 -4.6 -1.2 -0.1 -0.3 0.4
and related 6.6 5.1 0.4 7.0 0.3 -0.2 -0.7 0.2Industrial 4.3 1.3 -10.2 -14.2 -2.9 0.0 -0.3 1.1
Defense and space equip. 4.8 -0.2 -4.7 -8.6 -11.2 -1.1 -0.9 -0.7Construction supplies 5.7 -4.6 -12.0 -21.2 -0.3 1.1 1.2 0.6
Materials 38.6 -0.1 -9.7 -11.0 3.2 1.2 1.0 0.7Durable 19.6 -0.5 -13.9 -16.7 3.1 1.2 0.9 1.0Nondurable 8.8 0.5 -5.5 -7.0 1.1 0.7 1.2 0.7Energy 10.2 0.0 -4.5 -3.0 5.1 1.4 1.0 0.2
Memorandum:Major industry groups:Manufacturing 84.9 0.3 -7.4 -10.4 1.9 0.6 0.7 0.6
Excluding motor vehiclesand parts 81.0 0.9 -4.9 -9.2 0.1 0.4 0.6 0.4
Mining 7.5 2.4 -1.4 -4.0 -3.0 -0.3 1.9 -0.9Utilities 7.6 -2.1 -7.6 -7.6 10.2 4.8 -1.4 0.7
1. From the final quarter of the previous period to the final quarter of the periodindicated.
CAPACITY UTILIZATION IN MANUFACTURING(Percent of capacity; seasonally adjusted)
1967-89 1988-89 1990 1991
Avg. High July May June July
Total industry 82.2 85.0 83.8 79.1 79.5 79.7
Manufacturing 81.5 85.1 83.1 77.8 78.2 78.4
Primary processing 82.3 89.0 86.1 79.1 80.1 80.8Advanced processing 81.1 83.6 81.8 77.3 77.4 77.5

August 16, 1991
UNIVERSITY OF MICHIGAN SURVEY RESEARCH CENTER: SURVEY OF CONSUMER ATTITUDES(Not seasonally adjusted)
1990 1991 1991 1991 1991 1991 1991 1991 1991Dec Jan Feb Mar Apr May Jun Jul Aug
Indexes of consumer sentiment (Feb. 1966-100)
Composite of current and expected conditions 65.5 66.8 70.4 87.7 81.8 78.3 82.1 82.9 79.6
Current conditionsExpected conditions
84.0 84.9 83.7 92.7 92.8 89.0 91.9 96.153.7 55.2 62.0 84.5 74.7 71.5 75.9 74.4
Personal financial situation
Now compared with 12 months ago*Expected in 12 months*
Expected business conditions
Next 12 months*Next 5 years*
90.772.4
98 104 96 102 99 102 104 103 101110 118 120 126 122 124 120 119 111
113 98100 79
Appraisal of buying conditions
CarsLarge household appliances*Houses
willingness to use creditwillingness to use savings
102 9981 80
104 105 114 138 132 127 129 134 134119 115 120 137 141 128 133 145 134114 126 126 148 140 149 148 148 148
36 3144 50
Average expected increase in prices duringthe next 12 months
Average expected increase in pricesover the next 5 to 10 years
(per year)
5.5 5.1 4.8 4.5 4.3 4.6 4.8 3.8 3.8
5.9 5.6 6.0 6.2 5.2 5.5 5.8 5.5 4.8
* -- Indicates the question is one of theNote: Figures on financial, business, and
'better') minus the percent reporting
five equally-weighted components ofbuying conditions are the percent r'bad times' (or 'worse'), plus 100.
the index of sentiment.eporting 'good times' (or

-6-
PRIVATE HOUSING ACTIVITY(Seasonally adjusted annual rates; millions of units)
1990 1990 1991 1991
Annual Q4 Q1 Q2r Mayr Juner Julyp
All unitsPermits 1.11 .90 .86 .96 .97 1.00 1.00Starts 1.19 1.04 .92 1.00 .98 1.03 1.07
Single-family unitsPermits .79 .67 .67 .76 .76 .78 .79Starts .90 .79 .73 .83 .83 .86 .89
SalesNew homes .53 .47 .47 .51 .49 .53 n.a.Existing homes 3.30 3.12 3.09 3.48 3.54 3.59 n.a.
Multifamily unitsPermits .32 .23 .19 .20 .21 .22 .21Starts .30 .26 .19 .17 .15 .17 .18
Vacancy rateRental units 9.1 9.0 9.4 9.4 n.a. n.a. n.a.Owned units 7.2 6.6 7.6 7.1 n.a. n.a. n.a.
1. Percent. Owned units consist mainly of condominiums.p Preliminary. r Revised estimates. n.a. Not available.
PRIVATE HOUSING STARTS(Seasonally adjusted annual rate)
Millions of units
1982 1983 1984 1985 1986 1987 1988 1989 1990 1991

Unemployment Insurance(Weekly data; seasonally adjusted, FRB basis <1>)
Initial Claims
All regular programs Aug3
433.6 j 500
1984 1985 1986 1987 1988 1989 1990 1991
450
400
350
300
250
Insured Unemployment Millionsr5.0
All regular programsJul 27
3.43
1990 1991
<1> Only the state program components of these series areseasonally adjusted.
Thousands700
650
600
550
1981
1981 1982 1983 1984 1985 1986 1987 1988

-8-
THE FINANCIAL ECONOMY
Senior Financial Officer and Loan Officer Surveys 2
In view of the unusual weakness of the monetary aggregates and
bank credit in recent months, the System recently conducted two
surveys of large commercial banks, requesting information on retail
deposit behavior, loan demand, and lending standards.
On the Senior Financial Officer Survey, more than half of the 45
banks that have responded to date indicated that retail deposit growth
at their institution has been unusually weak since the end of May.
The most frequently cited reason for the unusually slow growth was the
more attractive returns available on nondeposit instruments, such as
bond funds and Treasury securities: Of the banks experiencing
unusually weak deposit growth, about three-quarters considered this a
factor. In addition, more than half of them attributed some of the
weakness to changes in their own deposit rates, fee structures, or
promotional expenditures. Indeed, banks with slow deposit growth more
often reported that they had lowered their deposit rates relative to
other banks in their market, had increased fees, or reduced
advertising and other promotional efforts. Other reasons for the slow
growth--including the condition of the local economy, rates and terms
offered by other depositories, concerns about deposit safety, and
changes in their own promotion of nondeposit investments--also were
given, but less frequently.
Several questions on the survey dealt with possible reasons for
changes in banks' demands for retail deposits. About 20 percent of
respondents indicated that increased deposit insurance premiums had
2. A more extensive analysis of the survey results will be availablenext week.

-9-
reduced somewhat their demands for retail deposits. And a handful of
the eighteen banks that had acquired retail deposits from failed
depository institutions indicated that this had made them less
aggressive in seeking additional deposits. A larger share, about a
third of the surveyed banks, reported that the weak pace of asset
growth had decreased their demands for retail deposits, and about half
said it had reduced their demands for wholesale liabilities.
With regard to the strength of customers' demands for loans,
about a third of the banks indicated that large corporations had
exhibited weaker-than-normal loan demand in recent months, with
reduced inventory and fixed investment financing needs most often
cited as the reasons. Loan demand on the part of middle-market and
small business customers appeared to have been about the same as
usual, with roughly the same number of respondents reporting increased
as decreased demand. In the home mortgage and consumer markets, the
balance tipped toward those reporting stronger demands for credit. In
general, those banks reporting unusually slow deposit growth tended to
be a bit more likely to report weaker loan demand.
Results from the Senior Loan Officer Survey show a further
reduction in the net share of banks that had tightened credit
availability over the last three months. Only 10 to 15 percent of
domestic respondents reported some tightening of credit standards for
business borrowers, and a couple indicated some easing. The waning of
the trend toward tightening was even more evident at foreign-related
institutions.
The number of respondent banks imposing stricter terms on the
loans that are being made was higher than the number tightening
standards, but it, too, was down noticeably from that in the May
survey. In the commercial real estate area, the tightening of
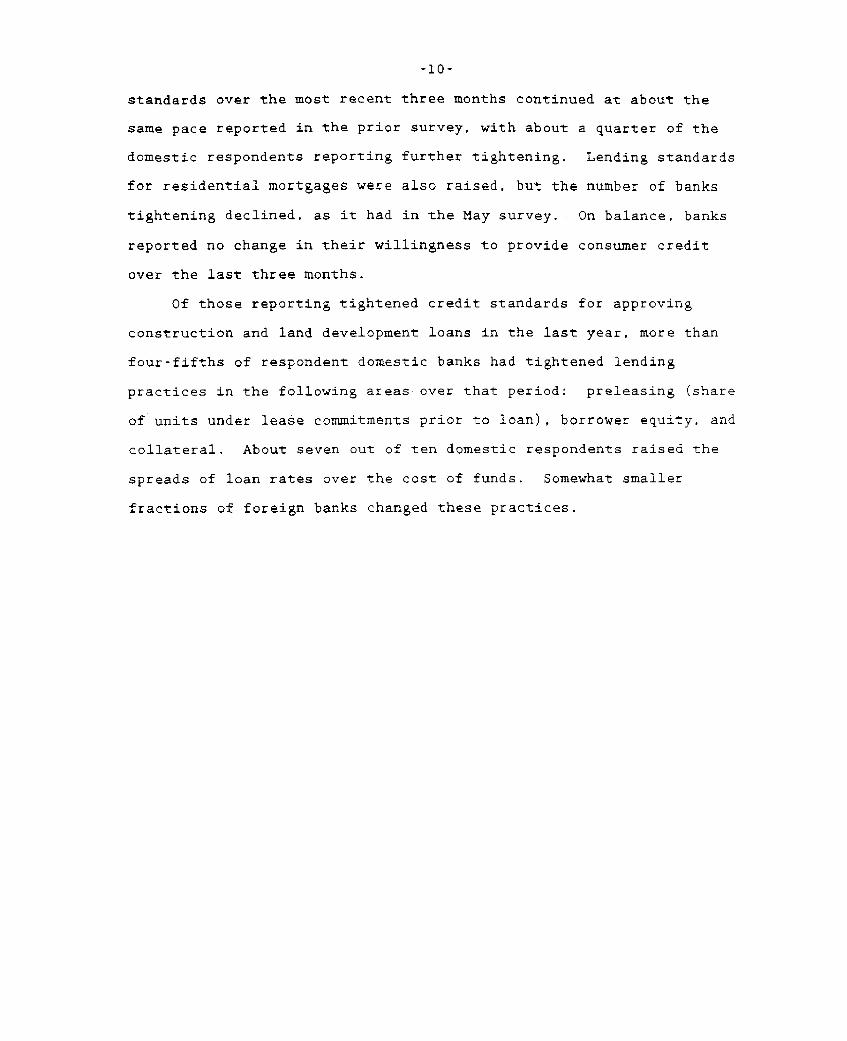
-10-
standards over the most recent three months continued at about the
same pace reported in the prior survey, with about a quarter of the
domestic respondents reporting further tightening. Lending standards
for residential mortgages were also raised, but the number of banks
tightening declined, as it had in the May survey. On balance, banks
reported no change in their willingness to provide consumer credit
over the last three months.
Of those reporting tightened credit standards for approving
construction and land development loans in the last year, more than
four-fifths of respondent domestic banks had tightened lending
practices in the following areas over that period: preleasing (share
of units under lease commitments prior to loan), borrower equity, and
collateral. About seven out of ten domestic respondents raised the
spreads of loan rates over the cost of funds. Somewhat smaller
fractions of foreign banks changed these practices.

-11-
MONETARY AGGREGATES(based on seasonally adjusted data unless otherwise noted)
Growth1991 1991 1991 1991 1991 04 90-
19901 Q1 Q2 May Jun Jul p Jul 91p
------------ Percent change at annual rates---------------------
4.2 5.9 7.3 13.53.8 3.4 4.6 4.21.7 4.0 1.8 0.5
9.6 1.81.4 -3.7
-2.1 -4.6
Levels------------ Percent change at annual rates----------- bil. s
Jul 91p
Selected components
4. Ml-A
5. Currency6. Demand deposits
5.7 3.9 7.3
11.0 15.3 3.9 0.9-0.6 -2.5 4.5 12.6
6.4 -2.0 545.5
3.7 6.1 258.99.9 -9.0 278.9
7. Other checkable deposits
8. M2 minus M12
9. Overnight RPs and Eurodollars, NSA10. General purpose and broker/dealer money
market mutual fund shares11. Commercial banks12. Savings deposits plus MMDAs
3
13. Small time deposits14. Thrift institutions15. Savings deposits plus MMOAs
3
16. Small time deposits
17. M3 minus M24
18. Large time deposits19. At commercial banks, net
5
20. At thrift institutions21. Institution-only money market
mutual fund shares22. Term RPs, NSA23. Term Eurodollars, NSA
MEMORANDA:
24. Managed liabilities at commercialbanks (25+261
25. Large time deposits, gross26. Nondeposit funds27. Net due to related foreign
institutions28. Other
7
29. U.S. government deposits at comercialbanks
a
3.5 6.1 13.5 24.6 15.2 8.5 314.2
3.7 2.6 3.7 1.1 -1.3 -5.6 2528.3
3.0 -42.3 -16.0 -34.7 -23.2 -58.4 62.6
11.09.97.5
12.4-5.5-2.2-7.3
18.28.27.58.9
-6.3-0.7-9.8
6.67.3
16.7-1.8-1.518.4
-13.7
3.05.8
17.3-5.8-0.122.9
-14.9
-2.68.7
16.31.0
-11.211.7
-26.5
-16.15.2
11.6-1.4-9.010.3
-22.1
359.41226.6625.6601.0882.1364.5517.7
-6.4 6.7 -10.2 -15.4 -17.4 -8.5 761.3
-9.5-3.5
-23.9
20.2-12.0-12.1
1.211.9-32.1
49.9-32.8
7.9
-7.60.3
-34.8
23.0-25.6-31.2
-8.02.4
-46.3
4.9-16.1-47.5
-11.7-3.6
-42.4
-23.8-34.1
-7.3
-17.3-12.1-38.1
-12.622.911.1
491.8394.1
97.7
141.880.265.7
-----Average monthly change in billions of dollars----
-0.1,-2.62.4
-1.5 -4.9 -2.6 -11.36.4 0.3 1.7 -1.1
-7.9 -5.2 -4.3 -10.2
-4.8 695.8-4.4 447.5-0.4 248.3
2.2 -1.5 -3.7 -4.8 -6.9 -0.4 18.8
0.2 -6.4 -1.5 0.4 -3.3 0.0 229.5
3.1 -3.5 -6.6 8.1 -2.8 20.4
1. Amounts shown are from fourth quarter to fourth quarter.2. Nontransactions M2 is seasonally adjusted as a whole.3. Commercial bank savings deposits excluding MMDAs grew during June and July at rates of 21
percent and 13.9 percent, respectively. At thrift institutions, savings deposits excluding HMOAs grewduring June and July at rates of 11.4 percent and 8 percent, respectively.
4. The non-M2 component of M3 is seasonally adjusted as a whole.5. Net of large denomination time deposits held by money market mutual funds and thrift institutions.6. Dollar amounts shown under memoranda are calculated on an end-month-of-quarter basis.7. Consists of borrowing from other than commercial banks in the form of federal funds purchased, securities
sold under agreements to repurchase, and other liabilities for borrowed money (including borrowing from theFederal Reserve and unaffiliated foreign banks, loan RPs and other minor items). Data are partially estimated.
8. Consists of Treasury demand deposits and note balances at commercial banks.p - preliminary
1. M12. M23. M3
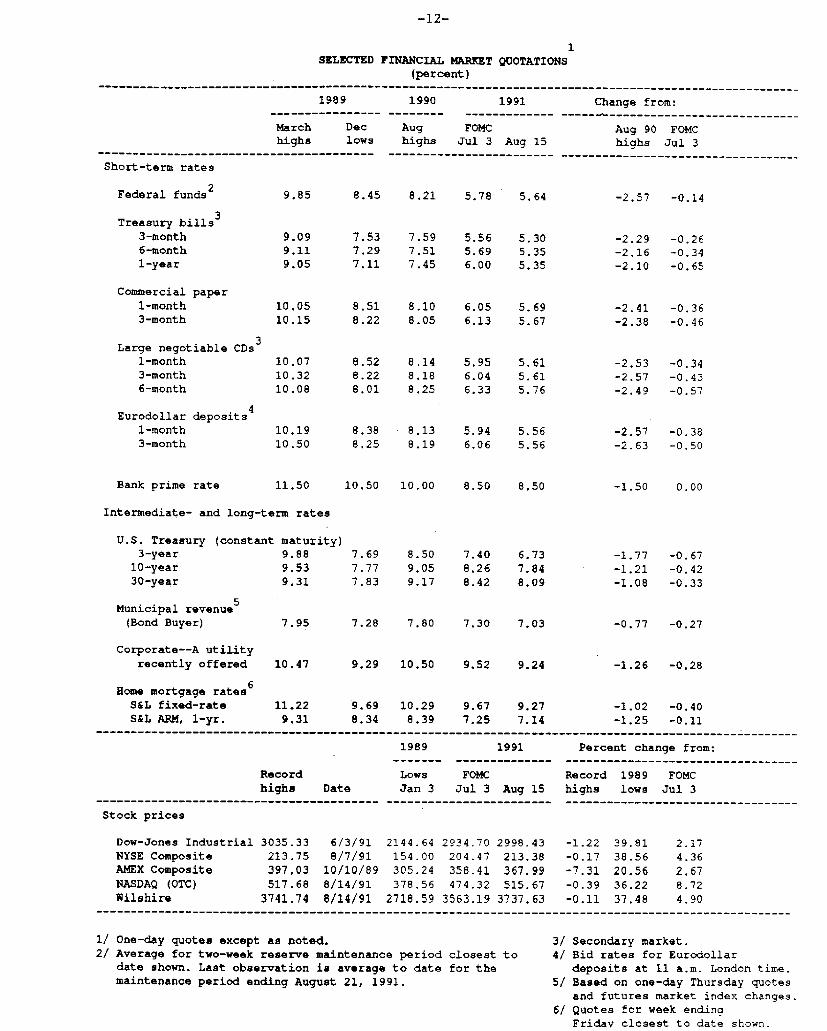
1SELECTED FINANCIAL MARKET QUOTATIONS
(percent)-- -- - -- -- - -- - -- -- - -- - -- -- - -- -- - -- - -- -- - -- - -- -- - -- -- - -- - -- -- - -- -
1989
March Dechighs lows
Short-term rates
1990 1991
Aug FOMChighs Jul 3 Aug 15
Change from:--------------------------------
Aug 90 FOMChighs Jul 3
...................................
Federal funds 2
Treasury bills3
3-month6-month1-year
Commercial paper1-month3-month
Large negotiable CDs 3
1-month3-month6-month
Eurodollar deposits 4
1-month3-month
Bank prime rate
9.85
9.099.119.05
10.0510.15
10.0710.3210.08
10.1910.50
11.50
8.45 8.21 5.78 5.64
7.537.297.11
7.597.517.45
5.565.696.00
-2.57 -0.14
5.305.355.35
-2.29-2.16-2.10
8.51 8.10 6.05 5.698.22 8.05 6.13 5.67
8.528.228.01
8.148.188.25
5.95 5.616.04 5.616.33 5.76
8.38 8.13 5.94 5.568.25 8.19 6.06 5.56
10.50 10.00 8.50 8.50
-0.26-0.34-0.65
-2.41 -0.36
-2.38 -0.46
-2.53-2.57-2.49
-0.34-0.43-0.57
-2.57 -0.38-2.63 -0.50
-1.50 0.00
Intermediate- and long-term rates
U.S. Treasury (constant3-year
10-year30-year
Municipal revenue-(Bond Buyer)
Corporate--A utilityrecently offered
Home mortgage rates6
S&L fixed-rateS&L ARM, 1-yr.
7.95
10.47
11.229.31
7.28 7.80 7.30 7.03
9.29 10.50 9.52 9.24
9.69 10.29 9.67 9.278.34 8.39 7.25 7.14
-0.77 -0.27
-1.26 -0.28
-1.02 -0.40-1.25 -0.11
1989 1991 Percent change from:
Record Lows FOMC Record 1989 FOMChighs Date Jan 3 Jul 3 Aug 15 highs lows Jul 3
Stock prices
Dow-Jones Industrial 3035.33 6/3/91 2144.64 2934.70 2998.43 -1.22 39.81 2.17NYSE Composite 213.75 8/7/91 154.00 204.47 213.38 -0.17 38.56 4.36AMEX Composite 397.03 10/10/89 305.24 358.41 367.99 -7.31 20.56 2.67NASDAQ (OTC) 517.68 8/14/91 378.56 474.32 515.67 -0.39 36.22 8.72Wilshire 3741.74 8/14/91 2718.59 3563.19 3737.63 -0.11 37.48 4.90
.....................................................................................................
One-day quotes except as noted.Average for two-week reserve maintenance period closest todate shown. Last observation is average to date for themaintenance period ending August 21, 1991.
3/ Secondary market.4/ Bid rates for Eurodollar
deposits at 11 a.m. London time.
5/ Based on one-day Thursday quotesand futures market index changes.
6/ Quotes for week endingFriday closest to date shown.
maturity)9.889.539.31
7.69
7.777.83
8.509,059.17
7.408.26
8.42
6.737.848.09
-1.77-1.21
-1.08
-0.67-0.42
-0.33
-12-

-13-
THE INTERNATIONAL ECONOMY
U.S. Merchandise Trade through June 1991
In June, the U.S. merchandise trade deficit was $4.0 billion
(seasonally adjusted, Census basis), somewhat less than the revised
May deficit of $4.8 billion. (See the tables that follow.) The level
of both exports and imports declined in June. Most of the 1 percent
decline in exports was in agricultural products and industrial
supplies (primarily fuels and chemicals). The 3 percent decrease in
imports was spread across most major trade categories (except
automotive products from Japan).
The deficit narrowed in the second quarter, the third consecutive
quarter of improvement. There was strong growth in the value of
exports (about 4 percent) from the first to second quarters and only a
small increase in the value of imports (less than 1 percent). The
increase in exports was primarily in machinery, commercial aircraft,
and automotive products. The small rise in imports resulted from
increases in foods and capital goods (particularly computers and
aircraft) that were nearly offset by declines in oil and automotive
products. The price of oil declined about $3 per barrel in the second
quarter (and by about $12 per barrel since the fourth quarter); the
quantity of oil rose by 1 million barrels per day from the first-
quarter rate. The reduction in automotive imports was for the third
consecutive quarter. In the second quarter, the decline in automotive
imports was the result of large and nearly offsetting swings in
imports from Japan and Canada: There was a sharp reduction in
shipments from Japan and a large increase in automotive imports from
Canada. In the previous two quarters, all of the decline in
automotive imports was from Canada.

-14-
August 16, 1991
Merchandise Trade: Census-Based Data(in billions of dollars, seasonally adjusted *)
Exports I Imports
Total Ag. NonAg. Total Oil NonOil I Balance
322.4363.8394.5
37.742.240.3
284.7321.6354.2
441.0473.2495.0
38.548.962.2
402.5424.3432.8
-118.5-109.4-100.5
Quarters at annual rates:
1990 Qtr 1234
384.9396.2386.7410.0
43.141.538.537.9
341.8354.7348.2372.1
489.7482.4498.0509.9
63.351.361.972.1
426.4431.1436.1437.7
-104.8-86.2
-111.3-99.8
1991 Qtr 1 407.1 39.3 367.8 474.9 52.9 422.0 -67.82 423.0 38.3 384.7 1 476.2 51.7 424.6 -53.3
Monthly Rates:
31.431.633.332.132.834.232.132.532.035.034.233.3
34.133.634.035.635.334.8
3.73.53.63.33.43.73.23.33.13.13.33.1
3.13.43.33.23.33.1
27.728.129.628.729.430.628.929.228.931.930.930.2
31.030.230.732.531.931.8
41.639.141.739.740.740.141.441.841.344.543.139.9
41.539.138.140.140.138.9
5.85.24.84.14.64.24.25.35.96.36.55.3
5.24.13.84.14.64.2
35.834.036 .935.736.136.037.236.535.438.236.634.6
36.335.034.336.135.434.7
-10.2-7.6-8.4-7.7-8.0-5.9-9.2-9.3-9.3-9.5-8.9-6.6
-7.4-5.5-4.1-4.5-4.8-4.0
--------------------------------------------------------------
A All data are on a revised end-use basis.
Sources U.S. Department of Commerce, Bureau of the Census, Customs Valuation.
198819891990
1990 JanFebMarAprMayJunJulAugSepOctNovDec
1991 JanFebMarAprMayJun

-15-August 16, 1991
U.S. MERCHANDISE TRADE: SUMMARY OF MONTHS AND QUARTERS -- LEVELSBillions of dollars, seasonally adjusted (except as noted), Census-basis Data
1991 1991 1991 1991 1991Feb Mar Apr May Jun
1990 1990 1990 1991 1991Qtr-2 Qtr-3 Qtr-4 Qtr-1 Qtr-2- - - - - - -. - . - - - - - .- .- - - -. - - - . - - - .- - - .- -
TRADE BALANCE (Census-basis) -5504 -4070 -4507 -4790 -4022 -21547 -27821 -24962 -16950 -13319......------------------------------------------------------------------------------------------------------------
EXPORTS, Total (FAS Value) 33599 34031 35632 35271 34839 99052 96684 102506 101774 105742Agricultural 3392 3332 3168 3329 3077 10384 9635 9483 9823 9574Nonagricultural 30208 30699 32464 31942 31762 88669 87049 93023 91951 96168
Ind Supplies (Norag)**Fuels (coal,petrol,etc)ChemicalsGold (Census)Other Ind Supplies
Capital GoodsAircraft & PartsComputers & AccessSem iconductorsOther Capital Gds
9025 8193 8548 8675 80091640 1124 953 1263 10372721 2716 2787 2646 2475332 243 359 249 168
4332 4109 4448 4518 4328
12414 13484 14433 13698 144072236 3003 3392 2726 35982233 2287 2354 2243 22281165 1196 1215 1228 11966779 6998 7472 7501 7385
23131 23541 26308 25942 252313056 3591 4620 4213 32536993 6871 7735 8124 7908620 416 891 833 776
12462 12662 13061 12772 13294
38522 37988 38608 38877 425388661 7914 7716 7710 97176270 6610 6599 6826 68253291 3340 3445 3533 3640
20300 20124 20847 20807 22357
Automotive Products 2604 2906 3383 3478 3451 9896 9113 9376 8625 10313Consumer Goods 3863 3808 3838 3754 3663 10946 10706 11464 11601 11255Other Nonagric Exports 2302 2307 2262 2338 2231 6173 5702 7268 6907 6831
..................................................................................................................
IMPORTS, Total (Customs Value) 39103 38100 40139 40061 38860Petroleum (revised, SA) 4143 3843 4089 4616 4209Nonpetroleum 34960 34257 36050 35445 34651
120599 124505 127468 118724 11906112836 15473 18034 13225 12915
107763 109032 109433 105499 106146
Foods, Feeds,Beverages
Ind Supplies (ex Oil)ChemicalsIron & Steel Mill ProdGold (Census)Other Ind Supplies
Capital GoodsAircraft & PartsComputers S AccessSemiconductorsOther Capital Gds
Automotive ProductsFrom CanadaFrom Other
2060 2118 2364 2333 2297
6613 6274 6869 6665 62471209 1194 1241 1238 1255761 678 784 647 543126 155 165 251 119
4517 4247 4679 4529 4330
9933 9925 10367 10059969 980 1013 1007
2024 2051 2079 22231058 1067 1088 10255883 5827 6186 5805
6658 66041797 20444861 4560
98421088220610185530
6669 6517 66402337 2455 23454332 4062 4295
6744 6422 6471 6389 6993
20133 20237 20532 19860 197803533 3549 3659 3627 37332192 2295 2284 2207 1973238 236 337 520 535
14170 14157 14252 13506 13538
28887 29044 30034 29801 302692679 2481 3196 2797 31085723 5746 5812 6047 65093011 3012 3073 3176 313117474 17805 17953 17781 17521
21893 22495 21483 20551 198267747 8062 6829 5911 7137
14146 14433 14654 14639 12690
Consumer Goods 8485 8049 8508 8409 8144 26141 26621 26682 25101 25060Other Nonpetrol Imports 1211 1287 1274 1462 1481 3966 4212 4231 3798 4218
Memo Items, NSA:Oil Imports: Value*
Volume l bd)*Price ($/bbli•
Passenger Car Imports (NSA)from Canadafrom Japan*from other (residual)
3698 3757 3986 4599 40496.94 6.88 7.76 8.56 8.0619.04 17.62 17.11 17.33 16.75
3490 3879729 1172
1855 1807906 901
37411281
1499962
352213981197927
362614111456759
12434 15233 17810 12783 126338.75 8.40 6.79 7.06 8.13
15.61 19.71 28.51 20.11 17.07
11596 10203 13076 11174 108893893 2879 3669 2767 40894436 4351 5767 5567 41523267 2973 3639 2839 2648
* Unrevised data.'* Agricultural Industrial Supplies (primarily cotton and tobacco are excluded from this line.