Embed Size (px)
Citation preview

Prefatory Note
The attached document represents the most complete and accurate version available based on original copies culled from the files of the FOMC Secretariat at the Board of Governors of the Federal Reserve System. This electronic document was created through a comprehensive digitization process which included identifying the best-preserved paper copies, scanning those copies,1 and then making the scanned versions text-searchable.2 Though a stringent quality assurance process was employed, some imperfections may remain.
Please note that this document may contain occasional gaps in the text. These gaps are the result of a redaction process that removed information obtained on a confidential basis. All redacted passages are exempt from disclosure under applicable provisions of the Freedom of Information Act.
1 In some cases, original copies needed to be photocopied before being scanned into electronic format. All scanned images were deskewed (to remove the effects of printer- and scanner-introduced tilting) and lightly cleaned (to remove dark spots caused by staple holes, hole punches, and other blemishes caused after initial printing). 2 A two-step process was used. An advanced optimal character recognition computer program (OCR) first created electronic text from the document image. Where the OCR results were inconclusive, staff checked and corrected the text as necessary. Please note that the numbers and text in charts and tables were not reliably recognized by the OCR process and were not checked or corrected by staff.

Confidential (FR) Class III FOMC
September 29, 2000
CURRENT ECONOMICAND FINANCIAL CONDITIONS
Supplemental Notes
Prepared for the Federal Open Market Committeeby the staff of the Board of Governors of the Federal Reserve System

Contents
Domestic Nonfinancial Economy .................. .......... 1
Real Gross Domestic Product ............................
Consumer Income and Spending ......................... 3
Prices ........................................... 6
TablesReal Gross Domestic Product and Related Items ............. 2Personal Income .................................. . 4Real Personal Consumption Expenditures ................... 4Michigan Survey of Consumer Attitudes .................... 5PCE Price Indexes .................................... 7Corrections to the Consumer Price Index ................... 8Broad Measures of Inflation ... ........................ 10Surveys of (CPI) Inflation Expectations ................... 10
The Financial Economy
TableSelected Financial Market Quotations ..................... 11
Supplemental Notes
The Domestic Nonfinancial Economy
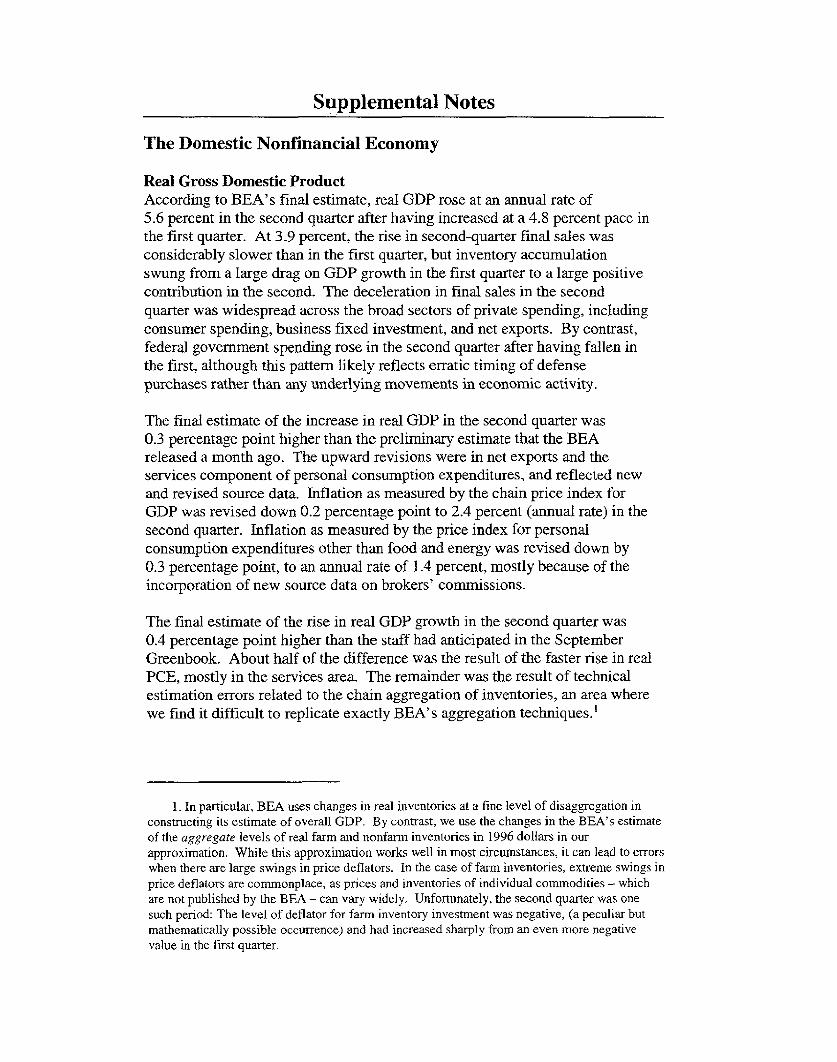
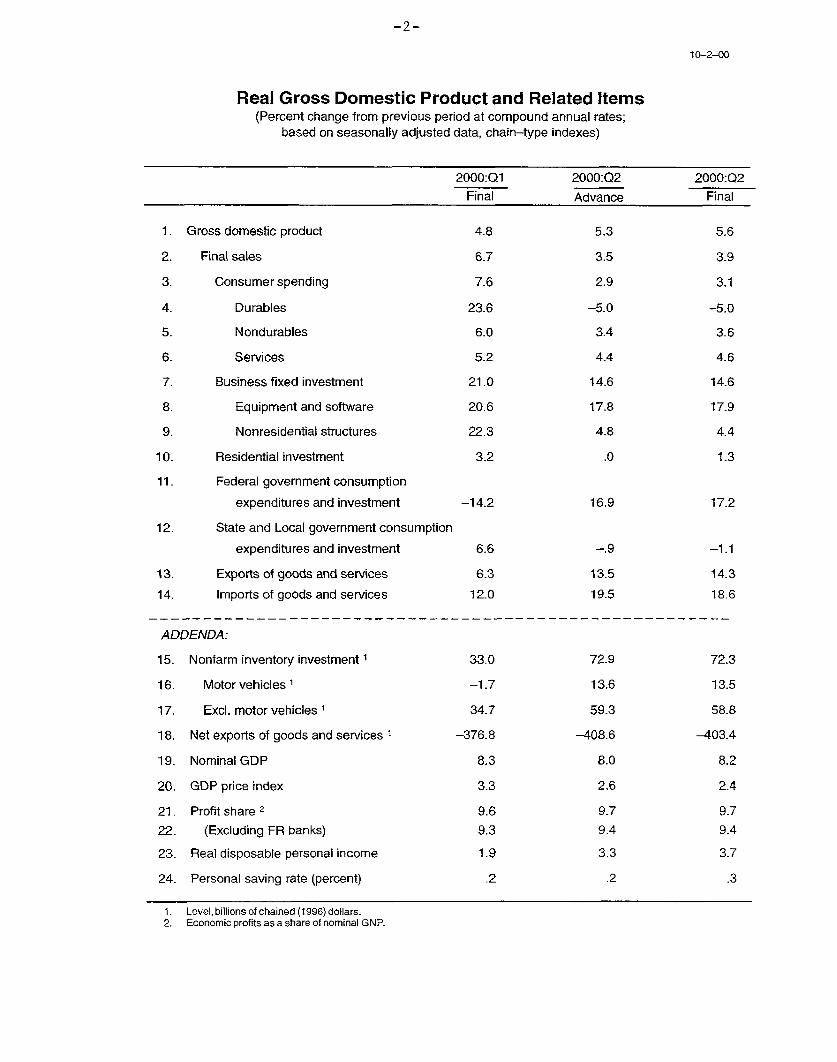
Real Gross Domestic ProductAccording to BEA's final estimate, real GDP rose at an annual rate of5.6 percent in the second quarter after having increased at a 4.8 percent pace inthe first quarter. At 3.9 percent, the rise in second-quarter final sales wasconsiderably slower than in the first quarter, but inventory accumulationswung from a large drag on GDP growth in the first quarter to a large positivecontribution in the second. The deceleration in final sales in the secondquarter was widespread across the broad sectors of private spending, includingconsumer spending, business fixed investment, and net exports. By contrast,federal government spending rose in the second quarter after having fallen inthe first, although this pattern likely reflects erratic timing of defensepurchases rather than any underlying movements in economic activity.
The final estimate of the increase in real GDP in the second quarter was0.3 percentage point higher than the preliminary estimate that the BEAreleased a month ago. The upward revisions were in net exports and theservices component of personal consumption expenditures, and reflected newand revised source data. Inflation as measured by the chain price index forGDP was revised down 0.2 percentage point to 2.4 percent (annual rate) in thesecond quarter. Inflation as measured by the price index for personalconsumption expenditures other than food and energy was revised down by0.3 percentage point, to an annual rate of 1.4 percent, mostly because of theincorporation of new source data on brokers' commissions.
The final estimate of the rise in real GDP growth in the second quarter was0.4 percentage point higher than the staff had anticipated in the SeptemberGreenbook. About half of the difference was the result of the faster rise in realPCE, mostly in the services area. The remainder was the result of technicalestimation errors related to the chain aggregation of inventories, an area wherewe find it difficult to replicate exactly BEA's aggregation techniques.'
1. In particular, BEA uses changes in real inventories at a fine level of disaggregation inconstructing its estimate of overall GDP. By contrast, we use the changes in the BEA's estimateof the aggregate levels of real farm and nonfarm inventories in 1996 dollars in ourapproximation. While this approximation works well in most circumstances, it can lead to errorswhen there are large swings in price deflators. In the case of farm inventories, extreme swings inprice deflators are commonplace, as prices and inventories of individual commodities - whichare not published by the BEA - can vary widely. Unfortunately, the second quarter was onesuch period: The level of deflator for farm inventory investment was negative, (a peculiar butmathematically possible occurrence) and had increased sharply from an even more negativevalue in the first quarter.
-2-
10-2-00
Real Gross Domestic Product and Related Items(Percent change from previous period at compound annual rates;
based on seasonally adjusted data, chain-type indexes)
2000:Q1 2000:Q2 2000:Q2Final Advance Final
1. Gross domestic product 4.8 5.3 5.6
2. Final sales 6.7 3.5 3.9
3. Consumer spending 7.6 2.9 3.1
4. Durables 23.6 -5.0 -5.0
5. Nondurables 6.0 3.4 3.6
6. Services 5.2 4.4 4.6
7. Business fixed investment 21.0 14.6 14.6
8. Equipment and software 20.6 17.8 17.9
9. Nonresidential structures 22.3 4.8 4.4
10. Residential investment 3.2 .0 1.3
11. Federal government consumption
expenditures and investment -14.2 16.9 17.2
12. State and Local government consumption
expenditures and investment 6.6 -. 9 -1.1
13. Exports of goods and services 6.3 13.5 14.3
14. Imports of goods and services 12.0 19.5 18.6
ADDENDA:
15. Nonfarm inventory investment 33.0 72.9 72.3
16. Motor vehicles 1 -1.7 13.6 13.5
17. Excl. motor vehicles 1 34.7 59.3 58.8
18. Net exports of goods and services 1 -376.8 -408.6 -403.4
19. Nominal GDP 8.3 8.0 8.2
20. GDP price index 3.3 2.6 2.4
21. Profit share 2 9.6 9.7 9.7
22. (Excluding FR banks) 9.3 9.4 9.4
23. Real disposable personal income 1.9 3.3 3.7
24. Personal saving rate (percent) .2 .2 .3
1. Level, billions of chained (1996) dollars.2. Economic profits as a share of nominal GNP.

On net, BEA's estimate of second-quarter corporate profits was little changed,as a $3 billion downward revision to domestic profits was offset by a similar-sized upward revision to rest-of-world profits. Thus, corporate profits as ashare of GNP (excluding profits of Federal Reserve Banks) are estimated tohave been 9.4 percent in the second quarter, the same as in the preliminaryrelease and up just slightly from the first quarter. Elsewhere on the incomeside of the accounts, the increase in compensation was revised up as the BEAmade adjustments in reaction to new data from the unemployment insuranceprogram. This revision suggests that there will be a large upward revision tohourly compensation in the nonfarm business sector when those data are nextreleased (in early November); incorporating new data on hours as well, weestimate that the increase in hourly compensation will be 5.9 percent (annualrate), 0.6 percentage point higher than currently published. We estimate thatthe second-quarter increase in productivity in the nonfarm business sector willbe revised up a bit less, 0.4 percentage point.
Consumer Income and SpendingTotal nominal personal income increased 0.4 percent ($34 billion) in August,following a gain of 0.3 percent ($24 billion) in July. Wage and salarydisbursements rose more slowly in August than over the first seven months ofthe year, and farm proprietors' income fell again, reflecting in part lowerfederal farm subsidy payments. In contrast, nonfarm proprietors' incometurned up, and the increases in dividend and interest income and in transferpayments were larger in August than in July. Personal tax and nontaxpayments increased more than $14 billion in August following a gain of just$1 billion in July when tax payments were held down by a tax rebate inMinnesota. Real disposable personal income rose 0.3 percent in August andwas up 2-3/4 percent from a year earlier.
Real personal consumption expenditures rose 0.6 percent in August, and thepersonal saving rate fell to -0.4 percent. Real outlays for durable goodsjumped 2 percent last month reflecting increases in purchases of motorvehicles, appliances, computers, audio and video equipment, andmiscellaneous household furnishings. Real expenditures for nondurable goodsincreased 0.6 percent, held down a bit by a small decline in real outlays forgasoline. However, higher spending was reported in a number of othercategories including food, beverages, apparel, toiletries, and prescriptiondrugs. Real expenditures for services rose 0.4 percent in August, boosted by arebound in outlays for electricity and natural gas following unseasonably coolweather in July. Small spending gains were reported in August for medicalcare, personal business services, and recreation services. Outlays fortransportation services were unchanged last month in part because of a declinein air travel.

PERSONAL INCOME(Average monthly change at an annual rate; billions of dollars)
1999 2000 2000
1999 Q4 Q1 Q2 July Aug.
Total personal income 36.0 49.1 55.8 39.3 24.3 34.2
Wages and salaries 23.7 25.0 27.7 25.9 24.7 14.1Private 21.0 22.7 22.1 23.7 21.6 13.4
Other labor income 1.4 1.6 2.4 2.1 2.5 2.5
Proprietors' income 3.5 8.7 8.5 3.4 -11.4 -.2Farm -.5 .9 2.0 .7 -7.1 -4.9
Rent .1 5.7 1.0 -3.0 -1.4 -.9Dividend 2.1 2.2 2.2 2.0 2.4 5.0Interest 3.8 5.8 9.4 5.2 7.7 9.2
Transfer payments 3.3 1.8 7.2 5.5 1.5 5.5
Less: Personal contributionsfor social insurance 2.0 1.7 2.6 1.7 1.6 1.0
Less: Personal tax and nontaxpayments 7.9 10.8 13.4 12.2 1.0 14.2
Equals: Disposable personal income 28.1 38.4 42.3 27.0 23.4 20.0
Memo: Real disposable income1 16.3 28.1 14.6 19.9 6.9 18.6
1. Billions of chained (1996) dollars.
REAL PERSONAL CONSUMPTION EXPENDITURES(Percent change from the preceding period)
1999 2000 2000
1999 Q4 Q1 Q2 July Aug.
- - - Annual rate - - - Monthly ratePersonal consumption
expenditures 5.6 5.9 7.6 3.1 .4 .6
Durable goods 11.1 13.0 23.6 -5.0 .8 2.0Excluding motor vehicles 14.7 17.0 20.8 4.4 .6 1.8
Nondurable goods 5.9 7.4 6.0 3.6 .6 .6Excluding gasoline 6.2 7.3 7.8 3.7 .4 .7
Services 4.2 3.8 5.2 4.6 .2 .4Excluding energy 4.3 4.8 5.1 4.1 .3 .3
Memo:Personal saving rate
(percent) 2.2 1.5 .2 .3 .0 -.4Real disposable income1 3.1 4.5 1.9 3.7 .1 .3
1. Percent changes derived from billions of chained (1996) dollars.
September 29, 2000
UNIVERSITY OF MICHIGAN SURVEY RESEARCH CENTER: SURVEY OF CONSUMER ATTITUDES(Not seasonally adjusted)
2000 2000 2000 2000 2000 2000 2000 2000 2000Jan. Feb. Mar. Apr. May June July Aug. Sept.
(f)
Indexes of consumer sentiment (Feb. 1966=100)
Composite of current and expected conditions 112.0 111.3 107.1 109.2 110.7 106.4 108.3 107.3 106.8Current conditions 117.3 116.8 115.4 117,8 119.9 115,1 114.2 112.4 112.0Expected conditions 108.6 107,8 101.7 103,7 104.8 100.8 104,5 104.0 103.4
Personal financial situationNow compared with 12 months ago* 135 132 135 130 138 129 130 126 124Expected in 12 months* 141 138 136 137 137 137 139 139 132
Expected business conditionsNext 12 months* 165 161 146 152 153 146 148 151 149Next 5 years* 133 136 128 130 133 123 135 130 136
Appraisal of buying conditionsCars 144 153 134 148 145 138 141 147 145Large household appliances* 169 172 165 176 173 170 167 166 167Houses 152 153 150 151 136 128 136 138 144
Willingness to use credit 51 48 52 54 45 49 44 47 41Willingness to us esavings 85 75 67 70 65 79 70 71 70
Expected unemployment change - next 12 months 104 106 109 109 104 112 111 108 111
Prob. household will lose a job - next 5 years 19 21 20 19 18 21 23 21 21
Expected inflation - next 12 monthsMean 3.5 3.5 3.8 3,5 3.5 3.4 3.7 3.5 3.7Median 3.0 2.9 3.2 3,2 3,0 2.9 3.0 2.7 2.9
Expected inflation - next 5 to 10 yearsMean 3.5 3.3 3.8 3.2 3.4 3.3 3.2 3.5 3.6Median 3.0 2.9 3.1 2.8 2.9 2.8 2.8 2.9 3.0
* -- Indicates the question is one of the five equally-weighted components of the index of sentiment,(p) -- Preliminary(f) -- FinalNote: Figures on financial, business, and buying conditions are the percent reporting 'good times' (or
'better') minus the percent reporting 'bad times' (or 'worse'), plus 100. Expected change inunemployment is the fraction expecting unemployment to rise minus the fraction expectingunemployment to fall, plus 100.

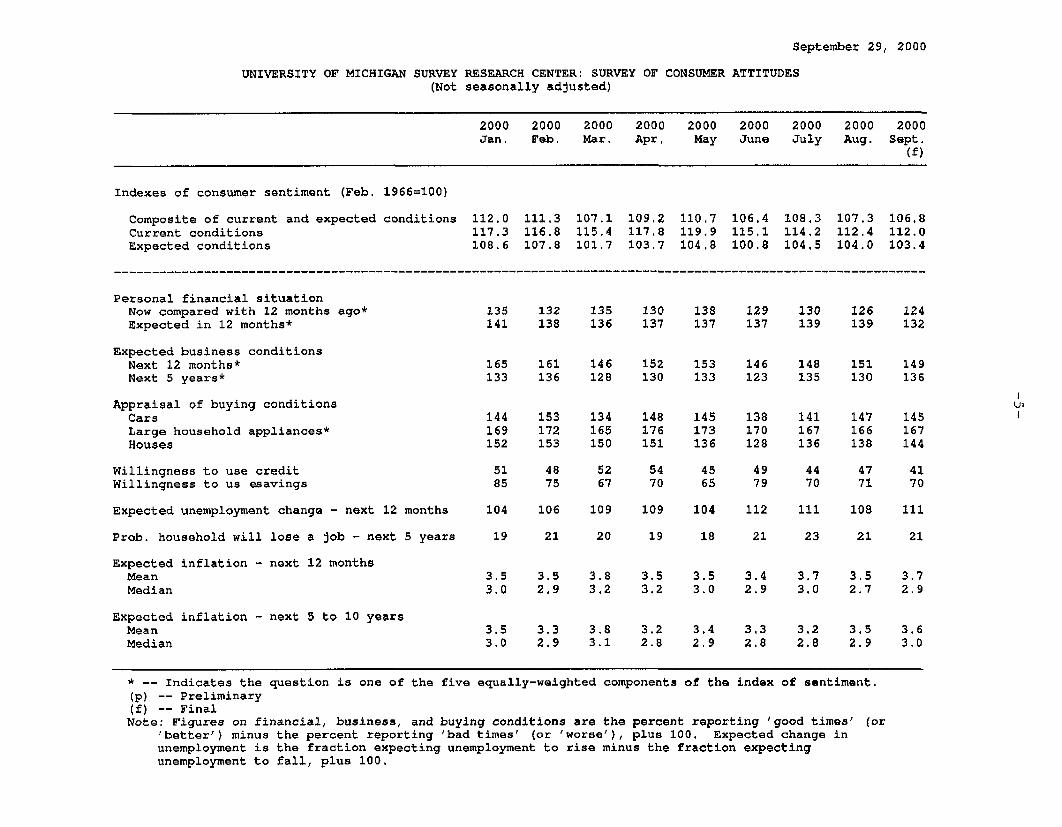
According to the final report, the overall index of consumer sentiment from theMichigan Survey Research Center edged down 1/2 point in September. 2 Still,the index remains in the middle of the narrow, elevated range recorded overthe past two years. In September, consumers were not quite as optimisticabout their financial situations over the next twelve months, but theirassessments of their current personal finances and of buying conditions forlarge household appliances were little changed. The index of expectedbusiness conditions for the next twelve months inched down in September, butthe index for the next five years rebounded after having dipped in August.Among those questions not included in the overall measure, respondents'views about current car buying conditions and expected unemploymentconditions were slightly less favorable in September. In contrast, their viewsof home buying conditions turned significantly more favorable this month.Since June, the index for home buying conditions has reversed most of thedecline that occurred over the first half of this year; nonetheless, the indexremains considerably below the levels recorded in 1998 and the first half of1999.
Inflation expectations moved up a little in September. Both the mean and themedian of expected inflation over the next twelve months increased 0.2percentage point to 3.7 and 2.9 percent, respectively. The mean and median ofexpected inflation over the next five years inched up 0.1 percentage point to3.6 and 3.0 percent, respectively.
PricesThe price index for personal consumption expenditures was unchanged inAugust. Over the past twelve months, the PCE price index rose 2.4 percentcompared with a 1.7 percent increase over the preceding twelve-month period.Faster energy price inflation accounts for most of that acceleration in overallPCE prices. Excluding food and energy items, PCE prices rose 0.1 percent inAugust and were up 1.7 percent over the past twelve months--up about1/4 percentage point from the year-earlier figure. This acceleration in corePCE prices is less pronounced than in the core CPI (on a current-methodsbasis).
Having discovered a programming error that affected the indexes forresidential rent and owners' equivalent rent, as well as the higher-levelaggregates that depend on them, the BLS released corrected CPI data for thefirst eight months of this year. The upper portion of the table below presentsthe corrected levels of the affected indexes in August 2000. As can be seen,
2. In contrast, the preliminary report showed an increase in the index of 1-1/2 points duringthe first two weeks of September. The decline in the index for the month as a whole suggests amoderate deterioration in attitudes in the second half of the month.

-7-
PCE PRICE INDEXES(Percent changes)
From twelvemonths earlier
Aug. Aug.1999 2000
2000
Q1 Q2
2000
July Aug.
-Annual rate- -Monthly rate-
All items
Food and Beverages
Energy
PCE less food and energy
Commodities
Services
Memo:
CPI 1
CPI less food and energy1
1. Data for 1998 are on a current-methods basis
2.4
2.7
13.7
1.7
-.3
2.7
3.4
2.6
3.5
2.4
35.1
2.2
-1.4
3.8
4.1
2.3
2.1
2.3
13.0
1.4
.6
1.8
3.7
3.0
.0
.2
-3.0
.1
-.2
.3
-. 1
.2

the corrections to the top-line indexes amount to less than 0.1 percentagepoint, and the revisions to the rent components themselves amount to0.2 percentage point.
Corrections to the Consumer Price Index
Index levels, August 2000 (NSA)
. IRevisionCurrent Previous (eren
(percent)
Total CPI 172.8 172.7 .06
Excluding food and energy 181.7 181.6 .06
Rent of Shelter 202.7 202.3 .20
Owners' equivalent rent 199.2 198.8 .20
Residential rent 184.6 184.2 .22
Twelve-month percent changes
With revised 1999 data As published
Aug. 2000 Aug. 1999 Aug. 2000 Aug. 1999
Total CPI 3.3 2.3 3.4 2.3Previous 3.4 2.3
Excluding food and energy 2.5 2.0 2.6 1.9Previous 2.5 1.9
Rent of Shelter 3.2 2.9 3.4 2.8Previous 3.2 2.8
Owners' equivalent rent 2.8 2.8 3.0 2.6Previous 2.8 2.6
Residential rent 3.6 3.1 3.8 3.0Previous 3.5 3.0
The published data present a misleading impression about the timing of thesecorrections, however. Although the programming errors affected data back toJanuary 1999, BLS only revised data for this calendar year.3 That is, BLS putthe levels of this year's indexes in their proper place, but did not change the
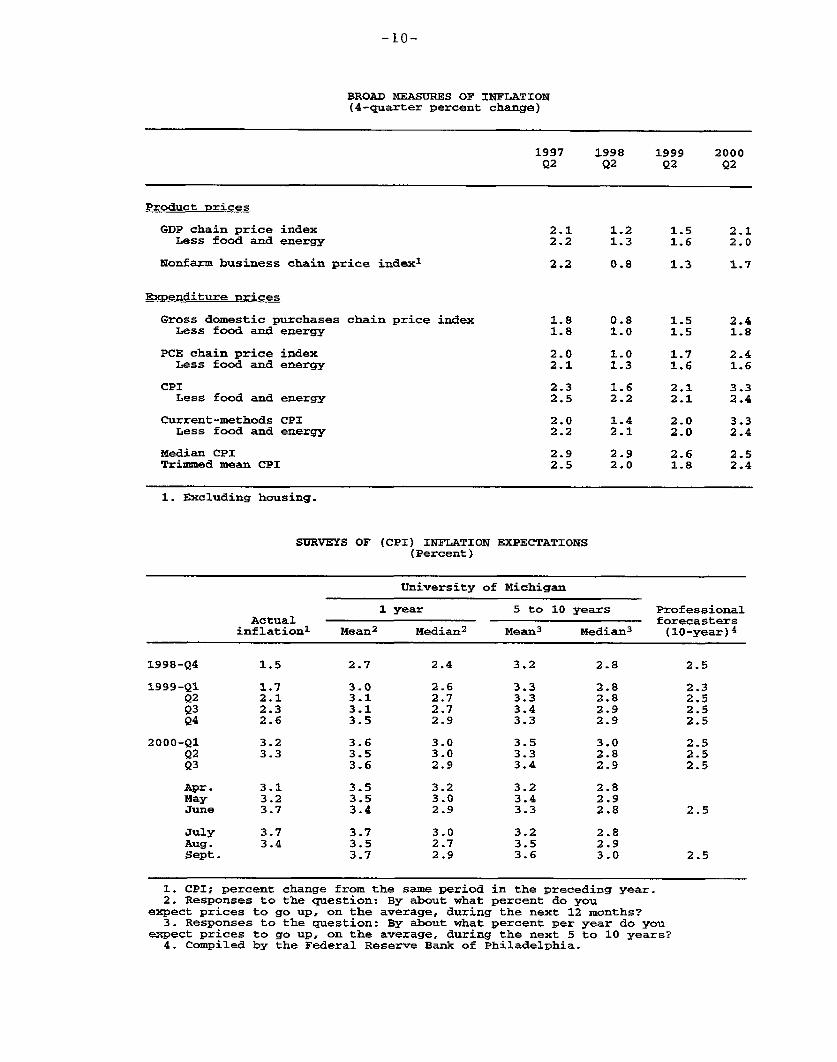
3. The current-methods CPI series shown on the table, "Broad Measures of Inflation," onpage 10 incorporates both the published revisions to the CPI for 2000 as well the revisions thatwould have been made to the CPI for 1999 had the BLS revision covered the entire period overwhich the programming error affected the data. It presents our best guess of a consistentlymeasured, error-free series. These current-methods CPI data are confidential.

index levels for 1999; thus, there is now a discontinuity in the published seriesbetween December 1999 and January 2000. The lower portion of the tablepresents twelve-month changes based on both the new published data and theunpublished data that incorporates revisions to 1999. As can be seen, theseries with revised 1999 data, which adjust for the discontinuity, suggests thatthe acceleration in the core CPI between 1999 and 2000 - from 2 percent ayear ago to 2.5 percent in the most recent twelve months - is slightly smallerthan the published data would indicate. However, the 2 percent rise nowshown for 1999 is a tenth higher than the previous data had indicated.
The BEA uses these CPI rent estimates as source data for the housingcomponents of PCE prices, and the corrected CPIs will be brought into theNIPAs with next summer's annual revision.4 We expect that the correctionswill result in a slight upward revision to PCE prices at that time. However,those revisions should have no effect on real PCE or GDP, because thehousing components of PCE are based on real (not nominal) source data.
4. The NIPAs will not be affected by the break in the series between December 1999 andJanuary 2000 because the BEA uses the current-methods CPIs, which will be revised toincorporate the corrections to the data in 1999 as well as 2000.
-10-
BROAD MEASURES OF INFLATION(4-quarter percent change)
1997 1998 1999 2000Q2 Q2 Q2 Q2
Product prices
GDP chain price index 2.1 1.2 1.5 2.1Less food and energy 2.2 1.3 1.6 2.0
Nonfarm business chain price index1 2.2 0.8 1.3 1.7
Expenditure prices
Gross domestic purchases chain price index 1.8 0.8 1.5 2.4Less food and energy 1.8 1.0 1.5 1.8
PCE chain price index 2.0 1.0 1.7 2.4Less food and energy 2.1 1.3 1.6 1.6
CPI 2.3 1.6 2.1 3.3Less food and energy 2.5 2.2 2.1 2.4
Current-methods CPI 2.0 1.4 2.0 3.3Less food and energy 2.2 2.1 2.0 2.4
Median CPI 2.9 2.9 2.6 2.5Trimmed mean CPI 2.5 2.0 1.8 2.4
1. Excluding housing.
SURVEYS OF (CPI) INFLATION EXPECTATIONS(Percent)
University of Michigan
1 year 5 to 10 years ProfessionalActual forecasters
inflation1 Mean2 Median2 Mean3 Median3 (10-year)4
1998-Q4 1.5 2.7 2.4 3.2 2.8 2.5
1999-Q1 1.7 3.0 2.6 3.3 2.8 2.3Q2 2.1 3.1 2.7 3.3 2.8 2.5Q3 2.3 3.1 2.7 3.4 2.9 2.5Q4 2.6 3.5 2.9 3.3 2.9 2.5
2000-Q1 3.2 3.6 3.0 3.5 3.0 2.5Q2 3.3 3.5 3.0 3.3 2.8 2.5Q3 3.6 2.9 3.4 2.9 2.5
Apr. 3.1 3.5 3.2 3.2 2.8May 3.2 3.5 3.0 3.4 2.9June 3.7 3.4 2.9 3.3 2.8 2.5
July 3.7 3.7 3.0 3.2 2.8Aug. 3.4 3.5 2.7 3.5 2.9Sept. 3.7 2.9 3.6 3.0 2.5
1. CPI; percent change from the same period in the preceding year.2. Responses to the question: By about what percent do you
expect prices to go up, on the average, during the next 12 months?3. Responses to the question: By about what percent per year do you
expect prices to go up, on the average, during the next 5 to 10 years?4. Compiled by the Federal Reserve Bank of Philadelphia.

-11-
Selected Financial Market Quotations(One-day quotes in percent except as noted)
Change to Sept. 28 from1999 2000 selected dates (percentage points)
Instrument FOMC* 1999 2000 FOMC*June 29 May 15 Aug. 22 Sept. 28 June 29 May 15 Aug. 22
Short-termFOMC intended federal funds rate
Treasury bills 13-month6-month1-year
Commercial paper1-month3-month
Large negotiable CDs 11-month3-month6-month
Eurodollar deposits 21-month3-month
Bank prime rate
Intermediate- and long-termU.S. Treasury (constant maturity)
2-year10-year30-year
U.S. Treasury 10-year indexed note
Municipal revenue (Bond Buyer) 3
Private instruments10-year swap10-year FNMAMerrill Lynch BBBHigh yield4
Home mortgages (FHLMC survey rate) 5
30-year fixed1-year adjustable
Stock exchange index
Dow-Jones IndustrialS&P 500 CompositeNasdaq (OTC)Russell 2000Wilshire 5000
4.75
4.704.924.89
5.185.12
5.215.325.43
5.135.25
7.75
5.685.936.07
4.01
5.62
6.816.597.60
10.53
6.00
5.946.246.05
6.476.59
6.556.746.97
6.536.72
9.00
6.886.476.17
4.21
6.23
7.827.708.86
11.94
6.50 650 .50 .00
.05 .04-.12 .00
1.40 .00 .001.44 -.03 .09
1.75 .50 .00
-.24 -.04
.23 -.38 .09
7.63 8.52 7.96 7.905.93 6.96 7.21 7.27
.27 -.62 -.061.34 .31 .06
Change to Sept. 28from selected dates (percent)
11,723 1-14-00 10,808 11,080 10,824 -7.67 .15 -2.311,527 3-24-00 1,452 1,499 1,458 -4.53 .41 -2.755,049 3-10-00 3,608 3,953 3,778 -25.16 4.73 -4.42
606 3-9-00 498 516 524 -13.58 5.22 1.4314,752 3-24-00 13,438 13,970 13,786 -6.54 2.59 -1.31
1. Secondary market.2. Bid rates for Eurodollar deposits collected around 9:30 a.m. Eastern time.3. Most recent Thursday quote.4. Merrill Lynch 175 high-yield bond index composite.5. For week ending Friday previous to date shown.* Data are as of the close on August 21, 2000.
NOTE. June 29, 1999 is the day before the beginning of the most recent sequence of policy tightenings.May 15, 2000 is the day before the most recent tightening.
BA:DAM