Embed Size (px)
Citation preview

Prefatory Note
The attached document represents the most complete and accurate version available based on original copies culled from the files of the FOMC Secretariat at the Board of Governors of the Federal Reserve System. This electronic document was created through a comprehensive digitization process which included identifying the best-preserved paper copies, scanning those copies,1 and then making the scanned versions text-searchable.2 Though a stringent quality assurance process was employed, some imperfections may remain.
Please note that this document may contain occasional gaps in the text. These gaps are the result of a redaction process that removed information obtained on a confidential basis. All redacted passages are exempt from disclosure under applicable provisions of the Freedom of Information Act.
1 In some cases, original copies needed to be photocopied before being scanned into electronic format. All scanned images were deskewed (to remove the effects of printer- and scanner-introduced tilting) and lightly cleaned (to remove dark spots caused by staple holes, hole punches, and other blemishes caused after initial printing). 2 A two-step process was used. An advanced optimal character recognition computer program (OCR) first created electronic text from the document image. Where the OCR results were inconclusive, staff checked and corrected the text as necessary. Please note that the numbers and text in charts and tables were not reliably recognized by the OCR process and were not checked or corrected by staff.

CONFIDENTIAL (FR)CLASS III FOMC
February 1 1994
SUPPLEMENT
CURRENT ECONOMIC AND FINANCIAL CONDITIONS
Prepared for theFederal Open Market Committee
By the StaffBoard of Governors
of the Federal Reserve System
TABLE OF CONTENTS
Page
THE DOMESTIC NONFINANCIAL ECONOMY
Personal income and outlays . . . . . . . . . . . . . .Purchasing managers' survey . . . . . . . . . . . . . .
Tables
Personal income. . . . . . . . . . . . . . . . . . . .Real personal consumption expenditures . . . .....Business capital spending indicators . . . . . . . . .Changes in manufacturing and trade inventories . .Inventories relative to sales. . . . . . . . . . . . .
Charts
Purchasing managers. . . . . . . . . . . . . . . . . .Nonresidential construction and permits. . . . . . . .
THE FINANCIAL ECONOMY
The January 1994 Senior Loan Officer Opinion Surveyon Bank Lending Practices . . . . . . . . . . . . .
Table
Selected financial market quotations . . . . . . . . .
Chart
Measures of supply and demandfor commercial and industrial loans . . . . . . . .
SUPPLEMENTAL NOTES
THE DOMESTIC NONFINANCIAL ECONOMY
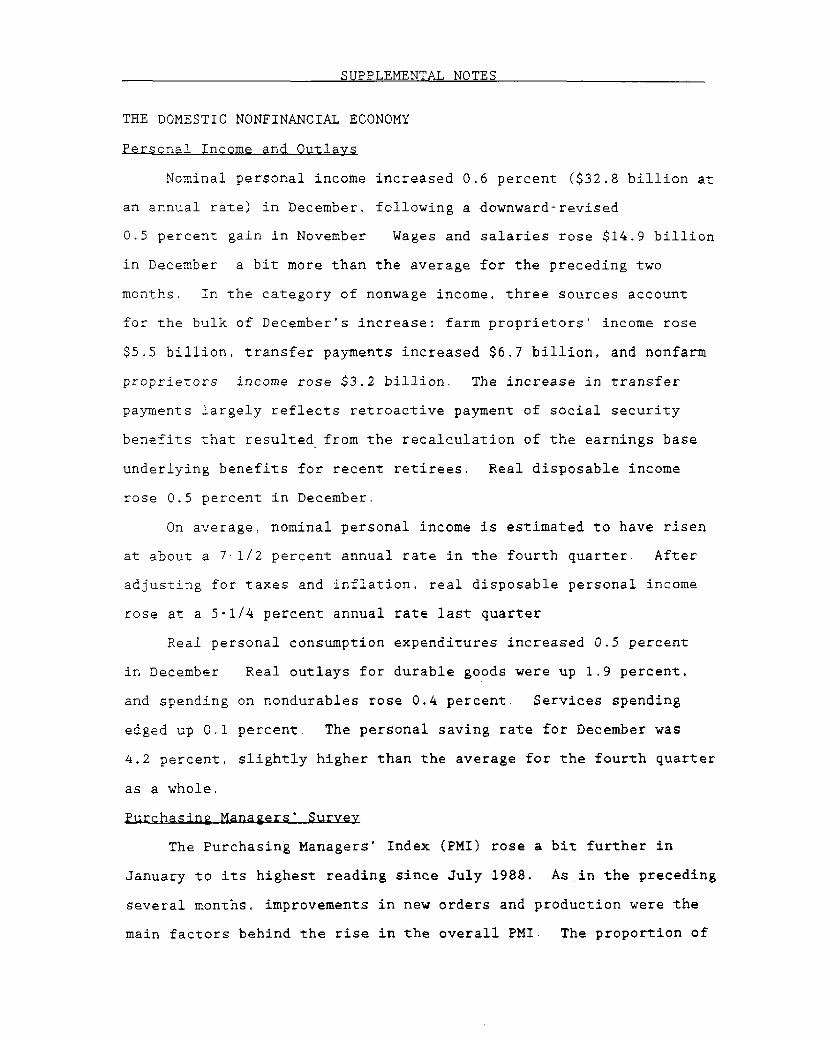
Personal Income and Outlays
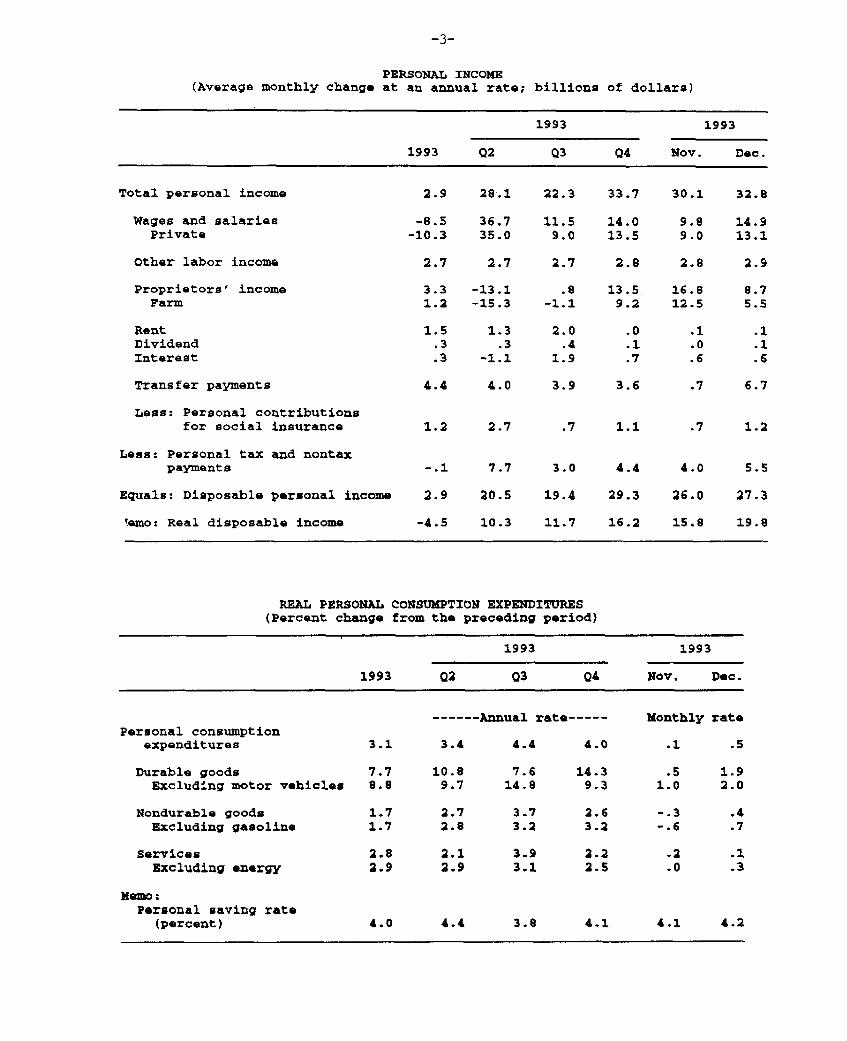
Nominal personal income increased 0.6 percent ($32.8 billion at
an annual rate) in December, following a downward-revised
0.5 percent gain in November Wages and salaries rose $14.9 billion
in December a bit more than the average for the preceding two
months. In the category of nonwage income, three sources account
for the bulk of December's increase: farm proprietors' income rose
$5.5 billion, transfer payments increased $6.7 billion, and nonfarm
proprietors income rose $3.2 billion. The increase in transfer
payments largely reflects retroactive payment of social security
benefits that resulted from the recalculation of the earnings base
underlying benefits for recent retirees, Real disposable income
rose 0.5 percent in December.
On average, nominal personal income is estimated to have risen
at about a 7-1/2 percent annual rate in the fourth quarter. After
adjusting for taxes and inflation, real disposable personal income
rose at a 5-1/4 percent annual rate last quarter
Real personal consumption expenditures increased 0.5 percent
in December Real outlays for durable goods were up 1.9 percent,
and spending on nondurables rose 0.4 percent Services spending
edged up 0.1 percent. The personal saving rate for December was
4.2 percent, slightly higher than the average for the fourth quarter
as a whole.
Purchasing Managers' Survey
The Purchasing Managers' Index (PMI) rose a bit further in
January to its highest reading since July 1988. As in the preceding
several months, improvements in new orders and production were the
main factors behind the rise in the overall PMI The proportion of

-2-
industrial companies reporting higher orders in January exceeded
those reporting lower orders by 30.2 percentage points, an extremely
wide margin by historical standards. The pickup in orders appears
to have come from both domestic and foreign sources. With regard to
production, the proportion of companies reporting higher output
exceeded those reporting lower output by 23 percentage points, among
the best readings in the past two years. Nonetheless, employment
and materials inventories appear to have continued to decline
Prices of materials also firmed markedly in January, with
industrial companies paying higher prices outnumbering those paying
lower prices by 19.4 percentage points, the highest net difference
since November 1990. Survey respondents cited, in particular,
higher prices for steel and steel scrap, a few types of nonferrous
metals, lumber and grain products. Likely reflecting the tighter
market conditions, deliveries of materials and supplies in January
were made much less promptly than in preceding months, and imports
of materials also increased.
PERSONAL INCOME(Average monthly change at an annual rate; billions of dollars)
1993 1993
1993 Q2 Q3 Q4 Nov. Dec.
Total personal income 2.9 28.1 22.3 33.7 30.1 32.8
Wages and salaries -8.5 36.7 11.5 14.0 9.8 14.9Private -10.3 35.0 9.0 13.5 9.0 13.1
Other labor income 2.7 2.7 2.7 2.8 2.8 2.9
Proprietors' income 3.3 -13.1 .8 13.5 16.8 8.7Farm 1.2 -15.3 -1.1 9.2 12.5 5.5
Rent 1.5 1.3 2.0 .0 .1 .1Dividend .3 .3 .4 .1 .0 .1Interest .3 -1.1 1.9 .7 .6 .6
Transfer payments 4.4 4.0 3.9 3.6 .7 6.7
Less: Personal contributionsfor social insurance 1.2 2.7 .7 1.1 .7 1.2
Less: Personal tax and nontaxpayments -.1 7.7 3.0 4.4 4.0 5.5
Equals: Disposable personal income 2.9 20.5 19.4 29.3 26.0 27.3
Memo: Real disposable income -4.5 10.3 11.7 16.2 15.8 19.8
REAL PERSONAL CONSUMPTION EXPENDITURES(Percent change from the preceding period)
1993 1993
1993 Q2 Q3 Q4 Nov. Dec.
------ Annual rate----- Monthly ratePersonal consumption
expenditures 3.1 3.4 4.4 4.0 .1 .5
Durable goods 7.7 10.8 7.6 14.3 .5 1.9Excluding motor vehicles 8.8 9.7 14.8 9.3 1.0 2.0
Nondurable goods 1.7 2.7 3.7 2.6 -.3 .4Excluding gasoline 1.7 2.8 3.2 3.2 -.6 .7
Services 2.8 2.1 3.9 2.2 .2 .1Excluding energy 2.9 2.9 3.1 2.5 .0 .3
Memo:Personal saving rate
(percent) 4.0 4.4 3.8 4.1 4.1 4.2

2/1/94Purchasing Managers*
(Seasonally adjusted)
Percent-- 75
-4 50
New orders Jan.
'rA,> AUV'TV
- 25
50
1985 1987 1989 1991 19931985 1987 1989 1991 1993
Percent
1985 1987 1989 1991 1993
Percent Percent
1985 1987 1989 1991 1993
* Percent reportng increases are ned with thos reporting decreases." Positve entries represent slowe daiveries.
1985 1987 1989 1991 1993

BUSINESS CAPITAL SPENDING INDICATORS(Percent change from preceding comparable period;
based on seasonally adjusted data, in current dollars)
1993 1993
02 Q3 Q4 Oct. Nov. Dec.
Producers' durable equipment
Shipments of nondefense capital goods 1.0 .6 7.3 1.0 4.7 5.1Excluding aircraft and parts .8 3.4 8.1 .2 6.5 2.8
Office and computing -2.2 9.4 5.5 .9 3.4 3.5All other categories 1.7 1.7 8.9 .0 7.5 2.6
Orders of nondefense capital goods 4.1 -1.2 11.0 5.9 6.3 2.0Excluding aircraft and parts 1.3 3.6 11.3 3.3 3.8 6.6
Office and computing -.7 4.9 13.3 7.7 12.2 -7.0All other categories 1.9 3.2 10.7 2.1 1.3 11.0
Shipments of complete aircraft1 31.2 19.1 n.a. 21.4 19.9 n.a.
Sales of heavy-weight trucks2 338.5 334.8 363.4 335.4 425.2 329.5
Nonresidential structures
Construction put-in-place 2.7 1.2 5.0 2.1 2.4 .8Office -.3 -1.8 2.7 2.4 9.1 3.3Other commercial 3.4 -.8 12.9 6.6 1.9 1.6Institutional 6.4 2.9 -.7 1.6 -3.2 4.7Industrial -5.4 4.1 8.4 -.2 4.8 2.2Public utilities 2.4 1.6 2.6 1.0 3.3 -2.8Lodging and misc. 22.5 6.7 2.9 -.4 -2.9 -1.5
Rotary drilling rigs in use 692.1 795.3 790.8 809.4 783.5 779.6
Footage drilled3 11.0 11.6 n.a. 10.6 9.8 n.a.
Memo:Business fixed investment4 16.6 7.4 21.0 n.a. n.a. n.a.
Producers' durable equipment4 19.8 10.0 24.6 n.a. n.a. n.a.Nonresidential structures4 8.1 .3 10.7 n.a. n.a. n.a.
1. Billions of dollars, annual rate. From the Current Industrial Report'Civil Aircraft and Aircraft Engines.' Monthly data are seasonally adjustedby FRB staff; the monthly seasonals are constrained such that their quarterlyaverages equal the BEA seasonals (which only are available on a quarterly basis).2. Thousands of units, annual rate. BEA seasonal factors.3. From the Department of Energy.4. Based on constant-dollar data; percent change, annual rate.

-6-
NONRESIDENTIAL CONSTRUCTION AND PERMITS*(Index, Dec. 1982 = 100, ratio scale)
Total Building
1980 1982 1984 1986 1988 1990 1992 1994
Office Index Other Commercial
IDec.
Dec.
19,4
1984 1986 1988 1990 1992 1994
Industrial index-- 240
1984 1986 1988 1990 1992 1994
Institutional Index
1984 1986 1988 1990 1992 1994
'Six-month moving average for all series.
Index
Index
*"* ,, . Dec.
Dec.
1984 1986 1988 1990 1992 1994

CHANGES IN MANUFACTURING AND TRADE INVENTORIES(Billions of dollars at annual rates;based on seasonally adjusted data)
1993 1993
Q1 Q2 Q3 Sep. Oct. Nov.
Current-cost basis
Total 39.9 20.5 12.7 17.5 27.8 59.2Excluding auto dealers 20.6 20.9 22.3 15.6 16.5 40.9Manufacturing 1.2 7.1 -2.5 -8.4 -4.7 .7
Defense aircraft -4.4 -.2 -.8 -1.1 -7.8 4.7Nondefense aircraft .0 -3.1 -3.3 2.5 -2.8 -.0Excluding aircraft 5.6 10.5 1.5 -9.8 6.0 -4.0
Wholesale 5.1 6.2 12.2 -1.2 -1.3 13.2Retail 33.6 7.2 3.0 27.1 33.8 45.3
Automotive 19.3 -.3 -9.6 1.9 11.3 18.3Excluding auto dealers 14.3 7.5 12.7 25.2 22.5 27.0
Constant-dollar basis
Total 23.0 14.0 16.4 33.7 5.3 36.0Excluding auto dealers 6.4 14.4 23.5 13.0 11.7 36.2Manufacturing -.8 5.0 3.1 -4.1 -.1 8.3Wholesale -.1 5.9 8.5 -4.6 -5.4 6.5Retail 24.0 3.0 4.8 42.4 10.8 21.2
Automotive 16.6 -.5 -7.1 20.7 -6.3 -.2Excluding auto dealers 7.4 3.5 11.8 21.6 17.2 21.3
INVENTORIES RELATIVE TO SALES 1
(Months supply; based on seasonally adjusted data)
1993 1993
01 Q2 Q3 Sep. Oct. Nov.
Current-cost basis
Total 1.47 1.47 1.47 1.46 1.45 1.44Excluding auto dealers 1.44 1.44 1,45 1.43 1.43 1.42Manufacturing 1.48 1.49 1.49 1.46 1.46 1.43
Defense aircraft 5.07 5.25 5.22 5.11 4.75 5.64Nondefense aircraft 5.08 4.87 5.39 5.71 5.35 5.65Excluding aircraft 1.34 1.35 1.35 1.32 1.33 1.29
Wholesale 1.33 1.32 1.34 1.34 1.33 1.33Retail 1.60 1.58 1.56 1.55 1.54 1.55Automotive 1.99 1.90 1.78 1.78 1.71 1.72Excluding auto dealers 1.49 1.49 1.50 1.49 1.49 1.51
Constant-dollar basis
Total 1.56 1.56 1.55 1.54 1.53 1.52Excluding auto dealers 1.53 1.54 1.54 1.52 1.52 1.51Manufacturing 1.59 1.60 1.60 1.57 1.57 1.55Wholesale 1.42 1.42 1.421 .42 1.42 1.41Retail 1.64 1.62 1.60 1.59 1.57 1.58
Automotive 1.91 1.85 1.76 1.77 1.66 1.63Excluding auto dealers 1.56 1.55 1.55 1.54 1.55 1.56
1. Ratio of end of period inventories to average monthly sales for the period.

THE FINANCIAL ECONOMY
The January 1994 Senior Loan Officer Opinion Surveyon Bank Lending Practices
The January 1994 Senior Loan Officer Opinion Survey on Bank
Lending Practices posed questions about changes in bank lending
standards and terms: about changes in loan demand by businesses and
households, and about several bank balance sheet items. Included in
the survey were fifty-nine domestic commercial banks and eighteen
U.S. branches and agencies of foreign banks.
The survey results again show an easing of terms and standards
on loans to businesses and households by a significant proportion of
respondents. Banks reported easing terms and standards on
commercial and industrial loans to firms of all sizes, although
somewhat fewer banks reported such easing than did so in the
November survey Standards for commercial real estate loans were
little changed. Respondents reported increased willingness to make
loans to individuals and a small net easing of standards on home
mortgage loans.
A significant number of respondents reported an increase in
credit demand over the past three months. The number of respondents
reporting stronger demand for commercial and industrial loans
increased sharply relative to the November survey; firms of all
sizes increased their demand. The banks also reported a small net
increase in demand for credit lines over the past three months.
Household demand for credit, particularly installment credit, was
stronger at several banks.
Special questions on the survey addressed the distribution of
bank loans by type of loan, bank holdings of state and local tax-
exempt securities, and bank loans to brokers and dealers.
Business Lending
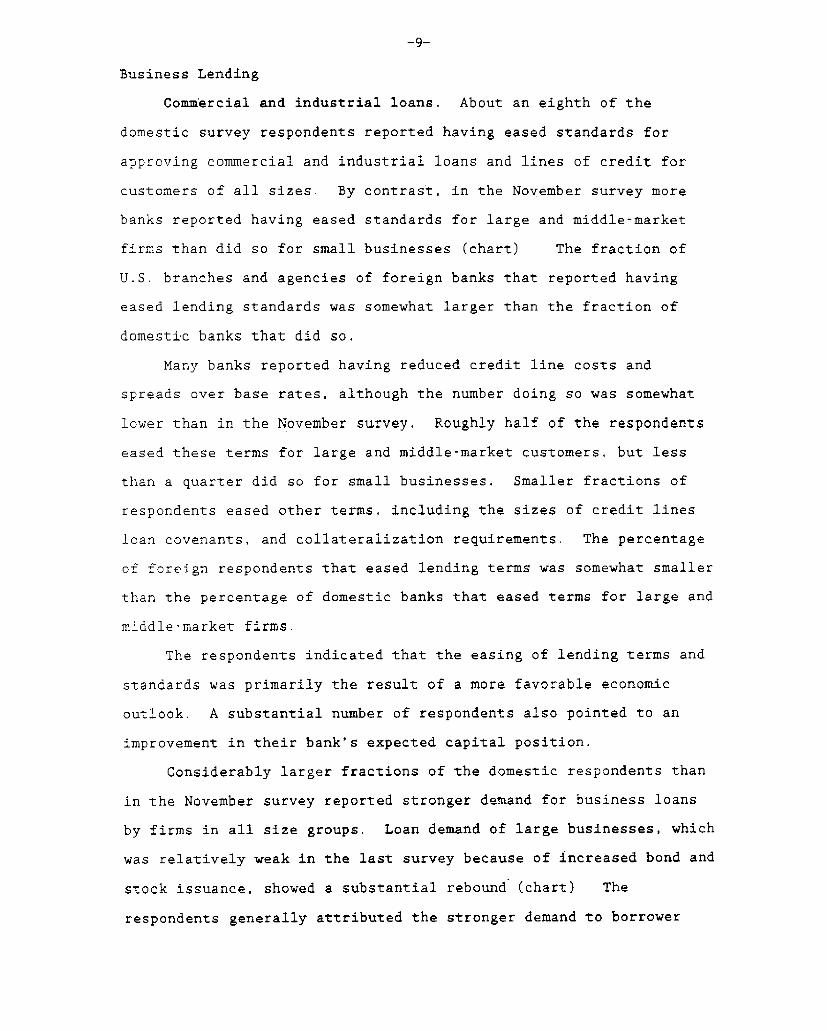
Commercial and industrial loans. About an eighth of the
domestic survey respondents reported having eased standards for
approving commercial and industrial loans and lines of credit for
customers of all sizes. By contrast, in the November survey more
banks reported having eased standards for large and middle-market
firms than did so for small businesses (chart) The fraction of
U.S. branches and agencies of foreign banks that reported having
eased lending standards was somewhat larger than the fraction of
domestic banks that did so,
Many banks reported having reduced credit line costs and
spreads over base rates, although the number doing so was somewhat
lower than in the November survey. Roughly half of the respondents
eased these terms for large and middle-market customers, but less
than a quarter did so for small businesses. Smaller fractions of
respondents eased other terms, including the sizes of credit lines,
loan covenants, and collateralization requirements. The percentage
of foreign respondents that eased lending terms was somewhat smaller
than the percentage of domestic banks that eased terms for large and
middle-market firms.
The respondents indicated that the easing of lending terms and
standards was primarily the result of a more favorable economic
outlook. A substantial number of respondents also pointed to an
improvement in their bank's expected capital position.
Considerably larger fractions of the domestic respondents than
in the November survey reported stronger demand for business loans
by firms in all size groups. Loan demand of large businesses, which
was relatively weak in the last survey because of increased bond and
stock issuance, showed a substantial rebound (chart) The
respondents generally attributed the stronger demand to borrower

-10-
needs to finance inventories and investment in plant and equipment
Branches and agencies of foreign banks also reported a net increase
in demand for commercial and industrial loans, although it was more
limited than the one that the domestic respondents reported. A few
domestic and foreign respondents also noted an increase in demand
for lines of credit, as opposed to loans, over the past three
months.
Real estate loans. Domestic and foreign respondents both
indicated that credit standards for commercial real estate loans had
eased slightly On net, the domestic respondents reported a small
easing of standards for all types of commercial real estate loans-
the first such easing since the questions were added to the survey
in 1990. These responses are consistent with indications of firming
markets for commercial real estate in some parts of the country and
with the decline in delinquency rates on bank real estate loans over
the past two years Foreign respondents reported a small net easing
of standards on construction and land development loans and loans to
finance other nonfarm, nonresidential real estate. Their terms for
other types of commercial real estate loans were unchanged.
Lending to Households
The fraction of domestic banks reporting increased willingness
to make consumer loans in the January survey was about twice as
large as in November. Nearly 30 percent of respondents reported
greater willingness to make consumer installment loans, and a
similar percentage was more willing to make general purpose consumer
loans, including home equity loans. In contrast, only a few banks
reported having eased standards for approving mortgage applications
for purchasing houses over the past three months.
Demand for household credit appears to have strengthened from
November to January. More than 20 percent of the respondents noted

-11-
stronger demand for consumer installment loans, while more than
15 percent indicated that demand for mortgages to purchase houses
had picked up. These percentages, however, were somewhat below the
levels they had attained in the November survey. The respondents
also reported no net decline in demand for home equity loans over
the past three months. In November, the banks had reported a net
decline in demand for home equity loans, possibly because of
paydowns employing the proceeds from refinancings of first
mortgages.
Bank Balance Sheet Items
The January survey asked for information on several balance
sheet items First, the respondents were asked to provide the
distribution of their business loan portfolios among four
categories. The domestic banks reported that "floating-rate loans
with stated maturities" accounted for nearly 60 percent of their
business loans at the end of 1993. "Fixed rate loans with stated
maturities excluding overnight loans" were the next biggest
category, followed by "demand loans." The smallest category was
"overnight loans," which accounted for less than 5 percent of the
total The foreign respondents generally reported larger shares of
fixed-rate loans and smaller shares of demand loans. On average,
demand loans were reported to remain on banks' books for about a
year
The second set of questions was about banks' holdings of tax-
exempt municipal securities. After six years of contraction
following tax law changes in 1986, holdings of these securities have
increased in recent months. According to the respondents, more
1 Until the 1986 changes, banks were allowed to deduct80 percent of the costs of funding tax-exempt securities fromtaxable income. For most tax-exempt instruments acquired afterAugust 7, 1986, banks are not allowed to deduct any of the fundingcosts.

-12-
than half of the tax-exempt securities on their books were purchased
before the 1986 tax changes and so are grandfathered under the old
tax rules. The bulk of the remaining holdings are "bank-qualified"
securities. 2 The banks indicated that their increased holdings
of tax-exempt securities represent primarily purchases of bank-
qualified instruments. The few respondents reporting increased
holdings of standard tax-exempt instruments indicated that they had
purchased them because the yields on these instruments had increased
relative to those on comparable taxable securities and also because
improved profitability at their banks made tax-exempt securities
more attractive.
A third set of questions focused on the surge in security loans
during 1993 Most of the banks reporting growth in security loans
indicated that it resulted primarily from increased funding needs of
brokers and dealers. A few respondents also noted that broker and
dealer financing had shifted away from other sources, in some cases
because their bank offered more aggressive terms.
2. Bank-qualified tax-exempt securities are those issued bymunicipalities whose annual issuance is less than $10 million.These instruments retain the favorable pre-1987 tax treatment ofmunicipals.

-13-
Measures of Supply and DemandFor Commercial and Industrial Loans
Net Percentage of Domestic RespondentsTightening Standards for C&I Loans
(by Size of Firm Seeking Loan)Percent
-- 80
- Large......... Medium
\. --- Small
''\\ -40
2020
.. o . - -20
Q2 Q3 Q4 01 Q2 03 Q4 01 02 03 04 01 Q2 03 Q4 Q1 Q21990 1991 1992 1993 1994
Net Percentage of Domestic RespondentsReporting Stronger Demand for C&I Loans
(by Size of Firm Seeking Loan)Percent
- Large 40......... Medium
-- - Small30
0- 30
/ - -20/ * -20
Q41991
01 Q2 03 Q4 Q1 02 Q3 04 Q11992 1993 1994

-14-
SELECTED FINANCIAL MARKET QUOTATIONS1(Percent except as noted)
Instrument
SHORT-TERM RATES2
Federal funds
Treasury bills3-month6-month1-year
Commercial paper1-month3-month
Large negotiable CDs1 month3-month6-month
4Eurodollar deposits
1-month3-month
Bank prime rate
INTERMEDIATE- AND LONG-TERM RATES
U.S. Treasury (constant maturity)3-year10-year30-year
5Municipal revenue
(Bond Buyer)
Corporate A utility.recently offered
6Home mortgages
FHLMC 30-yr fixed rateFHLMC 1-yr adjustable rate
Stock exchange index
Dow-Jones IndustrialNYSE CompositeNASDAQ (OTC)Wilshire
3978.36267.10800.47
4798.08
1989
Marhighs
9.85
9.109.129.05
10.0510.15
10.0710.3210.68
10.1910.50
11.50
9.889.539.31
7.95
10.47
11.229.31
1993 1994 Change to Jan 31 1994
Mid-Oct FOMC. From Mid-Oct From FOMClows Dec 21 Jan 31 lows Dec 21
3.07 2.96 3.04
3.01 3.07 2.963.09 3.24 3.143.23 3.47 3.37
-0.03
-0.050.050.14
3 .13 3.31 3.10 -0.033.23 3.30 3.15 -0.08
3.08 3.16 3.06 -0.023.22 3.19 3.13 -0.093.23 3.34 3.26 0.03
3.06 3.06 3.00 -0.063.25 3.19 3.13 -0.12
6.00 6.00 6.00
4.06 4.58 4.445.19 5.85 5.705.78 6.32 6.23
5.41 5.62 5.50
6.79 7.35 7.16
6.74 7.174.14 4.20
6.974.16
0.00
0.380.510.45
0.09
0.37
0.230.02
0.08
-0.11-0.10-0.10
-0.21-0.15
-0.10-0.06-0.08
-0.06-0.06
0.00
-0.14-0.15-0.09
-0.12
-0.19
-0-20-0.04
1989 1993 1994 Percentage change to Jan 31Record high From From
________________ From From
Low. FOMC. record 1989 From FOMC.Level Date Jan. 3 Dec 21 Jan 31 high low Dec 21
1/31/94 2144.641/31/94 154.001/31/94 377.561/3!/94 2718.59
3745.15257.14755.63
4610.31
3978.36267.10800.47:793.07
0.000.000.000.00
85.5073.44111.4576.49
6.233.875.934.C7
1. One-day quotes except as noted.2. Average for two-week reserve maintenance
period closest to date shown. Last observationis average to date for maintenance period endingFebruary 2, 1994.3. Secondary market.
4. Bid rates for Eurodollardeposits at 11 a.m. London time.5. Most recent observation based on
one-day Thursday quote and futuresmarket index changes.6. Quotes for week ending Friday
previous to date shown.
I
I ---------- - --