Embed Size (px)
Citation preview
Prefatory Note
The attached document represents the most complete and accurate version available based on original copies culled from the files of the FOMC Secretariat at the Board of Governors of the Federal Reserve System. This electronic document was created through a comprehensive digitization process which included identifying the best-preserved paper copies, scanning those copies,1 and then making the scanned versions text-searchable.2 Though a stringent quality assurance process was employed, some imperfections may remain.
Please note that this document may contain occasional gaps in the text. These gaps are the result of a redaction process that removed information obtained on a confidential basis. All redacted passages are exempt from disclosure under applicable provisions of the Freedom of Information Act.
1 In some cases, original copies needed to be photocopied before being scanned into electronic format. All scanned images were deskewed (to remove the effects of printer- and scanner-introduced tilting) and lightly cleaned (to remove dark spots caused by staple holes, hole punches, and other blemishes caused after initial printing). 2 A two-step process was used. An advanced optimal character recognition computer program (OCR) first created electronic text from the document image. Where the OCR results were inconclusive, staff checked and corrected the text as necessary. Please note that the numbers and text in charts and tables were not reliably recognized by the OCR process and were not checked or corrected by staff.

CONFIDENTIAL (FR)CLASS III - FOMC
May 11, 1990
SUPPLEMENT
CURRENT ECONOMIC AND FINANCIAL CONDITIONS
Prepared for theFederal Open Market Committee
By the StaffBoard of Governors
of the Federal Reserve System

TABLE OF CONTENTS
Page
THE DOMESTIC NONFINANCIAL ECONOMY
Producer prices . . . . . . . . . . . . . . . . . . . . . .Retail sales . . . . . . . . . . . . . . . . . . . . . . . .
Tables
Recent changes in producer prices . . . . . . . . . . . . .Retail sales . . . . . . . . . . . . . . . . . . . . . . . .
THE FINANCIAL ECONOMY
Summary of the May 1990 senior loan officer opinion surveyon bank lending practices . . .. . . . . . . . . . . . .
Tables
Senior loan officer opinion survey on bank lending practicesat selected large banks in the United States . . . . . . .
Monetary aggregates . . . . . . . . . . . . . . . . . . . .Commercial bank credit and short- and
intermediate-term business credit . . . . . . . . . . . .Selected financial market quotations . . . . . . . . . . . .
SUPPLEMENTAL NOTES
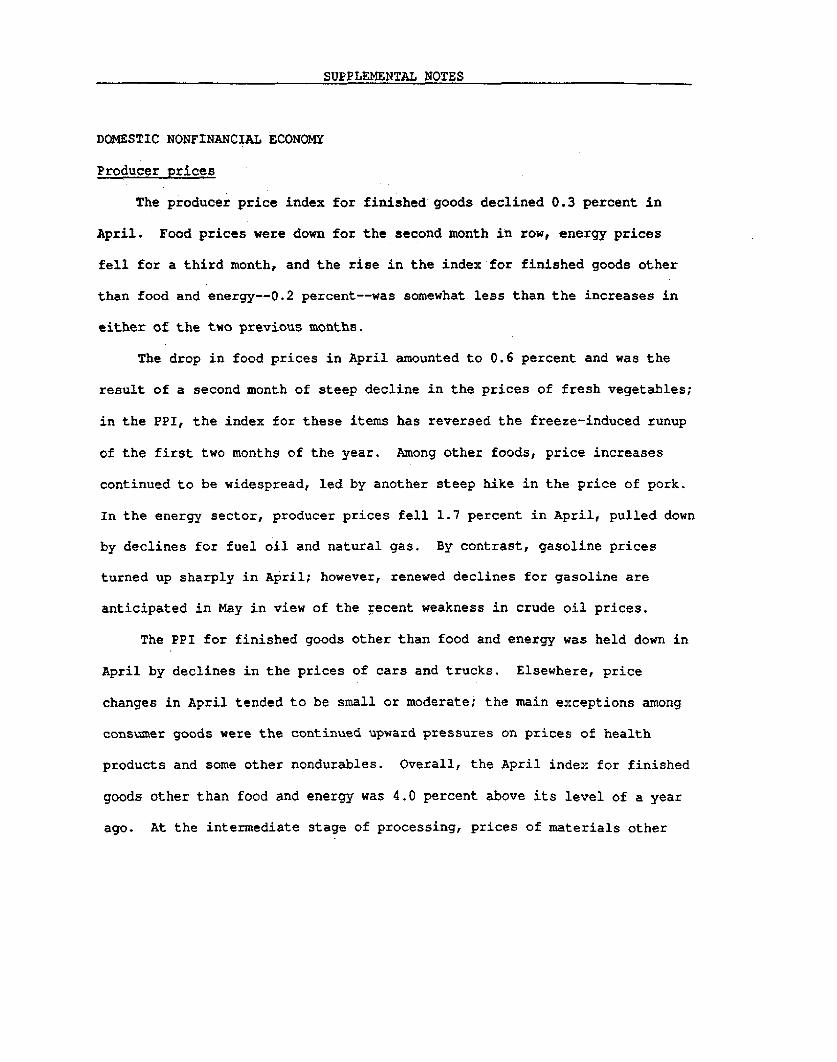
DOMESTIC NONFINANCIAL ECONOMY
Producer prices
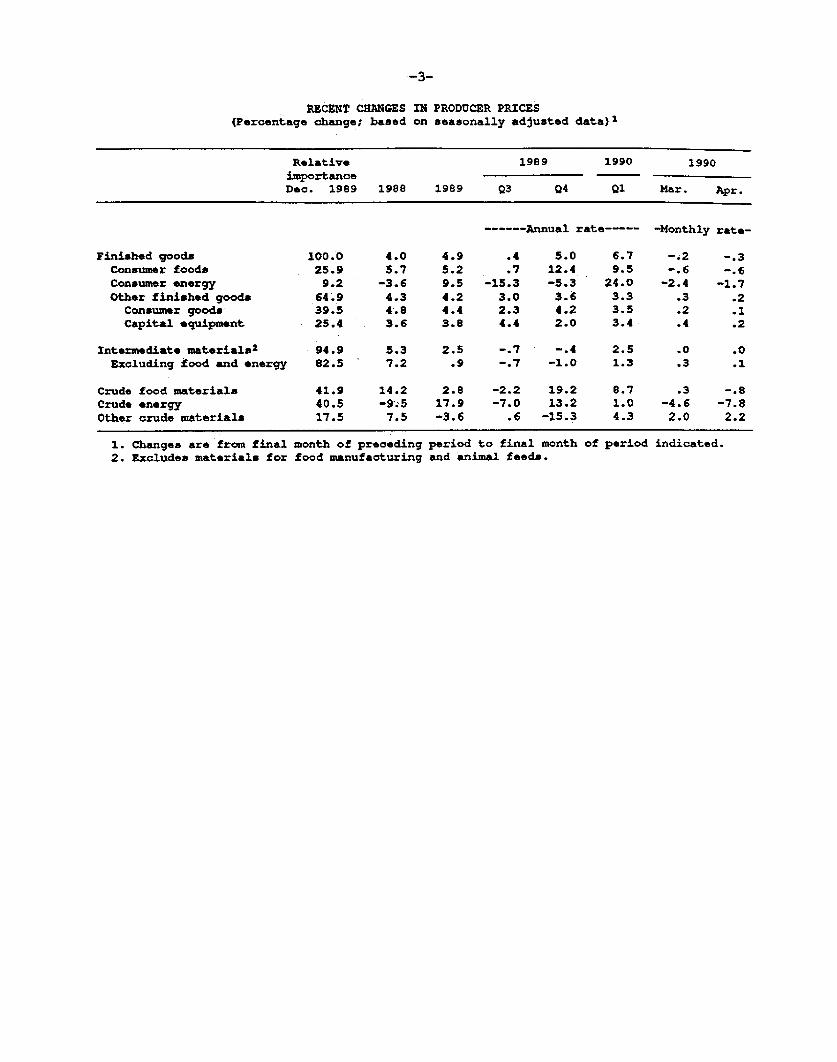
The producer price index for finished goods declined 0.3 percent in
April. Food prices were down for the second month in row, energy prices
fell for a third month, and the rise in the index for finished goods other
than food and energy--0.2 percent--was somewhat less than the increases in
either of the two previous months.
The drop in food prices in April amounted to 0.6 percent and was the
result of a second month of steep decline in the prices of fresh vegetables;
in the PPI, the index for these items has reversed the freeze-induced runup
of the first two months of the year. Among other foods, price increases
continued to be widespread, led by another steep hike in the price of pork.
In the energy sector, producer prices fell 1.7 percent in April, pulled down
by declines for fuel oil and natural gas. By contrast, gasoline prices
turned up sharply in April; however, renewed declines for gasoline are
anticipated in May in view of the recent weakness in crude oil prices.
The PPI for finished goods other than food and energy was held down in
April by declines in the prices of cars and trucks. Elsewhere, price
changes in April tended to be small or moderate; the main exceptions among
consumer goods were the continued upward pressures on prices of health
products and some other nondurables. Overall, the April index for finished
goods other than food and energy was 4.0 percent above its level of a year
ago. At the intermediate stage of processing, prices of materials other
-2-
than food and energy increased 0.1 percent in April; after declining a
little in the second half of 1989, these prices have tilted toward a gradual
uptrend thus far in 1990.
Retail Sales
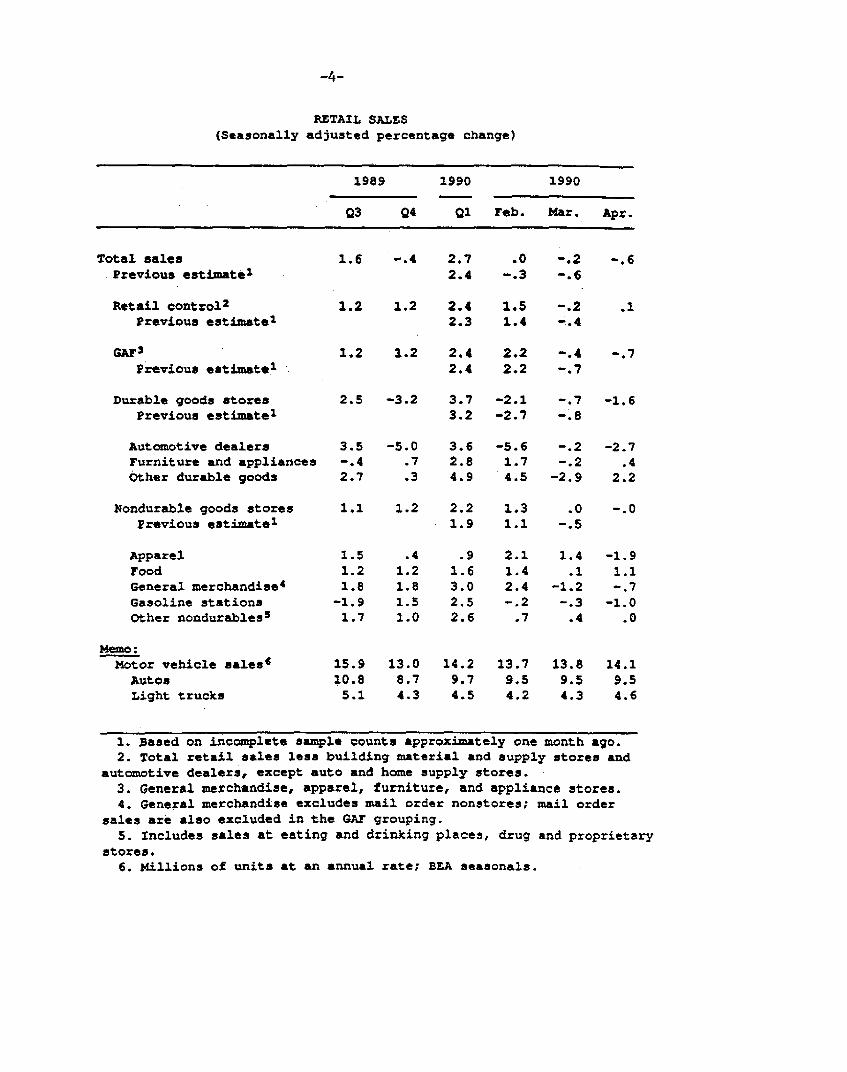
According to the Commerce Department's advance report, total retail
sales are estimated to have fallen 0.6 percent in April, as the result of
reduced spending at automotive dealers and building material and supply
stores. Excluding these categories, spending in the retail control group
edged up 0.1 percent in April, following small upward revisions to February
and March. The April level of nominal retail control was about 2 percent
(annual rate) above the first-quarter average.
Among the components of retail control, spending declined in April at
general merchandise and apparel stores but firmed at furniture and appliance
outlets. Sales at food stores also were up in April after essentially no
change in March. The small upward revisions to spending in February and
March occurred mainly in sales at apparel outlets, food stores, and gasoline
stations.
On balance, the April retail sales report was somewhat weaker than
assumed in the May Greenbook. However, given the tentative nature of the
advance retail sales data, the staff would not be inclined at this point to
make major adjustments to our forecast of real consumer spending in the
second quarter.
-3-
RECENT CHANGES IN PRODUCER PRICES(Percentage change; based on seasonally adjusted data) 1
Relative 1989 1990 1990importanceDec. 1989 1988 1989 Q3 Q4 Q1 Mar. Apr.
------ Annual rate----- -Monthly rate-
Finished goods 100.0 4.0 4.9 .4 5.0 6.7 -.2 -.3Consumer foods 25.9 5.7 5.2 .7 12.4 9.5 -.6 -.6Consumer energy 9.2 -3.6 9.5 -15.3 -5.3 24.0 -2.4 -1.7Other finished goods 64.9 4.3 4.2 3.0 3.6 3.3 .3 .2
Consumer goods 39.5 4.8 4.4 2.3 4.2 3.5 .2 .1Capital equipment 25.4 3.6 3.8 4.4 2.0 3.4 .4 .2
Intermediate materials2 94.9 5.3 2.5 -.7 -.4 2.5 .0 .0Excluding food and energy 82.5 7.2 .9 -.7 -1.0 1.3 .3 .1
Crude food materials 41.9 14.2 2.8 -2.2 19.2 8.7 .3 -.8Crude energy 40.5 -9.5 17.9 -7.0 13.2 1.0 -4.6 -7.8Other crude materials 17.5 7.5 -3.6 .6 -15.3 4.3 2.0 2.2
1. Changes are from final month of preceding period to final month of period indicated.2. Excludes materials for food manufacturing and animal feeds.
-4-
RETAIL SALES(Seasonally adjusted percentage change)
1989 1990 1990
Q3 Q4 Q1 Feb. Mar. Apt.
Total salesPrevious estimate1
Retail control2
Previous estimate 2
GAF3
Previous estimate1
Durable goods storesPrevious estimatel
Automotive dealersFurniture and appliancesOther durable goods
Nondurable goods storesPrevious estimatel
ApparelFoodGeneral merchandise 4
Gasoline stationsOther nondurables 5
Memo:Motor vehicle salesO
AutosLight trucks
1.6 -.4 2.7 .0 -.22.4 -.3 -.6
1.2 1.2 2.4 1.5 -. 22.3 1.4 -. 4
1.2 1.2 2.4 2.2 -.42.4 2.2 -. 7
2.5 -3.2 3.7 -2.1 -.73.2 -2.7 -.8
-5.0.7.3
3.6 -5.62.8 1.74.9 4.5
1.1 1.2 2.2 1.31.9 1.1
1.51.21.8-1.91.7
15.910.85.1
.41.21.81.51.0
13.08.74.3
.91.63.02.52.6
14.29.74.5
2.11.42.4-.2.7
13.79.54.2
-. 2-.2
-2.9
.0-.5
1.4.1
-1.2-.3
.4
13.89.54.3
1. Based on incomplete sample counts approximately one month ago.2. Total retail sales less building material and supply stores and
automotive dealers, except auto and home supply stores.3. General merchandise, apparel, furniture, and appliance stores.4. General merchandise excludes mail order nonstores; mail order
sales are also excluded in the GAF grouping.5. Includes sales at eating and drinking places, drug and proprietary
stores.6. Millions of units at an annual rate; BEA seasonals.
-.6
.1
-.7
-1.6
-2.7.4
2.2
-.0
-1.91.1-. 7
-1.0.0
14.19.54.6
-5-THE FINANCIAL ECONOMY
Summary of the May 1990 Senior Loan Officer Opinion Surveyon Bank Lending Practices
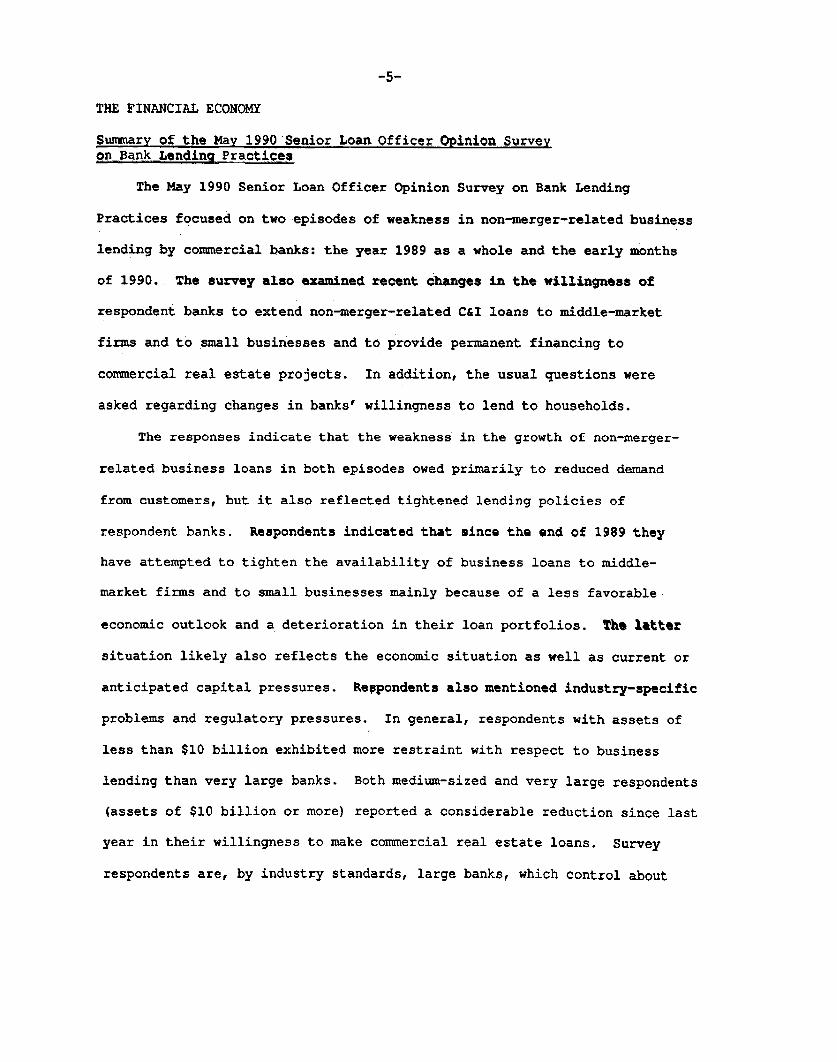
The May 1990 Senior Loan Officer Opinion Survey on Bank Lending
Practices focused on two episodes of weakness in non-merger-related business
lending by commercial banks: the year 1989 as a whole and the early months
of 1990. The survey also examined recent changes in the willingness of
respondent banks to extend non-merger-related C&I loans to middle-market
firms and to small businesses and to provide permanent financing to
commercial real estate projects. In addition, the usual questions were
asked regarding changes in banks' willingness to lend to households.
The responses indicate that the weakness in the growth of non-merger-
related business loans in both episodes owed primarily to reduced demand
from customers, but it also reflected tightened lending policies of
respondent banks. Respondents indicated that since the end of 1989 they
have attempted to tighten the availability of business loans to middle-
market firms and to small businesses mainly because of a less favorable-
economic outlook and a deterioration in their loan portfolios. The latter
situation likely also reflects the economic situation as well as current or
anticipated capital pressures. Respondents also mentioned industry-specific
problems and regulatory pressures. In general, respondents with assets of
less than $10 billion exhibited more restraint with respect to business
lending than very large banks. Both medium-sized and very large respondents
(assets of $10 billion or more) reported a considerable reduction since last
year in their willingness to make commercial real estate loans. Survey
respondents are, by industry standards, large banks, which control about
-6-
one-third of industry assets, and their responses may not be fully
representative of the industry as a whole.
C&I Loan Growth in 1989. Growth of C&I loans (other than those
identifiable as merger-related) is estimated to have virtually ceased in
1989. 1 About one-half of survey respondents indicated that their own C&I
lending, net of merger-related loans, also weakened last year. They
attributed this weakening mainly to reduced lending to middle-market and
large firms, with relatively little contribution from small businesses. 2
Most commonly they ascribed the weaker loan growth to customers' reduced
funding needs, but almost as frequently they cited more stringent credit
standards or tighter lending terms or both. Several banks mentioned that
weaker loan growth last year also owed to their customers' increased
reliance on commercial paper; a few banks indicated that C&I loan growth was
damped last year by customers' greater reliance on bonds.
C&I Loan Growth in Early 1990. Although non-merger-related C&I loans
at all banks showed no growth on balance last year, they are estimated to
have expanded during the final two quarters. This measure of business
credit weakened after the turn of the year, however. About 40 percent of
respondent banks indicated that the growth of C&I loans other than those
made to finance mergers and acquisitions slowed at their banks during the
first four months of 1990 relative to the last quarter of 1989. Most of the
remaining banks saw no change in this measure of C&I loan growth over the
1. Merger-related loans include those made to finance leveraged buyouts,other mergers and acquisitions, and defensive restructurings--such as equityand debt buybacks--related to mergers and acquisitions.2. About one-quarter of respondents experienced a pickup in non merger-
related loan growth last year. By far the most important source of thisstrength was middle market firms.
-7-
period. With respect to the size of customer, many more banks cited middle-
market or large firms as borrowers whose loan growth had slowed than cited
small businesses. The major reason that respondent banks gave for the
slower loan growth of their large and middle market customers was reduced
funding needs. Other reasons respondents gave for large firms included
their customers' greater reliance on commercial paper and the respondents
more stringent credit standards for approving these loans or the tighter
rate or nonrate terms placed on them. For middle-market firms, respondents
cited more stringent credit standards and tighter loan terms to be almost as
important a factor in explaining the weaker loan growth as reduced demand;
for small business, they most frequently cited tighter credit standards as
the reason for weaker loan growth.
Recent Changes in Willingness to Lend to Middle Market and Smaller
Firms. More than one-half of the respondent banks indicated that since late
1989 they had tightened their credit standards for lending both to middle-
market firms and to small businesses. 4 Banks with assets below $10
billion showed much more inclination to tighten than did very large banks;
about one out of ten respondents indicated that its loan policies had
tightened "considerably." The primary reason given for tightening credit
availability to middle-market and small firms was a less-favorable economic
outlook. The second most frequently given reason was a deterioration in the
3. In part, this difference may reflect the composition of respondents'business loan portfolios, almost one-half of which respondents reported toconsist of loans to large customers, about one-third to middle-marketcustomers, and the rest to small businesses.4. For purposes of this survey, "small businesses" were defined as firms
with annual sales of $50 million to $250 million; a number of banks usedtheir own definitions, however. Many of these had lower limits, in the $5to $10 million area, and some had an upper limit below $250 million.
-8-
quality of banks' loan portfolios, which likely also reflected concern about
the economic situation as well as current or anticipated capital pressures.
Other reasons frequently cited for tightening were regulatory pressures and
industry-specific problems. Relatively few banks explicitly listed pressure
on their capital positions as a reason for restraint, but those that did
considered this factor to be among the most important.
Banks reported that, besides tightening their standards for determining
which loan applicants qualify for credit, they have recently tightened terms
on loans they are currently willing to make. With respect to middle-market
customers, more than one-half of the respondents indicated that they had
moved to make loan covenants more stringent since late 1989 and a similar
number reported that they had tightened collateral requirements; they gave
comparable responses with respect to small-business customers. About 30
percent of banks indicated that since late 1989 they had reduced the size of
credit lines they were making available to middle-market firms. As for
pricing, banks on balance reported that spreads of loan rates over base-
lending rates had increased in the past six months, for middle-market and
small-business lending. That many banks reported lower spreads, however,
perhaps reflected the higher credit standards they had put in place or the
lower demand experienced during the period examined. The evidence for
tighter lending terms, as with that for more stringent credit standards, is
stronger at medium-sized than at very large banks.
Lending for Commercial Real Estate. Respondents reported considerable
tightening of standards since late 1989 with respect to commercial real
-9-
estate lending (excluding construction and land development loans). 5
About 80 percent of respondents tightened their standards for lending on
commercial offices in the past six months, a large share "considerably."
The evidence of tighter standards for industrial structures and other
commercial real estate over the past six months is only slightly less
strong. Both medium-sized and very large banks have exhibited similar
restraint with respect to lending for commercial real estate since late last
year.
Willingness to Lend to Households. As in recent surveys, respondent
banks on balance had become a bit more willing to extend consumer
installment credit in the three months ending with the survey date. As in
the February survey, however, there was little evidence of an increase in
banks' willingness to extend the broader category of consumer credit that
includes loans made under home equity lines.
5. As reported in the January 1990 Senior Loan Officer Opinion Survey, 80percent of respondents had become less willing to make construction and landacquisition and development loans during the second half of 1989.

-10-
SENIOR LOAN OFFICER OPINION SURVEY ON BANK LENDING PRACTICESAT SELECTED LARGE BANKS IN THE UNITED STATES
(Status of policy as of May 1990)(Number of banks and percent of banks answering question)
(By volume of total domestic assets, in $ billions, as of December 31, 1989)1
1. What is the rough percentage distribution of C&I loans on your bank's books among large corporate firms, middle marketfirms, and small businesses? (The middle market has been categorized as consisting of firms with annual sales of between $50and $250 million; in answering this question, refer either to this definition or to any other that may be employed at your bank.Please indicate the definition used if it is other than the one suggested. "Large" borrowers would then be those larger thanmiddle market customers and " small" borrowers those that are smaller. Percentages should add to 100.)
1. large firms
Banks
All Respondents 17$10.0 and Over 2Under $10.0 15
)-20% 21-40% 41-60%
Pet Banks Pet Banks Pet
29.3 197.1 9
50.0 10
32.8 9 15.532.1 5 17.933.3 4 13.3
41-80% Over 804--- ean Total
Banks Pet Banks Pet pet* Banks
11 19.0 2 3.4 48.2 5810 35.7 2 7.1 54.6 28
1 3.3 0 0 27.9 30
ii. middle market firms
All Respondents$10.0 and OverUnder $10.0
iii. small firms
All Respondents$10.0 and OverUnder $10.0
0-20%-------------
Banks Pet
10 17.28 28.62 6.7
0-20% --------------
Banks Pot
37 63.821 75.016 53.3
21-40% 41-60% 61-80% Over 80%--------- --------------- ---- --- Mean Total
Banks Pet Banks Pot Banks Pet Banks Pet pot* Banks
20 34.5 22 37.9 4 6.9 2 3.4 35.5 5812 42.9 8 28.6 0 0 0 0 31.8 28B 26.7 14 46.7 4 13.3 2 6.7 47.3 30
21-40% 41-60% 61-80% Over 80%---------- --------------- --------------- ------------- Mean Total
Banks Pet Banks Pet Banks Pet Banks Pet pet* Banks
15 25.9 3 5.2 2 3.4 1 1.7 16.2 586 21.4 1 3.6 0 0 0 0 13.5 289 30.0 2 6.7 2 6.7 1 3.3 24.9 30
2. Apart from lending estimated to have been for purposes of financing merger-related activities, C&I loans nationwide showedlittle if any growth in 1989. At your bank, how did growth of C&I loans in 1989--other than those made to financemerger-related activities--compare with growth of such non merger-related loans in 19887 (Merger-related loans include thosemade to finance leveraged buyouts, other mergers and acquisitions, and defensive restructurings--such as equity and debtbuybacks--related to mergers and acquisitions.)
All Respondents$10.0 and OverUnder $10.0
Much Muchweaker Weaker Same Stronger stronger
---------- -------- -------- --------- ------- TotalBanks Pet Banks Pet Banks Pet Banks Pet Banks Pet Banks-----. -.--- .- .- -. -----. ---. -. - ---. - ---. .---- .----. -.--- .- .-
1 1.8 28 49.1 16 28.1 10 17.5 2 3.5 570 0.0 14 51.9 9 33.3 4 14.8 0 0.0. 271 3.3 14 46.7 7 23.3 6 20.0 2 6.7 30
1 As of December 31,1989, 28 respondents had domestic assets of $10.0 billion or more; combined assets of these bankstotalled $721 billion, compared to $938 billion for the entire panel of 60 banks, and $2.91 trillion for all domesticallychartered federally insured commercial banks.
* Weighted by volume of commercial and industrial loans to domestic addressees as of April 18, 1990.
Note: In questions 3, 4, 6 and 8 "mean" refers to average rank, with 1 most important, 2 next most important and so on.

-11-
3. If growth of non merger-related C&I loans at your bank was weaker last year than in 1988 (answer i. or ii. to question 2.):
a. which category of borrower mainly accounted for the weakness? (If more than one was an important source of weakness, pleasirank.)
All Respondents$10.0 and OverUnder $10.0
Middlemarket
Large firms firms
Banks Mean Banks Mean
21 1.4 22 1.312 1.3 9 1.2
9 1.4 13 1.4
Smallbusinesses
------- TotalBanks Mean Banks
8 1.B 293 2.3 145 1.4 15
b. did the weaker loan growth mainly reflect: (If more than one was important, please rank.)
i. reduced (non merger-related) funding needs of your customers?ii. greater reliance of your customers on commercial paper?
iii. greater reliance of your customers on junk bonds?iv. greater reliance of your customers on investment-grade bonds?v. reclassifications of Cal loans into real estate loans for reporting purposes consequent upon their
collateralization by real estate?vi. more stringent credit standards at your bank for approving (non merger-related) CII loans and/or
tighter rate and non rate terms on these loans?
MoreReduced Greater Greater Greater Reclassifi- stringentfunding reliance reliance reliance cation of credit
needs of on cosm. on junk on inv. CAI loans standards/customers paper bonds grade bonds to RE terms
------- -------- ------- - ------ - --.------------------ Total
Banks Mean Banks Mean Banks Mean Banks Mean Banks Mean Banks Mean Banks
All Respondents 19 1.2 12 1.8 3 2.3 2 2.5 2 2.5 15 1.5 28$10.0 and Over 9 1.1 7 1.9 2 2.5 2 2.5 1 2.0 6 1.5 14Under $10.0 10 1.3 5 1.8 1 2.0 0 0 1 3.0 9 1.4 14
4. If growth of non merger-related Ctl loans at your bank strengthened in 1989 (answer iv. or v. to question 2), did it mainlyinvolve (if more than one applies, please rank by importance.)
Middmark
Large firms fil----------- -----
Banks Mean Banks
All Respondents 5 1.8 13$10.0 and Over 2 1.5 4Under $10.0 3 2.0 9
le
et Smallms businesses----- ----------- TotalMean Banks Mean Banks
1.4 7 1.9 131.3 1 3.0 41.4 6 1.7 9
5. At your bank, how has growth in non merger-related C&I lending thus far in 1990 compared with growth in the last quarter of1989? (In answering, please refer to the underlying or trend movements in these loans, making allowance for normal seasonalswings.)
Muchweaker Weaker Same
----------- ----------- -----------
Banks pot Banks Pct Banks Pet
All Respondents 4 7.3 20 36.4 24 43.6
$10.0 and Over 0 0.0 13 50.0 10 38.5Under $10.0 4 13.8 7 24.1 14 48.3------- - ------ - -. --. -. -- -. -. ---.- -----. ----- .-- --
Stronger
Banks Pet
Muchstronger
---------- TotalBanks Pet Banks
6 10.9 12 7.7 14 13.8 0
1.8 553.8 260.0 29
r:
-12-
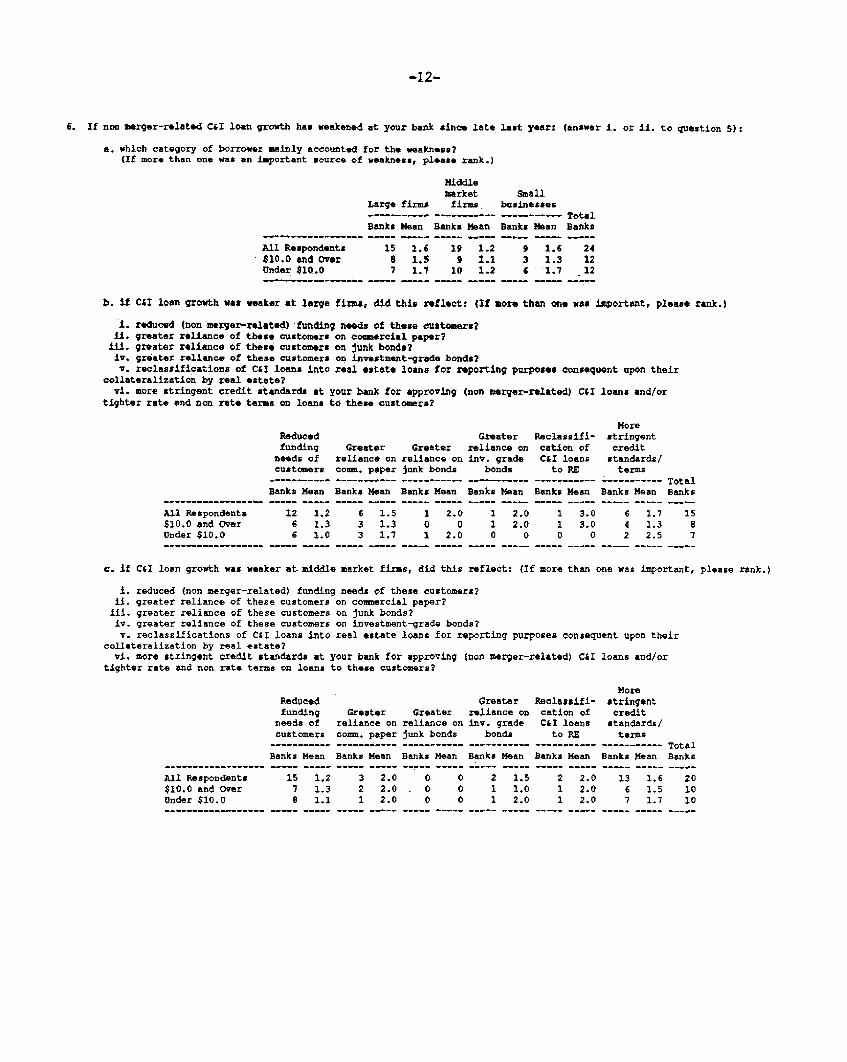
6. If non merger-related C&I loan growth has weakened at your bank since late last year: (answer i. or ii. to question 5):
a. which category of borrower mainly accounted for the weakness?(If more than one was an important source of weakness, please rank.)
Middlemarket Small
Large firms firms businessesTotal
Banks Mean Banks Mean Banks Mean Banks
All Respondents 15 1.6 19 1.2 9 1.6 24$10.0 and Over 8 1.5 9 1.1 3 1.3 12Under $10.0 7 1.7 10 1.2 6 1.7 12
b. if CSI loan growth was weaker at large firms, did this reflect: (If more than one was important, please rank.)
1. reduced (non merger-related) funding needs of these customers?ii. greater reliance of these customers on coamercial paper?ill. greater reliance of these customers on junk bonds?iv. greater reliance of these customers on investment-grade bonds?v. reclassifications of C&I loans into real estate loans for reporting purposes consequent upon their
collateralization by real estate?vi. more stringent credit standards at your bank for approving (non merger-related) CUI loans and/or
tighter rate and non rate terms on loans to these customers?
MoreReduced Greater Reclassifi- stringentfunding Greater Greater reliance on cation of credit
needs of reliance on reliance on inv. grade CI loans standards/customers comm. paper junk bonds bonds to RE terms
----- ----- ---------- --------- ---------- ------ --------- TotalBanks Mean Banks Mean Banks Mean Banks Mean Banks Mean Banks Mean Banks
All Respondents 12 1.2 6 1.5 1 2.0 1 2.0 1 3.0 6 1.7 15$10.0 and Over 6 1.3 3 1.3 0 0 1 2.0 1 3.0 4 1.3 8Under $10.0 6 1.0 3 1.7 1 2.0 0 0 0 0 2 2.5 7
c. If C&I loan growth was weaker at middle market firms, did this reflect: (If more than one was important, please rank.)
I. reduced (non merger-related) funding needs of these customers?ii. greater reliance of these customers on commercial paper?iii. greater reliance of these customers on junk bonds?iv. greater reliance of these customers on investment-grade bonds?v. reclassifications of C&I loans into real estate loans for reporting purposes consequent upon their
collateraliration by real estate?vi. more stringent credit standards at your bank for approving (non merger-related) CLI loans and/or
tighter rate and non rate terms on loans to these customers?
MoreReduced Greater Reclassifi- stringentfunding Greater Greater reliance on cation of creditneeds of reliance on reliance on inv. grade C&I loans standards/customers coam. paper junk bonds bonds to RE terms
- -- ----------- -------------------------------------------------------- TotalBanks Mean Banks Mean Banks Mean Banks Mean Banks Mean Banks Mean Banks
All Respondents 15 1.2 3 2.0 0 0 2 1.5 2 2.0 13 1.6 20$10.0 and 0ver 7 1.3 2 2.0 . 0 0 1 1.0 1 2.0 6 1.5 10Under $10.0 8 1.1 1 2.0 0 0 1 2.0 1 2.0 7 1.7 10
-13-
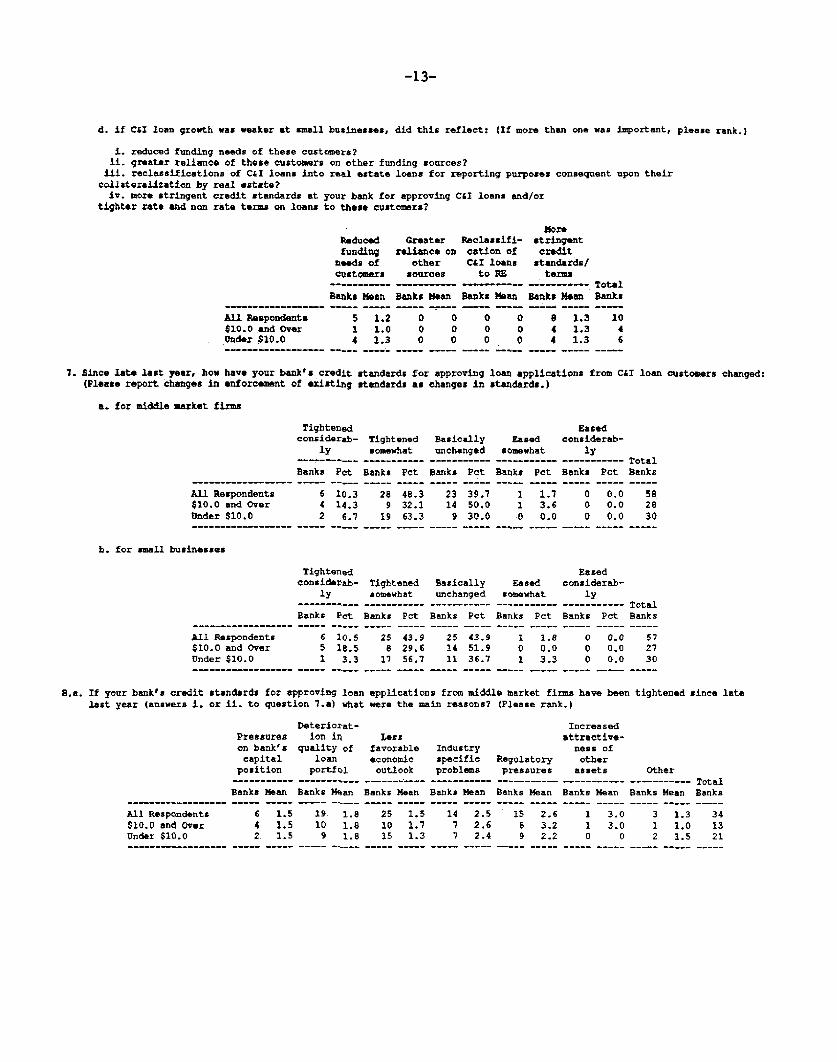
d. if CtI loan growth was weaker at small businesses, did this reflect: (If more than one was important, please rank.)
i. reduced funding needs of these customers?ii. greater reliance of these customers on other funding sources?
iii. reclassifications of C&I loans into real estate loans for reporting purposes consequent upon theircollateralization by real estate?
iv. more stringent credit standards at your bank for approving C&I loans and/ortighter rate and non rate terms on loans to these customers?
Reducedfunding
needs ofCustomers
Banks Mean
All Respondents 5 1.2$10.0 and Over 1 1.0Under $10.0 4 1.3
Greater Reclassifi-reliance on cation of
other C&I loanssources to RE
--------- -------
Banks Mean Banks Mean
0 0 0 00 0 0 00 0 0 0
7. Since late last year, how have your bank's credit standards for approving loan applications from C&I loan customers changed:(Please report changes in enforcement of existing standards as changes in standards.)
a. for middle market firms
Tightenedconsiderab- Tightened
ly somewhat--------- ----------Banks Pot Banks Pet
All Respondents 6 10.3 28 48.3$10.0 and Over 4 14.3 9 32.1Under $10.0 2 6.7 19 63.3
b. for small businesses
Tightenedconsiderab- Tightened
ly somewhat-------- I--- -----------
Banks Pot Banks Pot
All Respondents 6 10.5 25 43.9$10.0 and Over 5 18.5 8 29.6Under $10.0 1 3.3 17 56.7
Basicallyunchanged
---------Banks Pot
23 39.714 50.09 30.0
Easedsomewhat
Banks Pet
1 1.71 3.60 0.0
Easedconsiderab-
ly-------- TotalBanks Pot Banks
0 0.0 580 0.0 280 0.0 30
EasedBasically Eased considerab-unchanged somewhat ly
----------- ----------- ----------- TotalBanks Pot Banks Pot Banks Pet Banks
25 43.9 1 1.8 O 0.0 5714 51.9 0 0.0 0 0.0 2711 36.7 1 3.3 0 0.0 30
B.a. If your bank's credit standards for approving loan applications from middle market firms have been tightened since latelast year (answers i. or ii. to question 7.a) what were the main reasons? (Please rank.)
Deteriorat- IncreasedPressures ion in Less attractive-on bank's quality of favorable Industry ness ofcapital loan economic specific Regulatory other
position portfol outlook problems pressures assets Other----------- ---------- ---------- ----------- ---------- ----------- ----------- TotalBanks Mean Banks Mean Banks Mean Banks Mean Banks Mean Banks Mean Banks Mean Banks
All Respondents 6 1.5 19 1.8 25 1.5 14 2.5 15 2.6 1 3.0 3 1.3 34$10.0 and Over 4 1.5 10 1.8 10 1.7 7 2.6 6 3.2 1 3.0 1 1.0 13Under $10.0 2 1.5 9 1.8 15 1.3 7 2.4 9 2.2 0 0 2 1.5 21
Morestringentcredit
standards/terms
Banks Mean
8 1.34 1.34 1.3
TotalBanks
1046
-14-
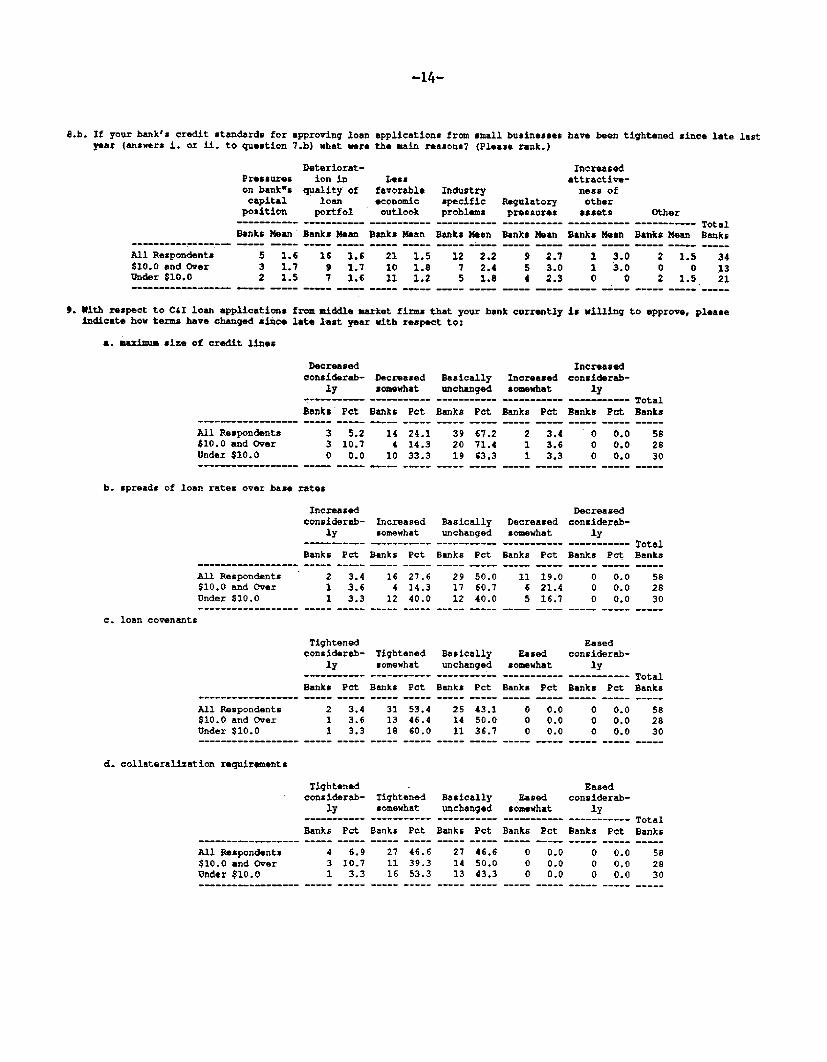
8.b. If your bank's credit standards for approving loan applications from small businesses have been tightened since late lastyear (answers i. or ii. to question 7.b) what were the main reasons? (Please rank.)
Deteriorat- IncreasedPressures ion in Less attractive-on bank"s quality of favorable Industry ness ofcapital loan economic specific Regulatory other
position portfol outlook problems pressures assets Other- ------ --------- -------- ---------- --------- Total
Banks Mean Banks Mean Banks Mean Banks Mean Banks Mean Banks Mean Banks Mean Banks
All Respondents 5 1.6 16 1.6 21 1.5 12 2.2 9 2.7 1 3.0 2 1.5 34$10.0 and Over 3 1.7 9 1.7 10 1.8 7 2.4 5 3.0 1 3.0 0 0 13Under $10.0 2 1.5 7 1.6 11 1.2 5 1.8 4 2.3 0 0 2 1.5 21
9. With respect to CSI loan applications from middle market firms that your bank currently is willing to approve, pleaseindicate how terms have changed since late last year with respect to:
a. maximum size of credit lines
Decreasedconsiderab- Decreased
ly somewhat
Banks Pet Banks Pot
All Respondents 3 5.2 14 24.1$10.0 and Over 3 10.7 4 14.3Under $10.0 0 0.0 10 33.3
b. spreads of loan rates over base rates
Increasedconsiderab-
ly
Banks
All Respondents 2$10.0 and Over 1Under $10.0 1
c. loan covenants
All Respondents$10.0 and OverUnder $10.0
Pot
3.43.63.3
Tightenedconsidereb-
ly---------Banks Pet
2 3.41 3.6
1 3.3
d. collateralization requirements
Tightenedconsiderab-
ly---------
Banks Pot
All Respondents 4 6.9$10.0 and Over 3 10.7Under $10.0 1 3.3
IncreasedBasically Increased considerab-unchanged somewhat ly
---- TotalBanks Pet Banks Pet Banks Pet Banks
39 67.2 2 3.4 0 0.0 5820 71.4 1 3.6 0 0.0 2819 63.3 1 3.3 0 0.0 30
DecreasedIncreased Basically Decreased considerab-somewhat unchanged somewhat ly
------- ------- ------ -- ---- TotalBanks Pet Banks Pet Banks Pot Banks Pot Banks
16 27.6 29 50.0 11 19.0 0 0.0 584 14.3 17 60.7 6 21.4 0 0.0 28
12 40.0 12 40.0 5 16.7 0 0.0 30
Tightenedsomewhat----------
Banks Pot
31 53.413 46.418 60.0
Tightenedsomewhat
---------
Banks Pet
27 46.611 39.316 53.3
EasedBasically Eased considerab-unchanged somewhat ly
---- ------- --- ---- TotalBanks Pot Banks Pet Banks Pet Banks
25 43.1 0 0.0 0 0.0 5814 50.0 0 0.0 0 0.0 2811 36.7 0 0.0 0 0.0 30
EasedBasically Eased considerab-unchanged somewhat ly---------- --------- ----------
Banks Pot Banks Pet Banks Pet
27 46.6 0 0.0 0 0.014 50.0 0 0.0 0 0.013 43.3 0 0.0 0 0.0
- -- - -. -. --- .-- . -- - -- .- .- - -- . .- - --
TotalBanks
582830

-15-
10. With respect to C&I loan applications from small businesses that your bank currently is willing to approve please indicatehow terms have changed since late last year with respect to:
a. maximum size of credit linesDecreased Increasedconsiderab- Decreased Basically Increased considerab-
ly somewhat unchanged somewhat ly----------- ----------- ----------- ----------- ----------- TotalBanks Pet Banks Pet Banks Pet Banks Pet Banks Pot Banks
All Respondents 0 0.0 3 5.4 50 89.3 3 5.4 0 0.0 56$10.0 and Over 0 0.0 2 7.7 22 84.6 2 7.7 0 0.0 26Under $10.0 0 0.0 1 3.3 28 93.3 1 3.3 0 0.0 30
b. spreads of loan rates over base rates
Increased Decreasedconsiderab- Increased Basically Decreased considerab-
ly somewhat unchanged somewhat lyBanks Pct Banks Pet Baks Pt Banks ot Bank P TotanklBanks Pot Banks Pot Banks Pet Banks Pet Banks Pot Banks
All Respondents 2 3.6$10.0 and Over 1 3.8Under $10.0 1 3.3
9 16.1 38 67.91 3.8 : 21 80.88 26.7 17 56.7
c. loan covenants
Tightenedconsiderab- Tightened Basically
ly somewhat unchanged
Banks Pet Banks Pet Banks Pet------------------ --- ----- ----- ----- ----- -----
All Respondents 2 3.6 22 39.3 32 57.1$10.0 and Over 1 3.8 8 30.8 17 65.4Under $10.0 1 3.3 14 46.7 15 50.0
7 12.5 0 0.0 563 11.5 0 0.0 264 13.3 0 0.0 30
EasedEased considerab-
somewhat ly---- r---- -------- TotalBanks Pot Banks Pot Banks
0 0.0 0 0.0 560 0.0 0 0.0 260 0.0 0 0.0 30
d. collateralization requirements
All Respondents$10.0 and OverUnder $10.0
Tightenedconsiderab-
ly-----------
Banks Pet
4 7.12 7.7
Tightenedsomewhat
-----------Banks Pet
25 44.68 30.8
Basicallyunchanged-----------
Banks Pet
27 48.216 61.5
EasedEased considerab-
somewhat ly----------- ----------- TotalBanks Pet Banks Pet Banks
0 0.0 0 0.0 560 0.0 0 0.0 26
2 6.7 17 56.7 11 36.7- 0 0.0 0 0.0 30
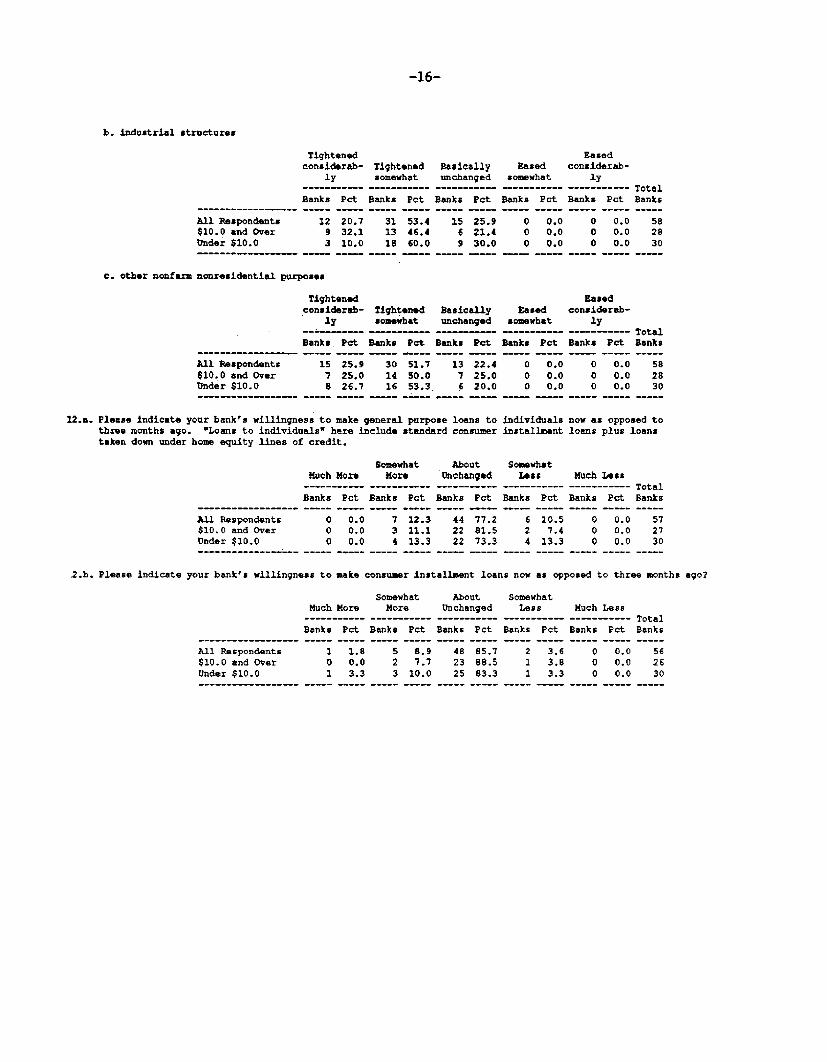
11. Apart from construction and land development loans, since late last year, how have your bank's creditstandards changed for approving applications for nonfarm nonresidential real estate loans used tofinance: (Please report changes in enforcement of existing standards as changes in standards.)
a. commercial office buildings
Tightenedconsiderab- Tightened Basically Eased
ly somewhat unchanged somewhat----------- ----------- ----------- -----------
Banks Pet Banks Pct Banks Pot Banks Pet
All Respondents 22 37.9 24 43.1 11 19.0 0 0.0$10.0 and Over 9 32.1 12 46.4 6 21.4 0 0.0Under $10.0 13 43.3 12 40.0 5 16.7 0 0.0
Easedconsiderab-
ly-----------
Banks Pet
0 0.00 0.00 0.0
TotalBanks
582830
-16-
b. industrial structures
Tightened Easedconsiderab- Tightened Basically Eased considerab-
ly somewhat unchanged somewhat ly-------- ---- --------- -- -- T- o ta---Total
Banks Pot Banks Pot Banks Pat Banks Pot Banks Pot Banks
All Respondents 12 20.7 31 53.4 15 25.9 0 0.0 0 0.0 58$10.0 and Over 9 32.1 13 46.4 4 21.4 0 0.0 0 0.0 28Under $10.0 3 10.0 1B 60.0 9 30.0 0 0.0 0 0.0 30
c. other nonfarm nonresidential purposes
Tightened Easedconsiderab- Tightened Basically Eased considerab-
ly somewhat unchanged somewhat ly--- ----- - - -- -- ---------- -- - - ----- Total
Banks Pet Banks Pat Banks Pot Banks Pet Banks Pot Banks
All Respondents 15 25.9 30 51.7 13 22.4 0 0.0 0 0.0 58$10.0 and Over 7 25.0 14 50.0 7 25.0 0 0.0 0 0.0 28Under $10.0 8 26.7 16 53.3 6 20.0 0 0.0 0 0.0 30
12.a. Please indicate your bank's willingness to make general purpose loans to individuals now as opposed tothree months ago. "Loans to individuals" here include standard consumer installment loans plus loanstaken down under home equity lines of credit.
Somewhat AboutMuch More More Unchanged----------- ----------- ----------Banks Pot Banks Pot Banks Pot
All Respondents 0 0.0 7 12.3 44 77.2$10.0 and Over 0 0.0 3 11.1 22 81.5Under $10.0 0 0.0 4 13.3 22 73.3
SomewhatLess Much Less
----------- ---------- TotalBanks Pot Banks Pot Banks
6 10.5 0 0.0 572 7.4 0 0.0 274 13.3 0 0.0 30
2.b. Please indicate your bank's willingness to make consumer installment loans now as opposed to three months ago?
All Respondents$10.0 and OverUnder $10.9
SomewhatMuch More More---------- ---------
Banks Pot Banks Pot
1 1.8 5 8.90 0.0 2 7.71 3.3 3 10.0
AboutUnchanged---------
Banks Pot
48 85.723 88.525 83.3
SomewhatLess
---------
Banks Pot
2 3.61 3.81 3.3
Much Less------- Total
Banks Pet Banks
0 0.0 560 0.0 260 0.0 30
-17-
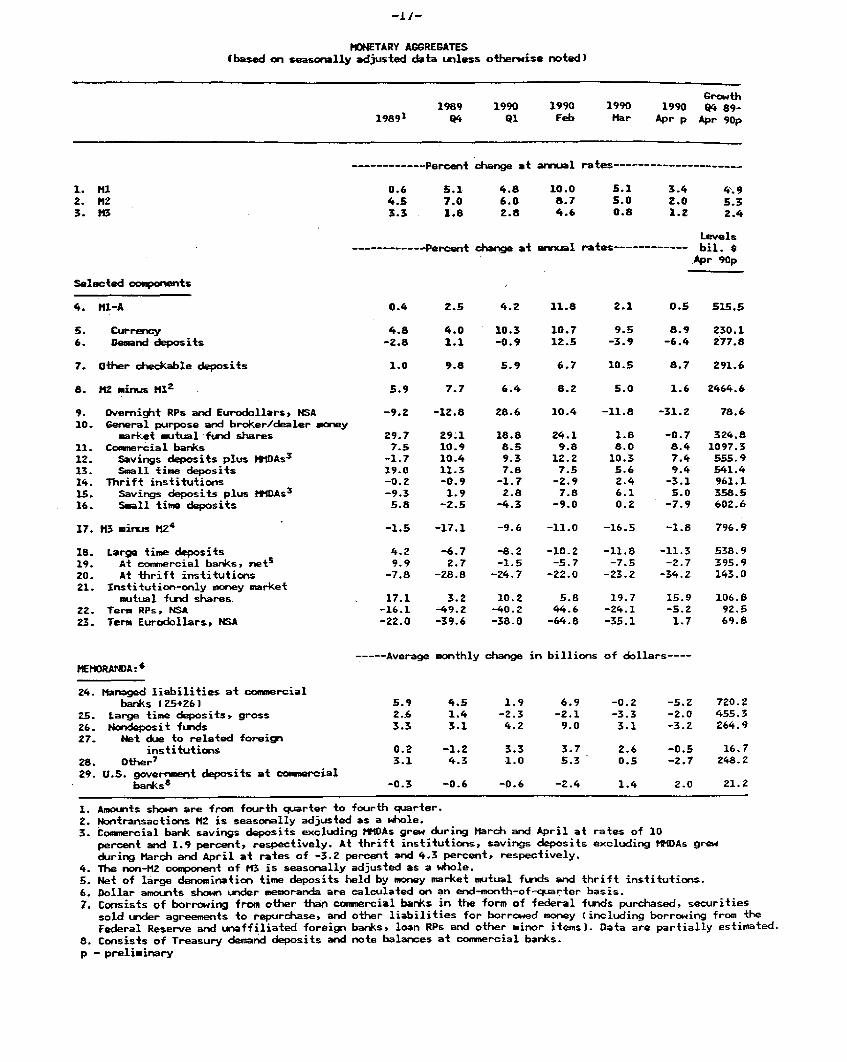
MONETARY AGGREGATES(based on seasonally adjusted data unless otherwise noted)
198911989
W4
Growth1990 1990 1990 1990 04 89-
Q1 Feb Mar Apr p Apr 90p
1. Ml2. M23. 13
Selected components
4. H1-A
5. Currency6. Demand deposits
7. Other checkable deposits
8. N2 minus MI2
9. Overnight RPs and Eurodollars, NSA10. General purpose and broker/dealer money
market mutual fund shares11. Commercial banks12. Savings deposits plus MMDAs
3
13. Small time deposits14. Thrift institutions15. Savings deposits plus MMDAs
3
16. Small time deposits
17. M3 minus M24
18. Large time deposits19. At commercial banks, net s
20. At thrift institutions
21. Institution-only money marketmutual fund shares
22. Term RPs, NSA23. Term Eurodollars, NSA
MEMORANDA:
24. Managed liabilities at commercialbanks 125+261
25. Large time deposits, gross
26. Nondeposit funds27. Net due to related foreign
institutions
28. Other7
29. U.S. government deposits at commercialbankst
----------- Percent change at annual rates-------------------..
0.6 5.1 4.8 10.0 5.1 3.4 4.94.5 7.0 6.0 8.7 5.0 2.0 5.33.3 1.8 2.8 4.6 0.8 1.2 2.4
Levels----------- Percent change at annual rates--------- bil. $
Apr 90p
0.4 2.5 4.2 11.8 2.1 0.5 515.5
4.8 4.0 10.3 10.7 9.5 8.9 230.1-2.8 1.1 -0.9 12.5 -3.9 -6.4 277.8
1.0 9.8 5.9 6.7 10.5 8.7 291.6
7.7 6.4 8.2 5.0 1.6 2464.6
-9.2 -12.8 28.6 10.4 -11.8 -31.2 78.6
29.7 29.1 18.8 24.1 1.8 -0.7 324.87.5 10.9 8.5 9.8 8.0 8.4 1097.3
-1.7 10.4 9.3 12.2 10.3 7.4 555.919.0 11.3 7.8 7.5 5.6 9.4 541.4-0.2 -0.9 -1.7 -2.9 2.4 -3.1 961.1
-9.3 1.9 2.8 7.8 6.1 5.0 358.55.8 -2.5 -4.3 -9.0 0.2 -7.9 602.6
-1.5 -17.1 -9.6 -11.0 -16.5 -1.8 796.9
4.2 -6.79.9 2.7
-7.8 -28.8
17.1-16.1-22.0
3.2-49.2-39.6
-8.2-1.5
-24.7
10.2-40.2-38.0
-10.2-5.7-22.0
5.844.6-64.8
-11.8-7.5
-23.2
19.7-24.1-35.1
-11.3-2.7-34. Z
538.9395.9143.0
15.9 106.8-5.2 92.51.7 69.8
---- Average monthly change in billions of dollars----
5.9 4.5 1.9 6.9 -0.2 -5.2 720.22.6 1.4 -2.3 -2.1 -3.3 -2.0 455.33.3 3.1 4.2 9.0 3.1 -3.2 264.9
0.2 -1.2 3.3 3.7 2.6 -0.5 16.7
3.1 4.3 1.0 5.3 0.5 -2.7 248.2
-0.3 -0.6 -0.6 -2.4 1.4 2.0 21.2
1. Amounts shown are from fourth quarter to fourth quarter.
2. Nontransactions M2 is seasonally adjusted as a whole.3. tommercial bark savings deposits excluding MMDAs grew during March and April at rates of 10
percent and 1.9 percent, respectively. At thrift institutions, savings deposits excluding MMDAs grew
during March and April at rates of -3.2 percent and 4.3 percent, respectively.4. The non-MZ component of M3 is seasonally adjusted as a whole.
5. Net of large denomination time deposits held by money market mutual funds and thrift institutions.6. Dollar amounts shown under memoranda are calculated on an end-nonth-of-quarter basis.
7. Consists of borrowing from other than commercial banks in the form of federal funds purchased, securities
sold under agreements to repurchase, and other liabilities for borrowed money (including borrowing from the
Federal Reserve and unaffiliated foreign banks, loan RPs and other minor items). Data are partially estimated.
8. Consists of Treasury demand deposits and note balances at commercial banks.
p - preliminary
__
I _ _
-18-
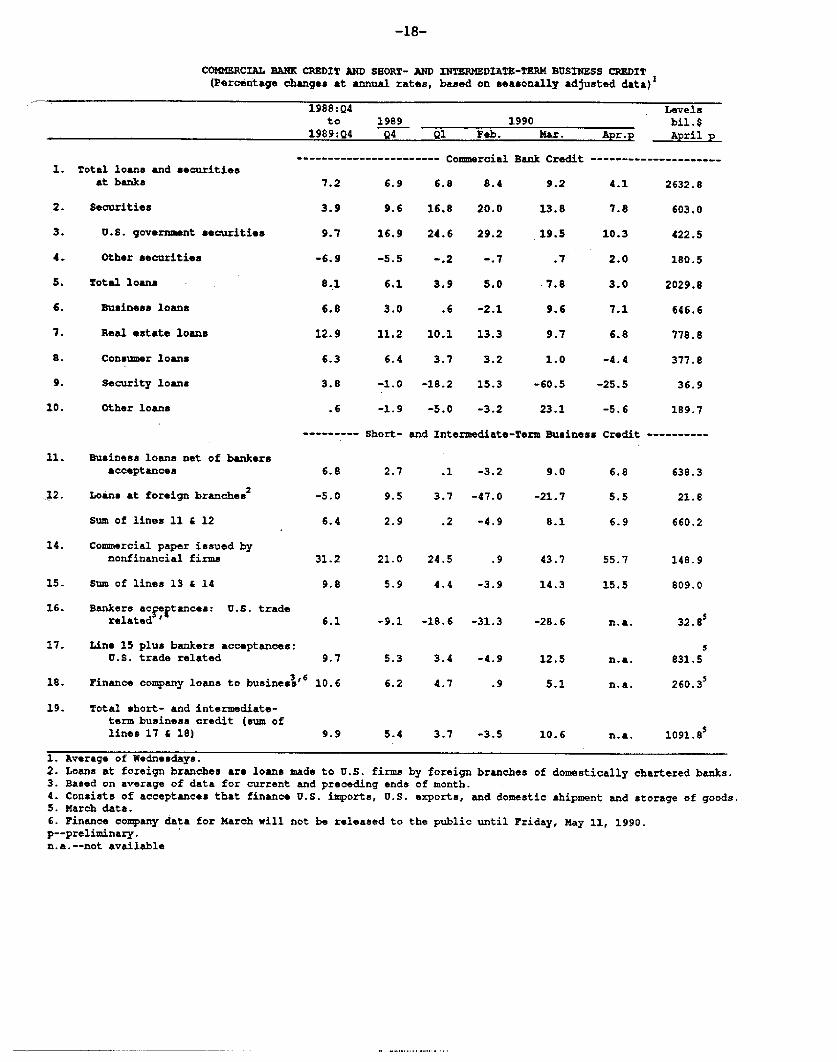
COMMERCIAL BANK CREDIT AND SHORT- AND INTERMEDIATE-TERM BUSINESS CREDIT(Percentage changes at annual rates, based on seasonally adjusted data) 1
1988:Q4to 1989
1989:Q4 Q4
1. Total loans and securities
1. Total loans and securitiesat banks
2. Securities
3. U.S. government securities
4. Other securities
5. Total loans
6. Business loans
7. Real estate loans
8. Consumer loans
9. Security loans
.0. Other loans
2
199001 Feb. Mar.
------------------- Commercial Bank Credit -
7.2 6.9 6.8 8.4 9.2
3.9 9.6 16.8 20.0 13.8
9.7 16.9 24.6 29.2 19.5
-6.9 -5.5 -. 2 -. 7 .7
8.1 6.1 3.9 5.0 7.8
6.8 3.0 .6 -2.1 9.6
.2.9 11.2 10.1 13.3 9.7
6.3 6.4 3.7 3.2 1.0
3.8 -1.0 -18.2 15.3 -60.5
.6 -1.9 -5.0 -3.2 23.1
*--- Short- and Intermediate-Term Business
11. Business loans net of bankersacceptances
12. Loans at foreign branches~
Sum of lines 11 & 12
14. Commercial paper issued bynonfinancial firms
15. Sum of lines 13 & 14
16. Bankers acceptances: U.S. traderelated '"
17. Line 15 plus bankers acceptances:U.S. trade related
3,618. Finance company loans to business 3
19. Total short- and intermediate-term business credit (sum oflines 17 & 18)
-3.2
-47.0
-4.9
21.0 24.5
5.9 4.4
9.0
-21.7
8.1
.9 43.7
-3.9 14.3
6.1 -9.1 -18.6 -31.3 -28.6
5.3 3.4 -4.9
6.2 4.7 .9
12.5
5.1
5.4 3.7 -3.5 10.6
1. Average of Wednesdays.2. Loans at foreign branches are loans made to U.S. firms by foreign branches3. Based on average of data for current and preceding ends of month.
of domestically chartered banks.
4. Consists of acceptances that finance U.S. imports, U.S. exports, and domestic shipment and storage of goods.5. March data.6. Finance company data for March will not be released to the public until Friday, May 11, 1990.p--preliminary.n.a.--not available
6.8
5.5
6.9
55.7
15.5
n.a.
n.a.
n.a.
638.3
21.8
660.2
148.9
809.0
32.8 s
831.5
260.3 3
Levelsbil.$
Apr.p April p
--------------------
4.1 2632.8
7.8 603.0
10.3 422.5
2.0 180.5
3.0 2029.8
7.1 646.6
6.8 778.8
-4.4 377.8
-25.5 36.9
-5.6 189.7
Credit----------
---
---
n.a. 1091.8 s

-19-
SELECTED FINANCIAL MARKET QUOTATIONS 1
(percent)-- -- - -- - - - -- -- - -- -- - -- -- - -- -- - -- -- - -- -- - -- -- - -- -- - -- -- - -- -- - -- -
1987
2Oct 16
Short-term rates
1989
Marchhighs
19
Dec FOMClows Mar 27
90 Change from:-------- ""'""------------------------
Mar 89 Dec 89 FOMCMay 10 highs lows Mar 27-------- " ' ~'"'~"---------- - - -- -- -- -- -
Federal funds 3
Treasury bills4
3-month6-month1-year
Commercial paper1-month3-month
Large negotiable CDs 4
1-month3-month6-month
Eurodollar deposits 5
1-month3-month
Bank prime rate
7.59
6.937.587.74
9.85 8.45 8.27 8.21 -1.64 -0.24
9.099.119.05
7.537.297.11
7.907.867.76
7.717.727.73
-1.38-1.39-1.32
0.180.430.62
7.94 10.05 8.51 8.35 8.26 -1.79 -0.258.65 10.15 8.22 8.31 8.26 -1.89 0.04
7.928.909.12
10.0710.3210.08
8.52 8.318.22 8.358.01 8.53
8.258.358.50
-1.82-1.97-1.58
-0.270.130.49
8.00 10.19 8.38 8.31 8.25 -1.94 -0.139.06 10.50 8.25 8.38 8.38 -2.12 0.13
9.25 11.50 10.50 10.00 10.00 -1.50 -0.50
-0.06
-0.19-0.14-0.03
-0.09-0.05
-0.060.00
-0.03
-0.060.00
0.00
Intermediate- and long-term rates
U.S. Treasury (constant maturity)3-year 9.52
10-year 10.2330-year 10.24
Municipal revenue(Bond Buyer) 9.59
Corporate--A utilityrecently offered 11.50
Bome mortgage ratesS&L fixed-rateS&L ARM, 1-yr.
11.588.45
9.889.539.31
7.697.777.83
8.608.528.48
8.738.828.81
-1.15-0.71-0.50
1.041.050.98
7.95 7.28 7.54 7.66 -0.29 0.38
10.47 9.29 9.84 10.14 -0.33 0.85
0.130.300.33
0.12
0.30
11.22 9.69 10.26 10.67 -0.55 0.98 0.419.31 8.34 8.56 8.62 -0.69 0.28 0.06
1989 1990
Record Lows FOMChighs Date Jan 3 Mar 27 May 10
Percent change from:
Record 1989 FOMChighs lows Mar 27
Stock prices
Dow-Jones Industrial 2810.15 1/2/90 2144.64 2736.94 2738.51 -2.55 27.69 0.06NYSE Composite 199.34 10/9/89 154.98 187.40 188.14 -5.62 21.40 0.39AMEX Composite 397.03 10/10/89 305.24 361.88 348.92 -12.12 14.31 -3.58NASDAQ (OTC) 485.73 10/9/89 378.56 439.50 433.20 -10.81 14.43 -1.43Wilshire 3523.47 10/9/89 2718.59 3286.05 3285.07 -6.77 20.84 -0.03
-- -- - -- -- - -- -- - -- -- - -- -- - -- -- - -- -- - -- -- - -- -- - -- -- - -- -- - -- -- - -- -
I/ One-day quotes except as noted.2/ Last business day prior to stock market decline on Monday
Oct. 19, 1987.3/ Average for two-week reserve maintenance period closest to
date shown. Last observation is average to date for themaintenance period ending May 16, 1990.
4/ Secondary market.5/ Bid rates for Eurodollar
deposits at 11 a.m. London time.6/ Based on one-day Thursday quotes
and futures market index changes.7/ Quotes for week ending
Friday closest to date shown.
------------------------