Embed Size (px)
Citation preview
Prefatory Note The attached document represents the most complete and accurate version available based on original copies culled from the files of the FOMC Secretariat at the Board of Governors of the Federal Reserve System. This electronic document was created through a comprehensive digitization process which included identifying the best-preserved paper copies, scanning those copies,1
and then making the scanned versions text-searchable.2
Though a stringent quality assurance process was employed, some imperfections may remain. Please note that some material may have been redacted from this document if that material was received on a confidential basis. Redacted material is indicated by occasional gaps in the text or by gray boxes around non-text content. All redacted passages are exempt from disclosure under applicable provisions of the Freedom of Information Act. 1 In some cases, original copies needed to be photocopied before being scanned into electronic format. All scanned images were deskewed (to remove the effects of printer- and scanner-introduced tilting) and lightly cleaned (to remove dark spots caused by staple holes, hole punches, and other blemishes caused after initial printing). 2 A two-step process was used. An advanced optical character recognition computer program (OCR) first created electronic text from the document image. Where the OCR results were inconclusive, staff checked and corrected the text as necessary. Please note that the numbers and text in charts and tables were not reliably recognized by the OCR process and were not checked or corrected by staff.
Content last modified 6/05/2009.
CONFIDENTIAL (FR)
SUPPLEMENT
CURRENT ECONOMIC AND FINANCIAL CONDITIONS
Prepared for theFederal Open Market Committee
By the StaffBoard of Governors
of the Federal Reserve SystemJuly 17, 1970
SUPPLEMENTAL NOTES
The Domestic Economy
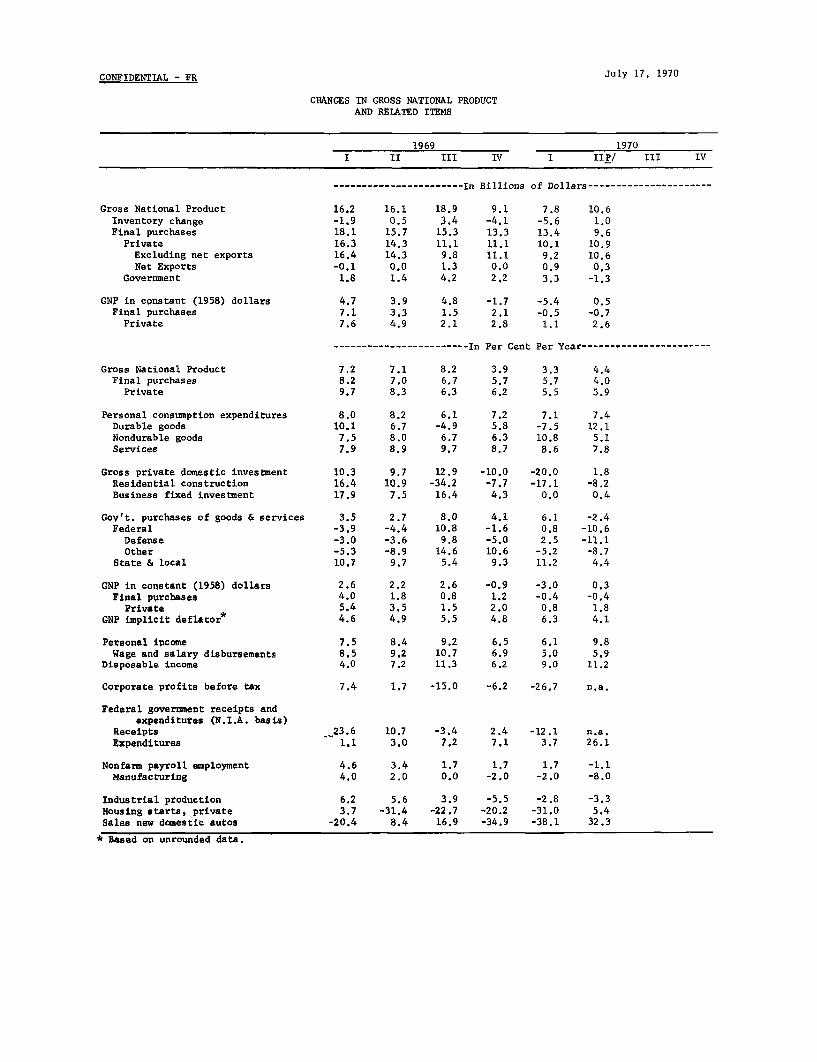
Gross national product. / Preliminary Commerce estimates
indicate that GNP increased $10.6 billion in the second quarter, to an
annual rate of $970.1 billion; this compares with an increase of $7.8
(revised) in the first quarter. In real terms, GNP was virtually
unchanged--up .3 per cent at an annual rate. In the first quarter,
according to the revised estimates, real GNP declined at an annual rate
of 3.0 per cent, following a .9 per cent rate of decline in the fourth
quarter of 1969.
The improved performance in the second quarter was mainly
attributable to inventories. Accumulation rose to an annual rate of
$2.6 billion, from $1.6 billion in the first quarter; in contrast the
rate of accumulation had declined substantially in the preceding two
quarters. Final purchases in the second quarter rose by $9.6 billion,
the smallest increase in over three years. Business fixed investment
was unchanged, as it also had been in the first quarter on the basis
of revised data. In constant dollars, such investment has been declin-
ing in recent quarters. The rise in State and local government purchases
of goods and services was smaller than in the previous quarter.
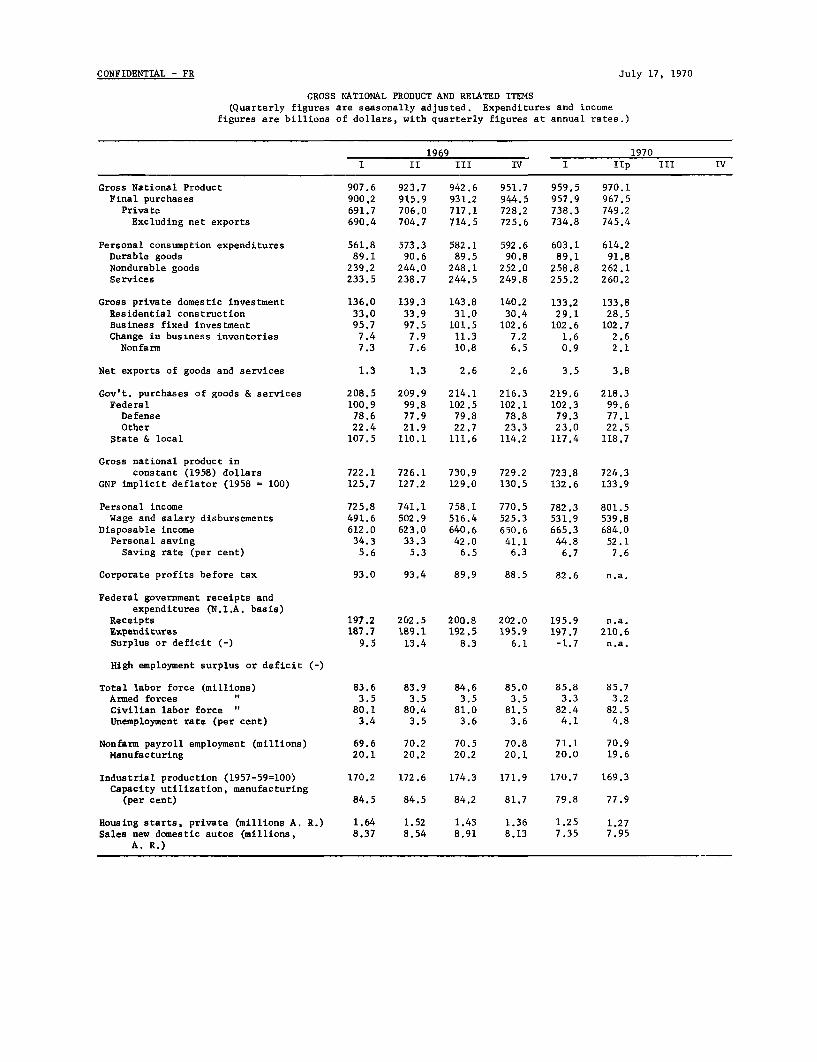
Personal income and disposable income rose by more than $19
and $19.5 billion, respectively, for the most part reflecting special
1/ Figures through the second quarter of 1970 are contained in thetables at the end of this Supplement.
- 2-
factors. Despite these large increases, consumption expenditures rose
only a little more than in the two preceding quarters, when income
gains were much more moderate, and the saving rate rose sharply to
7.6 per cent, from 6.7 per cent in the first quarter.
The GNP implicit deflator rose at a rate of 4.2 per cent in
the second quarter, much less rapid than the 6.4 per cent rate of the
first. For private GNP--which excludes the effect of changes in
government pay scales--the implicit deflator rose at an annual rate of
4.1 per cent in the second quarter, as compared with 5.3 per cent in
the first. The slowing of the rise was mainly due to the changing
composition of GNP rather than to deceleration in the rate of inflation.
Personal income declined $1 billion in June to a seasonally
adjusted annual rate of $798.8 billion, reflecting a decline of $3.7
billion in government payrolls resulting from the concentration in April
and May of the retroactive portion of the Federal pay raise. Wages and
salaries rose $1.8 billion in the private sector in June, following a
negligible increase in the previous month and a decline in April. More
than $1 billion of the June advance was in the distributive industries
where increased employment and higher pay rates in the transportation
industries accounted for most of the gain. Payrolls in manufacturing,
recorded a slight rise in June after two months of substantial declines.
Higher hourly earnings were responsible for the June increase, as
employment dropped sharply and weekly hours were unchanged.

-3-
PERSONAL INCOME, 1970(Seasonally adjusted, in billions of dollars)
Change from prior monthMarch April May June
Total personal income 6.1 18.4 -6.2 -1.0
Wages and salaries 3.9 4.9 0.7 -1.9Government 0.5 6.7 0.5 -3.7Private 3.4 -1,8 0.2 1.8
Manufacturing 1.3 -1.3 -0.8 0.3Nonmanufacturing 2.1 -0.5 1.0 1.5
Transfer payments 1.4 13.0 -7.5 0.9All other 0.8 0.5 0.6 0
Seasonally adjusted private housing starts, which were
revised upward by 2 per cent for May, rose more than a tenth further
in June to an annual rate of 1.36 million units. This was the highest
rate since March and brought the average for the second quarter as a
whole to 1.27 million units or slightly above the reduced average in
the first quarter of the year.
The advance in June was largely in single-family starts,
which until that month had been exceptionally low this year. However,
multifamily starts also increased in June. Regionally, only the North-
east showed a month-to-month decline in total starts.
Seasonally adjusted building permits declined only slightly
in June after a sharp two-month surge. Mainly reflecting this develop-
ment, indications are that starts in July may hold near the improved
rate reached in June, even allowing for the extreme volatility of the
monthly starts series. This suggests the possibility of a third quarter
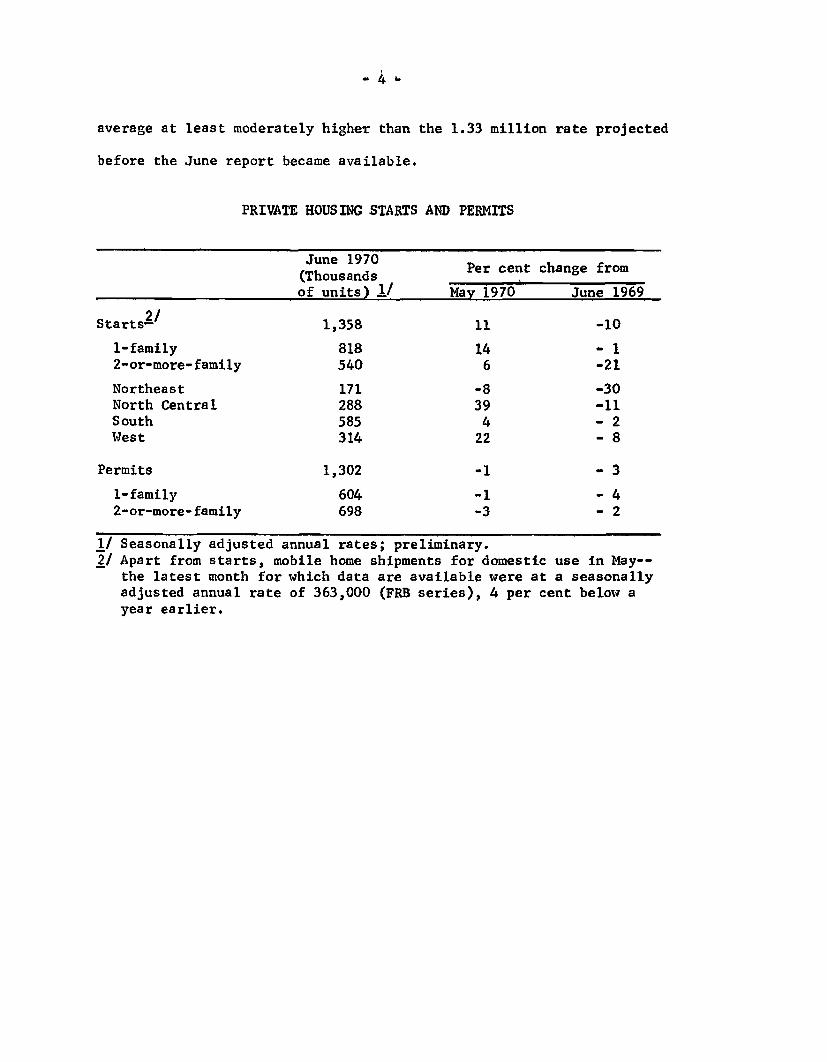
average at least moderately higher than the 1.33 million rate projected
before the June report became available.
PRIVATE HOUSING STARTS AND PERMITS
June 1970June 10 Per cent change from(Thousandsof units) ./ May 1970 June 1969
Starts- / 1,358 11 -10
1-family 818 14 - 12-or-more-family 540 6 -21
Northeast 171 -8 -30North Central 288 39 -11South 585 4 - 2West 314 22 - 8
Permits 1,302 -1 - 3
1-family 604 -1 - 42-or-more-family 698 -3 - 2
1/ Seasonally adjusted annual rates; preliminary.2/ Apart from starts, mobile home shipments for domestic use in May--
the latest month for which data are available were at a seasonallyadjusted annual rate of 363,000 (FRB series), 4 per cent below ayear earlier.
-5-
The Domestic Financial Situation
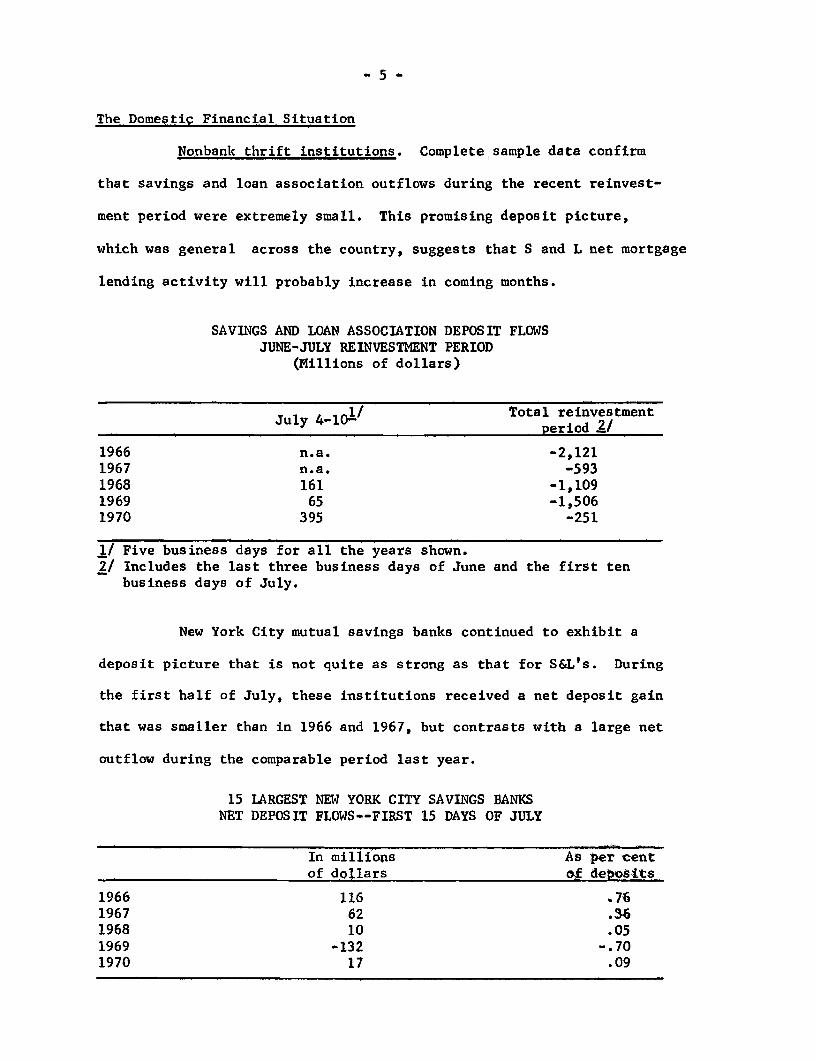
Nonbank thrift institutions. Complete sample data confirm
that savings and loan association outflows during the recent reinvest-
ment period were extremely small. This promising deposit picture,
which was general across the country, suggests that S and L net mortgage
lending activity will probably increase in coming months.
SAVINGS AND LOAN ASSOCIATION DEPOSIT FLOWSJUNE-JULY REINVESTMENT PERIOD
(Millions of dollars)
1/ Total reinvestmentJuly 4-10- period
1966 n.a. -2,1211967 n.a. -5931968 161 -1,1091969 65 -1,5061970 395 -251
1/ Five business days for all the years shown.2/ Includes the last three business days of June and the first ten
business days of July.
New York City mutual savings banks continued to exhibit a
deposit picture that is not quite as strong as that for S&L's. During
the first half of July, these institutions received a net deposit gain
that was smaller than in 1966 and 1967, but contrasts with a large net
outflow during the comparable period last year.
15 LARGEST NEW YORK CITY SAVINGS BANKSNET DEPOSIT FLOWS--FIRST 15 DAYS OF JULY
In millions As per centof dollars of deposits
1966 116 .761967 62 .361968 10 .051969 -132 -. 701970 17 .09
-6-
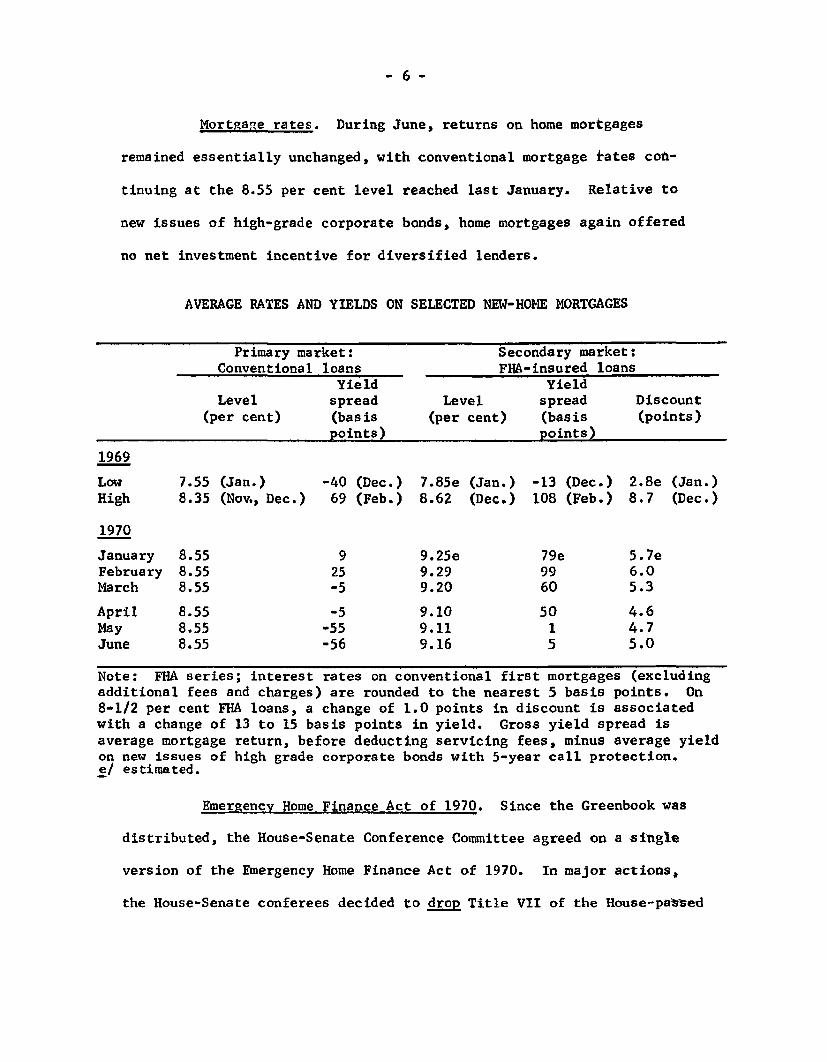
Mortgage rates. During June, returns on home mortgages
remained essentially unchanged, with conventional mortgage rates con-
tinuing at the 8.55 per cent level reached last January. Relative to
new issues of high-grade corporate bonds, home mortgages again offered
no net investment incentive for diversified lenders.
AVERAGE RATES AND YIELDS ON SELECTED NEW-HOME MORTGAGES
Primary market: Secondary market:Conventional loans FHA-insured loans
Yield YieldLevel spread Level spread Discount
(per cent) (basis (per cent) (basis (points)
points) points)
1969
Low 7.55 (Jan.) -40 (Dec.) 7.85e (Jan.) -13 (Dec.) 2.8e (Jan.)High 8.35 (Nov., Dec.) 69 (Feb.) 8.62 (Dec.) 108 (Feb.) 8.7 (Dec.)
1970
January 8.55 9 9.25e 79e 5.7eFebruary 8.55 25 9.29 99 6.0March 8.55 -5 9.20 60 5.3
April 8.55 -5 9.10 50 4.6May 8.55 -55 9.11 1 4.7June 8.55 -56 9.16 5 5.0
Note: FHA series; interest rates on conventional first mortgages (excludingadditional fees and charges) are rounded to the nearest 5 basis points. On8-1/2 per cent FHA loans, a change of 1.0 points in discount is associatedwith a change of 13 to 15 basis points in yield. Gross yield spread isaverage mortgage return, before deducting servicing fees, minus average yieldon new issues of high grade corporate bonds with 5-year call protection.e/ estimated.
Emergency Home Finance Act of 1970. Since the Greenbook was
distributed, the House-Senate Conference Committee agreed on a single
version of the Emergency Home Finance Act of 1970. In major actions,
the House-Senate conferees decided to drop Title VII of the House-pased
- 7
version, which would have given the Federal Reserve Board discretionary
authority to allow member banks to invest a designated portion of their
required reserves in the obligations of housing-oriented Federal
agencies. In addition, the conferees voted to increase the annual
authorizations under Title V of the Senate version from $60 to $105
million, to subsidize the purchase of lower interest rate mortgages for
middle-income familites.1/ Finally, the conferees decided to drop the
dual interest rate plan of the Senate, and simply extend the authority
of Secretary of HUD to set the maximum ceiling rates on FHA and VA
mortgages until October 1971.
1/ It is our understanding that there will be no funding of this programbefore October.
-8-
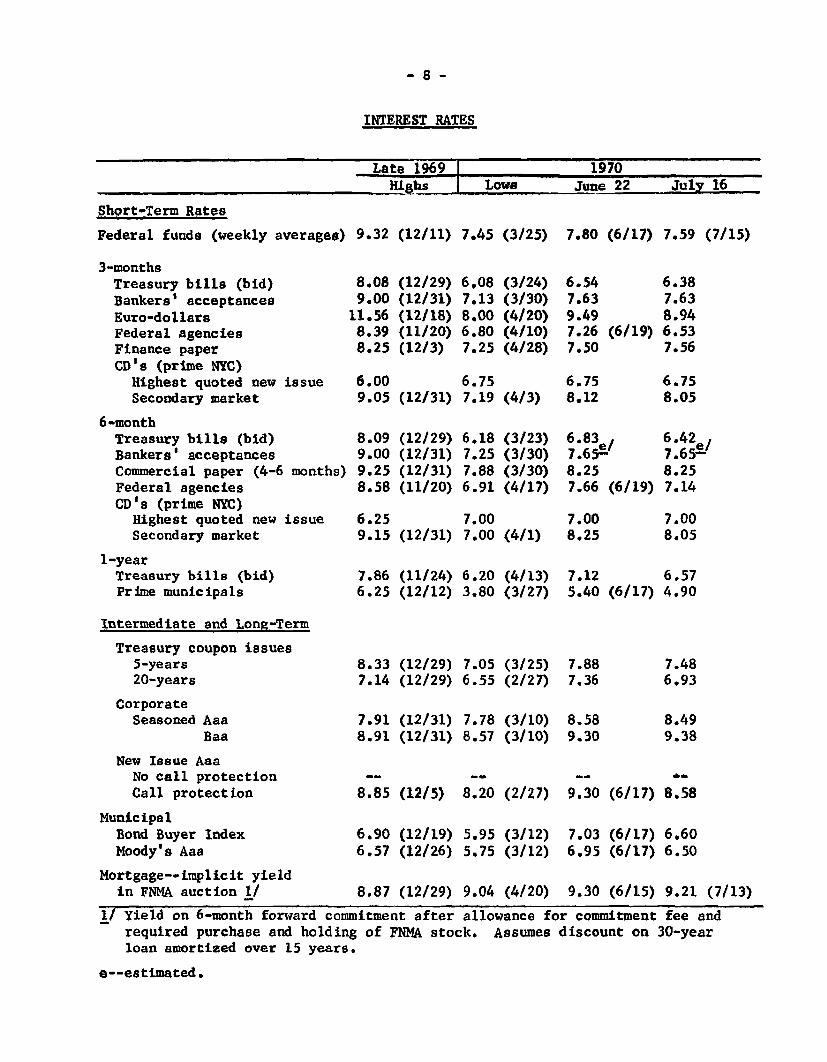
INTEREST RATES
Late 1969 1 1970Highs Lows June 22 July 16
Short-Term Rates
Federal funds (weekly averages) 9.32 (12/11) 7.45 (3/25) 7.80 (6/17) 7.59 (7/15)
3-monthsTreasury bills (bid)Bankers' acceptancesEuro-dollarsFederal agenciesFinance paperCD's (prime NYC)
Highest quoted new issueSecondary market
6-monthTreasury bills (bid)Bankers' acceptancesCommercial paper (4-6 months)Federal agenciesCD's (prime NYC)
Highest quoted new issueSecondary market
1-yearTreasury bills (bid)Prime municipals
Intermediate and Lone-Term
8.089.00
11.568.398.25
(12/29)(12/31)(12/18)(11/20)(12/3)
6.009.05 (12/31)
8.099.009.258.58
(12/29)(12/31)(12/31)(11/20)
6.259.15 (12/31)
6.087.138.006.807.25
(3/24)(3/30)(4/20)(4/10)(4/28)
6.757.19 (4/3)
6.187.257.886.91
(3/23)(3/30)(3/30)(4/17)
7.007.00 (4/1)
7.86 (11/24) 6.20 (4/13)6.25 (12/12) 3.80 (3/27)
6.54 6.387.63 7.639.49 8.947.26 (6/19) 6.537.50 7.56
6.75 6.758.12 8.05
6.83e 6.427.65i 7.65e
8.25 8.257.66 (6/19) 7.14
7.00 7.008.25 8.05
7.125.40 (6/17)
6.574.90
Treasury coupon issues5-years20-years
CorporateSeasoned Aaa
Baa
New Issue AaaNo call protectionCall protection
MunicipalBond Buyer IndexMoody's Aaa
Mortgage--implicit yieldin FNMA auction 1/
1/ Yield on 6-month forward
8.33 (12/29) 7.05 (3/25)7.14 (12/29) 6.55 (2/27)
7.91 (12/31) 7.78 (3/10)8.91 (12/31) 8.57 (3/10)
8.85 (12/5) 8.20 (2/27)
6.90 (12/19) 5.95 (3/12)6.57 (12/26) 5.75 (3/12)
8.87 (12/29)
commitment after
9.04 (4/20)
alrequired purchase and holding of FNMA stock.loan amortized over 15 years.
e--estimated.
7.887.36
8.589.30
9.30
7.486.93
8.499.38
(6/17) 8.58
7.03 (6/17) 6.606.95 (6/17) 6.50
9.30 (6/15) 9.21 (7/13)
lowance for commitment fee andAssumes discount on 30-year
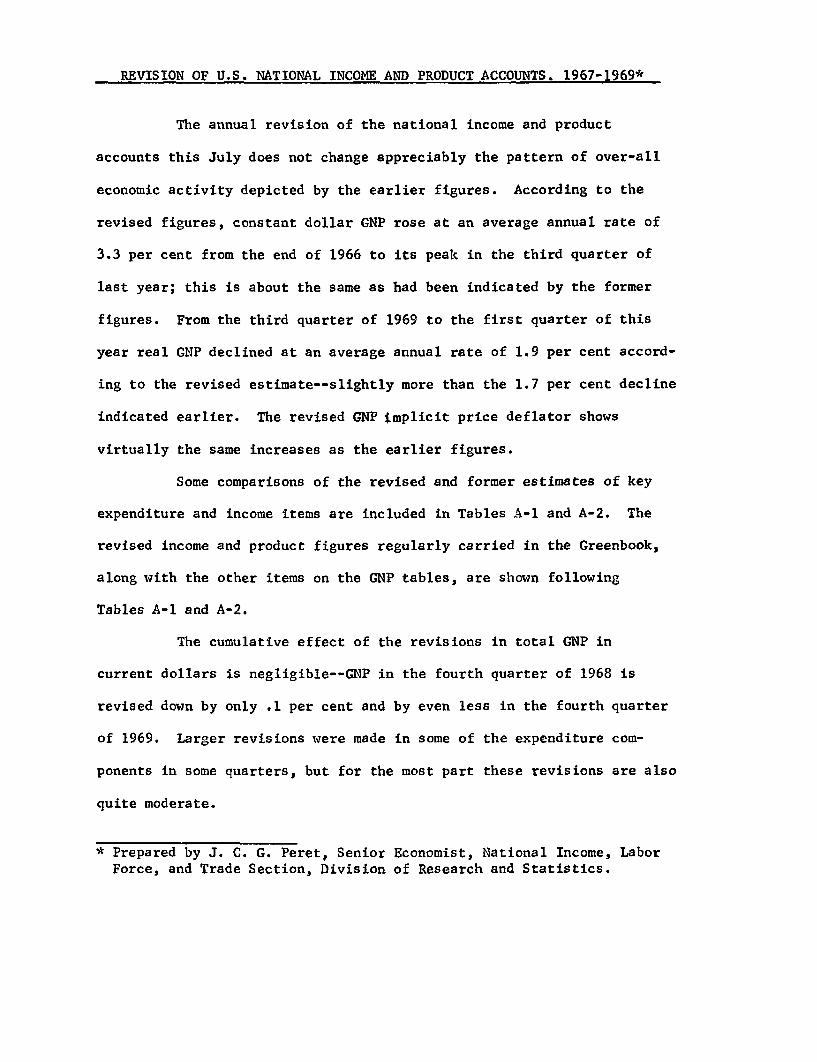
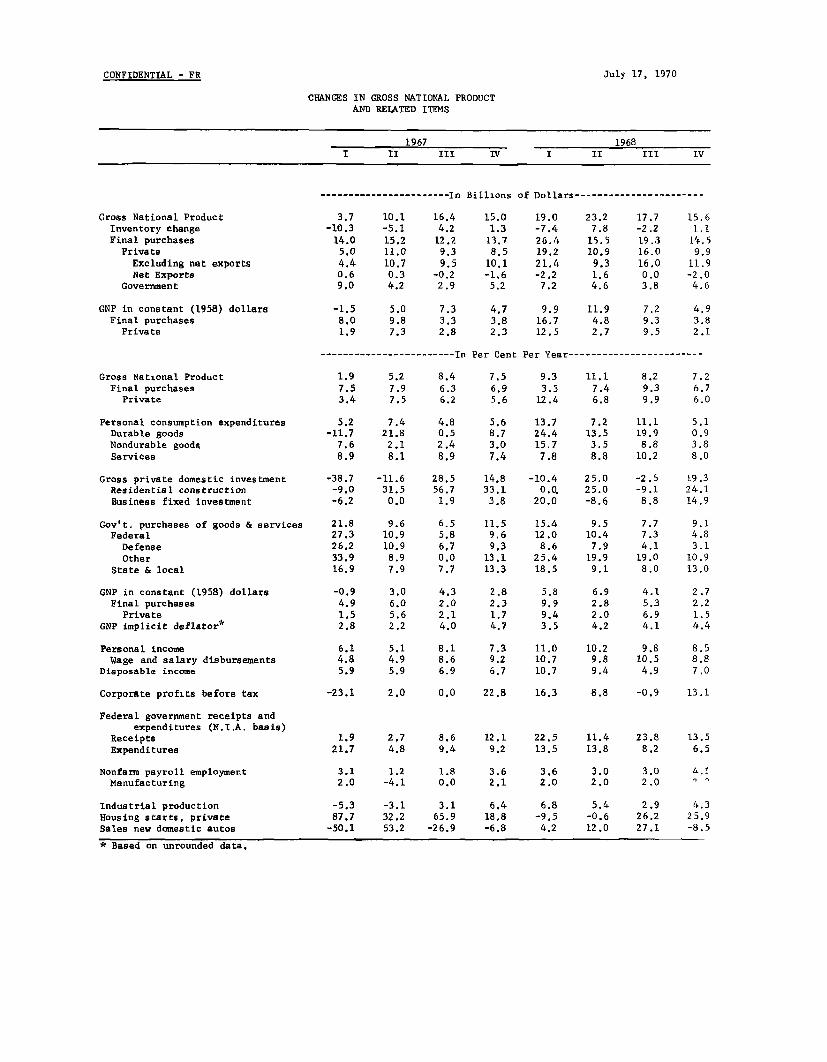
REVISION OF U.S. NATIONAL INCOME AND PRODUCT ACCOUNTS. 1967-1969*
The annual revision of the national income and product
accounts this July does not change appreciably the pattern of over-all
economic activity depicted by the earlier figures. According to the
revised figures, constant dollar GNP rose at an average annual rate of
3.3 per cent from the end of 1966 to its peak in the third quarter of
last year; this is about the same as had been indicated by the former
figures. From the third quarter of 1969 to the first quarter of this
year real GNP declined at an average annual rate of 1.9 per cent accord-
ing to the revised estimate--slightly more than the 1.7 per cent decline
indicated earlier. The revised GNP implicit price deflator shows
virtually the same increases as the earlier figures.
Some comparisons of the revised and former estimates of key
expenditure and income items are included in Tables A-1 and A-2. The
revised income and product figures regularly carried in the Greenbook,
along with the other items on the GNP tables, are shown following
Tables A-1 and A-2.
The cumulative effect of the revisions in total GNP in
current dollars is negligible--GNP in the fourth quarter of 1968 is
revised down by only .1 per cent and by even less in the fourth quarter
of 1969. Larger revisions were made in some of the expenditure com-
ponents in some quarters, but for the most part these revisions are also
quite moderate.
* Prepared by J. C. G. Peret, Senior Economist, National Income, LaborForce, and Trade Section, Division of Research and Statistics.
Personal income, disposable income and personal taxes are
now indicated to be a little higher in the fourthiquarter of 1969,
although wages and salaries have hardly been modified. The QIV 1969
saving rate is a bit lower than shown earlier.
Corporate profits before tax have been revised down
throughout the period and in the fourth quarter of 1969 are $2.9
billion below the preceding estimate. Corporate profits are now shown
to have risen a little more in the first half of 1969 than indicated
earlier and to have declined more in the second half.
The revised figures also show smaller quarterly deficits
(N.I.A. basis) for Federal government during 1967 and larger deficits
in 1968; in 1969 the revised quarterly surpluses are smaller than
indicated earlier except for the third quarter. For State and local
governments the quarter deficits are generally smaller than indicated
earlier.
- 2
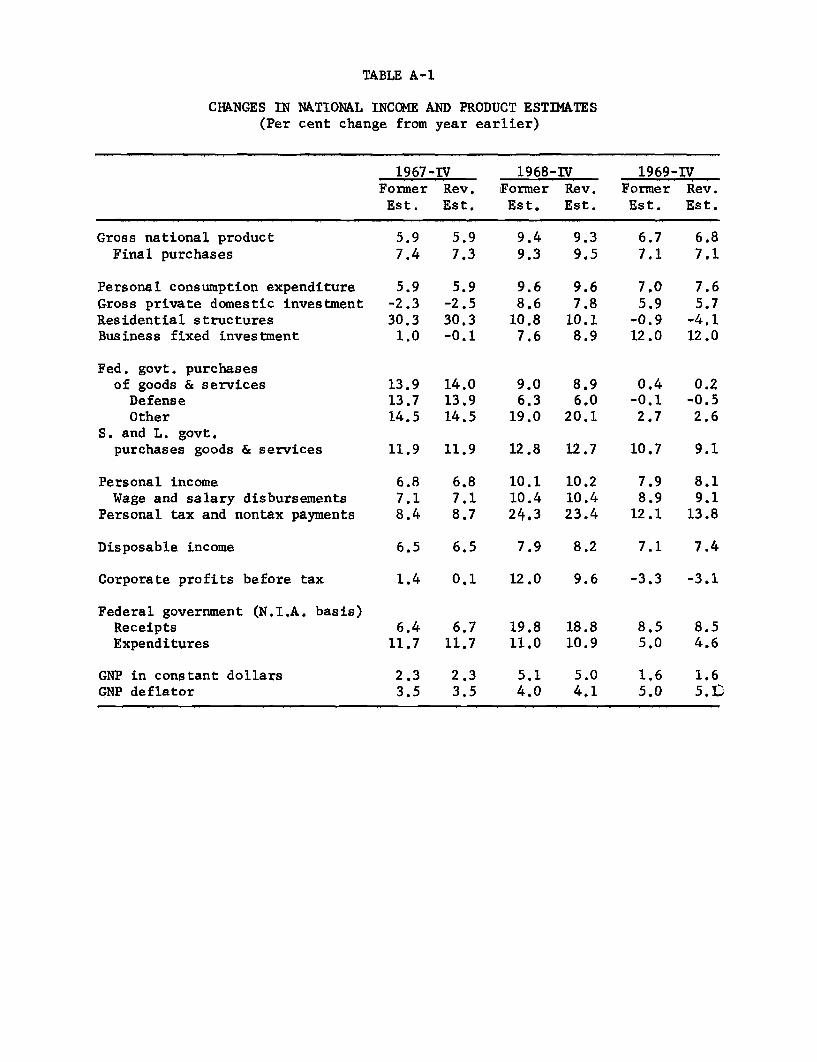
TABLE A-1
CHANGES IN NATIONAL INCOME AND PRODUCT ESTIMATES(Per cent change from year earlier)
1967-IV 1968-IV 1969-IVFormer Rev. IFormer Rev. Former Rev.Est. Est. Est. Est. Est. Est.
Gross national productFinal purchases
5.9 5.97.4 7.3
9.4 9.39.3 9.5
6.7 6.87.1 7.1
Personal consumption expenditureGross private domestic investmentResidential structuresBusiness fixed investment
Fed. govt. purchasesof goods & services
DefenseOther
S. and L. govt.purchases goods & services
Personal incomeWage and salary disbursements
Personal tax and nontax payments
5.9-2.330.31.0
13.913.714.5
5.9-2.530.3-0.1
14.013.914.5
9.68.6
10.87.6
9.06.3
19.0
9.67.8
10.18.9
8.96.0
20.1
7.05.9
-0.912.0
0.4-0.1
2.7
7.65.7-4.112.0
0.2-0.5
2.6
11.9 11.9 12.8 12.7 10.7 9.1
6.8 6.8 10.1 10.2 7.9 8.17.1 7.1 10.4 10.4 8.9 9,18.4 8.7 24.3 23.4 12.1 13.8
Disposable income 6.5 6.5 7.9 8.2 7.1 7.4
Corporate profits before tax
Federal government (N.I.A. basis)ReceiptsExpenditures
GNP in constant dollarsGNP deflator
1.4 0.1 12.0 9.6 -3.3 -3.1
6.4 6.7 19.8 18.811.7 11.7 11.0 10.9
2.3 2.33.5 3.5
5.1 5.04.0 4,1
8.5 8.55.0 4.6
1,6 1.65.0 5.1
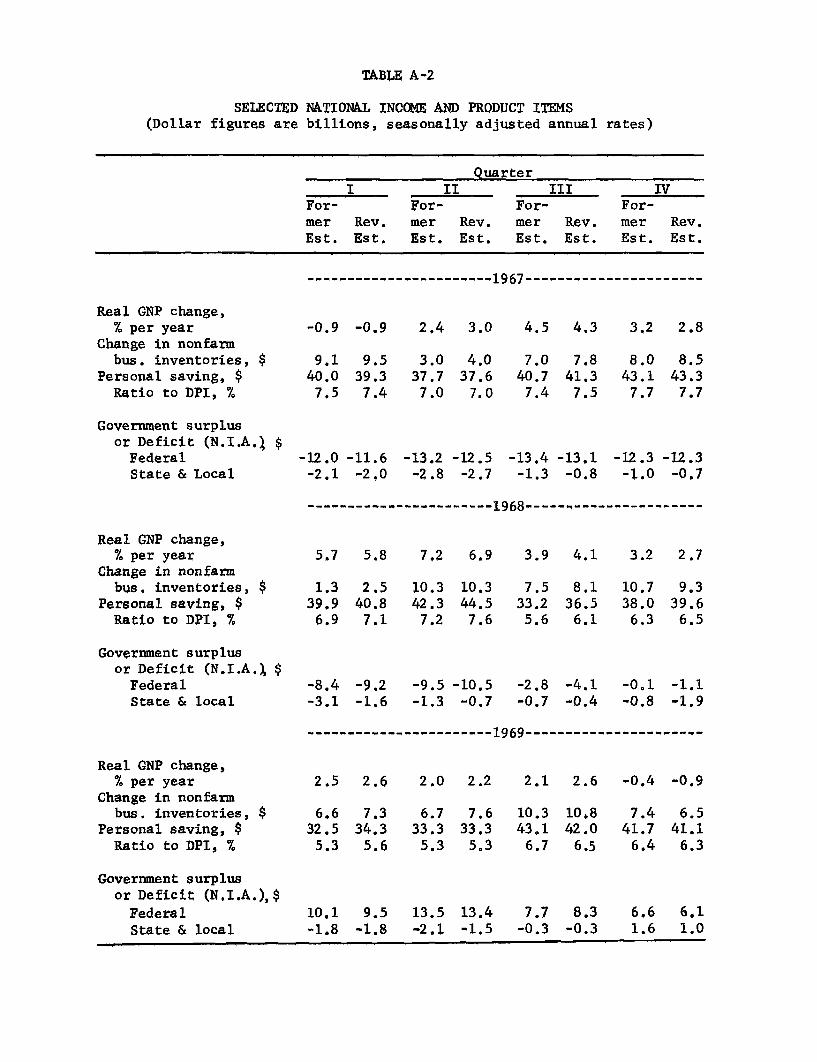
TABLE A-2
SELECTED NATIONAL INCOME AND PRODUCT ITEMS(Dollar figures are billions, seasonally adjusted annual rates)
quarterI II III IV
For- For- For- For-mer Rev. mer Rev. mer Rev. mer Rev.Est. Est. Est. Est. Est. Est. Est. Est.
----------------------- 1967------ ------
Real GNP change,% per year
Change in nonfarmbus. inventories, $
Personal saving, $Ratio to DPI, %
Government surplusor Deficit (N.I.A.1FederalState & Local
-0.9 -0.9
9.140.0
7.5
9.539.3
7.4
-12.0 -11.6-2.1 -2,0
2,4 3.0
3.037.7
7.0
4.037.67.0
-13.2 -12.5-2.8 -2.7
4.5 4.3
7.040.7
7.4
7.841.3
7.5
-13.4 -13.1-1.3 -0.8
3.2 2.8
8.043.1
7.7
8.543.3
7.7
-12.3 -12.3-1.0 -0.7
----------------------- 1968------------
Real GNP change,% per year
Change in nonfarmbus. inventories, $
Personal saving, $Ratio to DPI, %
Government surplusor Deficit (N.I.A.1 $
FederalState & local
5.7 5.8 7,2 6.9
1.339.9
6.9
2.540.8
7.1
10.342.3
7.2
10.344.5
7.6
-8.4 -9.2 -9.5 -10.5-3.1 -1.6 -1.3 -0.7
3.9 4.1
7.533.2
5.6
8.136.5
6.1
3.2 2.7
10.738.06.3
9.339.6
6.5
-2.8 -4.1 -0.1 -1.1-0.7 -0.4 -0.8 -1.9
----------------------- 1969---------------------
Real GNP change,% per year
Change in nonfarmbus. inventories, $
Personal saving, $Ratio to DPI, %
Government surplusor Deficit (N.I.A.),$
FederalState & local
2.5 2.6
6.632.5
5.3
7.334.3
5.6
2.0 2.2
6.733.3
5.3
7.633.3
5,3
2.1 2.6
10.343.16.7
10,842.0
6.5
-0.4 -0.9
7.441.7
6.4
6.541.1
6.3
10,1 9.5 13.5 13.4 7.7 8.3 6.6 6.1-1.8 -1.8 -2.1 -1.5 -0.3 -0.3 1.6 1.0
CONFIDENTIAL - FR
GROSS NATIONAL PRODUCT AND RELATED ITEMS(Quarterly figures are seasonally adjusted. Expenditures and income
figures are billions of dollars, with quarterly figures at annual rates.)
1967 1968I II III IV I II III IV
Gross National ProductFinal purchases
PrivateExcluding net exports
Personal consumption expendituresDurable goodsNondurable goodsServices
Gross private domestic investmentResidential constructionBusiness fixed investmentChange in business inventoriesNonfarm
Net exports of goods and services
Gov't. purchases of goods & servicesFederalDefenseOther
State & local
Gross national product inconstant (1958) dollars
GNP implicit deflator (1958 = 100)
Personal incomeWage and salary disbursements
Disposable incomePersonal saving
Saving rate (per cent)
Corporate profits before tax
Federal government receipts andexpenditures (N.I.A. basis)
ReceiptsExpendituresSurplus or deficit (-)
High employment surplus or deficit (-)
774.4764.8590.6585.1
480.769.8
213.1197.8
114.021.682.99.69.5
784.5780.0601.6595.8
489.673.6
214.2201.8
110.723.382.9
4.54.0
800.9792.2610.9605.3
495.573.7
215.5206,3
118.626.683.3
8.77.8
815.9805.9619.4615.4
502.575.3
217.1210.1
123.028.884.110.0
8.5
834.9832.3638.6636.8
519.779.9
225.6214.2
119.828.888.3
2.62.5
858.1847.8649.5646.1
529.182.6
227.6218.9
127.330.686.410.410.3
875.8867.6665.5662.1
543.886.7
232.6224.5
126.529.988.3
8.28.1
891.4882.1675.4674.0
550.886.9
234.8229.0
132.631.791.6
9.39.3
5.5 5.8 5.6 4.0 1.8 3.4 3.4 1.4
174.287.769.917.986.5
178.490.171.818.388.2
181.391.473.018.389.9
186.593.674.718.992.9
193.796.476.320.197.2
198.398.977.821.199.4
202.1100.7
78.622.1
101.4
206.7101.979.222.7
104.7
666.6 671.6 678.9 683.6 693.5 705.4 712.6 717.5116.2 116.8 118.0 119.4 120.4 121.7 122.9 124.3
614.2412.3533.439.3
7.4
622.1417.4541.3
37.67.0
634.7426.4550.741.3
7.5
646.3436.2559.9
43.37.7
664.0447.9574.940.8
7.1
680.9458.9588.4
44.5
7.6
697.6471.0595.636.5
6.1
712.5481.4606.0
39.6
6.5
78.4 78.8 78.8 83.3 86.7 88.6 88.4 91.3
147.7159.3-11.6
148.7161.2-12.5
151.9165.0-13.1
156.5168.8-12.3
165.3174.5
-9.2
170.0180.5-10.5
180.1184.2
-4.1
186.2187.2
-1.1
Total labor force (millions)Armed forcesCivilian labor forceUnemployment rate (per cent)
Nonfarm payroll employment (millions)Manufacturing
Industrial production (1957-59=100)Capacity utilization, manufacturing
(per cent)
Housing starts, private (millions A.R.)Sales new domestic autos (millions,
A.R.)
80.2 80.3 81.1 81.7 81.8 82.3 82.4 82.63.4 3.5 3.5 3.5 3.5 3.5 3.6 3.5
76.7 76.9 77.6 78.2 78.3 78.7 78.8 79.13.8 3.9 3.9 3.9 3.7 3.6 3.6 3.4
65.4 65.6 65.9 66.5 67.1 67.6 68.1 68.819.6 19.4 19.4 19.5 19.6 19.7 19.8 19.9
157.2 156.0
87.1 85.0
157.2
84.3
159.7
84.8
162.4
85.0
164.6
85.1
165.8
84.2
167.6
84.2
1.12 1.21 1.41 1.47 1.44 1.44 1.53 1.63
7.16 8.11 7.57 7.44 8.19 8.44 9.01 8.82
CONFIDENTIAL - FR
CHANGES IN GROSS NATIONAL PRODUCTAND RELATED ITEMS
1967 1968I II III IV I II III IV
----------------------- In Billions of Dollars-----------------------
Gross National ProductInventory changeFinal purchasesPrivate
Excluding net exportsNet Exports
Government
GNP in constant (1958) dollarsFinal purchases
Private
3.7-10.3
14.05.04.40.69.0
10.1-5.115.211.010.70.34.2
16.44.2
12.29.39.5
-0.22.9
15.01.3
13.78.510.1-1.6
5.2
-1.5 5.08.0 9.81.9 7.3
19.0-7.426.419.221.4-2.2
7.2
23.27.815.510.99.31.64.6
17.7-2.219.316.016.00.03.8
9.9 11.9 7.216.7 4.8 9.312.5 2.7 9.5
------------------------ In Per Cent Per Year------------------------
Gross National ProductFinal purchases
Private
8.4 7.56.3 6.96.2 5.6
9.3 11.1 8.23.3 7.4 9.3
12.4 6.8 9.9
Personal consumption expendituresDurable goodsNondurable goodsServices
Gross private domestic investmentResidential constructionBusiness fixed investment
Gov't. purchases of goods & servicesFederalDefenseOther
State & local
GNP in constant (1958) dollarsFinal purchases
PrivateGNP implicit deflator*
Personal incomeWage and salary disbursements
Disposable income
Corporate profits before tax
Federal government receipts andexpenditures (N.I.A. basis)
ReceiptsExpenditures
Nonfarm payroll employmentManufacturing
5.2-11.7
7.68.9
-38.7-9.0-6.2
21.827.326.233.916.9
7.4 4.821.8 0.52.1 2.48.1 8.9
-11.631.5
0.0
28.5 14.856.7 33.11.9 3.8
-0.9 3.04.9 6.01.5 5.62.8 2.2
8.1 7.38.6 9.26.9 6.7
13.7 7.2 11.1 5.124.4 13.5 19.9 0.915.7 3.5 8.8 3.87.8 8.8 10.2 8.0
-10.4 25.0 -2.5 19.30.Q 25.0 -9.1 24.1
20.0 -8.6 8.8 14.9
5.8 6.9 4.1 2.79.9 2.8 5.3 2.29.4 2.0 6.9 1.53.5 4.2 4.1 4.4
11.0 10.2 9.8 8.510.7 9.8 10.5 8.810.7 9.4 4.9 7.0
-23.1 2.0 0.0 22.8 16.3 8.8 -0.9 13.1
1.9 2,7 8.6 12.1 22.5 11.4 23.8 13.521.7 4.8 9.4 9.2 13.5 13.8 8.2 6.5
3.1 1.2 1.8 3.6 3.6 3.0 3.0 A.12.0 -4.1 0.0 2.1 2.0 2.0 2.0
Industrial productionHousing starts, privateSales new domestic autos
-5.387.7
-50.1
-3.1 3.132.2 65.953.2 -26.9
6.4 6.8 5.4 2.9 4.318.8 -9.5 -0.6 26.2 25.9-6.8 4.2 12.0 27.1 -8.5
* Based on unrounded data.
15.61.1It,59.9
11.9-2.0
4.6
July 17, 1970
CONFIDENTIAL - FR
CHANGES IN GROSS NATIONAL PRODUCTAND RELATED ITEMS
1969 1970I II III IV I IIP/ III IV
----------------------- In Billions of Dollars---------------------
Gross National ProductInventory changeFinal purchases
PrivateExcluding net exportsNet Exports
Government
GNP in constant (1958) dollarsFinal purchases
Private
Gross National ProductFinal purchases
Private
16.2-1.918.116.316.4-0.11.8
16.10.5
15.714.314.30.01.4
18.93.4
15.311.19.81.34.2
9.1-4.113.311.111.10.02,2
7.8-5.613.410.19.20.93.3
4.7 3.9 4.8 -1.7 -5.4 0.57.1 3.3 1.5 2.1 -0.5 -0.77.6 4.9 2.1 2.8 1.1 2.6
------------------------ In Per Cent Per Year----------------------
7.1 8.27.0 6.78.3 6.3
Personal consumption expenditures
Durable goodsNondurable goodsServices
Gross private domestic investmentResidential constructionBusiness fixed investment
Gov't. purchases of goods & servicesFederal
DefenseOther
State & local
GNP in constant (1958) dollarsFinal purchases
PrivateGNP implicit deflator*
Personal incomeWage and salary disbursements
Disposable income
Corporate profits before tax
Federal government receipts andexpenditures (N.I.A. basis)
ReceiptsExpenditures
Nonfarm payroll employmentManufacturing
Industrial productionHousing starts, privateSales new domestic autos
8.0 8.2 6.1 7.210.1 6.7 -4.9 5.87.5 8.0 6.7 6.37.9 8.9 9.7 8.7
10.3 9.7 12.916.4 10.9 -34.217.9 7.5 16.4
3.5-3.9-3.0-5.310.7
2.7-4.4-3.6-8.9
9.7
2.6 2.24.0 1.85.4 3.54.6 4.9
7.1 7.4-7.5 12.110.8 5.18.6 7.8
-10.0 -20.0-7.7 -17.14.3 0.0
8.010.89.8
14.65.4
-2.4-10.6-11.1
-8.74.4
-0.9 -3.0 0.31.2 -0.4 -0.42.0 0.8 1.84.8 6.3 4.1
9.2 6.510.7 6.911.3 6.2
7.4 1.7 -15.0 -6.2 -26.7 n.a.
23.6 10.7 -3.4 2.4 -12.1 n.a.1.1 3.0 7.2 7.1 3.7 26.1
4.6 3.4 1.7 1.7 1.7 -1.14.0 2.0 0.0 -2.0 -2.0 -8.0
6.2 5.6 3.93.7 -31.4 -22.7
-20.4 8.4 16.9
-5.5-20.2-34.9
-2.8-31.0-38.1
* Based on unrounded data.
July 17, 1970
CONFIDENTIAL - FR July 17, 1970
GROSS NATIONAL PRODUCT AND RELATED ITEMS(Quarterly figures are seasonally adjusted. Expenditures and income
figures are billions of dollars, with quarterly figures at annual rates.)
1969 1970I II III IV I lip III IV
Gross National ProductFinal purchasesPrivateExcluding net exports
Personal consumption expendituresDurable goodsNondurable goodsServices
Gross private domestic investmentResidential constructionBusiness fixed investmentChange in business inventoriesNonfarm
Net exports of goods and services
Gov't. purchases of goods & servicesFederalDefenseOther
State & local
Gross national product inconstant (1958) dollars
GNP implicit deflator (1958 = 100)
Personal incomeWage and salary disbursements
Disposable incomePersonal savingSaving rate (per cent)
Corporate profits before tax
Federal government receipts andexpenditures (N.I.A. basis)
ReceiptsExpendituresSurplus or deficit (-)
High employment surplus or deficit (-)
Total labor force (millions)Armed forcesCivilian labor forceUnemployment rate (per cent)
Nonfarm payroll employment (millions)Manufacturing
Industrial production (1957-59=100)Capacity utilization, manufacturing
(per cent)
Housing starts, private (millions A. R.)Sales new domestic autos (millions,
A. R.)
907.6900.2691.7690.4
561.889.1
239.2233.5
136.033.095.7
7.47.3
923.7915.9706.0704.7
573.390.6
244.0238.7
139.333.997.57.97.6
942.6931.2717.1714.5
582.189.5
248.1244.5
143.831.0
101.511.310.8
951.7944.5728.2725.6
592.690.8
252.0249.8
140.230.4
102.67.26.5
959.5957.9738.3734.8
603.189.1
258.8255.2
133.229.1
102.61.60.9
970.1967.5749.2745.4
614.291.8
262.1260.2
133.828.5
102.72.62.1
1.3 1.3 2.6 2.6 3.5 3.8
208.5100.9
78.622.4
107.5
209.999.877.921.9
110.1
214.1102.5
79.822.7
111.6
216.3102.1
78.823.3
114.2
219.6102.379.323.0
117.4
218.399.677.122.5
118.7
722.1 726.1 730.9 729.2 723.8 724.3125.7 127.2 129.0 130.5 132.6 133.9
725.8491.6612.034.3
5.6
741.1502.9623.033.35.3
758.1
516.4
640.6
42.0
6.5
770.5525.3650.6
41.16.3
782.3531.9665.344.8
6.7
801.5539.8684.0
52.1
7.6
93.0 93.4 89.9 88.5 82.6 n.a.
197.2187.7
9.5
202.5189.1
13.4
200.8192.5
8.3
202.0195.9
6.1
195.9 n.a.197.7 210.6
-1.7 n.a.
83.6 83.9 84.6 85.0 85.8 85.73.5 3.5 3.5 3.5 3.3 3.280.1 80.4 81.0 81.5 82.4 82.53.4 3.5 3.6 3.6 4.1 4.8
69.6 70.2 70.5 70.8 71.1 70.920.1 20.2 20.2 20.1 20.0 19.6
170.2
84.5
172.6
84.5
174.3
84.2
171.9
81.7
170.7
79.8
169.3
77.9
1.64 1.52 1.43 1.36 1.25 1.278.37 8.54 8.91 8.13 7.35 7.95
CONFIDENTIAL - FR July 17 , 1970
GROSS NATIONAL PRODUCT AND RELATED ITEMS(Expenditures and income figures are billions of dollars.)
1962 1963 1964 1965 1966 1967 1968 1969
Gross National Product 560.3 590.5 632.4 684.9 749.9 793.9 865.0 931.4
Final purchases 554.3 584.6 626.6 675.3 735.1 785.7 857.4 922.9Private 437.2 462.1 497.9 538.3 578.3 605.6 657.2 710.7Excluding net exports 432.1 456.2 489.4 531.4 573.0 600.4 654.7 708.8
Personal consumption expenditures 355.1 375.0 401.2 432.8 466.3 492.1 535.8 577.5Durable goods 49.5 53.9 59.2 66.3 70.8 73.1 84.0 90.0
Nondurable goods 162.6 168.6 178.7 191.1 206.9 215.0 230.2 245.8
Services 143.0 152.4 163.3 175.5 188.6 204.0 221.6 241.6
Gross private domestic investment 83.0 87.1 94.0 108.1 121.4 116.6 126.5 139.8Residential construction 25.3 27.0 27.1 27.2 25.0 25.1 30.3 32.0
Business fixed investment 51.7 54.3 61.1 71.3 81.6 83.3 88.7 99.3Change in business inventories 6.0 5.9 5.8 9.6 14.8 8.2 7.6 8.5Nonfarm 5.3 5.1 6.4 8.6 15.0 7.5 7.5 8.0
Net exports of goods & services 5.1 5.9 8.5 6.9 5.3 5.2 2.5 1.9
Gov't. purchases of goods & services 117.1 122.5 128.7 137.0 156.8 180.1 200.2 212.2Federal 63.4 64.2 65.2 66.9 77.8 90.7 99.5 101.3Defense 51.6 50.8 50.0 50.1 60.7 72.4 78.0 78.8Other 11.8 13.5 15.2 16.8 17.1 18.4 21.5 22.6
State & local 53.7 58.2 63.5 70.1 79.0 89.4 100.7 110.8
Gross national product inconstant (1958) dollars 529.8 551.0 581.1 617.8 658.1 675.2 707.2 727.1
GNP implicit deflator (1958=100) 105.8 107.2 108.8 110.9 113.9 117.6 122.3 128.1
Personal income 442.6 465.5 497.5 538.9 587.2 629.3 688.7 748.9
Wage and salary disbursements 296.1 311.1 333.7 358.9 394.5 423.1 464.8 509.0Disposable income 385.3 404.6 438.1 473.2 511.9 546.3 591.2 631.6
Personal saving 21.6 19.9 26.2 28.4 32.5 40.4 40.4 37.6Saving rate (per cent) 5.6 4.9 6.0 6.0 6.4 7.4 6.8 6.0
Corporate profits before tax 55.4 59.4 66.8 77.8 84.2 79.8 88.7 91.2
Federal government receipts andexpenditures (N.I.A. basis)
Receipts 106.5 114.5 115.0 124.7 142.5 151.2 175.4 200.6Expenditures 110.3 113.9 118.1 123.5 142.8 163.6 181.6 191.3Surplus or deficit (-) -3.8 0.6 -3.0 1.2 -0.2 -12.4 -6.2 9.3
High employment surplus or deficit (-)
Total labor force (millions) 73.4 74.6 75.8 77.2 78.9 80.8 82.3 84.2Armed forces " 2.8 2.7 2.7 2.7 3.1 3.4 3.5 3.5Civilian labor force " 70.6 71.8 73.1 74.5 75.8 77.3 78.7 80.7Unemployment rate (per cent) 5.5 5.7 5.2 4.5 3.8 3.8 3,6 3.5
Nonfarm payroll employment (millions) 55.6 56.7 58.3 60.8 64.0 65.9 67.9 70.3
Manufacturing 16.9 17.0 17.3 18.1 19.2 19.4 19.8 20.2
Industrial production (1957-59=100) 118.3 124.3 132.3 143.4 156.3 158.1 165.5 172.8Capacity utilization, manufacturing
(per cent) 82.1 83.3 85.7 88.5 90.5 85.3 84.b 83.7
Housing starts, private (millions A.R.) 1.46 1.61 1.53 1.47 1.17 1.29 1.5L 1.47
Sales new U.S.-made autos (millions,A.R.) 6.75 7.33 7.62 8.76 8.38 7.57 8.62 8 46
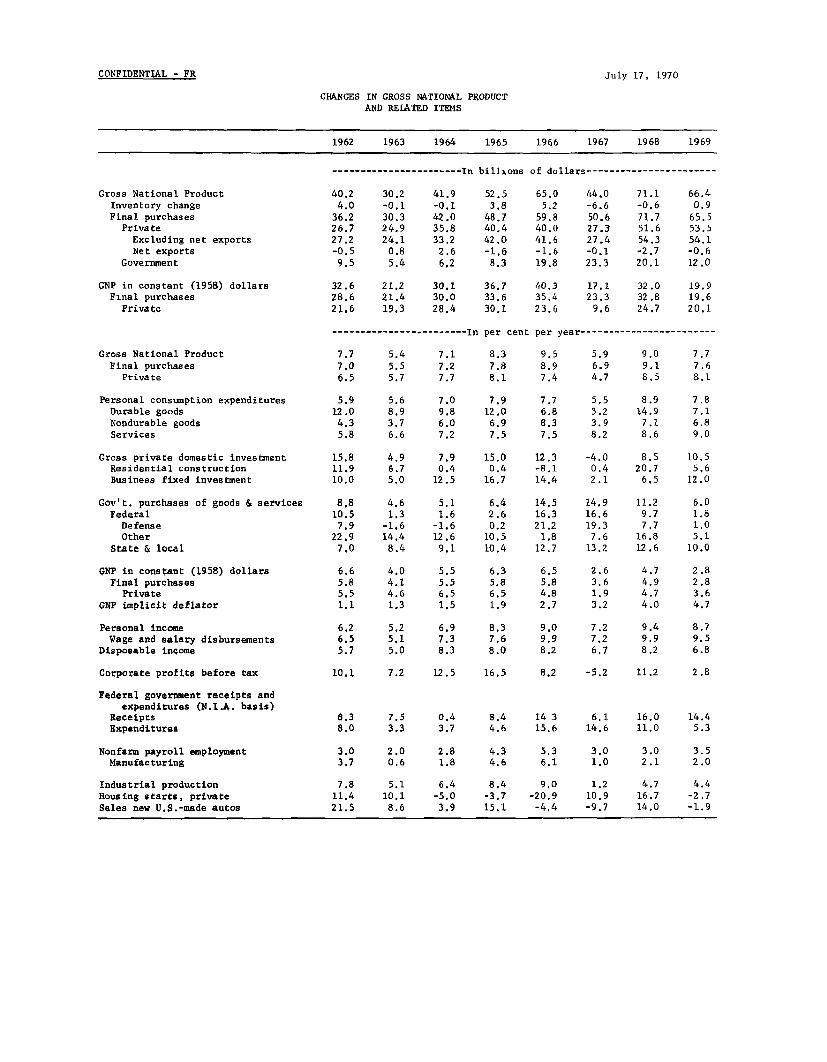
CONFIDENTIAL - FR
CHANGES IN GROSS NATIONAL PRODUCTAND RELATED ITEMS
1962 1963 1964 1965 1966 1967 1968 1969
----------------------- In billons of dollars-----------------------
Gross National ProductInventory changeFinal purchases
PrivateExcluding net exportsNet exports
Government
GNP in constant (1958) dollarsFinal purchases
Private
40.24.0
36.226.727.2-0.59.5
30.2-0.130.324.924.1
0.85.4
41.9-0.142.035.833.2
2.66.2
52.53.8
48.740.442.0-1.68.3
44.0-6.650.627.327.4-0.123.3
71.1-0.671.751.654.3-2.720.1
66.40.9
65.553.554.1-0.612.0
32.6 21.2 30.1 36.7 40.3 17.1 32.0 19.928.6 21.4 30.0 33.6 35.4 23.3 32.8 19.621.6 19.3 28.4 30.1 23.6 9.6 24.7 20.1
------------------------ In per cent per year------------------------
Gross National ProductFinal purchases
Private
Personal consumption expendituresDurable goodsNondurable goodsServices
Gross private domestic investmentResidential constructionBusiness fixed investment
Gov't. purchases of goods & servicesFederalDefenseOther
State & local
GNP in constant (1958) dollarsFinal purchases
PrivateGNP implicit deflator
Personal incomeWage and salary disbursements
Disposable income
Corporate profits before tax
Federal government receipts andexpenditures (N.I.A. basis)
ReceiptsExpenditures
Nonfarm payroll employmentManufacturing
5.9 5.612.0 8.94.3 3.75.8 6.6
15.8 4.911.9 6.710.0 5.0
7.0 7.9 7.79.8 12.0 6.86.0 6.9 8.37.2 7.5 7.5
8.9 7.814.9 7.17.1 6.88.6 9.0
7.9 15.0 12.3 -4.0 8.5 10.50.4 0.4 -8.1 0.4 20.7 5.6
12.5 16.7 14.4 2.1 6,5 12.0
2.6 4.73.6 4.91.9 4.73.2 4.0
10.1 7.2 12.5 16.5 8.2 -5.2 11.2 2.8
8.3 7.5 0.4 8.4 14 3 6.1 16.0 14.48.0 3.3 3.7 4.6 15.6 14.6 11.0 5.3
3.0 2.0 2.8 4.3 5.3 3.0 3.0 3.53.7 0.6 1.8 4.6 6.1 1.0 2.1 2.0
Industrial productionHousing starts, privateSales new U.S.-made autos
7.8 5.1 6.4 8.4 9.011.4 10.1 -5.0 -3.7 -20.921.5 8.6 3.9 15.1 -4.4
1.2 4.7 4.4
10.9 16.7 -2.7
-9.7 14.0 -1.9
July 17, 1970