Embed Size (px)
Citation preview

Prefatory Note
The attached document represents the most complete and accurate version available based on original copies culled from the files of the FOMC Secretariat at the Board of Governors of the Federal Reserve System. This electronic document was created through a comprehensive digitization process which included identifying the best-preserved paper copies, scanning those copies,1 and then making the scanned versions text-searchable.2 Though a stringent quality assurance process was employed, some imperfections may remain.
Please note that this document may contain occasional gaps in the text. These gaps are the result of a redaction process that removed information obtained on a confidential basis. All redacted passages are exempt from disclosure under applicable provisions of the Freedom of Information Act.
1 In some cases, original copies needed to be photocopied before being scanned into electronic format. All scanned images were deskewed (to remove the effects of printer- and scanner-introduced tilting) and lightly cleaned (to remove dark spots caused by staple holes, hole punches, and other blemishes caused after initial printing). 2 A two-step process was used. An advanced optimal character recognition computer program (OCR) first created electronic text from the document image. Where the OCR results were inconclusive, staff checked and corrected the text as necessary. Please note that the numbers and text in charts and tables were not reliably recognized by the OCR process and were not checked or corrected by staff.

CONFIDENTIAL (FR)CLASS III - FOMC
January 31, 1992
SUPPLEMENT
CURRENT ECONOMIC AND FINANCIAL CONDITIONS
Prepared for theFederal Open Market Committee
By the StaffBoard of Governors
of the Federal Reserve System

TABLE OF CONTENTS
Page
THE DOMESTIC NONFINANCIAL ECONOMY
New home sales . . . . . . . . . . . . . . . . . . . . 1Corrigenda . . . . . . ... . . . . . . . . . . . . . . 3
Tables
The market for new houses. ... . . . . . . . . . . .. 2
THE FINANCIAL ECONOMY
The January 1992 senior loan officer opinionsurvey on bank lending practices .. . . .... . . .. 4
Tables
Monetary aggregates .. . . . . . . . . . . . . ... 8Commercial bank credit and short- andintermediate-term business credit. . . . . . . . . . 9
Selected financial market quotations . . . . . . . .. 10
THE INTERNATIONAL ECONOMY
Prices of imports and exports. ... . ... . . . ... 11
Tables
Import and export price measures . . . . . . . . . . 12

SUPPLEMENTAL NOTES
THE DOMESTIC NONFINANCIAL ECONOMY
New Home Sales
Sales of new single-family homes declined 6.6 percent in
December to 522,000 units (annual rate), following an upward
revision to the November estimate from 520,000 to 559,000 units.
For the fourth quarter as a whole, new home sales increased
4.7 percent to 533,000 units, the strongest quarterly pace since the
spring of 1990.
Analysts at the Census Bureau attribute the November revision
to a persistent statistical problem affecting the estimation of new
home sales that has contributed to a number of upward revisions in
recent months. The Census Bureau samples newly issued building
permits and then obtains information about sales and prices for
newly permitted units. Homes that are sold before a permit is
issued necessitate a revision to the sales estimate for prior
months. Although imputations are made for pre-sales, pre-selling
has become increasingly common. Because the December preliminary
estimate may also be subject to this bias, new home sales actually
may be stronger than is indicated by the latest report.
The median price of new homes sold in December declined
2.5 percent from a year earlier to $123,800; the average price of
new homes decreased 3.4 percent to $148,200. These price measures
are not adjusted for variations in the structural characteristics
and geographic distribution of homes sold.
The number of new homes for sale nationwide edged down in
December to 283,000 units. This inventory level translates into a
6.6 months' supply, as compared with 7.1 months, on average, in the
third quarter.

THE MARKET FOR NEW HOUSES
1991
1 9 9 1 Q3r Q4p Oct.r Nov.p Nov.r Dec.p
Sales VolumeThousands of units, SAAR
(Percent change fromearlier comparable period,not at an annual rate)
Sales PriceAverage ($1,000, NSA)
(Percent changefrom year earlier)
Median ($1,000, NSA)(Percent changefrom year earlier)
InventoryUnits for sale
(Thousands of units,end of period)
Months' supply(At current sales rate)
Regional Sales VolumeThousands of units, SAAR
Northeast
504 509 533 518
-5.6 -0.2 4.7 4.0 7.9 -6.6
147.7 145.4 145.4 147.8 141.1 140.5 148.2
-1.4 -0.1 -3.1 -3.4 -1.5 -2.0 -3.4
120.0 120.0 120.5 123.5 117.4 117.3 123.8
-2.4 2.6 -0.8 2.9 -1.3 -1.3 -2.5
283 291 283 287
7.3 7.1 6.6 6.7
283
6.6
57 64 57 63 36 50 59
93 91 96 102
212 210 230 221
143 144 150 132
96 96 90
1. The relative standard error for(+) or (-) 6 percent.
the monthly sales estimates is
2. Months' supply data derived by Census Bureau by seasonal adjustment of theratio of homes for sale to homes sold. It may, therefore, not agree with theseasonally adjusted components shown on the table.r--revised p--preliminary.
January 31, 1992Mortgage and Consumer Finance Section
Midwest
South
West
Corrigenda
Two tables in the nonfinancial portion of Part 1 of the
Greenbook had incorrect numbers for the consumer price index in
1992. The corrected tables are shown below.
MAJOR INDICATORS OF ECONOMIC PERFORMANCE(Percent change, fourth quarter to fourth quarter)
1989 1990 1991 1992 1993
- projected
Real GDP 1.7 -.1 .2 2.1 3.5
Consumer price index 4.6 6.3 2.9 3.5 2.8
Exc. food and energy 4.3 5.3 4.4 3.4 2.8
ECI hourly compensation 4.8 4.6 4.4 3.7 3.3
Memo:Civilian unemployment rate
1. Average in the fourth quarter.
5.4 6.0 6.9 7.2 6.7
STAFF SIMULATIONS OF THE EFFECTS OF FISCAL ACTION ON THE ECONOMY(Percentage change, fourth quarter to fourth quarter)
1992 1993
Simulation with fixed short-term interest rates-----
1. Growth of real GDP 3.4 4.7(Baseline) (2.1) (3.5)
2. Consumer price index 3.7 3.4(Baseline) (3.5) (2.8)
3. Civilian unemployment rate1 6.8 5.7(Baseline) (7.2) (6.7)
--------- Simulation with fixed money growth ---------
4. Growth of real GDP 3.1 2.8(Baseline) (2.1) (3.5)
5. Consumer price index 3.7 3.1(Baseline) (3.5) (2.8)
6. Civilian unemployment ratel 6.9 6.5(Baseline) (7.2) (6.7)
1. Average in the fourth quarter.

THE FINANCIAL ECONOMY
The January 1992 Senior Loan Officer Opinion Surveyon Bank Lending Practices
The January 1992 Senior Loan Officer Opinion Survey on Bank
Lending Practices posed questions about changes in bank lending
standards and terms and about the demand for business and household
loans. It also sought information about bank lending to commercial
and industrial firms that is secured by real estate.
Virtually all surveyed banks--both domestically chartered banks
and U.S. branches and agencies of foreign banks--indicated that they
had kept their credit standards for approving business loan
applications unchanged since the October 1991 survey. The few banks
that did tighten standards most often cited a less favorable
economic outlook as the primary reason for the change. Though
some banks reported that terms on business loans have become more
stringent, their numbers fell noticeably from the October survey.
Domestic banks reported that business loan demand from firms of
all sizes weakened over the past three months at about the same pace
reported in the October survey. Foreign banks also reported softer
business loan demand, in contrast to the somewhat stronger demand
reported in October. More than half of banks reported stronger
residential mortgage demand--well above the number so reporting in
October--while demand for home equity loans was down at some banks
and up at others. Demand for consumer installment loans
continued to weaken. Banks' willingness to provide consumer credit
over the last three months appears to have increased a bit.
1. In light of the historical tendency of banks not to reportthat they have eased standards, the virtual absence of reportedtightening of standards in the current survey might be interpretedas indicating that standards actually have been eased. This featureof earlier survey data is discussed in "Survey Evidence of TighterCredit Conditions: What Does It Mean?" by Stacey L. Schreft andRaymond E. Owens in the March/April 1991 issue of the FederalReserve Bank of Richmond's Economic Review.

-5-
The number of banks reporting further tightening of standards
for approving commercial real estate loans continued to fall in the
January survey. Again in January, almost all banks indicated that
their lending standards for residential mortgages were unchanged.
Banks reported that about one-fourth of their loans secured by
real estate were extended to commercial and industrial firms, and
that about one-third of those loans were for purposes other than
acquisition or improvement of the real estate pledged as collateral.
In general, banks characterized such loans as having higher yields
than most C&I loans, as being made to smaller, riskier firms, and as
having declined relatively in volume over the past two years.
Lending Standards and Terms
Nonmerger-related C&I loans: credit standards. Very few
domestic banks reported that they had altered standards for
approving business loans for nonmerger-related purposes. Business
lending standards at branches and agencies of foreign banks were
generally unchanged as well. As in previous surveys, a common
reason given by the few banks that did report tightening over the
prior three months were concerns about the economic outlook.
Nonmerger-related C&I loans: price and nonprice terms of
credit. In the January survey, banks on balance reported some
additional tightening of terms on business loans, although the
changes were somewhat less common than in the October survey. A
minority of banks responded that they had decreased the size of
credit lines for large firms and increased credit line costs and the
spreads of loan rates over base rates for smaller business
borrowers.
Commercial real estate loans: credit standards. As occurred
in the October survey, the number of domestic banks that indicated
that they had further tightened credit standards for the various

-6-
categories of commercial real estate lending fell by half in the
most recent survey. In January, less than 10 percent of banks
reported having tightened lending standards for construction and
land development loans. The number of banks that tightened
standards for loans for commercial office buildings, for industrial
structures, and for other nonfarm nonresidential purposes also
declined noticeably since the last survey. Relatively more foreign
banks adjusted their lending policies for these categories, about
one-fourth of them reporting that they had tightened standards.
Household loans: As in October, in January very few domestic
respondents reported having tightened credit standards for approving
home purchase loan applications from individuals. With regard to
banks' willingness to make consumer loans, banks on balance again
registered a small increase in the willingness to lend in the three
months ending in January.
The Demand for Loans
Business loans. A significant minority of domestic banks
reported that the demand for business loans had weakened over the
past three months compared with the prior three months. This
pattern held across both large and small banks and across firms of
all sizes, although the tendency was less prevalent in small
firms.2 Banks that noted weaker business loan demand most often
cited decreases in their customers' funding needs for inventories
and fixed investment, regardless of the size of the borrower. In
contrast to October, when foreign banks tended to report somewhat
stronger business loan demand, in January these banks faced weaker
business loan demand, attributed in part to their customers opting
for nonbank financing, for example bond or equity issuance.
2. Large banks are those with at least $10 billion of assets.
-7-
Household loans. After being generally unchanged over the
period covered by the October survey, the demand for residential
mortgages picked up sharply during the past three months.
At the same time, demand for home equity lines of credit, on
balance, was a bit weaker. And there were clear indications that
the demand for consumer installment loans had fallen further, with
about one-third of banks responding that it had weakened.
C&I Lending Classified as Real Estate Loans
The January survey inquired about banks' holdings of C&I loans
secured by real estate, which are reported and published on the Call
Report and other statistical releases as real estate loans. Such
loans comprise about one-fourth of real estate loans at domestic
respondents and nearly that fraction at foreign banks. Of these
loans, about one-third at both domestic and foreign banks are used
for purposes other than the acquisition or improvement of the real
estate securing the loan. The interest charges on these loans are
almost all tied to the prime rate. A sizable majority of these
loans have original maturities of at least three years. Most banks
indicated that over 40 percent of such loans were made under some
type of formal loan commitment program. Only a minority of these
C&I loans came to be secured by real estate after the origination of
the loan, although more than half of banks obtained some of these
loans in this way. These C&I loans collateralized by real estate
are considered by banks generally to offer higher yields, to be
provided to borrowers with credit risk greater than typical of C&I
borrowers, and to be made to smaller borrowers. The volume of such
loans relative to other C&I lending over the past two years appears
to have diminished.
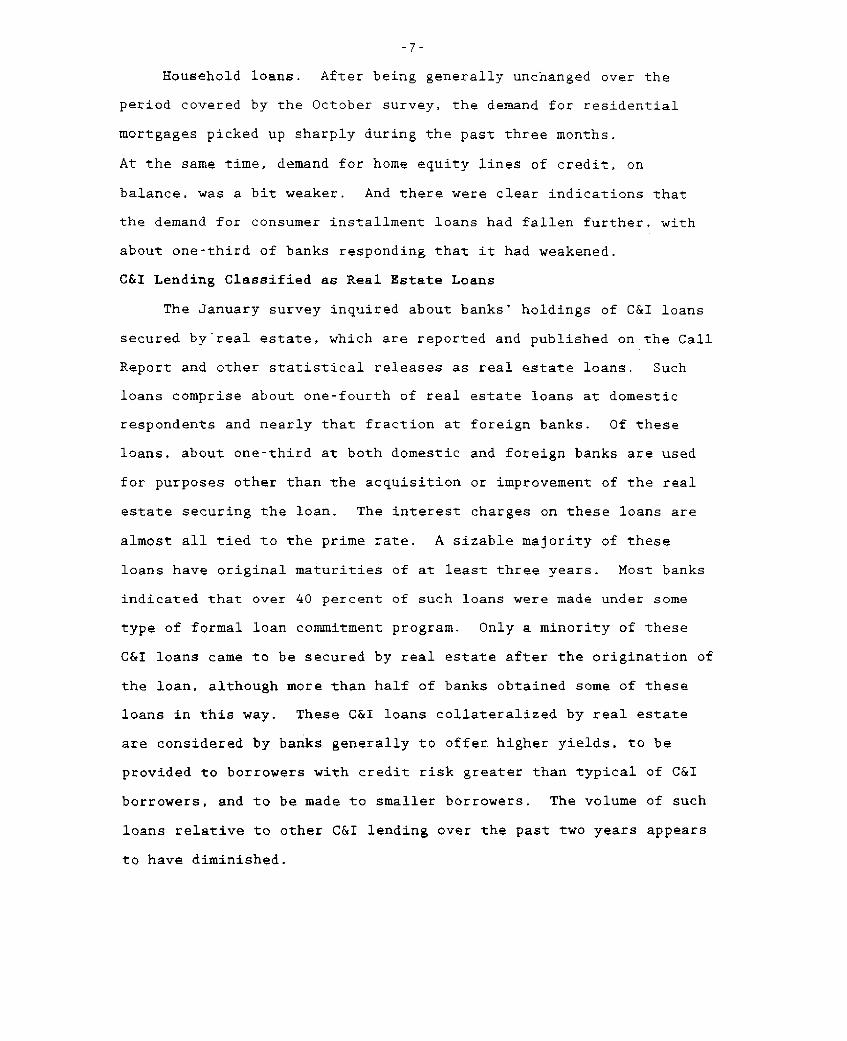
MONETARY AGGREGATES(based on seasonally adjusted data unless otherwise noted)
199111991
93
Growth1991 1991 1991 1992 94 91-Q4 Nov Dec Jan pe Jan
92pe
---------- Percent change at annual rates-------------------
8.0 7.5 11.1 14.3 9.23.1 1.1 3.3 5.0 2.81.3 -1.1 1.3 2.6 1.8
------------ Percent change at annual rates--------
Selected components
4, M-A
5. Currency6. Demand deposits
7. Other checkable deposits
8. M2 minus M12
5.6 4.4 8.7 11.2 7.1 12 564.9
8.4 6.9 7.4 5.4 5.4 9 267.23.4 2.6 10.0 16.1 7.9 15 289.5
12.5 12.9 15.1 19.6 12.4 20 333.2
1.5 -1.0 0.7 1.7 O.S -2 2544.7
9. Overnight RPs and Eurodollars, NSA10. General purpose and broker/dealer money
market mutual fund shares11. Commercial banks12. Savings deposits (including MMDAs)13. Small time deposits14. Thrift institutions15. Savings deposits (including tMMAs)16. Small time deposits
17. M3 minus M23
-8.1 -15.1 38.1 62.3 36.2
4.67.6
13.32.1
-6.99.2
-16.5
-3.47.9
12.53.4
-10.59.9
-24.2
-3.14.3
13.2-4.8-8.29.7
-21.2
-1.00.0
14.3-15.0-4.413.7
-18.4
0.3-0.214.0
-15.4-4.414.2
-19.0
-6.1 -11.0 -7.6 -8.1 -2.6
Large time depositsAt commercial banks, net
4
At thrift institutionsInstitution-only money market
mutual fund sharesTerm RPs, NSATerm Eurodollars. NSA
MEMORANDA:$
24. Managed liabilities at commercialbanks (25+26)
25. Large time deposits, gross26. Nondeposit funds27. Net due to related foreign
institutions28. Other
&
29. U.S. government deposits at commercialbanks
7
-12.7 -16.7 -24.1 -20.8 -15.2 -28-6.6 -10.4 -20.6 -18.2 -11.8 -29-31.7 -40.5 -37.4 -31.6 -29.6 -26
33.4 11.4 37.0 38.5 38.0 20-21.6 -11.5 -23.6 -28.6 -47.2 -2-8.1 -2.5 -0.6 -11.4 -26.8 -27
---- Average monthly change in billions of dollars----
-1.2 -2.4 3.7 -0.6 8.7-0.7 -3.0 -5.7 -3.4 -2.3-0.5 0.6 9.4 2.8 11.0
436.6353.683.0
179.170.961.4
706.9423.8283.1
0.6 0.5 6.9 2.5 6.8 0 41.3-1.0 0.1 2.4 0.3 4.2 -5 241.8
0.2 -0-1 0.9 5.0 -7.7 1 26.5
1. Amounts shown are from fourth quarter to fourth quarter.2. Nontransactions HZ is seasonally adjusted as a whole.3. The non-MZ component of M3 is seasonally adjusted as a whole.4. Net of large denomination time deposits held by money market mutual funds and thrift institutions.5. Dollar amounts shown under memoranda are calculated on an end-month-of-quarter basis.6. Consists of borrowing from other than commercial banks in the form of federal funds purchased, securities
sold under agreements to repurchase, and other liabilities for borrowed money (including borrowing from theFederal Reserve and unaffiliated foreign banks, loan RPs and other minor items). Data are partially estimated.
7. Consists of Treasury demand deposits and note balances at commercial banks.pe - preliminary estimate
1. Ml2. M23. M3
Levels- bil. $
Dec 91
35 75.1
-3 362.24 1258.928 660.4-22 598.5-2 844.024 377.2-22 466.8
-10 735.4

COMMERCIAL BANK CREDIT AND SHORT- AND INTERMEDIATE-TERM BUSINESS CREDIT 1
(Percentage change at annual rate, based on seasonally adjusted data)
Dec.1990 Levelsto bil.$
Dec. 1991 1991 1991 1991 1991 1991Category 1991 Q3 Q4 Oct. Nov. Dec. Dec.
1. Total loansand securitiesat banks
2. Securities
3. U.S. government
4. Other
5. Loans
6. Business
7. Real estate
8. Consumer
9. Security
10. Other
---------------Commercial bank credit---------------
3.2
16.6
23.2
-0.8
-0.8
-4.3
1.9
-4.2
16.3
1.4
0.8
14.7
21.7
-5.3
-3.6
-4.3
-2.8
-7.2
59.5
-10.1
6.0
23.5
29.3
5.9
0.2
-3.4
1.8
-3.9
29.1
5.4
6.8
30.3
37.0
9.8
-1.1
0.0
1.1
-8.5
-5.5
0.6
6.4
19.1
24.7
0.7
2.0
-4.1
3.1
-3.3
71.2
11.1
4.8
19.8
24.0
7.0
-0.3
-6.0
1.3
0.0
20.7
4.3
2,810.6
733.6
560.3
173.3
2,077.0
616.8
857.0
361.8
47.2
194.1
11. Business loansnet ofbankers acceptances
12. Loans at foreignbranches 2
13. Sum of lines 11 and 12
14. Commercial paperissued bynonfinancial firms
15. Sum of lines 13 and 14
16. Bankers acceptances,U.S. trade-related3
17. Finance companyloans to business 4
18. Total (sum oflines 15, 16,and 17)
----Short- and intermediate-term business credit----
-4.2 -4.5 -3.8 0.6 -5.1 -6.9 610.2
-1.2
-4.1
-10.7
-5.3
-3.4
-4.4
-26.3
-8.5
41.2
-2.3
-5.3
-2.8
20.6
1.1
-22.9
-3.1
40.5
-3.4
18.0
0.3
58.8
-4.5
-10.6
-5.6
-16.4 -20.5 -2.9 4.3 -4.3 -8.7
25.7
635.8
134.3
770.2
27.5
n.a. 11.6 n.a. 11.4
n.a. -3.4 n.a. 1.1 2.4 n.a. 1,113.0 5
1. Average of Wednesdays.2. Loans at foreign branches are loans made to U.S. firms by foreign branches of
domestically chartered banks.3. Consists of acceptances that finance U.S. imports, U.S. exports, and domestic
shipment and storage of goods. Based on average of data for current and precedingends of month.
4. Based on average of data for current and preceding ends of month.5. November 1991 data.p--Preliminary.n.a.--Not available.
8.2 n.a. 311.35

-10- 1SELECTED FINANCIAL MARKET QUOTATIONS
(percent)
1989 1991 1992 Change from:- - - - - - -- - - - - - - - - - - - -.-- - - - - - - - - - - - - - - - - - - - - - -
March FOMC Dec-Janhighs Dec 17 Lows-------------------------
Mar 89 Dec-Janhighs LowsJan 30
Short-term rates
Federal funds 2
Treasury bills 3
3-month6-month1-year
Commercial paper1-month3-month
Large negotiable CDs'1-month3-month6-month
Eurodollar deposits1-month3-month
Bank prime rate
9.85
9.109.119.05
_0.05-0.15
_0.07_0.32_0.08
-0.19-0.50
-1.50
4.49 3.94 4.01
4.114.164.17
3.723.763.81
-5.84 0.07 -0.48
3.833.924.03
-5.27-5.19-5.02
4.87 4.01 4.074.56 3.94 4.08
4.794.444.39
3.953.893.89
0.110.160.22
-0.28-0.24-0.14
-5.98 0.06 -0.80-6.07 0.14 -0.48
4.064.084.12
4.75 3.94 4.004.44 3.88 4.06
7.50 6.50 6.50
-6.01-6.24-5.96
0.110.190.23
-0.73-0.36-0.27
-6.19 0.06 -0.75-6.44 0.18 -0.38
-5.00 0.00 -1.00
Intermediate- and long--ar-m rates
U.S. Treasury3-year10-year30-year
(constan maturity)9.889.539.31
Municipal revenue 5
(Bond Buyer)
Corporate--A utilityrecently offered
Home mortgage rates 6
FHLMC 30-yr. FRMFHLMC 1-yr. ARM
7.95
-3.47
-. 229.31
?.scDordhS,. s Di
---------------------------.-.--------
6.90 6.53 6.76
8.74 8.46 8.63
8.53 8.23 8.566.23 5.79 5.90
1989 1991 1992
Lows FOMCLte Jan 3 Dec 17 Jan 30.............................-
-1.19 0.23 -0.14
-1.84 0.17 -0.11
-2.66 0.33 0.03-3.41 0.11 -0.33
Percent change from:--------------------------
Record 1989 FOMChighs lows Dec 17..........................
Stock prices
Dow-Jones Industrial :2-2.14 1/28/92 2144.64 2902.28 3244.86 -0.83 51.30 11.80NYSE Composite :1'1.85 1/15/92 154.00 211.21 227.37 -1.93 47.64 7.65AMEX Composite -_.32 1/17/92 305.24 369.81 410.92 -1.06 34.62 11.12NASDAQ (OTC) : 30.82 1/15/92 378.56 539.70 621.37 -1.50 64.14 15.13Wilshire ,1111.28 1/15/92 2718.59 3773.53 4044.37 -1.87 48.77 7.18
- - - - - - - - - - - - - - - - - - - - - - --.-.. . .-.-.- -.-. .-.. . .-. .-.-.- -.-.. . . . -.. . . -. . . . -. . . . . . . .- . .- . . . . . . ..- - . .- . .- . .- . .- . . . .- . . ..-- - - . .-
One-day quotes except as noted.Average for two-week res=erve maintenance periodclosest to date shown. :I-servation for December 17FOMC is average for wea< of Dec 18. Last observationis average to date for =aaintenance period endingFebruary 5. 1992.
3/ Secondary market.4/ Bid rates for Eurodollar
deposits at 11 a.m. London time.5/ Based on one-day Thursday quotes
and futures market index changes.6/ Quotes for week ending
Friday previous to date shown.
FOMCDec 17
5.397.187.75
5.056.717.39
5.717.317.79
-4.17-2.22-1.52
0.660.600.40
0.320.130.04

-11-
THE INTERNATIONAL ECONOMY
Prices of Imports and Exports
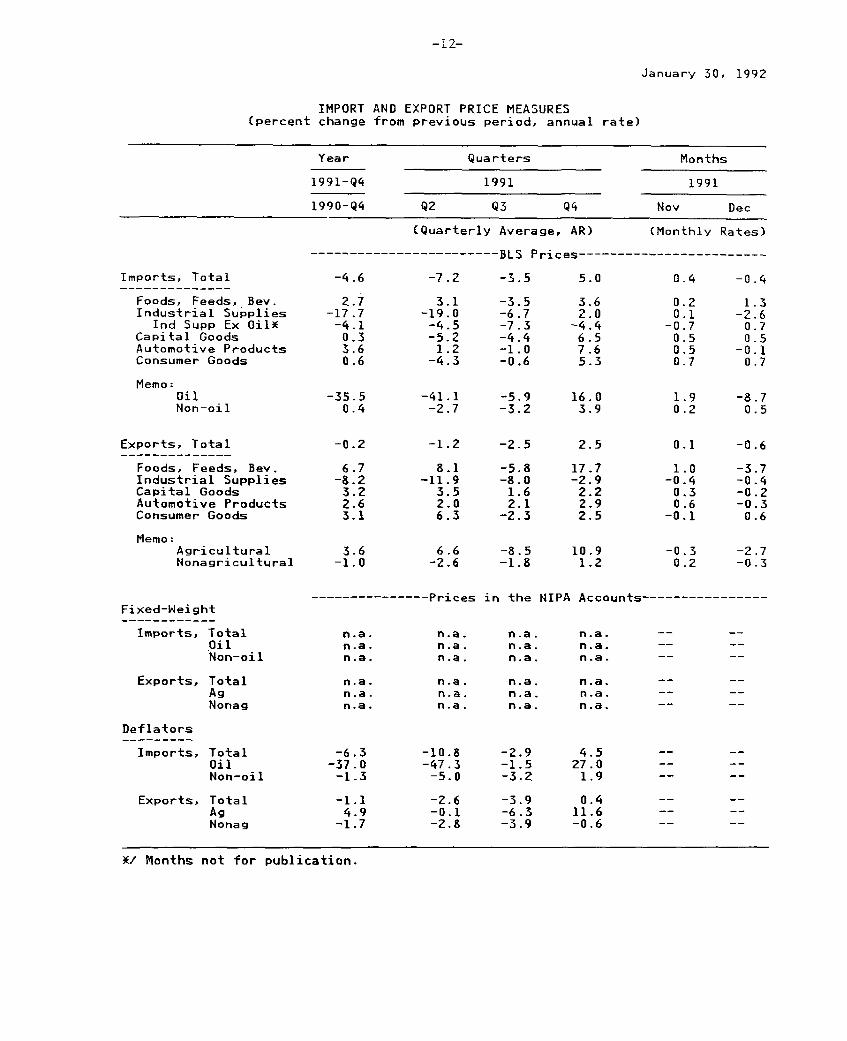
Prices of U.S. imports, reported by the Bureau of Labor
Statistics, increased at a 5 percent annual rate in the fourth
quarter of 1991 on a quarterly average basis. The largest increase
was in petroleum prices; prices of non-oil imports rose at a
4 percent pace. The increase in prices of non-oil imports followed
two quarters of declines that were associated in part with an
appreciating dollar. There were price increases in the 5 to 7
percent (annual rate) range for consumer goods, automotive products,
and capital goods, which generally reversed declines recorded in the
previous two quarters. On the other hand, prices of non-oil
industrial supplies fell in the fourth quarter--the fourth
consecutive quarter of decline. Over the four quarters of 1991, the
price of imported oil dropped 35 percent from a late 1990 level that
was inflated by the Iraqi invasion of Kuwait; on balance, prices of
non-oil imports were about the same in the fourth quarter of 1991 as
a year earlier.
Prices of U.S. exports rose at a 2-1/2 percent annual rate in
the fourth quarter. The price of agricultural exports jumped at an
11 percent rate while prices of exported capital, consumer, and
automotive products rose more moderately. In contrast, prices of
exported industrial supplies declined for the fourth consecutive
quarter. On average, export prices were about the same in the
fourth quarter of 1991 as a year earlier; an increase in
agricultural prices about offset declines in other categories.
January 30, 1992
IMPORT AND EXPORT PRICE MEASURES(percent change from previous period, annual rate)
Year Quarters Months
1991-Q4 1991 1991
1990-Q4 Q2 Q3 Q4 Nov Dec
(Quarterly Average, AR) (Monthly Rates)
---------------------- BLS Prices-----------------------
Imports, Total -4.6 -7.2 -3.5 5.0 0.4 -0.4
Foods, Feeds, Bev. 2.7 3.1 -3.5 3.6 0.2 1.3Industrial Supplies -17.7 -19.0 -6.7 2.0 0.1 -2.6
Ind Supp Ex Oil* -4.1 -4.5 -7.3 -4.4 -0.7 0.7Capital Goods 0.3 -5.2 -4.4 6.5 0.5 0.5Automotive Products 3.6 1.2 -1.0 7.6 0.5 -0.1Consumer Goods 0.6 -4.3 -0.6 5.3 0.7 0.7
Memo:Oil -35.5 -41.1 -5.9 16.0 1.9 -8.7Non-oil 0.4 -2.7 -3.2 3.9 0.2 0.5
Exports, Total -0.2 -1.2 -2.5 2.5 0.1 -0.6
Foods, Feeds, Bev. 6.7 8.1 -5.8 17.7 1.0 -3.7Industrial Supplies -8.2 -11.9 -8.0 -2.9 -0.4 -0.4Capital Goods 3.2 3.5 1.6 2.2 0.3 -0.2Automotive Products 2.6 2.0 2.1 2.9 0.6 -0.3Consumer Goods 3.1 6.3 -2.3 2.5 -0.1 0.6
Memo:Agricultural 3.6 6.6 -8.5 10.9 -0.3 -2.7Nonagricultural -1.0 -2.6 -1.8 1.2 0.2 -0.3
--------------- Prices in the NIPA Accounts----------------Fixed-Height
Imports, Total n.a. n.a. n.a. n.a. -- -Oil n.a. n.a. n.a. n.a. - --Non-oil n.a. n.a. n.a. n.a. --
Exports, Total n.a. n.a. n.a. n.a. --
Ag n.a. n.a. n.a. n.a, -- --Nonag n.a. n.a. n.a. n.a. -- --
Deflators
Imports, Total -6.3 -10.8 -2.9 4.5Oil -37.0 -47.3 -1.5 27.0Non-oil -1.3 -5.0 -3.2 1.9
Exports, Total -1.1 -2.6 -3.9 0.4Ag 4.9 -0-1 -6.3 11.6Nonag -1.7 -2.8 -3.9 -0.6
X/ Months not for publication.