Embed Size (px)
Citation preview

Prefatory Note
The attached document represents the most complete and accurate version available based on original copies culled from the files of the FOMC Secretariat at the Board of Governors of the Federal Reserve System. This electronic document was created through a comprehensive digitization process which included identifying the best-preserved paper copies, scanning those copies,1 and then making the scanned versions text-searchable.2 Though a stringent quality assurance process was employed, some imperfections may remain.
Please note that this document may contain occasional gaps in the text. These gaps are the result of a redaction process that removed information obtained on a confidential basis. All redacted passages are exempt from disclosure under applicable provisions of the Freedom of Information Act.
1 In some cases, original copies needed to be photocopied before being scanned into electronic format. All scanned images were deskewed (to remove the effects of printer- and scanner-introduced tilting) and lightly cleaned (to remove dark spots caused by staple holes, hole punches, and other blemishes caused after initial printing). 2 A two-step process was used. An advanced optimal character recognition computer program (OCR) first created electronic text from the document image. Where the OCR results were inconclusive, staff checked and corrected the text as necessary. Please note that the numbers and text in charts and tables were not reliably recognized by the OCR process and were not checked or corrected by staff.

CONFIDENTIAL (FR)CLASS III FOMC
November 12 1993
SUPPLEMENT
CURRENT ECONOMIC AND FINANCIAL CONDITIONS
Prepared for theFederal Open Market Committee
By the StaffBoard of Governors
of the Federal Reserve System

TABLE OF CONTENTS
Page
THE DOMESTIC NONFINANCIAL ECONOMY
Retail sales . . . . . . . . . . . . . . . . . . . .Consumer sentiment . . . . . . . . . . . . . . . . .
Tables
Retail sales . . . . . . . . . . . . . . . . . . . .University of Michigan Survey Research Center:
Survey of consumer attitudes . . . . . .....
Indicators of consumer sentiment . . . . . . . . ..
THE FINANCIAL ECONOMY
The November Senior Loan Officer Opinion Survey onBank Lending Practices. . . . . . . . . . . . . .
Tables
Monetary aggregates . . . . . . . . . . . . . . .Commercial bank credit and short- and
intermediate-term business credit. . . . . . . . .Selected financial market quotations . . . . . ...
SUPPLEMENTAL NOTES
THE DOMESTIC NONFINANCIAL ECONOMY
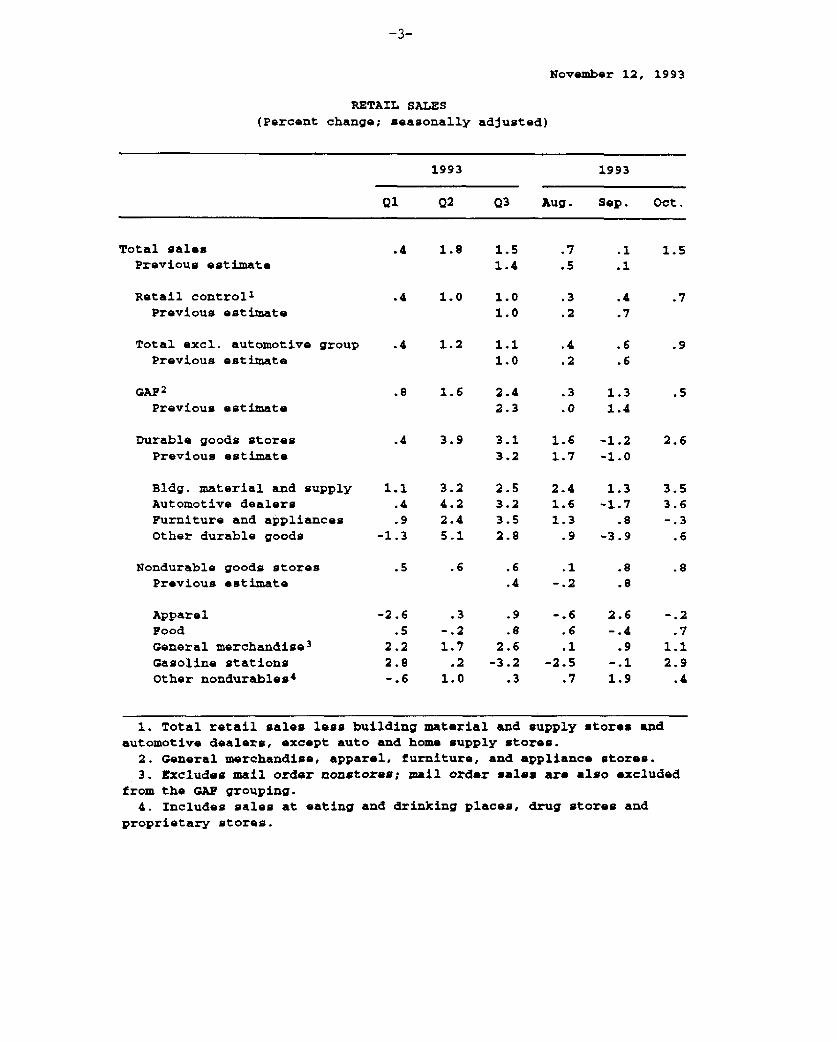
Retail Sales
Nominal retail sales are estimated to have increased
1.5 percent in October, boosted by the turnaround in sales at auto
dealers and by a surge in spending at building material and supply
stores, which have benefited from higher levels of residential
construction activity. In the retail control category, which
excludes spending at automotive dealers and building material and
supply stores, nominal sales rose 0.7 percent in October, following
a downward-revised gain of 0.4 percent in September. About a third
of the increase in outlays in the retail control category in October
resulted from a jump in spending at gasoline stations, where nominal
sales rose 2.9 percent. Given the 4-1/2 percent increase in
gasoline prices last month--reflecting the hike in the federal
excise tax--spending in this category likely fell in real terms.
Elsewhere, sales in October were mixed. Purchases at general
merchandise stores increased 1.1 p ercent, but sales at furniture and
appliance stores edged down after rising strongly for several
months. Spending at stores selling "other durable goods" increased
0.6 percent, but was revised down sharply for August and September.
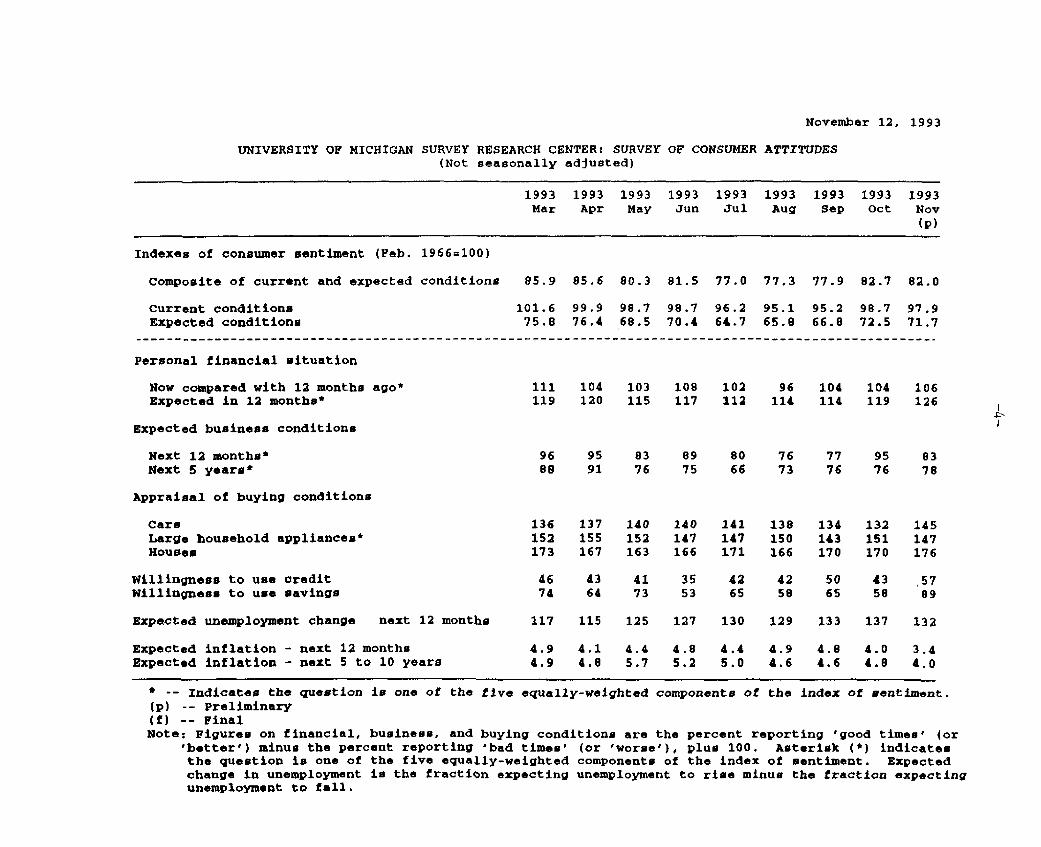
Consumer Sentiment
The Michigan index of consumer sentiment edged down in the
first part of November to 82.0, but remained well above its third-
quarter average of 77.4. The current-conditions index fell slightly
because of a decline in consumers' assessments of buying conditions
for large household appliances. The expected-conditions index also
slipped somewhat: Respondents' expectations about their personal
financial situations over the next twelve months improved notably,
but their outlook for general business conditions fell sharply.

Among the survey questions not included in the overall index,
results for the first part of November were generally upbeat.
Consumers' appraisals of buying conditions for houses continued on a
strong upward trend, and assessments of buying conditions for cars
rose sharply. Expectations of the change in unemployment also
improved, retracing the deterioration in October.
Both the average and median values of expected inflation over
the next twelve months fell 0.6 percentage point, to 3.4 percent and
2.8 percent, respectively. The average expectation of inflation
over the next five to ten years dropped sharply to 4.0 percent; the
median expectation also declined substantially to 3.2 percent.
November 12, 1993
RETAIL SALES(Percent change; seasonally adjusted)
1993 1993
Q1 Q2 Q3 Aug. Sep. Oct.
Total salesPrevious estimate
Retail control1Previous estimate
Total excl. automotive groupPrevious estimate
GAF2
Previous estimate
Durable goods storesPrevious estimate
Bldg, material and supplyAutomotive dealersFurniture and appliancesOther durable goods
Nondurable goods storesPrevious estimate
ApparelFoodGeneral merchandise 3
Gasoline stationsOther nondurables 4
.4 1.8 1.51.4
.4 1.0 1.01.0
.4 1.2 1.11.0
.8 1.6 2.42.3
.4 3.9 3.1 1.6 -1.23.2 1.7 -1.0
1.1.4.9
-1.3
3.24.22.45.1
.5 .6 .6.4
-2.6.5
2.22.8-. 6
.3-.21.7.2
1.0
.9
.82.6-3.2
.3
-.6.6.1
-2.5.7
1.3-1.7
.8-3.9
.8
.8
2.6-.4
.9-. 11.9
1. Total retail sales less building material and supply stores andautomotive dealers, except auto and home supply stores.2. General merchandise, apparel, furniture, and appliance stores.3. Excludes mail order nonstores; mail order sales are also excluded
from the GAP grouping.4. Includes sales at eating and drinking places, drug stores and
proprietary stores.
1.5
November 12, 1993
UNIVERSITY OF MICHIGAN SURVEY RESEARCH CENTER: SURVEY OF CONSUMER ATTITUDES(Not seasonally adjusted)
1993 1993 1993 1993 1993 1993 1993 1993 1993Mar Apr May Jun Jul Aug Sep Oct Nov
(p)
Indexes of consumer sentiment (Feb. 1966=100)
Composite of current and expected conditions 85.9 85.6 80.3 81.5 77.0 77.3 77.9 82.7 82.0
Current conditionsExpected conditions
101.6 99.9 98.7 98.7 96.2 95.1 95.2 98.7 97.975.8 76.4 68.5 70.4 64.7 65.8 66.8 72.5 71.7
Personal financial situation
Now compared with 12 months ago*Expected in 12 months*
Expected business conditions
111 104 103 108 102 96 104 104 106119 120 115 117 112 114 114 119 126
Next 12 months*Next 5 years*
76 7773 76
95 8376 78
Appraisal of buying conditions
CarsLarge household appliances*Houses
Willingness to use creditWillingness to use savings
Expected unemployment change next 12 months
Expected inflation - next 12 monthsExpected inflation - next 5 to 10 years
136 137 140 140 141 138 134 132 145152 155 152 147 147 150 143 151 147173 167 163 166 171 166 170 170 176
117 115 125 127 130 129 133 137 132
4.9 4.1 4.4 4.8 4.4 4.9 4.8 4.0 3.44.9 4.8 5.7 5.2 5.0 4.6 4.6 4.8 4.0
* -- Indicates the question is one of the five equally(p) -- Preliminary(f) -- FinalNote: Figures on financial, business, and buying condi
'better') minus the percent reporting 'bad times'the question is one of the five equally-weightedchange in unemployment is the fraction expectingunemployment to fall.
'-weighted components of the index of sentiment.
.tions are the percent reporting 'good times' (or(or 'worse'), plus 100. Asterisk (*) indicatescomponents of the index of sentiment. Expectedunemployment to rise minus the fraction expecting
-
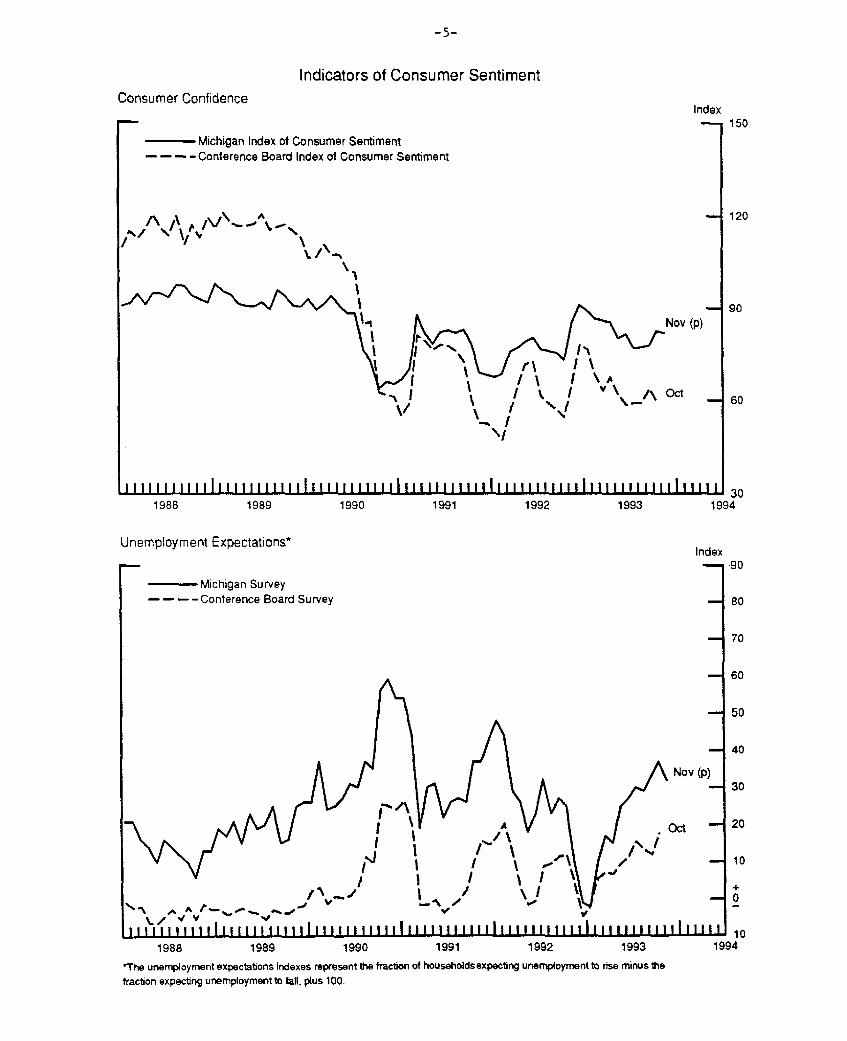
Indicators of Consumer SentimentConsumer Confidence
Index--- 150
- Michigan Index of Consumer Sentiment- - - -Conference Board Index of Consumer Sentiment
, / 0\/ 6I \
VnrJNx~Nov (p) 90
Nov (p)
-t 60
SIIIIII i l llllllt111111111 11111111l i 1 1 1 111111 II iili III111 Il gi11111
1990 1991 1992 1993 1J 30)94
Unemployment Expectations*
Michigan Survey---- Conference Board Survey
-4 40
n4t
A/ IS111 I I IIII 111 III 11L11 11W JI
1988 1989 1990
Nov (p)
1 ,/ \
.A --
/ 1
lllll 1111 11111 111111 111111111 11111 I1991 1992 1993 19
The unemployment expectations indexes represent the fraction of households expecting unemployment to rise minus the
fraction expecting unemployment to fall, plus 100.
-4 120
1988 1989
Index
20
10
0
10)94
4
--c
THE FINANCIAL ECONOMY
The November Senior Loan Officer Opinion Survey on Bank LendingPractices
The November 1993 Senior Loan Officer Opinion Survey on Bank
Lending Practices posed questions about changes in bank lending
standards and terms, changes in loan demand by businesses and
households, and prime rate lending. Sixty domestic commercial banks
and eighteen U.S. branches and agencies of foreign banks
participated in the survey.
The survey results show a further easing of the terms and
standards on loans to both businesses and households; the share of
banks that reported easing was about the same in the November as in
the August survey. Demand for credit continued to grow in November,
but responses were less uniformly positive than in the last survey.
Respondents reported easing terms and standards on commercial and
industrial loans to firms of all size categories, with the greatest
share of banks reporting easing for large firms. Standards for
commercial real estate loans were little changed. A small fraction
of respondents indicated that they had eased standards on home
mortgage loans, and a larger fraction reported increased willingness
to make loans to individuals. Demand for business loans by large
firms, which had been reported up in the previous survey, was little
changed on balance over the last three months, while demand from
small and middle market firms increased at about the same
substantial share of banks as reported in the August survey.
Household demand for credit continued to grow, particularly for
installment credit, but demand for home equity lines of credit fell
back a bit.
1. The response from one domestic bank had not been received whenthis summary was prepared.

Special questions on the survey addressed the importance of
prime rate lending and the determinants of the prime rate.
Respondents indicated that the fraction of their commercial and
industrial loans priced off the prime had declined substantially
since the late 1980s. Banks identified the federal funds rate as
the interest rate having the most influence on the level of the
prime. They attributed the current wide spread of the prime rate
over market rates to a variety of factors, but especially to a
perceived insensitivity of the demand for credit to the level of the
prime.
Business Lending
Commercial and industrial loans other than for mergers.
Domestic respondents reported some easing of credit standards for
firms in all size categories, with around one-fifth easing for large
firms and 10 percent for small firms. These figures are little
changed from the August survey. About 13 percent of U.S. branches
and agencies of foreign banks eased lending standards and none
reported tightening; in August none of the branches and agencies
reported a change in credit standards. With respect to loan terms,
many banks eased the cost of credit and credit lines. About half of
the domestic respondents reported reductions for large and middle
market firms, and about a quarter for small firms. These levels
surpass the substantial number of respondents that reported easing
fees and lending rates in August. Smaller fractions of respondents
eased other terms, including loan covenants, credit line size, and
collateralization. About twice as many respondents eased these
terms for large firms as for small firms. Similar, although
slightly smaller, fractions of foreign respondents reported having
eased terms.

-8-
Real estate loans. Both domestic and foreign respondents
indicated that credit standards for commercial real estate loans
were little changed. On net, domestic respondents reported a slight
tightening on loans secured by commercial office buildings and a
slight easing for other types of commercial real estate loans.
Although scattered signs of easing were also evident in previous
surveys, there has been no reversal of the substantial tightening of
lending standards reported in 1990 and 1991. At U.S. branches and
agencies of foreign banks standards for commercial real estate loans
were unchanged.
Demand. Demand for business loans from large firms was mixed
among respondents, with a few more banks experiencing a
strengthening than a weakening; in August, the evidence of
strengthening had been more clear-cut. By contrast, a substantial
fraction of respondents indicated that demand from small and middle
market firms increased over the last three months, continuing the
pattern reflected in the August survey. Respondents attributed
declines in demand from large firms to increased financing from
nonbank sources, consistent with the recent heavy pace of bond and
equity issuance. Changes in credit needs for funding inventories
and investment in plant and equipment were commonly cited as a
source of both declines and increases in demand. Branches and
agencies of foreign banks experienced a moderate increase in demand
for business loans.
Lending to households
As in August, there was a substantial increased willingness at
respondent banks to make consumer and residential mortgage loans.
Nearly a fifth of respondents reported greater willingness to make
consumer installment loans, down slightly from the previous survey.
Standards for approving mortgage applications have been eased in the
last three months at just under 15 percent of banks queried, above
the share of banks which reported having eased these standards in
August.
Loan demand from households was again reported to have
increased. More than a quarter of respondents experienced increased
demands for consumer installment credit and for mortgages. On net,
respondents found that demand for home equity loans had dropped.
This decline may be due to paydowns of this form of debt with the
proceeds from refinancing of first mortgages.
Consumer loans at banks have expanded rapidly this year,
following two years of runoffs. Banks attributed this reemergence
of growth to a variety of reasons: The leading explanation was
increased demand, particularly for automobile loans; less commonly
cited reasons included increased demand for revolving credit,
increased demand for student loans, as well as a more aggressive
lending stance by the bank. Although the pace of securitization of
consumer loans has slowed and some banks appear to be taking back
onto their balance sheet consumer receivables that had backed
maturing securities, these factors were assigned a relatively minor
impact on consumer loan growth this year. While a few banks
reported that more than 10 percent of their consumer loans are
student loans, almost two-thirds indicated this share was under
5 percent.
Prime rate lending
The November survey asked a series of questions about the
fraction of loans priced off the prime rate and the determinants of
the prevailing prime rate. The survey responses suggest that
perhaps 20 percent of domestic respondent banks' outstanding loans
are linked to the prime. The types of loans with the largest
proportion tied to prime were home equity loans and C&I loans; about

-10-
two-fifths of these loans were reported as prime based. A bit less
than one-fifth of real estate loans other than home equity loans and
around 15 percent of consumer loans are tied to prime, according to
2the survey responses.
The responses indicate that the share of commercial and
industrial loans linked to prime is inversely related to the size of
borrower. Close to 60 percent of domestic respondents reported that
more than three-quarters of C&I loans to small firms are prime
based. About 50 percent reported that more than half of their C&I
loans to middle market firms are prime based. Nearly two-thirds of
the respondents reported that a quarter or less of their C&I loans
to large firms were prime based. The respondents placed the shares
of C&I loans that were prime based in the late 1980s at appreciably
higher levels, particularly for loans to large and middle market
borrowers. At U.S. branches and agencies of foreign banks, less
than a quarter of C&I loans were prime based, with nearly three-
quarters placing the share at less than 10 percent.
The survey asked the respondents which interest rates have had
the greatest influence on the level of the prime rate and why the
current spread of the prime over market rates is so high. Both
domestic and foreign respondents cited the level of the federal
funds rate as the most influential determinant of the level of the
prime, followed at some distance by LIBOR and rates on CDs with
maturities less than six months. The respondents attributed the
recent high spread in part to a perceived insensitivity of the
quantity of credit demanded to a rate cut. Forty-five domestic
respondents felt that a prime rate cut would not increase borrowing
by current customers, and almost as many believed that a cut would
2. These averages were calculated using the mid point of reportedpercentage ranges, weighted by separately reported data onoutstanding loans as of mid-October.

-11-
not attract additional borrowers. In addition, a large number of
respondents attributed the high level of the prime to the cost of
having to hold additional capital and to other increases in
regulatory expenses. Foreign respondents as well did not see a cut
in the prime as leading to increased demand and, in addition,
pointed to an increased riskiness of prime-based loans.
Slightly less than half of the domestic respondents reported
using derivatives to hedge the risk associated with prime-based
lending. Respondents reported that their counterparties in their
derivatives transactions were primarily U.S.-chartered banks, U.S.
securities firms, and foreign banks or securities firms. Only two
of the U.S. branches and agencies of foreign banks used derivatives
to hedge their prime-rate risk.

-12-
MONETARY AGGREGATES(Based on seasonally adjusted data except as noted)
Aggregate or component
Aggregate
1992:Q41993 1993 1993 1993 1993 to
1992 1 Q2 2 Q3 2 Aug. Sep. Oct. Oct. 93(pe) (pe)
Level(bil. $)Sep 93
Percentage change (annual rate)
1. Ml2. M23. M3
Selected components
4. M1-A
5. Currency6. Demand deposits
7. Other checkable deposits
14.3 10.5 12.9 10.1 13.61.7 2.2 3.1 1.6 4.00.2 2.3 1.2 0.8 3.4
13.7 13.1 14.2 13.9 16.5
9.1 9.7 11.6 11.6 14.618.0 16.0 17.2 16.4 18.5
1106.53532.94176.8
9 11% 700.5
7 10% 316.411 13% 376.4
15.4 6.3 10.7 3.6 8.6 12 8% 406.0
8. M2 minus Ml
9. Overnight RPs and Eurodollars,n.s.a.
10. General-purpose and broker-dealer money market funds
11 Commercial banks12. Savings deposits13. Small time deposits14. Thrift institutions15. Savings deposits16. Small time deposits
-2.7 -1.4 -1.1 -2.2 -0.3
2.7
-5-2-0.1!4.5
-15.8-5.814.8
-22.1
*10.3 35.5 42.8 45.9
-0.7-0.4
4.6-7.9-4.30.7
-10.4
-0-6-0.9
5.3-10.5
-4.02.9
-12-7
-5.70.16.9
-10.7-4.11.7
-11.5
-6.80.25.1
-7.8-5.2
1.1-13.4
-4 -2% 2426.4
34 12 81.4
2 -3% 332.4-3 -I 1253.6
1 3% 777.2-10 -84 476.4
-6 -5%4 758.50 1 431.6
-13 -13 326.9
-6 , 3.3 -9.3 -3.9 0.0 9 -4y 643.9
Large time depositsAt commercial banks
4
At thrift 4•estiutionsInstitution-only money market
mutual fundsTerm RPs, n.s.a.Term Eurodollars, n.s.a.
-16.5-15.8-19.5
18.27.8
-22.6
-1.7 -8.4 0.7 -6.10.1 -8.9 2.7 -7.5
-10.3 -6.8 -9.4 -1.9
0.4 -12.6 -10.5 5.0 1538.3 24-3 -5.0 -7.5 -197.7 -34.5 54.4 24.7 16
-8 333.7-7% 270.5-9 63.1
-5% 194.118% 95-4-4 44.7
Average monchly change (billions of dollars)
Memo
Managed liabilities at com'l.banks (lines 25 26)
Large time deposits, grossNondeposit funds
Net due to related foreigninstitutions
Other5
U-S- government deposits atcommercial banks
6
6.5 9.9 6.1 7.2 1-1.0 -5.7 -4.9 -4.2 07.5 15.6 11.0 11.4 1
2.6 11.2 14.5 4.8 05.0 4-4 -3.5 6.5 1
2.4 -0.6 -0.7 -5.2
1- *Percentage change' is percentage change in quarterly average from fourth quarter of preceding year tofourth quarter of specified year 'Average monthly change' is dollar change from December to December,divided by 12.2. "Percentage change" is percentage change in quarterly average from preceding quarter to specified quarter
*Average monthly change' is dollar change from the last month of the preceding quarter to the last month ofthe specified quarter, divided by 3.3. Seasonally adjusted as a whole.4. Net of holdings of money market mutual funds, depository institutions, U.S. government, and foreign banks,d official institutions.5. Borrowing from other than commercial banks in the form of federal funds purchased, securities
sold under agreements to repurchase, and other liabilities for borrowed money (including borrowing from theFederal Reserve and unaffiliated foreign banks, loan RPs, and other minor items), Data are partially estimated.6. Treasury demand deposits and note balances at commercial banks.
M3 minus K23
736.7335.5401.2
120.7280.4
24.2

-13-
COMMERCIAL BANK CREDIT AND SHORT- AND INTERMEDIATE-TERM BUSINESS CREDIT1(Percentage change at annual rate, based on seasonally adjusted data)
Type of credit
1. Total loans and securitiesat banks
2. Securities
3. U.S. government
4. Other
5. Loans
6. Business
7. Real estate
8. Consumer
9. Security
10. Other
11. Business loans net of bankersacceptances
12. Loans at foreign branches 2
13. Sum of lines 11 and 12
14. Commercial paper issued bynonfinancial firms
15. Sum of lines 13 and 14
16. Bankers acceptances, U.S.trade-related
3,4
17. Finance company loans tobusiness4
18. Total (sum of lines 15, 16,and 17)
Dec. Level,1991 1993 1993 1993 1993 1993 Oct.
to Dec. Q2 Q3 Aug. Sep. Oct. p 1993 p1992 ($billions)
Commercial bank credit
3.6
13.0
17.5
-1.1
.2
-3.2
2.1
-1.8
18.4
1.2
.1 3,056.5
11.2
12.9
5.2
5.6
-1.2
5.2
7.1
44.9
12.2
8.0
8.6
4.9
4.5
-2.2
3.7
8.7
62.7
.8
9.6
9.5
10.0
.7
.2
2.4
8.4
-26.5
-9.1
7.8
9.6
0.0
2.4
-5.1
4.0
4.2
43.7
-1.8
-5.5
-4.0
-9.9
2.4
.4
5.0
12.7
-49.4
-1.8
898.2
717.8
180.5
2,158.2
585.4
917.9
380.6
79.2
195.2
Short- and intermediate-term business credit
-3.3 -1.4 -2.4
2.0
-3.1
9.5
-. 8
-16.9
1.8
-. 5
-5.2
-1.5
15.8
1.9
-14.2
-31.3
-3.6
22.5
1.7
-11.1
-. 4 3.0
.9 1.9
-. 6 -3.7
-48.0
-2.2
23.5
3.0
-11.4
4.8
3.3
-22.2
-4.4
4.5
-2.4
11.5
5.7
-. 6
-8.9
-2.4
n.a.
576.0
21.3
597.3
160.5
757.85
21.1
55.5 n.a. 305.4
0.0 n.a. 1,085.8
1. Except as noted, levels are averages of Wednesday data and percentage changes are based on aver-
ages of Wednesday data; data are adjusted for breaks caused by reclassification; changes are measured
frcn preceding period to period indicated.2. Loans to U.S. firs made by foreign branches of domestically chartered banks.
3. Acceptances that finance U.S. imports, U.S. exports, and damestic shipment and storage of
goods.4. Changes are based on averages of month-end data.
5. September 1993.p Preliminary.
n.a. Not available.

-14-
SELECTED FINANCIAL MARKET QUOTATIONS(Percent except as noted)
1992 1993
FOMC, Mid-OctSept. 4 Sep 21 lows Nov 10
Instrument
Change to Nov 10, 1993
From FOMC, Mid-OctSep 21 lows
SHORT-TERM RATES
Federal funds3
Treasury bills3-month6-month1-year
Commercial paper1-month3-month
Large negotiable CDs1-month3-month
6-month4
Eurodollar depositsl-month3-month
Bank prime rate
INTERMEDIATE- AND LONG-TERM RATES
U.S. Treasury (constant maturity)3-year
10-year30-year
5Municipal revenue
(Bond Buyer)
Corporate--A utility,recently offered
6Home mortgages
FHLMC 30-yr. fixed rateFHLMC 1-yr. adjustable rate
3.19
2.922.963.06
3.223.22
3.063.063.11
3.313.31
6.00
4.386.407.29
8.06
7.845.15
3.01
2.923.053.25
3.153.16
3.113.123.25
3.063.06
6.00
4.215.476.14
5.49
7.10
6.964.36
3.07 3.00 -0.01 -0.07
3.01 3.12 0.20 0.113.09 3.26 0.21 0.173.23 3.40 0.15 0.17
3.13 3.15 0.00 0.023.23 3.40 0.24 0.17
3.08 3.10 -0.01 0.023.22 3.35 0.23 0.133.23 3.38 0.13 0.15
3.06 3.06 0.00 0.003.25 3.38 0.32 0.13
6.00 6.00 0.00 0.00
4.06 4.51 0.30 0.455.19 5.72 0.25 0.535.78 6.21 0.07 0.43
5.41 5.72 0.23 0.31
6.79 7.21 0.11 0.42
6.74 7.11 0.15 0.374.14 4.17 -0.19 0.03
Stock exchange index
Dow-Jones IndustrialNYSE compositeNASDAQ (OTC)Wilshire
S 1989 !Record high ____
__ I II Low, I
Level I Date I Jan. 31_I __I
3697.64260.48787.42
4701.68
11/2/93 2144.6410/15/93 154.0010/15/93 378.5610/15/93 2718.59
1993 I Percentage change to Nov 10I
I I From I From IFOMC, I record I 1989 I From FOMC,Sep 21 iNov 101 high I low I Sep 21
_ I 1 I
3537.24 3663.55251.59 256.57733.56 776.504515.06 4628.16
-0.92-1.50-1.39-1.56
70.8266.60
105.1270.24
3.571-985.852.50
1. One-day quotes except as noted.2. Average for two-week reserve maintenance
period closest to date shown. Last observationis average to date for maintenance period endingNovember 10, 1993.3. Secondary market.
4. Bid rates for Eurodollardeposits at 11 a.m. London time.5. Most recent observation based on
one-day Thursday quote and futuresmarket index changes.6. Quotes for week ending Friday
previous to date shown.
t __