Embed Size (px)
Citation preview

Prefatory Note
The attached document represents the most complete and accurate version available based on original copies culled from the files of the FOMC Secretariat at the Board of Governors of the Federal Reserve System. This electronic document was created through a comprehensive digitization process which included identifying the best-preserved paper copies, scanning those copies,1 and then making the scanned versions text-searchable.2 Though a stringent quality assurance process was employed, some imperfections may remain.
Please note that this document may contain occasional gaps in the text. These gaps are the result of a redaction process that removed information obtained on a confidential basis. All redacted passages are exempt from disclosure under applicable provisions of the Freedom of Information Act.
1 In some cases, original copies needed to be photocopied before being scanned into electronic format. All scanned images were deskewed (to remove the effects of printer- and scanner-introduced tilting) and lightly cleaned (to remove dark spots caused by staple holes, hole punches, and other blemishes caused after initial printing). 2 A two-step process was used. An advanced optimal character recognition computer program (OCR) first created electronic text from the document image. Where the OCR results were inconclusive, staff checked and corrected the text as necessary. Please note that the numbers and text in charts and tables were not reliably recognized by the OCR process and were not checked or corrected by staff.

CONFIDENTIAL (FR)CLASS III - FOMC
February 2, 1990
SUPPLEMENT
CURRENT ECONOMIC AND FINANCIAL CONDITIONS
Prepared for theFederal Open Market Committee
By the StaffBoard of Governors
of the Federal Reserve System

TABLE OF CONTENTS
Page
THE DOMESTIC NONFINANCIAL ECONOMY
Employment and unemployment. . . . . . . . . . . . . . . . . 1Average hourly earnings. . . . . . . . . . . . . . . . . . . 2Purchasing managers' survey. . . . . . . . . . . . . . . . . 3Consumer surveys . . . . . . . . . . . . . . . . ... . . . . 3Manufacturers' inventories . . . . . . . . . . . . . . . . . 4Addenda. . . . . . . . . . . . . . . . . ... . . . . . . . . 4
Tables
Changes in employment. . . . . . . . . . . . . . . . . . . . 5Selected unemployment rates. . . . . . . . . . . . . . . ... 5Average hourly earnings. . . . . . . . . . . . . . . . . . . 6Summary of survey of purchasing managers . . . . . . . . . . 7Changes in manufacturing and trade inventories . . . . . .. 11Inventories relative to sales . . . . . . . . . . . . . .. 11Business capital spending indicators . . . . . . . . . . .. . 13
Charts
Purchasing managers. . ................. . .. 8Average lead time. . . . . . . . . . . . . . . . . ... . .. 9Consumer attitudes . . . . . . . . . . . . . . . . ... . . . 10Ratio of inventories to sales . .. ... . . . . . . . . . 12Nonresidential construction and selected indicators. ... . . 14
THE FINANCIAL ECONOMY
Summary of responses to the January 1990 senior loanofficer opinion survey . . . . . . . . . . . . . . . ... . 15
Tables
January senior loan officer opinion survey . . . . . . ... . 19Monetary aggregates . . . . . . . . . . . . . . . .... . .. 24Commercial bank credit and short- and
intermediate-term business credit . . . . . . . . ... .. 25Selected financial market quotations . . . . . . . . . ... . 26

APPENDIX
Federal budget developments. . . . . . . . . . . . . . . ... A-i
Tables
Estimates of total budget. . . . . . . . . . . . . . ... ..A-iAdministration and CBO economic assumptions. . . . . . . ... A-3CBO baseline budget projections. . . . . . . . . . . . . .. .A-4Composition of Administration budget proposals . . . . . .. .A-5Administration budget projections. . . . . . . . . . . . .. .A-6
Chart
Federal outlays. . . . . . . . . . . . . . . . . ... . . . .A-8
-ii-

SUPPLEMENTAL NOTES
THE DOMESTIC NONFINANCIAL ECONOMY
Employment and Unemployment
Despite sizable temporary layoffs in motor vehicles and related
industries, the civilian unemployment rate was unchanged in January at
5.3 percent, and nonfarm payroll employment was up 275,000. The gain in
jobs reported in the business survey and the 0.6 percent rise in aggregate
hours of production workers probably overstate to some extent the underlying
strength in labor demand: Those over-the-month changes were bolstered by
large increases in construction--associated with unseasonably warm weather--
and in retail trade--associated with problems in estimating seasonal swings
in holiday staffing.
As expected, the payroll employment report showed a steep decline in
manufacturing jobs in January: About 90,000 of the drop occurred at motor
vehicle facilities, but stampings and tire production also were affected,
reducing employment by another 25,000 in fabricated metals and rubber.
Elsewhere, smaller declines continued in the primary metals, machinery,
furniture, apparel, and textile industries. The only notable gain in
factory jobs occurred in the lumber industry and may have been associated
with an unusually brisk pace of construction activity last month. Indeed,
construction employment jumped more than 100,000 last month, more than
offsetting the drop of 50,000 that occurred in December when weather was
unseasonably harsh.

-2-
In the services and finance industries, January's increases in
employment were about in line with recent trends. Within services, growth
in business services has slowed, on average, in recent months, but health
services continue to expand at a rapid rate, adding almost 50,000 jobs again
last month. In trade, employment was shown to have increased 141,000 in
January. However, 25,000 of the gain reflects the reversal of December's
reported drop in jobs at general merchandisers, suggesting that these
retailers recently have expanded employment little, on net, apart from
holiday hiring. Over the past year, employment at general merchandisers has
risen only 22,000; automotive dealers and service stations also have seen a
similar small gain. In contrast, employment gains have continued to be
sizable at food stores and eating and drinking establishments.
In the household survey, total employment, which can fluctuate widely
from month to month, edged down in January after a small increase in
December. Unemployment declined as well; the number of job losers did jump
85,000, reflecting the industrial layoffs in early January, but the impact
on the overall jobless rate was obscured by an unusually steep decline, of
almost 170,000, in the count of unemployed entrants to the labor force.
That drop also was reflected in a small decline in the labor force
participation rate in January.
Average Hourly Earnings
Average hourly earnings of production workers edged up 0.1 percent in
January to a level 3.7 percent above a year earlier. Average hourly wages
apparently were held down last month by the hiring of a sizable number of
relatively low wage construction workers and by the absence of laidoff auto

-3-
workers. Hourly earnings in construction were down 2 percent over the
month, and wages in durable manufacturing were off 1 percent.
Purchasing Managers' Survey
The purchasing managers' survey in January indicates that activity in
the industrial sector remained sluggish. After verging into the positive
range in December, new orders apparently weakened last month, with the
number of purchasing managers reporting declines in orders exceeding those
reporting increases by 9 percentage points. Survey readings on production
and employment remained in the negative range. Some items, though, were
reported to be in short supply, in part because of disruptions caused by the
record cold in late December. Thus, while the margin of suppliers making
faster deliveries still was running above those reporting slower deliveries,
the margin in January was not as great as in previous months. Similarly,
although purchasing managers who paid lower prices in January still
outnumbered those who paid higher prices, the net difference of less than
2 percentage points contrasted sharply with the 12 to 13 percentage point
spread reported in the preceding several months. Also, lead times allowed
by purchasing managers in ordering production materials and maintenance and
repair supplies were up a bit from the low December levels.
Consumer Surveys
The Michigan survey of consumer sentiment edged up in January, while
the Conference Board index dropped back sharply. The rise in the Michigan
measure was attributable to a sharp increase in respondents' perceptions of
current buying conditions for large household goods; expectations of future
business conditions and personal financial situations were down somewhat
from December. Respondents to the Conference Board were more pessimistic in

-4-
their appraisal of both present conditions and the outlook six months hence.
The Michigan Survey measure of inflation expectations over the next 12
months increased 3/4 percentage point to 5.4 percent, the highest reading
since last May.
Manufacturers' Inventories
In current-cost terms, manufacturers' inventories fell at an annual
rate of $16 billion in December, following moderate increases in October and
November. For the fourth quarter as a whole, the current-cost data show
that factory stocks rose only $2.3 billion at an annual rate--considerably
slower than the average increase of $22-1/4 billion during the first three
quarters of last year. The December inventory reduction was apparently
quite widespread; outside of aircraft, most major industries reported
inventory declines.
A 0.5 percent drop in factory shipments left the manufacturers'
inventory-to-shipments ratio at 1.60 months at the end of December. The
ratio remained largely unchanged at this level all through the fourth
quarter, after following a gradual uptrend over the first three quarters of
last year.
Addenda
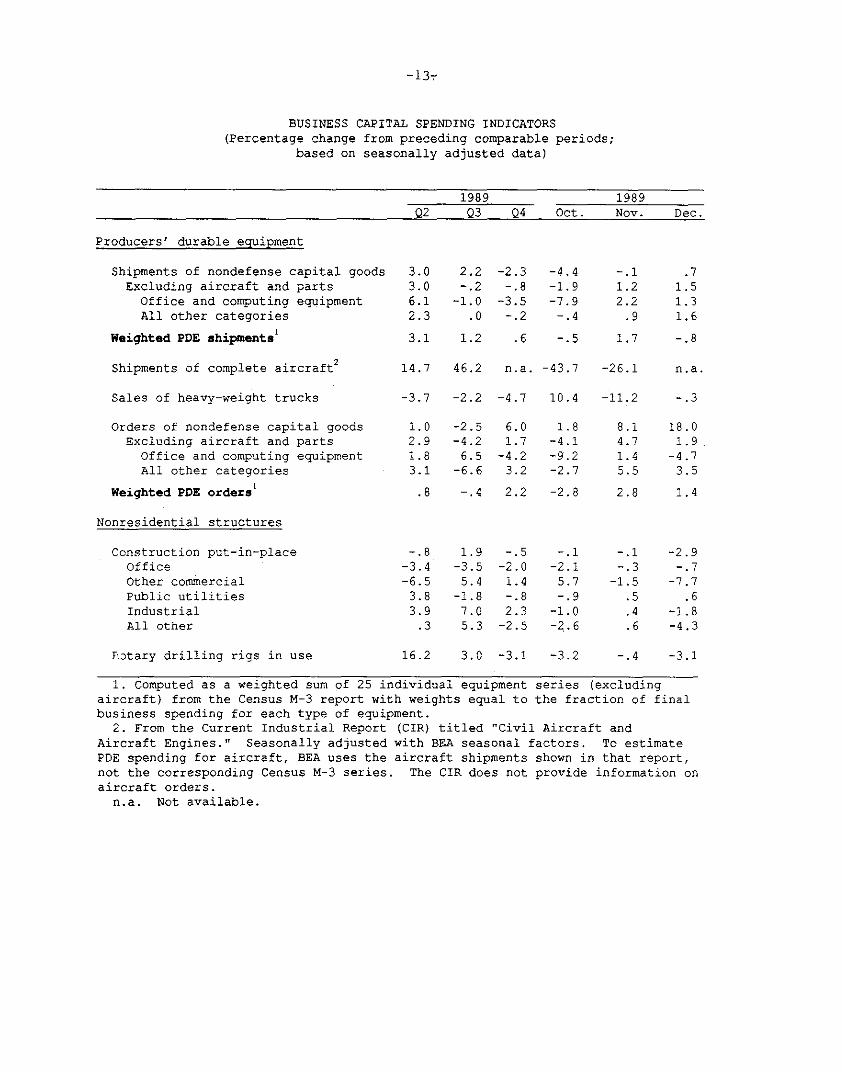
The attached table on business spending indicators and the chart on
nonresidential construction and selected indicators have been updated to
include data through December on construction put-in-place and revised data
on shipments and orders for durable goods.

CHANGES IN EMPLOYMENT 1
(Thousands of employees; based on seasonally adjusted data)
1989 1989 1990
1988 1989 Q2 Q3 Q4 Nov. Dec. Jan.
-----------Ave-age monthly changes--------
Nonfarm payroll employment2 2.76 204 240 163 151 281 96 275Strike-adjusted 275 206 245 177 127 278 22 273
Private 248 176 198 115 152 294 63 277Strike-adjusted 248 177 203 128 128 291 -11 275Manufacturing 29 -8 -10 -30 -23 -20 -28 -112
Durable 20 -13 -12 -29 -23 -18 -28 -101Nondurable 9 5 2 -1 -0 -2 0 -11
Construction 14 8 10 14 -7 20 -50 104Trade 64 47 32 38 42 87 -22 141Finance, insurance, real estate 11 12 11 15 10 20 11 10Services 118 99 137 76 86 157 71 106
Total government 27 28 42 48 -1 -13 33 -2
Private nonfarm production workers 197 142 151 94 120 277 24 235Manufacturing production workers 20 -11 -14 -27 -20 -31 -18 -107
Total employment3 192 146 165 -41 156 251 52 -25
Nonagricultural 193 145 181 -68 164 288 15 37
1. Average change from final month of preceding period to final month ofperiod indicated.
2. Survey of establishments. Strike-adjusted data noted.3. Survey of households.
SELECTED UNEMPLOYMENT RATES(Percent; based on seasonally adjusted data)
1989 1989 1990
1988 1989 Q2 Q3 Q4 Nov. Dec. Jan.
Civilian, 16 years and older 5.5 5.3 5.3 5.3 5.3 5.3 5.3 5.3
Teenagers 15.3 15.0 15.0 15.0 15.2 15.3 15.2 14.520-24 years old 8.7 8.6 8.4 8.7 8.9 9.0 8.9 8.5Men, 25 years and older 4.2 3.9 3.9 3.9 4.0 4.0 3.9 4.2Women, 25 years and older 4.3 4.2 4.2 4.2 4.3 4.2 4.3 4.1
White 4.7 4.5 4.5 4.5 4.5 4.5 4.6 4.5Black 11.7 11.5 11.3 11.3 11.8 11.9 11.8 11.3
Fulltime workers 5.1 4.9 4.9 5.0 5.0 5.0 5.0 5.0
Memo:Total nationall 5.4 5.2 5.2 5.2 5.3 5.3 5.3 5.2
1. Includes resident armed forces as employed.

AVERAGE HOURLY EARNINGS
(Percentage change; based on seasonally adjusted data) 1
1989 1989 1990
1988 1989 Q2 Q3 Q4 Nov. Dec. Jan.
-Annual rate- -Month-y rate-
Total private nonfarm 3.7 3.9 4.0 4.1 3.8 .0 .5 .1
Manufacturing 3.0 2.7 2.2 3.6 2.2 .2 .3 -.4Durable 2.8 2.4 2.3 4.1 1.0 .0 .3 -1.0Nondurable 3.1 3.4 2.5 3.3 4.4 .2 .5 .4
Contract construction 2.3 3.2 3.2 2.1 4.0 .6 .7 -2.0Transportation and
public utilities 2.0 2.1 1.8 2.7 1.0 -.6 .3 .7Finance, insurance
and real estate 5.3 4.5 6.0 5.6 4.5 -1.0 1.2 -.2Total trade 4.1 4.0 4.0 4.1 4.3 .0 .5 .4Services 4.9 5.6 6.1 5.7 5.2 -.4 .8 .4
Memo:Hourly earnings index 2 3.5 3.5 3.8 3.9 3.5 -.1 .6 .0
1. Changes over periods longer than one quarter are measured fromfinal quarter of preceding period to final quarter of period indicated.
2. The Hourly Earnings Index after 1988 was produced by FRB staff.

SUMMARY OF SURVEY OF PURCHASING MANAGERSFOR INDUSTRIAL FIRMS
February 1, 1990
1989 1989Q2 Q3
1989 1989 1989 1989 1990Q4 Oct Nov Dec Jan
New ordersIncreasesSameDeclinesNet change (n.s.a.) <1>Net change (s.a.) <1>
New export ordersIncreasesSameDeclinesNet change (n.s.a.) <1,2>
- - - - - - - - - - - Percent reporting - - - - - -
29 26 20 1956 52 51 5415 22 * 29 2714 4 -9 -7
7.8 4.0 -9.3 -.7
24 2469 70
7 617.4 17.7
19 1673 7,
8 511.0 11.0
ProductionIncreasesSameDeclinesNet changeNet change
EmploymentIncreasesSameDeclinesNet changeNet change
Prices paidIncreasesSameDeclinesNet changeNet change
InventoriesIncreasesSameDeclinesNet changeNet change
(n.s.a.) <1>(s.a.) <1>
(n.s.a.) <1>(n.s.) <1>
(n.s.a.) <1>(s.a) <1>
(n.s.a.) <1>(s.a.) <1>
Vendor performanceSlowerSameFasterNet change (n.s.a.) <3>Net change (s.a) <3>
Average lead times, numberMRO suppliesProduction materialsCapital goods
of days,2956
174
seasonally adjusted25 2658 54171 172
<1> Increases minus declines.<2> Data on export orders available<3> Slower less faster.
only since January 1988.

2/1/90
Purchasing Managers*(Seasonally adjusted)
Percent
New orders
I an.
______I l lI1986 1988 1984 1986 1988
1984 1986 1988 1990
- - 50
1-- 1l- 1-----751984 1986 1988 1990
Percent reporting increases are netted with those reporting decreases.** Positive entries represent slower deliveries.
1984
Percent
1990
Percent
Percent

2/1/90-9-
Average Lead Time(Monthly, seasonally adjusted)
MRO SUPPLIES
-- 20
I I I I I I I I I I I1980 1982 1988 1990
PRODUCTION MATERIALS
1980 1982 1984 1986 1988 1990
CAPITAL GOODS
S " Jan.
I I I I I I I I I I I19901980 1982 1984 1986
Source: Calculated by FR staff from monthly purchasing managers reports.

Consumer AttitudesFebruary 2, 1990
Index
Conference Board Index of Consumer Confidence
120 [
Ii I
i iF,
iI I\ /F',
80-
Michigan Survey Research Center Index of Consumer Sent
V I4 I (I
/'
Jan
iment
1989
The base of the Michigan Index is February 1966; the base ofthe Conference Board Index is the annual average for 1985.Both indexes are an average of five equally-weighted questionsthat relate to current and expected economic conditions.However, the questions in the two surveys are different andthe timing of the surveys in the field varies.
90 I

-11
CHANGES IN MANUFACTURING AND TRADE INVENTORIES(Billions of dollars at annual rates;based on seasonally adjusted data)
1989 1989
Q2 Q3 Q4 Oct. Nov. Dec.
Current-cost basis:
Total 61.2 39.1 - 31.0 41.3Total excluding auto 47.6 30.0 -- 67.1 41.7Manufacturing 21.4 17.6 2.3 9.9 13.2 -16.1Wholesale 11.5 7.4 -- 38.7 11.7Retail 28.3 20.1 -- -17.6 16.4
Automotive 13.6 9.1 -- -36.0 -.4Excluding auto 14.7 11.1 -- 18.5 16.8
Constant-dollar basis:
Total 16.2 9.9 -- 46.7 38.9Total excluding auto 19.2 18.9 -- 43.0 34.3Manufacturing 8.3 12.0 -- 1.1 11.6 --Wholesale 5.2 -.5 -- 30.6 11.7Retail 2.6 -1.6 -- 14.9 15.6Automotive -3.0 -9.0 -- 3.6 4.6Excluding auto 5.7 7.4 -- 11.3 11.0
INVENTORIES RELATIVE TO SALES <1>(Months supply; based on seasonally adjusted data)
1989 1989
Q2 Q3 Q4 Oct. Nov. Dec.
Range inpreceding 12 months:<2>
Low High
Current-cost basis:
Total 1.48 1.54 1.51 1.52 -- 1.53 1.52Total excluding auto 1.46 1.51 1.47 1.49 -- 1.49 1.49Manufacturing 1.53 1.64 1.57 1.60 1.60 1.60 1.60 1.60Wholesale 1.27 1.31 1.28 1.28 -- 1.29 1.28Retail 1.59 1.64 1.63 1.64 -- 1.64 1.64
Automotive 1.87 2.06 2.05 2.04 -- 2.03 2.04Excluding auto 1.49 1.53 1.51 1.52 -- 1.53 1.53
Constant-dollar basis:
Total 1.48 1.52 1.50 1.49 -- 1.51 1.51Total excluding auto 1.46 1.51 1.47 1.48 -- 1.49 1.49Manufacturing 1.52 1.63 1.57 1.58 -- 1.59 1.59Wholesale 1.31 1.36 1.33 1.32 -- 1.33 1.32Retail 1.51 1.56 1.55 1.52 -- 1.55 1.56
Automotive 1.70 1.93 1.88 1.72 -- 1.81 1.84Excluding auto 1.44 1.47 1.46 1.46 -- 1.47 1.48
<1> Ratio of end of period inventories to average monthly sales for the period.<2> Highs and lows are specific to each series and are not necessarily
coincidential. Range is for the 12-month period preceding the latest month forwhich data are available.

RATIO OF INVENTORIES TO SALES(Current-cost data)
Wholesale
Total manufacturing
4 -It
- I.'-'it-
Excluding transportation equipment
I I I I I I I1985 1986 1987 1988 1989
Total RetailRatio
I,
- I
Excluding motor vehicles,farm and groceries
* I 'N' i " ' t *' N
St I
N
Total wholesale
19 I I I 1 81985 1986 1987 1988 1989
Retail Excluding Autos and Food
1985 1986 1987 1988 1989
Manufacturing
-- 1.9
'p
2~' '
- 1.6
Ratio
1985 1986 1987 1988 1989
-13-
BUSINESS CAPITAL SPENDING INDICATORS(Percentage change from preceding comparable periods;
based on seasonally adjusted data)
1989 1989Q2 Q3 Q4 Oct. Nov. Dec.
Producers' durable equipment
Shipments of nondefense capital goods 3.0 2.2 -2.3 -4.4 -.1 .7Excluding aircraft and parts 3.0 -.2 -.8 -1.9 1.2 1.5
Office and computing equipment 6.1 -1.0 -3.5 -7.9 2.2 1.3All other categories 2.3 .0 -.2 -.4 .9 1.6
Weighted PDE shipments' 3.1 1.2 .6 -.5 1.7 -.8
Shipments of complete aircraft2 14.7 46.2 n.a. -43.7 -26.1 n.a.
Sales of heavy-weight trucks -3.7 -2.2 -4.7 10.4 -11.2 -.3
Orders of nondefense capital goods 1.0 -2.5 6.0 1.8 8.1 18.0Excluding aircraft and parts 2.9 -4.2 1.7 -4.1 4.7 1.9
Office and computing equipment 1.8 6.5 -4.2 -9.2 1.4 -4.7All other categories 3.1 -6.6 3.2 -2.7 5.5 3.5
Weighted PDE orders' .8 -.4 2.2 -2.8 2.8 1.4
Nonresidential structures
Construction put-in-place -.8 1.9 -.5 -.1 -.1 -2.9Office -3.4 -3.5 -2.0 -2.1 -.3 -.7Other commercial -6.5 5.4 1.4 5.7 -1.5 -7.7Public utilities 3.8 -1.8 -.8 -.9 .5 .6Industrial 3.9 7.0 2.3 -1.0 .4 -1.8All other .3 5.3 -2.5 -2.6 .6 -4.3
.otary drilling rigs in use 16.2 3.0 -3.1 -3.2 -.4 -3.1
1. Computed as a weighted sum of 25 individual equipment series (excludingaircraft) from the Census M-3 report with weights equal tobusiness spending for each type of equipment.
the fraction of final
2. From the Current Industrial Report (CIR) titled "Civil Aircraft andAircraft Engines." Seasonally adjusted with BEA seasonal factors. To estimatePDE spending for aircraft, BEA uses the aircraft shipments shown in that report,not the corresponding Census M-3 series. The CIR does not provide information onaircraft orders.
n.a. Not available.

-14-
NONRESIDENTIAL CONSTRUCTION AND SELECTED INDICATORS <1>
Index, Dec. 1982 = 100, ratio scale
1980 1982 1984 1986 1988
Office Other Commercial
Industrial
(NC)-'^-- - 4 t -4,
4'- 4 -
*C
1986 1988
Institutional
(P) ,'
(c)
I I I I I1984 1986 1988
<1> Six-month moving average for all series shown. Data end in November for all series except contracts, which go through December.<2> Varies by panel: either permits (P), contracts (CN), or new commitments(NC).

THE FINANCIAL ECONOMY
Summary of Responses to the January 1990 Senior Loan Officer Opinion Survey
The January 1990 Senior Loan Officer Opinion Survey on Bank Lending
Practices focused on credit standards and lending terms for different types
of C&I loans and whether various price and nonprice terms on new loans had
been tightened recently. Respondents were asked about their loan policies
with respect to different categories of C&I loans that are believed to pose
different degrees of credit risk; these included merger-related loans,
nonmerger-related loans to investment-grade C&I customers, nonmerger-related
loans to below investment-grade firms, C&I loans to new customers, and real
estate loans for acquisition, land development, and construction (ADC
loans). In addition, respondents were asked to rank various factors that
may have led them to alter their loan policies toward C&I and ADC customers,
and what percent of their loans in this latter category would have been made
by savings and loan associations in the absence of recent problems in the
thrift industry.
The survey indicated that many banks reported tightening their credit
standards and nonprice terms of credit for the riskier types of C&I loans,
but not for nonmerger-related loans to their investment-grade borrowers.
Survey results also revealed that a large majority of respondents had become
less willing to make ADC loans. Nevertheless, a number of banks indicated
that they were making such loans to customers that had formerly borrowed
from thrifts.

Policy Changes for C&I Loans in General
About one-fifth of respondents reported a decreased willingness to
extend overall business credit during the past six months. All of these
banks cited a less favorable economic outlook as a reason, followed, in
order of importance, by industry-specific problems, a deterioration in the
quality of their overall loan portfolio, pressures on their capital
positions, and regulatory pressures. About one-sixth of banks indicated
that their willingness to extend business credit to new as opposed to
existing customers had declined over the past half year.
Policy Changes for Specific Categories of C&I Loans
Changes in policy over the past six months toward different types of
C&I loans were far from uniform. Nearly three-fourths tightened their
credit standards for reviewing loan applications for merger-related loans
and over half did so on nonmerger-related loans to below investment-grade
firms. By contrast, less than one-tenth of respondents tightened their
credit standards on nonmerger-related loans to investment-grade firms. That
a decline in the general economic outlook was the most important factor
motivating tighter lending policies for overall C&I loans and that standards
were mainly tightened for riskier types of loans is consistent with the
notion that increases in downside risk tend disproportionately to affect the
perceived credit risk of highly leveraged firms and of noninvestment-grade
firms.
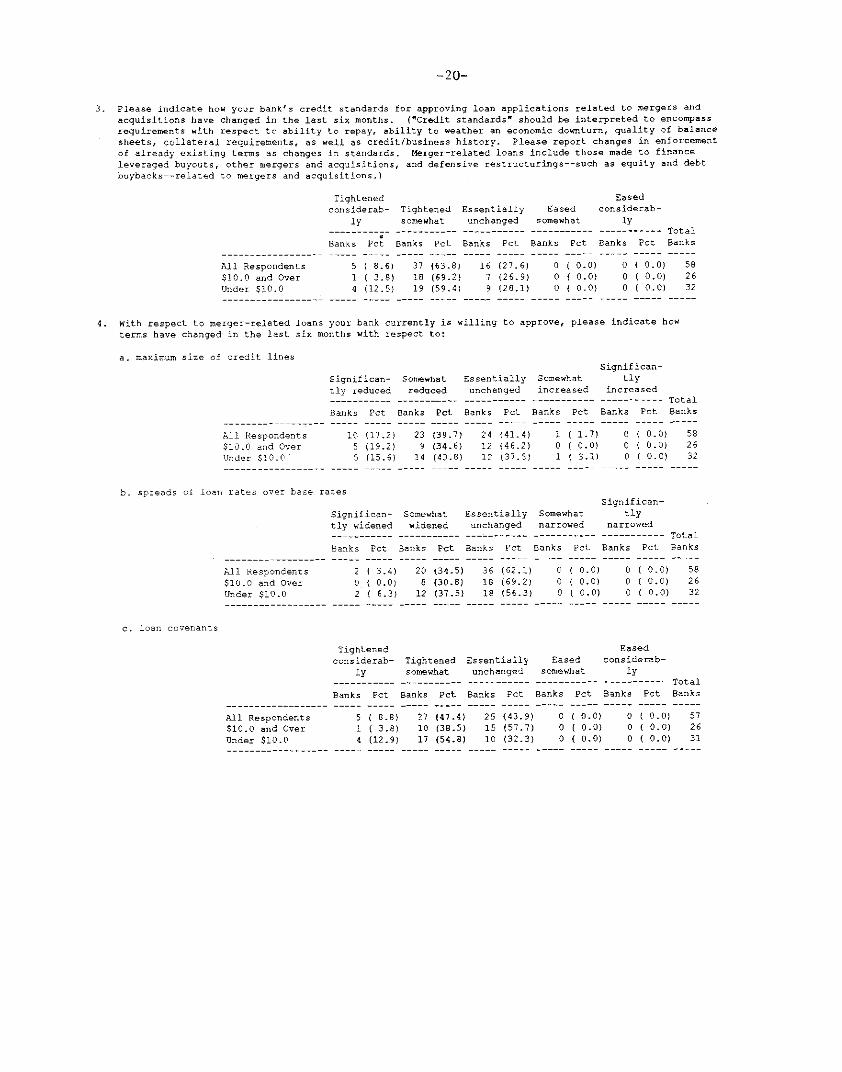
Banks also were asked whether they changed specific price and nonprice
terms for these three types of C&I loans in the last six months. Virtually
all respondents indicated that they either tightened or left unchanged these
terms, but for investment-grade customers not involved in merger activity,

there was relatively little restriction. Over half of the respondents
reported tightening loan covenants for merger-related loans and for
nonmerger-related loans to noni-vestment-grade firms. (Such covenants help
limit loan losses by preventing excessive risk-taking by borrowers and by
providing banks more leeway in working out problem loans.) For these two
types of loans, nearly two-fifths reported increasing loan rate spreads with
respect to base rates. With respect to credit lines, over one-half of
surveyed banks reduced maximum line sizes for merger-related loans and about
two-fifths, for nonmerger-related loans to below investment-grade firms.
For nonmerger-related loans to investment-grade borrowers, one-eight of
respondents reported lowering sizes of maximum credit lines, one-tenth
reported increasing loan rate spreads, and about one-tenth indicated that
they tightened loan covenants. The difference in the frequency of
tightening loan covenants across the different loan types may reflect, in
part, the greater risks posed by borrowers involved in merger-related
activity and by noninvestment-grade businesses relative to the risks posed
by investment-grade firms borrowing for nonmerger-related purposes.
Loan Policy Changes for ADC Loans
Nearly four-fifths of respondents reported a reduced willingness to
make ADC loans compared to six months ago. Of these banks, nearly three-
fifths reduced permissible loan-to-value ratios, and substantial proportions
reported restricting credit for income-generating properties (nearly one-
half) and for single-family homes (nearly one-third) that were not sold
prior to construction. About one-third of the banks reporting less
willingness indicated that they had lowered loan sizes and about one-third

imposed limits on loans outside of their geographic area. Only about one-
fifth reported widening the spread of loan rates over base rates, and about
one-seventh reduced the maximum maturity f these loans or imposed
additional limits on loan participations. Nearly two-fifths of banks
reporting a reduced willingness to make these loans indicated that they had
cut off credit to some customers and one-fifth had denied loans to new
customers.
Almost all banks that were less willing to make these loans cited a
less favorable economic outlook as a reason, and nearly three-fourths
mentioned industry-specific problems as a factor. About one-half of such
banks indicated that a deterioration in the quality of their loan portfolio
was a factor in changing their attitude and about one-seventh cited
pressures on their bank's capital position.
Impact of the Thrift Crisis on Bank ADC Lending
Approximately one-third of respondents indicated that their ADC loans
were higher than they would otherwise be owing to the thrift crisis. Of
these banks, the vast majority estimated that less than ten percent of such
loans made in the last six months would have been made by savings and loan
associations in the absence of problems in the thrift industry.
Geographically, these banks were concentrated in the Philadelphia, Richmond,
and San Francisco Federal Reserve Districts. Several of these banks
mentioned that they lent only to the higher-quality former thrift customers
that sought credit.

TABLE 1
SENIOR LOAN OFFICER OPINION SURVEY ON BANK LENDING PRACTICESAT SELECTED LARGE BANKS IN THE UNITED STATES
(Status of policy as of January 1990)(Number of banks and percent of banks answering question)
(By volume of total domestic assets, in $ billions, as of September 30, 1989)
l.a. Has your bank's willingness to extend credit to C&I customers decreased over the last six months?
Yes No----------- ---------- TotalBanks Pet Banks Pet Banks
All Respondents$10.0 and OverUnder $10.0
12 (20.7) 46 (79.3) 586 (23.1) 20 (76.9) 266 (18.8) 26 (81.3) 32
b. If you answered yes to question 1.a, which of the following were important reasons? (Please rank byimportance.)
All Respondents$10.0 and OverUnder $10.0
Pressures Deteriorat- Lesson bank ion in favorablecapital quality of economic
position portfolio outlook----- --------- -----------Banks Mean Banks Mean Banks Mean
5 (2.0) 5 (2.0) 12 (1.6)3 (1.7) 2 (1.5)
c (1.7)
2 (2.5) 3 (2.3) 6 (1.5)
2.a. Has your bank's willingness to lend to new C&I customers decreased relative to itslend to existing customers over the last six months?
willingness to
Yes No---------- ----------- TotalBanks Pet Tanks Pct Banks
All Respondents 10 (17.2) 48 (82.8) 58$10.0 and Over 4 (15.4) 22 (84.6) 26Under $10.0 6 (18.8) 26 (81.3) 32
b. If you answered yes to question 2.a, which of the following actions have been taken
customers relative to existing customers? (More than one answer may apply.)
Maximumloan size Spreads
Credit or credit over basestandards line ratestightened reduced widened
All Respondents$10.0 and OverUnder $10.0
Banks Pct Banks
9 ( 90.0) 43 ( 75.0) 16 (100.0) 3
Pet Banks
(40.0) 2(25.0) 1(50.0) 1
Credit tonew
customersgenerally
cut off
Pet Banks
(20.0) 0(25.0) 0(16.7) 0
with respect to new
Other-------- Total
Banks Pct Banks
2 (20.0) 101 (25.0) 41 (16.7) 6
1 As of September 30, 1989, 27 respondents had domestic assets of $10 billion or more; combinedassets of these banks totalled $690 billion, compared to $907 billion for the entire panel of60 banks, and $2.80 trillion for all domestically chartered federally insured commercial banks.
2 Average rank calculated using 1 for most important, 2 for next most important, and so forth.
Industryspecificproblems
-----------
Banks Mean
8 (2.4)4 (2.0)4 (2.8)
Regulatorypressures
-----------
Banks Mean2
4 (3.5)2 (2.r)2 (5.0)
Other
Banks Mean
1 (1.0)
1 ( 0)1 (1.0}
3. Please indicate how your bank's credit standards for approving loan applications related to mergers andacquisitions have changed in the last six months. ("Credit standards" should be interpreted to encompassrequirements with respect to ability to repay, ability to weather an economic downturn, quality of balancesheets, collateral requirements, as well as credit/business history. Please report changes in enforcementof already existing terms as changes in standards. Merger-related loans include those made to financeleveraged buyouts, other mergers and acquisitions, and defensive restructurings--such as equity and debtbuybacks--related to mergers and acquisitions.)
Tightened Easedconsiderab- Tightened Essentially Eased considerab-
ly somewhat unchanged somewhat ly---------- ----------- ----------- ---------------------- TotalBanks Pct Banks Pet Banks Pet Banks Pct Banks Pct Banks
All Respondents 5 ( 8.6) 37 (63.8) 16 (27.6) 0 ( 0.0) 0 ( 0.0) 58$10.0 and Over 1 ( 3.8) 18 (69.2) 7 (26.9) 0 ( 0.0) 0 ( 0.0) 26Under $10.0 4 (12.5) 19 (59.4) 9 (28.1) 0 ( 0.0) 0 ( 0.0) 32
4. With respect to merger-related loans your bank currently is willing to approve, please indicate how
terms have changed in the last six months with respect to:
a. maximum size of credit linesSignifican-
Significan- Somewhat Essentially Somewhat tlytly reduced reduced unchanged increased increased--- ----- ----- ------ ---------------------- ----------- TotalBanks Pct Banks Pet Banks Pet Banks Pet Banks Pet Banks
All Respondents 10 (17.2) 23 (39.7) 24 (41.4) 1 ( 1.7) 0 ( 0.0) 58$10.0 and Over 5 (19.2) 9 (34.6) 12 (46.2) 0 ( 0.0) 0 ( 0.0) 26Under $10.0 5 (15.6) 14 (43.8) 12 (37.5) 1 (3.1) 0 ( 0.0) 32- - - - - - - - - - - - --.- --.- - - - - - --.- -. .- - --.- -. .- - --.- --.- - - - - - --.- - -
b. spreads of loan rates over base rates
All Respondents$10.0 and OverUnder $10.0
Significan-Significan- Somewhat Essentially Somewhat tlytly widened widened unchanged narrowed narrowed---------- ----------- -------- -------.--- ----------- Total
Banks Pct Banks Pet Banks Pct Banks Pct Banks Pet Banks
2 ( 3.4) 20 (34.5) 36 (62.1) 0 ( 0.0) 0 ( 0.0) 580 ( 0.0) 8 (30.8) 18 (69.2) 0 ( 0.0) 0 ( 0.0) 262 ( 6.3) 12 (37.5) 18 (56.3) 0 ( 0.0) 0 ( 0.0) 32
---.- - --.- --.- ----.- -.- --.-.- - ----.- -.
c. loan covenants
Tightenedconsiderab-
ly
All Respondents$10.0 and OverUnder $10.0
Tightened Essentially Easedsomewhat unchanged somewhat--------- --------- -----------
Banks Pet Banks Pet Banks Pct Banks
5 ( 8.8) 27 (47.4) 25 (43.9) 01 (3.8) 10 (38.5) 15 (57.7) 04 (12.9) 17 (54.8) 10 (32.3) 0
Pct
0.0)0.0)
( 0.0)
Easedconsiderab-
ly----- Total
Banks Pct Banks
0 ( 0.0) 570 ( 0.0) 260 ( 0.0) 31

-21-
5. Please indicate how your bank's credit standards for approving loan applications from investment-gradeC&I customers (other than those related to mergers and acquisitions) have changed in the last six months.("Credit standards" and "merger-related loans" should be interpreted as in question 3.)
Tightened Easedconsiderab- Tightened Essentially Eased considerab-
ly somewhat unchanged somewhat ly------------------------------- ----------- ----------- TotalBanks Pet Banks Pot Banks Pot Banks Pot Banks Pc' Banks
All Respondents 1 ( 1.8) 3 ( 5.3) 52 (91.2) 1 ( 1.8) 0 ( 0.0) 57$10.0 and Over 0 (0.0) 2 ( 7.7) 23 (88.5) 1 ( 3.8) 0 ( 0.0) 26Under $10.0 1 ( 3.2) 1 ( 3.2) 29 (93.5) 0 ( 0.0) 0 ( 0.0) 31
6. With respect to loans to investment-grade C&I customers (other than merger-related loans) that your bankcurrently is willing to approve, please indicate how terms have changed in the last six months with respect to:
a. maximum size of credit linesSignifican-
Significan- Somewhat Essentially Somewhat tlytly reduced reduced unchanged increased increased---------- ---------- --------- ----------- ----------- TotalBanks Pet Banks Pet Banks Pct Banks Pet Banks Pot Banks
All Respondents 2 ( 3.5) 6 (10.5) 48 (84.2) 1 (1.8) 0 ( 0.0) 57$10.0 and Over I ( 3.8) 1 ( 3.8) 23 (88.5) 1 ( 3.8) 0 ( 0.0) 26Under $10.0 1 (3.2) 5 (16.1) 25 (80.6) 0 ( 0.0) 0 ( 0.0) 31
b. spreads of loan rates over base ratesSignifican-
Sicnifican- Somewhat Esse-tiasll Somewha tltly widened widened niCangced narrowed nrrcoed---------- ----------- ----------- ----------- ----------- TotalBanks Pet Banks Pot Banks Pct Banks Pet Banks Pot Banks
All Respondents 1 ( 1.8) 5 ( 8,8) 48 (84.2) 3 ( 5.3) 0 ( 0.0) 57$10.0 and Over 0 ( 0.0) 1 ( 3.8) 23 (88.5) 2 ( 7.7) 0 ( 0.0) 26Under $10.0 1 ( 3.2) 4 (12,9) 25 (80.6) 1 ( 3.2) 0 ( 0.0) 31
c. loan covenants
Tightened Easedconsiderab- Tightened Essentially Eased considerab-
ly somewhat unchanged somewhat ly----------- ----- -- ----------- ---------- ----------- TotalBanks Pet Banks Pet Banks Pet Banks Pct Banks Pet Banks
All Respondents 1 ( 1.8) 5 ( 8.9) 50 (89.3) O ( 0.0) 0 ( 0.0) 56$10,0 and Over 0 ( 0.0) 3 (11.5) 23 (88.5) 0 ( 0.0) 0 ( 0.0) 26Under $10.0 1 ( 3.3) 2 ( 6.7) 27 (90.0) 0 ( 0.0) 0 0.0) 30

7. Please indicate how your bank's credit standards for approving loan applications (other than thoserelated to mergers and acquisitions) from below investment-grade C&I customers have changed in the last sixmonths. ("Credit standards" and "merger-related loans" should be interpreted as in question 3.)
Tightened Easedconsiderab- Tightened Essentially Eased considerab-
ly somewhat unchanged somewhat ly--------------------- --------------------- ----------- TotalBanks Pct Banks Pct Banks Pct Banks Pet Banks Pct Banks
All Respondents 4 ( 6.9) 29 (50.0) 25 (43.1) 0 ( 0.0) 0 ( 0.0) 58$10.0 and Over 2 ( 7.7) 11 (42.3) 13 (50.0) 0 ( 0.0) 0 ( 0.0) 26Under $10.0 2 ( 6.3) 18 (56.3) 12 (37.5) 0 ( 0.0) 0 0.0) 32
8. With respect to loans to below investment-grade C&I customers (other than merger-related loans) thatyour bank currently is willing to approve, please indicate how terms have changed in the last six monthswith respect to:
a. maximum size of credit linesSignifican-
Significan- Somewhat Essentially Somewhat tlytly reduced reduced unchanged increased increased----------- ------------------------- ----------- ----------- TotalBanks Pet Banks Pct Banks Pct Banks Pet Banks Pct Banks
All Respondents 4 ( 6.9) 20 (34.5) 34 (58.6) 0 ( 0.0) 0 ( 0.0) 58$10.0 and Over 2 ( 7.7) 8 (30.8) 16 (61.5) 0 ( 0.0) 0 ( 0.0) 26Under $10.0 2 ( 6.3) 12 (37.5) 18 (56.3) 0 ( 0.0) 0 ( 0.0) 32
b. spreads of loan rates over base ratesSignifican-
Significan- Somewhat Essentially Somewhat tlytly widened widened unchanged narrowed narrowed----------- -------------------- ----------- ----------- TotalBanks Pct Banks Pet Banks Pct Banks Pet Banks Pct Banks
All Respondents 1 (1.7) 21 (36.2) 35 (60.3) 1 (1.7) 0 ( 0.0) 58$10.0 and Over 0 ( 0.0) 8 (30.8) 17 (65.4) 1 ( 3.8) 0 ( 0.0) 26Under $10.0 1 ( 3.1) 13 (40.6) 18 (56.3) 0 ( 0.0) 0 (0.0) 32
c. loan covenants
Tightened Easedconsiderab- Tightened Essentially Eased considerab-
ly somewhat unchanged somewhat ly------- - -------------------- ----------- ----------- TotalBanks Pct Banks Pet Banks Pct Banks Pct Banks Pct Banks
All Respondents 3 { 5.3) 28 (49.1) 26 (45.6) 0 ( 0.0) 0 ( 0.0) 57$10.0 and Over 2 ( 7.7) 9 (34.6) 15 (57.7) 0 ( 0.0) 0 ( 0.0) 26Under $10.0 1 ( 3.2) 19 (61.3) 11 (35.5) 0 ( 0.0) 0 ( 0.0) 31
9. Roughly what percent of the construction and land acquisition and development loans that your bank hasmade in the last six months would you estimate went to firms that would have borrowed from thriftinstitutions absent recent adverse developments in that industry?
Between 10Essentially Under 10 and 25 Over 25
none percent percent percent---------------------- ---------- ----------- TotalBanks Pct Banks Pet Banks Pet Banks Pet Banks
All Respondents 34 (61.8) 19 (34.5) 2 ( 3.6) 0 ( 0.0) 55$10.0 and Over 13 (52.0) 11 (44.0) 1 ( 4.0) 0 ( 0.0) 25Under $10.0 21 (70.0) 8 (26.7) 1 ( 3.3) 0 ( 0.0) 30

SPlease indicate your bank's willingness to make construction and land acquisition and developmentloans now as opposed to six months ago.
Somewhat SomewhatMuch more more Unchanged less Much less
----------- - ------- ----------- ----------- ----------- TotalBanks Pct Banks Pet Banks Pet Banks Pet Banks Pet Banks
All Respondents 0 ( 0.0) 0 ( 0.0) 11 (19.3) 35 (61.4) 11 (19.3) 57$10.0 and Over 0 ( 0.0) 0 ( 0.0) 3 (12.0) 19 (76.0) 3 (12.0) 25Under $10.0 0 ( 0.0) 0 ( 0.0) 8 (25.0) 16 (50.0) 8 (25.0) 32
11. If you answered "less" to question 10 (answers iv. or v.), please indicate which of the followingsteps your bank has taken in this regard (more than one answer may apply).
i.) lowered the maximum amount that can be lent to a single borrower.ii.) lowered the maximum size of loans generally.
iii.) reduced the maximum maturity of loans.iv.) restricted the availability of credit to finance single-family
home construction prior to the homes having been sold.v.) restricted the availability of credit to finance the
construction of income properties prior to permanent(takeout) financing having been arranged.
vi.) imposed additional limits on out-of-area lending.vii.) imposed additional limits on loan participations.
viii.) reduced permissible loan to value ratios.ix.) widened spreads over base rates.X.) cut off credit to some existing customers.
xi.) generally denied credit to new customers.xii.) other (please specify).
Lowered Loweredmax. loan max. sizeto ind, of loans
borrower generally
Reducedmay.
maturity ofloans
Restrictedcredit tosinglehomes
Restrictedcredit toconst. of
income prop.
Imposedadd. limitsto out-of-
area loans
Imposedadd. limits
on loanparticipa-
tions
Reducedpermissibleloan/value
ratios
All Respondents$10.0 and OverUnder $10.0
Pet Banks Pet Banks
(30.4) 15 (32.6) 7(27.3) 7 (31.8) 3(33.3) 8 (33.3) 4
Pet Banks
(15.2) 14(13.6) 7(16.7) 7
Pet Banks
(30.4) 21(31.8) 9(29.2) 12
Pet Banks
(45.7) 15(40.9) 7(50.0) 8
Pet Banks
(32.6) 6(31.8) 4(33.3) 2
Pet Banks
(13.0) 26(18.2) 10(8.3) 16
Pet Banks Pet
(56.5) 10 (22.2(45.5) 2 ( 9.5(66.7) 8 (33.3:
All Respondents$10.0 and OverUnder $10.0
GenerallyCut off denied
credit to credit tosome new
customers customers Other--------- ---------- ----------- TotalBanks Pet Banks Pet Banks Pet Banks
18 (39.1) 9 (19.6) 12 (26.1) 469 (40.9) 1 ( 4.5) 8 (36.4) 229 (37.5) 8 (33.3) 4 (16.7) 24
12. If you have tightened your supply of credit for construction and acquisition and land developmentloans in the last six months, which of the following were important reasons? (Please rank in order ofimportance.)
Pressureson bankcapital
position
All Respondents$10.0 and OverUnder $10.0
Deteriorat-ion in
quality ofportf
Banks Mean Banks
7 ( 3.3) 192 ( 3.0) 75 ( 3.4) 12
Lessfavorable
economicIndustryspecific
:olio outlook problems Other------ ----------- ----------- ----------- TotalMean Banks Mean Banks Mean Banks Mean Banks
( 2.1) 43 ( 1.6) 34 ( 1.7) 7 ( 3.1) 46( 1.9) 21 ( 1.6) 16 ( 1.8) 4 ( 2.3) 22( 2.3) 22 ( 1.6) 18 ( 1.7) 3 ( 4.3) 24
(CONTINUED)
Widenenespreads
over baserates

-24-
MONETARY AGGREGATES(based on seasonally adjusted data unless otherwise noted)
Growth1989 1989 1989 1989 1990 Q4 89-
19891 Q3 Q4 Nov Dec Jan pe Jan 90pe
------------ Percent change at annual rates---------------------
0.5 1.5 6.7 2.7 12.2 -2 34.5 7.1 7.6 8.4 7.8 4 543.3 4.0 2.8 4.9 3.7 2 3
Levels------------ Percent change at annual rates------------ bil. $
Dec 89
Selected components
4. MI-A
5. Currency6. Demand deposits
7. Other checkable deposits
8. M2 minus M12
9. Overnight RPs and Eurodollars, NSA10. General purpose and broker/dealer money
market mutual fund shares, NSA11. Commercial banks12. Savings deposits, SA, plus MMDAs, NSA
3
13. Small time deposits14. Thrift institutions15. Savings deposits, SA, plus MMDAs, NSA
3
16. Small time deposits
0.4 1.2 3.7 -1.9
0.9 2.2 12.1 11.1 16.1
5.9 9.0 7.9 10.3
1.1 -12.8 -16.5 16.7
9.9 -5 510.8
14 222.1-20 281.2
2 286.7
5 2418.9
46 72.8
309.11064.5
543.3521.2968.9354.8614.1
17. M3 minus M24 -1.2 -7.0 -14.9 -8.5 -12.1
18. Large time deposits19. At commercial banks, net
5
20. At thrift institutions21. Institution-only money market
mutual fund shares, NSA22. Term RPs, NSA23. Term Eurodollars, NSA
4.4 -1.5 -7.510.1 2.1 1.5-7.7 -9.8 -28.2
40.1 9.46.5 -115.08.9 38.4
----- Average monthly change in billions of dollars----
MEMORANDA:6
24. Managed liabilities at commercialbanks (25+26)
25. Large time deposits, gross26. Nondeposit funds27. Net due to related foreign
institutions28. Other
7
29. U.S. government deposits at commercialbanks8
5.4 3.42.6 -0.32.8 3.7
0.0 0.7 -0.82.8 3.0 4.6
-0.3 -1.2 -0.8
-1.2 -1.64.5 -1.2
0.5 0.9 -2 21.3
Amounts shown are from fourth quarter to fourth quarter.Nontransactions M2 is seasonally adjusted as a whole.Commercial bank savings deposits excluding MMDAs grew during December and January at rates of 11.5
percent and 6 percent, respectively. At thrift institutions, savings deposits excluding MMDAs grewduring December and January at rates of 3.8 percent and 6 percent, respectively.
4. The non-M2 component of M3 is seasonally adjusted as a whole.
5. Net of large denomination time deposits held by money market mutual funds and thrift institutions.
6. Dollar amounts shown under memoranda are calculated on an end-month-of-quarter basis.
7. Consists of borrowing from other than commercial banks in the form of federal funds purchased, securities
sold under agreements to repurchase, and other liabilities for borrowed money (including borrowing from the
Federal Reserve and unaffiliated foreign banks, loan RPs and other minor items). Data are partially estimated.
8. Consists of Treasury demand deposits and note balances at commercial banks.
pe - preliminary estimate
Note: Data on the monetary aggregates do not incorporate the results of the benchmark and seasonal review.
-4 822.8
1 7.2-8 242.3
-25-
COMMERCIAL BANK CREDIT AND SHORT- AND INTERMEDIATE-TERM BUSINESS CREDIT(Percentage changes at annual rates, based on seasonally adjusted data)
1988:.Q4to
19
S Total loans and securitiesat banks
2. Securities
S U.S. government securities
4. Other securities
5. Total loans
6. Business loans
7. Real estate loans
8. Consumer loans
9. Security loans
10. Other loans
11. Business loans net of bankersacceptances
12. Loans at foreign branches2
13. Sum of lines 11 & 12
14. Commercial paper issued bynonfinancial firms
15. Sum of lines 13 & 14
16. Bankers acce tances: U.S. traderelated '
17. Line 15 plus bankers acceptances:U.S. trade related
18. Finance company loans to business3
19. Total short- and intermediate-term business credit (sum oflines 17 & 18)
1. Average of Wednesdays.2. Loans at foreign branches are loans made to U.S.
198989:Q4 Q3 Q4 Nov. Dec.
------------------ Commercial Bank Credit -
7.2 8.0 5.4 3.9 -2.8
4.1 1.6 11.8 7.1 .8
0.3 5.4 19.1 17.8 -1.8
7.3 -6.2 -3.5 -15.8 6.7
8.1 9.9 3.6 3.0 -3.9
6.4 8.3 -1.6 .9 -13.7
2.7 13.7 11.6 10.7 11.7
6.5 6.1 6.5 8.0 3.8
4.2 -6.8 -21.1 -26.2 -80.2
1.5 10.6 -9.6 -22.5 -30.1
------ Short- and Intermediate-Term Business
10.3 17.3 15.2
5.1 1.5 3.5
5.8 -1.1 -12.4 -10.3
4.9 .9 2.9
14.1 n.a. -2.3
7.0 n.a. 1.7 n.a.
firms by foreign branches of domesti
n.a. 1078.96
cally chartered banks.3. Based on average of data for current and preceding ends of month.4. Consists of acceptances that finance U.S. imports, U.S. exports, and domestic shipment and storage of goods.5. November data.p--preliminary.n.a.--not available
Levelsbil.$
Jan.p December
--------------------
5 2577.4
7 588.2
19 396.9
-21 181.3
5 1999.2
2 634.2
9 754.8
8 378.1
-41 37.8
1 194.3
Credit ----------

SELECTED FINANCIAL MARKET QUOTATIONS 1/(percent)
1987
2/Oct 16
Short-term rates
Federal funds 3/
Treasury bills 4/3-rmnth6-rnnth1-year
Comercial paper1-mnth3-Month
March FCHigs Dec 19 Feb 1
9.85 8.50 8.24
9.09 7.67 7.769.11 7.48 7.719.05 7.20 7.54
7.94 10.05 8.75 8.238.65 10.15 8.39 8.14
Change from:
ar 89 FUCHighs Dec 19
-1.61 -0.26
-1.82 -0.52-2.01 -0.25
Larg negotiable CD's 4/T-nonth3--month6-month
Eurodollar deposits 5/1-Minth3-mDnth
Bank prime rate
7.92 10.078.90 10.329.12 10.08
8.76 8.188.43 8.208.20 8.23
8.00 10.19 8.81 8.199.06 10.50 8.50 8.25
9.25 11.50 10.50 10.00
-2.00 -0.62-2.25 -0.25
-1.50 -0.50
Intermediate- and long-term rates
U.S. Treasury3-year
10-year30-year
(constant maturity)9.52
10.2310.24
Municipal revenue 6/(Bond Bayer index)
Corporate-A utilityRecently offered
Home nmrtgage rates 7/Fixed-rateARM, 1-year
9.88 7.73 8.359.53 7.78 8.429.31 7. 5 8.44
7.95 7.29 7.52
11.50 10.47 9.36 9.75
11.58 11.22 9.75 10.058.45 9.31 8.39 8.41
-0.43 0.23
-0.72 0.39
-1.17 0.30-0.90 0.02
1989 1990 Percent change fom:
Record Lows FOC Record 1989 FOCMhigs Date Jan 3 Dec 19 Feb 1 highs Lows Dec 19
Stock prices
Dow-Jones Industrial 2810.15 1/2/90 2144.64 2695.61 2586.26 -7.97 20.59 -4.06NSE Composite 199.34 10/9/89 154.98 189.40 181.52 .9422.21 -4.16AMER Composite 397.03 10/10/89 305.24 367.95 351.50 -11.47 20.54 -4.47NASDAQ (TC) 485.73 10/9/89 378.56 434.35 417.76 -13.99 14.74 -3.82Wilshire 3523.47 10/9/89 2718.59 3314.70 3166.40 -10.13 21.93 -4.47
One-day quotes except as noted.Last business day prior to stock marketOct. 19, 1987.
decline on Monday
Average for two-week reserve maintenance period closest todate shown. Last observation is average to date for themaintenance period ending February 7, 1990.
4/ Secondary market.5/ Bid rates for Eurodollar
deposits at 11 a.m. London time.6/ Based on one-day Thursday quotes
and futures-market index changes.7/ Quotes for week ending
Friday closest to date shown.

APPENDIX
FEDERAL BUDGET DEVELOPMENTS
President Bush has submitted his FY1991 budget to the Congress,
with proposals that satisfy the Gramm-Rudman-Hollings requirements. The
budget projections hinge on assumptions of fairly robust economic growth
and falling interest rates, which cause the baseline deficit to fall
year by year. In contrast, the Congressional Budget Office (CBO) has
released estimates, based on less favorable economic assumptions, that
show the baseline deficit remaining in the neighborhood of $140 billion
through 1993.
Near-term Budget Developments and Prospects
This week's news contained much information about the prospects
for the budget in the near term, including updated estimates for FY1990.
As shown in table 1, the Administration now projects an FY1990 deficit
of $124 billion, compared with a figure of $99 billion in the July Mid-
Session Review. Outlays were revised up nearly $20 billion, largely
because of legislation passed since midsummer. Most notably, FIRREA
contributed to an $8 billion upward revision in expenditures for deposit
insurance, which now are expected to total $11 billion in FY1990.
Spending on defense also was revised up. Changes to revenues were
smaller, on net, as a sharp reduction in projected taxes in response to
weak incoming data on corporate profits and tax payments was partially
offset by technical reestimates of other revenues. CBO, however,
estimates the FY1990 deficit at $138 billion.
Table 1
ESTIMATES OF TOTAL BUDGET(Billions of dollars)
AdministrationMid-Session CBO
Review Baseline Proposed Baseline
--------------------FY1990------------------
Total deficit 99 124 124 138
Receipts 1080 1073 1074 1067
Outlays 1179 1197 1197 1205
--------------------FY1991------------------
Total deficit 85 102 63 138
Receipts 1152 1156 1170 1137
Outlays 1237 1259 1233 1275
1. Includes extension of food stamp program, which is scheduled to
expire in 1991, and adjustments for other accounting anomalies.

The gap between the Administration and CBO baseline estimateswidens in FY1991. These estimates assume that budget authority fordiscretionary programs is held constant in real terms at FY1990 levelsand that benefit programs and taxes evolve according to current laws.In effect, they determine how much outlays will have to be cut, orrevenues raised, to reduce the deficit to the Gramm-Rudman FY1991 targetof $64 billion. According to the Administration, the baseline deficitwill decline to $102 billion next year; this level requires deficit-reducing actions of at least $38 billion to meet the Gramm-Rudmantarget. CBO's baseline deficit, $138 billion, is unchanged from 1990.According to CBO's numbers, however, the package of cuts would have tobe roughly twice as large as that of the Administration.
The Administration's projection of a sizable decline in thebaseline deficit next year hinges largely on its favorable expectationsfor economic performance in 1990 and 1991--that is, it forecasts robustgrowth, stable inflation, declining interest rates, and booming profits(table 2). Notably, OMB anticipates an increase in real GNP of 2-1/2percent for 1990 and 3-1/4 percent for 1991. CBO's assessment is lessoptimistic: It expects real GNP to advance less than 2 percent in 1990
and about 2-1/2 percent in 1991, though, like OMB, CBO sees prices
continuing to rise about 4 percent per year. The interest rateforecasts of the two agencies are similar for 1990, but OMB sees rates
dropping about a percentage point in 1991.
Longer-run Budget Prospects: The CBO Baseline
As shown in table 3, CBO expects deficits to remain sizableover the next several years but to decline somewhat as a share of GNP--
from 2-1/2 percent in 1990 to 1-1/2 percent in 1995. With no realgrowth in discretionary spending, outlays fall from about 22 percent ofGNP this year to less than 21 percent in the mid-1990s, while therevenue share drops only a little. The CBO projection is based on realGNP growth of about 2-1/2 percent per year through 1995, with inflation
remaining at roughly 4 percent. Interest rates, however, are projectedto decline--especially short-term rates, which fall to about 5-3/4percent in 1995.

Table 2
ADMINISTRATION AND CBO ECONOMIC ASSUMPTIONS
Forecast1990 1991
Projected1992 1993 1994 1995
----- Percent change, calendar year average-----
Real GNPAdministrationCBO
GNP deflatorAdministrationCBO
CPI 1
AdministrationCBO
--------- Percent, calendar year average--------
Unemployment rateAdministrationCBO
Three-month TreasuryAdministrationCBO
bill rate6.76.9
Ten-year Treasury note rateAdministration 7.7CBO 7.8
Corporate profits as apercent of GNPAdministration 6.4CBO 5.6
1. Administration forecasts the CPI-W; CBO forecasts the CPI-U.

Table 3
CBO BASELINE BUDGET PROJECTIONS(Fiscal years)
1990 1991 1992 1993 1994 1995
------------- Billions of dollars-----------
Total deficit 138 138 135 141 130 118
Revenues 1067 1137 1204 1277 1355 1438
Outlays 1205 1275 1339 1418 1484 1555
Gramm-Rudmandeficit targets 100 64 28 0
------------ As a percentage of GNP---------
Total deficit 2.5 2.4 2.2 2.1 1.8 1.6
Revenues 19.6 19.6 19.5 19.4 19.3 19.3
Outlays 22.1 22.0 21.7 21.5 21.2 20.8
The Administration Budget Proposals
President Bush's proposals are consistent, at this stage, with
the requirements of the Gramm-Rudman law. Given the underlying economic
and technical assumptions, his program meets the deficit target of
$64 billion in FY1991 and achieves balance by FY1993. President Bush
proposes a modest reduction--relative to the baseline--in defense
spending and some reallocation of resources among nondefense programs
over the next few years. He also continues to press for a cut in
capital gains taxes and proposes a new incentive to spur personal
saving.
Proposals for FY1991. The Administration is proposing deficit-
reducing actions totaling $39 billion for FY1991 (see table 4). Outlays
1. Under the Administration plan, households filing joint tax returns
and earning less than $120,000 would be allowed to contribute $5000 per
year to a Family Savings Account (FSA); single filers with incomes below
$60,000 could put in $2500. Contributions would not be deductible, but
earnings on accounts held for more than seven years would be tax-exempt.
Because there is no upfront deduction for the contributions, the
estimated revenue loss to the Treasury in early years is small--reaching
only $1 billion by 1995. Allowable investment vehicles would be the
same as for current IRAs. Contribution limits on IRAs, 401Ks, and
Keoghs would not change under this proposal, but the Administration
would like to waive the penalty for early withdrawals of up to $10,000
from IRAs, if the withdrawn funds are used for first-time home
purchases.

A-5
are to be lowered $25 billion relative to baseline, with the largestreductions slated for medicare ($6 billion), defense ($3 billion), andagriculture ($3 billion). Proposed changes in miscellaneous user fees--which are scored in the budget as offsets to outlays--amount to $6billion.
Table 4
COMPOSITION OF ADMINISTRATION BUDGET PROPOSALS1
(Change from baseline in billions of dollars, fiscal years)
1991 1992 1993
Outlays -25 -37 -53Defense -3 -9 -17Medicare -6 -8 -11Agriculture -3 -5 -6User fees -6 -4 -5Other -7 -11 -14
Receipts 14 11 4Capital gains 5 3 1Social security 4 4 4Excise taxes 3 4 5Other 2 0 -6
Deficit -39 -48 -57
1. Excluding payments to the SSIDRF.2. Extension of OASDI coverage to additional state and
local employees and HI coverage to all workers in the sector.
The budget also calls for $14 billion in new revenues inFY1991. About $5 billion is projected to come from a revamped proposalto cut the effective tax rate on capital gains; this proposal wouldallow an exclusion from gross income of 30 percent of the realized gainson certain assets held more than three years, with smaller exclusionsfor assets held for shorter periods. According to the Administration,enactment of this provision would result in an increase in realizationslarge enough to add $5 billion, on net, to FY1991 receipts. The longer-run relationship between capital gains rates and tax collections, ofcourse, is uncertain; but the Administration projects small revenuegains at least through 1995.
Much of the remaining FY1991 revenue would come from bringing
additional state and local employees under the social security system(OASDI) and extending medicare coverage (HI) to all workers in thatsector. Similar proposals have been rejected by the Congress in thepast. The Administration is also requesting about $3 billion of hikes

in excise taxes, including the extension of the telephone excise tax,which currently is scheduled to expire at the end of 1990.
The longer-run outlook. In contrast to CBO, the Administrationexpects the deficit to disappear by the mid-1990s--whether measured on abaseline or on a policy basis. However, the $9 billion surplus shown intable 5 for the proposed budget in FY1995 unde-states the federalgovernment's total contribution to national saving by $102 billionbecause it includes an outlay of that amount to a new off-budget fund,the Social Security Integrity and Debt Reduction Fund (SSIDRF) which isdesigned to protect the assets in the social security trust funds.Excluding payments to the SSIDRF, the budget is projected to run asurplus of $111 billion in FY1995.
Table 5
ADMINISTRATION BUDGET PROJECTIONS(Fiscal years, billions of dollars)
1990 1991 1992 1993 1994 1995
Baseline deficit(-) -124 -102 -73 -38 -10 17Receipts 1073 1156 1235 1324 1402 1481Outlays 1197 1259 1308 1361 1412 1463
Proposed deficit(-) -124 -63 -25 6 11 9Receipts 1074 1170 1246 1328 1409 1486Outlays 1197 1233 1271 1322 1398 1477
Memo:Payments to SSIDRF 0 0 0 14 54 102Deficit excl. payments -124 -63 -25 20 64 111
to SSIDRF(-)
The Administration projections assume that real GNP willcontinue to grow about 3 percent per year and that inflation willdecline to about 3 percent by 1995. OMB assumes a somewhat steeper fallin nominal interest rates than does CBO; but the two projections do notshow much difference in the levels of real rates by the mid-1990s.
Prospects for defense spending. One reason for the projectedimprovement in the deficit path over this period is the lack of furthergrowth in real defense spending. In real terms, defense appropriationshave already declined 13 percent from their 1985 peak. And if they are
held constant in real terms over the next five years at FY1990 levels--the baseline assumption--nominal outlays will fall from about 5-1/2
2. See page II-A-7 for a detailed description of the proposed fund.

percent of GNP in FY1990 to about 4-1/2 percent in FY1995; by contrast,the share averaged 6-1/2 percent between FY1985 and FY1987. The Bushprogram incorporates small across-the-board reductions in defenseappropriations, which would shave another 1/2 percentage point off thedefense share of GNP by FY1995; in real terms, defense outlays woulddecline about 2 percent a year. The proposed cuts are much smaller thanthose reportedly under consideration a few months ago; ndeed, PresidentBush this week announced that he is prepared to negotiate with theSoviet Union about further troop reductions. For comparison, the$180 billion package discussed a few months ago was widely interpretedas consistent with declines in real defense spending of about 4 percentper year.
Prospects for nondefense spending. The Bush program containssizable reductions in nondefense spending (excluding payments to theSSIDRF) over the next five years. But the broad thrust of such spendingshows little change. Outlays on human resources programs (for example,social security, health, and education) will continue at about 11percent of GNP. Spending in other areas is expected to rise much lessrapidly than nominal GNP over the next five years, but this expectationlargely reflects an anticipated decline in net interest outlays. Amongthe major programs, the growth in medicare is shaved under the Bushproposals, with nominal outlays cut $15 billion below baseline byFY1995, primarily through cuts in reimbursement rates to hospitals anddoctors. The budget also builds in large savings in agriculture butdoes not specify how these will be achieved. Changes elsewhere arerelatively small; funding is increased relative to baselines for a fewprograms such as NASA and Head Start, but the increases are more thanoffset by reductions elsewhere.
The Social Security Integrity and Debt Reduction Fund (SSIDRF).The Administration has proposed a mechanism that it believes will helpto move the overall budget into surplus after the early 1990s. The planis complicated. First, it would require the government to make annualpayments from the general fund into a new off-budget fund--the SSIDRF.After a brief phase-in period, the payments would be equal to theprojected annual surplus in the social security trust funds. Thus,the SSIDRF would effectively neutralize the influence of the buildup inthe social security trust funds on the official budget statistics;however, in the absence of other changes in outlays and revenues, it
would do nothing to reduce government demands on credit markets.
3. Payments to the SSIDRF between 1993 and 1999 would be based on theannual balances (net inflows) in the OASDI trust funds, as projected in1989 by the Board of Trustees of the Social Security System underintermediate (II-B) economic and demographic assumptions. Paymentswould increase from 15 percent of the projected balance ($14 billion) inFY1993 to 85 percent ($102 billion) in FY1995; beginning in 1996, theywould equal the projected OASDI surplus.

FEDERAL OUTLAYS *(As a percent of GNP)
National Defense
- 8
- Baseline
Administration policyAdministration policy .
1983 1986 1989 1992
Human Resources S13- 12
Baseline
Administratio pol-------- cy
Administratio. policy
---I 10
[.. ___r. I I I II I I I I I I I
Other (excluding Net Interest Outlays)
- 4
-1 3
- - Baseline 2
Administration policy
- I I I I I I I I I I I I1 I I I -19921980 1983 1986 1989
Source: OMB, Budget of the U.S. Government, FY 1991, January 190.
* Outlays exclude payments to the Social Security Integrity and Debt Reduction Fund.
I I I I I I I I I I I I I I I I

A-9
Second, the proposal extends the Gramm-Rudman framework beyond1993, with a target of zero in the official deficit in each year.Noting that this measure of the deficit would include payments to theSSIDRF, the proposal, in effect, requires that the non-social securitypart of the budget--as conventionally defined--be brought close tobalance by the mid-1990s. Relative to the Administration baseline,balancing the budget as defined under this proposal would requiresizable spending cuts and revenue increases. In FY1995, for example,such actions would need to total roughly $100 billion. Relative toCBO's baseline, achieving balance would require even greater cuts--morethan $200 billion, equivalent to roughly 3 percent of that year'sprojected GNP.