Embed Size (px)
Citation preview
Prefatory Note
The attached document represents the most complete and accurate version available based on original copies culled from the files of the FOMC Secretariat at the Board of Governors of the Federal Reserve System. This electronic document was created through a comprehensive digitization process which included identifying the best-preserved paper copies, scanning those copies,1 and then making the scanned versions text-searchable.2 Though a stringent quality assurance process was employed, some imperfections may remain.
Please note that this document may contain occasional gaps in the text. These gaps are the result of a redaction process that removed information obtained on a confidential basis. All redacted passages are exempt from disclosure under applicable provisions of the Freedom of Information Act.
1 In some cases, original copies needed to be photocopied before being scanned into electronic format. All scanned images were deskewed (to remove the effects of printer- and scanner-introduced tilting) and lightly cleaned (to remove dark spots caused by staple holes, hole punches, and other blemishes caused after initial printing). 2 A two-step process was used. An advanced optimal character recognition computer program (OCR) first created electronic text from the document image. Where the OCR results were inconclusive, staff checked and corrected the text as necessary. Please note that the numbers and text in charts and tables were not reliably recognized by the OCR process and were not checked or corrected by staff.
Strictly Confidential (FR) Class II FOMC
January 31, 1990
SUMMARY AND OUTLOOK
Prepared for the Federal Open Market Committee
By the staff of the Board of Governors of the Federal Reserve System
DOMESTIC NONFINANCIAL DEVELOPMENTS
Recent Developments
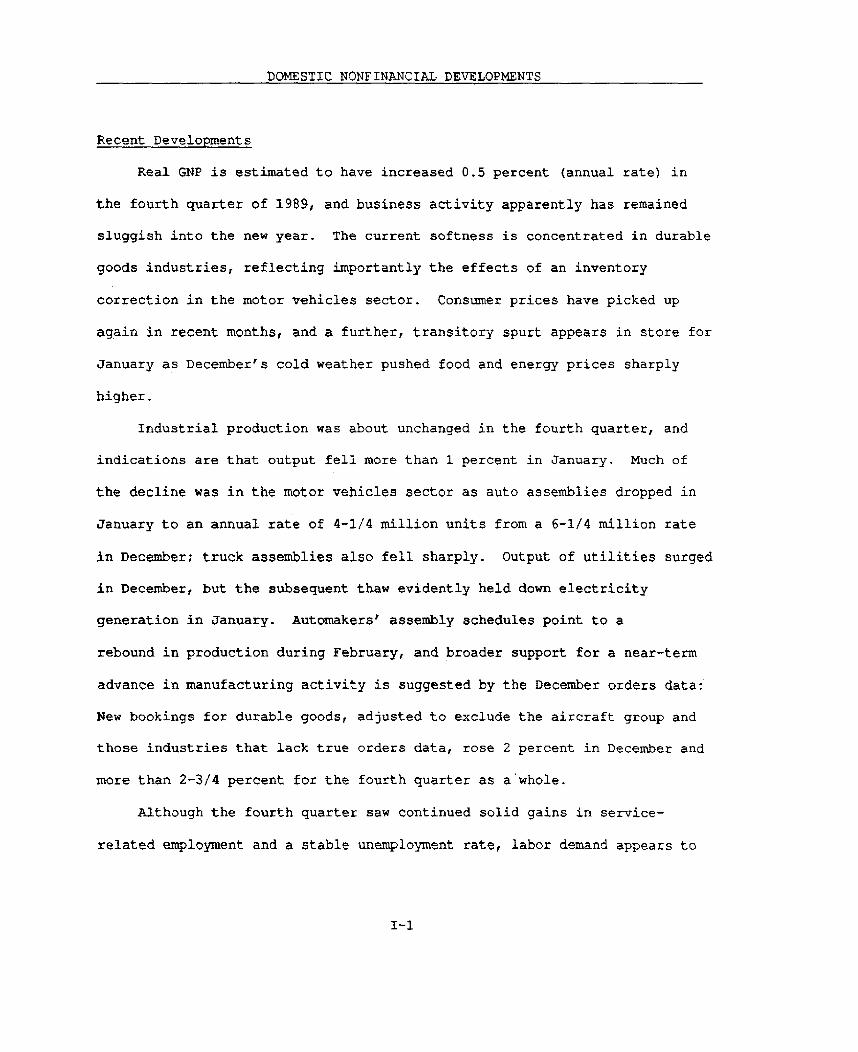
Real GNP is estimated to have increased 0.5 percent (annual rate) in
the fourth quarter of 1989, and business activity apparently has remained
sluggish into the new year. The current softness is concentrated in durable
goods industries, reflecting importantly the effects of an inventory
correction in the motor vehicles sector. Consumer prices have picked up
again in recent months, and a further, transitory spurt appears in store for
January as December's cold weather pushed food and energy prices sharply
higher.
Industrial production was about unchanged in the fourth quarter, and
indications are that output fell more than 1 percent in January. Much of
the decline was in the motor vehicles sector as auto assemblies dropped in
January to an annual rate of 4-1/4 million units from a 6-1/4 million rate
in December; truck assemblies also fell sharply. Output of utilities surged
in December, but the subsequent thaw evidently held down electricity
generation in January. Automakers' assembly schedules point to a
rebound in production during February, and broader support for a near-term
advance in manufacturing activity is suggested by the December orders data:
New bookings for durable goods, adjusted to exclude the aircraft group and
those industries that lack true orders data, rose 2 percent in December and
more than 2-3/4 percent for the fourth quarter as a whole.
Although the fourth quarter saw continued solid gains in service-
related employment and a stable unemployment rate, labor demand appears to

I-2
have weakened of late. Both initial claims for unemployment insurance and
the number of workers receiving unemployment insurance benefits--although
volatile from week to week--climbed higher on average through mid-January.
Private surveys also suggest falling factory employment in January. The big
three automakers put more than 100,000 U.S. workers on layoff in early
January; most workers reportedly have been recalled, but some are scheduled
to be off work through early February.
Real personal consumption expenditures were unchanged in the fourth
quarter, reflecting reduced sales of cars and light trucks. Excluding motor
vehicles, real consumer outlays rose at a 2.7 percent annual rate in the
fourth quarter; much of the rise is attributable to higher spending on
services. Despite heavy discounting during the holiday season, purchases
of consumer goods other than autos were flat in December. Inventory-sales
ratios already were relatively high for many retailers, and additional
price, production, or import adjustments still may be needed to reduce
stocks to more comfortable levels. In an effort to clear out the overhang
of stocks on dealer lots, automakers enhanced their incentive programs in
late December, and sales have picked up considerably since then--averaging
around 7-1/2 million units (annual rate) compared with a 6 million unit
average pace during October and November.
Total housing starts fell 7-1/2 percent in December to 1.24 million
units at an annual rate. Virtually all of the drop was in the single-family
sector, and it seems to have been a result of a delay in starts caused by
1. Energy services--primarily electricity and natural gas--posted a verylarge increase in December as a result of the severe cold weather, providinga considerable boost to overall spending on services in the fourth quarter.In contrast, January was unusually warm, and outlays for energy serviceslikely fell sharply.

I-3
the unusually cold weather. Issuance of building permits for single-family
houses, which are less affected by weather, was down only slightly in
December. Multifamily starts remained at a low level last month; vacancy
rates for multifamily units rose in the fourth quarter, underscoring the
weak incentives for new construction.
Real outlays for business equipment--excluding purchases of motor
vehicles and aircraft--rose at an 8.3 percent annual rate in the fourth
quarter. The strength reflected sizable increases in spending on computers
and communications equipment and moderate gains for a wide variety of heavy
machinery. Looking ahead, new orders for nondefense capital goods
(excluding aircraft) continued to expand during the fourth quarter, pointing
the way for some increase in equipment investment at least through the early
months of 1990. Real outlays for nonresidential structures changed little
in the fourth quarter, and indicators of future investment--for example,
vacancy rates for office space as well as building permits and construction
contracts for all types of buildings--remain negative.
The consumer price index increased 0.4 percent in December, the same as
in November. Retail food prices were up 0.5 percent in December, but
wholesale prices for fresh produce rose sharply in early January because of
the cold weather, and the near term probably will see sizable increases at
retail. The CPI excluding food and energy also was up 0.4 percent in
December; discounting for apparel and household furnishings was more than
offset by a sharp increase in the index for new cars and another month of
sizable increases for nonenergy services. For 1989 as a whole, the CPI
excluding food and energy rose 4.4 percent--a bit less than in 1988. The
slowing was concentrated among consumer goods other than food and energy,

I-4
and probably reflected the effect of declining prices of non-oil imports for
most of the year.
The employment cost index for compensation of private industry workers,
the most representative measure of economy-wide labor costs of production,
rose 4.8 percent in 1989, virtually the same as in 1988. Reflecting trends
in the composition of labor demand, increases for workers in service-
producing industries continued to outpace the gains recorded in the goods-
producing sector.
Outlook
The basic story in the staff forecast can be outlined briefly. Growth
of the economy currently is being constrained by a variety of factors: an
inventory correction in the motor vehicles industry and probably in some
other areas; the still high level of real interest rates; financial
disruptions that have led to more cautious lending; the lagged effects of
the rise in the foreign exchange value of the dollar through mid-1989 on the
competitive position of U.S. manufacturers; and the contraction in real
defense spending. The staff anticipates that the production adjustments
needed to eliminate the current stock overhangs will be largely completed by
the spring, and an improvement in net exports is expected to emerge by late
this year as a result of the dollar's recent decline and an assumed further
moderate depreciation. Real GNP accelerates somewhat in 1991, but growth
remains below potential.
The staff forecast continues to be conditioned on the FOMC's goal of
reducing inflation over time. Achievement of that goal is likely to require
some easing of pressures on resources, and to keep domestic demand
sufficiently in check, the staff projects that real interest rates will have

I-5
to be maintained at relatively high levels. No major changes in nominal
interest rates are expected over the projection period; rates may average
somewhat higher in 1991 than in 1990, however, as the pace of activity
accelerates. For the monetary aggregates, M2 is anticipated to grow in the
upper portion of its tentative range this year, boosted by the lagged
response to interest rate declines in the second half of 1989; given the
projected path of interest rates, M2 growth should slow in 1991. M3 is
expected to expand in the lower portion of its tentative range in 1990 as
the funding needs of thrifts decline further, reflecting continued runoffs
of their assets; slow growth also is in prospect for 1991.
Fiscal policy is assumed to be moderately restrictive during the next
two years. The staff's FY1991 budget assumption incorporates $30 billion in
expenditure cuts and revenue increases, compared with $39 billion proposed
by the President. Given the staff's economic projection, the actual deficit
is projected to be $118. billion in fiscal year 1991, only a little larger
than CBO's (after adjusting for policy differences), but well above the $63
billion figure shown in the President's budget and the $64 billion Gramm-
Rudman target. 2 The difference between the deficit projections of the
staff and the Administration reflects, in large measure, the more favorable
economic assumptions underlying the Administration's budget estimates. 3
2. The Gramm-Rudman law allows for the possibility of a temporarysuspension of the provisions in the event that the Commerce Departmentreports real GNP growth of less than 1 percent (annual rate) for twoconsecutive quarters. A joint congressional resolution is required.3. BEA's translation of the Administration budget shows an NIPA deficit of
$118 billion in FY1990, compared with the staff's $147 billion estimate, and$48 billion in FY1991, compared with the staff's $116 billion estimate. Thegap between the staff and Administration deficits is larger on an NIPA thanon a unified basis, in part because of differences in accounting procedures.Notably, the Administration's forecast of corporate profits is much stronger(Footnote continued on next page.)

I-6
SUMMARY OF STAFF PROJECTION(Percent change, Q4 to Q4)
1989 1990 1991
Real GNP 2.4 1.6 2.3Gross domestic purchases 2.1 1.1 1.5
CPI 4.5 4.4 4.5CPI excluding food and energy 4.3 4.6 4.7
Unemployment rate (fourth quarter) 5.3 5.9 6.1
1. Real GNP excluding net exports.
Real GNP is projected to increase at an annual rate of just 3/4 percent
in the first quarter. Growth is expected to be restrained by a considerable
slump in manufacturing activity. Most notably, for the first quarter as a
whole, output of motor vehicles is expected to be off 13 percent (not at an
annual rate) from the fourth-quarter pace, even though assemblies of autos
and light trucks are likely to recover from the extraordinarily low rate in
January. The decline in motor vehicle production, which will manifest
itself on the expenditure side of the national income accounts as a drop in
inventory investment, is projected to reduce directly the annualized growth
rate of real GNP about 1-1/4 percentage points. In addition, production of
other goods is likely to be damped as businesses attempt to reduce
inventory-sales ratios.
While inventory corrections should be largely completed by the spring,
final sales are projected to grow at a relatively slow pace through the end
(Footnote is continued from previous page.)than the staff's. These profits feed more rapidly into receipts whenmeasured on an NIPA basis than on a unified basis, because the NIPA measuresprofits taxes on an accrual basis, while profits taxes are not recorded inthe unified budget until received by the Treasury.4. Some of the inventory correction also will affect foreign producers
that export goods to the United States. This is reflected in the projectionas a drop in real non-oil imports in the first quarter.

I-7
of 1990. Slow gains in employment should restrain real disposable personal
income and thus damp the growth of consumer spending. Housing starts in the
first quarter are likely to benefit from a make-up of starts that were
delayed in December. However, developments in the housing finance market
are likely to damp future activity: Mortgage rates moved up during the past
month, and some thrifts reportedly have cut back acquisition, development,
and construction lending as a result of FIRREA-mandated capital requirements
and loan limits. In addition, business outlays for nonresidential
structures are likely to decline, reflecting the persistent overhang of
vacant office space on the market and tightened credit availability, while
investment in new equipment is expected to be discouraged by a widening
margin of unused capacity and weak cash flow.
As noted above, the external sector is projected to begin to provide a
key source of impetus to domestic output toward the end of this year.
Growth of real exports accelerates noticeably during 1991, making a direct
contribution to GNP and providing an indirect boost through "multiplier"
effects. Even with that boost, though, growth in domestic spending is
projected to pick up only fractionally next year, rising 1-1/2 percent.
Consumer spending remains sluggish, and, in light of the anticipated
firmness of interest rates, housing activity is expected to remain flat.
Spurred by the pickup in overall final sales, business purchases of
equipment should strengthen moderately, but the overhang of properties is
likely to keep construction of nonresidential structures on a downward
course. In the state and local government sector, budgetary problems in a
number of areas are expected to restrain the growth of real purchases; in
addition, many units are projected to raise indirect business taxes in order

I-8
to fill in revenue shortfalls. On balance, real GNP is projected to
increase 2-1/4 percent over the four quarters of 1991.
With real GNP growth expected to fall short of its potential rate,
which the staff puts at between 2-1/2 and 2-3/4 percent per year, the
civilian unemployment rate is projected to rise over the projection period
to a little more than 6 percent. It is anticipated that greater slack in
the labor market will tend to damp compensation increases. However,
compensation will be boosted in the first and second quarters of 1990 and
1991 by higher social security taxes and hikes in the federal minimum wage.
In the second half of 1991, the rise in ECI compensation slows to about 4-
1/4 percent, roughly 1/2 percentage point below the pace of 1989. At the
same time, productivity gains are projected to pick up in 1991, returning to
the longer-run trend rate of increase, and growth of unit labor costs slows
markedly.
EMPLOYMENT COST INDEX FOR COMPENSATION OF PRIVATE INDUSTRY WORKERS(Percent change, seasonally adjusted)
1990 19911988 1989 H1 H2 H1 H2
ECI 4.9 4.8 5.4 4.6 4.9 4.3ECI - excluding
social security andminimum wage effects 4.6 4.7 4.7 4.6 4.4 4.3
Despite some diminution in underlying labor cost pressures, the
inflation rate shows little change over the next two years. In the first
quarter, inflation is likely to be boosted appreciably by the steep runup in
food and energy prices around the turn of the year. The bulk of these
5. Projected increases in indirect business taxes add about 0.1 percentagepoint to CPI inflation in both 1990 and 1991.

I-9
increases is expected to be reversed subsequently, though, and for the year
as a whole inflation in these markets is projected to be at or below that
for other consumer goods and services. As 1990 progresses, prices of non-
oil imports are projected to rise relati e to those of domestically produced
goods in response to the depreciation of the dollar, and over the projection
period this pickup offsets the influence on overall inflation stemming from
the slowing of unit labor costs. The GNP fixed-weight price index is
projected to rise about 4-1/4 percent in 1990 and 1991, while the CPI,
is more heavily influenced by import prices, is expected to rise about
percent this year and in 1991.
which
4-1/2

I-10
January 31, 1990CONFIDENTIAL - FR
CLASS II FOMC STAFF GNP PROJECTIONS
Percent changes, annual rate
GMP fixed-weight Consumer UnMploymentNominal GNP Real GNP price index Price Index <1> rate
(percent)
12/13/89 1/31/90 12/13/89 1/31/90 12/13/99 1/31/90 12/13/89 1/31/90 12/13/89 1/31/90. . . . . . . . . . . . . . . . . . . . . . . . . . . . . . . . . . . . . . . . . . . . . . . . . . . . . . . . . . . . . .. . . . . . . . . . . . . . . .. . . . . .- - . . . . . . . . . . . . . . . . . . . . . . . . . . . . .. . . . . . . . .
Annual changes:
1987 <2> 6.1988 <2> 7.1989 <2> 7..1990 5.1991 6.
Quarterly changes:
1988 01 <2> 6.02 <2> 8.Q3 <2> 7.04 <2> 7.
1989 01 <2>02 <2>03 <2>04 <2>
1990 01Q203
04
1991 01020314
Two-quarter changes: <3>
1988 02 <2> 7.504 <2> 7.5
1989 Q2 <2> 7.5Q4 <2> 5.3
1990 02 5.804 5.7
1991 02 6.3Q4 6.2
our-quarter changes: <4>
1987 Q4 <2> 8.6
1988 04 <2> 7.5
1989 04 <2> 6.41990 Q4 5.71991 04 6.3
4.2 4.24.8 4.8
7.5 3.15.3 1.7
5.7 1.75.7 1.6
6.6 2.06.4 2.3
5.7 5.75,5 5.55.5 5.55.3 5.3
5.2 5.25.3 5.35.2 5.3
5.4 5.3
5.6 5.55.8 5.65.9 5.8
6.0 5.9
6.1 6.06.1 6.06.2 6.16.2 6.1
-. 4 -. 3-. 2 -. 2
.0 .0
.1 .0
.4 .3
.2 .3
.1 .1
.1 .1
1> For all urban consiOur.2> Actual.
<3> Prcent change from two quarters earlier.<4> Percent change from four quarters earlier.

I-11
January 31, 1990CONFIDENTIAL - FR GROSS NATIONAL PRODUCT AND RELATED ITEMSCLASS II FOMC (Seasonally adjusted; annual rate)
I Projection----- - ---------
I Units 1983 1984 1985 1986 1987 1988 1989 1990 1991
EXPENDITURES
Nominal GNP Billions of $ 3405.7 3772.2 4014.9 4231.6 4524.3 4880.6 5233.2 5525.5 5872.3Real GNP Billions of 82$1 3279.1 3501.4 3618.7 3717.9 3853.7 4024.4 4142.6 4208.0 4295.5
Real GNP IPercent change*l 6.5 5.1 3.6 1.9 5.4 3.4 2.4 1,6 2.3Gross domestic purchases I I .4 6.4 4.3 2.1 4.6 2.4 2.1 1.1 1.5
Final sales 3,7 4.7 4.6 2.7 3.3 4.4 2.1 2.2 2.1Private dom. final purchases I 7.7 5.6 4.6 2.9 2.7 3.8 2.1 1.8 1.5
Personal consumption expend. 5.4 4.1 4.6 3.8 2.2 3.8 2.3 2.0 1.6Durables 1 14.7 10.8 7.0 11.5 -2.0 8,0 .3 2.6 1.5Nondurables 4.4 2.3 3.3 2.9 1.1 2.1 .6 1.1 .9Services 3.9 3.5 5.0 2.1 4.4 3.6 4.3 2.3 2.2
Business fixed investment I 10.8 13.8 3.7 -5.5 8.5 4.2 4.3 1.3 1.8Producers' durable equipment I 1 20,9 14.9 4.6 .4 11.1 7.0 5.9 3.1 3.9Nonresidential structures I 1 -4.8 11.8 1.9 -17.7 1.9 -3.4 -.5 -4.5 -5.3
Residential structures I 38.1 6.1 5.8 11.6 -4.2 3.2 -6.1 1.2 -1.2
Exports 5.8 5.9 -2.4 10.6 19.1 13.9 8.9 7.4 9.3Imports 23.8 17.4 4.5 10.0 9.6 5.3 5.9 3.4 4.1
Government purchases -2.7 7.9 8.6 3.1 2.1 1.8 .2 .8 .5Federal -8.1 13.0 13.3 .5 .7 -.3 -3.0 -.6 -1.4
Defense 5.1 6.5 7.1 6.0 4.3 -1.9 -2.6 -4.2 -3.0State and local I 1.5 4.4 4.9 5.2 3.1 3.4 2.5 1.8 1,8
Change in business inventories |Billions of 82$1 -6.4 62.3 9.1 5.6 23.7 27.9 24.5 2.7 17.7Nonfarm IBillions of 82$1 -.1 57.8 13.4 8.0 25.8 30.7 21.0 4.1 17.3
Net exports (Billions of 82S6 -19.9 -84.0 -104.3 -129.7 -115.7 -74.9 -56.3 -42.3 -21.7
Nominal GNP Percent change* 10.4 8.6 6.6 4,6 8.6 7.5 6.4 5.7 6.5
EMPLOYMENT AND PRODUCTION------------ ,----.----
Nonfarm payroll employment IMillions 90.2 94.5 97.5 99.5 102.2 105.6 108.6 110.3 111.5Unemployment rate IPercent 9.6 7.5 7.2 7.0 6.2 5.5 5.3 5.7 6.1
IIndustrial production index (Percent change*
t 14.3 6.6 1.7 1.0 5.8 5.0 1.7 1.4 3.0
Capacity utilization rate-afg. (Percent 73.9 80.5 80.1 79.7 81.1 83.5 84.0 81.9 81.41 I
Housing starts IMillions 1 1.70 1.75 1.74 1.81 1.62 1.49 1.37 1.34 1.33Auto sales (Millions 9.19 10.35 11.04 11.46 10.24 10.65 9.89 9.53 9.50
Domestic IMillions 6.82 7.92 8.22 8.22 7.06 7.55 7.06 6.90 6.95Foreign (Millions 2.37 2.43 2.82 3.23 3.18 3.10 2.83 2.63 2.55
INCOME AND SAVING----- -„-- -_-- ----
Nominal personal income JPercent change*l 7.8 8.4 6.6 5.8 8.6 7.1 8.5 6.1 6.3Real disposable income (Percent change*l 5.1 4.3 2.7 3.3 3.0 4.0 3.6 1.2 1.4Personal saving rate IPercent I 5.4 6.1 4.4 4.1 3.2 4.2 5.5 5.3 5.1
I ICorp. profits with IVA & CCAdj (Percent change*| 70.1 7.4 9.2 -5.6 12.0 10.4 -19.7 -.6 5.9
Profit share of GNP IPercent 6.3 7.1 7.0 6.7 6.6 6.7 5.7 4.9 4.8
Federal govt. surplus/deficit IBilllons of S I -176.0 -169.6 -196.9 -206.9 -161.4 -145.8 -149.9 -136.7 -109.0State and local govt. surplus 47.5 64.6 65.1 62.8 51.3 49.7 45.0 45.3 62.1Exc. social insurance funds 4.4 19.8 13.8 5.6 -12.4 -21,4 -33.0 -38.9 -28.1
PRICES AND COSTS---------------- I IGNP implicit deflator Percent change*l 3.6 3.4 2.9 2.6 3.0 4.0 3.8 4.1 4.1GNP fixed-weight price index 1 1 3.9 3.7 3.3 2.6 4.0 4.5 4.1 4.2 4,3Cons. & fixed invest, prices I 3.3 3.3 3.4 2.5 4.7 4.2 4.3 4.3 4.4
CPI 3.2 4.2 3.5 1.3 4.4 4.3 4.5 4.4 4.5Exc. food and energy 4.2 5.0 4.3 3.9 4.2 4.6 4.3 4.6 4.7
ECI hourly compensation 5.7 4.9 3.9 3.2 3.3 4.9 4.8 5.0 4.5
Nonfarm business sectorOutput per hour 3.4 1.5 1.6 1.3 2.4 1.6 .6 .7 1.5Compensation per hour 1 3.1 4.2 4.6 5.0 4.0 4.8 5.7 5.6 5.2Unit labor osts I -.4 2.6 3.0 3.6 1.5 3.1 5.1 4.9 3.7
* Percent changes are from fourth quarter to fourth quarter.

I-12
CONFIDENTIAL - FRCLASS II FOMC
GROSS NATIONAL PRODUCT AND RELATED ITEMS
(Seasonally adjusted; annual rate)
January 31, 1990
Project ion
I 1989 1990 1991I - - - - - - - - - - - - - - - - - - - - - --- - - - - - - - - - - - - -
Units 3 Q4 01 Q2 Q3 Q4 Q1 02 03 04
EXPENDITURES------------ I
N-ainal GNP IBillions of $ 5281.0 5337.0 5404.8 5488.2 5566.3 5642.8 5736.3 5825.6 5917.0 6010.3
Real GNP IBillions of 8251 4162.9 4168.1 4175.2 4202.0 4218.4 4236.4 4258.2 4282.1 4307.4 4334.3
Real GNP 3.0 * .5 .7 2.6 1.6 1.7 2.1 2.3 2.4 2.5
Gross domestic purchases I 3.5 .9 -1.5 3.2 1.6 1.2 1.6 1.4 1.6 1.6
Final sales 2.7 -. 5 4.8 1.5 .9 1.5 1.6 2.1 2.2 2.4
Private don. final purchases I 4.7 -.4 2.6 2.3 1.3 1.1 1.3 1.5 1.6 1.7
Personal consumption expend. 5.6 -.1 2.2 2.7 1.5 1.5 1.6 1.6 1.7 1.7
Durables 11.3 -12.9 7.0 3.2 -. 4 .9 1.5 1.3 1.5 1.7
Nondurables I 5.0 -1.4 .8 1.8 .9 .9 .8 .9 .9 1.0
Services 4.3 5.3 1.6 3.1 2.6 2.0 2.1 2.2 2.2 2.2
Business fired investment I1 5.2 -3.0 4.1 1.3 .1 -.2 .9 1.9 2.2 2.4
Producers' durable equipment 4.6 -4.3 5.9 3.0 1.8 1.6 2.8 4.0 4.3 4.4
Nonresidential structures 8.0 1.3 -2.1 -4.2 -5.5 -6.1 -5.7 -5.3 -5.2 -5.0Residential structures -9.2 2.6 4.8 .3 .2 -. 4 -2.1 -1.9 -. 6 -. 2
Exports 3.9 4.9 13.6 2.1 5.7 8.6 7.3 9.5 9.7 10.6Imports 7.4 7.5 -2.0 5.8 5.5 4.4 3.9 3.8 4.3 4.2
Government purchases I -2.4 1.3 2.2 1.3 -. 5 .4 .7 .4 .5 .3Federal -8.4 -2.9 2.7 .4 -3.5 -1.6 -.9 -1.7 -1.5 -1.6
Defense 6.9 -8.0 -4.9 -5.1 -3.8 -3.1 -3.2 -3.1 -3.0 -2.8State and local 2.2 4.3 1.9 1.9 1.7 1.8 1.8 1.8 1.8 1.6
Change in business inventories IBillions of 82$1 21.9 32.6 -9.4 1.3 8.3 10.4 15.0 16.9 18.9 20.0
Nonfarm IBillions of 82$1 16.2 31.3 -6.2 3.7 8.3 10.6 14.8 16.8 18.3 19.3
Net exports Billions of 82$1 -57.1 -61.8 -38.9 -45.1 -45.4 -39.7 -34.8 -26.3 -17.9 -7.7
Nominal GNP Percent change 6.2 4.3 5.2 6.3 5.8 5.6 6.8 6.4 6.4 6.5
EMPLOYMENT AND PRODUCTION----------„------„-----|
Nonfarm payroll employment IMillions 1108.9 109.4 109.8 110.4 110.4 110.6 111.0 111.3 111.6 112.0
Unemployment rate IPercent 5.3 5.3 5.5 5.6 5.8 5.9 6.0 6.0 6.1 6.1
Industrial production index Percent change I 1.3 .2 -. 9 2.8 1.8 2.0 2.5 3.0 3.2 3.4Capacity utilization rate-mfg. (Percent* 84.0 83.1 82.2 82.1 81.8 81.5 81.4 81.4 81.4 81.5
Housing starts IMillions 1.34 1.33 1.37 1.33 1.33 1.33 1.33 1.33 1.33 1.33
Auto sales IMillions 1 10.24 9.14 9.57 9.65 9.45 9.45 9.50 9.50 9.50 9.50Domestic IMillions 7.36 6.56 6.90 6.95 6.85 6.90 6.95 6.95 6.95 6.95Foreign IMillions 2.88 2.59 2.67 2.70 2.60 2.55 2.55 2.55 2.55 2.55
INCOME AND SAVING
Nominal personal income IPercent change 1 5.2 7.9 7.0 6.5 5.2 5.9 7.1 6.3 5.6 6.5Real disposable income nPercent change I 4.4 2.6 1.2 2.2 .4 1.0 2.3 1.2 .6 1.4Personal saving rate Percent* I 5.1 5.8 5.6 5.5 5.2 5.1 5.3 5.2 5.0 5.0
Corp. profits with IVA A CCAdj [Percent change -15.4 -26.5 -7.4 .0 8.6 -2.9 4.6 -2.9 14.5 8.0Profit share of GNP IPercent* 5.6 5.1 5.0 4.9 4.9 4.8 4.8 4.7 4.8 4.8
Federal govt. surplus/deficit IBillions of S t -144.7 -162.4 -152.6 -143.8 -127.3 -123.2 -122.8 -114.4 -101.7 -97.1State and local govt. surplus I 44.9 39.1 41.9 44.4 45.9 49.1 53.2 60.5 64.7 70.1Exc. social insurance funds 1 -34.3 -41.4 -40.1 -39.1 -39.1 -37.4 -34.8 -29.0 -26.3 -22.4
PRICES AND COSTS
GNP implicit deflatorGNP fixed-weight price indexCons. & fixed invest. prices
CPIExc. food and energy
ECI hourly compensation**
Nonfarm business sectorOutput per hourCompensation per hourUnit labor costs
(Percent change 3.2 3.5S 2.9 3.8S2.3 4.4
2.6 3.93.5 4.7
4.9 4.7
2.5 .15.3 6.82.8 6.7
4.6 3.65.0 3.75.3 3.55.6 3.74.3 4.7
5.5 5.3
4.2 3.8 4.64.1 4.1 4.94.1 4.2 4.54.2 4.3 4.64.7 4.6 4.8
4.6 4.5 4.8
4.0 3.9 3.84.2 4.1 4.14.5 4.4 4.44.5 4.5 4.54.7 4.6 4.6
4.9 4.3 4.2
1.6 1.6 1.65.6 5.0 4.93.9 3.3 3.2
Not at an annual rate.** Private industry workers; seasonally adjusted by Board staff.

CONFIDENTIAL - FRCLASS II FOMC
GROSS NATIONAL PRODUCT AND RELATED ITEMS(Net changes, billions of 1982 dollars)
January 31, 1990
Projection Projection
1989 1990 1991 1988 1989 1990 1991----- ---- -------------------- ------------------ (fourth quarter to fourth quartr,
03 04 Q1 02 03 04 Q1 02 3 04 i net change)
Real G•WGross domastic purchases
final salesPrivate dom. final purchases
Personal constuption expend.DurablesNondurablesServices
Businesa fixed investmentProducers' durable equipmentNonresidential structures
Residential structures
Change in business inventoriesNonfarmFarm
Net exportsExportsImports
Government purchasesFederalDefenseNondefense
State and local
30.436.3
27,538.4
36.411.511.113.9
6.54.4
2.3-4.5
2.8-3.36.1
-5.95.6
11.5
-5.0-7.5
4.3-11.8
2.5
5.2 7.1 26.8 16.3 18.1 21.8 23.8 25.3 26.99.9 -15.8 33.0 16.7 12.4 16.9 15.3 17.0 16.7
-5.5 49.1 16.1 9.3 16.0 17.2 21.9 23.3 25.8-3.4 21.9 19.7 10.7 9.5 10.8 12.6 14.0 14.9
-.8 14.6 17.9 10.5 9.9 10.7 11.0 11.4 11.9-14.8 7.2 3.4 -.4 1.0 1.7 1.4 1.7 1.9-3.3 1.9 4.1 2.1 2,1 1.8 2.1 2.1 2.317.4 5.4 10.4 8.8 6.8 7.2 7.6 7.6 7.7
-3.9 5.2 1.7 .1 -.2 1.1 2.5 2.9 3.1-4.3 5.7 3.0 1.8 1.6 2.8 4.0 4.4 4.5
.4 -.6 -1.3 -1.7 -1.8 -1.7 -1.5 -1.5 -1.41.2 2.2 .2 .1 -.2 -1.0 -.9 -.3 -.1
10.7 -42.0 10.7 7.0 2.1 4.6 1.9 2.0 1.115.1 -37.5 9.9 4.6 2.3 4.2 2.0 1.5 1.0-4.3 -4.5 .8 2.4 -.2 .4 -.1 .5 .1
-4.7 22.9 -6.2 -.3 5.7 4.9 8.6 8.4 10.27.1 19.5 3.2 8.7 13.1 11.5 15.1 15.8 17.5
11.8 -3.4 9.4 9.0 7.4 6.6 6.5 7.4 7.3
2.6 4.3 2.6 -1.0 .8 1.5 .8 1.0 .7
-2.5 2.2 .3 -3.0 -1.4 -.7 -1.4 -1.2 -1.3-5.4 -3.2 -3.3 -2.4 -1.9 -2.0 -1.9 -1.8 -1.7
3.0 5.3 3,6 -. 6 .5 1.3 .5 .6 .45.0 2.2 2.3 2.0 2.2 2.2 2.2 2.2 2.0
133,897.8
172.0121.7
95.431.119.145.2
20.024.3-4.3
6.2
-38.3-23.7-14.6
36.067.331.3
14.3-1.0-5.14.1
15.3
98.7 68.3 97.986.7 46.3 65.8
84.571.0
61.61.15.5
55.1
21.322.0-'*
-12.1
14.3-. 6
14.9
90.561.7
52.811.110.231.4
6.812.1-5.4
2.2
-22.2-20.7-1.5
88.352,3
45.06.68.3
30.1
9.615.7-6.1-2.3
12.0 22.1 32.148.8 44.4 59.936.8 22.4 27.8
1.5 6.7 3.9-10.3 -1.9 -4.7-6.9 -10.8 -7.4-3.3 8.8 2.711.7 8.7 8.6

CONFIDENTIAL- FR CLASS IIFEDERAL SECTOR ACCOUNTS 1
(Billions of dollars)
Fiscal years1989 1990 1991
1988a 1989a 1990 1991 Ia IIa IIIa IV I I I II I I II IV
BUDGET Not seasonally adjusted
Budget receipts 2 908 991 1055 1132 219 308 242 229 240 322 264 251 259 339 283 269Budget outlays2 1063 1143 1192 1250 280 285 288 298 299 300 295 318 308 314 310 321Surplus/deficit(-)
to be financed2 -155 -152 -137 -118 -61 23 -46 -70 .59 23 -31 -67 -49 24 -27 -52(On-budget) -194 -204 -199 -188 -77 0 -54 -76 -77 0 -46 -77 -69 1 -42 -62(Off-budget) 39 52 62 70 16 23 7 6 19 23 14 10 21 24 16 10
Means of financing:Borrowing 162 140 144 115 38 10 39 63 51 10 20 65 24 8 17 48Cash decrease -8 3 6 0 19 -29 3 14 11 -24 5 10 10 -25 5 10Other3 1 8 -13 3 4 -4 5 -8 -4 -8 6 -8 14 -8 4 -6
Cash operating balance,end of period 44 41 35 35 15 44 41 27 16 40 35 25 15 40 35 25
IPA FEDERAL SECTOR Seasonally adjusted annual rates
Receipts 958 1032 1099 1187 1036 1053 1043 1054 1093 1114 1134 1153 1180 1199 1219 1240Expenditures 1103 1183 1246 1303 1184 1199 1188 1217 1246 1258 1262 1276 1303 1313 1321 1337Purchases 377 404 414 424 399 406 403 409 413 417 415 416 ' 426 427 428 428
Defense 297 302 304 305 299 301 308 303 306 304 303 302 306 306 306 305Nondefense 80 101 110 119 100 105 95 105 108 113 113 114 120 121 122 123
Other expend. 726 780 832 879 785 793 785 808 832 841 846 860 877 886 893 909surplus/deficit -145 -151 -147 -116 -148 -145 -145 -162 -153 -144 -127 -123 -123 -114 -102 -97
FISCAL INDICATORS 4
High-employment (HEB)surplus/deficit(-) -150 -167 -147 -97 -165 -162 -162 -172 -153 -142 -120 -110 -106 -94 -78 -72
Change in BEB, percentof potential GNP .3 .4 -. 4 -. 9 -. 3 -. 1 .0 .2 -. 4 -. 2 -. 4 -. 2 - -.2 -. 3 -. 1
Fiscal impetus measure(FI), percent .2 * -3.5 * -6.8 * -3.4 * -2.7 -.2 .5 -2.6 -4.0 -.2 -1.0 -1.9 -1.0 -.3 -.4 -.4
a--actual *--calendar year
Note: Details may not add to totals due to rounding.1. Staff projections. The FY90 and FY91 deficits in OMB's F71991 Budget (January 1990) are $124 billion and $63 billion, respectively.
These estimates incorporate approximately $39 billion of cuts from the adjusted Gramm-Rudman-Hollings baseline in FY1991.The FY90 and TP91 baseline deficits in CBO's Economic and Budget Outlook (January 1990) are $138 billion and $138 billion, respectively.
2. Budget receipts, outlays, and surplus/deficit include social security (OASDI) receipts, outlays and surplus, respectively. The OASDIsurplus is excluded from the "on-budget" deficit and shown separately as "off-budget", as classified under current law,
3. Other means of financing are checks issued less checks paid, accrued items; and changes in other financial assets and liabilities, includingPost Office surplus/deficit in FY90 and FY91.
4. WEB is the NIPA measure in current dollars with cyclically-sensitive receipts and outlays adjusted to a 6 percent unemployment rateand 2.7% potential output growth. Quarterly figures for change in HEB and FI are not at annual rates. Change in BEB, as a percentof nominal potential GNP, is reversed in sign. FI is the weighted difference of discretionary federal spending and tax changes (in1982 dollars), scaled by real federal purchases. For change in BEB and FI, (-) indicates restraint.
January 31, 1990

DOMESTIC FINANCIAL DEVELOPMENTS
Recent Developments
Short-term interest rates generally dropped slightly in late December
following the 1/4 percentage point decline in the federal funds rate. But,
despite the subsequent stability of the funds rate at 8-1/4 percent, other
rates have risen across the maturity spectrum as the prospect of any near-
term easing of monetary policy appeared to diminish. Contributing to this
changed outlook have been the depreciation of the dollar and higher bond
rates abroad, incoming price information and other domestic economic news,
and a press report that some Board members would not support additional
easing steps under current circumstances. For the intermeeting period as a
whole, yields on Treasury securities beyond three months' maturity are up
1/4 to 3/4 of a percentage point, with the largest increases posted at the
long end.
M2 growth slowed to about a 4 percent rate in January. Virtually
all of the deceleration can be attributed to a decline in Ml after robust
growth a month earlier. An estimated 4 percent annual rate of contraction
in Ml in January stemmed largely from a sharp drop in demand deposits, after
a surge in December. The nontransactions component of M2 continued to grow
moderately. Core deposits at thrift institutions expanded in January,
reversing a fourth-quarter decline, as flows into adequately capitalized
thrifts outstripped further runoffs at RTC-controlled institutions and other
insolvent thrifts. With declines in managed liabilities at thrifts
continuing heavy and bank credit and associated financing needs remaining
weak, M3 growth slipped further in January, to a 2 percent annual rate.
1. Monetary statistics referred to in this section do not incorporateannual updates of benchmarks and seasonal adjustment factors.
I-15

I-16
Net borrowing by the domestic nonfinancial sectors appears to have
slowed a little around year-end. Borrowing by businesses in particular has
slackened. Bank lending to business, especially merger-related financings,
fell off sharply in December and posted only sluggish growth in January. At
a 14 percent annual rate of decline in December, C & I loans contributed to
the first monthly drop in total bank credit in nearly a decade. Partly
offsetting the contraction in bank business loans, commercial paper
borrowing by nonfinancial firms has continued to grow rapidly.
Public offerings of corporate bonds, meanwhile, have fallen further
in January from a moderate December pace. Investment-grade offerings have
slowed with the general back-up in long-term rates, and issuance of low-
rated debt is running at its slowest pace in two years. Prices of junk
bonds have fallen in response to the Campeau bankruptcy, Moody's unexpected
downgrading of RJR's debt, and weakness in stock prices. Major stock price
indexes are down 5 to 6 percent from their levels of mid-December and 10
percent below recent highs in early January. Equity issuance by
nonfinancial firms has nearly evaporated since a flurry of issues early in
December.
In the household sector, information on borrowing in early 1990 is
sparse. Consumer credit growth appears to have picked up a bit in December,
boosting the fourth-quarter growth in installment credit to about an
8 percent annual rate. Credit card usage was largely responsible for
December's rise. Consumer loans at banks in January expanded at a brisk
7 percent pace. Evidence on mortgage lending activity around year-end is
sketchy, but indications are that the growth in home mortgage debt in the
fourth quarter probably did not change much from the moderate pace of the
third quarter. Thrift institutions continued their disinvestment in

I-17
mortgages and mortgage securities at least through November, but increased
acquisitions by banks and other lenders have kept rate spreads from
widening. At current pricings, the vast majority of mortgage borrowers
continue to prefer fixed-rate mortgages to adjustable-rate products; the
latter accounted for only 21 percent of conventional mortgage loans
originated in early December.
In the government sector, the federal deficit in the current quarter
is expected to decline and, in anticipation of April tax inflows, the
Treasury is expected to draw down its cash balance. As a result, net
borrowing from the public is anticipated to slow to about $51 billion, with
most of the cutback in the bill sector. Among the government sponsored
enterprises, the Federal Home Loan Banks continued to pay down debt in the
fourth quarter, reflecting reduced demand for advances by member thrifts.
Fannie Mae, by contrast, tapped the debt markets for an additional $4.6
billion in the fourth quarter to finance additions to its portfolio.
REFCORP's $5 billion auction of 40-year bonds fared poorly relative to
market expectations, but spreads have subsequently narrowed.
Offerings of long-term tax-exempt securities picked up in December,
but slowed appreciably in January as rates firmed. Issuance for 1989 as a
whole was off slightly from the 1988 totals. Despite the revenue shortfalls
continuing to plague a number of eastern states, the overall credit quality
of general obligation debt improved in 1989. Among revenue bonds, the
record was more mixed.
Outlook
The staff economic projection assumes that interest rates will remain
near current levels through the remainder of this year, with some slight
increases possibly occurring next year as a lower dollar boosts exports and

I-18
overall production. Relative to conditions that have prevailed in recent
years, credit use and aggregate spending are likely to remain somewhat
constrained by investor concerns about highly leveraged borrowers and more
cautious lending by institutions bruised by losses and faced with tighter
regulation.
The accompanying outlook for total credit growth among the domestic
nonfinancial sectors, which has changed only marginally since the December
FOMC meeting, calls for continuation of the deceleration that began in the
mid-1980s. Debt growth this year is expected to slow to about 7 percent and
to ease further to 6-1/2 percent in 1991. Tightened standards for provision
of merger-related financing will restrain overall business credit growth
despite some offset from increased borrowing to finance capital expenditures
in the face of deteriorating cash flow.
In the household sector, the expected flatness of housing
construction and home sales probably implies some additional slowing in the
rate of growth in mortgage credit over the projection period. Consumer
credit growth in the near term may be jostled by choppy monthly patterns of
auto sales and revolving charge bookings, but the longer-run outlook for
consumer borrowing is for sluggish growth, consistent with the prospects for
consumer income and spending.
The outlook for federal government debt growth is clouded by the
RTC's financing of working capital needs. Borrowing through the Federal
Financing Bank (FFB) could be the avenue selected, and this would boost the
Treasury borrowing needs. Abstracting from this possibility, a lower
deficit is expected to reduce slightly Treasury borrowing in 1990 and by a
larger amount in 1991. If RTC is financed through the FFB, federal sector
and total debt growth would be higher; for example, $40 billion of working

I-19
capital financed through this means would boost annual growth in total
domestic nonfinancial debt by slightly less than 1/2 percentage point in
1990.

INTERNATIONAL DEVELOPMENTS
Recent Developments
The weighted-average foreign exchange value of the dollar in terms
of other G-10 currencies has declined 2-1/2 percent since the FOMC
meeting on December 19. The dollar fell as monetary conditions abroad
tightened somewhat on average while those in the United States eased.
The mark appreciated 3-1/2 percent against the dollar, buoyed further by
developments in Eastern Europe.
Short-term interest rate differentials moved against the dollar by
30 to 50 basis points over the intermeeting period, as rates in Japan
and Germany edged up and U.S. private rates eased. Bond yields rose
substantially worldwide, particularly after year-end; Japanese yields
were up more than U.S. and German yields, on balance. Stock price
indexes in most of the major markets have fallen 5 to 10 percent since
the beginning of the year, after having risen by lesser amounts during
the latter part of December. (The German market, however, fell somewhat
less in January, and is up 10 percent since December 19.) Some
rekindling of inflation expectations in the wake of higher oil prices,
and perceptions of likely monetary policy responses may have contributed
to the recent global decline in bond and stock markets. Signs of
continued demand pressures abroad, particularly in the German economy,
may have factored in as well.
1-20

1-21
. The Desk sold $600 million against yen.
The lira's central parity rate within the EMS was devalued on January 5
by nearly 4 percent, and the margin for fluctuation from that rate was
narrowed from 6 percent to the 2-1/4 percent margin that now applies to
all EMS currencies except the peseta.
Indicators of economic activity in major foreign industrial
countries during the fourth quarter of last year were mixed, as monetary
restraint appears to have taken hold in some, but not all, of these
countries. Industrial output has weakened noticeably in Canada and the
United Kingdom. Japanese industrial production and retail sales also
turned down, according to the latest monthly releases, but for the
fourth quarter as a whole, growth appears to have continued to be strong
in Japan. Recent data for Germany, France, and Italy point to continued
strength of activity in those countries. Inflation in the foreign G-10
countries picked up somewhat in the fourth quarter, and it averaged 4-
1/4 percent for the year, compared with 3 percent during 1988.
Japan's trade surplus declined further in December, and was down
$13 billion for the year from its 1988 rate. Through November,
Germany's trade surplus was running at about its 1988 pace, while
Canada's surplus was roughly half its 1988 rate; the U.K., French, and
Italian trade deficits all widened in 1989.
With respect to the major developing countries, Mexico's debt
restructuring package is scheduled to be signed, beginning February 4.
The Philippines completed the debt buyback part of its debt
restructuring program, repurchasing $1.3 billion in commercial bank debt

I-22
at a 50 percent discount on January 3. Argentina's rate of inflation
has accelerated, and financial conditions have deteriorated since mid-
December; the government has announced two new stabilization programs.
Brazil's inflation rate rose to 56 percent in January, and government
efforts to reduce it have been put off until the Collor administration
takes office in mid-March.
The U.S. merchandise trade deficit widened slightly further, to
$10.5 billion in November (on a seasonally adjusted customs basis) from
a revised.$10.2 billion in October. For October-November combined, the
deficit was up substantially from its average in both the third quarter
and the first nine months of the year. A strike-related disruption to
aircraft exports accounted for about one-third of the worsening of the
trade deficit. The growth of non-oil imports picked up significantly,
stimulated in part by earlier declines in relative prices associated
with the rise in the dollar through mid-1989.
Import prices, as reported by the BLS, rose almost 5 percent in the
fourth quarter (at an annual rate), led by a 31 percent rate of increase
in oil prices. The West Texas spot price of crude petroleum rose to
more than $23 per barrel in the third week of December and again in mid-
January, as unusually cold weather spurred demand and as oil supply
problems in centrally planned economies came to light. Non-oil import
prices increased at a 3 percent rate in the fourth quarter, after having
declined over the first three quarters the year. Export prices fell
slightly in the fourth quarter; a decline in agricultural prices more
than offset a slight increase in the average price of nonagricultural
exports.

I-23
Recorded net capital inflows during October-November were
concentrated in private foreign net purchases of U.S. Treasury
securities and corporate bonds. Foreign holdings of U.S. corporate
stocks fell in November for the first time since February.
Outlook
The staff forecast continues to incorporate a moderate rate of
decline in the foreign exchange value of the dollar in terms of other G-
10 currencies over the next two years. The dollar declined more rapidly
than expected over the past six weeks, and its projected path is now
slightly below that in the December Greenbook, especially in the near
term.
Economic growth in the major foreign industrial countries is
expected to average a little less than 3 percent at an annual rate over
the next two years, down somewhat from the average annual rate of about
3-1/2 percent recorded over the past two years. The monetary restraint
that is expected to hold growth to this more subdued pace should also
hold the average rate of consumer price inflation abroad below that in
the United States.
Oil import prices are expected to average $19.70 per barrel in the
current quarter, and then to fall to $18 by the second half of the year
as the market recovers from the effects of cold weather and disruptions
to supply. This price level is about $1 per barrel above the December
Greenbook forecast. Moreover, oil prices are now assumed to rise
slightly faster than U.S. consumer prices in 1991 as world output
becomes increasingly concentrated among the Persian Gulf producers,
enhancing prospects for OPEC coordination.

I-24
The U.S. merchandise trade deficit is expected to improve somewhat
in the next few months as the effects of the recent Boeing strike and
delayed aircraft exports unwind. The deficit is then projected to level
off at an annual rate of about $115 billion through mid-1991. The
projected slow U.S. growth and associated lower growth in demand for
imports over the year ahead will about offset the negative effects on
the trade balance of the rise in the dollar through mid-1989. The more
recent and the projected further decline in the dollar is expected to
show through in a lower deficit during 1991.
Net portfolio investment income payments will continue to rise as
U.S. net indebtedness to the rest of the world mounts. However, these
higher net payments are expected to be more than offset by increases in
net direct investment income receipts and other net services. As a
result, the current account deficit (excluding capital gains and losses)
is projected to improve slightly more than the trade deficit, moving
below $100 billion during 1991.

Strictly Confidential (FR)Class II FOMC
January 30, 1990
Outlook for U.S. Net Exports and Related Items(Billions of Dollars, Seasonally Adjusted Annual Rates)
1, GNP Exports and Imports I/
Current *t NetExports of 0+SImports of G+S
Constant 82 4, NetExports of G+SImports of +5S
2. Merchandise Trade Balance 2/
ExportsAgriculturalNon-Agricultural
ImportsPetroleum and ProductsNon-Petroleum
3. Other Current Account Transactions
Capital Gains and Losses 3/Other D.I. Income, NetPortfolio Income, NetOther Current Account, Net
4. U.S. Current Account Balance
Including Capital O/LExcluding Capital G/L
5. Foreign Outlook 4/
Real GNP--Ten Industrial 5/Real GNP--LDC 6/Consumer Prices--Ten Ind. 5/
ANNUAL1989-P 1990-P 1991-P
-50.9 -39.1 -23.7624.4 679.3 753,9675.2 718.4 777.6
-56.5 -42.3 -21.7587.6 629.7 679.7643.9 672.0 701.4
Q3 94-P
-45.1 -53.8628.5 637.3673.6 691.1
_1 Q 199041 -Q2-P Q3-P 44-P
-36.0 -43.3 -40.7662.4 669.4 683.2698.4 712.6 723.9
-36.4702.3738.8
-p 1991 -41-P 42-P Q3-P 94-P
-33.9 -27.4 -21.2719.9 741.7 764.5753.8 769.1 785.7
-12.3789.7802.0
-57.1 -61.8 -3,.9 -45.1 -45.4 -39.7 -34.8 -26,3 -17.9 -7.7593.1 600.2 619.7 622.9 631.5 644.6 656.1 671.2 687.0 704.5650.2 662.0 658.6 668.0 677,0 684.4 691.0 697.5 704.9 712.2
-114.9 -111.5 -103.8 I-111.0 -124.9 -106.6 -114.8 -113.3 -111.4 -110.2 -106.6 -102.3 -96.2
362.9 396.9 445.141.5 41.9 44.9
321.4 355.0 400.3
477.8 508.4 548.950.9 56.7 59.6
426.9 451.7 489.4
-5.3 2.1 0.936.1 39.1 42.2
-36.5 -44.6 -49.95.9 9.7 14.2
366.3 368.1 387.9 390.0 398.7 410.9 422.5 436.8 452.4 .468.739.1 40.4 41.2 41.5 41.7 43.1 43.6 44.4 45.2 46.2
327.2 327.6 346.7 348.5 357.1 367.7 378.9 392,4 407.2 422.5
477.3 493.0 494.5 504.8 512.0 522.2 532.7 543.5 554.7 564.953.2 53.5 58.9 57.8 54.8 55.4 57.1 58.7 60.4 62.1
424.1 439.5 435.7 447.0 457.2 466.8 475.7 484.7 494.2 502.8
10.9 2.9 6.3 0.7 0.6 0.6 0.9 0.9 0.9 0.935.1 38.2 39.0 38.4 38.8 40.1 40.3 42.0 42.5 43.8
-35.5 -40.2 -42.3 -43.8 -45.3 -46.8 -48.0 -49.3 -50.6 -51.89,8 5.7 8.7 10.2 10.9 9.1 13.1 14.4 15.6 15.8
-114.7 -105.2 -96.4 -90.7 -118.3 -94.9 -109.3 -108.2 -108.3 -103.8 -98.7 -93.8 -89.4-109.4 -107.2 -97.3 -101.6 -121.2 -101.1 -110.0 -108.9 -108.9 -104.8 -99.6 -94.8 -90.3
3.7 3.0 2.82.7 3.7 3.94.0 3.9 3.8
3.7 3.9 2.9 2.8 2.8 2.9 2.8 2.8 2.9 2.93.0 3,6 4.1 4.1 3.9 3.7 3.7 4.0 4.3 4.72.3 4.4 3.3 4.9 3.3 3.4 3.8 4.3 3.5 3.6
1/ National Income and Product Account data.2/ International accounts basis.3/ The net of gains (+) or losses (-) on foreign-currency denominated assets due to their revaluation at current exchange rates andother valuation adjustments.4/ Percent change, annual rates.5/ Weighted by multilateral trade-weights of 0-10 countries plus Switzerland; prices are not seasonally adjusted.6/ Weighted by share in LDC GNP.P/ Projected