Embed Size (px)
Citation preview

APPENDIX

Notes for FOMC MeetingFebruary 6-7, 1990
Sam Y. Cross
Since your last meeting, the dollar has on balance eased, but
only moderately. The market's attention has been dominated by
developments abroad, and trading has continued to focus to a large
extent on currencies other than the dollar. The trends we described
at your last meeting remain more or less intact, with the German mark
edging still higher against the dollar, although at a slower pace, and
the Japanese yen still trading on the weak side.
In these circumstances, the Desk intervened on only three
occasions in early and mid-January, selling a total of $600 million
against yen. We intervened far more modestly than the Bank of Japan,
which during early January sold almost to support its
currency. In the past couple of weeks or so, there has been no dollar
intervention either by ourselves, the Japanese, or the Germans. The
dollar is now trading marginally higher against the yen from its
levels of six weeks ago, but is about 4 to 5 percent lower against the
mark and is at the lowest point against the mark that we have seen for
almost two years.
More important than the movement in dollar rates are the
shifts in market sentiment that seem to be taking place below the
surface--some providing support for the dollar but others casting a
negative shadow on the currency. In recent weeks, the market seems to
have focused increasingly on these more negative concerns and, in the
process, has expressed some nervousness abut the ability of the United
States to continue a smooth financing of its payments deficits, at
least at current exchange rates.
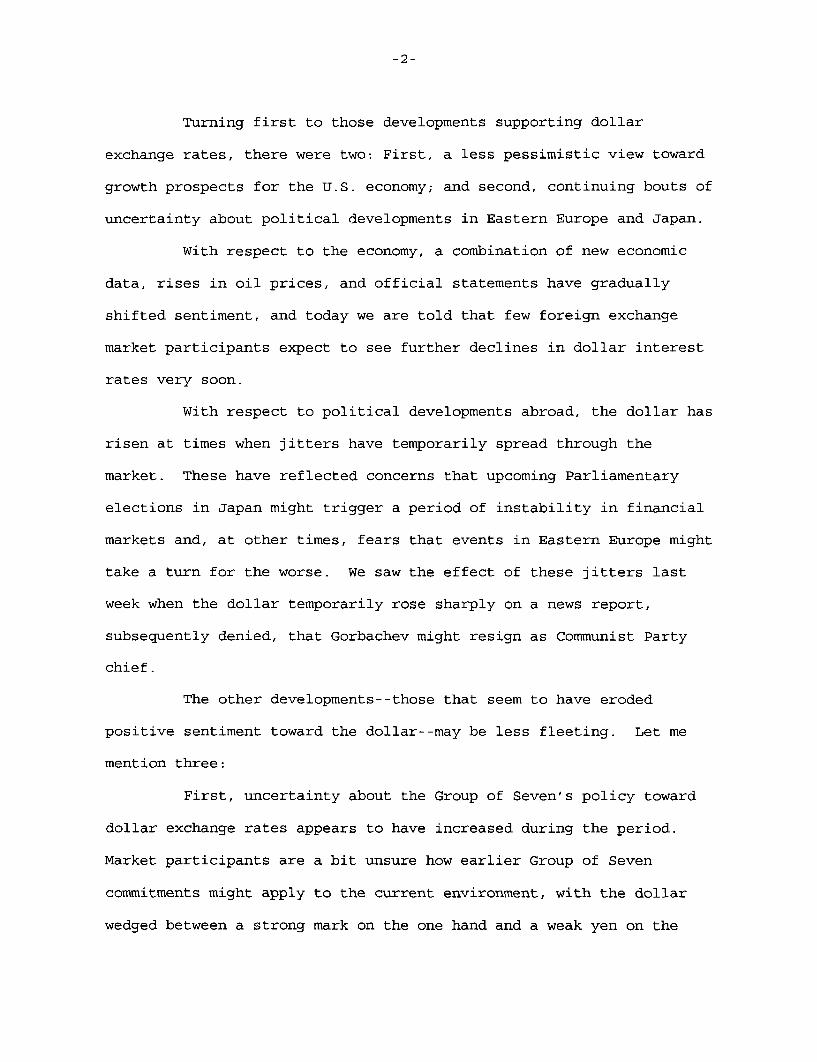
Turning first to those developments supporting dollar
exchange rates, there were two: First, a less pessimistic view toward
growth prospects for the U.S. economy; and second, continuing bouts of
uncertainty about political developments in Eastern Europe and Japan.
With respect to the economy, a combination of new economic
data, rises in oil prices, and official statements have gradually
shifted sentiment, and today we are told that few foreign exchange
market participants expect to see further declines in dollar interest
rates very soon.
With respect to political developments abroad, the dollar has
risen at times when jitters have temporarily spread through the
market. These have reflected concerns that upcoming Parliamentary
elections in Japan might trigger a period of instability in financial
markets and, at other times, fears that events in Eastern Europe might
take a turn for the worse. We saw the effect of these jitters last
week when the dollar temporarily rose sharply on a news report,
subsequently denied, that Gorbachev might resign as Communist Party
chief.
The other developments--those that seem to have eroded
positive sentiment toward the dollar--may be less fleeting. Let me
mention three:
First, uncertainty about the Group of Seven's policy toward
dollar exchange rates appears to have increased during the period.
Market participants are a bit unsure how earlier Group of Seven
commitments might apply to the current environment, with the dollar
wedged between a strong mark on the one hand and a weak yen on the

other. They wonder whether the central banks might simultaneously
support the dollar against the strong mark while resisting its rise
against the weak yen. Another question is what would happen if the
yen, which is sometimes prone to sharp and unpredictable moves, were
to stage a strong comeback, say after the February elections. The
situation was further complicated in early January, when the
Bundesbank surprised the market by selling dollars at levels well
below where the market would have expected such sales by a Group of
Seven central bank, an episode which led some to conclude that the
Group of Seven might have changed its views, and this heightened the
dollar's downside risk.
A second concern is that some market participants have
concluded that the Bank of Japan will, in future, be more willing to
tighten monetary policy to resist periods of yen weakness. Following
the Bank of Japan's surprise Christmas Day discount rate increase, and
the subsequent rise in market interest rates throughout the yield
curve, many analysts perceive a subtle policy shift in Japan and now
believe that a series of additional tightening moves may be in store
in the coming months.
These two factors, along with ongoing events in Europe, have
fed into the third--nervousness over a possible lessening in the
strength of foreign demand for U.S. securities. With long-term rates
in the United States, Germany, and Japan having tended to converge
over the past year and with market participants less certain where
Group of Seven support for a declining dollar might exist, some are
beginning to question whether the flow of funds into U.S. asset
markets will remain steady and dependable.

One difficulty in assessing the impact of capital flows on
exchange rates these days is that there appear to be so many cross
currents. For example, long-term equity investment appears to be
attracted very heavily to Germany, in the expectation that Germany's
economy, already strong, will benefit from developments in East
Europe, and that Germany's stock market will continue to outperform
others. At the same time, however, there also appear to be flows of
short-term capital moving in the opposite direction as some non-
Japanese players, puzzled by the continued weakness of the yen,
speculate that there will be a near-term correction in that currency.
In the United States, the picture is equally mixed. On the
one hand, the U.S. equities market seems to have lost some of its
comparative attractiveness. But, on the other hand, our bond market
is perceived as carrying less risk than the others in that U.S.
interest rates are either not expected to rise, or if they do at least
not to rise by as much as those abroad, and this may be a plus
supporting capital flows into the dollar.
In sum, the interrelationships in capital flows seem tenuous
and uncertain, and shifts in sentiment toward particular investments
and particular currencies could occur very abruptly.
Mr. Chairman, I would like to ask the Committee's approval
for the foreign exchange operations that occurred during the inter-
meeting period. The Federal Reserve share of the Desk's operations
represents $300 million sold against Japanese yen. Our overall limit
remains at $21 billion. With our latest operations plus our continued
interest earnings, we now have just over $700 million in headroom, and
I do not propose any change at this time.

FOMC NOTESPETER D. STERNLIGHTWASHINGTON, D.C.FEBRUARY 6-7, 1990
Following the last meeting of the Committee, on
December 19, the Domestic Desk began aiming for slightly reduced
pressures on reserve positions, characterized by a 1/4 percent
reduction in the Federal funds rate to about 8 1/4 percent. By
arranging overnight repurchase agreements the day after that
meeting, the market got the message of a slight easing quickly and
unambiguously. While funds rates quickly moved to 8 1/4 percent,
moderate year-end pressures came into play early in the period,
causing some higher rates for a time. Later in the interval, funds
often tended to sag a bit below the expected level as seasonal
reserve surpluses emerged. Market participants kept the faith,
however, that 8 1/4 was the intended level throughout. For the
period, funds averaged 8.26 percent, compared with
8.51 percent in the previous intermeeting interval.
The path level for borrowing was $125 million throughout
the interval, but actual borrowing varied considerably above this
amount. In the reserve periods ending December 27 and January 10,
borrowing averaged a little over $300 million, reflecting elevated
use of the window in the weeks that included Christmas and New
Year's. Once past the holidays, another distorting factor emerged

-2-
later in January as the Bank of New England turned to the window for
sizable accommodation, leaving borrowing in the January 24 period at
just a little under $300 million of borrowing and boosting the
current period thus far to around $700 million. This bank's
borrowing, while still classified formally as adjustment credit, was
regarded more like extended credit and hence like nonborrowed
reserves for reserve management purposes. Abstracting from this
bank's borrowing, seasonal and adjustment credit has averaged about
$135 million since January 10, fairly close to path.
The Desk added reserves for the first half of the period,
running about a week past year-end, to meet seasonal needs for
currency and higher required reserves. Then from about January 10
on into early February the Desk absorbed reserves, offsetting
seasonal return reflows of currency and lower reserve requirements.
Higher Treasury balances after the mid-January tax date temporarily
moderated the need to drain reserves. Early in the interval, the
System bought nearly $1.1 billion of bills from foreign accounts,
and on most days arranged System or customer related repurchase
agreements in the market. We exercised particular caution in
promulgating repos on a couple of occasions in order to avoid
stimulating false signals of further policy moves beyond the modest
step undertaken right after the last meeting.
Subsequently, the System reduced outright bill holdings
through a series of run-offs in weekly auctions, totaling
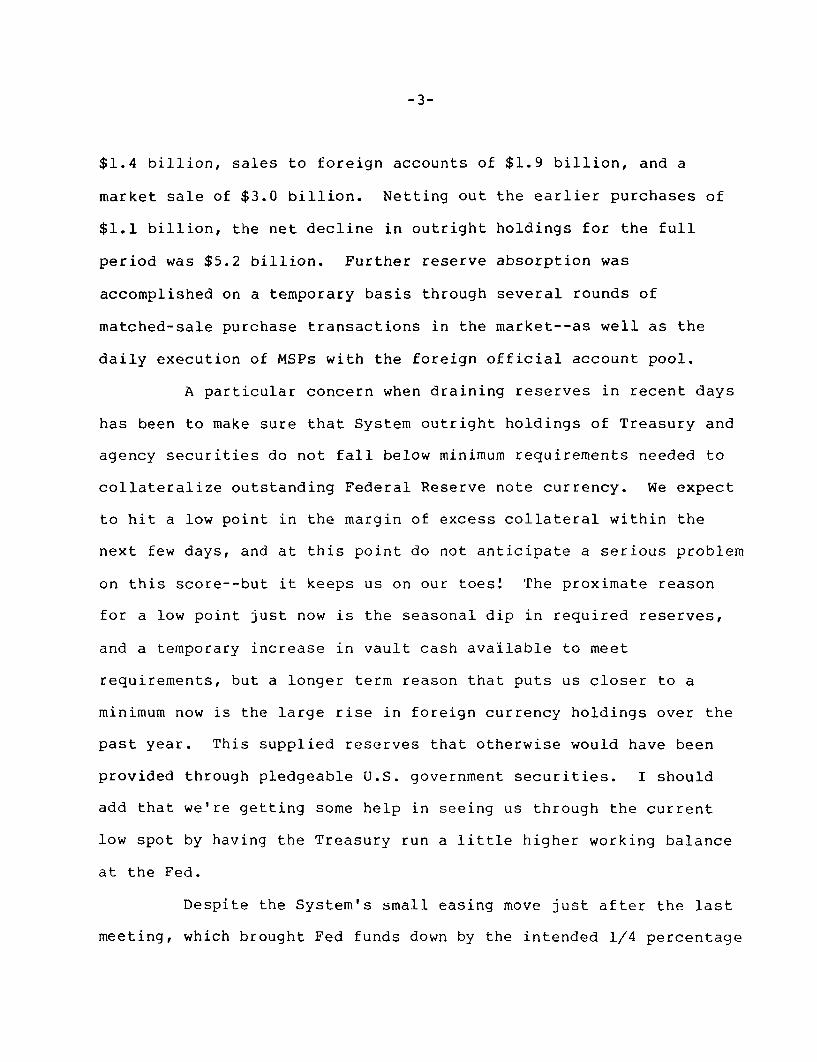
$1.4 billion, sales to foreign accounts of $1.9 billion, and a
market sale of $3.0 billion. Netting out the earlier purchases of
$1.1 billion, the net decline in outright holdings for the full
period was $5.2 billion. Further reserve absorption was
accomplished on a temporary basis through several rounds of
matched-sale purchase transactions in the market--as well as the
daily execution of MSPs with the foreign official account pool.
A particular concern when draining reserves in recent days
has been to make sure that System outright holdings of Treasury and
agency securities do not fall below minimum requirements needed to
collateralize outstanding Federal Reserve note currency. We expect
to hit a low point in the margin of excess collateral within the
next few days, and at this point do not anticipate a serious problem
on this score--but it keeps us on our toes! The proximate reason
for a low point just now is the seasonal dip in required reserves,
and a temporary increase in vault cash available to meet
requirements, but a longer term reason that puts us closer to a
minimum now is the large rise in foreign currency holdings over the
past year. This supplied reserves that otherwise would have been
provided through pledgeable U.S. government securities. I should
add that we're getting some help in seeing us through the current
low spot by having the Treasury run a little higher working balance
at the Fed.
Despite the System's small easing move just after the last
meeting, which brought Fed funds down by the intended 1/4 percentage

-4-
point, most market interest rates rose over the intermeeting
interval. The exceptions were day-to-day financing costs, some
short-term private instrument rates such as commercial paper and
CDs, and bank prime rates which came down 1/2 percentage point to
10 percent in a move that some analysts thought was overdue. The
decline in rates for private money market instruments partly
reflected the passage of year-end, as well as sizable demands for
such paper from money funds. In contrast, bill rates were up by 20
to 45 basis points and Treasury coupon yields climbed a startling
65-75 basis points.
A combination of factors produced the rise in rates. Views
on the economy and inflation prospects did not really change much,
but even subtle changes were enough to re-mold market opinion. The
economy was generally seen as growing sluggishly, though perhaps not
decelerating to the degree that some had anticipated. It was
expected that near-term news on inflation would be bad because of
higher fuel costs and crop damage related to December's bitter cold,
and while these were recognized as likely to be temporary factors,
it was still anticipated that there would at least be longer delays
before monetary policy was eased further. Meantime, there was less
patience with high costs of carrying inventory, relative to the
yields on that inventory. Weak bidding for the $5 billion of
40-year Refcorp bonds further unsettled the markets. A much-cited
factor throughout the period was the abatement of foreign demand for
U.S. securities and occasional selling from abroad as rates rose in

key foreign markets. Particular concern arose about the prospects
for foreign participation in the Treasury's current quarterly
financing, especially as the Japanese have been significant
participants in these auctions in the recent past. Some of these
concerns have abated now and more considered opinions are that, at
current higher yield levels, there will be appreciable foreign
participation--though perhaps to a lesser degree than earlier. We
just had the 3-year auction and it looks like there was quite decent
Japanese interest in that issue. To be sure, more question attaches
to the 10- and 30- year issues. Right now, market talk for
Thursday's 30-year Treasury bond auction is a little over
8 1/2 percent--which would be the highest auction yield for this
maturity since last May (when it averaged over 9 percent) and well
above the 7.87 percent yield on 30-year bonds three months ago.
In the bill area, rate increases were more modest--but
perhaps just as surprising given the lower Fed funds rate. Bills
were auctioned yesterday at average rates of 7.83 and 7.72 percent
for the 3- and 6-month issues, compared with 7.62 and 7.43 percent,
respectively, just before the December Committee meeting. Adding to
pressure on bill rates was a lessened willingness to hold bills at
negative cost of carry--so that even though day-to-day costs did
move a little lower with the funds rate those costs seemed more
burdensome given what had already been built into the bill yield
structure. In addition, the private sector had to absorb more bills
as the Fed and foreign official accounts let up on purchases or
actually lightened holdings.

-6-
The higher bill rates occurred despite some sporadic moves
to bills out of flight-to-quality concerns--coming both from the
stock market and the high yield bond market. In the "junk" bond
market there was particular concern about several developments: the
unexpected large loss reported by the Bank of New England; the
bankruptcy filing by Campeau's Federated and Allied department store
units--which while expected nevertheless called added attention to
weak cash flow situations among some other lower rated firms; and
the unexpected downgrading by one rating service of RJR-Nabisco
paper which had been regarded as relatively "high class junk",
almost ready for elevation to investment grade.
As I read the current state of market sentiment, the
underlying background is still one of a sluggish economic
expansion. Most participants do not see recession but it remains an
appreciable possibility. Inflation pressures are seen as fairly
well contained once we get past some temporary weather-related
effects in the next month or two, but there is only limited optimism
about seeing significantly lower price trends for the next year or
so. Some see the Fed as quite content with a sluggish growth
outlook in the effort to work inflation lower; others, perhaps a
majority, believe there could be a further modest easing move or
two, but with timing and extent quite uncertain.

Comments on Permanent Leeway Authority
As indicated in my note to the Committee, I recommend an
increase from standard $6 billion intermeeting leeway authorization
to a standard $8 billion allowance. The $6 billion standard of the
past five years has not been unduly burdensome. The Committee has
responded promptly to the two or three requests per year for
temporary increases. My sense is that these needs for temporary
enlargement may begin to come up more frequently as we have seen
more instances in the past year when we came fairly close to making
a request. One way to view the appropriate threshold is to consider
how often the Committee would want unusually large changes in the
portfolio brought to its attention. By setting an even higher
standard leeway, say $10 billion, the present prospect would be that
requests for enlargement might be quite a rarity. In suggesting
$8 billion, I expect that might be consistent with a need for
temporary enlargement perhaps once or twice a year.

MICHAEL J. PRELLFEBRUARY 6, 1990
FOMC CHART SHOW PRESENTATION -- DOMESTIC ECONOMIC OUTLOOK
As usual, the opening exhibit is a list of the assumptions that
conditioned our forecast. The first of these is that monetary policy
will be aimed at reducing inflation over time, preferably without
bringing a halt to the ongoing economic expansion. The second
assumption is that fiscal policy will remain moderately restrictive.
We have built into our forecast a $30 billion deficit-reduction
package for fiscal 1991; although this is smaller than the
Administration's $39 billion proposal, it probably is in the same ball
park in macroeconomic terms. For example, half the difference results
from our not including the capital gains initiative; enactment of that
measure would have ambiguous effects on aggregate demand in the near
term, for it is designed to hike tax revenues in 1991 at the same time
that it raises expected after-tax wealth and lowers the cost of capital.
In addition, our package contains none of the timing shifts or asset
sales present in the official proposal. We also have assumed that the
budget won't be framed in the context of a dramatic multi-year
agreement, which likely means it will produce no sea-change in bond
market expectations.
Indeed, our forecast does not anticipate any substantial
movements in interest rates. We've indicated, however, that we think
rates are likely to average somewhat higher, rather than lower, in 1991
than in 1990. With that interest rate scenario, M2 velocity falls a bit
this year, in lagged response to the rate declines of the past several

-2-
months, and rises a touch in 1991. M2 is projected to grow about 6-1/2
percent this year and 6 percent next year.
In the projected economic environment, the federal deficit
falls from $152 billion in FY89 to $137 billion this year and $118
billion in 1991. Obviously, we have implicitly assumed that either the
$64 billion Gramm-Rudman target for 1991 will be amended or that a
combination of "rosy scenarios" and economically meaningless "smoke and
mirrors" devices will be employed to satisfy the constraint.
And, finally, we have projected that the dollar will depreciate
moderately further. Built into the forecast is a 5 percent annual rate
of decline in the trade-weighted exchange value of the dollar against
other G-10 currencies, taking off from last month's level.
The staff economic forecast is summarized in chart 2. By
design, we have a projection in which growth in real GNP remains slower
than potential through 1991, producing a rise in the unemployment rate
to a bit over 6 percent. I might note, parenthetically, that the
stability of the unemployment rate over the past year, in the face of
2 percent growth of drought-adjusted GNP, does raise some questions
about whether we've been too optimistic about potential GNP increases.
If so, it might take considerably slower growth over the next two years
to produce the rise in joblessness we've projected. Be that as it may,
because the additional slack emerges only gradually in the forecast, and
owing to the effects of federally mandated cost increases as well as the
pressures on the price level coming from the dollar's depreciation, the
rate of inflation does not change materially from that observed in the
past few years.

-3-
The next chart summarizes your projections. As with the staff
forecast, your numbers have not changed radically from those of last
July. The most notable change is a slight lowering of the central
tendency of inflation forecasts, from the 4-1/2 to 5 percent range to 4
to 4-1/2 percent. I perhaps should also say that the majority of the
Committee is in the upper part of the 1-1/2 to 2 percent range that
we've written down for real GNP, placing you a shade higher than the
staff forecast.
Friday's labor market data, addressed in chart 4, may provide
some support for a stronger forecast. The upper left panel portrays
recent trends in employment growth. I've used 3-month averages to
filter some of the noise, but even on this basis the surprising spurt
last month in private job growth outside manufacturing shows through
clearly. Because we, like others, are inclined to discount the January
jumps in construction and retail jobs, our reading of the data is that
nonmanufacturing employment is still on a trend of moderate
deceleration. In manufacturing, the temporary layoffs at auto plants
last month exaggerate the picture, but employment has been falling
gradually since mid-1989, as factory productivity growth evidently has
been generally maintained in the face of slowing output.
The graph of production worker hours at the right conveys a
similar impression of the disparity between manufacturing and other
sectors. Even discounting somewhat the rise in total hours last month,
until we get additional information, we'd have to say that the data do
suggest some upside risk to the first-quarter GNP forecast. On the
other hand, the manufacturing component of the hours figures provided no

- 4 -
surprise. Between the effects of the auto cutbacks and lower
electricity generation associated with warmer weather, we were, and
still are, looking for a decline of more than a percentage point in
industrial production in January. Given the scheduled rebound in auto
assemblies and the orders trends indicated in the middle panel, we think
it likely that the January decline in IP will be recouped over the-next
couple of months.
All told, then, we don't see much sign that the negative
elements in the economy are gathering recessionary force, and, at the
turn of the year, the now-famous recession probability measures were
quite low.
One reason that more pronounced weakness in activity hasn't
emerged is that household income growth has been well maintained, and
consumer spending has held up. As you can see in the upper right table
in chart 5, real spending did not grow as much last year as disposable
income, but this was in good part a reflection of the quarter-to-quarter
gyrations in auto sales, which pushed total outlays for goods sharply
lower in the last months of 1989. Because we think employment growth
will be constrained in the period ahead, we foresee a distinct slowing
in income gains, which should hold down growth in consumer expenditures,
especially for goods.
We do not anticipate any major shift in consumers' willingness
to spend what they've got. Surveys for January provided mixed signs on
the direction of change in consumer sentiment; there does seem to have
been some erosion in confidence about the future strength of the
economy. But it is interesting to note that, notwithstanding talk about

-5-
declining home prices and consumer debt problems, consumers' assessments
of the changes in their financial situation--charted in the middle left
panel--maintained the favorable balance observed throughout this
expansion.
The middle right panel highlights the fact that one part of our
forecast of sluggish consumer spending growth is an expectation that
demand for motor vehicles is likely to be relatively subdued, partly
because households have stocked up considerably in recent years. This
is especially bad news for the Big Three automakers; as the chart
indicates, given the competition from transplants and imports, the Big
Three have borne the brunt of the overall decline in sales since 1986
and they are saddled with a good deal of excess capacity that will have
to be shed over the next few years.
The gearing down in the auto industry is one of the constraints
we see on employment and income growth in the months and quarters ahead.
Another expected drag on job and income creation is likely to be the
construction business. The lower panels of this chart indicate our
forecast for housing starts. Basically, we don't expect to see any
major changes in the pace of activity, in an environment of high after-
tax real mortgage rates, at least temporarily constrained availability
of construction credit, some overhang of vacant units, and--at the cost
of some circularity in the story--weak income growth.
We have also forecast a rather flat picture for business fixed
investment, shown in the next chart. The normal accelerator effects of
slower final demand growth on investment are reinforced by the adverse

- 6-
movements in profits and cash flow, and thus we have only modest
increases in total BFI in 1990 and 1991.
Such gains as there are seem likely to occur in the equipment
category. Recent orders data, displayed in the middle left panel, have
been more favorable, and we also should see some pickup in business
purchases of motor vehicles in the first part of this year. Many
companies will feel the competitive necessity to update their
facilities, and especially after the trade picture begins to improve
again, industrial firms may move more aggressively to acquire new
equipment.
Industrial construction projects started in the past couple of
years may provide some support to overall nonresidential building
activity in the period ahead, but the overhang of commercial space and
the less hospitable financial environment suggest that the downtrend in
new contracts shown at the right is likely to be extended. We're
expecting a very weak office and other commercial sector to drag down
total spending on nonresidential structures through 1991.
In the short run, however, the category of business spending
that leaves the greatest mark on the GNP forecast is inventory
investment. The downtrend in the manufacturing stock-to-shipments ratio
stalled out last year, and, in an environment where supplies are more
readily available there probably is a desire to trim that ratio further.
The rise in the retail stock-to-sales ratio, even after autos are
excluded, suggests perhaps a clearer need for some adjustment. As you
can see at the right, we have forecast a marked swing in inventory
investment in the first part of 1990. If we've got that right, then the

- 7 -
inventory correction we believe is underway may be over by midyear,
removing a significant impediment to more rapid GNP growth.
One impediment that will remain, however, is the contraction of
defense spending. As may be seen at the top of chart 7, we are
projecting small but significant declines in real defense purchases this
year and next. These are great enough to pull down total federal
purchases, listed at the right.
The middle panel puts our defense forecast in perspective by
comparing the path of nominal military expenditures that we have
projected with that proposed by the President and the Administration
baseline. We are expecting the budget that ultimately is passed to
entail lower spending authorizations than are contemplated by the
President's budget, continuing the pattern of recent years. The
proposed spending cuts have been widely characterized as being on the
small side, especially in the strategic weapons category, where some
expensive programs are likely to attract Congressional pruning shears.
In the state and local sector, budgetary problems also suggest
some constraint on spending. Given pressing needs, real purchases have
maintained a moderate growth path over the past two years in the face of
mounting operating deficits. We have forecast a combination of some
deceleration in spending growth and tax increases that would diminish
that budget gap over the next two years.
Shifting gears, now, the top panel of chart 8 lays out in the
baldest terms the basic logic of our forecast for inflation. As I noted
earlier, we do not expect that there will be much change in the pace of
price increase over the next two years. This is because we believe that

- 8-
the level of resource utilization in the economy is an important
determinant of wage and price behavior, and the experience of the past
couple of years suggests that some greater slack will be necessary if a
disinflationary trend is to be restored. Now, you may note in the chart
that we have not seen any significant acceleration in the past year or
so in the CPI ex food and energy, even though, by our reckoning, the
unemployment rate has edged below the natural rate; we believe that at
least a partial explanation for that fact is to be found in the strength
of the dollar through the first half of 1989. We have since experienced
a reversal of the dollar's appreciation, import prices have begun to
firm, and we are anticipating some extension of that trend. Thus it is
that we don't foresee an immediate deceleration of prices as some slack
emerges later this year and in 1991.
The bottom panels focus on a couple of other factors that will
be shaping overall price trends in the period ahead. With respect to
food, we think there will be a major spike in the first quarter, much of
which will be reversed in the second quarter or so. Beyond that period,
assuming normal harvests and better dairy output, we are projecting that
food price increases will run between 3-1/2 and 4 percent per annum,
considerably below the pace of the past two years.
Energy is a somewhat similar story: a first-quarter bulge,
followed by a second-quarter reversal. However, in light of recent oil
market developments, which Ted will discuss later, the underlying trend
of energy prices in this forecast is a little less favorable than in the
last.

- 9-
Trends in prices and price expectations clearly are an
important factor shaping wage behavior, which in turn is important in
shaping price trends. The latest data on household price expectations,
shown in the top panel of chart 9, do not bode well in this regard. The
Michigan survey indicated a jump in 12-month inflation expectations from
4.6 percent to 5.4 percent. The Conference Board survey showed a
similar movement last month, and it is quite likely that the sudden jump
was the result of the surge in food and fuel prices. Even if fully
reversed next month, however, it is clear, I think, that there is no
expectation out there that inflation will be cut below the 4 to 5
percent range anytime soon.
Under these circumstances, reducing the growth of wages and
total compensation is not likely to be an easy matter. We would
interpret the solid parts of the lines in the middle panel to suggest
that, at best, the trends in wage inflation have not been deteriorating
in the past year or so. The bottom panels provide a little more detail
on the recent behavior. In the goods-producing sector, I think that,
especially in the unionized industries, there has been a tendency to
reverse some of the so-called concessions of earlier years, but despite
hefty increases in benefits costs, overall compensation increases have
remained comparatively moderate. In services, cost increases have
continued to be relatively sizable, but have shown signs of peaking.
Looking ahead, in the middle panel again, the increases in
payroll taxes and the minimum wage are, of course, a significant
problem. Thus, with the unemployment rate drifting up rather gradually
in the forecast, it is not until the second half of 1991 that any

- 10 -
diminution in wage inflation becomes clearly visible. The 12-month
changes mask that deceleration somewhat: essentially, we are projecting
that, by the end of next year, ECI compensation will be rising at around
a 4-1/4 percent pace, as compared with the 4-3/4 percent rate of 1989.
*********
PRESENTATION TO THE FEDERAL OPEN MARKET COMMITTEEThomas D. SimpsonFebruary 6, 1990
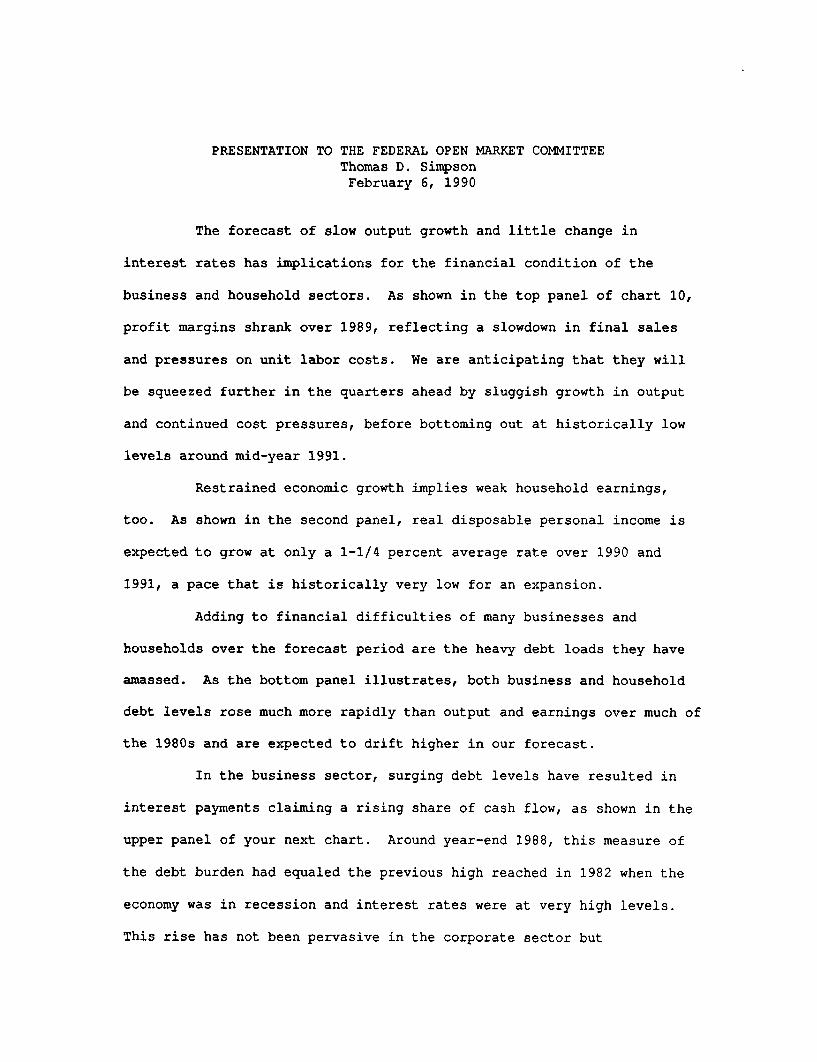
The forecast of slow output growth and little change in
interest rates has implications for the financial condition of the
business and household sectors. As shown in the top panel of chart 10,
profit margins shrank over 1989, reflecting a slowdown in final sales
and pressures on unit labor costs. We are anticipating that they will
be squeezed further in the quarters ahead by sluggish growth in output
and continued cost pressures, before bottoming out at historically low
levels around mid-year 1991.
Restrained economic growth implies weak household earnings,
too. As shown in the second panel, real disposable personal income is
expected to grow at only a 1-1/4 percent average rate over 1990 and
1991, a pace that is historically very low for an expansion.
Adding to financial difficulties of many businesses and
households over the forecast period are the heavy debt loads they have
amassed. As the bottom panel illustrates, both business and household
debt levels rose much more rapidly than output and earnings over much of
the 1980s and are expected to drift higher in our forecast.
In the business sector, surging debt levels have resulted in
interest payments claiming a rising share of cash flow, as shown in the
upper panel of your next chart. Around year-end 1988, this measure of
the debt burden had equaled the previous high reached in 1982 when the
economy was in recession and interest rates were at very high levels.
This rise has not been pervasive in the corporate sector but

concentrated in a minority of firms that have become highly leveraged by
retiring equity. Micro firm data available through 1988 show that, for
most firms, interest payments out of cash flow and leveraging ratios did
not rise much if at all between 1982 and 1988.
Other evidence points to some strains in the corporate sector
largely associated with the bonds of firms that have been engaged in
restructuring. The center left panel illustrates that downgrades of
corporate bonds climbed steadily last year, with most of them for firms
that have leveraged heavily in recent years, and default rates on junk
bonds rose to a recent high last year, as shown in the right panel.
Evidence of an erosion of credit quality is less apparent in
some other important areas of business credit. Delinquency rates on
commercial and industrial loans at commercial banks, the bottom left
panel, were stable through much of last year after declining over 1987
and 1988, although press accounts suggest that the picture may have
changed more recently. Delinquencies on commercial mortgages at life
insurance companies, the lower right panel, have been fairly stable over
recent years--albeit at a historically high level; however, the more
serious delinquencies--those in the process of foreclosure--continued to
rise last year.
A number of observers have expressed concern about the
consequences for corporate defaults and financial disruptions that would
occur in the event the economy turned down, given the greater extent of
leveraging today. The top panel of the next chart sheds some light on
this issue. It presents the results of a staff simulation that produces

the number of firms that could not meet interest payments out of cash
flow, given the structure of firm balance sheets in 1988, if the economy
were to experience an economic contraction of the type experienced in
1973-74 or 1981-82.
The left panel presents the percent of firms that would be
unable to make interest payments out of current earnings in a 1973-74-
type recession. The black bars show the percent of the sample that was
unable to do so in 1972 and then two years later. The red bars show the
simulated percent based on 1988 financial structure. The right panel is
comparable but for a sharper 1981-82-type contraction in output and
profits.
In the case of a 1973-74-type contraction, the left panel, the
number of firms unable to cover interest outlays would be 11 percent in
the 1988 base year and rise to 15 percent two years later, double the
actual number in 1974. Under a 1981-82-type contraction, more than a
quarter of all firms would be unable to meet interest payments out of
cash flow in the second year of the recession, up considerably from the
base year and from the actual number in 1982. I should note that these
figures on the number of firms facing difficulty overstate the amount of
corporate assets that would be involved because a disproportionate share
of firms facing trouble would be small.
These simulation results confirm that the potential for
widespread strains in the corporate sector, should there be a protracted
downturn in activity, is much greater today than in the past. Whether
defaults would rise to the extent implied by these results would depend

-4-
on, among other things, the assets held by these firms and the strength
of relevant asset markets.
Recent events have tended to focus creditors' attention on the
risks of default. Over the past several months, the junk bond market
has been jolted by some well-publicized difficulties of highly leveraged
firms, most recently the Moody's downgrade of RJR bonds. As shown in
the left center panel, the average spread on junk bonds over 30-year
Treasury bonds rose sharply over the latter part of 1989. Moreover,
tiering in this market has become more pronounced as investors in junk
bonds have become highly selective.
At commercial banks, there does not appear to have been in
1989 a significant generalized tightening of credit to businesses.
Spreads of rates on fixed and floating rate business loans over base
rates, the right panel, showed little evidence of widening.
However, a more recent survey of business loan officers at
large commercial banks, summarized in the lower panel, indicates that
bankers have become noticeably more cautious in some areas of business
lending. A large share of the respondents indicated that they had
tightened terms over the past six months on loans for corporate
restructuring purposes and on loans to below investment-grade customers
while leaving essentially unchanged the terms on loans to investment-
grade borrowers. Tighter terms included shortening of credit lines,
some more restrictive loan covenants, and some widening of rate spreads.
In the area of ADC lending, a large proportion of the bank respondents
mentioned less willingness to lend, although a number also mentioned

-5-
that they had taken on some former thrift customers--at least the
better-quality ones. Thus, at this point it would appear that, while a
generalized business credit squeeze has not emerged at banks, banks
appear to have become more selective and cautious lenders.
In the household sector, debt service payments are estimated to
have risen to about 20 percent of disposable income last year, as shown
at the top of the next page, and are projected to hold around this level
over the forecast period. Delinquency rates, shown in the center
panels, indicate some difficulties in meeting credit obligations.
Delinquencies on consumer loans at banks and auto loans at finance
companies, on the left, were both up appreciably last year. For
technical reasons, the bank series may overstate the degree of
deterioration in the third quarter of last year, but these series are
quite high by historical standards. Mortgage delinquencies of 60 days
or longer, the right panel, edged up in the third quarter of last year
but remained noticeably below recent highs of the mid-1980s.
In reflection of recent and prospective difficulties, lenders
have been tightening terms on consumer and residential mortgage loans,
as suggested by rate spreads and loan-to-value ratios on automobile
loans and ARMs in the lower panel. Similarly, surveys of bank lenders
suggest that their enthusiasm to make consumer loans diminished last
year. It should be noted that ARM customers frequently are less
qualified borrowers, and the recent tightening of terms may have
displaced some borrowers from the housing market. More generally, the
extent of tightening of credit to the household sector appears to have

-6-
been fairly limited to date but could become more of a factor if debt
servicing strains were to result in delinquencies moving higher.
In our forecast, we anticipate some further erosion of credit
quality in the near term and are assuming that lenders and other
investors will maintain a cautious and selective posture. Tighter
credit conditions will continue to be most evident in the more
vulnerable areas--highly leveraged corporate borrowers and overbuilt
real estate markets--and less of a factor in other areas. However,
there is a risk in the forecast that credit quality problems will be
greater than are now foreseen or that lenders will otherwise become more
restrictive. As the economy strengthens next year and the outlook for
earnings improves, strains could begin to ease.
Reflecting both a pronounced slowing in corporate borrowing to
finance restructuring and soft household demands for consumer durables
and housing, growth in private debt, shown in the upper panel of your
next chart, is projected to continue to moderate this year and next to a
historically slow pace. Declining federal deficits similarly will hold
in federal debt growth to the slowest pace since the mid-1970s, absent
the financing of RTC's working capital needs indirectly through the
Treasury.
Together, these paths for private and federal debt growth lead
to further deceleration in total debt of nonfinancial sectors, shown in
the bottom panel, moving into close alignment with growth in nominal GNP
next year. Debt growth of 7 percent projected for this year and
6-1/2 percent next year would be the slowest since 1970.

E.M. TrumanFebruary 6, 1990
Chart Show Presentation -- International Developments
The first international chart, in the upper left panel,
illustrates the 10 percent depreciation of the dollar on average
against the other G-10 currencies since the middle of 1989. The
data in the box at the right show that the dollar has fallen
15 percent against the DM over the past seven months; part of
that decline has been related to the rapid changes in Eastern
Europe and the widespread perception that Germany will receive a
disproportionate economic benefit from those changes. The dollar
declined less against sterling in recent months and has been
essentially unchanged, on balance, against the yen, Canadian
dollar, and the currencies of South Korea and Taiwan.
As Mike noted in his introduction, we are projecting a
moderate depreciation of the dollar over the forecast period.
The main factors underlying this projection are the lack of
progress in external adjustment through much of the period and
the associated growing stock of net claims on the United States.
However, the rate of depreciation built into our forecast --
5 percent at an annual rate from the January level -- is a crawl
compared with the pace since the dollar's peak last June.
The dollar's recent decline has been associated with a
growing gap between U.S. real long-term interest rates and rates
in the other G-10 countries -- the bottom-left panel. That gap
was positive for most of 1988 and the first half of 1989, while

- 2 -
the dollar was rising, but it turned negative thereafter and now
is as wide as it was in late 1986 and early 1987 when the dollar
was under considerable downward pressure. As is shown in the box
at the right, while U.S. nominal long-term interest rates have
been essentially unchanged on balance since June, long rates in
Germany and Japan have risen by 100 to 150 basis points under the
influence of continued rapid growth, mounting inflation worries,
and increased monetary restraint.
The top panels in the next chart summarize recent
developments in the six major foreign industrial countries,
divided into two groups.
In one group -- Japan, Germany and France -- industrial
production (left panel) rose at a somewhat slower pace in 1989
than in 1988 as monetary policies were tightened; at the same
time inflation (right panel) picked up somewhat under the
influence of strong growth and increased pressures on capacity,
higher oil prices, increases in consumption taxes in Japan and
Germany, and weaker currencies. In the other group of countries
-- the United Kingdom, Canada and Italy, shown by the red lines
in the charts -- the broad contours are similar; growth of
production has slowed and inflation has leveled off after rising
earlier. In the United Kingdom and Canada, relatively early
monetary restraint contributed to sharper deceleration of growth
in 1989 and the recent leveling of inflation.
The middle panel provides a longer-term perspective on
commodity prices -- excluding crude oil. In dollar terms, prices
have declined from their highs in early 1989 but have backed up

- 3 -
somewhat in recent weeks. In foreign-currency terms, the overall
decline in commodity prices since early 1989 has been somewhat
steeper, reflecting the depreciation of the dollar on balance
over the period.
Against this background, the bottom panel presents our
assessment of the stance of economic policies abroad. First,
although inflation has been flat recently, in most countries
policy makers remain concerned about capacity pressures.
Moreover, in several countries, upcoming wage negotiations may
have a crucial influence on the inflation outlook and on the
stance of policies. Second, we are assuming that monetary
policies will remain tight over the first half of the year with
little change in interest rates except, possibly, a slight
further increase in short-term rates in Germany; we expect a
gradual decline in interest rates over the second half of the
year and into 1991, as inflation eases abroad and the dollar
declines. Third, fiscal policy is expected generally to be
neutral; however, in Germany, tax reduction along with increased
spending related to the influx of immigrants from Eastern Europe
should provide some fiscal stimulus, adding somewhat to pressures
on interest rates.
Chart 17 summarizes our outlook for economic activity
and inflation abroad. The top panels show that we are projecting
a slowing this year in the expansion of real GNP in the major
foreign industrial countries; the slowing in the average stems
from very low growth projected for the United Kingdom and Canada.
However, on average, growth should remain faster than in the
- 4 -
United States and is projected to pick up next year. The data in
the box at the right indicate that domestic demand in these
countries is expected to outpace growth of real GNP.
As for economic activity in all foreign countries as a
group, shown in the middle panel, the slowdown in growth last
year was, in part, the consequence of slower growth among the
developing countries, especially in Asia. We are expecting a
modest pickup this year in growth in the developing countries,
which should temper the projected slowdown in the foreign
industrial countries.
The bottom panel presents our outlook for consumer
prices in the major foreign industrial countries. After rising
on average almost as much as in the United States in 1989,
consumer prices abroad are projected to increase less this year,
especially in Canada and the United Kingdom. The data in the
box at the right show that, over the next two years, inflation in
the major industrial countries is projected to average about a
percentage point less than in the United States, partly because
of the projected appreciation of these countries' currencies
against the dollar.
Turning to the U.S. trade outlook, the top panel of the
next chart summarizes recent and prospective developments in
agricultural exports. Last year saw falling prices and a sharp
recovery of agricultural shipments, following the effects of the
drought in 1988. We are looking for only a modest increase in
the value, price and volume of agricultural exports this year and
next.

- 5 -
Exports of computers -- the middle panels -- slowed
considerably in 1989. We are projecting a modest pickup in such
exports over the forecast period, but do not now expect anything
like the rapid pace of expansion seen earlier in the 1980s.
Meanwhile, quality-adjusted prices are expected to continue to
decline, holding down the increase in the value of such exports.
Other nonagricultural exports, shown in the lower panel,
were affected in the fourth quarter of last year by the Boeing
strike. However, the quantity of these nonagricultural exports
continued to rise at a double-digit pace for the year as a whole.
The quantity of exports this year will be boosted by
Boeing shipments in the first quarter and, later in the year, by
the dollar's depreciation. Prices of these exports are projected to
rise somewhat less than the overall domestic price level.
Chart 19 considers non-oil imports. As is shown in the
box at the left of the top panel, prices of all categories of
imports fell last year, or rose more slowly, than in 1988,
primarily due to the influence of the strong dollar. As can be
seen from the data in the box at the right, while the increase in
the total quantity of non-oil imports was greater in 1989 than in
1988, generally reflecting the influence of lower prices, the
year-to-year changes in individual categories were mixed.
As shown in the middle panels, we are projecting
continued increases in imports of computers, though at slightly
smaller rates than for exports of computers.
With respect to other non-oil imports -- the bottom
panels -- partial data suggest imports of consumer goods and

- 6 -
industrial supplies rose in the fourth quarter of last year and
that some of the increase went into inventories; we expect that
excess will be worked off in the first quarter. Fundamentally,
rising prices for non-oil, non-computer imports, as a consequence
of the recent and projected depreciation of the dollar, should
produce a slowing in the growth of these imports in real terms.
This year, slower growth of domestic economic activity helps,
along with improved U.S. price competitiveness, to hold down
the expansion in imports, while next year the cumulative
improvement in price competitiveness tends to offset the effect
of faster U.S. growth.
A familiar wildcard in our outlook involves imports of
petroleum and products. The top panel in the next chart provides
a longer-term perspective on U.S. import prices in relation to
the spot price for West Texas Intermediate. We expect that the
recent run-up in spot prices will produce a spike in the import
price in the first quarter at about $19.70 per barrel. Once
these temporary factors are out of the way, the price should drop
back to $18 per barrel by the end of the year.
As usual, a number of factors could produce dramatically
different oil prices over the forecast period; however, our basic
assumption is that oil prices are likely to be rising slowly in
real terms over the 1990s. As is illustrated in the middle
panel, the share of OPEC in free world oil production dropped
between 1979 and 1985 from more than 60 percent to about 40
percent. However, since the low point in 1985, OPEC's share has
risen back close to 50 percent, with a notable increase in the

- 7 -
share of the Persian Gulf producers. We believe that this trend
is likely to continue and to provide Persian Gulf producers
with greater scope to coordinate and restrict output.
As far as U.S. imports of oil are concerned, the bottom
panel, further declines in U.S. production are projected to
combine with rising prices to produce a rise in our import bill
to about $60 billion dollars at an annual rate by the end of
1991.
The last chart summarizes the staff's outlook for the
U.S. external accounts. As can be seen from the red line in the
top-left panel, we are projecting little net improvement in the
current account balance this year from the deficit of about $110
billion now estimated for 1989. However, we are projecting an
improvement in 1991 to a deficit of about $90 billion by the
fourth quarter. The deficit for the entire year would be at the
lower end of the range of $95 to $125 billion that has been
projected by the Administration.
Cutting through the influence of special factors that
affected the fourth quarter of last year and will affect the
first quarter of this year, we are projecting a small
contribution to real GNP this year from net exports of goods and
services and a larger contribution next year, as the effects of
the dollar's recent and projected depreciation cumulate.
The bottom panel summarizes U.S. capital account
transactions over the past three years and presents a projection
for 1990. Net private capital inflows (line 1) remained strong
in 1989, especially net inflows in the form of net purchases of

- 8 -
bonds and stocks (line 3). Inflows through banks (line 2) were
somewhat smaller than in 1988. This may have been related to the
liquidation by the G-10 countries of dollar holdings in the
Euromarkets to finance intervention sales of dollars (negative
purchases, line 12), which, at $72 billion, were large relative
to the $31 billion in official capital outflows shown in lines 7
and 8.
This year, with an essentially unchanged current account
deficit, we are projecting a net inflow of official capital
(line 6) and somewhat less in the way of net private capital
inflows.
Mr. Chairman, that concludes our presentation.

STRICTLY CONFIDENTIAL (FR) CLASS I-FOMC
Material for
Staff Presentation to theFederal Open Market Committee
February 6, 1990

Chart 1
Basic Policy Assumptions
* Monetary policy will be aimed at achieving a reduction in inflationover time, in the context of continued economic expansion.
* Fiscal policy will remain moderately restrictive.
-- For FY91, a deficit-reduction package of about $30 billion
-- No dramatic multi-year budget accord
Financial Projections
* Interest rates do not move far from recent levels; they may averagea little higher in 1991 than in 1990.
* M2 will grow around 6-1/2 percent in 1990 and 6 percent in 1991.
* Federal budget deficit will decline from $152 in FY89 to $137 inFY90 and to $118 in FY91.
* The dollar will depreciate moderately over the next two years.

Chart 2
REAL GNP
Drought Adjusted
Percent change, SAAR
6
1988 1989
CIVILIAN UNEMPLOYMENT RATE
1990
19884
1989
2 1990
1991
Percent changeQ4 to Q4
DroughtAdjusted Actual
4.0 3.4
1.9 2.4
1.6 1.6
2.3 2.3
1991
Percent
1988
INFLATION
1989 1990
6
5
04 level
1988
1989
1990
1991
Percent change, Q4 to Q4
Consumer Price Index
Fixed-weight GNP Price Index (Second bar)
1988
1989
1990
1991
Percent changeQ4 to Q4
Fixed-weightCPI GNP
4.3 4.5
4.5 4.1
4.4 4.2
4.5 4.3
1988 1989 1990

Chart 3
ECONOMIC PROJECTIONS FOR 1990
FOMC
RangeCentral
Tendency Administration
Percent change, Q4 to Q4
Nominal GNP
July 1989 forecast
Real GNP
July 1989 forecast
CPI
July 1989 forecast
4 to 7
4-1/4 to 7-1/2
1 to 2-1/4
1 to 2-1/2
3-1/2 to 5
3 to 5-3/4
5-1/2 to 6-1/2
5-1/2 to 6-3/4
1-1/2 to 2
1-1/2 to 2
4 to 4-1/2
4-1/2 to 5
Average level, Q4, percent
Unemployment Rate
July 1989 forecast
5-1/2 to 6-1/2
5 to 6-1/2
5-1/2 to 5-3/4
5-1/2 to 6
Staff

Chart 4
PRIVATE PAYROLL EMPLOYMENTChange, 1000s
Three Month Moving Average
Other
Manufacturing
1988 1989
300
200
PRODUCTION WORKER HOURSIndex, 1977=100 Index, 1977100
(diamond is quarterly average)
Total
100
98
96
130
128
Manufacturing
1988 1989
ADJUSTED DURABLE GOODS ORDERS AND INDUSTRIAL PRODUCTIONIndex, 1977100 Billions of dollars, s.a.
Adjusted Orders(moving average of previous three months' data)
Jan.est.
Total Industrial Production
1986 1987 1988 1989
RECESSION PROBABILITY RECESSION PROBABILITY
Stock - Watson (NBER)
1987 1988
0.8
0.6
0.4
02
1987 19881989 1989

Chart 5
PERSONAL CONSUMPTION EXPENDITURESPercent change from previous quarter, annual rate
Percent changeQ4 to Q4
TotalPCE
1988 3.8 4.0
1989 2.3 3.6
5 1990 2.0 1.2
1991 1.6 1.4
1988 1989 1990 1991
PERSONAL FINANCIAL SITUATIONPercent
SRC Survey
Better Than Year Ago
Worse
1985 1986 1987 1988 1989
HOUSING STARTS
25
COMPOSITION OF CAR SALES
Transplants (Top segment)
Imports (Middle segment)
Big 3 (Bottom Segment)
1986 1987 1988 1989 1990 1991
Million units, SAAR
Single-family
Multifamily
1985 1986 1987 1988 1989 1990 1991
Total Starts
Millions of units, SAAR
1985 1.74
1986 1.81
1987 1.62
1988 1.49
1989 1.37
1990 1.34
1991 1.33
Millions
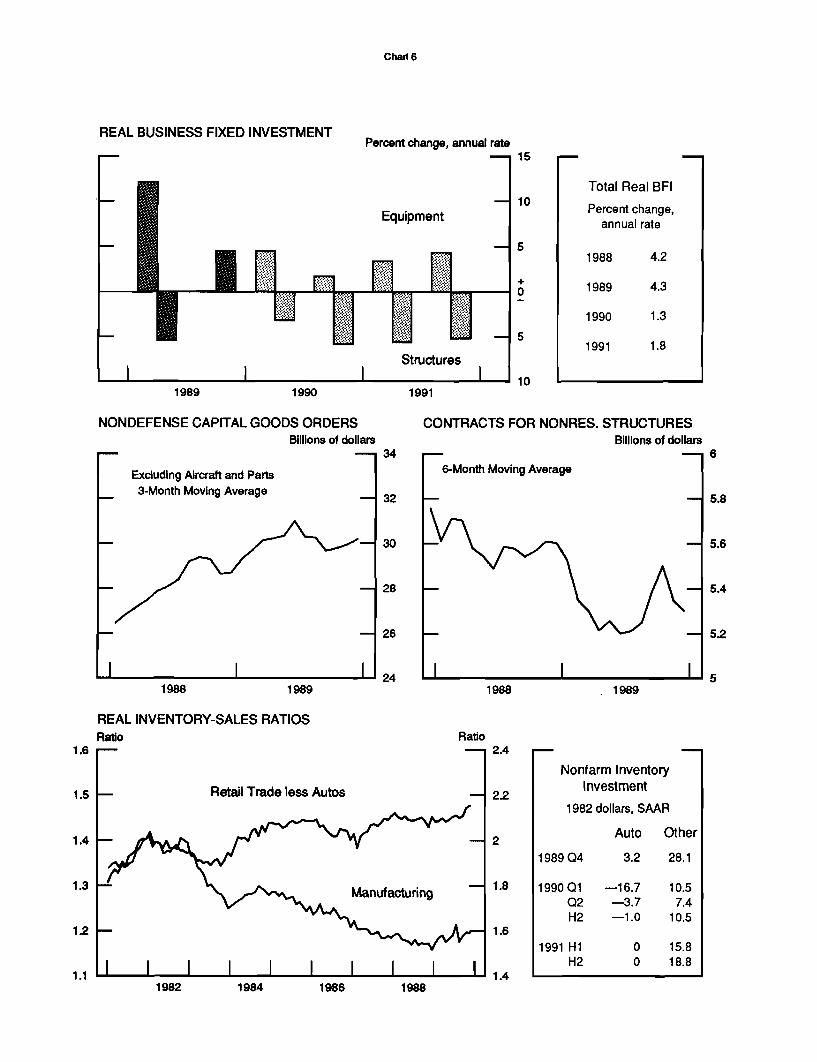
Chart 6
REAL BUSINESS FIXED INVESTMENTPercent change, annual rate
1989 1990 1991
NONDEFENSE CAPITAL GOODS ORDERSBillions of dollars
15
10
5
+0
5
10
Total Real BFI
Percent change,annual rate
1988 4.2
1989 4.3
1990 1.3
1991 1.8
CONTRACTS FOR NONRES. STRUCTURESBillions of dollars
1988 1989 1988 1989
REAL INVENTORY-SALES RATIOSRatio Ratio
1984
Nonfarm InventoryInvestment
1982 dollars, SAAR
Auto Other
1989 Q4
1.8 1990 Q1Q2H2
3.2 28.1
-16.7-3.7-1.0
1991 H1H2
1982 1986 1988

Chart 7
REAL FEDERAL PURCHASES
Defense
Nondefense less CCC (Second bar)
Percent change, Q4 to Q4
6
1988 1989 1990 1991
Percent changeQ4 to Q4
TotalTotal ex. CCC
1988
1989
1990
1991
-. 3
-3.0
-. 5
-1.5
-. 1
-2.3
-1.6
-1.5
MILITARY EXPENDITURESBillions of dollars
Administration Baseline
320
Administration ProposalGreenbook
1985 1986 1987 1988
REAL STATE AND LOCAL PURCHASES
1989 1990 1991 1992 1993 1994
Percent change, Q4 to 04
4
1988 1989 1990 1991
2
State and LocalOperating Deficit
Billions of dollars
1988 21.4
1989 33.0
1990 38.9
1991 28.1

Chart 8
"UNEMPLOYMENT GAP" AND INFLATION
CPI ex Food and Energy (Top data line)Natural Less Actual Rate of Unemployment
1967 1970 1976 1979
4-quarter percent change
1982 1985 1988 1991
Percent change, SAARCPI- ENERGY
Percent change, SAAR
3
1989 1990 1991 1989 1990 1991
CPI- FOOD
1989 1990 1991 1990 19911989

Chart 9
CONSUMER INFLATION EXPECTATIONS FOR YEAR AHEADPercent
Michigan SRC Survey
1982 1984 1986 1988 1990
EMPLOYMENT COST INDEXES - PRIVATE INDUSTRY12-month percent change
Total
Wages and Salaries
1982 1984 1986 1988 1990
ECI - GOODS PRODUCING12-month percent change
Total
Wages andSalaries
1984 1985 1986 1987 1988 1989
ECI - SERVICE PRODUCING12-month percent change
8
Total
4 4Wages and
Salaries
1984 1985 1986 1987 1988 1989
9
6
3
6

Chart 10
CORPORATE PROFITS BEFORE TAXPercent of Gross Domestic Business Product
Nonfinancial Corporations
8
4
1970 1973 1976 1979 1982 1985 1988 1991
REAL DISPOSABLE PERSONAL INCOMEPercent change, Q4 to Q4
1970 1973 1976 1979 1982 1985 1988 1991
DEBT RATIOS
Household Debt Relative to DPI
NF Corporate Debt Relative toGross Domestic Business Product
Percent100
70
55
1970 1973 1976 1979 1982 1985 1988 1991

Chart 11
INTEREST PAYMENTS RELATIVE TO CASH FLOW*
Nonfinancial Corporations
Percent50
30
20
1970 1973 1976 1979 1982
* Gross interest payments relative to cash flow including interest payments.
RATING CHANGES ON CORPORATE BONDS DENumber
300
Downgrades
82
DEFAULTS ON LOW-RATED BONDSPercent of outstanding
225
150
Upgrades
1979 1981 1983 1985 1987 1989
Moody's series
DELINQUENCY RATESPercent
1979 1981 1983 1985 1987 1989
1987 excludes Texaco.
DELINQUENCY RATESPercent
C & I Loans at Commercial Banks(seasonally adjusted)
10
8
Q3
4
1983 1985 1987 1989 1981 1983 1985 1987 1989
Delinquent loans include loans In the process of foreclosure.
1985 1988 1991

Chart 12
1973-74 Type Recession
FIRMS WITH INTEREST EXPENSE EXCEEDING CASH FLOWPercent of sample
30Recession
1972 Structure
1988 Structure (Second bar)
1981-82 Type Recession
1980 Structure
1988 Structure (Second bar)
Percent of sample30
Base year Second year ofRecession
Base year Second year ofRecession
JUNK BOND SPREADBasis points
1980 1983 1986 1989
1000
800
600
400
200
0
Merrill Lynch series
SPREADS ON C & I LOANS AT BANKSBasis points
Loan Rate lessFederal Funds Rate(floating rate loans)
Loan Rate less 3-month CD(fixed rate loans)
1987 1988
Survey of Terms of Bank Lending
1989
Summary of January 1990 Senior Bank Loan Officer Survey
* 72 percent had tightened standards for merger and LBO loans.
* 57 percent had tightened standards for below-investment-gradecustomers for other than merger and LBO loans.
* 7 percent had tightened standards for investment-grade borrowersfor other than merger and LBO loans.
* 81 percent had become less willing to make construction loans.

Chart 13
HOUSEHOLD DEBT SERVICE AS A PERCENT OF DISPOSABLE PERSONAL INCOMEPercent
1970 1972 1974 1976 1978 1980 1982 1984 1986 1988 1990
CONSUMER LOAN DELINQUENCIESPercent
All Closed-End Loans(commercial banks)*
1974 1977 1980 1983 1986 1989
* ABA series, 30 day past due.
INTEREST RATE SPREADSBasis points
1
600 98
400 95
200 9
MORTGAGE DELINQUENCIESPercent
Q3
1974 1977 1980 1983 1986
MBA series, 60 days past due.
LOAN TO VALUE RATIOSPercent
5
2
1989
Percent
ARM Mortgages
Auto Loans(finance companies) Q4
200 861984 1985 1986 1987 1988 1989 1988 1989
3
2

Chart 14
DEBT AGGREGATES4-quarter percent change
30
Federal 20
Nonfederal
10
101960 1963 1966 1969 1972 1975 1978 1981 1984 1987 1990
TOTAL DOMESTIC NONFINANCIAL DEBT AND NOMINAL GNP4-quarter percent change
20
Debt15
10
5
1960 1963 1966 1969 1972 1975 1978 1981 1984 1987 1990

Chart 15
FOREIGN EXCHANGE VALUE OF THE U.S. DOLLARRatio scale, March 1973 = 100
Weighted Average*Dollar
Price Adjusted**Dollar
1985 1986 1987
90
1988 1989
Selected DollarExchange Rates
Percent change6/89 to 2/2/90
Deutschemark -15
Yen 1
Pound sterling -8
Canadian dollar -1
S. Korean won
Taiwan dollar
REAL LONG-TERM INTEREST RATES***
United States
Selected Interest Rates
Percent
June1989
Three-monthGermany 6.92Japan 5.35U.S. 9.20
Long-termGermany 6.92Japan 5.08U.S. 8.28
Feb. 21990
8.057.068.20
8.056.588.42
1985 1986 1987 1988 1989
*Weighted average against or of foreign G-10 countries using total 1972-76 average trade.* Adjusted by relative consumer prices.
*** Multilateral trade-weighted average of long-term government or public authority bond rates adjusted for expectedinflation estimated by a 36-month centered moving average of actual inflation (staff forecasts where needed).
Percent

Chart 16
INDUSTRIAL PRODUCTION ABROAD
4-quarter percent change
Japan,Germany, France
6
U.K.,Canada, Italy
1987 1988 1989
CONSUMER PRICES ABROAD
4-quarter percent change
6U.K.,Canada,Italy
2
1987
COMMODITY PRICES*
1988 1989
Index, Jan.1983=100, ratio scale
125
U.S. Dollars
Foreign Currency"
1984 1985 1986 1987 1988 1989
ECONOMIC POLICY ABROAD
* Inflation flat recently; continued concern about capacity pressuresand upcoming wage negotiations.
* Tight monetary stance, with gradual decline in interest rates in1990-H2 and 1991 as growth slows.
* Fiscal policy generally neutral; tax reduction in 1990 and additionalspending in Germany related in part to East European immigrants.
1983
* Federal Reserve Board experimental index excluding crude oil.* Weighted average for the six major foreign industrial countries using 1982 GNP.
4
2
Japan,Germany, France

Chart 17
Percent change, SAAR6
United States*
Foreign Industrial Countries** (Second bar)
4
1990
2
Foreign*
Percent change, Q4 to Q4
DomesticGNP Spending
1988 3.9 4.0
1989 2.9 3.5
1990 2.3 2.7
1991 3.0 3.1
1991
ECONOMIC ACTIVITY: ALL FOREIGN COUNTRIES**4-quarter percent change
1986 1987 1988
CONSUMER PRICES
1989 1990 1991
Percent change
Percent changeQ4 to Q4
Foreign*** U.S.
1988 3.1 4.3
1989 4.3 4.5
1990 3.5 4.4
1991 3.5 4.5
REAL GNP
1989
1986 1987 1988 1989 1990 1991
* Excludes drought effects.** Weighted average using U.S. non-agricultural exports, 1978-83.*** Weighted average for the six major foreign industrial countries using 1982 GNP.

Chart 18
Exports
AGRICULTURAL EXPORTSRatio scale, billionsof 1982 dollars, SAAR
Ratio scale, billionsof dollars, SAAR
Value
Quantity
1986 1987
COMPUTERSRatio scale, billionsof 1982 dollars, SAAR
50
30
1988 1989 1990 1991
Ratio scale, billionsof dollars, SAAR
Percent changeQ4 to Q4
1989 1990 1991
Value 3 7 7
Price -7 4 4
1982$ 10 3 3
Quantity
Value
1986 1987 1988 1989 1990 1991
OTHER NON-AGRICULTURAL EXPORTSRatio scale, billions Ratio scale, billionsof 1982 dollars, SAAR of dollars, SAAR
Percent changeQ4 to Q4
Value
Price
1982$
1989
-4
-11
8
1990
4
-8
13
1986 1987 1988 1989 1990 1991
Value225
Price
1982$
Percent changeQ4 to Q4
1989 1990 1991
12 13 16
1 3 4
11 9 12
50
40
30
1991
5
-8
14

Chart 19
Non-oil Imports
QUANTITIESPRICES
Percent change, Q4 to Q4
1988 19891. Food 4 -10
2. Industrial Supplies 14 -1
3. Computers -1 -11
4. Other Capital Goods 6 -1
5. Automotive 6 2
6. Consumer Goods 5 2
7. Other 7 0
8. Total Non-oil 7 0
NIPA fixed-weight indexes
Percent change, Q4 to Q4
1988
1. Food -5
2. Industrial Supplies -2
3. Computers 11
4. Other Capital Goods 9
5. Automotive 0
6. Consumer Goods 5
7. Other 11
8. Total Non-oil 4
NIPA accounts
COMPUTERSRatio scale, billionsof 1982 dollars, SAAR
Quantity
Ratio scale, billionsof dollars, SAAR
100
70
40
Value
10
1986 1987 1988
OTHER NON-OIL IMPORTSRatio scale, billionsof 1982 dollars, SAAR
40
1989 1990 1991
Ratio scale, billionsof dollars, SAAR
450Value
Quantity
Percent changeQ4 to Q4
1989 1990 1991
Value 24 2 3
Price -11 -8 -8
1982$ 39 11 11
500
Percent change450 Q4 to Q4
4001989 1990 1991
350 350 Value 2 6 8
300 Price 0 5 6
1982$ 3 2 2
1986 1987 1988 1989 1990 1991
198911
-1
39
8
-10
6
4
7
400
350
300

Chart 20
Petroleum and Products
PRICESDollars per barrel Dollars per barrel
Spot PriceWest Texas Intermediate
U.S. Import Price
30
20
10
1982 1983 1984 1985 1986 1987 1988 1989 1990 1991
FREE WORLD OIL PRODUCTIONPercent of total
OPEC
40
United States
201979
U.S. IMPORTSRatio scale,million barrels per day
11
9
1985 1989
Ratio scale,billions of dollars
Quantity
Value
1986 1987 1988 1989 1990 1991
1991
100Q4 Level
Price($/barrel)
MBD
1988 12.85 7.8
1989 17.60 8.3
1990 18.00 8.4
1991 19.25 8.8
60
40
20
5

Chart 21
U.S. External Accounts
EXTERNAL DEFICITSBillions of 1982 dollars Billions of dollars
1985 1986 1987 1988 1989 1990 1991
Billions of dollarsAnnual rate, Q4
MerchanTrade
CurrentAccount
Real NetExports
1989 1990 1991
Merchanise-125 -111 -96
-121 -109 -90
-62 -40 -8
* Excludes capital gains and losses.
U.S. CAPITAL TRANSACTIONS
Billions of Dollars, Net Inflows - +
1987
1. Private Capital, net
2. U.S. Banking Offices 1
3. Bonds and Stocks 1 2
4. Direct Investment 2 35. Other Flows6. U.S. and Foreign Official Assets
7. United States 1 (increase = -)8. Other G-10 Countries9. Other Countries10. Statistical Discrepancy
Memo:11. Current Account 312. U.S. and Other G-10 net Purchases of Dollars
-16097
1988
105
21
36
43
532
-716
23-11
1989 1990
88
12
45
26
5-16
-27-415
37
-126 -1092 -72
-107n.a.
1. The refinancing of foreign governments' military sales debt through the sale of securities guaranteed by the U.S.government has been excluded from changes in U.S. government assets, U.S. purchases of foreign securities, andchanges in bank custody claims on foreigners.
2. Transactions with finance affiliates in theNetherlands Antilles have been excluded from direct investment and added toforeign purchases of U.S. securities.
3. Excludes capital gains and losses.e = estimatep = projection

February 6, 1990
Long-run Ranges BriefingDonald L. Kohn
The Committee's decision about its monetary objectives for
1990, may be subject to a bit more scrutiny than in recent years. The
public discussion and debate of the Federal Reserve's price stability
objective and the costs of achieving it have heightened interest in the
Committee's medium-term strategy. For example, the Senate Banking
Committee, in its letter of invitation to the Chairman for his forthcom-
ing testimony, posed questions about how our annual targets fit into our
plans to achieve price stability, and about the implications of this
objective for growth and resource utilization.
The question of costs was discussed extensively at the last
meeting, and is raised again in the context of longer-term strategies,
which I will be getting to in a minute. The relationship of annual
money targets to long-term goals is, unfortunately, complex. Year-to-
year growth rates in money may not convey, in a way that can be easily
understood, the underlying objective of monetary policy. This can be
seen quite clearly in the staff forecasts of money and debt growth rates
for 1990 consistent with the greenbook forecast, which are shown in the
right hand column of the table on page 12 of the bluebook. Although
that forecast involves some restraint on underlying inflation pressures,
M2 growth is expected to accelerate from the 4-1/4 to 5-1/4 percent
range of the last three years to around 6-1/2 percent this year. The
faster growth of M2 in the forecast occurs because of a judgment that
underlying demands for goods and services have been sufficiently damped,

largely by past monetary restraint, that price pressures can be held in
check without significant further upward movement of interest rates in
1990. The forces imparting an upward bias to money velocity in the past
several years will no longer be operating, and money growth will be more
in line with spending. In fact, the staff expects a small decrease in
velocity this year, of less than 1 percent, owing to the lagged effects
of declining interest rates over the second half of 1989. I might note
that the risks around the M2 projection are probably more heavily
weighted toward somewhat less growth than somewhat more. The shortfall
would occur if deposit offering rates are reduced more than expected--by
banks flooded with thrift core deposits, and by thrifts with renewed
access to RTC funds to paydown high-cost liabilities.
With respect to M3 and debt, we see the opposite pattern devel-
oping--that is, a damping of growth that is out of proportion to the
policy restraint assumed in the forecast. For M3, this reflects the
effects of the working out of the thrift situation, involving a major
restructuring of mortgage flows in credit markets, with a much lower
than usual fraction of mortgage assets ending up in the portfolios of
depository institutions and financed with M3. We are projecting only
4 percent M3 growth this year, extending the atypical relationship of
this aggregate to M2 and spending that developed in the second half of
1989 when the thrift industry began to shrink in earnest. Debt is ex-
pected to decelerate from 8 to 7 percent in 1990. Nearly half of this
slowdown is attributable to an assumed decrease in debt issuance to
retire corporate equity, rather than a contraction of underlying finance
available to support spending.

The complex relationship of yearly money growth to developments
in the economy and inflation also can be seen in the alternative policy
simulations shown on page 8 of the bluebook. Even in the tighter strat-
egy II, M2 running a little above its average pace of recent years is
consistent with a drop in inflation to 2 percent by 1994. This pattern
partly reflects a relatively stable path for nominal GNP, with output
depressed initially and picking up later, while prices slow with a lag.
In addition, however, it is a function of declines in interest rates and
velocity as inflation moderates, so that the same money growth supports
slower nominal spending in the transition period to price stability.
This is an aspect of the so-called re-entry problem, in which, to avoid
precipitating deflation, M2 must be allowed to expand faster than its
long-run equilibrium growth rate for a time as nominal and real interest
rates fall when price stability is approached. To the extent the drop
in interest rates since the middle of last year reflected a decrease in
inflation expectations, so that restraint in terms of real interest
rates can be maintained at lower nominal interest rates, stronger M2
growth in 1990 can be seen as a taste of the kinds of counter-intuitive
money growth paths that may be associated with attaining price
stability.
A few other points are worth noting about the simulations.
First, they start from the presumption that the unemployment rate has to
rise from current levels to keep inflation from accelerating in an un-
derlying sense. This can be seen most clearly in the easier strategy
III, in which, despite economic growth below potential and a small rise
in the unemployment rate this year, inflation is little changed in later

years aside from the effects of dollar depreciation through 1991. To
relieve pressure on resource use sufficiently to damp inflation probably
requires some upward movement in real interest rates, though the size of
the increase is not large, at least in the baseline.
Second, because of the starting point, and also the implied
short-run trade-offs in the model between resource utilization and in-
flation, a sustained period of subpar growth would be needed over the
next few years to make substantial progress in curbing inflation, as
under the tighter strategy II. However, the model makes no allowance
for changes in Federal Reserve credibility as markets measure our ac-
tions against our rhetoric. Maintaining a taut policy under this
strategy, even as the unemployment rate rises, might induce business and
workers, as well as financial market participants, to give greater
weight to our stated long-run objective, speeding the reduction in in-
flation expectations. Thus, even though none of the simulations pre-
sented show price stability in the 5-year horizon, the resource utiliza-
tion path of strategy II might actually have a good chance of closely
approaching price stability at or just beyond 1994.
Although money growth rates do not translate easily into, say,
inflation intentions, the choice of objectives for 1990 can convey some-
thing about the Committee's medium-term strategies and priorities. With
this in mind, and with an eye to the current outlook for growth of the
various aggregates, the staff presented on page 12 of the bluebook, not
only the tentative ranges, but also several alternatives.
When the Committee adopted its tentative ranges last July, it
carried over the existing 1989 ranges into 1990. These ranges could be

-5-
adopted as final. Staff projections for the three aggregates lie within
the tentative ranges, and it seems likely that these ranges also would
support the path for the economy and prices most Committee members envi-
sion as well, since the central tendency of your forecasts is similar to
the staff projection.
However, one reason the Committee simply carried over the 1989
ranges was because of the uncertainties in the financial outlook, as-
sociated in part with the workout of the thrift situation. These un-
certainties seem to be resolving themselves in ways that suggest adjust-
ing the ranges, at least for M3 and debt. To recognize the structural
shifts brought about by greater thrift shrinkage and reduced equity
retirements than was contemplated in July, all the alternatives have in
common lower M3 and debt ranges. Some reduction in these ranges would
not connote a "tighter" policy than contemplated in July or than would
be consistent with modest restraint on inflation pressures, given these
structural shifts. In this context, the staff considered alternative
II, which reduces the M3 and debt ranges, but retains the M2 range, to
be roughly equivalent, in a policy sense, to the tentative ranges.
Indeed, even greater reductions would be needed to center the M3 and
debt ranges around the staff outlook, but such reductions were not pro-
posed partly because of the possibility that the ranges might have to be
raised in future years after special effects abated, and the diffi-
culties such a reversal might raise in public perception of monetary
policy intentions. The alternative II ranges would seem to be balanced
in a way that suggested more scope for a tightening of policy than for

-6-
an easing, with the range for M2, the most interest sensitive of the
targeted aggregates, providing the principal reading in that regard.
Although an M2 range of 3 to 7 percent may be consistent with
staff and FOMC projections, it probably would not encompass the adminis-
tration's economic forecast. The 7 percent nominal GNP for 1990 and
falling interest rates of that forecast suggest M2 growth on the order
of 8 percent in 1990. The administration has addressed this potential
inconsistency in the CEA report released yesterday. This report is
generally very supportive of the conduct of monetary policy and the
Committee's objective of price stability. But it acknowledges that M2
could exceed its tentative range for 1990, and suggests two approaches:
raising the range, or simply allowing an overshoot to develop, which
would be explained ex post as an artifact of declining velocity. The
Humphrey-Hawkins report also is required to address the relationship of
the FOMC's ranges and the administration's forecast. The inconsistency
of the M2 range with the administration forecast might connote something
a bit more fundamental than a disagreement over velocity, since it
arises from more rapid income growth than the FOMC's central tendency,
as well as from the assumed drop in rates. The rate decline could be
attributed to the tighter fiscal policy assumed by the administration,
but higher real and nominal income growth might be considered less
conducive to inflation restraint than the Committee might believe
desirable.
Alternative I contains a higher M2 range, should the Committee
wish to allow for significantly greater income growth than in the staff
or FOMC forecasts, or for a drop in interest rates. Faster income

growth might be considered appropriate if the Committee wanted to key
policy to maintaining the expansion of the economy close to the rate of
growth of its potential in coming years. Room for more rapid M2 growth
might also be appropriate if the Committee saw the risks as greater on
the side of a shortfall in aggregate demand. Actions to sustain growth
under such circumstances by reducing interest rates might soon lead to
M2 growth above the upper limit of its tentative range. The increase in
the M2 range might be seen as connoting more attention to and concern
about the performance of the real economy on the part of the Federal
Reserve. However, given the expectations for M3 and debt growth, the
ranges for these aggregates still could be reduced without compromising
the intent of alternative I.
On the other hand, if the tentative range for M2 were adopted,
as in alternative II, it would be the first time in four years that the
M2 range had not been reduced, and might be seen as casting doubt about
the Federal Reserve's commitment to its price stability objective. A
reduction in the M2 range, as under alternative III, would underline
that commitment, and imply that the Federal Reserve was more concerned
about risks of inflation accelerating than of economic expansion falling
a little short of expectations. With M2 already running along the upper
end of this range, adoption of alternative III would seem to imply a
prompt response to tendencies for this aggregate to run over its range,
as might occur if price pressures in the economy turned out to be a
little stronger than expected. It would also imply more limited
responses, in the form of reducing interest rates, to any tendency for
economic activity to fall short of expectations. Presumably the range

-8-
would not be allowed to constrain actions to cushion a major shortfall
in demand and downturn in the economy, which might require an overshoot
of the upper bounds of all the alternatives. But the lower range may
imply the desire to delay a reaction to data suggesting softness in the
economy in order to gauge the extent of the weakness, and a willingness
to allow relatively minor shortfalls in demand to show through into
slower growth initially and ultimately into a reduced rate of price
increase.

February 7, 1990
Short-Run Policy BriefingDonald L. Kohn
I will be relatively brief Mr. Chairman, partly because you've
heard enough from me today, but also because yesterday's discussion of
bond yields covered much of the ground I was prepared to go over. This
won't deter me entirely, however; the issue of what has been driving
long-term rates is of sufficient import for the stance of monetary
policy that I thought it might be useful to sum up the arguments and
to add some thoughts on possible implications of other cross currents
recently evident in financial markets.
With regard to the bond yields--first, I think it was generally
agreed that the rise in bond yields was largely an increase in real
interest rates. Inflation prospects may be a little worse over the
near-term, and the outlook for a significant downward adjustment in
longer-term inflation rates probably looksless likely to those who had
thought the economy was slipping into recession. Nonetheless, it seems
farfetched that developments over the intermeeting period would have
caused long-term inflation expectations to be revised up by more than
1/2 percentage point.
Second, if at least some of the rise in real rates can be seen
as an increase in equilibrium real rates, then it might not imply much
more restrictiveness. To an extent, this can be inferred from the yield
curve. The slight upward slope of that curve is consistent, taking into
account usual liquidity premiums, with market expectations that economic

-2-
expansion will be sustained at something like the current level of
short-term rates, without any significant moderation of inflation.
A major factor behind the market's rethinking appears to have
been the incoming data on the U.S. economy, which presented much more of
a mixed picture than had been built into the earlier prevailing expecta-
tions of further Federal Reserve easing. Apparently, previous levels of
real rates were now seen to be less restrictive than had been thought.
Increases in foreign rates may also have played a role, though one needs
to be careful in interpreting the simultaneous increases in rates in
industrial countries. To the extent the rise in worldwide interest
rates represented a response to perceptions of newly opening opportuni-
ties in Eastern Europe, or if the upward movements of rates abroad re-
sulted from a generally stronger demands on their economies, the equi-
librium real rate in the US also would tend to rise. The expansion of
those economies will feed back onto the US economy through, for example,
greater demands for our exports, supporting growth here at the higher
real rates.
But other factors may have been pushing up bond yields as well,
with less benign implications for the United States. For one, some of
the increase may have involved market overshooting, arising perhaps from
a rush of sales when investors decided simultaneously to lighten port-
folios, or even from one of those mysterious Japanese accounting rule
changes. A suspicion that such transitory factors may have been in-
volved lay behind the hint in the bluebook that bond yields could edge
down once the Treasury refunding is over. In addition, our rates could
be reacting to the prospects for tighter monetary policy abroad, though

-3-
in the past this generally has shown through mainly in exchange rate
changes rather than interest rates, and there has been little confirming
evidence in short-term rates abroad. Or, uncertainty may have increas-
ed, driving investors into shorter-term instruments, or even into gold.
That these additional uncertainties are emanating at least as much from
Japan and eastern Europe as from the United States, could be another
explanation behind the the worldwide nature of the rise in bond yields.
On balance, it would appear that most of the increase in bond
yields might be attributable to increases in actual or perceived equi-
librium real rates, and to a lesser extent to higher inflation expecta-
tions. But some part also may represent a tightening of conditions that
could damp demand in certain sectors, perhaps more than now expected by
the market. Other developments in financial markets have also worked in
this direction. The drop in the stock market has reinforced the sense
of higher capital costs to businesses and has reduced the wealth of
share holders. And the evidence that lenders are adopting a more cau-
tious attitude, however welcome from a supervisory perspective, may be
raising the cost and reducing the availiblility of credit for some pri-
vate borrowers. These borrowers are, in effect, facing even greater
increases in real rates than suggested by tracking rates in the Trea-
sury, or even private securities markets.
On the other side of the ledger is the depreciation of the
dollar against major currencies, except the yen. Whatever the reason
for its behavior, the drop in the dollar would make US goods more com-
petitive in international markets, stimulating output and import price
increases. It seems likely that the decline in the dollar contributed

-4-
to the rise in US bond yields, through revisions to both expected real
rates and inflation. If this is an important channel for the transmis-
sion of interest rates around the world, it suggests that the mechanism
for such a transmission itself carries somewhat offsetting effects for
the economy--both for the countries whose currencies are depreciating
and those whose currencies are appreciating.
Money growth, after slowing in January, is expected to rebound
over the balance of the quarter. The M2 growth in the staff projection
would imply expansion in the first half of 1990 close to the upper bound
of the long-run range you adopted today. Moreover, such growth would
still keep P* close to the projected price level, reinforcing the notion
that the stance of monetary policy implied little near-term downward
impetus to price pressures.
Finally, although inflation concerns may not account for much
of the rise in bond yields, they have worsened recently, as was evident
from the consumer surveys discussed yesterday. Under these conditions,
restraint on the pace of economic activity, as might arise in part from
some of the bond and credit market developments just discussed, may be
necessary to prevent temporary increases in food and fuel prices from
becoming embedded in long-term price expectations.
In light of the divergent signals given by these various fac-
tors, the Committee might want to extend the period of stable operating
policy, as under alternative B, awaiting further developments that would
point more clearly to the need for policy adjustment. If the Committee
were to view the evidence as suggesting the need for a further slight
easing of policy at this time, it could well be that such an easing