Embed Size (px)
Citation preview

A-64
6. Environment and Socail Consideration (1) Environmental Permit

A-65

A-66

A-67

A-68

A-69

Dur
ing
your
pre
sent
atio
n, y
ousp
oke
of a
stu
dy c
ondu
cted
, w
here
yo
ur c
onsu
ltanc
y fi
rm c
aptu
red
stru
ctur
es a
long
the
rig
ht-o
ff –
way
in
50f
t, 60
ft a
nd 7
5ft.W
hat
is i
t, th
is m
eeti
ng o
nly
conc
entr
ates
on
stru
ctur
es in
50f
t?
Ou r
ter
ms
of r
efer
ence
ind
icat
ed t
hat
we
cond
uct
our
stud
ies
wit
hin
50 f
t.,
60 f
t. an
d 75
ft.
How
ever
so
as t
o re
duce
the
im
pact
of
the
proj
ect,
JIC
A
has
deci
ded
to u
nder
take
the
con
stru
ctio
n w
ithi
n 50
ft.
from
the
med
ian
of
the
new
roa
d.
With
in t
his
area
, th
ere
wil
l be
lim
ited
im
pact
as
only
26
stru
ctur
es m
ight
be
affe
cted
, acc
ordi
ng to
our
rep
ort.
You
men
tion
ed th
at th
e Ja
pane
se a
genc
y JI
CA
sai
d th
at th
ey a
re a
ble
to d
o th
e ro
ad c
onst
ruct
ion
wit
h in
50f
t. S
o, w
hyst
ruct
ures
wit
hin
60ft
and
75f
tmar
ked?
Acc
ordi
ng t
o L
iber
ian
law
s, a
ll ro
ads
in L
iber
ia s
houl
d ha
ve a
sid
e w
alls
or
a pa
th a
long
the
roa
d fo
r pe
dest
rian
s.
Thi
s ar
ea i
s ca
lled
the
righ
t-of
-way
(R
OW
)
in s
ome
area
s, it
is 7
5 ft
. fro
m t
he m
edia
n.
In o
ther
are
as, i
t is
150
ft.
How
ever
, sin
ce p
eopl
e ha
ve m
oved
into
maj
o r p
ortio
n of
the
RW
and
to
A-70
(2) Minutes of Stake holder meeting
Att
en
de
e N
o.
1
Att
en
de
e N
o.
2
Att
en
de
e N
o.
3
Att
en
de
e N
o.
4

redu
ce t
he p
roje
ct i
mpa
ct,
JIC
A h
as p
ropo
sed
to w
ork
in 5
0 ft
. of
the
m
edia
n.
Is th
e (E
EC
)a
priv
ate
enti
ty o
r a
gove
rnm
enta
l ent
ity?
Ear
th E
nvir
onm
enta
l C
onsu
ltanc
y or
(EE
C)
isa
priv
ate
entit
y. I
t do
es n
ot
wor
k fo
r th
e G
over
nmen
t of
Lib
eria
. It
was
hir
ed b
y th
e Ja
pane
se c
ompa
ny
Kat
ahir
a &
Eng
inee
rs I
nter
nati
onal
to c
ondu
ct th
e st
udy
for
JIC
A.
Wha
t is
the
actu
al d
ista
nce
requ
ired
for
rig
ht o
ff w
ays
in L
iber
ia?
Acc
ordi
ng t
o th
e L
iber
ian
Gov
ernm
ent
law
s, t
he r
ight
off
way
s sh
ould
be
75 f
t. or
150
ft, o
n bo
th le
ft a
nd r
ight
sid
es o
f th
e ro
ad, f
rom
the
med
ian.
You
spo
ke o
f 50
ft i
n yo
ur p
rese
ntat
ion,
tha
t th
e go
vern
men
t ow
ns a
ri
ght-
of-w
ay o
f 75
ft.
or 1
50ft
, w
hile
the
stud
ies
was
one
for
50f
t, 60
ft,
and
75ft
. I
f so
, w
hy d
idn’
t E
EC
res
tric
t th
e ex
erci
se t
o 50
ft,
know
ing
that
the
proj
ect c
an b
e un
dert
aken
in 5
0ft?
It i
s ob
viou
s th
at J
ICA
is
able
to
wor
k w
ithi
n 50
ft.
of t
he m
edia
n, b
utth
e Ja
pane
se g
over
nmen
t is
also
int
eres
ted
to k
now
the
like
ly im
pact
the
proj
ect
wou
ld h
ave
if t
he p
roje
ct is
und
erta
ken
wit
hin
60 f
t. or
75
ft. o
f th
e m
edia
n.
The
Jap
anes
e go
vern
men
t do
es n
ot w
ant
the
proj
ect
to a
ffec
t m
any
pers
ons,
th
at i
s w
hy t
he s
tudi
es w
ere
done
to
asce
rtai
n in
form
atio
n ac
ross
the
thr
ee
dist
ance
san
d th
e 50
ft d
ista
nce
impa
ct is
less
.Y
ou s
aid
that
you
r co
mpa
ny E
EC
was
hir
ed t
o co
nduc
t th
e so
cial
ec
onom
ic s
urve
y, a
nd y
ou w
ere
to m
ake
reco
mm
enda
tion
s as
an
inde
pend
ent
entit
y. I
s de
mol
itio
n ex
erci
se g
oing
to b
e on
e of
EE
C’s
re
com
men
dati
ons?
Dev
elop
men
t co
mes
wit
h pa
in.
The
ess
ence
of
unde
rtak
ing
the
stud
ies
is t
o as
cert
ain
if t
he p
roje
ct c
an b
e un
dert
aken
with
out
anyo
ne b
eing
dis
plac
ed.
If p
eopl
e ar
e to
be
disp
lace
d, th
e st
udie
s al
so w
ish
to a
scer
tain
how
the
lea
st
num
ber
of p
erso
ns c
an b
e af
fect
ed.
The
last
res
ort i
s th
at if
str
uctu
res
are
to
be d
emol
ishe
d, t
here
sho
uld
be n
o ot
her
bett
er a
ltern
ativ
es,
and
the
owne
rs
of
stru
ctur
es
to
be
affe
cted
m
ust
beco
mpe
nsat
ed
and
prov
ided
ot
her
assi
stan
ce s
o th
at th
eir
livel
ihoo
d is
not
adv
erse
ly a
ffec
ted.
Is i
t co
mpu
lsor
y th
at a
ll pr
ojec
t af
fect
ed p
erso
ns (
PA
Ps)
wit
hin
the
50ft
. mea
sure
men
t be
com
pens
ated
?Y
es, a
ll of
thos
e id
enti
fied
wit
hin
the
50 f
t. w
ill b
e co
mpe
nsat
ed.
We
unde
rsta
nd
that
ev
ery
coun
try
arou
nd
the
wor
ld
need
s de
velo
pmen
t th
ough
it
com
es a
long
with
a l
ot o
f pa
ins.
W
e al
so
know
tha
t pe
ople
sho
uld
be a
ble
to c
are
for
them
selv
es b
efor
e th
eyca
n m
ake
use
of w
hate
ver
deve
lopm
ent.
So,
we
wan
t yo
u to
ple
ase
conv
ey t
o th
e go
vern
men
t of
Lib
eria
tha
t w
e ne
ed a
com
pens
atio
n fo
r th
e da
mag
e to
res
tart
our
live
s.
Tha
nks
for
your
com
men
t and
res
t ass
ure
it w
ill b
e co
nvey
ed.
A-71
Att
en
de
e N
o.
7
Att
en
de
e N
o.
6
Att
en
de
e N
o.
5
Att
en
de
e N
o.
8
Att
en
de
e N
o.
9
Att
en
de
e N
o.
10

Geo Investigation Result
注) DCP試験 注) CBR試験
8%~12% 設計CBR 8
12%~ 設計CBR 12
0+025 AC
1 Aggregate
Depth Thickness
(m) (m) CBR Remark CBR Class Remark CBR Remark
0.00 - 0.10 0.10 24.4 on walkway surface0.10 - 0.20 0.10 Max 26.00.20 - 0.30 0.10 Mini 21.80.30 - 0.40 0.10 5 Black overburden0.40 - 0.5 0 0.10 50.50 - 0.60 0.10 50.60 - 0.70 0.10 50.70 - 0.80 0.10 90.80 - 0.90 0.10 250.90 - 1.00 0.10 171.00 - 1.10 0.10 221.10 - 1.20 0.10
1.20 - 1.30 0.10
0+250 AC
2 Aggregate
Depth Thickness
(m) (m) CBR Remark CBR Class Remark CBR Remark
0.00 - 0.10 0.10 45 PaveGL-0.1 Gray overburden0.10 - 0.20 0.10 100 57.6 Max 60.10.20 - 0.30 0.10 43 Mini 53.80.30 - 0.40 0.10 510.40 - 0.5 0 0.10 1000.50 - 0.60 0.10 1000.60 - 0.70 0.10 590.70 - 0.80 0.10 480.80 - 0.90 0.10
0.90 - 1.00 0.10 spreading thin sand on surface1.00 - 1.10 0.10
1.10 - 1.20 0.10
0+500 AC 75 mm
3 Aggregate 200 mm
Depth Thickness
(m) (m) CBR Remark CBR Class
0.00 - 0.10 0.10 soaked CBR test AASHTO classification of soil ( Dark Brown soil )
0.10 - 0.20 0.10 ①、②、③
0.20 - 0.30 0.10 20.05 A-2-6 P index 13
0.30 - 0.40 0.10 16.31 SC LL 34
0.40 - 0.5 0 0.10 12.57 PL 21
0.50 - 0.60 0.10 Consistency Index 0.62
0.60 - 0.70 0.10 ave. Natural Moisture Content 26%
0.70 - 0.80 0.10 16.3
0.80 - 0.90 0.10 設計 CBR Particle Density 2.69
0.90 - 1.00 0.10 12.0
1.00 - 1.10 0.10 OMC 6.2%
1.10 - 1.20 0.10 MDD 1122kg/CuM
1.20 - 1.30 0.10
0+750 AC
4 Aggregate
Depth Thickness
(m) (m) CBR Remark CBR Class Remark CBR Remark
0.00 - 0.10 0.10
0.10 - 0.20 0.10
0.20 - 0.30 0.10
0.30 - 0.40 0.10 70
0.40 - 0.5 0 0.10 45
0.50 - 0.60 0.10 20
0.60 - 0.70 0.10 28
0.70 - 0.80 0.10 36
0.80 - 0.90 0.10 35
0.90 - 1.00 0.10 37
1.00 - 1.10 0.10 44
1.10 - 1.20 0.10 48
1.20 - 1.30 0.10
4日水浸 3供試体平均
DCP Soil SAMPLING CASPOL
DCP Soil SAMPLING CASPOL
DCPT : 26 places Laboratory test of soil sample : 26 places Caspol test : 23 places
CBR= 292 / (DCPI)
DCPI : 打撃1回当たりの貫入量
0.5≦CBR≦100
DCP Soil SAMPLING
Remark
Clayey SandDark Brown
DCP Soil SAMPLING CASPOL
1.12
A-72
7. Design Data
7.1 Geological Survey Result(1) DCP, CBR, Caspol Survey Result

1+000 AC 50 mm
5 Aggregate 315 mm
Depth Thickness
(m) (m) CBR Remark CBR Class
0.00 - 0.10 0.10 AASHTO classification of soil ( Dark Gray soil )
0.10 - 0.20 0.10 soaked CBR test
0.20 - 0.30 0.10 ①、②、③ A-2-6 P index 11
0.30 - 0.40 0.10 16.84 SC LL 35
0.40 - 0.5 0 0.10 14.17 PL 24
0.50 - 0.60 0.10 11.50 Consistency Index 0.36
0.60 - 0.70 0.10 Natural Moisture Content 31%
0.70 - 0.80 0.10 ave.
0.80 - 0.90 0.10 14.2 Particle Density 2.71
0.90 - 1.00 0.10 設計 CBR
1.00 - 1.10 0.10 12.0 OMC 7.2%
1.10 - 1.20 0.10 MDD 1198kg/CuM
1.20 - 1.30 0.10
1+250 AC
6 Aggregate
Depth Thickness
(m) (m) CBR Remark CBR Class Remark CBR Remark
0.00 - 0.10 0.10
0.20 - 0.30 0.10
0.20 - 0.30 0.10
0.30 - 0.40 0.10
0.40 - 0.5 0 0.10
0.50 - 0.60 0.10
0.60 - 0.70 0.10 17
0.70 - 0.80 0.10 35
0.80 - 0.90 0.10 17
0.90 - 1.00 0.10 13
1.00 - 1.10 0.10 10
1.10 - 1.20 0.10 5
1.20 - 1.30 0.10 5
1+750 AC 70 mm
7 Aggregate 140 mm
Depth Thickness
(m) (m) CBR Remark CBR Class
0.00 - 0.10 0.10 soaked CBR test AASHTO classification of soil ( Dark Gray soil )
0.20 - 0.30 0.10 ①、②、③
0.20 - 0.30 0.10 19.25 A-2-6 P index 13
0.30 - 0.40 0.10 17.11 SC LL 35
0.40 - 0.5 0 0.10 12.03 PL 22
0.50 - 0.60 0.10 Consistency Index 0.54
0.60 - 0.70 0.10 ave. Natural Moisture Content 28%
0.70 - 0.80 0.10 16.1
0.80 - 0.90 0.10 設計 CBR Particle Density 2.73
0.90 - 1.00 0.10 12.0
1.00 - 1.10 0.10 OMC 9.0%
1.10 - 1.20 0.10 MDD 1064kg/CuM
1.20 - 1.30 0.10
1+780 AC 50
8 Aggregate 120
Depth Thickness
(m) (m) CBR Remark CBR Class
0.00 - 0.10 0.10 soaked CBR test AASHTO classification of soil ( Brown soil )
0.20 - 0.30 0.10 ①、②、③ A-2-6
0.20 - 0.30 0.10 22.19 SC P index 12
0.30 - 0.40 0.10 19.12 LL 32
0.40 - 0.5 0 0.10 6 16.04 PL 20
0.50 - 0.60 0.10 7 Consistency Index 0.75
0.60 - 0.70 0.10 9 ave. Natural Moisture Content 23%
0.70 - 0.80 0.10 12 19.1
0.80 - 0.90 0.10 15 設計 CBR Particle Density 2.71
0.90 - 1.00 0.10 16 12.0
1.00 - 1.10 0.10 16
1.10 - 1.20 0.10 14
1.20 - 1.30 0.10 13
DCP Soil SAMPLING
Remark
Clayey SandBrown
Green Gray
DCP Soil SAMPLING
Remark
Clayey Sand
Green Gray
DCP
Remark
Clayey SandDark Gray
DCP Soil SAMPLING CASPOL
Soil SAMPLING
A-73

2+000 AC
9 Aggregate
Depth Thickness
(m) (m) CBR Remark CBR Class Remark CBR Remark
0.00 - 0.10 0.10
0.20 - 0.30 0.10 soaked CBR test
0.20 - 0.30 0.10 ①、②、③
0.30 - 0.40 0.10 14.97
0.40 - 0.5 0 0.10 12.83
0.50 - 0.60 0.10 10.70
0.60 - 0.70 0.10
0.70 - 0.80 0.10 ave.
0.80 - 0.90 0.10 12.8
0.90 - 1.00 0.10 設計 CBR
1.00 - 1.10 0.10 12.0
1.10 - 1.20 0.10
1.20 - 1.30 0.10
2+250 AC
10 Aggregate
Depth Thickness
(m) (m) CBR Remark CBR Class Remark CBR Remark
0.00 - 0.10 0.10
0.20 - 0.30 0.10 at road side of Phase I0.20 - 0.30 0.10 Green Yellow soil0.30 - 0.40 0.10 Max 33.00.40 - 0.5 0 0.10 PaveGL-0.5 Mini 23.30.50 - 0.60 0.10 29.10.60 - 0.70 0.10 3
0.70 - 0.80 0.10 4
0.80 - 0.90 0.10 7
0.90 - 1.00 0.10 9
1.00 - 1.10 0.10 11
1.10 - 1.20 0.10 13
1.20 - 1.30 0.10 13
2+500 AC 60
11 Aggregate 130
Depth Thickness
(m) (m) CBR Remark CBR Class Remark CBR Remark
0.00 - 0.10 0.10
0.20 - 0.30 0.10 soaked CBR test
0.20 - 0.30 0.10 ①、②、③ at 0.8m below 0.30 - 0.40 0.10 18.18 from road shoulder0.40 - 0.5 0 0.10 16.71 Brown soil0.50 - 0.60 0.10 15.24
0.60 - 0.70 0.10
0.70 - 0.80 0.10 ave.
0.80 - 0.90 0.10 16.7
0.90 - 1.00 0.10 設計 CBR
1.00 - 1.10 0.10 12.0
1.10 - 1.20 0.10 PaveGL-1.2 Max 34.41.20 - 1.30 0.10 30.3 Mini 28.6
2+750 AC
12 Aggregate
Depth Thickness
(m) (m) CBR Remark CBR Class Remark CBR Remark
0.00 - 0.10 0.10
0.20 - 0.30 0.10 at 1.1m below 0.20 - 0.30 0.10 from road shoulder0.30 - 0.40 0.10 Brown soil0.40 - 0.5 0 0.10 59
0.50 - 0.60 0.10 79
0.60 - 0.70 0.10 82
0.70 - 0.80 0.10 59
0.80 - 0.90 0.10 79
0.90 - 1.00 0.10 93
1.00 - 1.10 0.10 68
1.10 - 1.20 0.10 55 PaveGL-1.4 Max 26.81.20 - 1.30 0.10 21.1 Mini 15.3
DCP Soil SAMPLING CASPOL
Gray
DCP Soil SAMPLING CASPOL
DCP Soil SAMPLING CASPOL
DCP Soil SAMPLING CASPOL
Light green
A-74

3+000 AC
13 Aggregate
Depth Thickness
(m) (m) CBR Remark CBR Class Remark CBR Remark
0.00 - 0.10 0.10
0.20 - 0.30 0.10 soaked CBR test
0.20 - 0.30 0.10 ①、②、③
0.30 - 0.40 0.10 20.32
0.40 - 0.5 0 0.10 17.51
0.50 - 0.60 0.10 14.71
0.60 - 0.70 0.10
0.70 - 0.80 0.10 ave.
0.80 - 0.90 0.10 17.5
0.90 - 1.00 0.10 設計 CBR
1.00 - 1.10 0.10 12.0
1.10 - 1.20 0.10
1.20 - 1.30 0.10
3+250 AC
14 Aggregate
Depth Thickness
(m) (m) CBR Remark CBR Class Remark CBR Remark
0.00 - 0.10 0.10
0.20 - 0.30 0.10
0.20 - 0.30 0.10
0.30 - 0.40 0.10
0.40 - 0.5 0 0.10 22
0.50 - 0.60 0.10 21
0.60 - 0.70 0.10 17
0.70 - 0.80 0.10 41
0.80 - 0.90 0.10 81
0.90 - 1.00 0.10 83 PaveGL-1.0 Max 51.01.00 - 1.10 0.10 43 45 Mini 40.51.10 - 1.20 0.10 17 at 0.8m below from road shoulder1.20 - 1.30 0.10 Yellow Brown soil
3+500 AC 80
15 Aggregate 140
Depth Thickness
(m) (m) CBR Remark CBR Class Remark CBR Remark
0.00 - 0.10 0.10
0.20 - 0.30 0.10 soaked CBR test
0.20 - 0.30 0.10 ①、②、③ at 1.2m below 0.30 - 0.40 0.10 17.91 from road shoulder0.40 - 0.5 0 0.10 16.31 Brownish Black soil0.50 - 0.60 0.10 13.90
0.60 - 0.70 0.10
0.70 - 0.80 0.10 ave.
0.80 - 0.90 0.10 16.0
0.90 - 1.00 0.10 設計 CBR
1.00 - 1.10 0.10 12.0
1.10 - 1.20 0.10 PaveGl-1.4 Max 42.31.20 - 1.30 0.10 31.7 Mini 25.5
3+750 AC
16 Aggregate
Depth Thickness
(m) (m) CBR Remark CBR Class Remark CBR Remark
0.00 - 0.10 0.10
0.20 - 0.30 0.10
0.20 - 0.30 0.10 at road side of Phase I 0.30 - 0.40 0.10 Yellow Brown soil0.40 - 0.5 0 0.10 PaveGL-0.5 Max 66.20.50 - 0.60 0.10 37 61.9 Mini 54.30.60 - 0.70 0.10 40
0.70 - 0.80 0.10 51
0.80 - 0.90 0.10 45
0.90 - 1.00 0.10 40
1.00 - 1.10 0.10 25
1.10 - 1.20 0.10 14
1.20 - 1.30 0.10
DCP Soil SAMPLING CASPOL
Yellow
DCP Soil SAMPLING CASPOL
Green
DCP Soil SAMPLING CASPOL
DCP Soil SAMPLING CASPOL
A-75

3+950 AC
17 Aggregate
Depth Thickness
(m) (m) CBR Remark CBR Class Remark CBR Remark
0.00 - 0.10 0.10
0.20 - 0.30 0.10 at 1m below from road shoulder0.20 - 0.30 0.10 Brown soil0.30 - 0.40 0.10 soaked CBR test
0.40 - 0.5 0 0.10 ①、②、③
0.50 - 0.60 0.10 19.25
0.60 - 0.70 0.10 16.58
0.70 - 0.80 0.10 13.90
0.80 - 0.90 0.10
0.90 - 1.00 0.10 ave. PaveGL-1.1 Max 48.51.00 - 1.10 0.10 16.6 39.8 Mini 32.51.10 - 1.20 0.10 設計 CBR
1.20 - 1.30 0.10 12.0
4+000 AC
18 Aggregate
Depth Thickness
(m) (m) CBR Remark CBR Class Remark CBR Remark
0.00 - 0.10 0.10
0.20 - 0.30 0.10
0.20 - 0.30 0.10
0.30 - 0.40 0.10 soaked CBR test
0.40 - 0.5 0 0.10 ①、②、③
0.50 - 0.60 0.10 21.12
0.60 - 0.70 0.10 17.91
0.70 - 0.80 0.10 15.51
0.80 - 0.90 0.10
0.90 - 1.00 0.10 ave.
1.00 - 1.10 0.10 18.2
1.10 - 1.20 0.10 設計 CBR
1.20 - 1.30 0.10 12.0
4+250 AC
19 Aggregate
Depth Thickness
(m) (m) CBR Remark CBR Class Remark CBR Remark
0.00 - 0.10 0.10
0.20 - 0.30 0.10 at road shoulder0.20 - 0.30 0.10 Gray soil0.30 - 0.40 0.10 35 PaveGL-0.4 Max 27.10.40 - 0.5 0 0.10 43 24.7 Mini 21.20.50 - 0.60 0.10 47
0.60 - 0.70 0.10 37
0.70 - 0.80 0.10 32
0.80 - 0.90 0.10 28
0.90 - 1.00 0.10 21
1.00 - 1.10 0.10 19
1.10 - 1.20 0.10 22
1.20 - 1.30 0.10
4+500 AC 50
20 Aggregate 230
Depth Thickness
(m) (m) CBR Remark CBR Class Remark CBR Remark
0.00 - 0.10 0.10
0.20 - 0.30 0.10 soaked CBR test
0.20 - 0.30 0.10 ①、②、③
0.30 - 0.40 0.10 17.65
0.40 - 0.5 0 0.10 16.84
0.50 - 0.60 0.10 16.04
0.60 - 0.70 0.10
0.70 - 0.80 0.10 ave.
0.80 - 0.90 0.10 16.8
0.90 - 1.00 0.10 設計 CBR
1.00 - 1.10 0.10 12.0
1.10 - 1.20 0.10
1.20 - 1.30 0.10
Green
Dark green gray
DCP Soil SAMPLING CASPOL
DCP Soil SAMPLING CASPOL
Yellow Brown
DCP Soil SAMPLING CASPOL
DCP Soil SAMPLING CASPOL
A-76

4+750 AC
21 Aggregate
Depth Thickness
(m) (m) CBR Remark CBR Class Remark CBR Remark
0.00 - 0.10 0.10 at 0.6m below from road shoulder0.20 - 0.30 0.10 Brown soil0.20 - 0.30 0.10 Max 34.40.30 - 0.40 0.10 37 Mini 28.10.40 - 0.5 0 0.10 46
0.50 - 0.60 0.10 56
0.60 - 0.70 0.10 44
0.70 - 0.80 0.10 24 PaveGL-0.8
0.80 - 0.90 0.10 13 30.8
0.90 - 1.00 0.10 8
1.00 - 1.10 0.10 6
1.10 - 1.20 0.10 6
1.20 - 1.30 0.10
5+000 AC 100
22 Aggregate 200
Depth Thickness
(m) (m) CBR Remark CBR Class Remark CBR Remark
0.00 - 0.10 0.10
0.20 - 0.30 0.10
0.20 - 0.30 0.10
0.30 - 0.40 0.10 soaked CBR test at 1.0m below from road shoulder0.40 - 0.5 0 0.10 ①、②、③ Yellow Brown soil0.50 - 0.60 0.10 17.91 Max 35.10.60 - 0.70 0.10 14.30 Mini 18.30.70 - 0.80 0.10 10.70
0.80 - 0.90 0.10
0.90 - 1.00 0.10 ave.
1.00 - 1.10 0.10 14.3
1.10 - 1.20 0.10 設計 CBR PaveGL-1.3
1.20 - 1.30 0.10 12.0 26.5
5+250 AC
23 Aggregate
Depth Thickness
(m) (m) CBR Remark CBR Class Remark CBR Remark
0.00 - 0.10 0.10
0.20 - 0.30 0.10
0.20 - 0.30 0.10
0.30 - 0.40 0.10
0.40 - 0.5 0 0.10 22
0.50 - 0.60 0.10 39
0.60 - 0.70 0.10 57
0.70 - 0.80 0.10 47
0.80 - 0.90 0.10 27
0.90 - 1.00 0.10 21
1.00 - 1.10 0.10 17
1.10 - 1.20 0.10 13
1.20 - 1.30 0.10
5+500 AC 68
24 Aggregate 180
Depth Thickness
(m) (m) CBR Remark CBR Class Remark CBR Remark
0.00 - 0.10 0.10
0.20 - 0.30 0.10
0.20 - 0.30 0.10
0.30 - 0.40 0.10 soaked CBR test
0.40 - 0.5 0 0.10 ①、②、③
0.50 - 0.60 0.10 21.39
0.60 - 0.70 0.10 19.25
0.70 - 0.80 0.10 13.37
0.80 - 0.90 0.10
0.90 - 1.00 0.10 ave.
1.00 - 1.10 0.10 18.0
1.10 - 1.20 0.10 設計 CBR
1.20 - 1.30 0.10 12.0
DCP Soil SAMPLING CASPOL
DCP Soil SAMPLING CASPOL
Yellow Gray
DCP Soil SAMPLING CASPOL
Dark Yellow Green
DCP Soil SAMPLING CASPOL
A-77

5+750 AC
25 Aggregate
Depth Thickness
(m) (m) CBR Remark CBR Class Remark CBR Remark
0.00 - 0.10 0.10 at road side of Phase I0.20 - 0.30 0.10 Yellow soil0.20 - 0.30 0.10 Max 21.80.30 - 0.40 0.10 Mini 17.80.40 - 0.5 0 0.10 PaveGL-0.5
0.50 - 0.60 0.10 19.7
0.60 - 0.70 0.10 8
0.70 - 0.80 0.10 3
0.80 - 0.90 0.10 5
0.90 - 1.00 0.10 8
1.00 - 1.10 0.10 8
1.10 - 1.20 0.10 6
1.20 - 1.30 0.10 6
6+000 AC
26 Aggregate
Depth Thickness
(m) (m) CBR Remark CBR Class Remark CBR Remark
0.00 - 0.10 0.10
0.20 - 0.30 0.10
0.20 - 0.30 0.10 soaked CBR test
0.30 - 0.40 0.10 ①、②、③
0.40 - 0.5 0 0.10 13.10
0.50 - 0.60 0.10 12.03
0.60 - 0.70 0.10 10.16
0.70 - 0.80 0.10
0.80 - 0.90 0.10 ave.
0.90 - 1.00 0.10 11.8
1.00 - 1.10 0.10 設計 CBR
1.10 - 1.20 0.10 8.0
1.20 - 1.30 0.10
6+300 AC
27 Aggregate
Depth Thickness
(m) (m) CBR Remark CBR Class Remark CBR Remark
0.00 - 0.10 0.10
0.20 - 0.30 0.10
0.20 - 0.30 0.10
0.30 - 0.40 0.10
0.40 - 0.5 0 0.10
0.50 - 0.60 0.10
0.60 - 0.70 0.10 37
0.70 - 0.80 0.10 27
0.80 - 0.90 0.10 22
0.90 - 1.00 0.10 20
1.00 - 1.10 0.10 15
1.10 - 1.20 0.10 15
1.20 - 1.30 0.10 22
6+500 AC 75
28 Aggregate 170
Depth Thickness
(m) (m) CBR Remark CBR Class Remark CBR Remark
0.00 - 0.10 0.10
0.20 - 0.30 0.10
0.20 - 0.30 0.10
0.30 - 0.40 0.10 soaked CBR test
0.40 - 0.5 0 0.10 ①、②、③
0.50 - 0.60 0.10 18.18
0.60 - 0.70 0.10 15.24
0.70 - 0.80 0.10 12.30
0.80 - 0.90 0.10
0.90 - 1.00 0.10 ave.
1.00 - 1.10 0.10 15.2
1.10 - 1.20 0.10 設計 CBR
1.20 - 1.30 0.10 12.0
Yellow Brown
DCP Soil SAMPLING CASPOL
DCP Soil SAMPLING CASPOL
Grayish Black
DCP Soil SAMPLING CASPOL
DCP Soil SAMPLING CASPOL
A-78

6+750 AC
29 Aggregate
Depth Thickness
(m) (m) CBR Remark CBR Class Remark CBR Remark
0.00 - 0.10 0.10
0.20 - 0.30 0.10
0.20 - 0.30 0.10
0.30 - 0.40 0.10
0.40 - 0.5 0 0.10
0.50 - 0.60 0.10
0.60 - 0.70 0.10 35
0.70 - 0.80 0.10 33
0.80 - 0.90 0.10 40
0.90 - 1.00 0.10 67
1.00 - 1.10 0.10 85
1.10 - 1.20 0.10 87
1.20 - 1.30 0.10 90
7+000 AC 65
30 Aggregate 230
Depth Thickness
(m) (m) CBR Remark CBR Class Remark CBR Remark
0.00 - 0.10 0.10 PaveGL-0.1 Light brown overburden
0.20 - 0.30 0.10 48.7 at road shoulder
0.20 - 0.30 0.10 soaked CBR test Max 52.70.30 - 0.40 0.10 ①、②、③ Mini 43.50.40 - 0.5 0 0.10 20.32
0.50 - 0.60 0.10 18.85
0.60 - 0.70 0.10 17.38
0.70 - 0.80 0.10
0.80 - 0.90 0.10 ave.
0.90 - 1.00 0.10 18.9
1.00 - 1.10 0.10 設計 CBR
1.10 - 1.20 0.10 12.0
1.20 - 1.30 0.10
7+250 AC
31 Aggregate
Depth Thickness
(m) (m) CBR Remark CBR Class Remark CBR Remark
0.00 - 0.10 0.10 at 0.9m below from road shoulder0.20 - 0.30 0.10 Yellow White soil0.20 - 0.30 0.10 Max 37.30.30 - 0.40 0.10 Mini 19.90.40 - 0.5 0 0.10 54
0.50 - 0.60 0.10 66
0.60 - 0.70 0.10 100
0.70 - 0.80 0.10 100
0.80 - 0.90 0.10 100
0.90 - 1.00 0.10 100
1.00 - 1.10 0.10 100 PaveGL-1.1
1.10 - 1.20 0.10 100 27.9
1.20 - 1.30 0.10 74
7+500 AC 60
32 Aggregate 200
Depth Thickness
(m) (m) CBR Remark CBR Class Remark CBR Remark
0.00 - 0.10 0.10 Brown soil0.20 - 0.30 0.10
0.20 - 0.30 0.10
0.30 - 0.40 0.10 soaked CBR test
0.40 - 0.5 0 0.10 ①、②、③
0.50 - 0.60 0.10 19.25
0.60 - 0.70 0.10 16.04
0.70 - 0.80 0.10 12.83
0.80 - 0.90 0.10
0.90 - 1.00 0.10 ave.
1.00 - 1.10 0.10 16.0 at 1.0m below from road shoulder1.10 - 1.20 0.10 設計 CBR PaveGL-1.3 Max 28.11.20 - 1.30 0.10 12.0 20.4 Mini 14.9
DCP Soil SAMPLING CASPOL
DCP Soil SAMPLING CASPOL
Yellow Gray
DCP Soil SAMPLING CASPOL
Light Gray
DCP Soil SAMPLING CASPOL
A-79

7+750 AC
33 Aggregate
Depth Thickness
(m) (m) CBR Remark CBR Class Remark CBR Remark
0.00 - 0.10 0.10 at 1.0m below from road shoulder0.20 - 0.30 0.10 Dark Brown soil0.20 - 0.30 0.10 Max 26.70.30 - 0.40 0.10 Mini 18.90.40 - 0.5 0 0.10
0.50 - 0.60 0.10
0.60 - 0.70 0.10 32
0.70 - 0.80 0.10 49
0.80 - 0.90 0.10 60 PaveGL-0.9
0.90 - 1.00 0.10 51 23.4
1.00 - 1.10 0.10 45
1.10 - 1.20 0.10 54
1.20 - 1.30 0.10 67
8+000 AC
34 Aggregate
Depth Thickness
(m) (m) CBR Remark CBR Class Remark CBR Remark
0.00 - 0.10 0.10
0.20 - 0.30 0.10
0.20 - 0.30 0.10
0.30 - 0.40 0.10
0.40 - 0.5 0 0.10
0.50 - 0.60 0.10 56
0.60 - 0.70 0.10 87
0.70 - 0.80 0.10 70
0.80 - 0.90 0.10 79
0.90 - 1.00 0.10 76 Yellow soil1.00 - 1.10 0.10 48 at 1.3m below from road shoulder1.10 - 1.20 0.10 27 PaveGL-1.5 Max 25.41.20 - 1.30 0.10 22 23.4 Mini 20.4
9+000 AC 60
35 Aggregate 170
Depth Thickness
(m) (m) CBR Remark CBR Class Remark CBR Remark
0.00 - 0.10 0.10
0.20 - 0.30 0.10 soaked CBR test
0.20 - 0.30 0.10 ①、②、③
0.30 - 0.40 0.10 17.91
0.40 - 0.5 0 0.10 15.24 St.9+0100.50 - 0.60 0.10 12.83 at road side of Phase I0.60 - 0.70 0.10 on compacted subgrade0.70 - 0.80 0.10 ave. Light Brown soil0.80 - 0.90 0.10 15.3 PaveGL-0.8 Max 63.80.90 - 1.00 0.10 設計 CBR 59.7 Mini 51.81.00 - 1.10 0.10 12.0
1.10 - 1.20 0.10
1.20 - 1.30 0.10
9+250 AC
36 Aggregate
Depth Thickness
(m) (m) CBR Remark CBR Class Remark CBR Remark
0.00 - 0.10 0.10
0.20 - 0.30 0.10
0.20 - 0.30 0.10
0.30 - 0.40 0.10
0.40 - 0.5 0 0.10
0.50 - 0.60 0.10 79
0.60 - 0.70 0.10 97
0.70 - 0.80 0.10 100
0.80 - 0.90 0.10 88
0.90 - 1.00 0.10 77
1.00 - 1.10 0.10 62
1.10 - 1.20 0.10 48
1.20 - 1.30 0.10 43
DCP Soil SAMPLING CASPOL
Light Brown
DCP Soil SAMPLING CASPOL
DCP Soil SAMPLING CASPOL
DCP Soil SAMPLING CASPOL
A-80

9+500 AC 55
37 Aggregate 170
Depth Thickness
(m) (m) CBR Remark CBR Class Remark CBR Remark
0.00 - 0.10 0.10
0.20 - 0.30 0.10 soaked CBR test
0.20 - 0.30 0.10 ①、②、③
0.30 - 0.40 0.10 18.72
0.40 - 0.5 0 0.10 16.58
0.50 - 0.60 0.10 13.64
0.60 - 0.70 0.10
0.70 - 0.80 0.10 ave.
0.80 - 0.90 0.10 16.3
0.90 - 1.00 0.10 設計 CBR
1.00 - 1.10 0.10 12.0
1.10 - 1.20 0.10
1.20 - 1.30 0.10
9+750 AC
38 Aggregate
Depth Thickness
(m) (m) CBR Remark CBR Class Remark CBR Remark
0.00 - 0.10 0.10 at 0.5m below from road shoulder0.20 - 0.30 0.10 White soil0.20 - 0.30 0.10 Max 41.50.30 - 0.40 0.10 Mini 27.30.40 - 0.5 0 0.10 48
0.50 - 0.60 0.10 51
0.60 - 0.70 0.10 69 PaveGL-0.7
0.70 - 0.80 0.10 100 35.5
0.80 - 0.90 0.10 100
0.90 - 1.00 0.10 100
1.00 - 1.10 0.10 100
1.10 - 1.20 0.10 100
1.20 - 1.30 0.10
10+000 AC 70
39 Aggregate 120
Depth Thickness
(m) (m) CBR Remark CBR Class Remark CBR Remark
0.00 - 0.10 0.10
0.20 - 0.30 0.10 soaked CBR test
0.20 - 0.30 0.10 ①、②、③
0.30 - 0.40 0.10 17.38
0.40 - 0.5 0 0.10 14.44
0.50 - 0.60 0.10 11.50
0.60 - 0.70 0.10
0.70 - 0.80 0.10 ave.
0.80 - 0.90 0.10 14.4
0.90 - 1.00 0.10 設計 CBR
1.00 - 1.10 0.10 12.0
1.10 - 1.20 0.10
1.20 - 1.30 0.10
10+250 AC
40 Aggregate
Depth Thickness
(m) (m) CBR Remark CBR Class Remark CBR Remark
0.00 - 0.10 0.10
0.20 - 0.30 0.10
0.20 - 0.30 0.10
0.30 - 0.40 0.10
0.40 - 0.5 0 0.10 27
0.50 - 0.60 0.10 80
0.60 - 0.70 0.10 100
0.70 - 0.80 0.10 64
0.80 - 0.90 0.10 26
0.90 - 1.00 0.10 16
1.00 - 1.10 0.10 12
1.10 - 1.20 0.10 14
1.20 - 1.30 0.10
DCP Soil SAMPLING CASPOL
Brown
DCP Soil SAMPLING CASPOL
Yellow Brown
DCP Soil SAMPLING CASPOL
DCP Soil SAMPLING CASPOL
A-81

10+500 AC 45
41 Aggregate 150
Depth Thickness
(m) (m) CBR Remark CBR Class Remark CBR Remark
0.00 - 0.10 0.10
0.20 - 0.30 0.10 soaked CBR test
0.20 - 0.30 0.10 ①、②、③
0.30 - 0.40 0.10 16.58
0.40 - 0.5 0 0.10 15.78
0.50 - 0.60 0.10 14.97
0.60 - 0.70 0.10
0.70 - 0.80 0.10 ave.
0.80 - 0.90 0.10 15.8
0.90 - 1.00 0.10 設計 CBR
1.00 - 1.10 0.10 12.0
1.10 - 1.20 0.10
1.20 - 1.30 0.10
10+750 AC
42 Aggregate
Depth Thickness
(m) (m) CBR Remark CBR Class Remark CBR Remark
0.00 - 0.10 0.10 Light Brown soil0.20 - 0.30 0.10
0.20 - 0.30 0.10
0.30 - 0.40 0.10
0.40 - 0.5 0 0.10 40
0.50 - 0.60 0.10 32
0.60 - 0.70 0.10 59
0.70 - 0.80 0.10 43
0.80 - 0.90 0.10 37
0.90 - 1.00 0.10 54
1.00 - 1.10 0.10 35 at 1.3m below from road shoulder1.10 - 1.20 0.10 22 PaveGL-1.5 Max 58.31.20 - 1.30 0.10 49.7 Mini 44.9
11+000 AC 65
43 Aggregate 140
Depth Thickness
(m) (m) CBR Remark CBR Class Remark CBR Remark
0.00 - 0.10 0.10
0.20 - 0.30 0.10
0.20 - 0.30 0.10
0.30 - 0.40 0.10 soaked CBR test
0.40 - 0.5 0 0.10 ①、②、③
0.50 - 0.60 0.10 40 18.18
0.60 - 0.70 0.10 45 16.84
0.70 - 0.80 0.10 35 15.51
0.80 - 0.90 0.10 30
0.90 - 1.00 0.10 27 ave.
1.00 - 1.10 0.10 37 16.8
1.10 - 1.20 0.10 20 設計 CBR
1.20 - 1.30 0.10 12.0
11+250 AC
44 Aggregate
Depth Thickness
(m) (m) CBR Remark CBR Class Remark CBR Remark
0.00 - 0.10 0.10 Yellow Brown soil0.20 - 0.30 0.10
0.20 - 0.30 0.10
0.30 - 0.40 0.10
0.40 - 0.5 0 0.10 7
0.50 - 0.60 0.10 8
0.60 - 0.70 0.10 8 PaveGL-0.7
0.70 - 0.80 0.10 6 22.1
0.80 - 0.90 0.10 7
0.90 - 1.00 0.10 8
1.00 - 1.10 0.10 8 at excavated DCPT point1.10 - 1.20 0.10 8 Max 33.01.20 - 1.30 0.10 Mini 11.5
DCP Soil SAMPLING CASPOL
Green Gray
DCP Soil SAMPLING CASPOL
Light Brown
DCP Soil SAMPLING CASPOL
DCP Soil SAMPLING CASPOL
A-82

11+500 AC 50
45 Aggregate 140
Depth Thickness
(m) (m) CBR Remark CBR Class
0.00 - 0.10 0.10 AASHTO classification of soil ( Brown soil )
0.20 - 0.30 0.10 soaked CBR test
0.20 - 0.30 0.10 ①、②、③ P index 11
0.30 - 0.40 0.10 14.97 LL 31
0.40 - 0.5 0 0.10 37 12.57 PL 20
0.50 - 0.60 0.10 40 11.23 Consistency Index 0.64
0.60 - 0.70 0.10 48 A-2-6 Natural Moisture Content 24%
0.70 - 0.80 0.10 42 ave. SC
0.80 - 0.90 0.10 26 12.9 Particle Dencity 2.73
0.90 - 1.00 0.10 28 設計 CBR
1.00 - 1.10 0.10 31 12.0 OMC 6.5%
1.10 - 1.20 0.10 27 MDD 1130kg/CuM
1.20 - 1.30 0.10
11+750 AC
46 Aggregate
Depth Thickness
(m) (m) CBR Remark CBR Class Remark CBR Remark
0.00 - 0.10 0.10
0.20 - 0.30 0.10
0.20 - 0.30 0.10
0.30 - 0.40 0.10
0.40 - 0.5 0 0.10 22
0.50 - 0.60 0.10 35
0.60 - 0.70 0.10 30
0.70 - 0.80 0.10 27
0.80 - 0.90 0.10 25
0.90 - 1.00 0.10 22
1.00 - 1.10 0.10 20
1.10 - 1.20 0.10
1.20 - 1.30 0.10
12+000 AC 48
47 Aggregate 187
Depth Thickness
(m) (m) CBR Remark CBR Class Remark CBR Remark
0.00 - 0.10 0.10
0.20 - 0.30 0.10
0.20 - 0.30 0.10 soaked CBR test
0.30 - 0.40 0.10 ①、②、③
0.40 - 0.5 0 0.10 17.91
0.50 - 0.60 0.10 16.31
0.60 - 0.70 0.10 14.71
0.70 - 0.80 0.10
0.80 - 0.90 0.10 ave.
0.90 - 1.00 0.10 16.3
1.00 - 1.10 0.10 設計 CBR
1.10 - 1.20 0.10 12.0
1.20 - 1.30 0.10
12+250 AC
48 Aggregate
Depth Thickness
(m) (m) CBR Remark CBR Class Remark CBR Remark
0.00 - 0.10 0.10
0.20 - 0.30 0.10
0.20 - 0.30 0.10
0.30 - 0.40 0.10
0.40 - 0.5 0 0.10 30
0.50 - 0.60 0.10 23
0.60 - 0.70 0.10 15 PaveGL-0.7 Yellow Brown soil0.70 - 0.80 0.10 11 31.1 St.12+3000.80 - 0.90 0.10 11 at road side of Phase I0.90 - 1.00 0.10 11 on un-compacted subgrade1.00 - 1.10 0.10 9 Max 33.41.10 - 1.20 0.10 8 Mini 29.11.20 - 1.30 0.10
DCP Soil SAMPLING
Green Brown
DCP Soil SAMPLING CASPOL
Remark
Clayey SandBrown
DCP Soil SAMPLING CASPOL
DCP Soil SAMPLING CASPOL
A-83

12+500 AC 55
49 Aggregate 180
Depth Thickness
(m) (m) CBR Remark CBR Class Remark CBR Remark
0.00 - 0.10 0.10
0.20 - 0.30 0.10
0.20 - 0.30 0.10 soaked CBR test
0.30 - 0.40 0.10 ①、②、③
0.40 - 0.5 0 0.10 17.11
0.50 - 0.60 0.10 15.51
0.60 - 0.70 0.10 13.90
0.70 - 0.80 0.10
0.80 - 0.90 0.10 ave.
0.90 - 1.00 0.10 15.5
1.00 - 1.10 0.10 設計 CBR
1.10 - 1.20 0.10 12.0
1.20 - 1.30 0.10
12+750 AC
50 Aggregate
Depth Thickness
(m) (m) CBR Remark CBR Class Remark CBR Remark
0.00 - 0.10 0.10
0.20 - 0.30 0.10
0.20 - 0.30 0.10
0.30 - 0.40 0.10
0.40 - 0.5 0 0.10 15
0.50 - 0.60 0.10 18
0.60 - 0.70 0.10 27
0.70 - 0.80 0.10 36
0.80 - 0.90 0.10 44
0.90 - 1.00 0.10 39
1.00 - 1.10 0.10 30
1.10 - 1.20 0.10 30
1.20 - 1.30 0.10
13+000 AC
51 Aggregate
Depth Thickness
(m) (m) CBR Remark CBR Class Remark CBR Remark
0.00 - 0.10 0.10
0.20 - 0.30 0.10 soaked CBR test
0.20 - 0.30 0.10 ①、②、③
0.30 - 0.40 0.10 17.91
0.40 - 0.5 0 0.10 17.51
0.50 - 0.60 0.10 17.11
0.60 - 0.70 0.10
0.70 - 0.80 0.10 ave.
0.80 - 0.90 0.10 17.5
0.90 - 1.00 0.10 設計 CBR
1.00 - 1.10 0.10 12.0
1.10 - 1.20 0.10
1.20 - 1.30 0.10
13+230 AC
52 Aggregate
Depth Thickness
(m) (m) CBR Remark CBR Class Remark CBR Remark
0.00 - 0.10 0.10
0.20 - 0.30 0.10
0.20 - 0.30 0.10
0.30 - 0.40 0.10
0.40 - 0.5 0 0.10
0.50 - 0.60 0.10 25
0.60 - 0.70 0.10 38
0.70 - 0.80 0.10 55
0.80 - 0.90 0.10 43
0.90 - 1.00 0.10 27
1.00 - 1.10 0.10 28
1.10 - 1.20 0.10 30
1.20 - 1.30 0.10 30
DCP Soil SAMPLING CASPOL
DCP Soil SAMPLING CASPOL
Yellow Brown
DCP Soil SAMPLING CASPOL
DCP Soil SAMPLING CASPOL
A-84

Utility (Water Pipe) Investigation Result
Depth ofUtility
Old/New
Eastings Northings (m)
0+700DoeCommunityJunction
Waterpipe
302296 700994 1.27 Old PVC, 4” Major 8
1+230JamaicaJunction
W.P 302631 700972 2.65 Old PVC, 4” Major 5.3
2+175 W.P 303723 700967 0.62 Old PVC, 2” Minor 1.5
2+200200m fromstation 2+000
W.P 303773 700965 0.74 Old PVC, 2” Minor 5
2+650Topo villagejunction
W.P 304200 700912 1.9 Old PVC, 4” Major 13.5
2+800Opp old fillingstation Topovillage
W.P 304351 700903 1.88 Old Galv. 4” Major 2.6
3+400Iron factory,opp Dukuly F.S
W.P 304951 700813 1.68 Old Galv. 4” Major 3.3
4+325By Total F.S,new georgia
W.P 305795 700708 1.75 New PVC, 4” Major Nil
Run Dist.from
Pavementedge (m)
RemarksStation Nr/Chainage
LocationDescription
Servicetype
Coordinates Type,Diameter
SizeRating
A-85
(2) Utility Investigation Result

4+550New Georgiajunction
W.P 305869 700704 1.93 New PVC, 6” Major Nil
4+632Life waterpremises
W.P 306172 700658 2.6 Old PVC, 2” Minor 3 In culvert
4+870 W.P 306412 700621 1.27 Old PVC, 2” Minor 4.5
6+230Barnervillejunction
W.P 307602 700025 2.31 New PVC, 6” Major Nil
6+850 LPRC junction W.P 308148 699673 2.11 New PVC, 4” Major Nil
7+230 NTA junction W.P 308362 699374 1.34 Old PVC, 2” Minor 2.1
8+140Double bridge,Boboh towncommunity
W.P 308457 698566 2.18 New PVC, 6” Major Nil
8+736486m fromdouble bridge
W.P 308774 698456 1.84 Old PVC, 4” Major 3 In culvert
9+320New Hopejunction
W.P 309165 697245 1.73 New PVC, 4” Major Nil
A-86

9+930St. Francisjunction
W.P 310118 697465 2.6 Old Galv. 4” Major 5.7
10+480Jay’s uniquerestaurant
W.P 310503 697207 2.36 Old PVC, 2” Minor 7 In culvert
10+95010m to station11+000
W.P 310631 697110 1.89 New PVC, 4” Major Nil
11+450 In culvert W.P 311420 696915 1.65 Old PVC, 4” Major Nil In culvert
11+820 10m from 72nd
junction to R/LW.P 311590 696938 2.1 New PVC, 4” Major Nil
12+200Close toRedlight park
W.P 312145 696261 1.95 New PVC, 4” Major Nil
12+680Close toshopping mall
W.P 312565 696025 1.85 New PVC, 4” Major Nil
Note ) New : New placed pipe crossing under Phase I and extending under Phase II in near future Old : Pipe crossing under Phase I and Phase II allredy at present
A-87

0+000 0+250 0+500 0+750 1+000 1+250 1+500 1+750 2+000 2+250 2+500 2+750 3+000 3+250 3+500 3+750 4+000 4+250 4+500 4+750 5+000 5+250 5+500 5+750 6+000 6+300 6+500 6+750 7+000 7+250 7+500 7+750 8+000 8+250 8+500 8+750 9+000 9+250 9+500 9+750 10+000 10+250 10+500 10+750 11+000 11+250 11+500 11+750 12+000 12+250 12+500 12+750 13+000 13+250
CBR CBR CBR CBR CBR CBR CBR CBR CBR CBR CBR CBR CBR CBR CBR CBR CBR CBR CBR CBR CBR CBR CBR CBR CBR CBR CBR CBR CBR CBR CBR CBR CBR CBR CBR CBR CBR CBR CBR CBR CBR CBR CBR CBR CBR CBR CBR CBR CBR CBR CBR CBR CBR CBR
調査後、入力 Gap(m) 0.2 0.5 0.3 0 0 0.2 0.2 0.2 0.2 0.4 0.2 0 0.1 -0.2 0 0 -0.1 0 0.1 0.1 0.1 0.1 0.1 0.1 0.1 01st layer 6.25 32 32.26 27.55 8.77 60 20 52 37 58 43 0 0 0 0 0 0 0 0 0 0 0 0 0 0 02nd layer 23 49 40 6.87 15 87 17 26 23 13.75 18 10 10 10 10 10 10 10 10 10 10 10 10 10 10 10
0
10
20
30
40
50
0+00
0
0+25
0
0+50
0
0+75
0
1+00
0
1+25
0
1+50
0
1+75
0
2+00
0
2+25
0
2+50
0
2+75
0
3+00
0
3+25
0
3+50
0
3+75
0
4+00
0
4+25
0
4+50
0
4+75
0
5+00
0
5+25
0
5+50
0
5+75
0
6+00
0
6+25
0
6+50
0
6+75
0
7+00
0
7+25
0
7+50
0
7+75
0
8+00
0
8+25
0
8+50
0
8+75
0
9+00
0
9+25
0
9+50
0
9+75
0
10+0
00
10+2
50
10+5
00
10+7
50
11+0
00
11+2
50
11+5
00
11+7
50
12+0
00
12+2
50
12+5
00
12+7
50
13+0
00
13+2
50
Rut
ting
(m
m)
Distance
Legend: LHS:Light Blue RHS:Red
0
50
100
0+00
0
0+25
0
0+50
0
0+75
0
1+00
0
1+25
0
1+50
0
1+75
0
2+00
0
2+25
0
2+50
0
2+75
0
3+00
0
3+25
0
3+50
0
3+75
0
4+00
0
4+25
0
4+50
0
4+75
0
5+00
0
5+25
0
5+50
0
5+75
0
6+00
0
6+25
0
6+50
0
6+75
0
7+00
0
7+25
0
7+50
0
7+75
0
8+00
0
8+25
0
8+50
0
8+75
0
9+00
0
9+25
0
9+50
0
9+75
0
10+
000
10+
250
10+
500
10+
750
11+
000
11+
250
11+
500
11+
750
12+
000
12+
250
12+
500
12+
750
13+
000
13+
250
Cra
ck R
atio
(%
)
Distance
Legend: LHS:Purple RHS:Blue
0
0.0
0.0
0.0
0.0
0.0
1.5
1.2
0.5
0.5
1.2
1.5
1.2
0.8
0.0
0.4
0.0
1.8
0.3
0.4
0.0
0.0
0.0
0.8
0.8
0.6
0.0
0.6
0.6
0.8
Dou
ble
Bri
dge
1.1
2.0
0.5
0.7
0.3
0.3
0.4
0.0
0.0
0.8
2.5
-1.7 2.5
0.0
0.5
0.5
1.0
0.0
0.0
0.0
Hei
ght
of F
ill
(m)
Distance
-0.50
0.00
0.50
1.00
1.50
2.00
+0 +250 +500 +750 1+000 1+250 1+500 1+750 2+000 2+250 2+500 2+750 3+000 3+250 3+500 3+750 4+000 4+250 4+500 4+750 5+000 5+250 5+500 5+750 6+000 6+250 6+500 6+750 7+000 7+250 7+500 7+750 8+000 8+250 8+500 8+750 9+000 9+250 9+500 9+750 10+000 10+250 10+500 10+750 11+000 11+250 11+500 11+750 12+000 12+250 12+500 12+750 13+000 13+250
Difference b/t existing and planned formation heights (m)
0.000
5.000
10.000
15.000
20.000
+0 +250 +500 +750 1+000 1+250 1+500 1+750 2+000 2+250 2+500 2+750 3+000 3+250 3+500 3+750 4+000 4+250 4+500 4+750 5+000 5+250 5+500 5+750 6+000 6+250 6+500 6+750 7+000 7+250 7+500 7+750 8+000 8+250 8+500 8+750 9+000 9+250 9+500 9+750 10+000 10+250 10+500 10+750 11+000 11+250 11+500 11+750 12+000 12+250 12+500 12+750 13+000 13+250
Longitudinal Profile (m) -------: Existing Road Pavement-------: Planned Road Pavement-------: Natural Ground Elevation
0+000 1+000 2+000 3+000 4+000 5+000 6+000 7+000 8+000 9+000 10+000 11+000 12+000 13+000
UN Road
Free
Por
tIS
0+00
0
Red
Lig
htIS
Jam
aica
Rd.
IS
1+
250
Stoc
kton
Bri
dge
A1:
1+39
9, A
2:1+
463 B
atte
ry F
acto
ry.
IS
2+17
5
New
Geo
rgia
IS
4+38
0
Bar
dnes
vill
e R
d. I
S
6+
250
LPR
C
IS6+
855
Dou
ble
Bri
dge
A1:
8+22
9, A
2:8+
279
Pea
ce I
slan
d C
omm
unity
IS
9+26
0
Reh
ab
IS10
+66
0
Nee
zoe
IS11
+315
72nd
IS
(SK
D R
oad)
11+
800
St. F
ranc
is
C
omm
unity
IS
9+93
0
Kakata Highway
Tabuman Road
Plan View
A-88
3.2 既存道路状況調査結果 ①既存道状況
Figure 7.2-1 Existing Road Condition A-88
7.2 Road Pavement Investigation Result(1) Existing Road Condition

0+000 1+000 2+000 3+000 4+000 5+000 6+000 7+000 8+000 9+000 10+000 11+000 12+000 13+000
2 2 2 2 2 2 2 2 2 2 2 2 2 4 4 4 4 4 4 4 4 7 7 7 7 7 7 7 7 7 4 4 4 4 4 4 6 6 10 10 10 10 6 6 4 4 4 4 4 4 4 4 4 4 6 6 6 6 6 6 6 6 6 6 6 6 6 6 14 14 10 10 13 13 19 19 11 11 2 2 6 6 6 6 6 6 6 6 10 10 3 3 19 19 6 6 6 6 6 6 10 10 10 10 10 14 14 12 12 12 6 6 10 10 10 10 10 10 10 10 6 6 10 10 10 10 10 10 10 10
Subgrade Classification
CBR
Class
Km 0+000 1+000 2+000 3+000 4+000 5+000 6+000 7+000 8+000 9+000 10+000 11+000 12+000 13+000* A part of the section is under HWL of the river at Stockton Bridge.
0.000
0.500
1.000
1.500
Rolling Rolling Rolling
Section
Terrain
0.000
0.500
1.000
1.500
11.1
0.00 - 1.25 1.25 - 6.25 6.25 - 10.66 10.66 - 11.80 11.80 - 13.24
*Flat Flat
UN Road
Fre
e P
ortI
S
WL=GL-1.57m
Red
Lig
htIS
Jam
aica
Rd.
IS
1+25
0
Stoc
kton
Bri
dge
A1:
1+39
9, A
2:1+
463 Bat
tery
Fac
tory
. IS
2+17
5
New
Geo
rgia
IS
4+38
0
Bar
dnes
vill
e R
d. I
S
LPR
C I
S6+
855
Dou
ble
Bri
dge
A1:
8+22
9, A
2:8+
279
Peac
e Is
land
C
omm
unit
y IS
9+26
0
Reh
ab I
S10
+66
0
Nee
zoe
IS11
+31
5
72nd
IS
(SK
D R
oad)
11+8
00
St.
Fra
ncis
C
omm
unit
y IS
9+93
0
Kakata Highway
Tabuman Road
Base (Crushed Stone)Clay
Silt
Asphalt Concrete (AC)
Sand
LEGEND
Dark Gray Clay
Sampled
BrownSilt
Clay Dark Clay
Brown-ish
Clay
Green-ish
Clay
Dark Green
-ishClay
Brown-ishSiltyClay
Brown-ish
Clay
Green-ish
Clay
BrownishClay
w/t Gravel
BrownishLiterite
Brown-ish Clay
w/t Debris
Greenish Silt
Dark Black Sand
Greenish Silty Sand
Laterite
BrownishClay
w/t Gravel Dark
Brownish Clay
Dark Clayly Sand
Dark Greenish
Silty Sand
Light Greenish
Silt
Yellow Clayly Silt
Base (Crushed Stone)Clay
Silt
Sand
LEGEND
Sampled
Dark Clay
Laterite
Asphalt Concrete (AC)
Dark Brown
-ishSand
Brown-ish
SandySilt
Brown-ishSilty Sand
GreenishSilty Clay
BrownishLiterite
w/t Gravel
Redish Literite
YellownishClay w/t Gravel
RedishLateritew/t Clay
A-89
A-89Figure 7.2-2 Result of exploratory excavation
(2) Investigation Result of exploratory excavation on the Existing Road

Feb
. 201
6
Wid
th o
fda
mag
ed
(m)
Lengt
h o
fda
mag
ed
(m)
Are
a of
dam
aged
(m)
Sort
s of da
mege
dW
idth
of
dam
aged
(m)
Lengt
h o
fda
mag
ed
(m)
Are
a of
dam
aged
(m)
Sort
s of da
mege
d
0+
00
00
.0F
ree
Po
rt I
S.
D1
0+
28
00
.01.
030
.030
.0M
ajo
r d
ep
ress
ion
D2
0+
32
00
.01.
07.
07.
0M
ajo
r d
ep
ress
ion
D3
0+
80
00
.01.
020
.020
.0M
ajo
r d
ep
ress
ion
D4
0+
90
00
.01.
020
.020
.0M
ajo
r d
ep
ress
ion
D5-1
1+
78
00
.53.
315
.049
.5S
urfa
ce is
sev
erel
y co
rrup
ted
320
m f
rom
Sto
ckto
n B
rid
ge
D5-2
1+
78
00
.53.
315
.049
.5S
urf
ace
is s
eve
rely
co
rru
pte
d3
20m
fro
m S
tock
ton
Bri
dg
e
D6
4+
25
00
.00.
00.
00.
01.
010
.010
.0M
ajo
r d
ep
ress
ion
130
m f
rom
Ne
w G
oe
rgia
IS
.to
wa
rds
BP
D7
5+
14
00
.00.
00.
00.
02.
015
.030
.0M
ajo
r d
ep
ress
ion
D8
5+
20
00
.00.
00.
00.
01.
015
.015
.0M
ajo
r d
ep
ress
ion
D9
5+
35
00
.00.
00.
00.
02.
06.
012
.0M
ajo
r d
ep
ress
ion
D10
5+
95
00
.00.
00.
00.
01.
01.
01.
0M
ajo
r p
oth
ole
D11
5+
95
50
.00.
00.
00.
01.
010
.010
.0M
ajo
r d
ep
ress
ion
D12
9+
38
01
.50.
00.
00.
01.
07.
07.
0M
ajo
r p
oth
ole
120
m f
rom
Pe
ace
Isl
an
d I
S.
tow
ard
s E
PD
13
9+
49
50
.30.
00.
00.
01.
62.
03.
2M
ajo
r p
oth
ole
D14
9+
81
00
.00.
00.
00.
01.
56.
09.
0M
ajo
r p
oth
ole
12
0m
fro
m S
t.F
ran
cis
IS.
tow
ard
s B
PD
15
11+
02
02
.00.
00.
00.
01.
522
.033
.0M
ajo
r p
oth
ole
D16
11+
10
03
.00.
00.
00.
03.
03.
09.
0S
urf
ace
is s
eve
rely
co
rru
pte
dD
17
11+
24
5-1
.40.
00.
00.
01.
51.
01.
5M
ajo
r p
oth
ole
D18
11+
28
00
.00.
00.
00.
01.
530
.045
.0S
urf
ace
is s
eve
rely
co
rru
pte
dIn
Ne
ezo
e I
S.
D19
11+
70
00
.03.
37.
023
.1M
ajo
r p
oth
ole
Fro
m 7
2n
d I
S.
tow
ard
s B
P
72.6
m2
312.
2m
238
4.8
m2
87,3
84.0
m2
0.44
%
Rem
arks
Tota
lG
rand
tota
lT
ota
l Pa
vem
en
t A
rea
Ma
jor
da
ma
ge
d r
atio
Tab
le-
Out
line
of p
rese
nt m
ajor
dam
aged
loca
tion
on S
omal
ia D
rive
No.
Sta
tion
Hei
ght o
fF
ill(m
)
LHS
RH
S
A-90
(3) Investigation Result of Existing Road damage

Existing Road Surface Condition on the Road NoHeight of
Embankment (m)
TotalCarriageWidth (m)
Date:February 2016 D19 11 + 700 0.0 6.60
11.70 km from Free Port IS 1.54 km from Red Light ISExisting Lane width
(m)3.30
Existing Lanewidth (m)
3.30
Type of DefectsMajor pot-
holeType ofDefects
Major pot-hole
The width ofDefects (m)
3.3The length ofDefects (m)
7.0
Existing Road Surface Condition on the Road NoHeight of
Embankment (m)
TotalCarriageWidth (m)
Date:February 2016 D18 11 + 280 0.0 6.60
11.28 km from Free Port IS 1.96 km from Red Light ISExisting Lane width
(m)3.30
Existing Lanewidth (m)
3.30
Type of DefectsSurface isseverelycorrupted
Type ofDefects
Surface isseverelycorrupted
The width ofDefects (m)
1.5The length ofDefects (m)
30.0
Station
Right hand side towards Red Light IS Right hand side towards Red Light IS
Remarks
From 72nd IS. Towards BP
Left hand side towards Red Light IS Left hand side towards Red Light IS
Station Remarks
Neezoe IS.
A-91

Existing Road Surface Condition on the Road NoHeight of
Embankment (m)
TotalCarriageWidth (m)
Date:February 2016 D17 11 + 245 -1.4 6.60
11.25 km from Free Port IS 2 km from Red Light ISExisting Lane width
(m)3.30
Existing Lanewidth (m)
3.30
Type of DefectsMajor pot-
holeType ofDefects
Major pot-hole
The width ofDefects (m)
1.5The length ofDefects (m)
1.0
Existing Road Surface Condition on the Road NoHeight of
Embankment (m)
TotalCarriageWidth (m)
Date:February 2016 D16 11 + 100 3.0 6.60
11.10 km from Free Port IS 2.14 km from Red Light ISExisting Lane width
(m)3.30
Existing Lanewidth (m)
3.30
Type of DefectsSurface isseverelycorrupted
Type ofDefects
Surface isseverelycorrupted
The width ofDefects (m)
3.0The length ofDefects (m)
3.0
Existing Road Surface Condition on the Road NoHeight of
Embankment (m)
TotalCarriageWidth (m)
Date:February 2016 D15 11 + 20 2.0 6.60
11.02 km from Free Port IS 2.22 km from Red Light ISExisting Lane width
(m)3.30
Existing Lanewidth (m)
3.30
Type of DefectsMajor pot-
holeType ofDefects
Major pot-hole
The width ofDefects (m)
1.5The length ofDefects (m)
22.0
Station
Right hand side towards Red Light IS Right hand side towards Red Light IS
Station
Right hand side towards Red Light IS Right hand side towards Red Light IS
Station
Right hand side towards Red Light IS Right hand side towards Red Light IS
Remarks
Remarks
Remarks
A-92

Existing Road Surface Condition on the Road NoHeight of
Embankment (m)
TotalCarriageWidth (m)
Date:February 2016 D14 9 + 810 0.0 6.60
9.81 km from Free Port IS 3.43 km from Red Light ISExisting Lane width
(m)3.30
Existing Lanewidth (m)
3.30
Type of DefectsMajor pot-
holeType ofDefects
Major pot-hole
The width ofDefects (m)
1.5The length ofDefects (m)
6.0
Existing Road Surface Condition on the Road NoHeight of
Embankment (m)
TotalCarriageWidth (m)
Date:February 2016 D13 9 + 495 0.3 6.60
9.50 km from Free Port IS 3.75 km from Red Light ISExisting Lane width
(m)3.30
Existing Lanewidth (m)
3.30
Type of DefectsMajor pot-
holeType ofDefects
Major pot-hole
The width ofDefects (m)
1.6The length ofDefects (m)
2.0
Existing Road Surface Condition on the Road NoHeight of
Embankment (m)
TotalCarriageWidth (m)
Date:February 2016 D12 9 + 380 1.5 6.60
9.38 km from Free Port IS 3.86 km from Red Light ISExisting Lane width
(m)3.30
Existing Lanewidth (m)
3.30
Type of DefectsMajor pot-
holeType ofDefects
Major pot-hole
The width ofDefects (m)
1.0The length ofDefects (m)
7.0
Right hand side towards Red Light IS Right hand side towards Red Light IS
Right hand side towards Red Light IS Right hand side towards Red Light IS
Station Remarks
120m from Peace Island IS.towards EP
Station Remarks
120m from St.Francis IS. towardsBP
Right hand side towards Red Light IS Right hand side towards Red Light IS
Station Remarks
A-93

Existing Road Surface Condition on the Road NoHeight of
Embankment (m)
TotalCarriageWidth (m)
Date:February 2016 D11 5 + 955 0.0 6.60
5.96 km from Free Port IS 7.29 km from Red Light ISExisting Lane width
(m)3.30
Existing Lanewidth (m)
3.30
Type of DefectsMajor
depressionType ofDefects
Major depression
The width ofDefects (m)
1.0The length ofDefects (m)
10.0
Existing Road Surface Condition on the Road NoHeight of
Embankment (m)
TotalCarriageWidth (m)
Date:February 2016 D10 5 + 950 0.0 6.60
5.95 km from Free Port IS 7.29 km from Red Light ISExisting Lane width
(m)3.30
Existing Lanewidth (m)
3.30
Type of DefectsMajor pot-
holeType ofDefects
Major pot-hole
The width ofDefects (m)
1.0The length ofDefects (m)
1.0
Existing Road Surface Condition on the Road NoHeight of
Embankment (m)
TotalCarriageWidth (m)
Date:February 2016 D9 5 + 350 0.0 6.60
5.35 km from Free Port IS 7.89 km from Red Light ISExisting Lane width
(m)3.30
Existing Lanewidth (m)
3.30
Type of DefectsMajor
depressionType ofDefects
Major depression
The width ofDefects (m)
2.0The length ofDefects (m)
6.0
Station
Right hand side towards Red Light IS Right hand side towards Red Light IS
Station
Remarks
Right hand side towards Red Light IS Right hand side towards Red Light IS
Station Remarks
Right hand side towards Red Light IS Right hand side towards Red Light IS
Remarks
A-94

Existing Road Surface Condition on the Road NoHeight of
Embankment (m)
TotalCarriageWidth (m)
Date:February 2016 D8 5 + 200 0.0 6.60
5.20 km from Free Port IS 8.04 km from Red Light ISExisting Lane width
(m)3.30
Existing Lanewidth (m)
3.30
Type of DefectsMajor
depressionType ofDefects
Major depression
The width ofDefects (m)
1.0The length ofDefects (m)
15.0
Existing Road Surface Condition on the Road NoHeight of
Embankment (m)
TotalCarriageWidth (m)
Date:February 2016 D7 5 + 140 0.0 6.60
5.14 km from Free Port IS 8.1 km from Red Light ISExisting Lane width
(m)3.30
Existing Lanewidth (m)
3.30
Type of DefectsMajor
depressionType ofDefects
Major depression
The width ofDefects (m)
2.0The length ofDefects (m)
15.0
Existing Road Surface Condition on the Road NoHeight of
Embankment (m)
TotalCarriageWidth (m)
Date:February 2016 D6 4 + 250 0.0 6.60
4.25 km from Free Port IS 8.99 km from Red Light ISExisting Lane width
(m)3.30
Existing Lanewidth (m)
3.30
Type of DefectsMajor
depressionType ofDefects
Major depression
The width ofDefects (m)
1.0The length ofDefects (m)
10.0
Right hand side towards Red Light IS Right hand side towards Red Light IS
Right hand side towards Red Light IS Right hand side towards Red Light IS
Station Remarks
130m from New Goergia IS.towards BP
Station Remarks
Right hand side towards Red Light IS Right hand side towards Red Light IS
Station Remarks
A-95

Existing Road Surface Condition on the Road NoHeight of
Embankment (m)
TotalCarriageWidth (m)
Date:February 2016 D5-2 1 + 780 0.5 6.60
1.78 km from Free Port IS 11.46 km from Red Light ISExisting Lane width
(m)3.30
Existing Lanewidth (m)
3.30
Type of DefectsSurface isseverelycorrupted
Type ofDefects
Surface isseverelycorrupted
The width ofDefects (m)
3.3The length ofDefects (m)
15.0
Existing Road Surface Condition on the Road NoHeight of
Embankment (m)
TotalCarriageWidth (m)
Date:February 2016 D5-1 1 + 780 0.5 6.60
1.78 km from Free Port IS 11.46 km from Red Light ISExisting Lane width
(m)3.30
Existing Lanewidth (m)
3.30
Type of DefectsSurface isseverelycorrupted
Type ofDefects
Surface isseverelycorrupted
The width ofDefects (m)
3.3The length ofDefects (m)
15.0
Existing Road Surface Condition on the Road NoHeight of
Embankment (m)
TotalCarriageWidth (m)
Date:February 2016 D4 0 + 900 0.0 6.60
0.90 km from Free Port IS 12.34 km from Red Light ISExisting Lane width
(m)3.30
Existing Lanewidth (m)
3.30
Type of DefectsMajor
depressionType ofDefects
Major depression
The width ofDefects (m)
1.0The length ofDefects (m)
20.0
Station
Left hand side towards Red Light IS Left hand side towards Red Light IS
Station
Remarks
320m from Stockton Bridge
Right hand side towards Red Light IS Right hand side towards Red Light IS
Station Remarks
320m from Stockton Bridge
Right hand side towards Red Light IS Right hand side towards Red Light IS
Remarks
A-96

Existing Road Surface Condition on the Road NoHeight of
Embankment (m)
TotalCarriageWidth (m)
Date:February 2016 D3 0 + 800 0.0 6.60
0.80 km from Free Port IS 12.44 km from Red Light ISExisting Lane width
(m)3.30
Existing Lanewidth (m)
3.30
Type of DefectsMajor
depressionType ofDefects
Major depression
The width ofDefects (m)
1.0The length ofDefects (m)
20.0
Existing Road Surface Condition on the Road NoHeight of
Embankment (m)
TotalCarriageWidth (m)
Date:February 2016 D2 0 + 320 0.0 6.60
0.32 km from Free Port IS 12.92 km from Red Light ISExisting Lane width
(m)3.30
Existing Lanewidth (m)
3.30
Type of DefectsMajor
depressionType ofDefects
Major depression
The width ofDefects (m)
1.0The length ofDefects (m)
7.0
Existing Road Surface Condition on the Road NoHeight of
Embankment (m)
TotalCarriageWidth (m)
Date:February 2016 D1 0 + 280 0.0 6.60
0.28 km from Free Port IS 12.96 km from Red Light ISExisting Lane width
(m)3.30
Existing Lanewidth (m)
3.30
Type of DefectsMajor
depressionType ofDefects
Major depression
The width ofDefects (m)
1.0The length ofDefects (m)
30.0
Right hand side towards Red Light IS Right hand side towards Red Light IS
Right hand side towards Red Light IS Right hand side towards Red Light IS
Station Remarks
Station Remarks
Right hand side towards Red Light IS Right hand side towards Red Light IS
Station Remarks
A-97

Feb. 2016
Depth ofrutting(mm)
Width ofaffected
(m)
Crack ratio(%)
Depth ofrutting(mm)
Width ofaffected
(m)
0+000 0.0 - - - - Free Port IS.1 0+250 0.0 0 4.0 0 4.02 0+500 0.0 0 3.6 15 3.63 0+750 0.0 0 3.4 0 3.44 1+000 0.0 0 3.4 10 3.45 1+250 1.5 0 5.5 13 3.4 Jamaica Road IS6 1+500 1.2 0 3.3 20 3.37 1+750 0.5 0 3.3 12 3.38 2+000 0.0 0 3.3 0 3.39 2+250 0.0 0 3.3 3 3.310 2+500 0.5 0 3.3 16 3.311 2+750 1.2 0 3.4 14 3.412 4+000 0.4 0 3.3 9 3.313 4+250 0.0 0 3.3 50 3.3 Pothole14 5+250 0.0 0 3.3 16 3.315 6+250 0.6 0 3.3 5 3.316 9+500 0.3 8 3.3 4 3.317 11+250 -1.4 0 3.2 8 3.218 11+500 2.5 5 3.3 0 3.319 12+000 0.5 3 3.3 5 3.320 12+500 1.0 0 3.3 5 3.321 12+750 0.0 0 3.3 7 3.3
0.0
Remarks
TotalGrand total
Total Pavement AreaMajor damaged ratio
Note: Measurement with 1m ruler in principal which is used on locations where are on behalf of typical conditions inSomalia Dirve based on existing road survey.
Table- Outline of rutting condition on behalf of present 250m interval road surfacesurvey on Somalia Drive based on existing road surface condition survey
No. StationHeight of
Fill(m)
LHS RHS
A-98
(4) Survey Result of rutting

Existing Road Surface Condition on the Road NoHeight of
Embankment (m)
TotalCarriageWidth (m)
Date:February 2016 21 12 + 750 0.0 6.60
12.75 km from Free Port IS 0.49 km from Red Light ISExisting Lane width
(m)3.30
Existing Lanewidth (m)
3.30
Rutting No Rutting Rutting A Few
The Rutting (mm) 0The Rutting
(mm)7
Existing Road Surface Condition on the Road NoHeight of
Embankment (m)
TotalCarriageWidth (m)
Date:February 2016 20 12 + 500 1.0 6.60
12.50 km from Free Port IS 0.74 km from Red Light ISExisting Lane width
(m)3.30
Existing Lanewidth (m)
3.30
Rutting No Rutting Rutting A Few
The Rutting (mm) 0The Rutting
(mm)5
Existing Road Surface Condition on the Road NoHeight of
Embankment (m)
TotalCarriageWidth (m)
Date:February 2016 19 12 + 0 0.5 6.60
12.00 km from Free Port IS 1.24 km from Red Light ISExisting Lane width
(m)3.30
Existing Lanewidth (m)
3.30
Rutting A Few Rutting A Few
The Rutting (mm) 3The Rutting
(mm)5
Left hand side towards Red Light IS Right hand side towards Red Light IS
Remarks
Station Remarks
Left hand side towards Red Light IS
Right hand side towards Red Light IS
Station
Right hand side towards Red Light IS
Station Remarks
Left hand side towards Red Light IS
A Few : Not more than 10mmModerate : More than 10mm but not more than 20mm
Much : More than 20mmA-99

Existing Road Surface Condition on the Road NoHeight of
Embankment (m)
TotalCarriageWidth (m)
Date:February 2016 18 11 + 500 2.5 6.60
11.50 km from Free Port IS 1.74 km from Red Light ISExisting Lane width
(m)3.30
Existing Lanewidth (m)
3.30
Rutting A Few Rutting No Rutting
The Rutting (mm) 5The Rutting
(mm)0
Existing Road Surface Condition on the Road NoHeight of
Embankment (m)
TotalCarriageWidth (m)
Date:February 2016 17 11 + 250 -1.4 6.40
11.25 km from Free Port IS 1.99 km from Red Light ISExisting Lane width
(m)3.20
Existing Lanewidth (m)
3.20
Rutting No Rutting Rutting A Few
The Rutting (mm) 0The Rutting
(mm)8
Existing Road Surface Condition on the Road NoHeight of
Embankment (m)
TotalCarriageWidth (m)
Date:February 2016 16 9 + 500 0.3 6.60
9.50 km from Free Port IS 3.74 km from Red Light ISExisting Lane width
(m)3.30
Existing Lanewidth (m)
3.30
Rutting A Few Rutting A Few
The Rutting (mm) 8The Rutting
(mm)4
Station Remarks
Left hand side towards Red Light IS Right hand side towards Red Light IS
Station Remarks
Left hand side towards Red Light IS Right hand side towards Red Light IS
Station Remarks
Left hand side towards Red Light IS Right hand side towards Red Light IS
A Few : Not more than 10mmModerate : More than 10mm but not more than 20mm
Much : More than 20mmA-100

Existing Road Surface Condition on the Road NoHeight of
Embankment (m)
TotalCarriageWidth (m)
Date:February 2016 15 6 + 250 0.6 6.60
6.25 km from Free Port IS 6.99 km from Red Light ISExisting Lane width
(m)3.30
Existing Lanewidth (m)
3.30
Rutting No Rutting Rutting A Few
The Rutting (mm) 0The Rutting
(mm)5
Existing Road Surface Condition on the Road NoHeight of
Embankment (m)
TotalCarriageWidth (m)
Date:February 2016 14 5 + 250 0.0 6.60
5.25 km from Free Port IS 7.99 km from Red Light ISExisting Lane width
(m)3.30
Existing Lanewidth (m)
3.30
Rutting No Rutting Rutting Moderate
The Rutting (mm) 0The Rutting
(mm)16
Existing Road Surface Condition on the Road NoHeight of
Embankment (m)
TotalCarriageWidth (m)
Date:February 2016 13 4 + 250 0.0 6.60
4.25 km from Free Port IS 8.99 km from Red Light ISExisting Lane width
(m)3.30
Existing Lanewidth (m)
3.30
Rutting No Rutting Defects Pothole
The Rutting (mm) 0The Rutting
(mm)50
Station Remarks
Left hand side towards Red Light IS Right hand side towards Red Light IS
Station Remarks
Left hand side towards Red Light IS Right hand side towards Red Light IS
Station Remarks
Left hand side towards Red Light IS Right hand side towards Red Light IS
A Few : Not more than 10mmModerate : More than 10mm but not more than 20mm
Much : More than 20mmA-101

Existing Road Surface Condition on the Road NoHeight of
Embankment (m)
TotalCarriageWidth (m)
Date:February 2016 12 4 + 0 0.4 6.60
4.00 km from Free Port IS 9.24 km from Red Light ISExisting Lane width
(m)3.30
Existing Lanewidth (m)
3.30
Rutting No Rutting Rutting A Few
The Rutting (mm) 0The Rutting
(mm)9
Existing Road Surface Condition on the Road NoHeight of
Embankment (m)
TotalCarriageWidth (m)
Date:February 2016 11 2 + 750 1.2 6.80
2.75 km from Free Port IS 10.49 km from Red Light ISExisting Lane width
(m)3.40
Existing Lanewidth (m)
3.40
Rutting No Rutting Rutting Moderate
The Rutting (mm) 0The Rutting
(mm)14
Existing Road Surface Condition on the Road NoHeight of
Embankment (m)
TotalCarriageWidth (m)
Date:February 2016 10 2 + 500 0.5 6.60
2.50 km from Free Port IS 10.74 km from Red Light ISExisting Lane width
(m)3.30
Existing Lanewidth (m)
3.30
Rutting No Rutting Rutting Moderate
The Rutting (mm) 0The Rutting
(mm)16
Station Remarks
Station Remarks
Left hand side towards Red Light IS Right hand side towards Red Light IS
Station Remarks
Left hand side towards Red Light IS Right hand side towards Red Light IS
Left hand side towards Red Light IS Right hand side towards Red Light IS
A Few : Not more than 10mmModerate : More than 10mm but not more than 20mm
Much : More than 20mmA-102

Existing Road Surface Condition on the Road NoHeight of
Embankment (m)
TotalCarriageWidth (m)
Date:February 2016 9 2 + 250 0.0 6.60
2.25 km from Free Port IS 10.99 km from Red Light ISExisting Lane width
(m)3.30
Existing Lanewidth (m)
3.30
Rutting No Rutting Rutting A Few
The Rutting (mm) 0The Rutting
(mm)3
Existing Road Surface Condition on the Road NoHeight of
Embankment (m)
TotalCarriageWidth (m)
Date:February 2016 8 2 + 0 0.0 6.60
2.00 km from Free Port IS 11.24 km from Red Light ISExisting Lane width
(m)3.30
Existing Lanewidth (m)
3.30
Rutting No Rutting Rutting No Rutting
The Rutting (mm) 0The Rutting
(mm)0
Existing Road Surface Condition on the Road NoHeight of
Embankment (m)
TotalCarriageWidth (m)
Date:February 2016 7 1 + 750 0.5 6.60
1.75 km from Free Port IS 11.49 km from Red Light ISExisting Lane width
(m)3.30
Existing Lanewidth (m)
3.30
Rutting No Rutting Rutting Moderate
The Rutting (mm) 0The Rutting
(mm)12
Left hand side towards Red Light IS Right hand side towards Red Light IS
Station Remarks
Left hand side towards Red Light IS Right hand side towards Red Light IS
Station Remarks
There was crocodile cracks.
Station Remarks
Left hand side towards Red Light IS Right hand side towards Red Light IS
A Few : Not more than 10mmModerate : More than 10mm but not more than 20mm
Much : More than 20mmA-103

Existing Road Surface Condition on the Road NoHeight of
Embankment (m)
TotalCarriageWidth (m)
Date:February 2016 6 1 + 500 1.2 6.60
1.50 km from Free Port IS 11.74 km from Red Light ISExisting Lane width
(m)3.30
Existing Lanewidth (m)
3.30
Rutting No Rutting Rutting Moderate
The Rutting (mm) 0The Rutting
(mm)20
Existing Road Surface Condition on the Road NoHeight of
Embankment (m)
TotalCarriageWidth (m)
Date:February 2016 5 1 + 250 1.5 8.90
1.25 km from Free Port IS 11.99 km from Red Light ISExisting Lane width
(m)5.50
Existing Lanewidth (m)
3.40
Rutting No Rutting Rutting Moderate
The Rutting (mm) 0The Rutting
(mm)13
Existing Road Surface Condition on the Road NoHeight of
Embankment (m)
TotalCarriageWidth (m)
Date:February 2016 4 1 + 0 0.5 6.80
1.00 km from Free Port IS 12.24 km from Red Light ISExisting Lane width
(m)3.40
Existing Lanewidth (m)
3.40
Rutting No Rutting Rutting A Few
The Rutting (mm) 0The Rutting
(mm)10
Jamaica IS.
Station Remarks
Left hand side towards Red Light IS Right hand side towards Red Light IS
Station Remarks
Left hand side towards Red Light IS Right hand side towards Red Light IS
Station Remarks
Left hand side towards Red Light IS Right hand side towards Red Light IS
A Few : Not more than 10mmModerate : More than 10mm but not more than 20mm
Much : More than 20mmA-104

Existing Road Surface Condition on the Road NoHeight of
Embankment (m)
TotalCarriageWidth (m)
Date:February 2016 3 0 + 750 0.0 6.80
0.75 km from Free Port IS 12.49 km from Red Light ISExisting Lane width
(m)3.40
Existing Lanewidth (m)
3.40
Rutting No Rutting Rutting No Rutting
The Rutting (mm) 0The Rutting
(mm)0
Existing Road Surface Condition on the Road NoHeight of
Embankment (m)
TotalCarriageWidth (m)
Date:February 2016 2 0 + 500 0.0 7.20
0.50 km from Free Port IS 12.74 km from Red Light ISExisting Lane width
(m)3.60
Existing Lanewidth (m)
3.60
Rutting No Rutting Rutting Moderate
The Rutting (mm) 0The Rutting
(mm)15
Existing Road Surface Condition on the Road NoHeight of
Embankment (m)
TotalCarriageWidth (m)
Date:February 2016 1 0 + 250 0.0 8.00
0.25 km from Free Port IS 12.99 km from Red Light ISExisting Lane width
(m)3.30
Existing Lanewidth (m)
4.00
Rutting No Rutting Rutting No Rutting
The Rutting (mm) 0The Rutting
(mm)0
Station Remarks
Station Remarks
Left hand side towards Red Light IS Right hand side towards Red Light IS
Left hand side towards Red Light IS Right hand side towards Red Light IS
Left hand side towards Red Light IS Right hand side towards Red Light IS
Station Remarks
A Few : Not more than 10mmModerate : More than 10mm but not more than 20mm
Much : More than 20mmA-105

Road Key MapName: Somalia Drive Date:
Location /Waste Station Surveyed by: M.Davies, G.Freeman, R.Blanyen
Direction /From: Freeport To: Redlight Supervised by: Windell Johnson
No。 1 2 3 4 5 6 7 8 9 10
Sedan / Taxi Mini Bus Large Bus Light Truck Heavy Truck Trailor Motorbike Bicycle Pedestrian
Category Wagon / (2-Axle) (> 2-Axle) (Artuculated
Pich-up Truck)
Hours6:00 ~ 6:15 28 57 37 23 16 9 4 14 0 176:15 ~ 6:30 30 49 44 23 0 16 0 15 0 176:30 ~ 6:45 18 28 22 14 2 4 1 16 0 166:45 ~ 7:00 14 14 15 9 5 1 14 0 14 07:00 ~ 7:15 16 21 14 11 0 1 0 16 0 187:15 ~ 7:30 3 21 14 0 0 0 0 11 0 117:30 ~ 7:45 14 35 25 13 4 2 1 12 0 217:45 ~ 8:00 24 42 35 10 7 3 0 12 0 248:00 ~ 8:15 16 35 29 10 0 2 1 22 0 278:15 ~ 8:30 15 35 21 13 4 3 0 7 0 218:30 ~ 8:45 21 49 23 7 2 3 1 12 0 218:45 ~ 9:00 11 35 22 8 3 3 1 21 0 309:00 ~ 9:15 24 56 30 8 2 3 1 10 0 149:15 ~ 9:30 22 28 24 8 7 7 1 8 0 159:30 ~ 9:45 21 70 29 3 1 3 2 18 1 219:45 ~ 10:00 21 44 31 5 7 9 1 7 1 1410:00 ~ 10:15 15 56 23 2 7 7 0 7 0 2510:15 ~ 10:30 28 50 28 3 9 9 4 9 0 2510:30 ~ 10:45 21 39 24 8 5 4 1 14 0 2210:45 ~ 11:00 21 35 21 0 3 5 0 23 0 2111:00 ~ 11:15 29 42 28 3 4 10 3 9 0 2311:15 ~ 11:30 24 48 37 9 5 10 4 19 0 2811:30 ~ 11:45 21 56 18 0 7 11 1 9 0 2311:45 ~ 12:00 45 49 31 2 2 10 1 11 1 2512:00 ~ 12:15 47 42 35 3 7 14 4 15 0 2312:15 ~ 12:30 30 56 28 4 5 11 2 16 2 3012:30 ~ 12:45 30 63 39 1 8 10 4 11 2 2212:45 ~ 13:00 42 84 38 4 3 10 1 21 0 3613:00 ~ 13:15 30 58 23 1 5 14 2 16 0 2613:15 ~ 13:30 40 49 36 1 3 7 2 14 0 3213:30 ~ 13:45 39 49 22 7 3 9 2 17 2 1613:45 ~ 14:00 36 77 24 7 14 9 2 21 0 2614:00 ~ 14:15 70 42 21 10 16 10 7 4 3 1714:15 ~ 14:30 35 15 9 3 1 1 0 5 0 014:30 ~ 14:45 52 25 12 5 4 4 2 2 0 014:45 ~ 15:00 77 22 14 5 21 5 1 6 0 715:00 ~ 15:15 95 22 12 2 14 8 5 10 2 415:15 ~ 15:30 49 28 14 9 9 7 6 4 2 1715:30 ~ 15:45 49 21 5 14 7 22 8 6 1 2515:45 ~ 16:00 77 21 14 9 14 0 8 5 0 2416:00 ~ 16:15 42 28 15 11 10 15 7 5 0 1516:15 ~ 16:30 49 14 14 14 9 7 4 9 2 1216:30 ~ 16:45 80 35 13 7 16 5 8 4 0 2516:45 ~ 17:00 56 28 14 7 14 10 9 6 0 1017:00 ~ 17:15 57 33 21 9 13 11 7 3 1 2117:15 ~ 17:30 77 35 8 7 6 8 4 7 0 517:30 ~ 17:45 56 38 16 7 8 10 4 7 0 517:45 ~ 18:00 105 28 28 7 15 14 5 2 2 718:00 ~ 18:15 106 49 31 23 11 35 16 29 0 4218:15 ~ 18:30 87 35 19 5 9 4 7 12 0 3018:30 ~ 18:45 84 45 19 7 8 5 5 16 0 2818:45 ~ 19:00 109 60 16 13 21 9 8 22 2 3419:00 ~ 19:15 110 40 25 5 3 0 6 23 0 2819:15 ~ 19:30 110 49 30 14 9 6 5 33 0 40
The Preparatory Survey on the Project for Reconstruction of Somalia Drive in Monrovia
(Road Side Traffic Counts Phase II)
2016/3/29
A-106
7.3 Traffic Counts Survey Result(1) 24 Hours Traffic Counts

19:30 ~ 19:45 112 51 20 8 10 3 3 25 0 919:45 ~ 20:00 112 24 15 7 8 0 0 18 0 1020:00 ~ 20:15 70 42 18 12 5 9 7 14 0 520:15 ~ 20:30 77 35 16 21 9 11 7 28 0 020:30 ~ 20:45 64 32 15 7 9 5 5 18 0 820:45 ~ 21:00 46 27 20 10 8 5 4 24 0 221:00 ~ 21:15 35 16 8 8 5 5 4 10 0 721:15 ~ 21:30 28 14 10 3 2 0 5 4 0 021:30 ~ 21:45 39 21 2 3 6 4 0 14 0 021:45 ~ 22:00 55 29 5 6 5 3 2 6 0 622:00 ~ 22:15 54 12 3 0 5 3 0 7 1 1522:15 ~ 22:30 40 12 0 2 0 0 0 5 0 322:30 ~ 22:45 38 5 3 2 1 0 0 6 0 422:45 ~ 23:00 31 6 1 0 0 0 0 7 0 223:00 ~ 23:15 27 5 1 0 1 0 0 0 0 023:15 ~ 23:30 17 5 1 0 2 1 0 3 0 023:30 ~ 23:45 11 1 0 0 0 1 0 1 0 323:45 ~ 0:00 19 1 0 0 0 0 0 1 0 00:00 ~ 0:15 8 8 5 0 4 0 2 0 0 00:15 ~ 0:30 10 4 2 2 0 2 2 0 0 00:30 ~ 0:45 4 6 0 0 2 1 3 0 0 00:45 ~ 1:00 6 4 0 1 3 1 3 0 0 01:00 ~ 1:15 0 0 0 0 0 1 3 0 0 01:15 ~ 1:30 0 0 0 0 0 2 1 0 0 01:30 ~ 1:45 0 0 0 0 0 0 0 0 0 01:45 ~ 2:00 2 0 0 1 0 0 1 0 0 02:00 ~ 2:15 0 0 0 0 0 0 0 0 0 02:15 ~ 2:30 0 0 0 0 0 0 0 0 0 02:30 ~ 2:45 6 3 0 0 0 0 0 0 0 02:45 ~ 3:00 2 0 0 0 2 1 2 0 0 03:00 ~ 3:15 5 0 0 0 2 0 0 0 0 03:15 ~ 3:30 0 0 0 0 0 0 0 0 0 03:30 ~ 3:45 0 0 0 0 0 0 1 0 0 03:45 ~ 4:00 13 4 0 0 0 4 3 0 0 04:00 ~ 4:15 42 14 21 6 2 8 2 12 0 34:15 ~ 4:30 49 16 3 4 1 4 6 17 0 24:30 ~ 4:45 56 23 3 9 5 7 5 11 0 284:45 ~ 5:00 56 29 8 5 5 3 1 21 0 255:00 ~ 5:15 70 34 13 8 4 4 5 12 0 145:15 ~ 5:30 48 25 22 4 6 5 3 15 0 205:30 ~ 5:45 70 35 21 9 5 7 3 13 0 165:45 ~ 6:00 56 30 14 8 8 4 4 5 0 20
Total Traffic 3806 2758 1490 559 513 519 280 950 39 1288
A-107

Road Key MapName: Somalia Drive Date:
Location /Waste Station Surveyed by: Freeman, Ajavon, M.Davies
Direction /From: Redlight To: Freeport Supervised by: Windell Johnson
No。 1 2 3 4 5 6 7 8 9 10
Sedan / Taxi Mini Bus Large Bus Light Truck Heavy Truck Trailor Motorbike Bicycle Pedestrian
Category Wagon / (2-Axle) (> 2-Axle) (Artuculated
Pich-up Truck)
Hours6:00 ~ 6:15 63 33 25 19 21 12 7 14 0 96:15 ~ 6:30 77 18 42 22 11 4 3 13 0 46:30 ~ 6:45 77 19 23 21 11 14 9 19 9 176:45 ~ 7:00 106 32 35 21 5 10 8 25 0 317:00 ~ 7:15 119 66 70 57 17 19 13 42 9 807:15 ~ 7:30 91 28 21 19 2 5 2 17 0 407:30 ~ 7:45 126 35 33 30 13 16 9 23 11 497:45 ~ 8:00 63 11 10 8 4 5 5 21 0 188:00 ~ 8:15 95 24 23 10 13 18 9 29 8 248:15 ~ 8:30 60 18 10 9 2 2 2 19 0 228:30 ~ 8:45 35 35 35 35 35 35 0 35 5 198:45 ~ 9:00 35 21 7 11 3 3 2 7 0 49:00 ~ 9:15 93 26 19 4 7 5 1 18 0 119:15 ~ 9:30 54 4 13 4 3 3 0 9 0 159:30 ~ 9:45 45 27 17 5 10 5 3 16 0 179:45 ~ 10:00 61 15 13 5 4 1 2 5 0 910:00 ~ 10:15 49 23 18 5 5 1 1 11 1 1010:15 ~ 10:30 14 14 14 7 8 10 0 11 0 1410:30 ~ 10:45 24 11 16 0 0 0 0 17 0 1410:45 ~ 11:00 59 28 21 10 10 2 2 8 0 1811:00 ~ 11:15 70 28 14 12 7 6 5 15 0 211:15 ~ 11:30 49 16 9 13 7 7 3 12 0 1811:30 ~ 11:45 66 20 18 3 0 7 3 21 0 1211:45 ~ 12:00 60 14 17 4 3 6 3 14 0 012:00 ~ 12:15 20 15 10 3 7 3 2 9 0 1112:15 ~ 12:30 48 8 8 1 1 0 1 12 1 112:30 ~ 12:45 33 9 4 5 9 0 0 9 0 712:45 ~ 13:00 45 20 23 4 5 0 1 26 1 113:00 ~ 13:15 56 9 15 1 2 0 1 16 0 013:15 ~ 13:30 69 19 11 1 8 2 4 25 1 013:30 ~ 13:45 57 18 17 2 7 6 0 7 0 1113:45 ~ 14:00 28 15 11 7 6 8 5 28 3 914:00 ~ 14:15 66 40 17 9 15 8 9 19 0 2014:15 ~ 14:30 36 15 14 3 7 2 1 6 0 014:30 ~ 14:45 63 22 21 10 0 3 1 0 0 014:45 ~ 15:00 49 25 16 0 7 10 5 4 0 915:00 ~ 15:15 109 49 18 6 10 12 3 14 2 615:15 ~ 15:30 70 35 10 6 14 9 7 9 0 1415:30 ~ 15:45 56 35 21 14 9 10 5 3 0 1615:45 ~ 16:00 31 15 9 5 6 8 8 5 0 1316:00 ~ 16:15 35 14 10 14 8 7 6 3 0 1416:15 ~ 16:30 50 29 7 15 6 4 5 21 0 1416:30 ~ 16:45 63 35 15 11 15 8 7 10 0 1316:45 ~ 17:00 35 22 15 7 9 4 2 9 0 317:00 ~ 17:15 28 15 13 20 9 8 6 3 0 4917:15 ~ 17:30 66 35 7 10 11 13 7 14 0 3517:30 ~ 17:45 42 23 17 13 7 14 6 10 0 5217:45 ~ 18:00 57 32 9 6 5 8 3 35 0 3518:00 ~ 18:15 35 21 5 13 5 7 9 14 2 2718:15 ~ 18:30 94 56 17 11 4 10 5 28 0 1318:30 ~ 18:45 68 42 28 7 6 8 9 7 0 2618:45 ~ 19:00 78 44 27 2 2 0 3 14 0 1519:00 ~ 19:15 53 31 10 25 13 7 1 22 0 619:15 ~ 19:30 59 35 12 7 7 2 3 18 0 0
The Preparatory Survey on the Project for Reconstruction of Somalia Drive in Monrovia
(Road Side Traffic Counts Phase II)
2016/3/29
A-108

19:30 ~ 19:45 64 24 12 12 10 3 0 15 0 019:45 ~ 20:00 91 13 8 6 4 4 0 12 0 020:00 ~ 20:15 35 21 8 7 3 6 5 21 0 520:15 ~ 20:30 60 26 5 3 7 2 2 8 0 020:30 ~ 20:45 49 21 7 6 9 7 5 25 0 220:45 ~ 21:00 31 16 5 4 7 4 2 21 0 021:00 ~ 21:15 36 20 7 5 3 6 4 5 0 421:15 ~ 21:30 42 14 7 4 4 7 3 5 0 021:30 ~ 21:45 32 16 3 4 4 2 4 2 0 021:45 ~ 22:00 51 23 0 3 1 4 2 15 0 422:00 ~ 22:15 35 7 5 1 1 0 2 2 0 322:15 ~ 22:30 27 11 0 0 1 0 0 4 0 022:30 ~ 22:45 34 6 4 2 1 0 4 3 0 022:45 ~ 23:00 17 3 1 0 0 0 3 7 0 023:00 ~ 23:15 31 3 1 0 1 1 1 0 0 023:15 ~ 23:30 14 0 0 0 0 0 1 2 0 023:30 ~ 23:45 7 2 0 0 0 0 0 2 0 123:45 ~ 0:00 10 2 1 0 0 0 0 0 0 00:00 ~ 0:15 3 4 0 0 0 2 1 0 0 00:15 ~ 0:30 20 12 7 2 6 2 1 0 0 00:30 ~ 0:45 15 7 3 0 3 0 3 0 0 00:45 ~ 1:00 7 4 1 0 0 2 0 0 0 01:00 ~ 1:15 2 0 0 2 0 4 4 0 0 01:15 ~ 1:30 4 0 0 0 2 2 2 0 0 01:30 ~ 1:45 5 0 0 0 2 0 3 0 0 01:45 ~ 2:00 0 0 0 0 3 1 2 0 0 02:00 ~ 2:15 16 8 0 0 0 0 0 4 0 02:15 ~ 2:30 7 3 0 0 0 0 0 0 0 02:30 ~ 2:45 4 0 0 0 0 0 0 0 0 02:45 ~ 3:00 0 0 0 0 0 0 0 0 0 03:00 ~ 3:15 4 2 0 0 0 0 0 0 0 03:15 ~ 3:30 0 0 0 0 0 0 0 0 0 03:30 ~ 3:45 6 0 0 0 0 0 0 0 0 03:45 ~ 4:00 7 4 0 0 0 0 0 0 0 04:00 ~ 4:15 10 7 4 0 0 0 0 7 0 04:15 ~ 4:30 8 6 0 0 0 0 0 4 0 04:30 ~ 4:45 14 7 5 0 0 0 0 8 0 04:45 ~ 5:00 12 13 3 4 2 1 0 6 0 05:00 ~ 5:15 20 9 5 2 5 4 0 3 0 05:15 ~ 5:30 8 12 0 6 6 0 0 8 0 05:30 ~ 5:45 29 15 10 6 5 3 4 10 0 05:45 ~ 6:00 22 9 6 5 8 5 3 7 0 4
Total Traffic 4079 1699 1058 656 519 449 278 1027 53 900
A-109

Road Key MapName: Somalia Drive Date:
Location /Waste Station Surveyed by: Y. Kaba, A. Ajavon, W.Jensen
Direction /From: Freeport To: Redlight Supervised by: windell Johnson
No。 1 2 3 4 5 6 7 8 9 10
Sedan / Taxi Mini Bus Large Bus Light Truck Heavy Truck Trailor Motorbike Bicycle Pedestrian
Category Wagon / (2-Axle) (> 2-Axle) (Artuculated
Pich-up Truck)
Hours6:00 ~ 6:15 80 17 33 7 6 5 3 7 1 16:15 ~ 6:30 75 15 27 9 4 7 3 5 1 16:30 ~ 6:45 77 25 27 9 5 3 1 3 0 16:45 ~ 7:00 81 21 27 8 6 7 1 12 0 67:00 ~ 7:15 154 27 38 10 4 8 2 7 0 207:15 ~ 7:30 94 12 14 5 8 4 1 13 2 177:30 ~ 7:45 82 13 22 9 10 9 3 8 1 137:45 ~ 8:00 91 17 14 6 8 3 3 2 0 138:00 ~ 8:15 70 19 17 5 7 5 0 18 0 308:15 ~ 8:30 62 19 5 3 8 2 2 18 0 108:30 ~ 8:45 56 8 10 4 3 0 1 29 1 108:45 ~ 9:00 38 15 9 4 10 3 3 16 0 79:00 ~ 9:15 78 16 11 5 6 7 2 26 0 79:15 ~ 9:30 77 23 13 5 4 4 1 7 0 49:30 ~ 9:45 72 22 16 5 10 2 0 11 0 29:45 ~ 10:00 82 19 11 7 0 2 0 14 0 1510:00 ~ 10:15 47 16 12 1 1 0 0 11 0 710:15 ~ 10:30 13 30 14 6 12 3 0 18 0 810:30 ~ 10:45 52 13 10 3 4 3 1 4 0 010:45 ~ 11:00 65 13 7 0 2 3 2 3 1 111:00 ~ 11:15 23 6 3 2 3 0 0 1 0 011:15 ~ 11:30 30 9 5 4 2 1 2 5 0 211:30 ~ 11:45 36 14 9 4 5 1 0 6 0 211:45 ~ 12:00 34 12 11 2 8 4 0 14 0 012:00 ~ 12:15 62 25 14 2 7 0 1 14 0 312:15 ~ 12:30 35 11 6 1 3 2 1 3 0 712:30 ~ 12:45 57 10 12 3 4 6 3 8 1 1912:45 ~ 13:00 69 20 13 5 3 1 0 9 1 1413:00 ~ 13:15 56 31 17 1 3 5 1 10 0 213:15 ~ 13:30 76 16 9 3 3 8 1 14 2 713:30 ~ 13:45 48 7 9 2 4 2 1 7 0 213:45 ~ 14:00 41 23 18 3 7 7 3 4 1 714:00 ~ 14:15 42 14 13 4 6 2 1 6 0 014:15 ~ 14:30 49 17 19 2 3 2 0 5 0 114:30 ~ 14:45 59 15 21 5 4 1 1 10 1 514:45 ~ 15:00 32 18 10 4 8 1 1 7 1 215:00 ~ 15:15 35 20 13 3 4 1 1 7 1 415:15 ~ 15:30 50 10 13 2 4 1 2 8 1 515:30 ~ 15:45 52 17 18 4 8 3 2 7 1 115:45 ~ 16:00 35 5 14 1 7 1 1 5 1 516:00 ~ 16:15 64 30 24 5 7 3 3 1 1 916:15 ~ 16:30 41 14 12 3 5 1 1 9 0 1116:30 ~ 16:45 38 13 17 5 5 5 2 10 0 316:45 ~ 17:00 67 12 14 5 6 7 1 7 1 5
The Preparatory Survey on the Project for Reconstruction of Somalia Drive in Monrovia
(Road Side Traffic Counts Phase II)
2016/3/30
A-110

17:00 ~ 17:15 54 21 12 7 7 2 1 13 1 417:15 ~ 17:30 34 16 10 7 4 3 1 9 1 417:30 ~ 17:45 40 15 10 3 4 1 2 3 2 517:45 ~ 18:00 37 12 14 4 4 1 0 12 0 418:00 ~ 18:15 72 31 24 9 6 7 5 21 2 2518:15 ~ 18:30 68 24 11 13 7 5 7 35 3 4018:30 ~ 18:45 79 38 24 16 6 9 9 35 0 2318:45 ~ 19:00 73 35 13 7 9 5 5 28 0 2819:00 ~ 19:15 59 20 6 5 8 4 3 31 0 2219:15 ~ 19:30 61 18 13 8 3 9 7 28 2 1619:30 ~ 19:45 42 27 12 19 15 6 8 18 0 1719:45 ~ 20:00 30 12 6 7 17 5 5 28 1 2220:00 ~ 20:15 35 19 7 9 6 7 4 22 0 1420:15 ~ 20:30 43 10 6 3 5 2 3 12 0 2120:30 ~ 20:45 35 15 8 5 4 6 3 8 0 920:45 ~ 21:00 37 15 12 6 6 4 3 14 0 1521:00 ~ 21:15 30 13 6 6 10 6 7 28 0 2021:15 ~ 21:30 23 9 5 2 14 7 5 23 0 1921:30 ~ 21:45 30 14 4 2 4 5 2 15 0 2421:45 ~ 22:00 30 14 7 4 3 3 5 14 0 420:00 ~ 22:15 22 12 2 0 8 7 2 9 0 322:15 ~ 22:30 30 10 14 0 3 1 5 6 0 322:30 ~ 22:45 21 7 4 0 7 4 7 11 0 722:45 ~ 23:00 28 8 5 2 9 3 6 8 0 223:00 ~ 23:15 19 10 2 0 8 1 4 8 0 1123:15 ~ 23:30 21 7 1 0 6 4 4 12 0 323:30 ~ 23:45 18 10 2 0 8 2 3 3 0 023:45 ~ 0:00 36 9 0 0 5 6 0 0 0 00:00 ~ 0:15 21 19 4 0 4 0 3 0 0 00:15 ~ 0:30 21 14 10 0 6 0 0 0 0 00:30 ~ 0:45 14 4 0 0 6 0 2 0 0 00:45 ~ 1:00 16 6 0 1 2 4 0 0 0 01:00 ~ 1:15 10 4 0 0 5 0 3 0 0 01:15 ~ 1:30 13 3 0 0 0 0 1 0 0 01:30 ~ 1:45 7 3 0 0 2 0 1 0 0 01:45 ~ 2:00 9 2 0 0 0 0 0 0 0 02:00 ~ 2:15 14 6 0 0 5 0 2 0 0 02:15 ~ 2:30 5 0 0 0 1 0 0 0 02:30 ~ 2:45 7 0 0 0 3 0 0 0 0 02:45 ~ 3:00 6 0 0 0 3 0 1 0 0 03:00 ~ 3:15 3 0 0 0 0 0 3 0 0 03:15 ~ 3:30 4 0 0 0 0 0 0 0 0 03:30 ~ 3:45 0 0 0 0 5 4 2 0 0 03:45 ~ 4:00 7 2 0 0 5 4 2 0 0 04:00 ~ 4:15 9 6 7 0 6 4 6 5 0 04:15 ~ 4:30 20 8 5 0 10 5 5 2 0 04:30 ~ 4:45 15 7 3 0 6 4 4 5 0 04:45 ~ 5:00 23 9 7 0 7 9 7 10 0 05:00 ~ 5:15 39 14 11 5 7 5 8 18 0 145:15 ~ 5:30 28 15 8 3 9 6 6 21 0 165:30 ~ 5:45 20 12 4 0 4 7 3 16 0 125:45 ~ 6:00 30 15 6 6 5 5 6 10 0 12
Total Traffic 3226 998 806 291 327 202 111 670 32 499
A-111

Road Key MapName: Somalia Drive Date:
Location /Waste Station Surveyed by: R.Blanyen, T.Jensen, W.Jensen
Direction /From: Redlight To: Freeport Supervised by: Windell Johnson
No。 1 2 3 4 5 6 7 8 9 10
Sedan / Taxi Mini Bus Large Bus Light Truck Heavy Truck Trailor Motorbike Bicycle Pedestrian
Category Wagon / (2-Axle) (> 2-Axle) (Artuculated
Pich-up Truck)
Hours6:00 ~ 6:15 25 5 18 9 0 3 1 3 0 16:15 ~ 6:30 14 6 21 10 1 3 1 3 0 16:30 ~ 6:45 17 5 31 4 4 2 1 6 1 06:45 ~ 7:00 23 8 21 13 0 4 1 6 0 27:00 ~ 7:15 28 10 6 5 5 0 1 11 2 07:15 ~ 7:30 28 16 12 11 2 0 0 10 0 07:30 ~ 7:45 45 18 24 10 5 3 0 13 0 07:45 ~ 8:00 35 19 18 3 0 0 0 17 1 38:00 ~ 8:15 42 15 23 5 1 0 0 12 0 18:15 ~ 8:30 48 22 17 5 8 1 0 14 0 58:30 ~ 8:45 42 19 21 7 2 0 1 17 0 38:45 ~ 9:00 70 30 16 7 0 4 1 16 2 09:00 ~ 9:15 45 16 14 8 3 0 1 1 0 09:15 ~ 9:30 21 14 18 7 14 8 0 4 0 79:30 ~ 9:45 76 45 32 8 13 2 5 8 4 09:45 ~ 10:00 44 15 20 10 7 8 3 8 0 410:00 ~ 10:15 54 36 29 4 7 2 2 9 0 210:15 ~ 10:30 51 11 20 6 7 2 0 7 1 310:30 ~ 10:45 51 23 30 4 8 1 2 8 0 210:45 ~ 11:00 79 19 18 5 10 2 5 12 0 011:00 ~ 11:15 42 21 14 1 7 5 0 3 0 011:15 ~ 11:30 60 39 23 21 7 2 4 6 0 011:30 ~ 11:45 73 51 34 23 18 11 3 1 1 011:45 ~ 12:00 31 28 20 12 15 8 1 2 0 012:00 ~ 12:15 42 12 14 6 8 4 4 2 0 012:15 ~ 12:30 91 74 66 49 26 14 8 3 0 012:30 ~ 12:45 21 13 11 6 3 0 3 2 0 012:45 ~ 13:00 66 29 17 4 10 3 2 16 0 113:00 ~ 13:15 73 24 19 3 10 3 3 9 2 113:15 ~ 13:30 64 16 11 0 16 2 1 8 0 113:30 ~ 13:45 54 21 14 3 9 4 1 11 3 4113:45 ~ 14:00 45 20 19 0 7 2 0 3 2 214:00 ~ 14:15 66 19 10 2 7 2 1 17 0 2114:15 ~ 14:30 50 15 7 1 1 1 1 8 2 2214:30 ~ 14:45 79 20 19 3 19 0 3 8 0 3114:45 ~ 15:00 40 14 14 2 2 0 1 5 0 2415:00 ~ 15:15 63 23 8 4 10 3 0 8 2 2115:15 ~ 15:30 56 15 10 1 7 3 9 10 1 915:30 ~ 15:45 38 17 14 11 14 3 8 15 3 715:45 ~ 16:00 51 16 9 4 2 4 1 3 0 416:00 ~ 16:15 27 14 11 5 7 3 2 7 0 816:15 ~ 16:30 17 10 9 2 6 4 0 7 2 716:30 ~ 16:45 49 9 8 2 5 5 3 7 2 716:45 ~ 17:00 37 21 17 5 5 2 1 10 3 2417:00 ~ 17:15 28 5 6 3 2 4 2 7 0 1117:15 ~ 17:30 32 10 7 9 2 4 2 7 4 217:30 ~ 17:45 14 8 6 4 2 1 2 3 1 10
The Preparatory Survey on the Project for Reconstruction of Somalia Drive in Monrovia
(Road Side Traffic Counts Phase II)
2016/3/30
A-112

17:45 ~ 18:00 60 11 10 5 5 4 1 10 0 018:00 ~ 18:15 75 21 21 15 7 12 16 35 5 2618:15 ~ 18:30 105 35 13 6 8 4 12 22 2 2118:30 ~ 18:45 94 22 15 7 5 5 0 21 5 1618:45 ~ 19:00 93 21 16 8 7 1 7 17 0 1019:00 ~ 19:15 91 24 15 8 8 2 1 31 4 2319:15 ~ 19:30 91 24 13 7 3 0 0 19 1 2019:30 ~ 19:45 86 26 8 7 1 1 0 18 0 2819:45 ~ 20:00 141 26 12 13 2 1 1 26 1 1820:00 ~ 20:15 82 10 19 4 8 2 2 19 0 820:15 ~ 20:30 55 20 6 1 0 1 0 14 1 420:30 ~ 20:45 63 28 20 11 6 12 11 28 4 2120:45 ~ 21:00 68 41 28 13 10 18 5 32 5 3021:00 ~ 21:15 91 32 19 12 6 9 10 27 0 1521:15 ~ 21:30 65 20 11 10 5 8 4 17 0 1421:30 ~ 21:45 44 17 4 11 9 3 6 7 0 1821:45 ~ 22:00 33 16 6 5 12 5 7 13 0 1322:00 ~ 22:15 24 12 5 6 3 2 5 12 0 322:15 ~ 22:30 18 8 3 3 3 7 2 7 0 022:30 ~ 22:45 59 15 5 4 7 5 7 4 0 422:45 ~ 23:00 24 8 2 6 1 3 1 0 0 123:00 ~ 23:15 25 13 5 5 1 7 5 2 0 223:15 ~ 23:30 22 7 7 7 3 2 2 0 0 023:30 ~ 23:45 18 6 3 2 7 6 4 4 0 223:45 ~ 0:00 23 11 3 3 0 2 2 0 0 00:00 ~ 0:15 32 12 2 0 3 3 4 1 0 00:15 ~ 0:30 16 4 0 3 1 5 1 0 0 00:30 ~ 0:45 36 10 5 2 4 7 3 3 0 20:45 ~ 1:00 23 4 1 1 5 0 2 0 0 01:00 ~ 1:15 17 7 0 0 3 4 3 0 0 01:15 ~ 1:30 15 7 3 2 0 2 0 5 0 01:30 ~ 1:45 6 0 0 0 0 0 0 0 0 01:45 ~ 2:00 4 0 0 0 0 0 0 0 0 02:00 ~ 2:15 0 0 0 0 0 0 0 0 0 02:15 ~ 2:30 4 2 0 0 0 0 0 0 0 02:30 ~ 2:45 3 0 0 0 0 0 0 0 0 02:45 ~ 3:00 7 4 0 0 0 0 0 0 0 03:00 ~ 3:15 10 4 0 0 0 0 0 0 0 03:15 ~ 3:30 7 4 0 0 0 3 2 0 0 03:30 ~ 3:45 10 7 5 3 3 4 2 3 0 03:45 ~ 4:00 11 4 5 3 5 3 3 1 0 04:00 ~ 4:15 12 5 5 4 6 4 3 6 0 04:15 ~ 4:30 18 7 7 6 4 2 1 4 0 04:30 ~ 4:45 12 6 4 6 4 4 3 8 0 04:45 ~ 5:00 14 8 10 7 4 3 2 3 0 05:00 ~ 5:15 21 10 7 5 4 2 3 7 0 05:15 ~ 5:30 23 12 10 5 3 1 1 5 0 05:30 ~ 5:45 18 11 7 6 4 7 3 5 0 05:45 ~ 6:00 21 14 7 8 4 3 6 8 0 0
Total Traffic 4037 1532 1173 567 508 321 244 817 67 587
A-113

Road Key MapName: Somalia Drive Date:
Location /N.T.A. Surveyed by: George Grabo
Direction /From: Freeport To: Redlight Supervised by: Dave S. Sourie
No。 1 2 3 4 5 6 7 8 9 10
Sedan / Taxi Mini Bus Large Bus Light Truck Heavy Truck Trailor Motorbike Bicycle Pedestrian
Category Wagon / (2-Axle) (> 2-Axle) (Articulated
Pick-up Truck)
Hours6:00 ~ 6:15 42 23 21 9 6 3 0 7 0 06:15 ~ 6:30 49 31 13 5 0 0 0 12 0 06:30 ~ 6:45 56 28 14 7 4 0 2 16 0 06:45 ~ 7:00 49 27 24 7 4 0 1 4 0 37:00 ~ 7:15 78 21 25 5 2 2 1 7 0 47:15 ~ 7:30 73 17 22 4 2 1 2 11 0 97:30 ~ 7:45 52 21 25 4 5 0 0 14 0 77:45 ~ 8:00 76 35 25 6 5 1 0 15 0 158:00 ~ 8:15 74 29 21 2 6 1 0 14 0 208:15 ~ 8:30 68 30 19 4 4 3 0 15 0 248:30 ~ 8:45 76 40 16 2 6 2 0 14 0 168:45 ~ 9:00 68 24 26 4 4 0 0 9 1 119:00 ~ 9:15 84 35 13 1 11 4 1 14 0 189:15 ~ 9:30 75 30 19 5 9 1 0 12 2 369:30 ~ 9:45 80 33 23 1 6 3 1 17 0 379:45 ~ 10:00 52 21 21 4 12 2 0 9 0 3210:00 ~ 10:15 54 23 11 1 2 2 0 14 0 3010:15 ~ 10:30 54 23 17 3 6 1 0 8 0 1810:30 ~ 10:45 86 21 24 4 13 1 1 8 0 2810:45 ~ 11:00 83 21 23 1 15 4 4 8 0 1211:00 ~ 11:15 56 26 14 0 12 2 0 10 1 1911:15 ~ 11:30 41 13 5 0 2 1 1 11 0 2311:30 ~ 11:45 58 24 15 3 5 1 0 9 0 5211:45 ~ 12:00 64 23 10 2 1 1 0 9 0 3312:00 ~ 12:15 54 26 9 1 7 4 0 16 1 912:15 ~ 12:30 45 29 11 1 2 6 0 6 1 1112:30 ~ 12:45 35 23 11 0 4 3 0 13 2 1912:45 ~ 13:00 33 31 21 2 5 3 0 4 1 1213:00 ~ 13:15 50 29 27 2 9 35 0 5 3 1913:15 ~ 13:30 12 13 5 1 2 14 0 3 0 713:30 ~ 13:45 58 52 19 2 9 21 0 8 0 1913:45 ~ 14:00 32 24 9 1 3 10 0 7 0 1214:00 ~ 14:15 32 31 6 1 4 4 0 7 1 1014:15 ~ 14:30 17 8 5 0 4 2 0 2 0 514:30 ~ 14:45 13 8 7 1 0 3 0 5 0 814:45 ~ 15:00 45 44 22 5 14 11 0 13 0 1115:00 ~ 15:15 46 23 20 2 9 8 0 11 0 1215:15 ~ 15:30 43 36 15 3 4 9 0 8 0 515:30 ~ 15:45 39 34 12 3 5 3 0 7 0 915:45 ~ 16:00 33 29 16 0 8 12 0 10 0 1116:00 ~ 16:15 40 49 19 0 6 4 0 11 0 816:15 ~ 16:30 63 43 28 0 5 7 0 11 0 916:30 ~ 16:45 31 23 13 1 3 5 0 7 1 916:45 ~ 17:00 44 59 14 2 6 8 0 11 3 1017:00 ~ 17:15 60 44 13 3 2 4 0 14 0 2117:15 ~ 17:30 49 47 16 5 0 4 0 12 0 1717:30 ~ 17:45 27 40 9 0 3 2 0 6 2 917:45 ~ 18:00 39 40 9 3 3 4 0 14 0 12
Total Traffic 2488 1404 782 123 259 222 14 478 19 721
The Preparatory Survey for the Reconstruction of Somalia Drive in Monrovia (Phase 2)
(Road Side Traffic Counts)
31/03/2016
A-114
7.3 Traffic Counts Survey Result(2) 12 Hours Traffic Counts

Road Key MapName: Somalia Drive Date:
Location /N.T.A. Surveyed by: Joshua Tarpeh
Direction /From: Redlight To: Freeport Supervised by: Dave S. Sourie
No。 1 2 3 4 5 6 7 8 9 10
Sedan / Taxi Mini Bus Large Bus Light Truck Heavy Truck Trailor Motorbike Bicycle Pedestrian
Category Wagon / (2-Axle) (> 2-Axle) (Articulated
Pick-up Truck)
Hours6:00 ~ 6:15 24 12 11 3 1 2 0 1 0 106:15 ~ 6:30 23 11 13 2 3 1 1 6 0 146:30 ~ 6:45 42 23 15 8 4 4 2 5 0 316:45 ~ 7:00 36 11 11 1 1 4 0 13 0 267:00 ~ 7:15 43 17 9 4 2 2 1 14 1 267:15 ~ 7:30 30 24 13 4 6 4 2 8 0 307:30 ~ 7:45 52 21 11 3 3 4 2 19 0 297:45 ~ 8:00 53 27 15 2 2 5 0 17 0 628:00 ~ 8:15 63 22 13 1 6 0 1 7 0 758:15 ~ 8:30 80 19 30 1 4 3 3 18 0 1048:30 ~ 8:45 52 25 14 5 7 1 0 9 0 808:45 ~ 9:00 51 25 4 0 2 2 0 10 0 389:00 ~ 9:15 44 19 20 1 1 0 1 9 0 609:15 ~ 9:30 45 24 18 4 4 2 0 4 1 469:30 ~ 9:45 49 23 12 3 5 0 0 10 0 399:45 ~ 10:00 58 21 13 4 5 3 2 11 0 4110:00 ~ 10:15 59 27 18 1 5 2 1 13 0 4610:15 ~ 10:30 42 24 5 3 7 2 0 8 0 4610:30 ~ 10:45 39 12 16 0 3 1 1 7 0 3210:45 ~ 11:00 48 43 14 3 4 1 2 6 0 2911:00 ~ 11:15 46 21 11 1 4 2 3 10 0 2311:15 ~ 11:30 44 22 11 2 5 1 0 7 1 4111:30 ~ 11:45 38 10 7 0 1 2 0 8 0 4611:45 ~ 12:00 29 16 10 1 4 2 0 5 0 3012:00 ~ 12:15 92 93 80 26 23 31 0 24 0 9812:15 ~ 12:30 75 80 64 0 2 23 2 8 2 8212:30 ~ 12:45 94 99 40 7 28 34 17 32 12 9412:45 ~ 13:00 83 86 73 16 24 6 0 33 4 8913:00 ~ 13:15 107 119 110 56 36 38 18 81 0 11913:15 ~ 13:30 164 146 133 94 123 135 112 100 88 15013:30 ~ 13:45 84 56 98 11 21 27 5 23 0 9813:45 ~ 14:00 84 75 59 51 9 36 0 31 1 8414:00 ~ 14:15 89 98 71 13 22 3 11 67 3 8714:15 ~ 14:30 73 92 60 7 22 3 4 24 0 8014:30 ~ 14:45 63 86 79 30 7 35 2 39 16 9314:45 ~ 15:00 84 105 112 42 58 35 23 56 14 11215:00 ~ 15:15 66 77 50 28 10 29 19 51 16 7715:15 ~ 15:30 99 98 91 49 37 56 5 10 18 9815:30 ~ 15:45 91 82 70 37 17 58 35 77 0 8415:45 ~ 16:00 62 91 40 6 20 31 13 21 14 3116:00 ~ 16:15 102 100 98 28 31 66 35 63 4 9916:15 ~ 16:30 88 73 18 4 22 19 2 18 2 7916:30 ~ 16:45 70 63 59 14 4 2 1 21 1 5816:45 ~ 17:00 99 112 95 38 70 30 0 59 10 5917:00 ~ 17:15 97 74 89 18 29 42 17 64 0 9117:15 ~ 17:30 91 72 49 31 4 9 2 23 5 9117:30 ~ 17:45 79 98 73 49 25 10 0 51 10 10517:45 ~ 18:00 81 60 84 0 10 0 25 42 3 84
Total Traffic 3207 2634 2109 712 743 808 370 1243 226 3146
The Preparatory Survey for the Reconstruction of Somalia Drive in Monrovia (Phase 2)
(Road Side Traffic Counts)
31/03/2016
A-115

Road Key MapName: Somalia Drive Date:
Location /N.T.A Surveyed by: W.Jensen Y.Kaba
Direction /From: Freeport To: Redlight Supervised by: Windell Johnson
No。 1 2 3 4 5 6 7 8 9 10
Sedan / Taxi Mini Bus Large Bus Light Truck Heavy Truck Trailor Motorbike Bicycle Pedestrian
Category Wagon / (2-Axle) (> 2-Axle) (Articulated
Pick-up Truck)
Hours6:00 ~ 6:15 20 13 10 5 1 2 0 0 0 06:15 ~ 6:30 15 10 13 7 3 0 1 2 0 06:30 ~ 6:45 12 21 20 3 8 4 0 3 0 06:45 ~ 7:00 12 18 14 5 5 2 0 4 1 07:00 ~ 7:15 11 13 15 5 1 1 0 5 0 07:15 ~ 7:30 6 6 13 4 4 1 1 2 0 07:30 ~ 7:45 4 4 10 1 2 1 2 3 0 07:45 ~ 8:00 16 11 3 3 1 2 0 2 0 08:00 ~ 8:15 14 10 9 5 1 1 0 2 0 08:15 ~ 8:30 3 7 5 3 3 2 2 0 0 08:30 ~ 8:45 12 8 9 5 2 30 0 0 0 08:45 ~ 9:00 17 8 10 6 4 6 2 3 2 09:00 ~ 9:15 21 19 15 12 13 0 2 0 0 29:15 ~ 9:30 10 4 8 3 0 0 0 0 0 09:30 ~ 9:45 14 4 13 5 4 4 2 1 0 79:45 ~ 10:00 29 15 15 9 7 6 3 1 0 010:00 ~ 10:15 13 11 7 1 1 4 0 1 1 010:15 ~ 10:30 14 12 6 3 4 1 2 3 0 010:30 ~ 10:45 9 4 5 1 2 2 0 2 0 010:45 ~ 11:00 10 11 12 8 10 3 0 0 3 1011:00 ~ 11:15 17 12 6 1 1 4 5 1 0 011:15 ~ 11:30 18 18 11 8 5 7 4 4 2 211:30 ~ 11:45 17 15 17 8 5 2 2 0 0 111:45 ~ 12:00 25 11 18 17 9 6 3 4 0 612:00 ~ 12:15 74 24 23 3 8 7 4 16 2 1112:15 ~ 12:30 58 35 22 2 17 6 5 8 1 712:30 ~ 12:45 43 17 22 2 10 5 3 12 0 712:45 ~ 13:00 38 16 18 1 7 8 2 11 1 613:00 ~ 13:15 56 35 22 2 6 8 5 12 1 813:15 ~ 13:30 31 18 6 2 4 7 2 10 1 1113:30 ~ 13:45 38 18 14 2 10 6 3 7 1 313:45 ~ 14:00 78 22 24 1 7 6 1 5 2 614:00 ~ 14:15 63 27 14 3 9 4 2 7 1 414:15 ~ 14:30 39 27 11 3 7 4 4 5 1 614:30 ~ 14:45 63 29 15 3 8 4 3 12 1 214:45 ~ 15:00 62 29 18 2 6 6 3 5 1 415:00 ~ 15:15 77 24 13 1 13 9 5 7 1 315:15 ~ 15:30 49 22 19 1 6 6 3 1 0 515:30 ~ 15:45 50 28 8 2 5 3 1 8 1 415:45 ~ 16:00 62 33 28 3 12 8 1 5 3 416:00 ~ 16:15 67 21 20 2 10 8 4 8 0 316:15 ~ 16:30 47 24 15 1 5 8 2 4 1 116:30 ~ 16:45 56 20 13 2 3 8 4 13 1 1116:45 ~ 17:00 64 24 14 1 1 7 1 6 1 1317:00 ~ 17:15 70 22 18 2 4 12 2 12 2 617:15 ~ 17:30 49 16 8 0 7 6 0 6 1 917:30 ~ 17:45 48 26 25 3 9 5 4 11 2 1017:45 ~ 18:00 64 23 11 5 1 8 3 20 4 17
Total Traffic 1685 845 665 177 271 250 98 254 39 189
The Preparatory Survey for the Reconstruction of Somalia Drive in Monrovia (Phase 2)
(Road Side Traffic Counts)
2016/4/1
A-116

Road Key MapName: Somalia Drive Date:
Location /N.T.A Surveyed by: L.Kerkula T.Jensen
Direction /From: Redlight To: Freeport Supervised by: Windell Johnson
No。 1 2 3 4 5 6 7 8 9 10Sedan / Taxi Mini Bus Large Bus Light Truck Heavy Truck Trailor Motorbike Bicycle Pedestrian
Category Wagon / (2-Axle) (> 2-Axle) (ArticulatedPick-up Truck)
Hours6:00 ~ 6:15 14 6 17 5 6 5 1 2 0 66:15 ~ 6:30 22 14 18 4 2 5 0 5 0 96:30 ~ 6:45 20 16 15 9 8 9 0 8 0 116:45 ~ 7:00 25 11 17 0 0 6 4 10 0 157:00 ~ 7:15 20 18 11 2 1 2 0 7 1 67:15 ~ 7:30 19 19 13 3 3 6 8 11 0 147:30 ~ 7:45 21 11 11 3 3 4 2 3 0 147:45 ~ 8:00 18 18 17 3 3 2 0 2 0 108:00 ~ 8:15 20 17 16 4 2 3 0 4 0 148:15 ~ 8:30 21 17 17 2 3 3 4 5 0 178:30 ~ 8:45 21 7 9 1 0 3 5 6 0 148:45 ~ 9:00 14 7 8 4 3 1 0 7 2 79:00 ~ 9:15 5 6 4 3 0 2 2 2 1 149:15 ~ 9:30 17 10 7 8 3 3 1 1 0 79:30 ~ 9:45 19 14 8 3 2 2 0 7 0 149:45 ~ 10:00 19 14 15 3 1 11 3 0 0 1410:00 ~ 10:15 16 6 8 2 2 4 1 1 0 2110:15 ~ 10:30 14 14 10 3 1 7 4 0 0 710:30 ~ 10:45 19 14 8 1 2 0 1 2 0 610:45 ~ 11:00 21 6 9 7 1 7 1 8 0 1011:00 ~ 11:15 28 10 4 5 3 2 1 0 0 1011:15 ~ 11:30 12 14 6 3 2 2 3 2 0 711:30 ~ 11:45 21 10 8 0 1 1 2 5 1 1411:45 ~ 12:00 19 12 18 5 6 1 0 3 0 2112:00 ~ 12:15 18 15 9 2 4 5 1 3 0 112:15 ~ 12:30 21 7 7 1 2 7 2 7 0 612:30 ~ 12:45 21 6 5 5 0 4 0 1 0 012:45 ~ 13:00 21 14 14 5 1 3 2 4 1 1213:00 ~ 13:15 28 15 19 5 2 3 5 3 0 713:15 ~ 13:30 46 32 31 7 11 5 2 14 8 2213:30 ~ 13:45 69 54 41 7 21 9 4 14 22 3313:45 ~ 14:00 35 31 22 22 14 14 2 24 7 2814:00 ~ 14:15 64 35 21 28 14 14 7 21 7 2814:15 ~ 14:30 49 28 14 14 16 7 8 35 7 2814:30 ~ 14:45 56 37 21 7 8 5 4 40 5 4214:45 ~ 15:00 59 35 29 16 24 17 9 22 17 2815:00 ~ 15:15 49 33 15 6 11 6 4 25 12 1915:15 ~ 15:30 61 26 22 16 9 8 7 30 5 2415:30 ~ 15:45 66 19 13 1 6 7 4 5 1 715:45 ~ 16:00 50 20 18 5 9 4 0 7 0 616:00 ~ 16:15 38 19 13 3 5 1 0 6 0 716:15 ~ 16:30 64 31 19 0 8 8 1 7 0 416:30 ~ 16:45 48 29 12 0 11 6 0 11 0 316:45 ~ 17:00 50 16 18 3 13 3 0 7 2 017:00 ~ 17:15 66 18 20 2 16 2 1 6 0 1117:15 ~ 17:30 58 18 19 3 4 5 0 13 3 417:30 ~ 17:45 54 20 14 9 5 5 0 8 1 617:45 ~ 18:00 53 16 18 6 18 6 0 23 0 2
Total Traffic 1589 865 708 256 290 245 106 437 103 610
The Preparatory Survey for the Reconstruction of Somalia Drive in Monrovia (Phase 2)
(Road Side Traffic Counts)
2016/4/1
A-117

Asphalt Pavement
Pavement Structure Index
Pavement Structure Somalia Drive
W18 42,180,000
R (%) 90
ZR -1.282
S0 0.45
P0 4.2
P1 2.5
ΔPSI 1.7
CBR 12
MR 18,000
SN 4.548
7.625
Calculation of right side= 7.625
提案する新設舗装構造の構造指数New Pavement Structure Drain Coefficient (m) Layer Index (a)
Pavement Structure Design Section Somalia Dreve
Asphalt Concrete (cm) - 0.440 15.0
Base Course (cm) 1.0 0.135 20.0
Subbase Course (cm) 1.0 0.108 30.0
4.94
SN=a1*D1+a2*m2*D2+a3*m3*D3
Prpposal Structural Number (SN)
P0-P1
CBR rate (%) Subgrade
Resilient Modulus ( =1500× CBR )
Target Structural Number
Log10(W18)=ZR×S0+9.36×Log10(SN+1)-0.20+{Log10[⊿PSI/(4.2-1.5)]/[0.40+1094/(SN+1)5.19]}+2.32×Log10(MR)-8.07
Tentative Calculation log10(W18)=
Combined Standard Error
Initial Serviceability Index
Terminal Serviceability Index
Traffic ESAL
Confidence Coefficient
Standard Deviation
A-118
7.4 Pavement Design(1) Calculation of Pavement thickness

図3.2
.4-
2:舗
装の
ひび
割れ
率と
旅行
速度
0.0
10.0
20.0
30.0
40.0
50.0
60.0
70.0
80.0
90.0
100.
0
051015202530354045
0.0
1.0
2.0
3.0
4.0
5.0
6.0
7.0
8.0
9.0
10.0
11.0
12.0
13.0
(%)
Speed (km/h)
Dis
tanc
e (k
m)
Ava
rag
e S
pee
d
Cra
ck R
ate
(%
)
Ava
rag
e S
pee
d
Dri
vin
g D
ire
ctio
n
Fre
e P
ort
Sto
ckto
n B
ridg
eD
ou
ble
Bri
dg
e
13.3
Re
d L
igh
t
0.0
10.0
20.0
30.0
40.0
50.0
60.0
70.0
80.0
90.0
100.
0
051015202530354045
0.0
1.0
2.0
3.0
4.0
5.0
6.0
7.0
8.0
9.0
10.0
11.0
12.0
13.0
(%)
Speed (km/h)
Dis
tanc
e (k
m)
Ava
rag
e S
pe
ed
Cra
ck R
ate
(%
)
Ava
rag
e S
pee
d
Dri
vin
g D
ire
ctio
n
Fre
e P
ort
Sto
ckto
n B
ridg
eD
ou
ble
Bri
dg
e
13.3
Re
d L
igh
t
路盤
良好
区間
路盤
良好
区間
3-15
Su
bb
ase
Goo
d C
ond
itio
n
Su
bb
ase
Goo
d C
ond
itio
n
A-119
(2) Relation of Pavement Crack rate and Travel Speed

FREE
POR
T In
ters
ectio
nAA
DT
Hou
r:
18:0
0 - 1
9:00
(Eve
ning
Pea
k H
our)
1. In
flow
Tra
ffic
Volu
me
2. S
igna
l Pha
seAp
proa
ch1φ
2φ
3φ
Stre
etD
irect
ion
Thro
ugh
Left
Thro
ugh
Rig
htLe
ftR
ight
Num
ber o
f lan
es2
12
12
1Ba
sic
satu
ratio
n flo
w ra
te2,
000
1,80
02,
000
1,80
01,
800
1,80
0Sa
fety
Fac
tor
0.81
0.81
0.81
0.81
0.81
0.81
Satu
ratio
n de
gree
0.15
0.24
0.10
Satu
ratio
n flo
w ra
te1,
620
1,45
81,
620
1,45
81,
458
1,47
4D
eman
d fo
r gre
en19
3013
Traf
fic v
olum
e (P
CU
/h)
435
222
716
501
297
107
Gre
en ti
me
3251
22
Traf
fic v
olum
e pe
r lan
e21
822
235
850
114
910
7Sa
tura
tion
Yello
w +
red
time
55
5
Nor
mal
ized
traf
fic v
olum
e0.
130.
150.
220.
340.
100.
07D
egre
eC
ycle
Dem
anf f
acto
r of p
hase
10.
130.
15**
**0.
15Sa
tura
tion
Deg
ree
of In
ters
ectio
n =
0.50
Dem
anf f
acto
r of p
hase
20.
220.
24**
**0.
24D
eman
f fac
tor o
f pha
se 3
0.10
0.10
****
0.10
3. L
ane
Com
posi
tion
& T
raffi
c D
eman
d(P
CU
/h)
0.00
< 0.
941
624
3
Gre
en ti
me
rate
of p
hase
10.
270.
270.
27O
K
Gre
en ti
me
rate
of p
hase
20.
430.
430.
43G
reen
tim
e ra
te o
f pha
se 3
0.18
0.18
0.18
Yello
w +
red
time
rate
0.13
Leg
Cap
acity
by
Dire
ctio
n86
438
91,
377
887
535
1,47
411
1
VCR
(Veh
icle
/Cap
acity
Rat
io)
0.50
0.57
0.52
0.56
0.56
0.07
301
Eval
uatio
nO
KO
KO
KO
KO
KO
K
698
560
120
0.50
Sign
al p
hase
Nor
thSo
uth
EAST
N
435
222
107
297
501
716
Free
Por
t
Som
alia
Driv
e
A-120
7.5 Intersection Traffic analysis

new
geo
rgia
Inte
rsec
tion
AAD
T
Hou
r:
18:0
0 - 1
9:00
(Eve
ning
Pea
k H
our)
1. In
flow
Tra
ffic
Volu
me
2. S
igna
l Pha
seAp
proa
chN
orth
1φ
2φ
3φ
Stre
etD
irect
ion
Thro
ugh
Left
Thro
ugh
Thro
ugh/
Rig
htLe
ft/R
ight
Num
ber o
f lan
es2
11
11
Basi
c sa
tura
tion
flow
rate
2,00
01,
800
2,00
01,
800
1,80
0Sa
fety
Fac
tor
0.81
0.81
0.81
0.81
0.81
Satu
ratio
n de
gree
0.26
0.07
0.23
Satu
ratio
n flo
w ra
te1,
620
1,45
81,
620
1,45
81,
458
Dem
and
for g
reen
4714
42
Traf
fic v
olum
e (P
CU
/h)
459
107
376
376
336
Gre
en ti
me
7622
68
Traf
fic v
olum
e pe
r lan
e23
010
737
637
633
6Sa
tura
tion
Yello
w +
red
time
55
5
Nor
mal
ized
traf
fic v
olum
e0.
140.
070.
230.
260.
23D
egre
eC
ycle
Dem
anf f
acto
r of p
hase
10.
140.
230.
260.
26Sa
tura
tion
Deg
ree
of In
ters
ectio
n =
0.56
Dem
anf f
acto
r of p
hase
20.
000.
070.
07D
eman
f fac
tor o
f pha
se 3
0.23
0.23
3. L
ane
Com
posi
tion
& T
raffi
c D
eman
d(P
CU
/h)
0.00
< 0.
9
Gre
en ti
me
rate
of p
hase
10.
420.
420.
42O
K21
251
Gre
en ti
me
rate
of p
hase
20.
120.
12G
reen
tim
e ra
te o
f pha
se 3
0.38
Leg
Cap
acity
by
Dire
ctio
n1,
764
178
684
616
551
VCR
(Veh
icle
/Cap
acity
Rat
io)
0.26
0.60
0.55
0.61
0.61
107
Eval
uatio
nO
KO
KO
KO
KO
K67
210
757
9
180
0.56
East
Wes
t
Sign
al p
hase
N
303
33
104
648
107
459
Free
Por
tRe
d Li
ght
A-121
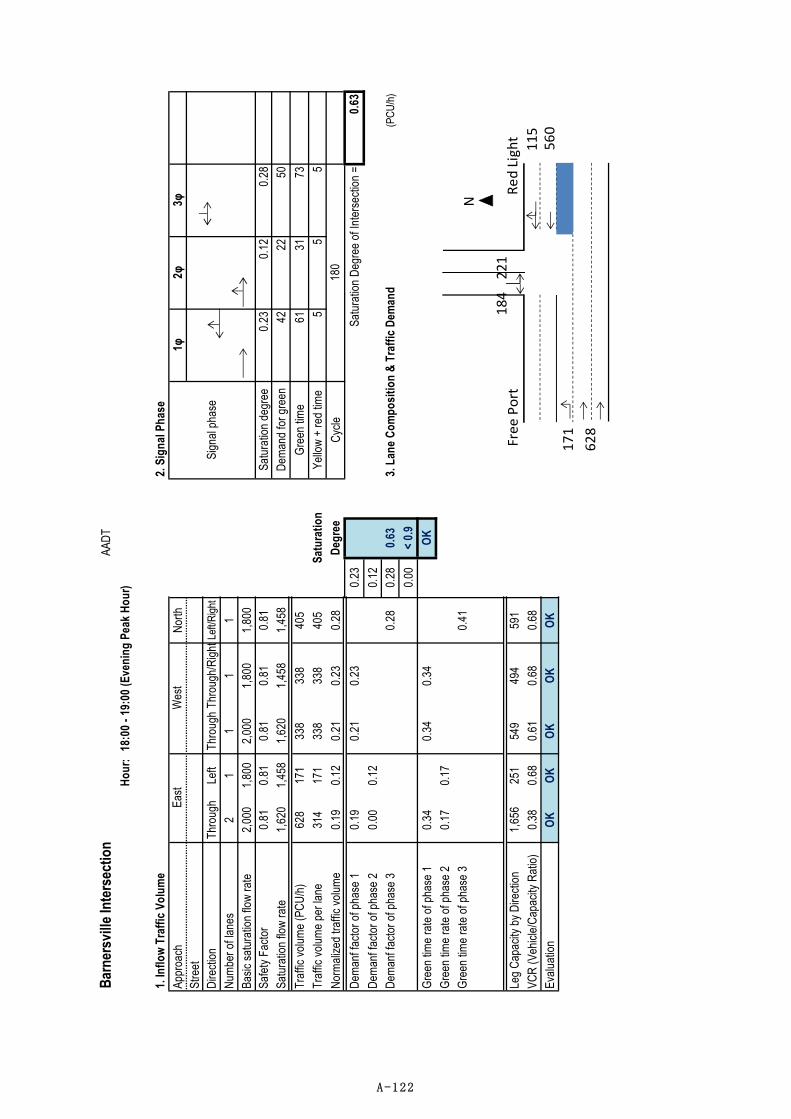
Bar
ners
ville
Inte
rsec
tion
AAD
T
Hou
r:
18:0
0 - 1
9:00
(Eve
ning
Pea
k H
our)
1. In
flow
Tra
ffic
Volu
me
2. S
igna
l Pha
seAp
proa
chN
orth
1φ2φ
3φSt
reet
Dire
ctio
nTh
roug
hLe
ftTh
roug
hTh
roug
h/R
ight
Left/
Rig
ht
Num
ber o
f lan
es2
11
11
Basi
c sa
tura
tion
flow
rate
2,00
01,
800
2,00
01,
800
1,80
0Sa
fety
Fac
tor
0.81
0.81
0.81
0.81
0.81
Satu
ratio
n de
gree
0.23
0.12
0.28
Satu
ratio
n flo
w ra
te1,
620
1,45
81,
620
1,45
81,
458
Dem
and
for g
reen
4222
50
Traf
fic v
olum
e (P
CU
/h)
628
171
338
338
405
Gre
en ti
me
6131
73
Traf
fic v
olum
e pe
r lan
e31
417
133
833
840
5Sa
tura
tion
Yello
w +
red
time
55
5
Nor
mal
ized
traf
fic v
olum
e0.
190.
120.
210.
230.
28D
egre
eC
ycle
Dem
anf f
acto
r of p
hase
10.
190.
210.
230.
23Sa
tura
tion
Deg
ree
of In
ters
ectio
n =
0.63
Dem
anf f
acto
r of p
hase
20.
000.
120.
12D
eman
f fac
tor o
f pha
se 3
0.28
0.28
3. L
ane
Com
posi
tion
& T
raffi
c D
eman
d(P
CU
/h)
0.00
< 0.
9
Gre
en ti
me
rate
of p
hase
10.
340.
340.
34O
K19
023
5
Gre
en ti
me
rate
of p
hase
20.
170.
17G
reen
tim
e ra
te o
f pha
se 3
0.41
Leg
Cap
acity
by
Dire
ctio
n1,
656
251
549
494
591
VCR
(Veh
icle
/Cap
acity
Rat
io)
0.38
0.68
0.61
0.68
0.68
111
Eval
uatio
nO
KO
KO
KO
KO
K59
314
874
2
180
0.63
East
Wes
t
Sign
al p
hase
N
184
221
115
560
171
628
Free
Por
tRe
d Li
ght
A-122

Nee
zoe
Inte
rsec
tion
AAD
T
Hou
r:
18:0
0 - 1
9:00
(Eve
ning
Pea
k H
our)
1. In
flow
Tra
ffic
Volu
me
2. S
igna
l Pha
seAp
proa
ch1φ
2φ3φ
Stre
etD
irect
ion
Thro
ugh
Rig
htTh
roug
hLe
ftLe
ft/R
ight
Num
ber o
f lan
es2
11
11
Basi
c sa
tura
tion
flow
rate
2,00
01,
800
2,00
01,
800
1,80
0Sa
fety
Fac
tor
0.81
0.81
0.81
0.81
0.81
Satu
ratio
n de
gree
0.19
0.20
0.06
Satu
ratio
n flo
w ra
te1,
620
1,45
81,
620
1,45
81,
458
Dem
and
for g
reen
3536
11
Traf
fic v
olum
e (P
CU
/h)
1,25
031
277
277
83G
reen
tim
e71
7321
Traf
fic v
olum
e pe
r lan
e62
531
277
277
83Sa
tura
tion
Yello
w +
red
time
55
5
Nor
mal
ized
traf
fic v
olum
e0.
390.
020.
170.
190.
06D
egre
eC
ycle
Dem
anf f
acto
r of p
hase
10.
190.
170.
190.
19Sa
tura
tion
Deg
ree
of In
ters
ectio
n =
0.44
Dem
anf f
acto
r of p
hase
20.
200.
020.
20D
eman
f fac
tor o
f pha
se 3
0.06
0.06
3. L
ane
Com
posi
tion
& T
raffi
c D
eman
d(P
CU
/h)
0.00
< 0.
9
Gre
en ti
me
rate
of p
hase
10.
390.
390.
39O
K32
55
Gre
en ti
me
rate
of p
hase
20.
410.
41G
reen
tim
e ra
te o
f pha
se 3
0.12
Leg
Cap
acity
by
Dire
ctio
n2,
592
591
639
575
170
VCR
(Veh
icle
/Cap
acity
Rat
io)
0.48
0.05
0.43
0.48
0.49
67Ev
alua
tion
OK
OK
OK
OK
OK
611
32 1,37
1
180
0.44
East
Wes
tN
orth
Sign
al p
hase
N
Free
Por
tRe
d Li
ght
2261
67 486
3112
50
A-123

72nd
Inte
rsec
tion
AAD
T
Hou
r:
18:0
0 - 1
9:00
(Eve
ning
Pea
k H
our)
1. In
flow
Tra
ffic
Volu
me
2. S
igna
l Pha
seAp
proa
ch1φ
2φ3φ
Stre
etD
irect
ion
Thro
ugh
Rig
htTh
roug
hLe
ftLe
ftR
ight
Num
ber o
f lan
es2
12
11
1Ba
sic
satu
ratio
n flo
w ra
te2,
000
1,80
02,
000
1,80
01,
800
1,80
0Sa
fety
Fac
tor
0.81
0.81
0.81
0.81
0.81
0.81
Satu
ratio
n de
gree
0.34
0.19
0.19
Satu
ratio
n flo
w ra
te1,
620
1,47
41,
620
1,45
81,
458
1,45
8D
eman
d fo
r gre
en62
3434
Traf
fic v
olum
e (P
CU
/h)
1,10
91,
467
604
244
274
131
Gre
en ti
me
7943
43
Traf
fic v
olum
e pe
r lan
e55
51,
467
302
244
274
131
Satu
ratio
nYe
llow
+ re
d tim
e5
55
Nor
mal
ized
traf
fic v
olum
e0.
341.
000.
190.
170.
190.
09D
egre
eC
ycle
Dem
anf f
acto
r of p
hase
10.
34**
**0.
34Sa
tura
tion
Deg
ree
of In
ters
ectio
n =
0.72
Dem
anf f
acto
r of p
hase
2**
**0.
190.
170.
19D
eman
f fac
tor o
f pha
se 3
****
0.19
0.09
0.19
3. L
ane
Com
posi
tion
& T
raffi
c D
eman
d(P
CU
/h)
0.00
< 0.
9
Gre
en ti
me
rate
of p
hase
10.
440.
44O
K
Gre
en ti
me
rate
of p
hase
20.
240.
240.
24G
reen
tim
e ra
te o
f pha
se 3
0.24
0.24
0.24
756
235
Yello
w +
red
time
rate
0.08
1,28
3Le
g C
apac
ity b
y D
irect
ion
1,42
21,
474
774
348
348
348
1,35
4
VCR
(Veh
icle
/Cap
acity
Rat
io)
0.78
0.99
0.78
0.70
0.79
0.38
Eval
uatio
nO
KO
KO
KO
KO
KO
K
272
140
180
0.72
East
Wes
tSo
uth
Sign
al p
hase
N
1109
1467
604
244
2741
31
SKD
Driv
e
Free
Por
tRe
d Li
ght
A-124

Flo
w C
alcula
tion
disc
har
ge c
oeff
icie
nt(
AC
)0.9
Man
nin
g: V
=(1
/n)・
R^(
2/3)・
i^(1
/2)
rain
fall
inte
nsi
ty(3yr
retu
rn p
eriod)
100m
m/h
0.0
15
Road
edge
Dra
incat
chm
ent
wid
th11.1
m0.8
Lengt
h(m
)Sta
tion
Outlet
dipt
h(m
)w
idth
(m)
section
area:
A(m
2)
Hyd
raulic
radi
us:
R(m
)
Velo
city:
V(m
/s)
Cap
acity
(m3/s)
10+000
~0+225
225
0.0
67
0+225 inner
wetlan
d0.0
62
1.0
01.5
00
1.5
00
0.4
29
0.9
81
1.4
71
OK
20+225
~0+368
143
0.2
40
0+225 inner
wetlan
d0.0
40
0.4
40.6
00
0.2
64
0.1
78
1.0
35
0.2
73
OK
30+368
~0+640
272
0.0
34
0+640 inner
wetlan
d0.0
75
0.4
40.6
00
0.2
64
0.1
78
0.3
90
0.1
03
OK
40+640
~0+844
204
0.2
38
0+640 inner
wetlan
d0.0
57
0.4
40.6
00
0.2
64
0.1
78
1.0
31
0.2
72
OK
50+844
~0+900
56
0.0
32
0+900 inner
wetlan
d0.0
16
0.4
40.6
00
0.2
64
0.1
78
0.3
78
0.1
00
OK
60+900
1+233
333
0.4
98
0.0
92
0.4
40.6
00
0.2
64
0.1
78
1.4
91
0.3
94
OK
71+233
1+262
29
0.0
04
0+900 inner
wetlan
d0.0
08
0.4
40.6
00
0.2
64
0.1
78
0.1
30
0.0
34
OK
81+262
~1+615
353
Sto
kton r
iver(
without
proje
ct)
91+615
~1+900
285
0.3
84
1+900 inner
wetlan
d0.0
79
0.4
40.6
00
0.2
64
0.1
78
1.3
09
0.3
46
OK
10
1+900
~2+230
330
0.1
23
1+900 inner
wetlan
d0.0
92
0.4
40.6
00
0.2
64
0.1
78
0.7
41
0.1
96
OK
11
2+230
~2+575
345
0.1
06
2+230 inner
wetlan
d0.0
96
0.4
40.6
00
0.2
64
0.1
78
0.6
88
0.1
82
OK
12
2+575
~3+000
425
0.1
11
3+000 inner
wetlan
d0.1
18
0.4
40.6
00
0.2
64
0.1
78
0.7
04
0.1
86
OK
13
3+000
~3+125
125
0.0
50
3+125 inner
wetlan
d0.0
35
0.3
40.6
00
0.2
04
0.1
59
0.4
38
0.0
89
OK
14
3+125
~3+580
455
0.2
46
3+125 inner
wetlan
d0.1
26
0.3
40.6
00
0.2
04
0.1
59
0.9
72
0.1
98
OK
15
3+580
~3+925
345
0.2
07
3+925 inner
wetlan
d0.0
96
0.3
40.6
00
0.2
04
0.1
59
0.8
92
0.1
82
OK
16
3+925
~4+245
320
0.3
30
3+925 inner
wetlan
d0.0
89
0.3
40.6
00
0.2
04
0.1
59
1.1
26
0.2
30
OK
17
4+245
~4+632
387
0.1
25
4+632 inner
wetlan
d0.1
07
0.3
40.6
00
0.2
04
0.1
59
0.6
93
0.1
41
OK
18
4+632
~4+976
344
0.1
77
4+632 inner
wetlan
d0.0
95
0.3
40.6
00
0.2
04
0.1
59
0.8
24
0.1
68
OK
19
4+976
~5+297
321
0.3
10
4+976 inner
wetlan
d0.0
89
0.3
40.6
00
0.2
04
0.1
59
1.0
91
0.2
23
OK
20
5+297
~5+556
259
0.2
21
5+556 inner
wetlan
d0.0
72
0.3
40.6
00
0.2
04
0.1
59
0.9
21
0.1
88
OK
21
5+556
~5+851
295
0.2
90
5+556 inner
wetlan
d0.0
82
0.3
40.6
00
0.2
04
0.1
59
1.0
55
0.2
15
OK
22
5+851
~6+135
284
0.1
47
6+135 inner
wetlan
d0.0
79
0.3
40.6
00
0.2
04
0.1
59
0.7
51
0.1
53
OK
23
6+135
~6+562
427
0.2
12
6+562 inner
wetlan
d0.1
18
0.3
40.6
00
0.2
04
0.1
59
0.9
02
0.1
84
OK
24
6+562
~7+144
582
0.6
17
6+562 inner
wetlan
d0.1
62
0.3
40.6
00
0.2
04
0.1
59
1.5
39
0.3
14
OK
25
7+144
~7+902
758
0.2
75
7+902 inner
wetlan
d0.2
10
0.4
40.6
00
0.2
64
0.1
78
1.1
08
0.2
92
OK
26
7+902
~8+075
173
0.2
75
0.0
48
0.3
40.6
00
0.2
04
0.1
59
1.0
28
0.2
10
OK
27
8+075
~8+229
154
0.1
60
Doubl
e B
r(rive
r)0.0
43
0.3
40.6
00
0.2
04
0.1
59
0.7
84
0.1
60
OK
28
8+229
~8+282
53
Doubl
e B
r29
8+282
~8+460
178
0.5
87
Doubl
e B
r(rive
r)0.0
49
0.3
40.6
00
0.2
04
0.1
59
1.5
01
0.3
06
OK
Sta
tion
Rat
ional
: Q
=(1
/(3
.6*10^6
))*C
*I*
aQ
=A
・V
rough
ness
coeff
icie
nt:(concre
te)
eff
ective
dept
h
No.
Slo
pe(%
)
U-D
ITC
Hdi
schar
ge(m
3/s)
cap
acity
Judg
e
A-125
7.6 Drainage Calculation

30
8+460
~8+900
440
Only
medi
an d
rain
are
a31
8+900
~8+975
75
0.6
04
0.0
21
0.3
40.6
00
0.2
04
0.1
59
1.5
23
0.3
11
OK
32
8+975
~9+448
473
0.7
98
0.1
52
0.3
40.6
00
0.2
04
0.1
59
1.7
51
0.3
57
OK
33
9+448
~9+544
96
0.5
00
9+544 inner
wetlan
d0.1
79
0.3
40.6
00
0.2
04
0.1
59
1.3
86
0.2
83
OK
34
9+540
10+125
585
1.0
00
0.2
11
0.4
40.6
00
0.2
64
0.1
78
2.1
13
0.5
58
OK
35
10+125
10+264
139
1.0
43
0.0
49
0.3
40.6
00
0.2
04
0.1
59
2.0
01
0.4
08
OK
36
10+264
10+302
38
0.5
00
9+544 inner
wetlan
d0.0
11
0.3
40.6
00
0.2
04
0.1
59
1.3
86
0.2
83
OK
37
10+302
10+428
126
0.5
00
0.0
35
0.3
40.6
00
0.2
04
0.1
59
1.3
86
0.2
83
OK
38
10+428
10+829
401
1.1
02
10+829 inner
wetlan
d0.1
46
0.3
40.6
00
0.2
04
0.1
59
2.0
57
0.4
20
OK
39
10+829
11+017
188
1.1
02
0.0
52
0.3
40.6
00
0.2
04
0.1
59
2.0
57
0.4
20
OK
40
11+017
11+133
116
0.3
00
11+133 inner
wetlan
d0.0
84
0.3
40.6
00
0.2
04
0.1
59
1.0
73
0.2
19
OK
41
11+133
11+262
129
1.2
29
0.0
89
0.3
40.6
00
0.2
04
0.1
59
2.1
73
0.4
43
OK
42
11+262
11+325
63
1.1
11
0.0
53
0.3
40.6
00
0.2
04
0.1
59
2.0
66
0.4
21
OK
43
11+325
11+453
128
1.2
40
11+133 inner
wetlan
d0.0
36
0.3
40.6
00
0.2
04
0.1
59
2.1
82
0.4
45
OK
44
11+453
~11+590
137
1.1
21
11+453 inner
wetlan
d0.0
38
0.3
40.6
00
0.2
04
0.1
59
2.0
75
0.4
23
OK
45
11+590
~11+800
210
0.2
22
11+800 C
-B
OX
0.0
58
0.3
40.6
00
0.2
04
0.1
59
0.9
23
0.1
88
OK
46
11+800
~11+930
130
0.2
05
11+930 inner
wetlan
d0.0
36
0.3
40.6
00
0.2
04
0.1
59
0.8
87
0.1
81
OK
47
11+930
12+035
105
0.1
00
0.1
03
0.4
40.6
00
0.2
64
0.1
78
0.6
68
0.1
76
OK
48
12+035
12+300
265
1.0
52
11+930 inner
wetlan
d0.0
74
0.3
40.6
00
0.2
04
0.1
59
2.0
10
0.4
10
OK
49
12+300
~12+575
275
1.2
73
12+575 inner
wetlan
d0.0
76
0.4
40.6
00
0.2
64
0.1
78
2.3
84
0.6
29
OK
50
12+575
12+775
200
2.1
90
0.0
56
0.3
40.6
00
0.2
04
0.1
59
2.9
00
0.5
92
OK
51
12+775
12+961
186
2.0
97
0.0
52
0.3
40.6
00
0.2
04
0.1
59
2.8
38
0.5
79
OK
52
12+961
13+075
114
0.6
58
0.0
32
0.3
40.6
00
0.2
04
0.1
59
1.5
90
0.3
24
OK
53
13+075
13+200
125
0.5
04
12+575 inner
wetlan
d0.0
35
0.3
40.6
00
0.2
04
0.1
59
1.3
91
0.2
84
OK
A-126