Embed Size (px)
Citation preview
IOSR Journal of Engineering (IOSRJEN) www.iosrjen.org
ISSN (e): 2250-3021, ISSN (p): 2278-8719
Vol. 04, Issue 07 (July. 2014), ||V2|| PP 24-40
International organization of Scientific Research 24 | P a g e
Generation of an Annual Typical Meteorological Solar Irradiance
on Tilted Surfaces for Armidale NSW,Australia
Yasser Maklad1
1(University of New England, Armidale NSW 2351 NSW Australia– School of Environmental & Rural Science –
email: [email protected])
Abstract:-This paper aims to estimate solar irradiance on tilted surfaces for Armidale NSW, Australia.The most
common data for describing the local solar climate is through what is called Typical Meteorological Year data
(TMY). Typical solar radiation data is very important for the calculations of many solarapplications. In this
study, typical solar radiation years on tilted surfaces of five inclination angles (15, 30, 45, 60 and 75) for Armidale town in New South Wales in Australia are generated from the typical solar radiation years on
horizontal surfaces developed earlier by the writer in a former article based on the daily and monthly solar
radiation data measured and collected for 23 years during the period 1990 to 2012, utilising the Finkelstein-
Schafer statistical method. The study outcome is expected to show how solar radiation is potential in Armidale
NSW and would be a real help for solar energy generation systems’ designers in this region for all building
applications varying between residential, educational, administrative and commercial for sizing and maximising
efficiency of such systems by using the tabular TYR outcome for the each day of the year. Specially for
calculating the energy output of solar arrays through the day while the sun is moving around the fixed angle
array surface. This would really give a real picture of actual energy generation utilising inclined solar arrays.
Keywords: Armidale NSW,test meteorological year, test reference year, solar radiation; tilted surfaces
I. INTRODUCTION The most common data for describing the local solarclimate is through what is called Typical
Meteorological Year data (TMY). To determine TMY data, various meteorological measurements are made at
hourly intervals over a number of years to build up a picture of the local climate. A simple average of the yearly
data underestimates the amount of variability, so the month that is most representative of the location is selected.
For each month, the average solar radiation over the whole measurement period is determined, together with the
average solar radiation in each month during the measurement period. The data for the month that has the
average solar radiation most closely equal to the monthly average over the whole measurement period is then
chosen as the TMY data for that month. This process is then repeated for each month in the year. The months
are added together to give a full year of hourly samples. There is no strict standard for TMY data so the user
must adjust the data to suit the application. Considerable care must be taken with sample periods. Solar radiation data is a crucial parameter for the prediction of long-term performance of solar energy generation systems. As
well, it is a key input in modelling and designing of solar energy applications. Thus, a need for a reliable source
of solar radiationdata has to be readily available for particular settlement locations.
The need for a one-year representative daily meteorological data led to the development of
methodologies known as the Typical Meteorological Year (TMY), alternatively called Test Reference Year
(TRY) [1]. TMY or TRY is a representative data that consists of the month selected from the individual years
and concatenated to form a complete year. However, A TMY is not necessarily a good indicator of conditions
over the next year or even the next five years. Rather, TMY represents conditions judged to be typical over a
long period of time [2]. Typical weather year data sets can be generated for several climatic variables such as
temperature, humidity, wind speed, etc. or only for solar radiation speed. Various trials have been made to
generate such weather databases for different areas around the world [1, 3, 4, 5, 6, 7, 8, 9, 10, 11, 13 & 14].
A variety of numerical models for calculating solar irradiance on tilted surfaceswere described and evaluated using data for any location on the earth. While all the hourly models have a common approach for
calculating the direct component of solar irradiance, there are a variety of methods for calculating diffuse
irradiance based on the portion of the sky hemisphere within the field of view of the surface. A less significant
distinction between the models is in the methods used to calculate the amount of radiation received as a result
of reflection from adjacent surfaces [16].
The hourly solar radiation data required for solar energy system design evaluation and performance
studies are generally not available for a number of sites, especially for those in remote locations. As such,
accurate determination of hourly solar radiation data is important at both horizontal surfaces and inclined
surfaces. A model to estimate global solar radiation using temperature and sunshine hour data has been
Generation of an Annual Typical Meteorological Solar Irradiance on Tilted Surfaces for Armidale
International organization of Scientific Research 25 | P a g e
developed [17], which is used to calculate the hourly solar radiation data. The hourly solar radiation has also
been calculated using [18] daily integration approach from the measured daily solar radiation data. These two
predicted hourly solar radiation data values are compared with measured hourly values to test the accuracy of
the models. The total solar radiation on the inclined surfaces and vertical surfaces for different orientations has
also been estimated. The estimated values are found to be in close agreement with the measured values. The
presented method can be used to estimate hourly, global, diffuse solar radiation for horizontal surfaces and total
solar radiation on inclined and vertical surfaces at different orientations with a greater accuracy for any location.
Thus, the main aim of this study is to generate representative TYM solar radiation data on tilted surfaces for
Armidale NSW, Australia. Inclination angles considered are (15, 30, 45, 60 and 75).
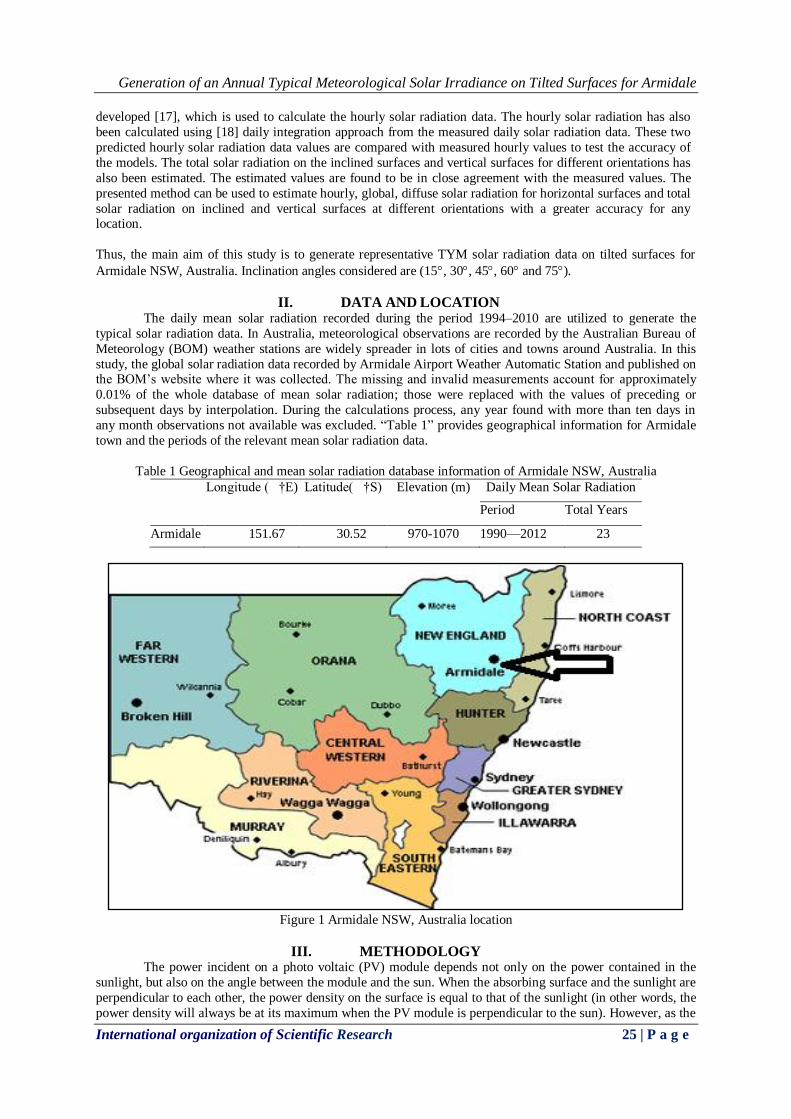
II. DATA AND LOCATION The daily mean solar radiation recorded during the period 1994–2010 are utilized to generate the
typical solar radiation data. In Australia, meteorological observations are recorded by the Australian Bureau of
Meteorology (BOM) weather stations are widely spreader in lots of cities and towns around Australia. In this
study, the global solar radiation data recorded by Armidale Airport Weather Automatic Station and published on the BOM’s website where it was collected. The missing and invalid measurements account for approximately
0.01% of the whole database of mean solar radiation; those were replaced with the values of preceding or
subsequent days by interpolation. During the calculations process, any year found with more than ten days in
any month observations not available was excluded. ―Table 1‖ provides geographical information for Armidale
town and the periods of the relevant mean solar radiation data.
Table 1 Geographical and mean solar radiation database information of Armidale NSW, Australia
Longitude ( †E) Latitude( †S) Elevation (m) Daily Mean Solar Radiation
Period Total Years
Armidale 151.67 30.52 970-1070 1990—2012 23
Figure 1 Armidale NSW, Australia location
III. METHODOLOGY The power incident on a photo voltaic (PV) module depends not only on the power contained in the
sunlight, but also on the angle between the module and the sun. When the absorbing surface and the sunlight are
perpendicular to each other, the power density on the surface is equal to that of the sunlight (in other words, the
power density will always be at its maximum when the PV module is perpendicular to the sun). However, as the
Generation of an Annual Typical Meteorological Solar Irradiance on Tilted Surfaces for Armidale
International organization of Scientific Research 26 | P a g e
angle between the sun and a fixed surface is continually changing, the power density on a fixed PV module is
less than that of the incident sunlight.
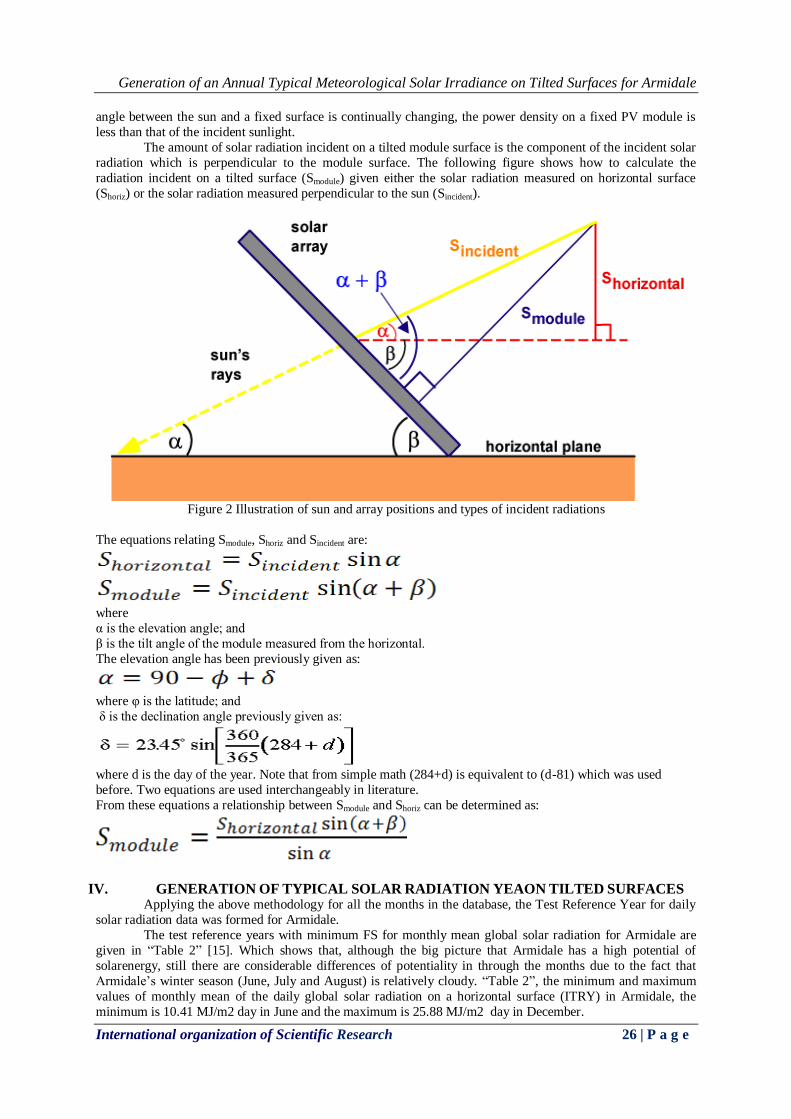
The amount of solar radiation incident on a tilted module surface is the component of the incident solar
radiation which is perpendicular to the module surface. The following figure shows how to calculate the
radiation incident on a tilted surface (Smodule) given either the solar radiation measured on horizontal surface
(Shoriz) or the solar radiation measured perpendicular to the sun (Sincident).
Figure 2 Illustration of sun and array positions and types of incident radiations
The equations relating Smodule, Shoriz and Sincident are:
where
α is the elevation angle; and
β is the tilt angle of the module measured from the horizontal.
The elevation angle has been previously given as:
where φ is the latitude; and
δ is the declination angle previously given as:
where d is the day of the year. Note that from simple math (284+d) is equivalent to (d-81) which was used
before. Two equations are used interchangeably in literature.
From these equations a relationship between Smodule and Shoriz can be determined as:
IV. GENERATION OF TYPICAL SOLAR RADIATION YEAON TILTED SURFACES Applying the above methodology for all the months in the database, the Test Reference Year for daily
solar radiation data was formed for Armidale.
The test reference years with minimum FS for monthly mean global solar radiation for Armidale are
given in ―Table 2‖ [15]. Which shows that, although the big picture that Armidale has a high potential of
solarenergy, still there are considerable differences of potentiality in through the months due to the fact that
Armidale’s winter season (June, July and August) is relatively cloudy. ―Table 2‖, the minimum and maximum
values of monthly mean of the daily global solar radiation on a horizontal surface (ITRY) in Armidale, the
minimum is 10.41 MJ/m2 day in June and the maximum is 25.88 MJ/m2 day in December.
Generation of an Annual Typical Meteorological Solar Irradiance on Tilted Surfaces for Armidale
International organization of Scientific Research 27 | P a g e
Table2TestReferenceYearswithminimum (min)FSandmonthlymeanofthesolar radiation(ITRY) for Armidale
NSW, Australia
Month Year ITRY (MJ/m2day)
January 1993 25.33
February 2007 25.18
March 1993 19.68
April 1993 15.98
May 2000 12.4
June 2006 10.41
July 1991 11.44
August 1999 14.62
September 2012 19.11
October 1991 22.00
November 1991 23.59
December 1994 25.88
Extracted from [15]
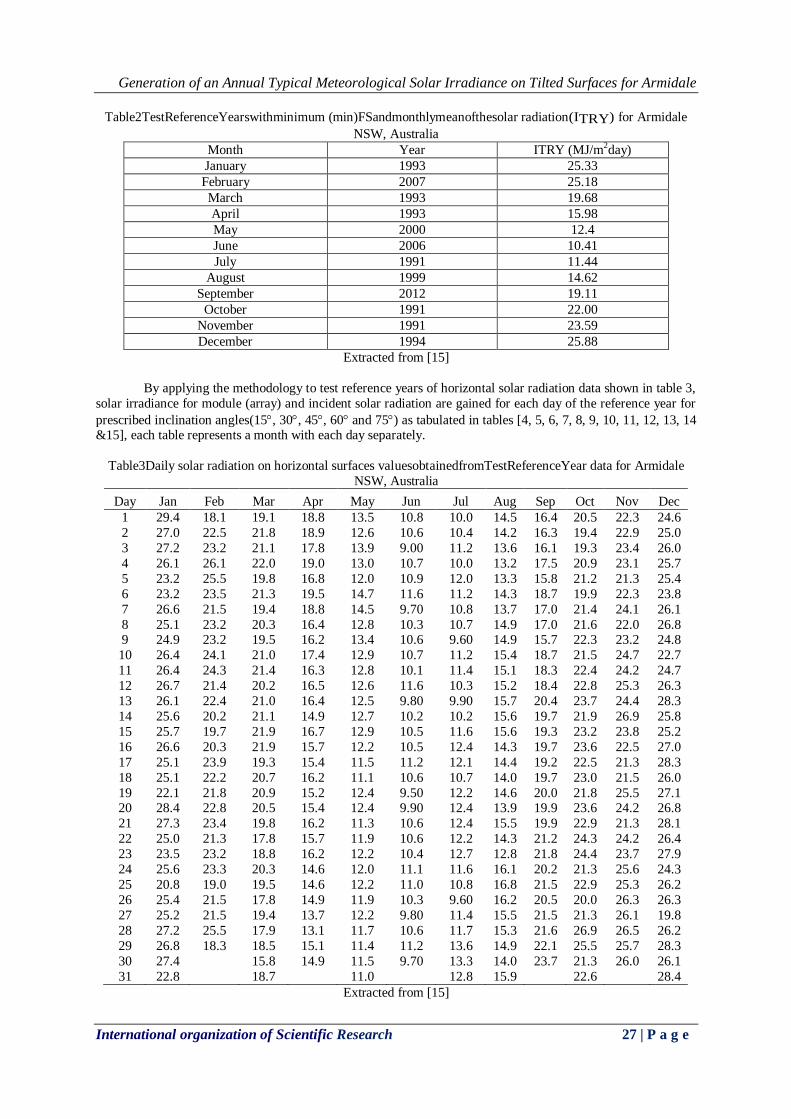
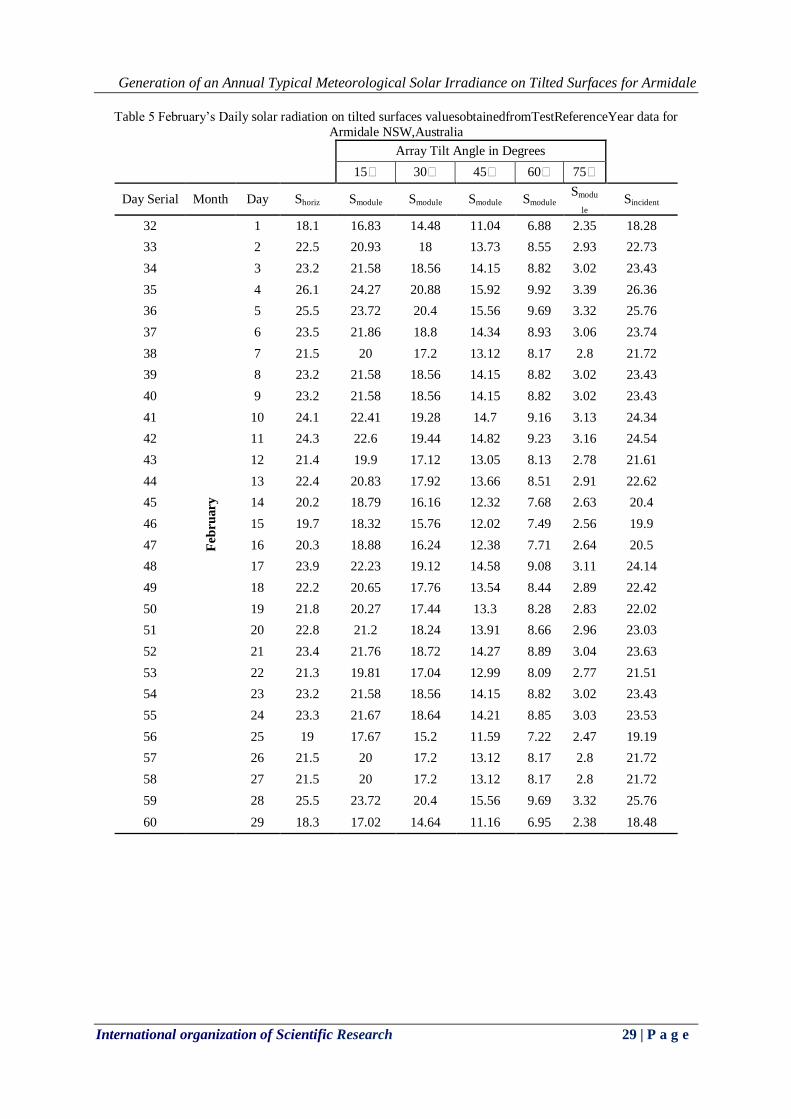
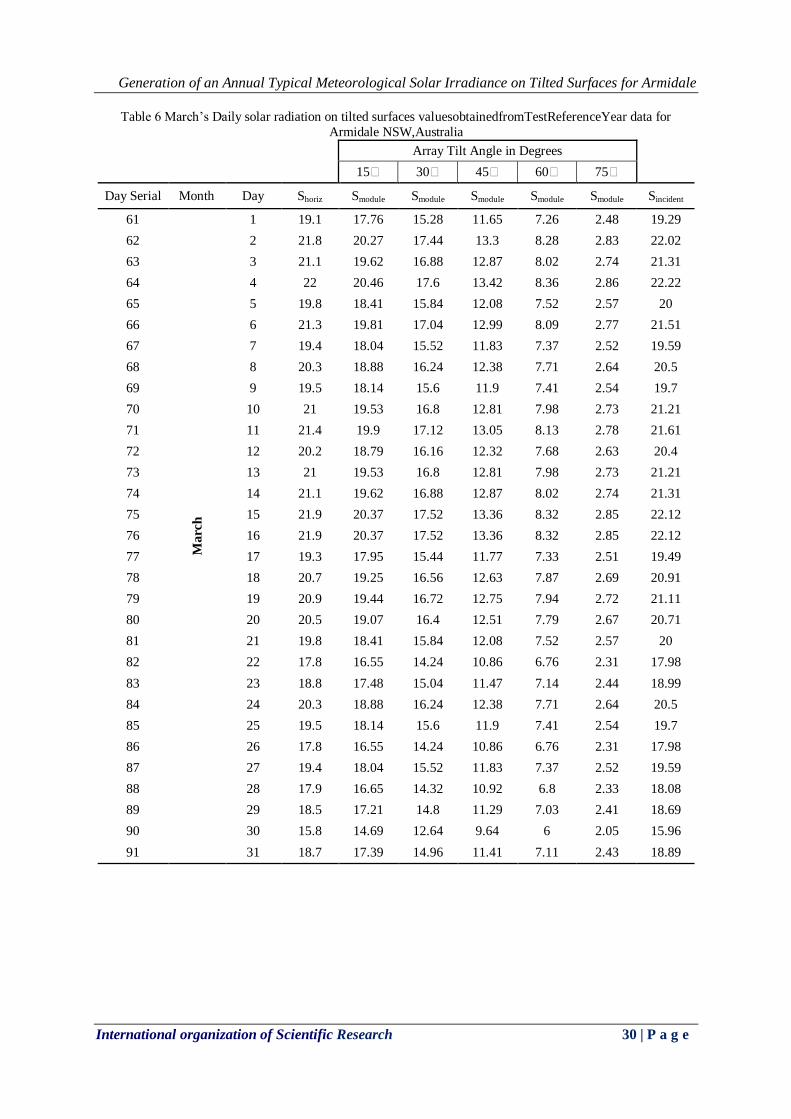
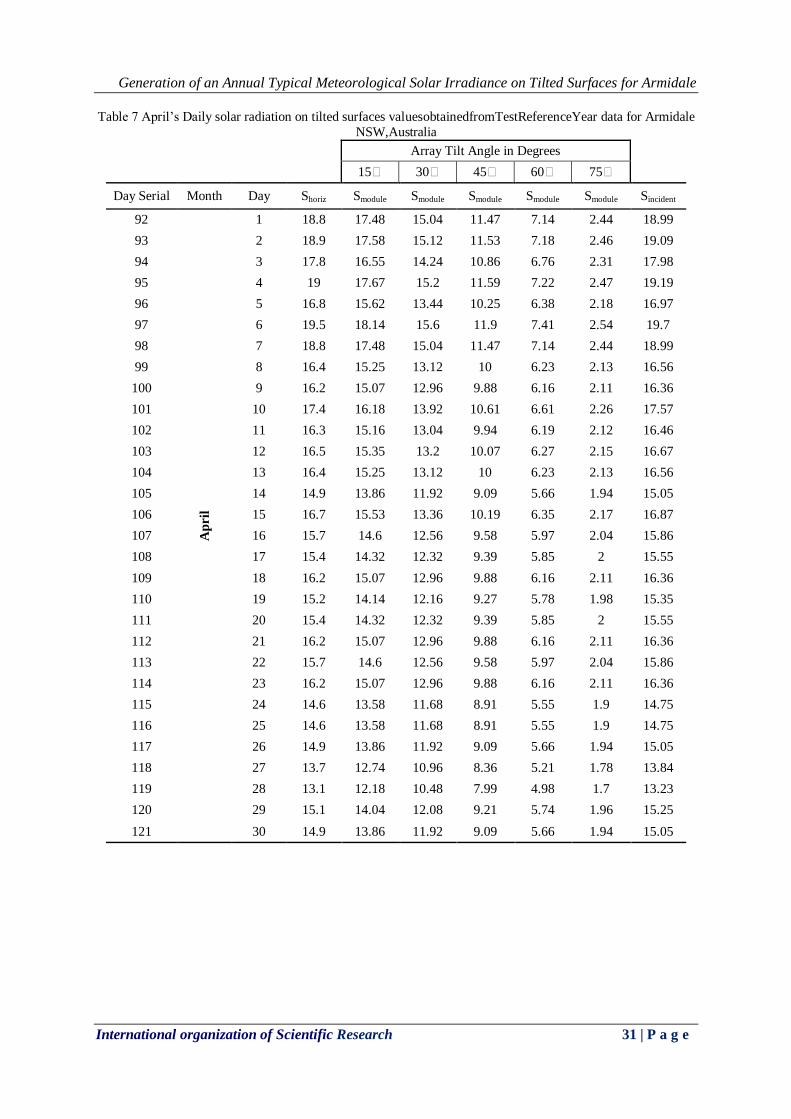
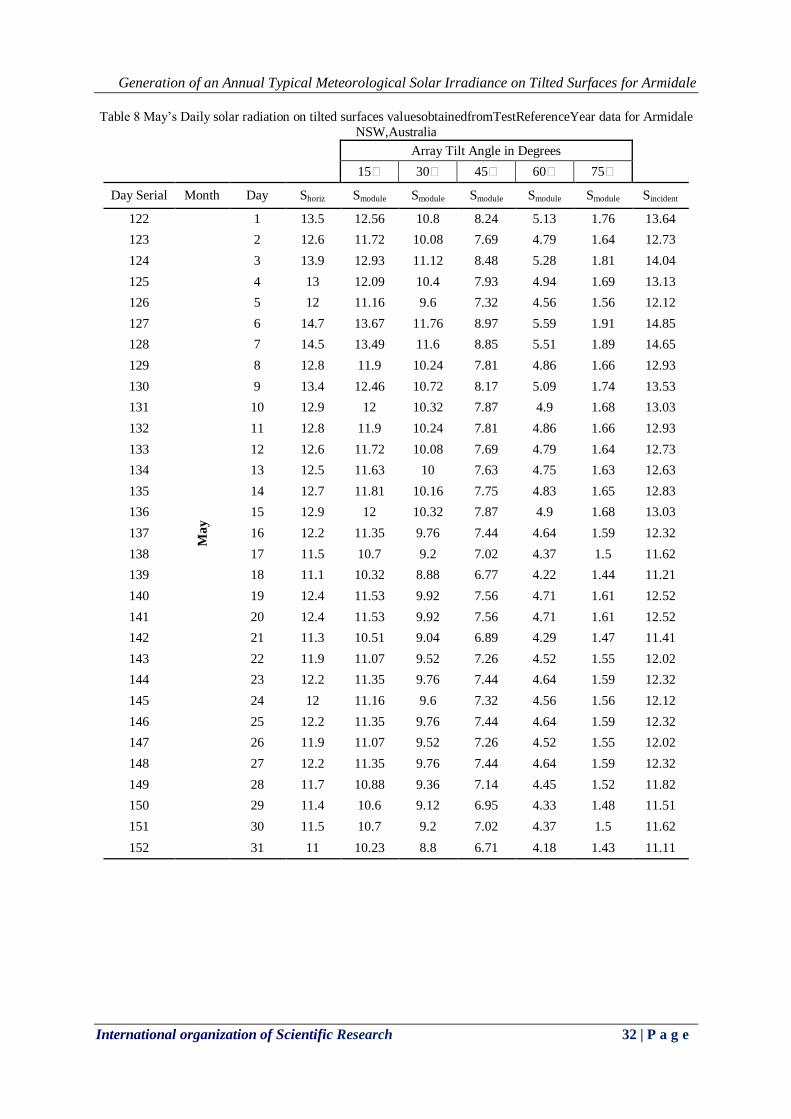
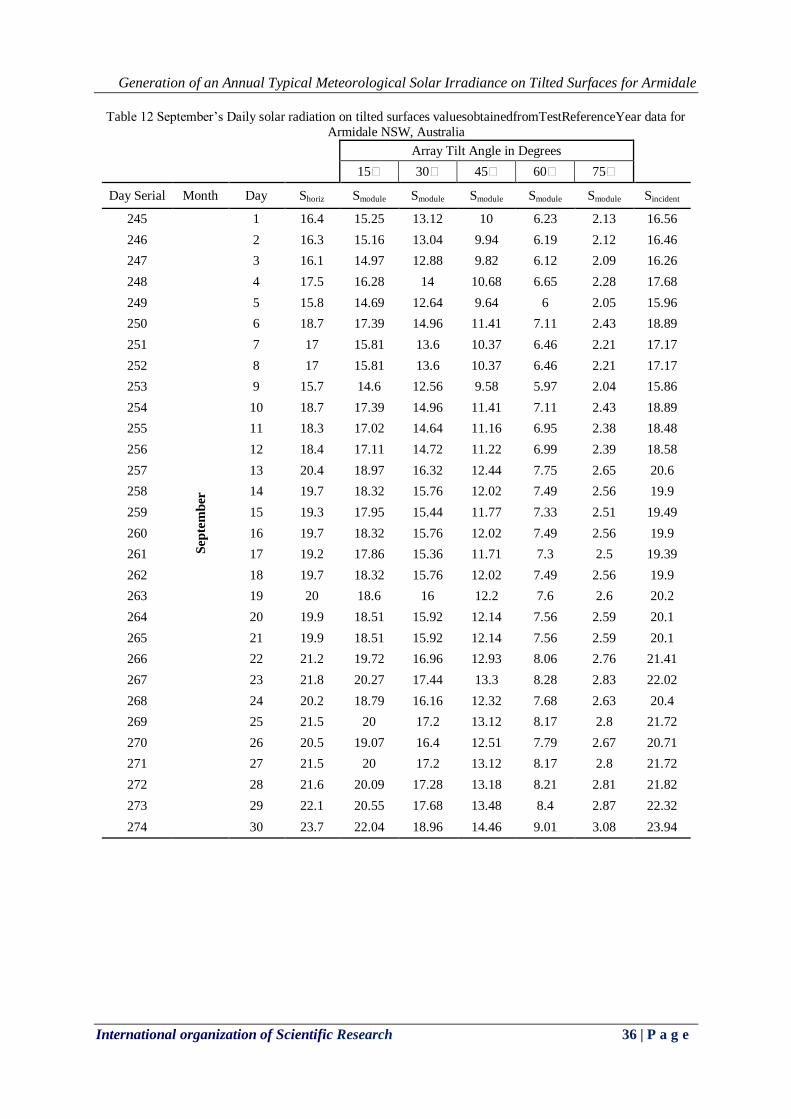
By applying the methodology to test reference years of horizontal solar radiation data shown in table 3,
solar irradiance for module (array) and incident solar radiation are gained for each day of the reference year for
prescribed inclination angles(15, 30, 45, 60 and 75) as tabulated in tables [4, 5, 6, 7, 8, 9, 10, 11, 12, 13, 14 &15], each table represents a month with each day separately.
Table3Daily solar radiation on horizontal surfaces valuesobtainedfromTestReferenceYear data for Armidale
NSW, Australia
Day Jan Feb Mar Apr May Jun Jul Aug Sep Oct Nov Dec
1 29.4 18.1 19.1 18.8 13.5 10.8 10.0 14.5 16.4 20.5 22.3 24.6
2 27.0 22.5 21.8 18.9 12.6 10.6 10.4 14.2 16.3 19.4 22.9 25.0
3 27.2 23.2 21.1 17.8 13.9 9.00 11.2 13.6 16.1 19.3 23.4 26.0
4 26.1 26.1 22.0 19.0 13.0 10.7 10.0 13.2 17.5 20.9 23.1 25.7
5 23.2 25.5 19.8 16.8 12.0 10.9 12.0 13.3 15.8 21.2 21.3 25.4
6 23.2 23.5 21.3 19.5 14.7 11.6 11.2 14.3 18.7 19.9 22.3 23.8
7 26.6 21.5 19.4 18.8 14.5 9.70 10.8 13.7 17.0 21.4 24.1 26.1
8 25.1 23.2 20.3 16.4 12.8 10.3 10.7 14.9 17.0 21.6 22.0 26.8 9 24.9 23.2 19.5 16.2 13.4 10.6 9.60 14.9 15.7 22.3 23.2 24.8
10 26.4 24.1 21.0 17.4 12.9 10.7 11.2 15.4 18.7 21.5 24.7 22.7
11 26.4 24.3 21.4 16.3 12.8 10.1 11.4 15.1 18.3 22.4 24.2 24.7
12 26.7 21.4 20.2 16.5 12.6 11.6 10.3 15.2 18.4 22.8 25.3 26.3
13 26.1 22.4 21.0 16.4 12.5 9.80 9.90 15.7 20.4 23.7 24.4 28.3
14 25.6 20.2 21.1 14.9 12.7 10.2 10.2 15.6 19.7 21.9 26.9 25.8
15 25.7 19.7 21.9 16.7 12.9 10.5 11.6 15.6 19.3 23.2 23.8 25.2
16 26.6 20.3 21.9 15.7 12.2 10.5 12.4 14.3 19.7 23.6 22.5 27.0
17 25.1 23.9 19.3 15.4 11.5 11.2 12.1 14.4 19.2 22.5 21.3 28.3
18 25.1 22.2 20.7 16.2 11.1 10.6 10.7 14.0 19.7 23.0 21.5 26.0
19 22.1 21.8 20.9 15.2 12.4 9.50 12.2 14.6 20.0 21.8 25.5 27.1 20 28.4 22.8 20.5 15.4 12.4 9.90 12.4 13.9 19.9 23.6 24.2 26.8
21 27.3 23.4 19.8 16.2 11.3 10.6 12.4 15.5 19.9 22.9 21.3 28.1
22 25.0 21.3 17.8 15.7 11.9 10.6 12.2 14.3 21.2 24.3 24.2 26.4
23 23.5 23.2 18.8 16.2 12.2 10.4 12.7 12.8 21.8 24.4 23.7 27.9
24 25.6 23.3 20.3 14.6 12.0 11.1 11.6 16.1 20.2 21.3 25.6 24.3
25 20.8 19.0 19.5 14.6 12.2 11.0 10.8 16.8 21.5 22.9 25.3 26.2
26 25.4 21.5 17.8 14.9 11.9 10.3 9.60 16.2 20.5 20.0 26.3 26.3
27 25.2 21.5 19.4 13.7 12.2 9.80 11.4 15.5 21.5 21.3 26.1 19.8
28 27.2 25.5 17.9 13.1 11.7 10.6 11.7 15.3 21.6 26.9 26.5 26.2
29 26.8 18.3 18.5 15.1 11.4 11.2 13.6 14.9 22.1 25.5 25.7 28.3
30 27.4
15.8 14.9 11.5 9.70 13.3 14.0 23.7 21.3 26.0 26.1
31 22.8
18.7
11.0
12.8 15.9
22.6
28.4
Extracted from [15]

Generation of an Annual Typical Meteorological Solar Irradiance on Tilted Surfaces for Armidale
International organization of Scientific Research 28 | P a g e
Table 4 January’s Daily solar radiation on tilted surfaces valuesobtainedfromTestReferenceYear data for
Armidale NSW,Australia
Array Tilt Angle in Degrees
15 30 45 60 75
Day Serial Month Day Shoriz Smodule Smodule Smodule Smodule Smodule Sincident
1 J
an
ua
ry
1 29.4 27.4 23.52 18.05 11.34 3.87 29.65
2 2 27 25.15 21.58 16.55 10.38 3.51 27.24
3 3 27.2 25.32 21.72 16.64 10.42 3.5 27.45
4 4 26.1 24.29 20.82 15.94 9.96 3.31 26.34
5 5 23.2 21.58 18.49 14.14 8.82 2.91 23.42
6 6 23.2 21.57 18.47 14.1 8.78 2.86 23.43
7 7 26.6 24.71 21.14 16.13 10.02 3.23 26.87
8 8 25.1 23.31 19.92 15.19 9.41 2.99 25.36
9 9 24.9 23.11 19.74 15.02 9.29 2.92 25.17
10 10 26.4 24.48 20.89 15.88 9.79 3.03 26.69
11 11 26.4 24.46 20.86 15.84 9.73 2.97 26.7
12 12 26.7 24.72 21.06 15.97 9.78 2.93 27.02
13 13 26.1 24.15 20.55 15.56 9.5 2.8 26.42
14 14 25.6 23.67 20.12 15.21 9.26 2.67 25.93
15 15 25.7 23.74 20.16 15.21 9.23 2.68 26.04
16 16 26.6 24.55 20.83 15.69 9.48 2.62 26.96
17 17 25.1 23.15 19.61 14.75 8.87 2.39 25.46
18 18 25.1 23.12 19.57 14.69 8.8 2.31 25.47
19 19 22.1 20.34 17.19 12.88 7.68 1.96 22.44
20 20 28.4 26.11 22.05 16.48 9.78 2.43 28.85
21 21 27.3 25.39 21.84 16.65 10.37 3.55 27.57
22 22 25 23.25 20 15.25 9.5 3.25 25.25
23 23 23.5 21.86 18.8 14.34 8.93 3.06 23.74
24 24 25.6 23.81 20.48 15.62 9.73 3.33 25.86
25 25 20.8 19.34 16.64 12.69 7.9 2.7 21.01
26 26 25.4 23.62 20.32 15.49 9.65 3.3 25.65
27 27 25.2 23.44 20.16 15.37 9.58 3.28 25.45
28 28 27.2 25.3 21.76 16.59 10.34 3.54 27.47
29 29 26.8 24.92 21.44 16.35 10.18 3.48 27.07
30 30 27.4 25.48 21.92 16.71 10.41 3.56 27.67
31 31 22.8 21.2 18.24 13.91 8.66 2.96 23.03
Generation of an Annual Typical Meteorological Solar Irradiance on Tilted Surfaces for Armidale
International organization of Scientific Research 29 | P a g e
Table 5 February’s Daily solar radiation on tilted surfaces valuesobtainedfromTestReferenceYear data for
Armidale NSW,Australia
Array Tilt Angle in Degrees
15 30 45 60 75
Day Serial Month Day Shoriz Smodule Smodule Smodule Smodule Smodu
le Sincident
32
Feb
ru
ary
1 18.1 16.83 14.48 11.04 6.88 2.35 18.28
33 2 22.5 20.93 18 13.73 8.55 2.93 22.73
34 3 23.2 21.58 18.56 14.15 8.82 3.02 23.43
35 4 26.1 24.27 20.88 15.92 9.92 3.39 26.36
36 5 25.5 23.72 20.4 15.56 9.69 3.32 25.76
37 6 23.5 21.86 18.8 14.34 8.93 3.06 23.74
38 7 21.5 20 17.2 13.12 8.17 2.8 21.72
39 8 23.2 21.58 18.56 14.15 8.82 3.02 23.43
40 9 23.2 21.58 18.56 14.15 8.82 3.02 23.43
41 10 24.1 22.41 19.28 14.7 9.16 3.13 24.34
42 11 24.3 22.6 19.44 14.82 9.23 3.16 24.54
43 12 21.4 19.9 17.12 13.05 8.13 2.78 21.61
44 13 22.4 20.83 17.92 13.66 8.51 2.91 22.62
45 14 20.2 18.79 16.16 12.32 7.68 2.63 20.4
46 15 19.7 18.32 15.76 12.02 7.49 2.56 19.9
47 16 20.3 18.88 16.24 12.38 7.71 2.64 20.5
48 17 23.9 22.23 19.12 14.58 9.08 3.11 24.14
49 18 22.2 20.65 17.76 13.54 8.44 2.89 22.42
50 19 21.8 20.27 17.44 13.3 8.28 2.83 22.02
51 20 22.8 21.2 18.24 13.91 8.66 2.96 23.03
52 21 23.4 21.76 18.72 14.27 8.89 3.04 23.63
53 22 21.3 19.81 17.04 12.99 8.09 2.77 21.51
54 23 23.2 21.58 18.56 14.15 8.82 3.02 23.43
55 24 23.3 21.67 18.64 14.21 8.85 3.03 23.53
56 25 19 17.67 15.2 11.59 7.22 2.47 19.19
57 26 21.5 20 17.2 13.12 8.17 2.8 21.72
58 27 21.5 20 17.2 13.12 8.17 2.8 21.72
59 28 25.5 23.72 20.4 15.56 9.69 3.32 25.76
60 29 18.3 17.02 14.64 11.16 6.95 2.38 18.48
Generation of an Annual Typical Meteorological Solar Irradiance on Tilted Surfaces for Armidale
International organization of Scientific Research 30 | P a g e
Table 6 March’s Daily solar radiation on tilted surfaces valuesobtainedfromTestReferenceYear data for
Armidale NSW,Australia
Array Tilt Angle in Degrees
15 30 45 60 75
Day Serial Month Day Shoriz Smodule Smodule Smodule Smodule Smodule Sincident
61
Ma
rch
1 19.1 17.76 15.28 11.65 7.26 2.48 19.29
62 2 21.8 20.27 17.44 13.3 8.28 2.83 22.02
63 3 21.1 19.62 16.88 12.87 8.02 2.74 21.31
64 4 22 20.46 17.6 13.42 8.36 2.86 22.22
65 5 19.8 18.41 15.84 12.08 7.52 2.57 20
66 6 21.3 19.81 17.04 12.99 8.09 2.77 21.51
67 7 19.4 18.04 15.52 11.83 7.37 2.52 19.59
68 8 20.3 18.88 16.24 12.38 7.71 2.64 20.5
69 9 19.5 18.14 15.6 11.9 7.41 2.54 19.7
70 10 21 19.53 16.8 12.81 7.98 2.73 21.21
71 11 21.4 19.9 17.12 13.05 8.13 2.78 21.61
72 12 20.2 18.79 16.16 12.32 7.68 2.63 20.4
73 13 21 19.53 16.8 12.81 7.98 2.73 21.21
74 14 21.1 19.62 16.88 12.87 8.02 2.74 21.31
75 15 21.9 20.37 17.52 13.36 8.32 2.85 22.12
76 16 21.9 20.37 17.52 13.36 8.32 2.85 22.12
77 17 19.3 17.95 15.44 11.77 7.33 2.51 19.49
78 18 20.7 19.25 16.56 12.63 7.87 2.69 20.91
79 19 20.9 19.44 16.72 12.75 7.94 2.72 21.11
80 20 20.5 19.07 16.4 12.51 7.79 2.67 20.71
81 21 19.8 18.41 15.84 12.08 7.52 2.57 20
82 22 17.8 16.55 14.24 10.86 6.76 2.31 17.98
83 23 18.8 17.48 15.04 11.47 7.14 2.44 18.99
84 24 20.3 18.88 16.24 12.38 7.71 2.64 20.5
85 25 19.5 18.14 15.6 11.9 7.41 2.54 19.7
86 26 17.8 16.55 14.24 10.86 6.76 2.31 17.98
87 27 19.4 18.04 15.52 11.83 7.37 2.52 19.59
88 28 17.9 16.65 14.32 10.92 6.8 2.33 18.08
89 29 18.5 17.21 14.8 11.29 7.03 2.41 18.69
90 30 15.8 14.69 12.64 9.64 6 2.05 15.96
91 31 18.7 17.39 14.96 11.41 7.11 2.43 18.89
Generation of an Annual Typical Meteorological Solar Irradiance on Tilted Surfaces for Armidale
International organization of Scientific Research 31 | P a g e
Table 7 April’s Daily solar radiation on tilted surfaces valuesobtainedfromTestReferenceYear data for Armidale
NSW,Australia
Array Tilt Angle in Degrees
15 30 45 60 75
Day Serial Month Day Shoriz Smodule Smodule Smodule Smodule Smodule Sincident
92
Ap
ril
1 18.8 17.48 15.04 11.47 7.14 2.44 18.99
93 2 18.9 17.58 15.12 11.53 7.18 2.46 19.09
94 3 17.8 16.55 14.24 10.86 6.76 2.31 17.98
95 4 19 17.67 15.2 11.59 7.22 2.47 19.19
96 5 16.8 15.62 13.44 10.25 6.38 2.18 16.97
97 6 19.5 18.14 15.6 11.9 7.41 2.54 19.7
98 7 18.8 17.48 15.04 11.47 7.14 2.44 18.99
99 8 16.4 15.25 13.12 10 6.23 2.13 16.56
100 9 16.2 15.07 12.96 9.88 6.16 2.11 16.36
101 10 17.4 16.18 13.92 10.61 6.61 2.26 17.57
102 11 16.3 15.16 13.04 9.94 6.19 2.12 16.46
103 12 16.5 15.35 13.2 10.07 6.27 2.15 16.67
104 13 16.4 15.25 13.12 10 6.23 2.13 16.56
105 14 14.9 13.86 11.92 9.09 5.66 1.94 15.05
106 15 16.7 15.53 13.36 10.19 6.35 2.17 16.87
107 16 15.7 14.6 12.56 9.58 5.97 2.04 15.86
108 17 15.4 14.32 12.32 9.39 5.85 2 15.55
109 18 16.2 15.07 12.96 9.88 6.16 2.11 16.36
110 19 15.2 14.14 12.16 9.27 5.78 1.98 15.35
111 20 15.4 14.32 12.32 9.39 5.85 2 15.55
112 21 16.2 15.07 12.96 9.88 6.16 2.11 16.36
113 22 15.7 14.6 12.56 9.58 5.97 2.04 15.86
114 23 16.2 15.07 12.96 9.88 6.16 2.11 16.36
115 24 14.6 13.58 11.68 8.91 5.55 1.9 14.75
116 25 14.6 13.58 11.68 8.91 5.55 1.9 14.75
117 26 14.9 13.86 11.92 9.09 5.66 1.94 15.05
118 27 13.7 12.74 10.96 8.36 5.21 1.78 13.84
119 28 13.1 12.18 10.48 7.99 4.98 1.7 13.23
120 29 15.1 14.04 12.08 9.21 5.74 1.96 15.25
121 30 14.9 13.86 11.92 9.09 5.66 1.94 15.05
Generation of an Annual Typical Meteorological Solar Irradiance on Tilted Surfaces for Armidale
International organization of Scientific Research 32 | P a g e
Table 8 May’s Daily solar radiation on tilted surfaces valuesobtainedfromTestReferenceYear data for Armidale
NSW,Australia
Array Tilt Angle in Degrees
15 30 45 60 75
Day Serial Month Day Shoriz Smodule Smodule Smodule Smodule Smodule Sincident
122
Ma
y
1 13.5 12.56 10.8 8.24 5.13 1.76 13.64
123 2 12.6 11.72 10.08 7.69 4.79 1.64 12.73
124 3 13.9 12.93 11.12 8.48 5.28 1.81 14.04
125 4 13 12.09 10.4 7.93 4.94 1.69 13.13
126 5 12 11.16 9.6 7.32 4.56 1.56 12.12
127 6 14.7 13.67 11.76 8.97 5.59 1.91 14.85
128 7 14.5 13.49 11.6 8.85 5.51 1.89 14.65
129 8 12.8 11.9 10.24 7.81 4.86 1.66 12.93
130 9 13.4 12.46 10.72 8.17 5.09 1.74 13.53
131 10 12.9 12 10.32 7.87 4.9 1.68 13.03
132 11 12.8 11.9 10.24 7.81 4.86 1.66 12.93
133 12 12.6 11.72 10.08 7.69 4.79 1.64 12.73
134 13 12.5 11.63 10 7.63 4.75 1.63 12.63
135 14 12.7 11.81 10.16 7.75 4.83 1.65 12.83
136 15 12.9 12 10.32 7.87 4.9 1.68 13.03
137 16 12.2 11.35 9.76 7.44 4.64 1.59 12.32
138 17 11.5 10.7 9.2 7.02 4.37 1.5 11.62
139 18 11.1 10.32 8.88 6.77 4.22 1.44 11.21
140 19 12.4 11.53 9.92 7.56 4.71 1.61 12.52
141 20 12.4 11.53 9.92 7.56 4.71 1.61 12.52
142 21 11.3 10.51 9.04 6.89 4.29 1.47 11.41
143 22 11.9 11.07 9.52 7.26 4.52 1.55 12.02
144 23 12.2 11.35 9.76 7.44 4.64 1.59 12.32
145 24 12 11.16 9.6 7.32 4.56 1.56 12.12
146 25 12.2 11.35 9.76 7.44 4.64 1.59 12.32
147 26 11.9 11.07 9.52 7.26 4.52 1.55 12.02
148 27 12.2 11.35 9.76 7.44 4.64 1.59 12.32
149 28 11.7 10.88 9.36 7.14 4.45 1.52 11.82
150 29 11.4 10.6 9.12 6.95 4.33 1.48 11.51
151 30 11.5 10.7 9.2 7.02 4.37 1.5 11.62
152 31 11 10.23 8.8 6.71 4.18 1.43 11.11

Generation of an Annual Typical Meteorological Solar Irradiance on Tilted Surfaces for Armidale
International organization of Scientific Research 33 | P a g e
Table 9 June’s Daily solar radiation on tilted surfaces valuesobtainedfromTestReferenceYear data for Armidale
NSW, Australia
Array Tilt Angle in Degrees
15 30 45 60 75
Day Serial Month Day Shoriz Smodule Smodule Smodule Smodule Smodule Sincident
153
Ju
ne
1 10.8 10.04 8.64 6.59 4.1 1.4 10.91
154 2 10.6 9.86 8.48 6.47 4.03 1.38 10.71
155 3 9 8.37 7.2 5.49 3.42 1.17 9.09
156 4 10.7 9.95 8.56 6.53 4.07 1.39 10.81
157 5 10.9 10.14 8.72 6.65 4.14 1.42 11.01
158 6 11.6 10.79 9.28 7.08 4.41 1.51 11.72
159 7 9.7 9.02 7.76 5.92 3.69 1.26 9.8
160 8 10.3 9.58 8.24 6.28 3.91 1.34 10.4
161 9 10.6 9.86 8.48 6.47 4.03 1.38 10.71
162 10 10.7 9.95 8.56 6.53 4.07 1.39 10.81
163 11 10.1 9.39 8.08 6.16 3.84 1.31 10.2
164 12 11.6 10.79 9.28 7.08 4.41 1.51 11.72
165 13 9.8 9.11 7.84 5.98 3.72 1.27 9.9
166 14 10.2 9.49 8.16 6.22 3.88 1.33 10.3
167 15 10.5 9.77 8.4 6.41 3.99 1.37 10.61
168 16 10.5 9.77 8.4 6.41 3.99 1.37 10.61
169 17 11.2 10.42 8.96 6.83 4.26 1.46 11.31
170 18 10.6 9.86 8.48 6.47 4.03 1.38 10.71
171 19 9.5 8.84 7.6 5.8 3.61 1.24 9.6
172 20 9.9 9.21 7.92 6.04 3.76 1.29 10
173 21 10.6 9.86 8.48 6.47 4.03 1.38 10.71
174 22 10.6 9.86 8.48 6.47 4.03 1.38 10.71
175 23 10.4 9.67 8.32 6.34 3.95 1.35 10.5
176 24 11.1 10.32 8.88 6.77 4.22 1.44 11.21
177 25 11 10.23 8.8 6.71 4.18 1.43 11.11
178 26 10.3 9.58 8.24 6.28 3.91 1.34 10.4
179 27 9.8 9.11 7.84 5.98 3.72 1.27 9.9
180 28 10.6 9.86 8.48 6.47 4.03 1.38 10.71
181 29 11.2 10.42 8.96 6.83 4.26 1.46 11.31
182 30 9.7 9.02 7.76 5.92 3.69 1.26 9.8

Generation of an Annual Typical Meteorological Solar Irradiance on Tilted Surfaces for Armidale
International organization of Scientific Research 34 | P a g e
Table 10 July’s Daily solar radiation on tilted surfaces valuesobtainedfromTestReferenceYear data for Armidale
NSW, Australia
Array Tilt Angle in Degrees
15 30 45 60 75
Day Serial Month Day Shoriz Smodule Smodule Smodule Smodule Smodule Sincident
183
Ju
ly
1 10 9.3 8 6.1 3.8 1.3 10.1
184 2 10.4 9.67 8.32 6.34 3.95 1.35 10.5
185 3 11.2 10.42 8.96 6.83 4.26 1.46 11.31
186 4 10 9.3 8 6.1 3.8 1.3 10.1
187 5 12 11.16 9.6 7.32 4.56 1.56 12.12
188 6 11.2 10.42 8.96 6.83 4.26 1.46 11.31
189 7 10.8 10.04 8.64 6.59 4.1 1.4 10.91
190 8 10.7 9.95 8.56 6.53 4.07 1.39 10.81
191 9 9.6 8.93 7.68 5.86 3.65 1.25 9.7
192 10 11.2 10.42 8.96 6.83 4.26 1.46 11.31
193 11 11.4 10.6 9.12 6.95 4.33 1.48 11.51
194 12 10.3 9.58 8.24 6.28 3.91 1.34 10.4
195 13 9.9 9.21 7.92 6.04 3.76 1.29 10
196 14 10.2 9.49 8.16 6.22 3.88 1.33 10.3
197 15 11.6 10.79 9.28 7.08 4.41 1.51 11.72
198 16 12.4 11.53 9.92 7.56 4.71 1.61 12.52
199 17 12.1 11.25 9.68 7.38 4.6 1.57 12.22
200 18 10.7 9.95 8.56 6.53 4.07 1.39 10.81
201 19 12.2 11.35 9.76 7.44 4.64 1.59 12.32
202 20 12.4 11.53 9.92 7.56 4.71 1.61 12.52
203 21 12.4 11.53 9.92 7.56 4.71 1.61 12.52
204 22 12.2 11.35 9.76 7.44 4.64 1.59 12.32
205 23 12.7 11.81 10.16 7.75 4.83 1.65 12.83
206 24 11.6 10.79 9.28 7.08 4.41 1.51 11.72
207 25 10.8 10.04 8.64 6.59 4.1 1.4 10.91
208 26 9.6 8.93 7.68 5.86 3.65 1.25 9.7
209 27 11.4 10.6 9.12 6.95 4.33 1.48 11.51
210 28 11.7 10.88 9.36 7.14 4.45 1.52 11.82
211 29 13.6 12.65 10.88 8.3 5.17 1.77 13.74
212 30 13.3 12.37 10.64 8.11 5.05 1.73 13.43
213 31 12.8 11.9 10.24 7.81 4.86 1.66 12.93

Generation of an Annual Typical Meteorological Solar Irradiance on Tilted Surfaces for Armidale
International organization of Scientific Research 35 | P a g e
Table 11 August’s Daily solar radiation on tilted surfaces valuesobtainedfromTestReferenceYear data for
Armidale NSW, Australia
Array Tilt Angle in Degrees
15 30 45 60 75
Day Serial Month Day Shoriz Smodule Smodule Smodule Smodule Smodule Sincident
214
Au
gu
st
1 14.5 13.49 11.6 8.85 5.51 1.89 14.65
215 2 14.2 13.21 11.36 8.66 5.4 1.85 14.34
216 3 13.6 12.65 10.88 8.3 5.17 1.77 13.74
217 4 13.2 12.28 10.56 8.05 5.02 1.72 13.33
218 5 13.3 12.37 10.64 8.11 5.05 1.73 13.43
219 6 14.3 13.3 11.44 8.72 5.43 1.86 14.44
220 7 13.7 12.74 10.96 8.36 5.21 1.78 13.84
221 8 14.9 13.86 11.92 9.09 5.66 1.94 15.05
222 9 14.9 13.86 11.92 9.09 5.66 1.94 15.05
223 10 15.4 14.32 12.32 9.39 5.85 2 15.55
224 11 15.1 14.04 12.08 9.21 5.74 1.96 15.25
225 12 15.2 14.14 12.16 9.27 5.78 1.98 15.35
226 13 15.7 14.6 12.56 9.58 5.97 2.04 15.86
227 14 15.6 14.51 12.48 9.52 5.93 2.03 15.76
228 15 15.6 14.51 12.48 9.52 5.93 2.03 15.76
229 16 14.3 13.3 11.44 8.72 5.43 1.86 14.44
230 17 14.4 13.39 11.52 8.78 5.47 1.87 14.54
231 18 14 13.02 11.2 8.54 5.32 1.82 14.14
232 19 14.6 13.58 11.68 8.91 5.55 1.9 14.75
233 20 13.9 12.93 11.12 8.48 5.28 1.81 14.04
234 21 15.5 14.42 12.4 9.46 5.89 2.02 15.66
235 22 14.3 13.3 11.44 8.72 5.43 1.86 14.44
236 23 12.8 11.9 10.24 7.81 4.86 1.66 12.93
237 24 16.1 14.97 12.88 9.82 6.12 2.09 16.26
238 25 16.8 15.62 13.44 10.25 6.38 2.18 16.97
239 26 16.2 15.07 12.96 9.88 6.16 2.11 16.36
240 27 15.5 14.42 12.4 9.46 5.89 2.02 15.66
241 28 15.3 14.23 12.24 9.33 5.81 1.99 15.45
242 29 14.9 13.86 11.92 9.09 5.66 1.94 15.05
243 30 14 13.02 11.2 8.54 5.32 1.82 14.14
244 31 15.9 14.79 12.72 9.7 6.04 2.07 16.06
Generation of an Annual Typical Meteorological Solar Irradiance on Tilted Surfaces for Armidale
International organization of Scientific Research 36 | P a g e
Table 12 September’s Daily solar radiation on tilted surfaces valuesobtainedfromTestReferenceYear data for
Armidale NSW, Australia
Array Tilt Angle in Degrees
15 30 45 60 75
Day Serial Month Day Shoriz Smodule Smodule Smodule Smodule Smodule Sincident
245
Sep
tem
ber
1 16.4 15.25 13.12 10 6.23 2.13 16.56
246 2 16.3 15.16 13.04 9.94 6.19 2.12 16.46
247 3 16.1 14.97 12.88 9.82 6.12 2.09 16.26
248 4 17.5 16.28 14 10.68 6.65 2.28 17.68
249 5 15.8 14.69 12.64 9.64 6 2.05 15.96
250 6 18.7 17.39 14.96 11.41 7.11 2.43 18.89
251 7 17 15.81 13.6 10.37 6.46 2.21 17.17
252 8 17 15.81 13.6 10.37 6.46 2.21 17.17
253 9 15.7 14.6 12.56 9.58 5.97 2.04 15.86
254 10 18.7 17.39 14.96 11.41 7.11 2.43 18.89
255 11 18.3 17.02 14.64 11.16 6.95 2.38 18.48
256 12 18.4 17.11 14.72 11.22 6.99 2.39 18.58
257 13 20.4 18.97 16.32 12.44 7.75 2.65 20.6
258 14 19.7 18.32 15.76 12.02 7.49 2.56 19.9
259 15 19.3 17.95 15.44 11.77 7.33 2.51 19.49
260 16 19.7 18.32 15.76 12.02 7.49 2.56 19.9
261 17 19.2 17.86 15.36 11.71 7.3 2.5 19.39
262 18 19.7 18.32 15.76 12.02 7.49 2.56 19.9
263 19 20 18.6 16 12.2 7.6 2.6 20.2
264 20 19.9 18.51 15.92 12.14 7.56 2.59 20.1
265 21 19.9 18.51 15.92 12.14 7.56 2.59 20.1
266 22 21.2 19.72 16.96 12.93 8.06 2.76 21.41
267 23 21.8 20.27 17.44 13.3 8.28 2.83 22.02
268 24 20.2 18.79 16.16 12.32 7.68 2.63 20.4
269 25 21.5 20 17.2 13.12 8.17 2.8 21.72
270 26 20.5 19.07 16.4 12.51 7.79 2.67 20.71
271 27 21.5 20 17.2 13.12 8.17 2.8 21.72
272 28 21.6 20.09 17.28 13.18 8.21 2.81 21.82
273 29 22.1 20.55 17.68 13.48 8.4 2.87 22.32
274 30 23.7 22.04 18.96 14.46 9.01 3.08 23.94

Generation of an Annual Typical Meteorological Solar Irradiance on Tilted Surfaces for Armidale
International organization of Scientific Research 37 | P a g e
Table 13 October’s Daily solar radiation on tilted surfaces valuesobtainedfromTestReferenceYear data for
Armidale NSW, Australia
Array Tilt Angle in Degrees
15 30 45 60 75
Day Serial Month
Day Shoriz Smodule Smodule Smodule Smodule Smodule Sincident
275 O
cto
ber
1 20.5 19.07 16.4 12.51 7.79 2.67 20.71
276 2 19.4 18.04 15.52 11.83 7.37 2.52 19.59
277 3 19.3 17.95 15.44 11.77 7.33 2.51 19.49
278 4 20.9 19.44 16.72 12.75 7.94 2.72 21.11
279 5 21.2 19.72 16.96 12.93 8.06 2.76 21.41
280 6 19.9 18.51 15.92 12.14 7.56 2.59 20.1
281 7 21.4 19.9 17.12 13.05 8.13 2.78 21.61
282 8 21.6 20.09 17.28 13.18 8.21 2.81 21.82
283 9 22.3 20.74 17.84 13.6 8.47 2.9 22.52
284 10 21.5 20 17.2 13.12 8.17 2.8 21.72
285 11 22.4 20.83 17.92 13.66 8.51 2.91 22.62
286 12 22.8 21.2 18.24 13.91 8.66 2.96 23.03
287 13 23.7 22.04 18.96 14.46 9.01 3.08 23.94
288 14 21.9 20.37 17.52 13.36 8.32 2.85 22.12
289 15 23.2 21.58 18.56 14.15 8.82 3.02 23.43
290 16 23.6 21.95 18.88 14.4 8.97 3.07 23.84
291 17 22.5 20.93 18 13.73 8.55 2.93 22.73
292 18 23 21.39 18.4 14.03 8.74 2.99 23.23
293 19 21.8 20.27 17.44 13.3 8.28 2.83 22.02
294 20 23.6 21.95 18.88 14.4 8.97 3.07 23.84
295 21 22.9 21.3 18.32 13.97 8.7 2.98 23.13
296 22 24.3 22.6 19.44 14.82 9.23 3.16 24.54
297 23 24.4 22.69 19.52 14.88 9.27 3.17 24.64
298 24 21.3 19.81 17.04 12.99 8.09 2.77 21.51
299 25 22.9 21.3 18.32 13.97 8.7 2.98 23.13
300 26 20 18.6 16 12.2 7.6 2.6 20.2
301 27 21.3 19.81 17.04 12.99 8.09 2.77 21.51
302 28 26.9 25.02 21.52 16.41 10.22 3.5 27.17
303 29 25.5 23.72 20.4 15.56 9.69 3.32 25.76
304 30 21.3 19.81 17.04 12.99 8.09 2.77 21.51
305 31 22.6 21.02 18.08 13.79 8.59 2.94 22.83

Generation of an Annual Typical Meteorological Solar Irradiance on Tilted Surfaces for Armidale
International organization of Scientific Research 38 | P a g e
Table 14 November’s Daily solar radiation on tilted surfaces valuesobtainedfromTestReferenceYear data for
Armidale NSW, Australia
Array Tilt Angle in Degrees
15 30 45 60 75
Day Serial Month Day Shoriz Smodule Smodule Smodule Smodule Smodule Sincident
306
No
vem
ber
1 22.3 20.74 17.84 13.6 8.47 2.9 22.52
307 2 22.9 21.3 18.32 13.97 8.7 2.98 23.13
308 3 23.4 21.76 18.72 14.27 8.89 3.04 23.63
309 4 23.1 21.48 18.48 14.09 8.78 3 23.33
310 5 21.3 19.81 17.04 12.99 8.09 2.77 21.51
311 6 22.3 20.74 17.84 13.6 8.47 2.9 22.52
312 7 24.1 22.41 19.28 14.7 9.16 3.13 24.34
313 8 22 20.46 17.6 13.42 8.36 2.86 22.22
314 9 23.2 21.58 18.56 14.15 8.82 3.02 23.43
315 10 24.7 22.97 19.76 15.07 9.39 3.21 24.95
316 11 24.2 22.51 19.36 14.76 9.2 3.15 24.44
317 12 25.3 23.53 20.24 15.43 9.61 3.29 25.55
318 13 24.4 22.69 19.52 14.88 9.27 3.17 24.64
319 14 26.9 25.02 21.52 16.41 10.22 3.5 27.17
320 15 23.8 22.13 19.04 14.52 9.04 3.09 24.04
321 16 22.5 20.93 18 13.73 8.55 2.93 22.73
322 17 21.3 19.81 17.04 12.99 8.09 2.77 21.51
323 18 21.5 20 17.2 13.12 8.17 2.8 21.72
324 19 25.5 23.72 20.4 15.56 9.69 3.32 25.76
325 20 24.2 22.51 19.36 14.76 9.2 3.15 24.44
326 21 21.3 19.81 17.04 12.99 8.09 2.77 21.51
327 22 24.2 22.51 19.36 14.76 9.2 3.15 24.44
328 23 23.7 22.04 18.96 14.46 9.01 3.08 23.94
329 24 25.6 23.81 20.48 15.62 9.73 3.33 25.86
330 25 25.3 23.53 20.24 15.43 9.61 3.29 25.55
331 26 26.3 24.46 21.04 16.04 9.99 3.42 26.56
332 27 26.1 24.27 20.88 15.92 9.92 3.39 26.36
333 28 26.5 24.65 21.2 16.17 10.07 3.45 26.77
334 29 25.7 23.9 20.56 15.68 9.77 3.34 25.96
335 30 26 24.18 20.8 15.86 9.88 3.38 26.26
Generation of an Annual Typical Meteorological Solar Irradiance on Tilted Surfaces for Armidale
International organization of Scientific Research 39 | P a g e
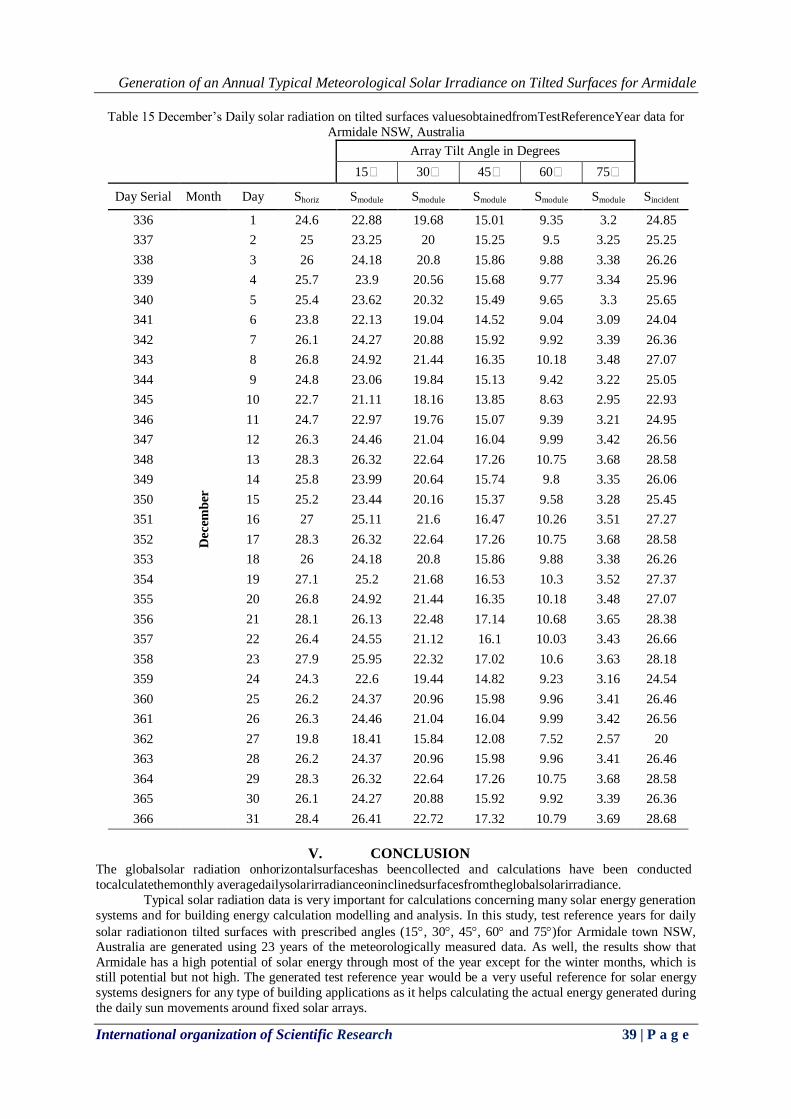
Table 15 December’s Daily solar radiation on tilted surfaces valuesobtainedfromTestReferenceYear data for
Armidale NSW, Australia
Array Tilt Angle in Degrees
15 30 45 60 75
Day Serial Month Day Shoriz Smodule Smodule Smodule Smodule Smodule Sincident
336
Decem
ber
1 24.6 22.88 19.68 15.01 9.35 3.2 24.85
337 2 25 23.25 20 15.25 9.5 3.25 25.25
338 3 26 24.18 20.8 15.86 9.88 3.38 26.26
339 4 25.7 23.9 20.56 15.68 9.77 3.34 25.96
340 5 25.4 23.62 20.32 15.49 9.65 3.3 25.65
341 6 23.8 22.13 19.04 14.52 9.04 3.09 24.04
342 7 26.1 24.27 20.88 15.92 9.92 3.39 26.36
343 8 26.8 24.92 21.44 16.35 10.18 3.48 27.07
344 9 24.8 23.06 19.84 15.13 9.42 3.22 25.05
345 10 22.7 21.11 18.16 13.85 8.63 2.95 22.93
346 11 24.7 22.97 19.76 15.07 9.39 3.21 24.95
347 12 26.3 24.46 21.04 16.04 9.99 3.42 26.56
348 13 28.3 26.32 22.64 17.26 10.75 3.68 28.58
349 14 25.8 23.99 20.64 15.74 9.8 3.35 26.06
350 15 25.2 23.44 20.16 15.37 9.58 3.28 25.45
351 16 27 25.11 21.6 16.47 10.26 3.51 27.27
352 17 28.3 26.32 22.64 17.26 10.75 3.68 28.58
353 18 26 24.18 20.8 15.86 9.88 3.38 26.26
354 19 27.1 25.2 21.68 16.53 10.3 3.52 27.37
355 20 26.8 24.92 21.44 16.35 10.18 3.48 27.07
356 21 28.1 26.13 22.48 17.14 10.68 3.65 28.38
357 22 26.4 24.55 21.12 16.1 10.03 3.43 26.66
358 23 27.9 25.95 22.32 17.02 10.6 3.63 28.18
359 24 24.3 22.6 19.44 14.82 9.23 3.16 24.54
360 25 26.2 24.37 20.96 15.98 9.96 3.41 26.46
361 26 26.3 24.46 21.04 16.04 9.99 3.42 26.56
362 27 19.8 18.41 15.84 12.08 7.52 2.57 20
363 28 26.2 24.37 20.96 15.98 9.96 3.41 26.46
364 29 28.3 26.32 22.64 17.26 10.75 3.68 28.58
365 30 26.1 24.27 20.88 15.92 9.92 3.39 26.36
366 31 28.4 26.41 22.72 17.32 10.79 3.69 28.68
V. CONCLUSION The globalsolar radiation onhorizontalsurfaceshas beencollected and calculations have been conducted
tocalculatethemonthly averagedailysolarirradianceoninclinedsurfacesfromtheglobalsolarirradiance.
Typical solar radiation data is very important for calculations concerning many solar energy generation
systems and for building energy calculation modelling and analysis. In this study, test reference years for daily
solar radiationon tilted surfaces with prescribed angles (15, 30, 45, 60 and 75)for Armidale town NSW, Australia are generated using 23 years of the meteorologically measured data. As well, the results show that
Armidale has a high potential of solar energy through most of the year except for the winter months, which is still potential but not high. The generated test reference year would be a very useful reference for solar energy
systems designers for any type of building applications as it helps calculating the actual energy generated during
the daily sun movements around fixed solar arrays.
Generation of an Annual Typical Meteorological Solar Irradiance on Tilted Surfaces for Armidale
International organization of Scientific Research 40 | P a g e
It is worth mentioning that well such TYM study has been developed for Armidale for mean wind
speed measured at 10 meter height [19]. So concurrently with this study, hybrid solar and wind energy systems
can be investigated, examined and designed for Armidale based on this study and study [16] concurrently.
REFERENCES [1] A. Argiriou, S. Lykoudis, S. Kontoyiannidis, C.A. Balaras, D. Asimakopoulos, M. Petrakis, and
P.Kassomenos. Comparison of methodologies for TMY generation using 20 years data forAthens,
Greece. Solar Energy 66(1), 1999, 33–45.
[2] W. Marion and K. Urban. User’s Manual for TMY2s. National Renewable Energy Laboratory, Colorado,
USA, 1995.
[3] H. Bulut. Generation of typical solar radiation data for Istanbul, Turkey. International Journal of Energy
Research 27(9), 2003, 847–855.
[4] H. Bulut. Typical Solar Radiation Year for South-eastern Anatolia. Renewable Energy 29(9), 2004,
1477–1488.
[5] R.L. Fagbenle. Generation of a test reference year for Ibadan, Nigeria. Energy Conversion
andManagement 30(1), 1995, 61–63. [6] J.C. Lam, S.C.M. Hui, and A.L.S. Chan. A statistical approach to the development of a
typicalmeteorological year for Hong Kong. Architectural Science Review 39(4), 1996, 201–209.
[7] A. Miguel, and J. Bilbao. Test reference year generation from meteorological and simulatedsolar
radiation data. Solar Energy 78(6), 2005, 695–703.
[8] M. Petrakis, H.D. Kambezidis, S. Lykoudis, A.D. Adamopoulos, P. Kassomenos, I.M. Michaelides, S.A.
Kalogirou, G. Roditis, I. Chrysis, and A. Hadjigianni. Generation of a typical meteorological year for
Nicosia, Cyprus. Renewable Energy: 13(3), 1998, 381–388.
[9] S.A.M. Said and H.M. Kadry. Generation of representative weather-year data for SaudiArabia. Applied
Energy 48(2), 1994, 131–136.
[10] M.A.M. Shaltout and M.T.Y. Tadros. Typical solar radiation year for Egypt. Renewable
Energy 4(4), 1994, 387–393. [11] J.M. Finkelstein and R.E. Schafer. Improved goodness of fit tests. Biometrika 58(3), 1971, 641–645.
[12] G. Kalogirou, I.Roditis,, II. Chrysis, and A. Hadjigianni. Generation of a typical meteorological year for
Nicosia, Cyprus. Renewable Energy: 13(3), 1998, 381–388.
[13] L. Q. Liu and Z. X. Wang. The development and application practice of wind-solar energy hybrid
generation systems in China.Renewable and Sustainable Energy Review 13(6-7), 2009, 1504–1512.
[14] T.N Anderson, M. Duke and J.K. Carson. Generationof a typical meteorological year for Harcourt zone.
Journal of Engineering Science and Technology 6(2), 2011, 204-2014
[15] Y. Maklad. Generation of an Annual Typical Meteorological Solar Radiation for Armidale NSW,
Australia. IOSR Journal of Engineering (IOSRJEN) 4(4), 2014, 41-45.
[16] J.E. Hay and D.C. McKay. Estimating solar irradiance on inclined surfaces: a review and assessment of
methodologies. International Journal of Sustainable Energy, 3 (4–5), 1985, 203–240.
[17] S.S. Chandel, R.K. AggarwalandA.N. Pandey. New correlation to estimate global solar radiation on horizontal surfaces using sunshine hour and temperature data for Indian sites. Solar Energy Engineering
Journal, 127 (3), 2005, 417–420.
[18] C. Gueymard. Prediction and performance assessment of mean hourly global radiation. Solar Energy, 68
(3), 2000, 285–303.
[19] Y. Maklad. Generation of an Annual Typical Meteorological Wind Speed for Armidale NSW, Australia.
IOSR Journal of Engineering (IOSRJEN) 4(7), 2014.