Embed Size (px)
Citation preview

Prefatory Note
The attached document represents the most complete and accurate version available based on original copies culled from the files of the FOMC Secretariat at the Board of Governors of the Federal Reserve System. This electronic document was created through a comprehensive digitization process which included identifying the best-preserved paper copies, scanning those copies,1 and then making the scanned versions text-searchable.2 Though a stringent quality assurance process was employed, some imperfections may remain.
Please note that this document may contain occasional gaps in the text. These gaps are the result of a redaction process that removed information obtained on a confidential basis. All redacted passages are exempt from disclosure under applicable provisions of the Freedom of Information Act.
1 In some cases, original copies needed to be photocopied before being scanned into electronic format. All scanned images were deskewed (to remove the effects of printer- and scanner-introduced tilting) and lightly cleaned (to remove dark spots caused by staple holes, hole punches, and other blemishes caused after initial printing). 2 A two-step process was used. An advanced optimal character recognition computer program (OCR) first created electronic text from the document image. Where the OCR results were inconclusive, staff checked and corrected the text as necessary. Please note that the numbers and text in charts and tables were not reliably recognized by the OCR process and were not checked or corrected by staff.

Strictly Confidential (FR) Class I FOMC
MONETARY POLICY ALTERNATIVES
Prepared for the Federal Open Market Committee
By the staff Board of Governors of the Federal Reserve System

Strictly Confidential (FR)Class I - FOMC November 12, 1993
MONETARY POLICY ALTERNATIVES
Recent Developments
(1) Since the September 21 FOMC meeting, the federal funds
rate has averaged close to its intended level of 3 percent, while most
short-term rates have moved up 15 to 20 basis points. For
maturities that recently crossed the turn of the year, much of that
increase owed to the anticipated pressures on overnight rates associated
with window-dressing efforts at year end. The Treasury bill sector
has been pressured, in part, by increases in supply: With the elimina-
tion of the seven-year note and no thirty-year bond issuance in the
fourth quarter under the new auction schedule, the Treasury will, on
net, retire coupon securities this quarter, and rely more heavily on
bills. On October 18, Morgan Guaranty trimmed its prime lending rate
1/2 percentage point, to 5-1/2 percent, but no other major money center
bank followed suit.
(2) Intermediate- and long-term rates fell in the weeks fol-
lowing the September FOMC meeting, reaching twenty-year lows. However,
strength in incoming economic data over the latter part of the inter-
meeting period has contributed to upward revisions to market partici-
pants' expectations of economic growth over the intermediate run. With
1. With the usual summer bulge in seasonal borrowing receding, theDesk lowered the borrowing allowance by $150 million in four steps, to$100 million. Actual borrowing, boosted by quarter-end pressures anda miss in nonborrowed reserves related to an unexpected swing in theTreasury balance, exceeded the allowance by about $45 million, onaverage, in the three complete maintenance periods since the previousFOMC meeting.
2. Rate quotes are taken as of noon on Friday, November 12.3. Term contracts currently imply about a 10 percent federal funds
rate for the three-day weekend beginning December 31. However, thosenow using these contracts to lock in funds are said to be primarilyforeign banks, which in the past have paid premiums for year-endfunding.

firmer credit demands and a tighter monetary policy now foreseen over
time, intermediate-term Treasury rates rose sharply, and have increased
about 25 basis points on balance since the September meeting. Treasury
and private long-term rates have increased as many as 20 basis points on
net. The robust gains in most equity indexes that were posted early in
the period were whittled back when interest rates rose in recent weeks:
most major indexes registered net gains of 2 to 6 percent.
(3) The dollar's weighted-average foreign exchange value in-
creased 2-1/4 percent, on balance, over the intermeeting period. The
strength of the dollar reflected not only upward revisions to expecta-
tions about growth in the United States, but also downward revisions in
the outlook for Europe and Japan. On average over the intermeeting
period, both short- and long-term interest rates declined about 25 basis
points in major foreign countries. In Mexico, financial markets were
roiled by anxieties about the fate of NAFTA, and the peso depreciated 3
percent on balance against the dollar. In recent days, these anxieties
appear to have abated, and the peso has steadied. In contrast to the
general strength of the dollar, its value fell against the Canadian
dollar, as the new government in Canada affirmed its support for anti-
inflationary macroeconomic policies, resolving some of the uncertainties
that had troubled market participants.
The Desk did not intervene.
(4) Growth of the monetary aggregates ran a bit faster over
the past two months than the staff had envisioned in the previous blue-
book. Although somewhat more rapid income and spending than anticipated
likely contributed to this overage, special factors also appear to have

played a role. M2 flattened in October after a relatively strong
advance in September, with growth averaging 2-1/4 percent over the two
months--twice the expected pace. The upward surprise in M2 owed to its
most volatile component: Overnight RPs by the end of October were about
$6 billion above the level anticipated at the time of the September
meeting.4 Household M2 (M2 less demand deposits and overnight RPs
and Eurodollar deposits) was in line with projections of no growth.
This weakness in household M2 apparently owed largely to the continued
allure of capital market instruments. While flows into stock and bond
mutual funds tapered off in September, partial data for October point to
a substantial pickup to a near-record pace.5 Through October M2 grew
at a 1-1/4 percent annual rate from the fourth quarter of 1992, placing
it in the lower portion of its annual range. M1 expanded at a 12
percent rate over September and October. Currency growth averaged a
10-3/4 percent rate over the past two months, in part reflecting con-
tinued strong demands for U.S. dollars abroad. In addition, the
surge in mortgage prepayments over the last two months provided a
temporary lift to demand deposits and perhaps to other checkable depos-
its as well.9
4. As expected, NationsBank spun off its recently acquired dealerinto a nonbank subsidiary, removing $4-1/2 billion of overnight RPsfrom M2 in late September.
5. M2 plus bond and stock mutual funds (excluding institutionalholdings and IRA/Keogh accounts) is estimated to have grown at an 8-1/4 percent pace over the past two months.
6. M2 velocity rose at a 1-1/4 percent rate in the third quarter,down from about a 4 percent rate of growth over the first half of theyear.
7. M1 velocity plunged in the third quarter. This declinereflects the lagged effects of prior reductions in competing interestrates as well as identifiable special factors, such as currency flowsabroad and mortgage prepayments.
8. Foreign currency shipments are estimated to have accounted forabout 2 percentage points of the growth in M1 over this period.
9. Total reserves and the monetary base grew at 18-1/4 and 11-1/2percent rates, respectively, over September and October.

(5) M3 grew at a 2-1/2 percent pace over the past two months,
in contrast to the staff anticipation that it would be about flat. In
October, M3 was about 1/4 percent at an annual rate above the zero-
percent lower bound of its annual cone. Aside from the unexpected boost
provided by M2, the broader aggregate was aided by a runup in institu-
tion-only money funds. Large time deposits edged lower over the two
months. Bankers apparently have had little reason to compete for
deposit funds of late. Bank credit was unchanged in October and, even
abstracting from the effect of the restructuring by NationsBank,
expanded at only about a 3-3/4 percent rate over the past two months.
(6) The growth of nonfederal sector debt dipped to about a
3-1/2 percent rate in September but still remained ahead of its pace in
the first half of the year. Short-term credit flows to businesses have
remained anemic, likely reflecting further refinancing of bank loans
with the proceeds of capital market offerings. Business loans at com-
mercial banks fell over September and October, despite greater efforts
by banks to extend such credit, as evidenced by some additional easing
of standards and terms on business credit reported by bank loan officers
in our most recent survey. Household borrowing has picked up, perhaps
indicating a sense of brighter income prospects and greater comfort with
financial positions. Consumer credit expanded at a 10-1/4 percent rate
in September and bank data suggest another strong month in October. Net
mortgage growth is estimated to have remained modest over the past few
months, however, despite the apparent surge in refinancings. Similarly,
the heavy gross flow of issues by state and local governments has mostly
reflected efforts to pay down existing debt; net tax-exempt debt has
risen at a shade above 4 percent in recent months. On balance, from the
fourth quarter of 1992 through September, nonfederal debt grew at about

-5-
a 3 percent rate. With the growth of federal debt continuing to slow,
the total debt of nonfinancial sectors expanded at a 4-1/2 percent rate
in September, sufficient to keep the aggregate a little above the four-
percent lower bound of its monitoring range.

MONEY, CREDIT, AND RESERVE AGGREGATES(Seasonally adjusted annual rates of growth)
QIV.to
Aug. Sep. Oct. Oct.
Money and credit aggregates
M1 10.1 13.6 10.4 10.6
M2 1.6 4.0 0.5 1.3
M3 0.6 3.4 1.7 .3
Domestic nonfinancialdebt 5.1 4.4 -- 4.7
Federal 9.0 7.0 -- 9.2Nonfederal 3.7 3.5 -- 3.1
Bank credit 3.2 4.0 0.1 4.5
Reserve measures
Nonborrowed reserves 7.5 15.2 23.0 12.2
Total reserves 9.7 16.6 19,9 12.5
Monetary base 11.5 15.2 7.8 10.6
Memo: (Millions of dollars)
Adjustment plus seasonalborrowing 352 428 286
Excess reserves 952 1090 1081
QIV to September for debt aggregates.Includes "other extended credit" from the Federal Reserve.
NOTE: Monthly reserve measures, including excess reserves and borrow-ing, are calculated by prorating averages for two-week reservemaintenance periods that overlap months. Reserve data incor-porate adjustments for discontinuities associated with changes inreserve requirements.

Policy Alternatives
(7) Three policy alternatives are presented for consideration
by the Committee. Under alternative B, the federal funds rate would
continue to trade around 3 percent.10 This alternative is consistent
with the monetary policy assumption of a steady federal funds rate for
several quarters ahead that underlies the greenbook projection of eco-
nomic activity and inflation. In that forecast, real GDP growth settles
into a 2-1/2 percent pace next year, as the stimulus imparted by past
interest rate declines and diminishing balance-sheet and credit supply
constraints about offsets the drag from continued fiscal retrenchment;
the unemployment rate remains around 6-3/4 percent, and core inflation
edges down. Market participants generally seem to believe that the
economic expansion will run a little faster than projected by the staff
and to avoid a pickup in inflation down the road the Federal Reserve
will begin to firm reserve conditions in the first half of next year.
If economic and inflation data over coming months instead prove to be
closer to the staff forecast, bond yields probably will retrace some of
their recent runup.
(8) The staff expects that a little faster expansion of spend-
ing and less cautious attitudes toward credit on the part of borrowers
and lenders will contribute to a slight pickup in the growth of non-
federal debt over coming months. Securities markets should remain very
receptive to offerings, as spreads of both investment-grade and junk
issues relative to Treasuries stay narrow. With long-term rates not
much above their recent lows, borrowing by households and firms is
10. The allowance for adjustment and seasonal borrowing would bemaintained initially at its current level of $100 million. Furthersmall reductions in the allowance likely would be needed over theintermeeting period as demands for seasonal credit continue to falloff.

expected to continue to be focused on longer-term sources. The recent
trend toward a greater willingness to lend by banks and other inter-
mediaries is unlikely to be reversed. However, credit flows through
depositories, while firming in early 1994, are likely to remain subdued,
limiting banks' and thrifts' need to bid for deposits. For 1993, domes-
tic nonfinancial sector debt is projected to finish the year 4-1/2 per-
cent above its 1992:Q4 base, a little above the lower edge of its 4 to 8
percent monitoring range. From the fourth quarter of this year through
next March, debt is projected to expand at a 5-1/4 percent rate; this
growth would place it well within its tentative 1994 monitoring range of
4 to 8 percent.
Alt. A Alt. B Alt. C
Growth from October to December
M2 2-1/2 2 1-1/2M3 1-1/4 1 1M1 11-1/2 10-1/2 9-1/2
Growth from October to March 1994
M2 3 2-1/2 2M3 1-3/4 1-1/2 1-1/4M1 11-1/4 10-1/2 9-1/2
(9) As shown in the lower panel of the above table, M2 under
alternative B is projected to grow at a 2-1/2 percent rate over October
to March. This would leave M2 in the fourth quarter 1-1/4 percent above
its Q4 1992 base, just within its 1 to 5 percent annual range. By next
March, this aggregate would be 2-3/4 percent at an annual rate above its
fourth quarter 1993 base, and well within its provisional range. The
firming in M2 growth over the next several months reflects forecasts of
stronger expansion in nominal GDP late this year, the effects of the
recent surge in mortgage refinancing activity, and lagged stimulus from

Alternative Levels and Growth Rates for Key Monetary Aggregates
M2 M3 M1
Alt. A Alt. B Alt. C Alt. A Alt. B Alt. C Alt. A Alt. B Alt. C
Levels in BillionsSep-93 3532.9 3532.9 3532.9 4176.8 4176.8 4176.8 1106.5 1106.5 1106.5Oct-93 3534.7 3534.7 3534.7 4183.2 4183.2 4183.2 1116.2 1116.2 1116.2Nov-93 3540.1 3539.3 3538.4 4186.6 4186.2 4185.9 1126.4 1125.9 1125.3Dec-93 3549.4 3546.5 3543.5 4192.4 4190.9 4189.5 1137.8 1135.9 1134.0Jan-94 3563.0 3558.3 3553.6 4202.0 4199.5 4197.0 1148.4 1145.4 1142.3Feb-94 3571.7 3565.7 3559.8 4207.9 4204.7 4201.6 1158.7 1154.9 1151.1Mar-94 3580.0 3573.2 3566.3 4213.6 4210.0 4206.3 1169.0 1164.5 1160.1
Monthly Growth RatesSep-93 4.0 4.0 4.0 3.4 3.4 3.4 13.6 13.6 13.6Oct-93 0.6 0.6 0.6 1.8 1.8 1.8 10.5 10.5 10.5Nov-93 1.9 1.6 1.3 1.0 0.9 0.8 11.0 10.4 9.8Dec-93 3.2 2.5 1.8 1.7 1.4 1.1 12.1 10.7 9.3Jan-94 4.6 4.0 3.4 2.8 2.5 2.2 11.2 10.0 8.8Feb-94 2.9 2.5 2.1 1.7 1.5 1.3 10.8 10.0 9.2Mar-94 2.8 2.5 2.2 1.6 1.5 1.4 10.6 10.0 9.4
Quarterly Averages93 Q2 2.2 2.2 2.2 2.3 2.3 2.3 10.5 10.5 10.593 Q3 3.1 3.1 3.1 1.2 1.2 1.2 12.9 12.9 12.993 Q4 2.0 1.9 1.7 1.9 1.8 1.7 11.5 11.2 11.094 Q1 3.4 2.9 2.4 1.9 1.7 1.5 11.3 10.3 9.2
Growth RateFrom ToSep-93 Dec-93 1.9 1.5 1.2 1.5 1.4 1.2 11.3 10.6 9.9Oct-93 Dec-93 2.5 2.0 1.5 1.3 1.1 0.9 11.6 10.6 9.6Dec-93 Mar-94 3.4 3.0 2.6 2.0 1.8 1.6 11.0 10.1 9.2Oct-93 Mar-94 3.1 2.6 2.1 1.7 1.5 1.3 11.3 10.4 9.4
92 Q4 Oct-93 1.3 1.3 1.3 0.3 0.3 0.3 10.6 10.6 10.692 Q4 Dec-93 1.5 1.4 1.3 0.4 0.4 0.4 10.9 10.8 10.693 Q4 Mar-94 3.3 2.8 2.3 1.9 1.7 1.4 11.2 10.3 9.3
91 Q4 92 Q4 1.7 1.7 1.7 0.2 0.2 0.2 14.3 14.3 14.392 Q4 93 Q4 1.4 1.3 1.3 0.4 0.4 0.3 10.8 10.7 10.6
1.0 to 5.0 0.0 to 4.01993 Target Ranges:

Chart 1
ACTUAL AND TARGETED M2Billions of Dollars
- Actual Level* Short-Run Alternatives
I I I I I IO N D J F M A M J J A S O N D J F M A M J
3750
-1 3700
-- 3650
-- 3600
-- 3550
- 3500
-13450
3400
''
I I I I I I I I I I I I I I
1993 1994

Chart 2
ACTUAL AND TARGETED M3Billions of Dollars
|
- Actual Level* Short-Run Alternatives
4%
0%
SA** C
4400
-1 4350
4300
4250
4200
-- 4150
I I I I I I I I I I I I I - .1** I I I I I ION D J F M A M J J A SO ND J F MA M J19319
4100
1993 1994

Chart 3
M1Billions of Dollars
122015%
- Actual Level
* Short-Run Alternatives ..' - 1200
15%10%
- .'. .. " - 1180
* .A'
*.** B5% 1 1 6 0
.* .-- 1140
*:-" ""0%o\: ./ .o, .. . ...... .. .. .................
- .- 112010%
- - 1100
10805%
- - 1060
1040
0% 1020- ....... .. . ........ ........ .. .. ... ....................... - 1020
I I I I I I I I 1000O N D J F M A M J J A S O N D J F M A M J
1993 1994

Chart 4
DebtBillions of Dollars
- Actual Level* Projected Level
ON D J F MA M J J A S ON D1993
J F MA M J1994
13000
12800
12600
12400
12200
12000
11800
11600

-10-
the previous flattening of the yield curve. Despite the latter two
effects, M2 velocity rises noticeably further in the fourth and first
quarters as funds continue to be diverted from deposits into longer-term
mutual funds. For that reason, the velocity of M2+, which adds the
market value of net holdings of bond and stock mutual funds to M2, seems
likely to remain more stable than that of M2 in coming quarters. Ml,
which is projected to expand at a 10-1/2 percent rate from October to
March, would still account for all of the increase in M2. The continued
brisk pace of M1 growth mainly owes to earlier declines in its oppor-
tunity cost, but sustained strong foreign currency demands also are seen
as supporting expansion of this aggregate. With core deposits and
non-deposit sources continuing to fund the bulk of moderate expansion of
bank credit, issuance of managed liabilities in M3 should remain weak.
M3 would increase at a 1-1/2 percent rate from October to March. This
aggregate would be a little above the lower bound of its 0 to 4 percent
range for 1993 and more distinctly within its tentative 1994 range by
March.
(10) Under Alternative C, the federal funds rate would rise
1/2 percentage point to 3-1/2 percent.12 An immediate firming of
reserve market conditions is not embedded in market interest rates, and
consequently, short-term interest rates are likely to rise by nearly the
full 1/2 percentage point increase in the federal funds. Long-term
rates probably would rise appreciably at first, but some of those in-
creases could be reversed over time as market participants interpreted
that action as trimming the trajectory of economic activity and prices
and reducing the need for more aggressive tightening in the future.
11. In association with continued rapid growth in M1 and requiredreserves, total reserves would expand at a 9.6 percent pace over theOctober-March period and the monetary base at a 9.3 percent rate.
12. The borrowing allowance would be increased to $125 million.

-11-
With dollar-denominated returns rising significantly, the dollar likely
would appreciate considerably on foreign exchange markets.
(11) The Committee might favor alternative C if strength in
recent economic data were seen as implying that any delay in firming ran
an unacceptably high risk that economic activity could develop excessive
momentum that would rapidly erode the remaining degree of slack and
produce an acceleration of prices. Even if growth in aggregate demand
turns out to be as moderate as in the staff forecast, a tightening would
better ensure a resumption of a distinct downward trend to inflation.
Under this alternative, M2 would expand at a 2 percent rate from October
through March of next year, leaving growth from the fourth quarter of
this year in the lower half of its tentative range. M3 would expand at
a 1-1/4 percent rate from October through March, also in the lower half
of its provisional range.
(12) Alternative A contemplates an easing in reserve market
pressures and a decline in the federal funds rate to 2-1/2 percent.13
Implementation of alternative A would be especially surprising to market
participants, given their view that underlying economic growth is
strengthening. Short-term interest rates, including the prime rate,
probably would fall by about the 50 basis point reduction in the federal
funds rate, and the value of the dollar on foreign exchange markets
likely would decline. In these circumstances, any lasting reduction in
intermediate- and longer-term interest rates likely would be limited by
a belief that the action would need to be reversed before too long, as
well as by perceptions that the Federal Reserve was placing less weight
13. The reduction in the federal funds rate would be accomplishedeither through a commensurate cut in the discount rate or through areduction in the borrowing allowance to $75 million.

-12-
on containing inflationary pressures and more weight on promoting near-
term growth in output and employment. Issuance of bonds and mortgages
likely would be heavy, as borrowers reacted to a sense that this was the
last window of low long-term rates for quite some time.
(13) Alternative A might be viewed as appropriate if the Com-
mittee wished to make appreciable progress in reducing remaining slack
in the economy, in contrast to the plateau for the unemployment rate
seen in the staff forecast. Lower short rates might also be seen as
desirable if the Committee were concerned about the possibility of
renewed weakness in economic growth over coming quarters, perhaps
brought on by tax increases becoming effective in 1994. This alterna-
tive would provide somewhat greater assurance that growth of the broad
monetary aggregates would be well within their annual ranges in the
first half of next year. Although the steeper yield curve under alter-
native A would make bond and stock funds more attractive, experience of
the last few years suggests some net shift of funds from market instru-
ments to M2 in the months following monetary policy easings. Thus, the
staff projects that M2 in March would be 3-1/4 percent at an annual rate
above its fourth-quarter base, a little above the middle of its tenta-
tive range, and M3 would be higher by 2 percent, around the middle of
its range.

-13-
Directive Language
(14) Presented below is draft wording for the operational
paragraph that includes the usual options for Committee consideration.
OPERATIONAL PARAGRAPH
In the implementation of policy for the immediate
future, the Committee seeks to DECREASE SOMEWHAT/main-
tain/INCREASE SOMEWHAT the existing degree of pressure
on reserve positions. In the context of the Commit-
tee's long-run objectives for price stability and
sustainable economic growth, and giving careful con-
sideration to economic, financial, and monetary devel-
opments, slightly (SOMEWHAT) greater reserve restraint
(WOULD/MIGHT) or slightly (SOMEWHAT) lesser reserve
restraint (WOULD) might be acceptable in the inter-
meeting period. The contemplated reserve conditions
are expected to be consistent with modest growth in M2
and M3 over COMING MONTHS [DEL: the balance of the year].

November 15, 1993
SELECTED INTEREST RATES(percent)
Short-Term Long-TermCDs money corporate conventional home mortgages
federal Treasury bills secondary comm. market bank U.S. government constant A-utility municipal secondary primaryfunds secondary market market paper mutual prime maturity yields recently Bond market market
S3-month 6-month 1-year 3-month 1-month fund loan 3-year 10-year 30-year offered Buyer fixed-rate fixed-rate ARM1 2 3 4 5 6 7 8 9 10 11 12 13 14 15 1 16
92 -- High-- Low
93 -- High-- Low
MonthlyNov 92Dec 92
Jan 93Feb 93Mar 93Apr 93May 93Jun 93Jul 93Aug 93Sep 93Oct 93
WeeklyJul 28 93
Aug 4 93Aug 11 93Aug 18 93Aug 25 93
Sep 1 93Sep 8 93Sep 15 93Sep 22 93Sep 29 93
Oct 6 93Oct 13 93Oct 20 93Oct 27 93
Nov 3 93Nov 10 93
DailyNov 5 93Nov 11 93Nov 12 93
4.20 4.05 4.22 4.51 4.32 5.02 4.51 6.502.86 2.69 2.82 2.91 3.07 3.17 2.74 6.00
3.24 3.10 3.26 3.48 3.36 3.39 2.92 6.002.87 2.82 2.94 3.07 3.06 3.07 2.59 6.00
3.09 3.13 3.34 3.52 3.58 3.25 2.83 6.002.92 3.22 3.36 3.55 3.48 3.71 2.82 6.00
3.02 3.00 3.14 3.35 3.19 3.21 2.83 6.003.03 2.93 3.07 3.25 3.12 3.14 2.72 6.003.07 2.95 3.05 3.20 3.11 3.15 2.66 6.002.96 2.87 2.97 3.11 3.09 3.13 2.65 6.003.00 2.96 3.07 3.23 3.10 3.11 2.62 6.003.04 3.07 3.20 3.39 3.21 3.19 2.62 6.003.06 3.04 3.16 3.33 3.16 3.15 2.64 6.003.03 3.02 3.14 3.30 3.14 3.14 2.64 6.003.09 2.95 3.06 3.22 3.12 3.14 2.65 6.002.99 3.02 3.12 3.25 3.24 3.14 2.65 6.00
3.03 3.09 3.24 3.46 3.18 3.15 2.65 6.00
3.10 3,06 3.20 3.40 3.16 3.16 2.65 6.002.98 3.03 3.17 3.36 3.16 3.15 2.64 6.003.06 3.01 3.12 3.28 3.13 3.15 2.64 6.002.98 2.99 3.10 3.25 3.14 3.12 2.64 6.00
3.08 3.01 3.11 3.23 3.13 3.13 2.64 6.002.99 2.96 3.05 3.16 3.11 3.13 2.64 6.003.03 2.97 3.07 3.22 3.12 3.13 2.64 6.003.12 2.94 3.07 3.26 3.12 3.14 2.65 6.003.05 2.92 3.05 3.23 3.10 3.16 2.65 6.00
3.24 2.95 3.06 3.23 3.24 3.16 2.68 6.002.91 3.00 3.09 3.21 3.22 3.15 2.64 6.002.97 3.03 3.11 3.24 3.22 3.13 2.65 6.002.97 3.06 3.17 3.30 3.26 3.14 2.64 6.00
3.04 3.07 3.22 3.37 3.34 3.15 2.66 6.002.96 3.09 3.25 3.40 3.36 3.15 2.65 6.00
2,95 3.06 3.26 3.42 3.36 3.15 -- 6,002.91 - -- - -- - -- 6.002,98p 3.11 3.25 3.38 3.36 3.14 -- 6.00
6.32 7.65 8.07 8.99 6.87 9.09 9.034.24 6.30 7.29 8.06 6.12 7.73 7.84
5.06 6.73 7.46 8.28 6.44 8.17 8.144.07 5.24 5.83 6.79 5.41 6.72 6.74
5.14 6.87 7.61 8.51 6.56 8.35 8.315.21 6.77 7.44 8.27 6.43 8.22 8.22
4.93 6.60 7.34 8.13 6.40 8.03 8.024.58 6.26 7.09 7.80 6.12 7.65 7.684.40 5.98 6.82 7.61 5.85 7.57 7.504.30 5.97 6.85 7.66 5.99 7.46 7.474.40 6.04 6.92 7.75 5.92 7.48 7.474.53 5.96 6.81 7.59 5.87 7.41 7.424.43 5.81 6.63 7.43 5.80 7.19 7.214.36 5.68 6.32 7.16 5.67 7.05 7.114.17 5.36 6.00 6.94 5.50 6.89 6.924.18 5.33 5.94 6.91 5.48 6.85 6.83
4.59 5.92 6.68 7.37 5.87 7.19 7.25
4.52 5,84 6.55 7.31 5.83 7.23 7.214.48 5.82 6.48 7.17 5.68 7.12 7.174.38 5.71 6.32 7.09 5.61 6.97 7.104.26 5.58 6.21 6.97 5.56 6.87 6.97
4.19 5.45 6.10 6.83 5.52 6.82 6.934.07 5.30 5.93 6.85 5.44 6.91 6.824.17 5.33 5.94 6.99 5.49 6.88 6.964.21 5.42 6.07 7.07 5.51 6.94 6.954.17 5.35 6.01 6.95 5.53 6.95 6.89
4.18 5.36 6.01 6.93 5.52 6.78 6.874.12 5.28 5.94 6.79 5.41 6.72 6.814.11 5.24 5.83 6.97 5.44 6.87 6.744.24 5.42 5.98 6.97 5.56 6.94 6.86
4.39 5.54 6.03 7.25 5.72 7.26 7.114.49 5.70 6.20 7.23 5.69 7.24 7.12
6.224.97
5.364.14
5.265.45
5.234.984.794.714.654.644.564,484.364.25
4.55
4,554,514.454.41
4.404.334.364.344.29
4.284.334.144.19
4.174.28
4.53 5,75 6.22
4.45 5.66 6.15
NOTE: Weekly data for columns 1 through 11 are statement week averages. Data in column 7 are taken from Donoghue's Money Fund Report. Columns 12, 13 and 14 are 1 -day quotes for Friday, Thursday or Friday, respectively,following the end of the statement week. Column 13 is the Bond Buyer revenue index. Column 14 is the FNMA purchase yield, plus loan servicing lee, on 30-day mandatory delivery commitments. Column 15 is the averagecontract rate on new commitments for fixed-rate mortgages (FRMs) with 80 percent loan-to-value ratios at major institutional lenders. Column 16 is the average initial contract rate on new commitments for 1 -year. adjustable-rate mortgages (ARMs) at major institutional lenders offering both FRMs and ARMs with the same number of discount points.
p - preliminary data
Period
Stoctly Confadential (FR)
ClassilFOMC
Money and Credit Aggregate Measures
NOVE BER15,1%B
Seasonally adjusted
Money stock measures and liquid assets Bank credit Domestic nonfinancial t'
nontransactions components total loanstotal loans
M1 M2 M3 L and U , other' total'In M2 In M3 only investments' gove
rnment'
1 2 3 4 5 6 7 8 9 10Annual growth rates(%):
Annually (Q4 to 04)1990 4.3 4.0 3.9 -6.5 1.8 2.0 5.6 10.2 5.5 6.61991- 8.0 2.8 1.1 -6.2 1.1 0.3 3.4 11.3 2.6 4.61992 14.3 1.7 -2.7 -6.7 0.2 1.3 3.8 10.7 3.1 5.0
Quarterly Average1992-4th QTR. 16.8 2.6 -3.0 -15.0 -0.4 1.4 4.1 6.7 3.5 4.31993-lst QTR. 6.5 -1.9 -5.4 -14.0 -3.9 -2.4 1.8 7.6. 2.5 3.81993-2nd QTR. 10.5 2.2 -1.4 3.3 2.3 3.3 6.1 10.4 2.5 4.61993-3rd QTR, 12.9 3.1 -1.1 -9.3 1.2 1.6 7.2 9.2 3.9 5.3
Monthly1992-OCT. 19,3 3.8 -2.4 -24.9 -1,1 0.6 3.3 1.0 3,7 3,0
NOV. 15.6 2.2 -3.3 -15.2 -0.7 2.2 2.7 7.2 3.3 4.3DEC. 8.8 -0.5 -4.3 -20.8 -3.8 -2.0 2.2 13.8 2.7 5.6
1993-JAN. 7.7 -3.2 -7.7 -28.8 -7.3 -5.8 -1.2 4.0 2.8 3.1FEB. -0.2 -4.0 -5.6 10.3 -1.7 -0.9 3.3 4.7 1.8 2.5MAR. 2.6 -0.9 -2.4 -4.0 -1.4 -0.2 6.3 11.8 1.8 4.4APR. 9.0 0.6 -3.0 15.8 3.0 3.8 4.2 10.7 2.4 4.6MAY 27.3 10.5 3.3 -2.7 6.4 9.4 8.2 10.2 2.8 4.8JUNE 7.2 2.5 0.4 -14.3 -0.2 0.5 9.1 12.2 4.1 6.2JULY 13.3 1.9 -3.2 -15.0 -0.8 -0.5 9.2 7.4 4.5 5.3AUG. 10.1 1.6 -2.1 -3.9 0.8 3.4 3.2 9.1 3.7 5.1SEP. 13.6 4.0 -0.3 0.0 3.4 -1.5 4.0 7.0 3.5 4.4OCT. p 10.5 0.6 -3.9 8.6 1.8 0.1
Levels ($Billions):Monthly
1993-JUNE 1073.1 3510.9 2437.8 654.2 4165.1 5067.8 3014.6 3207.9 8764.1 11972.0JULY 1085.0 3516.4 2431.3 646.0 4162.4 5065.6 3037.8 3227.8 8796.9 12024.7AUG. 1094.1 3521.1 2427.0 643.9 4165.1 5079.9 3046.0 3252.2 8823.8 12076.0SEP. 1106.5 3532.9 2426.4 643.9 4176.8 5073.4 3056.2 3271.2 8849.5 12120.7OCT. p 1116.2 3534.7 2418.5 648.5 4183.2 3056.5
Weekly1993-OCT. 4 1112.6 3537.3 2424.7 649.1 4186.4
11 1111.7 3536.3 2424.6 646.6 4182.918 1116.5 3535.2 2418.7 646.6 4181.725 p 1114.5 3530.2 2415.7 654.0 4184.2
NOV. 1 p 1118.7 3529.1 2410.4 646.4 4175.5
1. Adlusted for breaks caused by reclassifications.2. Debt data are on a monthly average basis, derived by averaging end-of-month levels of adjacent months, and have been adjusted to remove discontinuities.
p preliminarype preliminary estimate
I
Strictly Confidential (FR)-Class II FOMC
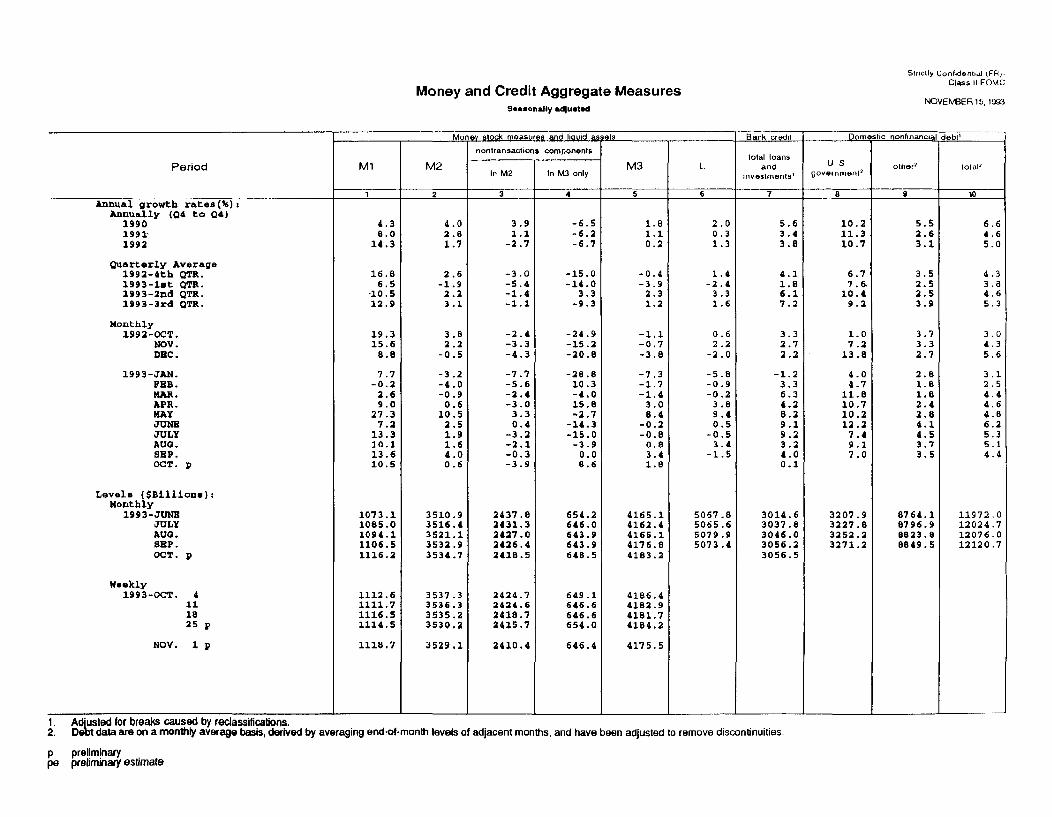
NOVEMBER 15. 1993Components of Money Stock and Related Measures
Seasonally adjusted unless otherwise noted
Period
Levels ($Billions):Annually (4th Qtr.)
199019911992
Monthly1992-OCT.
NOV.DEC.
1993-JAN.FEB.MAR.
APR.MAYJUNE
JULYAUG.SEP.
OCT. p
Currency DemandS depositsOther
checkabledeposits
245.4 277.7 293.1265.8 287.0 329.6290.0 338.8 380.2
288.0 336.0 373.7289.8 339.5 381.6292.3 340.8 385.2
294.8296.9299.0
301.4304.0306.8
309.6312.6316.4
318.2
341.9341.8341.9
347.2359.1360.5
365,7370.7376.4
380.0
388.6386.4386.3
386.2395.5397.8
401.9403.1406.0
410.2
OvernightRPs and
Euro-dollarsNSA'
Savingsdeposits
2
Smalldenomi-nationtime
deposits3
78.8 919.8 1171.673.4 1028.8 1081.075.4 1179.0 880.3
75.775.874.8
73.374.174.5
72.770.073.5
75.778.481.4
83.7
1170.51180.41186.0
1184.41182.41178.8
1181.61193.71198.8
1200,11205.11208.7
1209.3
894.4879.3867.3
858.3853.1848.1
841.1834.4826.7
817.6810.0803.3
795.8
Money marketmutual funds
generalpurpose institutions
andbroker/ onlydealer*
7 8
348.2362.9344.1
346.3343.7342.3
340.0333.2332.7
331.5336.4336.2
335.9334.3332.4
333.0
Largedenomi-nationtime
deposits'
131.5 496.9175.6 432.3207.5 360.8
210.9 366.6209.2 360.2202.3 355.7
197.7201.9200.9
200.4202.8198.1
195,0193.3194.1
196.6
348.5344.0338.1
343.2343.1339.8
335.2335.4333.7
334.5
TermEuro-
dollarsNSA'
68.060.747.0
48.147.245.6
43.546.749.8
48.748.745.5
41.943.844.7
45.3
Savings Short-term ommercial ankers
bonds Treasury paper' acceplan-securities ces
12 13
125.2 329.9137.0 319.4154.5 325.6
151.9 320.2154.7 325.1156.8 331.4
158.9161.1162.7
163.9164.8165.7
166.8167.8168.8
1. Net of money market mutual fund holdings of these items.2. Includes money market deposit accounts3. Includes retail repurchase agreements. All IRA and Keogh accounts at commercial banks and thrift institutions are subtracted from small time deposits.4. Excludes IRA and Keogh accounts.5. Net of large denomination time deposits held by money market mutual funds, depository institutions, U.S. government and foreign banks and official institutions.
p preliminary
337.5342.9341.6
340.7347.1349.2
349.9349.4329.3
14
356.2336.3369.6
368.0372.4368.4
360.7355.9360.3
365.5368.4369.1
369.1381.4381.7
36.324.420.4
20.520.320.4
20.620.219.3
19.319.418.7
17.516.216.8
~ , _ , __
I - I - I - - , - 1 - I L 1 ~ .- , .-I 1 I I I I I- -I---_- , , 1

November 12, 1993
NET CHANGES IN SYSTEM HOLDINGS OF SECURITES 1
Millions of dollars, not seasonally adjusted
STRICTLY CONFIDENTIAL (FR)
CLASS II-FOMC
Treasury bills ,Treasurycoupons Federal Net change
SNet purchases 3 agendes outrightPeriod Net Redempions Net p Redemptions Net redemptions holdings 5
purchases (-) change 1-5 5-10 over 10 (-) Change total 4 Net RPs
199019911992
1992 ---Q1---Q2---Q3---Q4
1993 ---Q1--- 02---03
1992 NovemberDecember
1993 JanuaryFebruaryMarchAprilMayJuneJulyAugustSeptemberOctober
WeeklyAugust 4
111825
September 18152229
October 6132027
November 310
Memo: LEVEL (bil. $) 6November 10
13,04819,03811,486
-2,6004,415
8678,805
7,7491,268
17,44820,03813,086
-1,0004,415
8678,805
7,7491,268
1,0643,669
121349
7,280
902366
1,396
379276143104
1063
65304
82281361
1,2353,859
--- 1,064- 3,669
--.
121349
7,280
902366927
3792761431041063
65304
82-188361
1,2353,859
165.1
4253,0431,096
506,583
13,118
2,4522,1933,9004,572
1,4412,4903,700
-1001,2802,818
597 655945 731
1,276 947
37511,28219,365
2,4523,7305,9277,256
3,1414,9906,326
6,756300
3,1414,990
2001,8004.326
461 4.172200
279244
100411
100
211
200
201.1
1,4412,490
2001,1002,400
200
650250200
2,300
100
100
75.7 21.6 31.1 329.5
13,24027,72630,219
-2337,8966,617
15,939
2,85112,648
7,067
7,8203,848
-103-85
3,0395,083
3087,258-166
2,5774,656
857
300379
1,426368304
4,03663
230404
77-218326
1,3353,859
11,128-1,614
-13,215
-14,6361,137
14,195-13,912
-46110,624-8,644
2,4252,929
-6,1284,788
879-5,5144,112
12,027-14,435
4,5281,262
-6,723
6,299-1,1592,726
-4,8153,833
-3,2061.867
18,292-15,535-6,182
4721,314
-1,910-2,3013,738
336.9 -2.6
1. Change from end-of-period to end-of-period. 4. Reflects net change in redemptions (-) of Tre2. Outright transactions in market and with foreign accounts. 5. Includes change in RPs (+), matched sale-pui3. Outright transactions in market and with foreign accounts, and short-term notes acquired 6. The levels of agency issues were as follows:in exchange for maturing bills. Excludes maturity shifts and rollovers of maturing issues.
asury and agency securities.rchase transactions (-), and matched purchase sale transactions (+).
within1 year 1-5 5-10 over 10 total
November 10 1.9 2.1 0.6 0.1 4.7
' '