Embed Size (px)
Citation preview

1
Economic Recovery IndexAn Amárach Research Briefing
September 2017
22
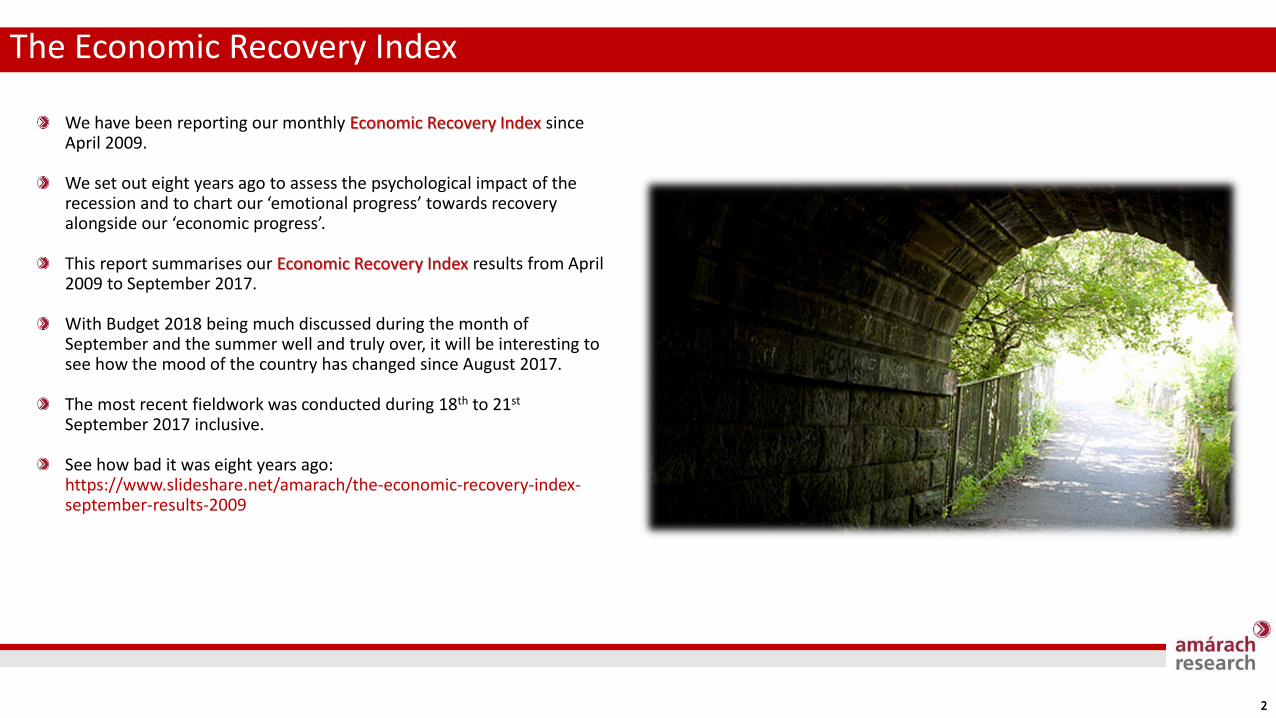
We have been reporting our monthly Economic Recovery Index since April 2009.
We set out eight years ago to assess the psychological impact of the recession and to chart our ‘emotional progress’ towards recovery alongside our ‘economic progress’.
This report summarises our Economic Recovery Index results from April 2009 to September 2017.
With Budget 2018 being much discussed during the month of September and the summer well and truly over, it will be interesting to see how the mood of the country has changed since August 2017.
The most recent fieldwork was conducted during 18th to 21st
September 2017 inclusive.
See how bad it was eight years ago:https://www.slideshare.net/amarach/the-economic-recovery-index-september-results-2009
The Economic Recovery Index

33
The ERI – Onwards and Upwards and……………
Source: Amárach Research, September 2017
0.0
5.0
10.0
15.0
20.0
25.0
30.0
35.0
40.0
45.0
50.0
Ap
r-0
9
Sep
-09
Feb
-10
Jul-
10
De
c-1
0
May
-11
Oct
-11
Mar
-12
Au
g-1
2
Jan
-13
Jun
-13
No
v-1
3
Ap
r-1
4
Sep
-14
Feb
-15
Jul-
15
De
c-1
5
May
-16
Oct
-16
Mar
-17
Au
g-1
7
Economic Recovery IndexApril 2009 – September 2017
Using the answers to the question on ‘stages of recovery’ we have created the Economic Recovery Index, which ranges from 0 to 100 (0 = deep recession; 100 = back to peak).
The Recovery Index and the Irish people’s views on the current and future state of the economy have improved considerably since its lowest point in November 2010, however; a curious trend had emerged.
Ireland has been the fastest growing economy in the EU in each of the last three years and key macroeconomic indicators (employment, GDP) have increased significantly over the same period, yet our feelings on the economy have not changed much over the past 2 years. A disconnect between macro performance and micro optimism is emerging.
We have seen the ERI plateau since mid-2015 with fewer claiming to see visible improvements in the economy in the most recent data. (see next slide).
35.0
40.0
45.0
Ap
r-1
5
Jun
-15
Au
g-1
5
Oct
-15
De
c-1
5
Feb
-16
Ap
r-1
6
Jun
-16
Au
g-1
6
Oct
-16
De
c-1
6
Feb
-17
Ap
r-1
7
Jun
-17
Au
g-1
7
Economic Recovery IndexApril 2015 – Sept 2017
44
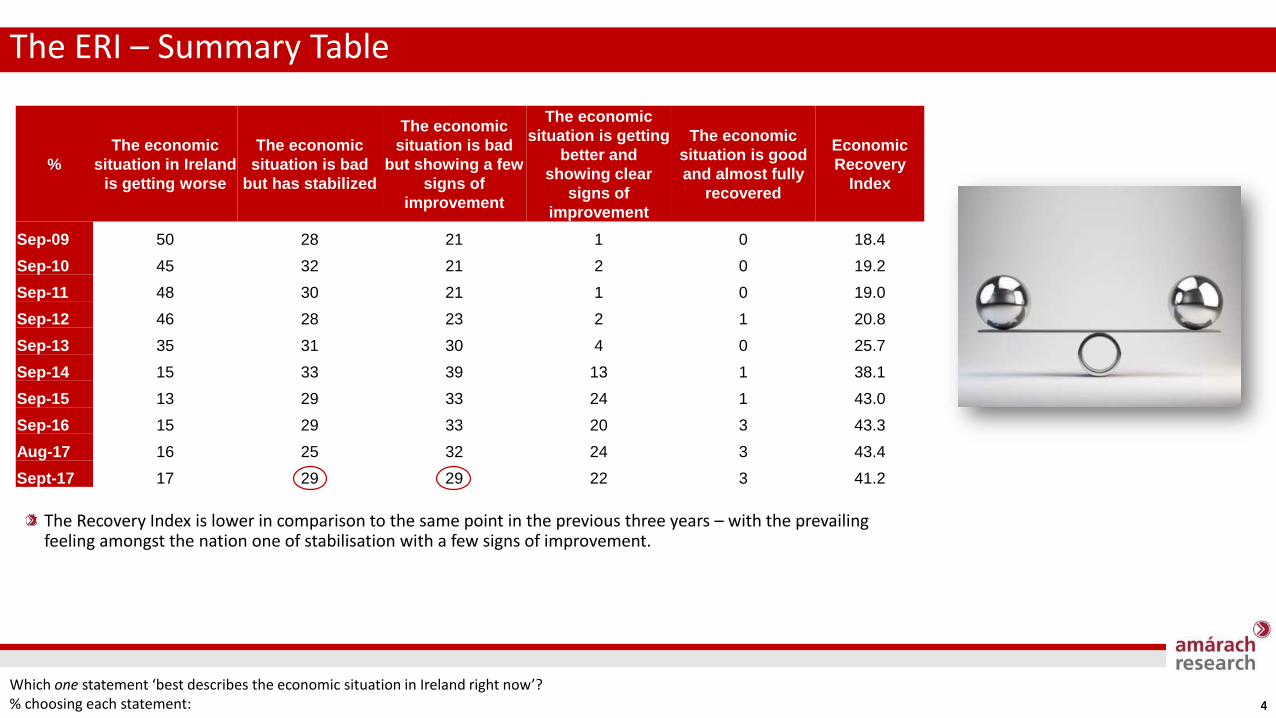
The ERI – Summary Table
Which one statement ‘best describes the economic situation in Ireland right now’?% choosing each statement:
%
The economic
situation in Ireland
is getting worse
The economic
situation is bad
but has stabilized
The economic
situation is bad
but showing a few
signs of
improvement
The economic
situation is getting
better and
showing clear
signs of
improvement
The economic
situation is good
and almost fully
recovered
Economic
Recovery
Index
Sep-09 50 28 21 1 0 18.4
Sep-10 45 32 21 2 0 19.2
Sep-11 48 30 21 1 0 19.0
Sep-12 46 28 23 2 1 20.8
Sep-13 35 31 30 4 0 25.7
Sep-14 15 33 39 13 1 38.1
Sep-15 13 29 33 24 1 43.0
Sep-16 15 29 33 20 3 43.3
Aug-17 16 25 32 24 3 43.4
Sept-17 17 29 29 22 3 41.2
The Recovery Index is lower in comparison to the same point in the previous three years – with the prevailing feeling amongst the nation one of stabilisation with a few signs of improvement.
5
Consumer Impact

66
We started calling our Index the ‘Recovery Index’ back in April 2009.
Over these past eight years we have tracked the highs and lows (and very lows) in terms of the mood of the nation and the impact on consumer spending, borrowing and saving intentions.
We’ve seen remarkable resilience on the part of the Irish people when it comes to ‘getting on’ with their lives, despite macro-economic uncertainties. Now with the macro-economic uncertainties becoming more certain, it is interesting to see how the feelings if the Irish people might have changed.
In this section we look at some of the key indicators when it comes to consumer spending and saving intentions.
Recession, Resilience, Recovery and………..where to next?

77
Consumers are feeling more comfortable with their financial position compared to a year ago – with saving and borrowing intentions increasing and paying off debts quicker becoming more of a priority.
With wage growth (+2.2% yoy, CSO) outstripping inflation (+0.4% yoy, CSO), it seems consumers are finally starting to notice the extra money in their pockets – and they are more than happy to spend it, with retail sales volumes up 4.7% (CSO) for the year.
However; optimism that Ireland will be through the worst of the recession is lower when compared to 2014 and 2015, suggesting Irish consumers are wary of false dawns with long-term structural problems such as housing and health still resonating with many. The results from the Amárach/ Claire Byrne Live panel support this; with 47% and 38% respectively believing health and housing to be the priority areas for Budget 2018.
Consumer Sentiment
% Agree
Ireland will be through the worst of the
recession in 12 months time
I feel I am financially
comfortable enough to make
it through the recession
I am optimistic in spite of the
current economic situation
Right now it seems like the
recession is affecting other people more
than it is affecting me
I am more relaxed about
spending money than I was a few
months ago
I am saving a lot more than
before because of the recession
My main financial priority is to pay off my debts as quickly
as possible
I would be happy to
borrow money from a bank if I
need to
NEW I always buy the lowest price products
or services
NEW I always buy Irish when I
can
Sep-09 46 48 62 60 18
Sep-10 31 41 46 53 18 24 56 27
Sep-11 26 38 47 49 14 23 59 23
Sep-12 24 35 46 42 13 26 56 24
Sep-13 28 38 45 46 19 26 57 25 59 54
Sep-14 45 42 54 44 26 25 57 28 55 53
Sep-15 47 45 57 45 31 28 54 30 54 52
Sep-16 33 42 49 39 33 31 57 35 50 54
Sep-17 39 46 58 41 37 32 63 39 54 60

88
The often maligned ‘Millennial’ cohort (typically those born between the early 80’s and mid to late 90’s) are surprisingly much more optimistic about their future economic prospects compared to others.
They are much more relaxed about spending - perhaps in large part driven by being more spendthrift and always buying the lowest price product or service – and they are saving more too.
Much more surprisingly for the 25-34 cohort, they are more likely to believe that now it is a good time to buy a house for those who want to. It would be interesting to explore if this is due to fear of house prices rising further or a reflection of feelings about an improved economic situation?
Consumer Sentiment – Thirty(ish), thrifty and thriving
0%
10%
20%
30%
40%
50%
60%
70%
80%
I AM MORERELAXED ABOUT
SPENDING MONEYTHAN I WAS A FEW
MONTHS AGO
I AM SAVING A LOTMORE THAN BEFORE
BECAUSE OF THERECESSION
I AM OPTIMISTIC INSPITE OF THE
CURRENTECONOMICSITUATION
I ALWAYS BUY THELOWEST PRICEPRODUCTS OR
SERVICES
I THINK THAT NOWIS A GOOD TIME TOBUY A HOUSE FOR
THOSE WHO WANTTO
16-24 35-44 45-54 55+ 25-34
Millennials

99
0%
10%
20%
30%
40%
50%
60%
70%
80%
I AM MORE RELAXED ABOUTSPENDING MONEY THAN I WAS A
FEW MONTHS AGO
I ALWAYS BUY IRISH WHEN I CAN I ALWAYS BUY THE LOWEST PRICEPRODUCTS OR SERVICES
Tesco Dunnes Supervalu Aldi Lidl
There is a clear separation in terms of shopper behaviour between grocery retailers – Tesco, Lidl and Aldi shoppers are considerably more price driven compared to those who shop in SuperValu and Dunnes.
SuperValu main shoppers are most likely to pull on the “green jersey” and buy Irish produce when then can and not worry if it comes at a price premium.
Dunnes main shoppers are feeling most relaxed about their spending compared to a few months ago, with Lidl shoppers least likely to be feeling relaxed about spending – which may explain their preference for always buying the lowest price produce.
Consumer Sentiment – Buying Irish
Price driven
10
Mood of the Nation

1111
10
20
30
40
50
60
70
Ap
r-0
9
Au
g-0
9
Dec
-09
Ap
r-1
0
Au
g-1
0
Dec
-10
Ap
r-1
1
Au
g-1
1
Dec
-11
Ap
r-1
2
Au
g-1
2
Dec
-12
Ap
r-1
3
Au
g-1
3
Dec
-13
Ap
r-1
4
Au
g-1
4
Dec
-14
Ap
r-1
5
Au
g-1
5
Dec
-15
Ap
r-1
6
Au
g-1
6
Dec
-16
Ap
r-1
7
Au
g-1
7
Enjoyment Happiness Stress Worry
The Mood of the Nation – Not enjoying, worrying less
Did you experience any of these feelings a lot of the day yesterday?% saying Yes: April 2009 to September 2017
When we started measuring and reporting theEconomic Recovery Index we wanted it to be more than just another ‘confidence index’.
We therefore set out to measure the full spectrum of emotions experienced by Irish consumers – positive as well as negative – in order to provide a unique insight into the real ‘mood’ of the nation.
This month has seen a significant fall back in happiness (-15%) and enjoyment (-9%), although with the (occasional) sunny days long forgotten and the summer holidays over, that is somewhat not surprising.
However; an interesting trend has emerged in the feelings of the nation over the past few years, with many feeling less happiness and enjoyment on a daily basis.
On a more positive note, as a nation we are feeling fewer negative feelings on a daily basis, with stress, worry, sadness, pain, anxiety, anger, boredom and loneliness all trending downwards (see next slide).
It’s a case of, if we’re not getting happier, at least we’re not stressing about it.

1212
10
15
20
25
30
35
40
Ap
r-0
9
Au
g-0
9
Dec
-09
Ap
r-1
0
Au
g-1
0
Dec
-10
Ap
r-1
1
Au
g-1
1
Dec
-11
Ap
r-1
2
Au
g-1
2
Dec
-12
Ap
r-1
3
Au
g-1
3
Dec
-13
Ap
r-1
4
Au
g-1
4
Dec
-14
Ap
r-1
5
Au
g-1
5
Dec
-15
Ap
r-1
6
Au
g-1
6
Dec
-16
Ap
r-1
7
Au
g-1
7
Sadness Pain Anger Anxiety
The Mood of the Nation – Looking back on anger
Did you experience any of these feelings a lot of the day yesterday?% saying Yes: April 2009 to September 2017 (Boredom and loneliness added in Jan and Dec 14)
10
15
20
25
30
Jan
-14
Mar
-14
May
-14
Jul-
14
Sep
-14
No
v-1
4
Jan
-15
Mar
-15
May
-15
Jul-
15
Sep
-15
No
v-1
5
Jan
-16
Mar
-16
May
-16
Jul-
16
Sep
-16
No
v-1
6
Jan
-17
Mar
-17
May
-17
Jul-
17
Sep
-17
Boredom Loneliness

13
Amárach Outlook

1414
It cannot be argued that the economic situation for the country has improved significantly over the previous 2 years and predictions for medium term are positive (the uncertainty of Brexit notwithstanding).
A simple average of external and internal GDP forecasts for Ireland suggests that robust growth of around 4.3% and 3.5% will be achieved in 2017 and 2018 respectively.
Nevertheless; our Economic Recovery Index finds the Irish people are becoming less positive about the future of the economy. While we are a long way removed from believing the economy is worsening, there is a view that the signs of improvement hoped for and promised, have failed to materialise – case in point, housing and health.
This suggests that the Irish people wish to see a more tangible recovery. Positive GDP forecasts do not seem to make us happier, maybe the collective €5 extra a week in our pockets from Budget 2018 money will?
The results from the October Economic Recovery Index will show us.
Outlook – Show me something tangible
* ESRI, European Commission, Central Bank, OECD and Bank of Ireland

1515
We survey 1,000 adults every month to create the Economic Recovery Index.
We also track dozens of data series relating to customer experience, spending levels, and switching intentions also as part of the same survey
You can view the full list (as well as a free dashboard with our latest data and forecasts) here:
Try out the free version for a one week trial period.
http://getPlanR.com/
Get PlanR and get Planning
1616
e. [email protected]. 01 410 5200
w. www.amarach.comb. www.amarach.com/blog
Tw. twitter.com/AmarachResearchs. slideshare.net/amarach/