Embed Size (px)
Citation preview

Dialogue on Utility and Local Scale Renewable Energy in South Africa 22 April 2015 - 1
Dialogue on Utility and Local Scale
Renewable Energy in South Africa
Solar photovoltaic research: Drakenstein Municipality
Karin Kritzinger and Imke Meyer,
Stellenbosch University, CRSES
Date 22/04/2015
Rooftop Solar PV

Contents
Context of research
Generation potential for PV in Drakenstein
Potential of SSEG by private sector in Drakenstein
Impact on municipal revenue
Opportunities to install on municipal buildings
Prefeasibility study
22 April 2015 - 2
Solar photovoltaic research: Drakenstein Municipality
Stellenbosch University, CRSES
Dialogue on Utility and Local Scale Renewable Energy in South Africa

Context of Research
• The 20% study - SU
• State of play of SSEG and impact on municipalities - WWF
• Overview of Drakenstein achievements to date - WWF
• Analysis of potential of SSEG by private sector - SU
• Potential impact on revenue - SU
• Opportunities to install on municipal buildings - SU
• Prefeasibility study - SU
• Financing of projects for the municipality - WWF
22 April 2015 - 3
Solar photovoltaic research: Drakenstein Municipality
Stellenbosch University, CRSES
Dialogue on Utility and Local Scale Renewable Energy in South Africa

Context of Research
• The 20% study - SU
• State of play of SSEG and impact on municipalities - WWF
• Overview of Drakenstein achievements to date - WWF
• Analysis of potential of SSEG by private sector - SU
• Potential impact on revenue - SU
• Opportunities to install on municipal buildings - SU
• Prefeasibility study - SU
• Financing of projects for the municipality - WWF
22 April 2015 - 4
Solar photovoltaic research: Drakenstein Municipality
Stellenbosch University, CRSES
Dialogue on Utility and Local Scale Renewable Energy in South Africa

Context of Research
• The 20% study - SU
• State of play of SSEG and impact on municipalities - WWF
• Overview of Drakenstein achievements to date - WWF
• Analysis of potential of SSEG by private sector - SU
• Potential impact on revenue - SU
• Opportunities to install on municipal buildings - SU
• Prefeasibility study - SU
• Financing of projects for the municipality - WWF
22 April 2015 - 5
Solar photovoltaic research: Drakenstein Municipality
Stellenbosch University, CRSES
Dialogue on Utility and Local Scale Renewable Energy in South Africa

Potential of SSEG by private sector in Drakenstein:
Solar Resource
22 April 2015 - 6 Dialogue on Utility and Local Scale Renewable Energy in South Africa
Location Annual PV output
(optimally inclined)
Paarl 1 632 kWh/kWp
Pretoria 1 731 kWh/kWp
Kimberley 1 854 kWh/kWp
Solar photovoltaic research: Drakenstein Municipality
Stellenbosch University, CRSES
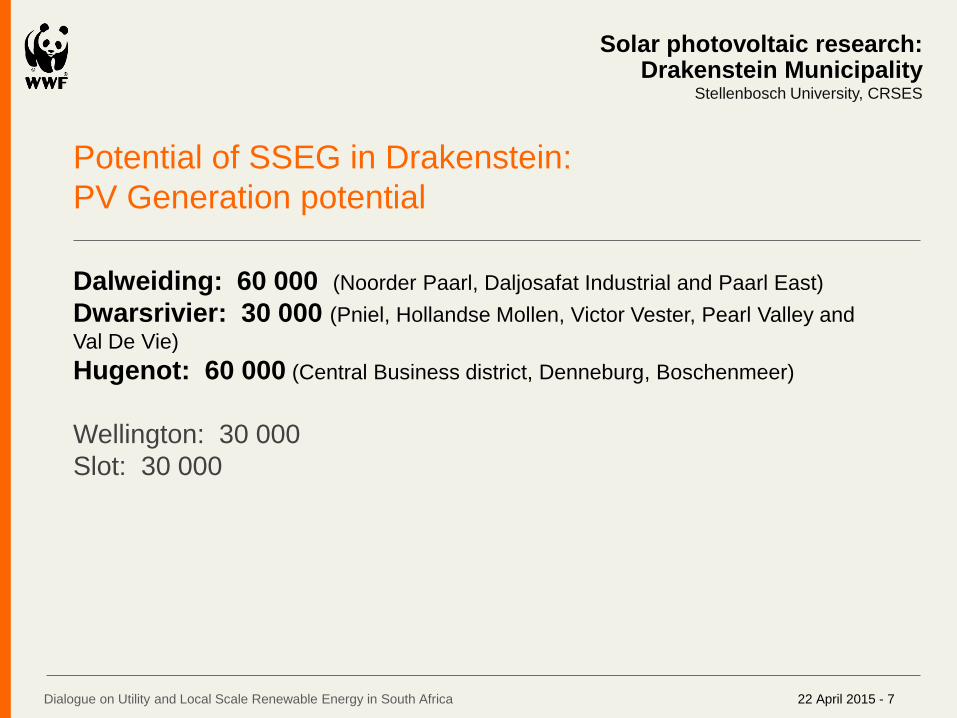
Potential of SSEG in Drakenstein:
PV Generation potential
22 April 2015 - 7 Dialogue on Utility and Local Scale Renewable Energy in South Africa
Solar photovoltaic research: Drakenstein Municipality
Stellenbosch University, CRSES
Dalweiding: 60 000 (Noorder Paarl, Daljosafat Industrial and Paarl East)
Dwarsrivier: 30 000 (Pniel, Hollandse Mollen, Victor Vester, Pearl Valley and
Val De Vie)
Hugenot: 60 000 (Central Business district, Denneburg, Boschenmeer)
Wellington: 30 000
Slot: 30 000

Potential of SSEG in Drakenstein:
PV Generation potential
22 April 2015 - 8 Dialogue on Utility and Local Scale Renewable Energy in South Africa
Solar photovoltaic research: Drakenstein Municipality
Stellenbosch University, CRSES
Dalweiding: 9 000
Dwarsrivier: 4 500
Hugenot: 9 000
Wellington: 4 500
Slot: 4 500

Potential of SSEG in Drakenstein:
PV Generation potential
22 April 2015 - 9 Dialogue on Utility and Local Scale Renewable Energy in South Africa
Solar photovoltaic research: Drakenstein Municipality
Stellenbosch University, CRSES
0
1000000
2000000
3000000
4000000
5000000
6000000
Jul Aug Sep Oct Nov Dec Jan Feb Mar Apr May Jun
kW
h
Dwarsrivier
Slot
Paarl Municiplatiy
Wellington
Hugenot

Potential of SSEG in Drakenstein: PV Generation potential typical summer day: Hugenot Eskom and PV
22 April 2015 - 10 Dialogue on Utility and Local Scale Renewable Energy in South Africa
Solar photovoltaic research: Drakenstein Municipality
Stellenbosch University, CRSES
0
10000
20000
30000
40000
50000
60000
70000
80000
1 2 3 4 5 6 7 8 9 10 11 12 13 14 15 16 17 18 19 20 21 22 23 24
kW
h

Potential of SSEG in Drakenstein: PV Generation potential typical winter(ish) day: Hugenot Eskom and PV
22 April 2015 - 11 Dialogue on Utility and Local Scale Renewable Energy in South Africa
Solar photovoltaic research: Drakenstein Municipality
Stellenbosch University, CRSES
0
10000
20000
30000
40000
50000
60000
70000
80000
90000
1 2 3 4 5 6 7 8 9 10 11 12 13 14 15 16 17 18 19 20 21 22 23 24
kW
h
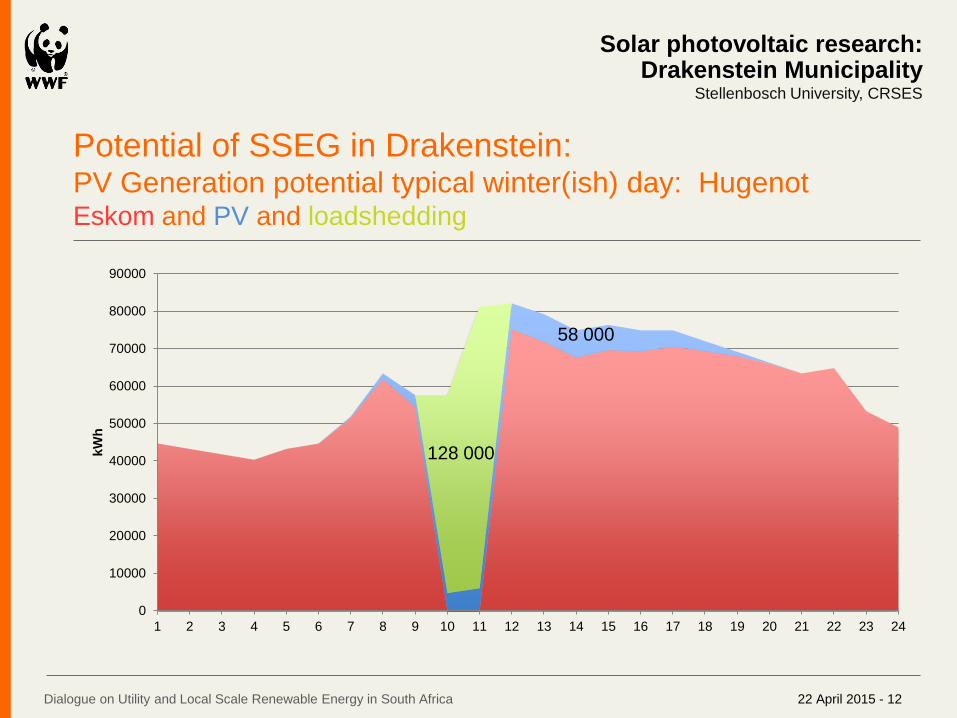
Potential of SSEG in Drakenstein: PV Generation potential typical winter(ish) day: Hugenot Eskom and PV and loadshedding
22 April 2015 - 12 Dialogue on Utility and Local Scale Renewable Energy in South Africa
Solar photovoltaic research: Drakenstein Municipality
Stellenbosch University, CRSES
0
10000
20000
30000
40000
50000
60000
70000
80000
90000
1 2 3 4 5 6 7 8 9 10 11 12 13 14 15 16 17 18 19 20 21 22 23 24
kW
h
128 000
58 000

Potential of SSEG by private sector in Drakenstein
• Industrial user
• Residential user
• Usage analysis
22 April 2015 - 13
Solar photovoltaic research: Drakenstein Municipality
Stellenbosch University, CRSES
Dialogue on Utility and Local Scale Renewable Energy in South Africa

Potential of SSEG by private sector in Drakenstein
Industrial user
• Paarl
• 30 kWp
• 11 identical sub systems with batteries
• Other; • Natural light
• Solar geysers
• CFLs and LEDs
• Motion sensors
22 April 2015 - 14
Solar photovoltaic research: Drakenstein Municipality
Stellenbosch University, CRSES
Dialogue on Utility and Local Scale Renewable Energy in South Africa
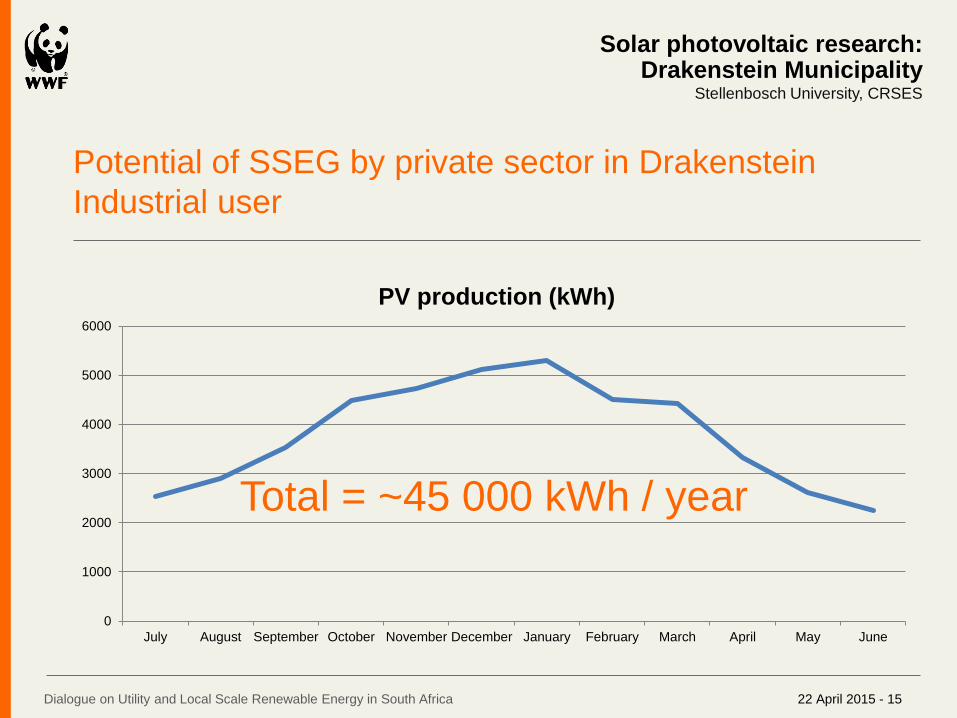
22 April 2015 - 15
Solar photovoltaic research: Drakenstein Municipality
Stellenbosch University, CRSES
Dialogue on Utility and Local Scale Renewable Energy in South Africa
0
1000
2000
3000
4000
5000
6000
July August September October November December January February March April May June
PV production (kWh)
Total = ~45 000 kWh / year
Potential of SSEG by private sector in Drakenstein
Industrial user

22 April 2015 - 16
Solar photovoltaic research: Drakenstein Municipality
Stellenbosch University, CRSES
Dialogue on Utility and Local Scale Renewable Energy in South Africa
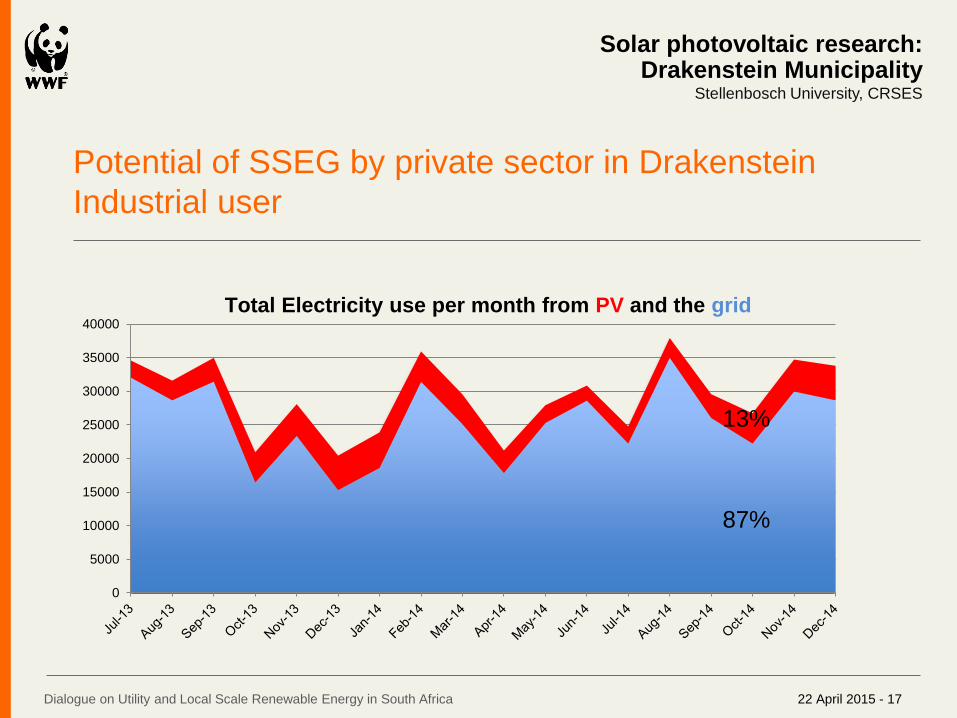
Potential of SSEG by private sector in Drakenstein
Industrial user
30 April 2011
22 April 2015 - 17
Solar photovoltaic research: Drakenstein Municipality
Stellenbosch University, CRSES
Dialogue on Utility and Local Scale Renewable Energy in South Africa
0
5000
10000
15000
20000
25000
30000
35000
40000
Total Electricity use per month from PV and the grid
87%
13%
Potential of SSEG by private sector in Drakenstein
Industrial user

• Paarl
• SWH
• Heat Pump
• Gas hob
• EE lights
• Panel heaters
• 4.25kWp PV system
22 April 2015 - 18
Solar photovoltaic research: Drakenstein Municipality
Stellenbosch University, CRSES
Dialogue on Utility and Local Scale Renewable Energy in South Africa
Potential of SSEG by private sector in Drakenstein
Residential user

22 April 2015 - 19
Solar photovoltaic research: Drakenstein Municipality
Stellenbosch University, CRSES
Dialogue on Utility and Local Scale Renewable Energy in South Africa
0
1000
2000
3000
4000
5000
6000
7000
8000
9000
Electricity Usage 6 monthly
Heat Pump
SWH Gas hob
Panel heaters in kids’ rooms
Panel heater in main bedroom
EE Lights (LED)
4.25kWp PV installation
2010:
1 377 kWh/m
2011:
1 259 kWh/m
2012:
1 344 kWh/m
2013:
1 287 kWh/m
2014:
1 128 kWh/m
Potential of SSEG by private sector in Drakenstein
Residential user

22 April 2015 - 20
Solar photovoltaic research: Drakenstein Municipality
Stellenbosch University, CRSES
Dialogue on Utility and Local Scale Renewable Energy in South Africa
0
500
1000
1500
2000
2500
Total Electricity use per month from PV and the grid
Potential of SSEG by private sector in Drakenstein
Residential user

Impact on municipal revenue
• Industrial user: 356 879 kWh / 45 798 kWh
• Residential user: 17 457kWh / 6 786 kWh
22 April 2015 - 21
Solar photovoltaic research: Drakenstein Municipality
Stellenbosch University, CRSES
Dialogue on Utility and Local Scale Renewable Energy in South Africa

Impact on municipal revenue
22 April 2015 - 22
Solar photovoltaic research: Drakenstein Municipality
Stellenbosch University, CRSES
Dialogue on Utility and Local Scale Renewable Energy in South Africa

Impact on municipal revenue
22 April 2015 - 23
Solar photovoltaic research: Drakenstein Municipality
Stellenbosch University, CRSES
Dialogue on Utility and Local Scale Renewable Energy in South Africa

Role of the municipality: the way forward
• Business as usual
• Policing “illegal” installations
22 April 2015 - 24
Solar photovoltaic research: Drakenstein Municipality
Stellenbosch University, CRSES
Dialogue on Utility and Local Scale Renewable Energy in South Africa

22 April 2015 - 25
Solar photovoltaic research: Drakenstein Municipality
Stellenbosch University, CRSES
Dialogue on Utility and Local Scale Renewable Energy in South Africa
Business as Usual
Perfect Harmony
Central Control
Hard Times
Small number
of rooftop PV
installations
Municipalities play a
dominant role in ED
Municipalities play
no role in ED
Role of the municipality: the way forward
Large number
of rooftop PV
installations

22 April 2015 - 26
Solar photovoltaic research: Drakenstein Municipality
Stellenbosch University, CRSES
Dialogue on Utility and Local Scale Renewable Energy in South Africa
Business as Usual
Municipalities remain the local
distributors and resellers of
electricity. All users of electricity
dependent on a reliable supply of
electricity from Eskom who, as a
monopoly, can determine the price.
Perfect Harmony Municipalities, industry and private
home-owners continue to install
rooftop PV in collaboration with each
other. The electricity generated by PV
suplements the central electricity
supply from Eskom and thereby
increases security of supply in a stable
electricity market.
Central Control
Eskom / new regional distributors
takes over electricity distribution.
Stimulation and/or control of PV
market out of the hands of
municipalities, including the
security of supply as well as the
price.
Hard Times
Industry and private home-owners
continue to install rooftop PV and
financially secure clients become
independent of the local/national grid
resulting in a loss of revenue for both
Eskom and the local municipalities.
Small number
of rooftop PV
installations
Large number
of rooftop PV
installations
Municipalities play
no role in ED
Municipalities play a
dominant role in ED

Contents
Drakenstein Municipality
Solar Resource
Municipal Sites
1 Market Street
Local Site concerns
Load Characteristics
Constraints
Feasibility
22 April 2015 - 28 Dialogue on Utility and Local Scale Renewable Energy in South Africa
Solar photovoltaic research: Drakenstein Municipality
Stellenbosch University, CRSES

Location
22 April 2015 - 29 Dialogue on Utility and Local Scale Renewable Energy in South Africa
Paarl Paarl Mountain (Evl. 676 m)
Haweqwa mountain range
Solar photovoltaic research: Drakenstein Municipality
Stellenbosch University, CRSES

Solar Resource
22 April 2015 - 30 Dialogue on Utility and Local Scale Renewable Energy in South Africa
Location Annual PV output
(optimally inclined)
Paarl 1 632 kWh/kWp
Pretoria 1 731 kWh/kWp
Kimberley 1 854 kWh/kWp
Solar photovoltaic research: Drakenstein Municipality
Stellenbosch University, CRSES

Municipal Buildings investigated
22 April 2015 - 31 Dialogue on Utility and Local Scale Renewable Energy in South Africa
Electricity Building
Civic Centre
1 Market Street
The location of the 3 sites in relation to Paarl Mountain
Solar photovoltaic research: Drakenstein Municipality
Stellenbosch University, CRSES

Macro Site Concerns
22 April 2015 - 32 Dialogue on Utility and Local Scale Renewable Energy in South Africa
Electricity building Civic Centre 1 Market Street
GHI [kWh/m2] 2105 2104 2080
PR 77.7 % 77.5% 76.5%
Specific Yield [kWh/kWp] 1644 1643 1625
The macro shading results in +/- 1% difference in yield.
Solar photovoltaic research: Drakenstein Municipality
Stellenbosch University, CRSES

Site constraints
2. Building Usage Load
22 April 2015 - 33 Dialogue on Utility and Local Scale Renewable Energy in South Africa
1. Available Roof Space
Approx. usable roof space: 1000 m2 Approx. minimum usage: 20 kW
Solar photovoltaic research: Drakenstein Municipality
Stellenbosch University, CRSES

Building Usage Load: Details
Hourly Power Usage Averaged for
Each Day of the Week
22 April 2015 - 34 Dialogue on Utility and Local Scale Renewable Energy in South Africa
Hourly Averaged Plots for Each
Month, Weekdays only
Approx. minimum weekday daylight usage: 90 kW
Approx. minimum weekend daylight usage: 20 kW
Solar photovoltaic research: Drakenstein Municipality
Stellenbosch University, CRSES

System Configuration
50 kWp System
22 April 2015 - 35 Dialogue on Utility and Local Scale Renewable Energy in South Africa
25 kWp System
0.9% difference in near shading losses
Solar photovoltaic research: Drakenstein Municipality
Stellenbosch University, CRSES

System Output
50 kWp System
22 April 2015 - 36 Dialogue on Utility and Local Scale Renewable Energy in South Africa
25 kWp System
Morning and afternoon peaks need to be
addressed to achieve maximum savings
Solar photovoltaic research: Drakenstein Municipality
Stellenbosch University, CRSES

System Output
50 kWp System
22 April 2015 - 37 Dialogue on Utility and Local Scale Renewable Energy in South Africa
25 kWp System
Total excess electricity: 75 kWh
Total PV electricity produced: 27 763 kWh
→ Excess negligible in comparison
Total excess electricity: 4 100 kWh
Total PV electricity produced: 54 335 kWh
→ Excess electricity is 7.5% of the total electricity
produced over this period
Solar photovoltaic research: Drakenstein Municipality
Stellenbosch University, CRSES

Scenarios Investigated
1. Building billed on the
Drakenstein 2014/2015 Bulk
Time of Use Medium Voltage
Tariff
2. Eskom Bulk Time of Use
Megaflex Tariff
22 April 2015 - 38 Dialogue on Utility and Local Scale Renewable Energy in South Africa
50 kWp System 25 kWp System
1. Building billed on the
Drakenstein 2014/2015 Bulk
Time of Use Medium Voltage
Tariff
2. Eskom Bulk Time of Use
Megaflex Tariff
3. Building billed on Large Power
Users Small Scale Embedded
Generation Medium Voltage
tariff
Solar photovoltaic research: Drakenstein Municipality
Stellenbosch University, CRSES

Financial Assumptions
22 April 2015 - 39 Dialogue on Utility and Local Scale Renewable Energy in South Africa
Funding scenarios 100% upfront capital funded, 50% upfront capital
funded and 100% loan funded
Capital Costs scenarios investigated R 16/Wp, R 18/Wp and R 20/Wp
Annual electricity increase over 20 years 12.2% year on year for the first 2 years, 8% for the
next 10 and then 6% for the remaining 8 years
Inflation rate 5.5%
PV production degradation Linear to 80% of original production in year 20
Project lifetime 20 years
Inverter replacement cost R 3.20 /Wp
O&M 0.35% of initial project cost annually
Depreciation Depreciated over project life time
Discount rate 5.5%
Lending Rate 10%
Solar photovoltaic research: Drakenstein Municipality
Stellenbosch University, CRSES

Feasibility Results: 25 kWp System
22 April 2015 - 40 Dialogue on Utility and Local Scale Renewable Energy in South Africa
Scenario 1@ R 18/Wp
(Building billed on Bulk Time of Use Medium Voltage
Tariff)
Scenario 2@ R 18/Wp
(Building billed on Bulk Time of Eskom Megaflex
Tariff)
100% upfront
capital funded
50% upfront
capital funded
100% Debt
funded
100% upfront
capital
funded
50% upfront
capital funded
100% Debt
funded
Total cost over project
lifetime R 584 917.60 R 888 485.91 R 1 192 054.22 R 584 917.60 R 888 485.91 R 1 192 054.22
Project IRR 9.02% 8.35% 5.37% 6.07% 3.19% -7.85%
NPV R 170 653.19 R 84 558.71 -R 1 535.77 R 25 429.27 -R 60 665.21 -R 146 759.69
Payback period [years] 11 13 17 13 17 20+
LCOE of PV energy
over duration of project R 0.78 R 1.49 R 2.19 R 0.78 R 1.49 R 2.19
LCOE of Utility energy
over duration of project R 1.76 R 1.76 R 1.76 R 1.37 R 1.37 R 1.37
Solar photovoltaic research: Drakenstein Municipality
Stellenbosch University, CRSES
100% upfront capital funded 100% upfront capital funded
100% upfront capital funded
100% upfront capital funded 100% upfront capital funded

Feasibility Results: 50 kWp System
22 April 2015 - 41 Dialogue on Utility and Local Scale Renewable Energy in South Africa
Saved [ZAR] % of total savings
Energy Charge (used when produced) R 44 415.34
83.97%
Energy Charge (accounted for through net-
metering) R 1 575.59
Demand Charge R 8 781.99 16.03%
• The excess savings amounts to 3.6% of total energy savings
• This increase in savings is less than the cost decrease in active
energy charge (14%)
→ Since the cash flow of a project is the result of the avoided
electricity costs for this sized system and required electricity load,
positive returns are not expected.
Solar photovoltaic research: Drakenstein Municipality
Stellenbosch University, CRSES

Feasibility Results: Comparison
22 April 2015 - 42 Dialogue on Utility and Local Scale Renewable Energy in South Africa
50 kWp 25 kWp
Scenario 1@ R18/Wp
(Building billed on Bulk Time of
Use Medium Voltage Tariff)
Scenario 3@ R18/Wp
(Building billed on Large Power
Users Small Scale Embedded
Generation tariff)
Scenario 2@ R18/Wp
(Building billed on Eskom
Megaflex Tariff)
100% upfront
capital funded
50% upfront
capital funded
100% upfront
capital funded
50% upfront
capital funded
100% upfront
capital funded
50% upfront
capital funded
Total cost over project
lifetime R 1 169 835.20 R 1 776 971.82 R 1 173 135.20 R 1 782 497.99 R 584 917.60 R 888 485.91
Project IRR 8.20% 6.96% 7.24% 5.29% 9.02% 8.35%
NPV R 256 444.10 R 84 255.14 R 161 178.48 -R 11 641.84 R 170 653.19 R 84 558.71
Payback period [years] 11 13 12 15 11 13
LCOE of PV energy over
duration of project R 0.83 R 1.59 R 0.79 R 1.51 R 0.78 R 1.49
LCOE of Utility energy
over duration of project R 1.76 R 1.76 R 1.55 R 1.55 R 1.76 R 1.76
Solar photovoltaic research: Drakenstein Municipality
Stellenbosch University, CRSES

Lessons Learnt
For this specific building it is more feasible to discard excess energy and
remain on the bulk time of use tariff rather than moving over to the
embedded generation tariff because of:
• The roof size and shading constraints
• The required load of the building
In order for the net metering option to make a good business case the
system needs to be significantly larger then the required day time load.
Manage the load of the buildings, always the first step is to put energy
efficiency measures in place
PV system will also help create awareness and set a good example for
others to follow
22 April 2015 - 43 Dialogue on Utility and Local Scale Renewable Energy in South Africa
Solar photovoltaic research: Drakenstein Municipality
Stellenbosch University, CRSES

Thank you Karin Kritzinger & Imke Meyer
22nd April, 2015
www.panda.org
© 2010, WWF. All photographs used in this presentation are copyright protected and courtesy of the WWF-Canon Global Photo Network and the respective photographers.


Drakenstein Bulk Time of Use
Medium Voltage Tariff 2014/2015
22 April 2015 - 46 Dialogue on Utility and Local Scale Renewable Energy in South Africa
Charge Value
Fixed Charge R 1 296.00
Demand Charge per kVA R 44.00
Access Charge per kVA (12 months) R 37.00
Active Energy Charge
High demand season
[Jun-Aug]
Low demand season
[Sept-May]
Peak [R/kWh] R 1.853 R 1.1369
Standard [R/kWh] R 0.7778 R 0.6358
Off peak [R/kWh] R 0.4463 R 0.3947
Reactive Energy per kVArh R 0.0200
Solar photovoltaic research: Drakenstein Municipality
Stellenbosch University, CRSES

Drakenstein Large Power Users
Small Scale Embedded Generation
Medium Voltage Tariff 2014/2015
22 April 2015 - 47 Dialogue on Utility and Local Scale Renewable Energy in South Africa
Charge Value
Fixed Charge R 1 495.00
Demand Charge per kVA R 52.00
Access Charge per kVA (12 months) R 44.00
Active Energy Charge High demand season
[Jun-Aug]
Low demand season
[Sept-May]
Peak [R/kWh] R 1.5924 R 0.9771
Standard [R/kWh] R 0.6684 R 0.5464
Off peak [R/kWh] R 0.3836 R 0.3392
Reactive Energy per kVArh R 0.0200
Solar photovoltaic research: Drakenstein Municipality
Stellenbosch University, CRSES

Eskom Time of Use Megaflex (local authority)
Tariff 2014/2015
22 April 2015 - 48 Dialogue on Utility and Local Scale Renewable Energy in South Africa
Charge Value
Service charge R/Account/day R 2 813.83
Administration charge R/POD/day R 89.86
Transmission network charge per kVA R 5.73
Network access charge per kVA R 4.12
Network demand charge per kVA R 7.62
Urban low voltage subsidy charge per kVA R 10.09
Reliability service charge per kWh R 0.0027
Electrification and rural network subsidy
charge per kWh R 0.0559
Active Energy Charge High demand season
[Jun-Aug]
Low demand season
[Sept-May]
Peak [R/kWh] R 2.2224 R 0.7249
Standard [R/kWh] R 0.6732 R 0.4989
Off peak [R/kWh] R 0.3656 R 0.3165
Reactive Energy per kVArh R 0.1010 R 0.00
Solar photovoltaic research: Drakenstein Municipality
Stellenbosch University, CRSES

Electricity Building
22 April 2015 - 49 Dialogue on Utility and Local Scale Renewable Energy in South Africa
Solar photovoltaic research: Drakenstein Municipality
Stellenbosch University, CRSES

Civic Centre
22 April 2015 - 50 Dialogue on Utility and Local Scale Renewable Energy in South Africa
Solar photovoltaic research: Drakenstein Municipality
Stellenbosch University, CRSES

1 Market Street
22 April 2015 - 51 Dialogue on Utility and Local Scale Renewable Energy in South Africa
Solar photovoltaic research: Drakenstein Municipality
Stellenbosch University, CRSES