Embed Size (px)
Citation preview
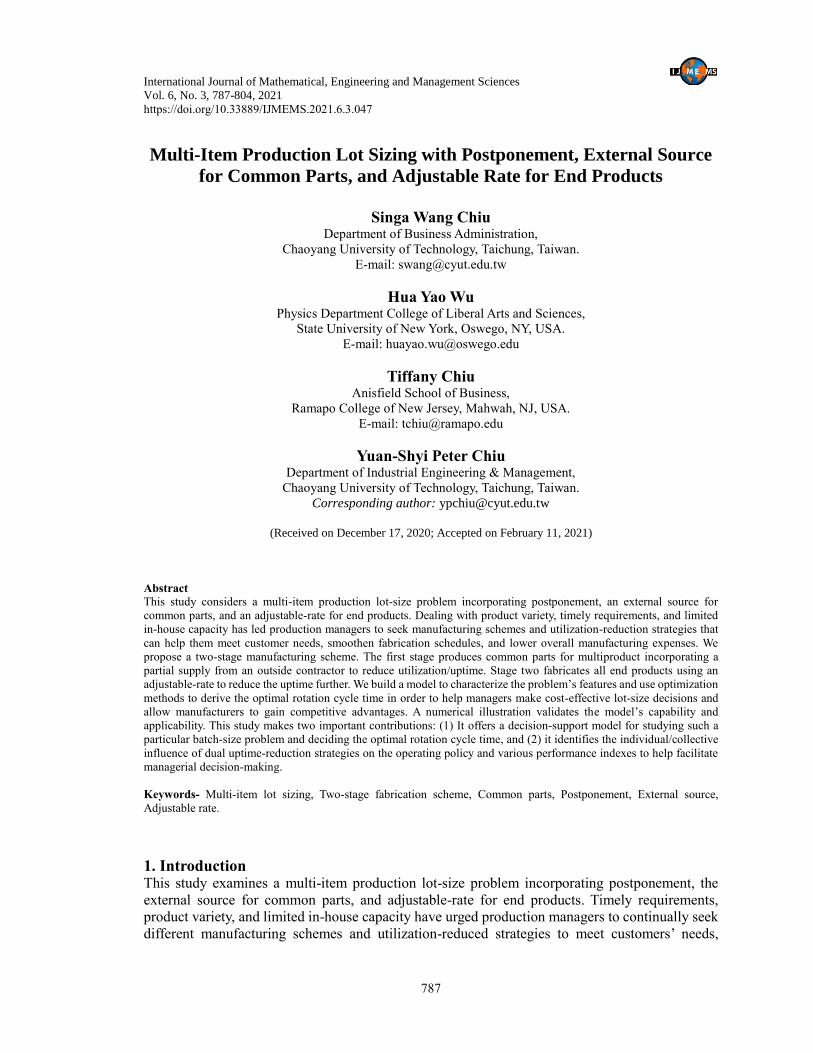
International Journal of Mathematical, Engineering and Management Sciences
Vol. 6, No. 3, 787-804, 2021
https://doi.org/10.33889/IJMEMS.2021.6.3.047
787
Multi-Item Production Lot Sizing with Postponement, External Source
for Common Parts, and Adjustable Rate for End Products
Singa Wang Chiu
Department of Business Administration,
Chaoyang University of Technology, Taichung, Taiwan.
E-mail: [email protected]
Hua Yao Wu Physics Department College of Liberal Arts and Sciences,
State University of New York, Oswego, NY, USA.
E-mail: [email protected]
Tiffany Chiu Anisfield School of Business,
Ramapo College of New Jersey, Mahwah, NJ, USA.
E-mail: [email protected]
Yuan-Shyi Peter Chiu Department of Industrial Engineering & Management,
Chaoyang University of Technology, Taichung, Taiwan.
Corresponding author: [email protected]
(Received on December 17, 2020; Accepted on February 11, 2021)
Abstract
This study considers a multi-item production lot-size problem incorporating postponement, an external source for
common parts, and an adjustable-rate for end products. Dealing with product variety, timely requirements, and limited
in-house capacity has led production managers to seek manufacturing schemes and utilization-reduction strategies that
can help them meet customer needs, smoothen fabrication schedules, and lower overall manufacturing expenses. We
propose a two-stage manufacturing scheme. The first stage produces common parts for multiproduct incorporating a
partial supply from an outside contractor to reduce utilization/uptime. Stage two fabricates all end products using an
adjustable-rate to reduce the uptime further. We build a model to characterize the problem’s features and use optimization
methods to derive the optimal rotation cycle time in order to help managers make cost-effective lot-size decisions and
allow manufacturers to gain competitive advantages. A numerical illustration validates the model’s capability and
applicability. This study makes two important contributions: (1) It offers a decision-support model for studying such a
particular batch-size problem and deciding the optimal rotation cycle time, and (2) it identifies the individual/collective
influence of dual uptime-reduction strategies on the operating policy and various performance indexes to help facilitate
managerial decision-making.
Keywords- Multi-item lot sizing, Two-stage fabrication scheme, Common parts, Postponement, External source,
Adjustable rate.
1. Introduction This study examines a multi-item production lot-size problem incorporating postponement, the
external source for common parts, and adjustable-rate for end products. Timely requirements,
product variety, and limited in-house capacity have urged production managers to continually seek
different manufacturing schemes and utilization-reduced strategies to meet customers’ needs,
International Journal of Mathematical, Engineering and Management Sciences
Vol. 6, No. 3, 787-804, 2021
https://doi.org/10.33889/IJMEMS.2021.6.3.047
788
smoothen fabrication schedules, and lower the total manufacturing expenses. During the
multiproduct fabrication planning stage, managers consider a postponement strategy to delay
product differentiation and reduce the orders’ response time for end products. Gerchak and Henig
(1986) examined the implication and impact of component commonality on the “assemble-to-order”
fabrication processes. They explored dynamic and static situations for product-specific parts and
other combined parts to disclose the characteristics and managerial implications in these different
situations. van Mieghem and Dada (1999) examined the price versus fabrication postponement
issues by focusing on completion and capacity. Through building a two-stage decisional model to
enable comparing/analyzing the potential benefits of postponement strategy from three different
decisions: investing capacity, fabrication quantity, price. As a result, they revealed the collective
effect of competition, the operational decision’s timing, and uncertainty on a firm’s strategic
investment decision and value. Schulze and Li (2009) considered a multiproduct logistic network
featuring commonality and postponement with the aim to analyze the influence of product
commonality and the postponement strategy on planning/allocating the locations. İnkaya et al.
(2018) examined a two-stage supply chain focusing on the collective impact of competition,
coordination, and cost structure on vertically differentiated products’ pricing and variety decisions.
Through numerical experiments, they compared different scenarios of product differentiation/
coordination between manufacturers and assembly firms. The performance evaluation measures
were the partial differentiation option, product competition strength, cost of bill-of-materials, and
products’ quality levels. Recent studies (Chiu et al., 2019, 2020a; Jabbarzadeh et al., 2019; Le Pape
and Wang, 2020; Wu et al., 2021) also examined the impact of different postponement schemes on
manufacturing systems, supply chains, and corporation management.
The commonly used uptime-reduction strategies to meet timely customer’s orders and smoothen
machine utilization fabrication include outsourcing and expedited rate. This study considers
outsourcing a portion of a batch’s common components to shorten the needed uptime in stage one.
Daugherty and Dröge (1997) examined the impact of differences in external logistical services
usage levels on corporations of various organizational structures. Lee-Mortimer (2006) examined
the correlations between improved product design studied and outsourcing assembly and
manufacturing tasks. Through surveyed/studied numerous outsourcing cases/firms, the author
obtained the overseas manufactures’ cost-benefit analytical details and researched their current
product design to seek correlations that can facilitate managerial operating decision-making. Elahi
(2013) built a make-to-stock, multiple-vendors single-buyer queueing model to investigate the best
outsourcing competition parameters. The model considered each vendor a queueing system, used
a proportional allocating function, and inventory and service levels as competition parameters to
study the correlations between the parameters to maximize the buyer’s service level. Chiu et al.
(2020b) derived the optimal rotation cycle decision for a multi-item finite production rate-based
system with a delayed differentiation strategy and a partial common-component outsourcing option.
Recent studies (Akkermans et al., 2019; Chiu et al., 2020c, d; Iqbal et al., 2020) also examined the
impact of various outsourcing policies on supply chains, production systems, and corporation
management.
Further, we consider an expedited rate for manufacturing multiple end items to further cut short
stage two’s production uptime. Boucher (1987) investigated the maximization of robot fabrication
rates in the operations of simple component insertions. The author formulated and analyzed the
problem to decide the robot’s stopping rules to focus on the consistency of the robot’s dimensional
tolerances and variability. Al-Fawzan and Al-Sultan (1997) extended the economic production
quantity model (EPQ model) by incorporating a controllable fabrication rate. The authors built
International Journal of Mathematical, Engineering and Management Sciences
Vol. 6, No. 3, 787-804, 2021
https://doi.org/10.33889/IJMEMS.2021.6.3.047
789
mathematical models with a specific search algorithm to examine the EPQ problems with and
without permitted shortages. Their objectives were to simultaneously derive the optimal fabrication
lot-size and rate from minimizing the problems’ total expenses. Gharbi et al. (2006) explored a
multi-item multi-machine manufacturing system with different setups, unreliable equipment, and
controllable rates. The authors applied several methods (e.g., the response surface, stochastic
optimal control, discrete-event simulation, and experimental design) to resolve the complex
problem. Their objectives were to determine the optimal setup order and manufacturing rates to
minimize the system’s operating expenses. The authors examined cases of different numbers of
machines with dissimilar failure and repair-time distribution to validate their model’s applicability.
Sajadieh and Larsen (2015) examined a producer-retailer coordinated two-stage supply chain
considering random yield, fixed setup cost, backlogs, and stochastic demand. The authors proposed
the Markovian chain to analyze and explore the optimal supply-chain decision. Their study used
several cases to validate their study’s applicability. Recent works (Fathallah et al., 2019; Lin et al.,
2019; Demić et al., 2020; Lesmono et al., 2020; Moin et al., 2020; Yadavalli et al., 2020; Glock
and Grosse, 2021;) investigated the effect of variable manufacturing rates on various aspects of
fabrication systems and supply chain systems. Since few past works emphasized multi-item
production lot-sizing problems with postponement and dual uptime-reduction strategies, we intend
to fill the gap.
2. Material and Methods
2.1 Problem Description and Notation This study explores a multi-item production lot sizing with postponement, external source for
common parts, and adjustable-rate for end products. The following Nomenclature helps describe
the studied two-stage delayed differentiation production model:
λi = end product i’s annual demand (where i = 1, 2, …, L),
t1,i = end product i’s uptime in stage two,
t2,i = depleting time of end product i,
Qi = end product i’s lot size,
PT1,i = adjustable manufacturing rate of end product i per year,
P1,i = ordinary production rate of end product i per year,
α1,i = the connecting parameter between P1,i and PT1,i,
KT,i = end product i’s setup cost when adjustable-rate is used,
Ki = ordinary setup cost of end product i,
α2,i = the connecting parameter between and Ki and KT,i,
CT,i = end product i’s unit cost when using adjustable-rate,
Ci = end product i’s ordinary unit cost,
α3,i = the connecting parameter between Ci and CT,i,
H1,i = end product i’s inventory status when its uptime finishes,
h1,i = end product i’s unit holding cost,
Si = end product i’s setup time,
ti* = the optimal total uptimes of end products,
TZ = rotation cycle time - the decision variable,
t1,0 = the uptime of common parts in stage one,
t2,0 = the depletion time of common parts,
λ0 = common part’s annual demand,
Q0 = common part’s in-house lot-size,
π0 = outsourcing proportion of common parts per batch,
γ = common part’s completion rate,
International Journal of Mathematical, Engineering and Management Sciences
Vol. 6, No. 3, 787-804, 2021
https://doi.org/10.33889/IJMEMS.2021.6.3.047
790
P1,0 = common part’s in-house annual manufacturing rate,
Kπ0 = outsourcing’s setup expense,
Cπ0 = unit cost per outsourced part,
H2,0 = common part’s stock level when outsourced items are received,
H1,0 = common part’s level when uptime ends,
Hi = common part’s level when end product i’s uptime completes,
K0 = common part’s production setup expense,
β1,0 = the relating parameter between K0 and Kπ0,
C0 = unit manufacturing cost per common part,
β2,0 = the relating parameter between C0 and Cπ0,
h1,0 = common part’s unit holding cost,
i0 = the relating parameter between holding and unit costs (i.e., h1,0 = i0 C0),
t0* = the optimal uptime for production of common parts,
S0 = setup time for common part,
I(t)I = inventory level at time t,
TC(TZ) = total production-inventory expense per cycle,
TCU(TZ) = total production-inventory expense per unit time.
The studied multi-item lot-size problem has the following characteristics/assumptions: (1) This
study uses a single-machine delayed differentiation two-stage production scheme. Stage one makes
all required common parts, and stage two fabricates multiple finished products under a rotation
cycle discipline. (2) Both the annual demand rates of multi-item and the completion rate of the
common part are assumed constant, e.g., if γ = 0.5, then the end product’s fabrication rate two times
as much as the ordinary rate of a single-stage system. (3) To shorten the uptime in stage one, an
external source is used to supply a π0 portion of common parts. (4) To further reduce the total
uptimes in stage two, an expediting rate with factor α1,i is used to fabricate multiple end products.
The influence of π0 and α1,i on relevant fabrication-rate and cost parameters, as shown below:
𝑃𝑇1,𝑖 = 𝑃1,𝑖(1 + 𝛼1,𝑖) (1)
𝐾𝑇,𝑖 = 𝐾𝑖(1 + 𝛼2,𝑖) (2)
𝐶𝑇,𝑖 = 𝐶𝑖(1 + 𝛼3,𝑖) (3)
𝐾𝜋0 = 𝐾0(1 + 𝛽1,0) (4)
𝐶𝜋0 = 𝐶0(1 + 𝛽2,0) (5)
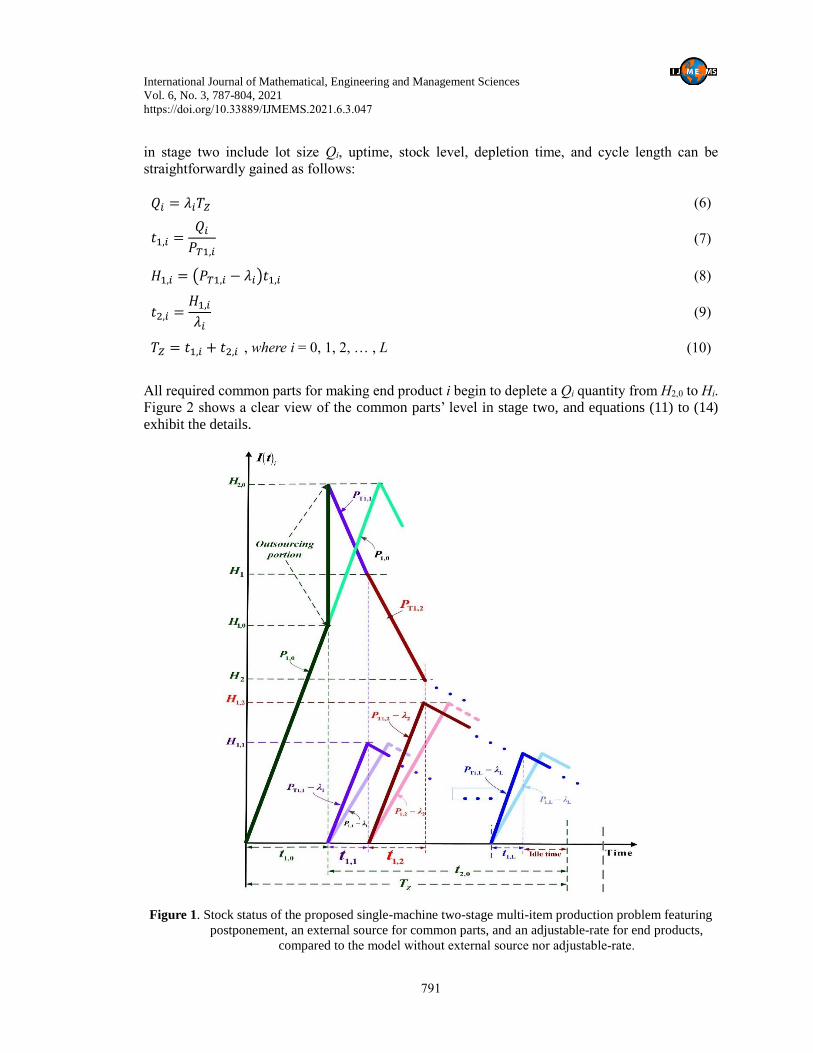
Figure 1 exhibits the level of stocks in our proposed problem featuring postponement, an external
source for common parts, and an adjustable-rate for finished products. It shows the common parts’
level stacks to H1,0 when in-house uptime t1,0 completes; meantime, the external source supplies the
outsourced items to bring common parts’ level to H2,0 before stage two begins. Then, finished
product i’s level accumulates to H1,i, when t1,i ends. Finally, the stocks of product i diminish under
a continuous transporting police.
2.2 Formulations and Solution Process In stage two, the annual demand λi of multiple finished products must be satisfied (i = 1, 2, …, L)
by a batch production plan with an adjustable-rate PT1,i. Observing Figure 1, the relevant formulas
International Journal of Mathematical, Engineering and Management Sciences
Vol. 6, No. 3, 787-804, 2021
https://doi.org/10.33889/IJMEMS.2021.6.3.047
791
in stage two include lot size Qi, uptime, stock level, depletion time, and cycle length can be
straightforwardly gained as follows:
𝑄𝑖 = 𝜆𝑖𝑇𝑍 (6)
𝑡1,𝑖 =𝑄𝑖𝑃𝑇1,𝑖
(7)
𝐻1,𝑖 = (𝑃𝑇1,𝑖 − 𝜆𝑖)𝑡1,𝑖 (8)
𝑡2,𝑖 =𝐻1,𝑖𝜆𝑖
(9)
𝑇𝑍 = 𝑡1,𝑖 + 𝑡2,𝑖 , where i = 0, 1, 2, … , L (10)
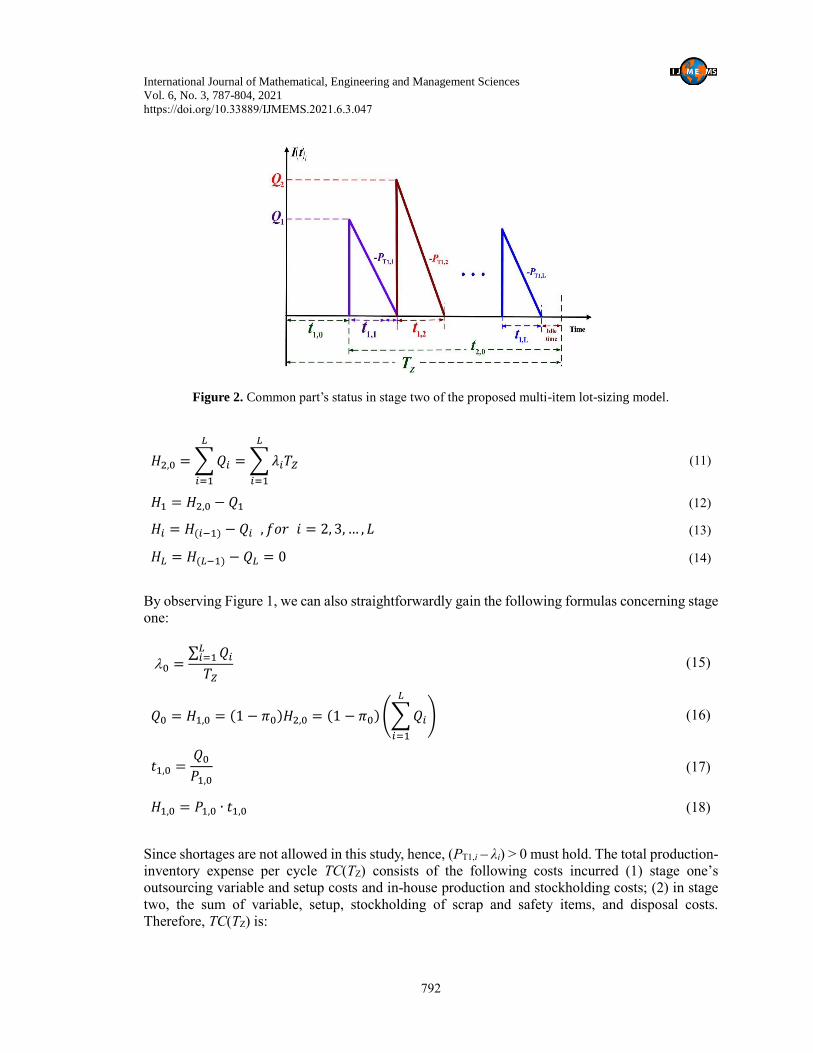
All required common parts for making end product i begin to deplete a Qi quantity from H2,0 to Hi.
Figure 2 shows a clear view of the common parts’ level in stage two, and equations (11) to (14)
exhibit the details.
Figure 1. Stock status of the proposed single-machine two-stage multi-item production problem featuring
postponement, an external source for common parts, and an adjustable-rate for end products,
compared to the model without external source nor adjustable-rate.
International Journal of Mathematical, Engineering and Management Sciences
Vol. 6, No. 3, 787-804, 2021
https://doi.org/10.33889/IJMEMS.2021.6.3.047
792
Figure 2. Common part’s status in stage two of the proposed multi-item lot-sizing model.
𝐻2,0 =∑𝑄𝑖
𝐿
𝑖=1
=∑𝜆𝑖𝑇𝑍
𝐿
𝑖=1
(11)
𝐻1 = 𝐻2,0 − 𝑄1 (12)
𝐻𝑖 = 𝐻(𝑖−1) − 𝑄𝑖 , 𝑓𝑜𝑟 𝑖 = 2, 3, … , 𝐿 (13)
𝐻𝐿 = 𝐻(𝐿−1) − 𝑄𝐿 = 0 (14)
By observing Figure 1, we can also straightforwardly gain the following formulas concerning stage
one:
0 =∑ 𝑄𝑖𝐿𝑖=1
𝑇𝑍 (15)
𝑄0 = 𝐻1,0 = (1 − 𝜋0)𝐻2,0 = (1 − 𝜋0)(∑𝑄𝑖
𝐿
𝑖=1
) (16)
𝑡1,0 =𝑄0𝑃1,0
(17)
𝐻1,0 = 𝑃1,0 ∙ 𝑡1,0 (18)
Since shortages are not allowed in this study, hence, (PT1,i – λi) > 0 must hold. The total production-
inventory expense per cycle TC(TZ) consists of the following costs incurred (1) stage one’s
outsourcing variable and setup costs and in-house production and stockholding costs; (2) in stage
two, the sum of variable, setup, stockholding of scrap and safety items, and disposal costs.
Therefore, TC(TZ) is:
International Journal of Mathematical, Engineering and Management Sciences
Vol. 6, No. 3, 787-804, 2021
https://doi.org/10.33889/IJMEMS.2021.6.3.047
793
𝑇𝐶(𝑇𝑍) = 𝜋0(∑ 𝑄𝑖𝐿𝑖=1 )𝐶𝜋0 + 𝐾𝜋0 + 𝐶0𝑄0 + 𝐾0 + ℎ1,0 [
𝐻1,0𝑡1,0
2+ ∑ [
𝑄𝑖
2(𝑡1,𝑖) + 𝐻𝑖(𝑡1,𝑖)]
𝐿𝑖=1 ] +
∑ [𝑄𝑖𝐶𝑇,𝑖 + 𝐾𝑇,𝑖 + ℎ1,𝑖 (𝐻1,𝑖𝑡1,𝑖
2+𝐻1,𝑖𝑡2,𝑖
2)]𝐿
𝑖=1 (19)
Substitute Eqs. (1) to (18) in Eq. (19), apply TC(TZ)] / TZ, and, TCU(TZ) is gained with extra
derivation as shown below:
𝑇𝐶𝑈(𝑇𝑍) =
{
(1+𝛽1,0)𝐾0
𝑇𝑍+ (1 + 𝛽2,0)𝐶0𝜋0𝜆0 + 𝐶0(1 − 𝜋0)𝜆0 +
𝐾0
𝑇𝑍+
ℎ1,0𝜆02(1−𝜋0)
2𝑇𝑍
2𝑃1,0
+ℎ1,0∑ {𝜆𝑖2𝑇𝑍
2(1+𝛼1,𝑖)𝑃1,𝑖+
𝜆𝑖
(1+𝛼1,𝑖)𝑃1,𝑖(∑ 𝜆𝑖𝑇𝑍 − ∑ 𝜆𝑗𝑇𝑍
𝑖𝑗=1
𝐿𝑖=1 )}𝐿
𝑖=1 }
+
∑ {(1 + 𝛼3,𝑖)𝐶𝑖𝜆𝑖 +(1+𝛼2,𝑖)𝐾𝑖
𝑇𝑍+
ℎ1,𝑖𝜆𝑖2
2[1
𝜆𝑖−
1
(1+𝛼1,𝑖)𝑃1,𝑖] 𝑇𝑍}
𝐿𝑖=1 (20)
To derive the optimal TZ*, the first- and second-derivative to TCU(TZ) are applied and the result as
follows:
𝑑TCU(𝑇𝑍)
𝑑(𝑇𝑍)= {−
(1+𝛽1,0)𝐾0
𝑇𝑍2 −
𝐾0
𝑇𝑍2 +
ℎ1,0𝜆02(1−𝜋0)
2
2𝑃1,0+ ℎ1,0∑ {
𝜆𝑖2
2(1+𝛼1,𝑖)𝑃1,𝑖}𝐿
𝑖=1 +
ℎ1,0∑ {𝜆𝑖
(1+𝛼1,𝑖)𝑃1,𝑖(∑ 𝜆𝑖 − ∑ 𝜆𝑗
𝑖𝑗=1
𝐿𝑖=1 )}𝐿
𝑖=1 } + ∑ {−(1+𝛼2,𝑖)𝐾𝑖
𝑇𝑍2 +
ℎ1,𝑖𝜆𝑖2
2[1
𝜆𝑖−
1
(1+𝛼1,𝑖)𝑃1,𝑖]}𝐿
𝑖=1 (21)
𝑑2TCU(𝑇𝑍)
𝑑(𝑇𝑍)2 =
2[(1+𝛽1,0)𝐾0]
𝑇𝑍3 +
2𝐾0
𝑇𝑍3 + ∑
2[(1+𝛼2,𝑖)𝐾𝑖]
𝑇𝑍3 > 0𝐿
𝑖=1 (22)
In Eq. (22), since variables β1,0, α2,i, TZ, K0, and Ki are all positive; hence, TCU(TZ) is convex. We
derive the optimal TZ* by setting the first derivative of TCU(TZ) = 0 (i.e., Eq. (21) = 0).
𝑇𝑍∗ =
√
2{(2+𝛽1,0)𝐾0+∑ (1+𝛼2,𝑖)𝐾𝑖𝐿𝑖=1 }
ℎ1,0𝜆02 (1−𝜋0)
2
𝑃1,0+ℎ1,0∑ {
𝜆𝑖2
(1+𝛼1,𝑖)𝑃1,𝑖+
2𝜆𝑖
(1+𝛼1,𝑖)𝑃1,𝑖(∑ 𝜆𝑖−∑ 𝜆𝑗
𝑖𝑗=1
𝐿𝑖=1 )}𝐿
𝑖=1
+∑ ℎ1,𝑖𝜆𝑖2[1
𝜆𝑖−
1
(1+𝛼1,𝑖)𝑃1,𝑖]𝐿
𝑖=1
(23)
2.3 Discussion on Setup Times and Prerequisite Condition
We may require to calculate Tmin (Nahmias, 2009) if the sum of setup times Si is larger than the
idle-time of the cycle (see Fig. 1). In this case, the final optimal cycle time solution is the maximum
(TZ*, Tmin).
𝑇𝑚𝑖𝑛=∑ (𝑆𝑖)𝐿𝑖=0
1−[ (1−𝜋0)𝜆0
𝑃1,0+∑ (
𝜆𝑖𝑃𝑇1,𝑖
)𝐿𝑖=1 ]
(24)
International Journal of Mathematical, Engineering and Management Sciences
Vol. 6, No. 3, 787-804, 2021
https://doi.org/10.33889/IJMEMS.2021.6.3.047
794
Moreover, the machine in our model must have adequate capacity to manufacture the common parts
and multiple end products (Nahmias, 2009). Hence, the following prerequisite formulas must hold:
(𝑡1,0 + ∑ 𝑡1,𝑖𝐿𝑖=1 ) < 𝑇𝑍 𝑜𝑟 (
𝑄0
𝑃1,0+ ∑
𝑄𝑖
𝑃𝑇1,𝑖
𝐿𝑖=1 ) < 𝑇𝑍 𝑜𝑟 [
(1−𝜋0)𝜆0
𝑃1,0+ ∑
𝜆𝑖
𝑃𝑇1,𝑖
𝐿𝑖=1 ] < 1
(25)
3. Numerical Illustration Assume variables’ values exhibited in Tables 1 and 2 below are for a multi-item batch production
plan featuring postponement, external source for common parts, and expedited rate for
manufacturing multiproduct. Conversely, the parameters’ values assumed for a single-stage
production scheme of the same problem are provided in Table 3.
Table 1. The variables’ values assumed in stage one.
π0 β1,0 P1,0 β2,0 0 C0 h1,0 K0 i0
0.4 -0.7 0.5 120000 0.4 17000 0.5 $40 $8 $8500 0.2
Table 2. The variables’ values assumed in stage two.
Product i α1,i Ci α2,i λi α3,i ii Ki P1,i h1,i
1 0.5 $40 0.1 3000 0.25 0.2 $8500 112258 $16
2 0.5 $50 0.1 3200 0.25 0.2 $9000 116066 $18
3 0.5 $60 0.1 3400 0.25 0.2 $9500 120000 $20
4 0.5 $70 0.1 3600 0.25 0.2 $10000 124068 $22
5 0.5 $80 0.1 3800 0.25 0.2 $10500 128276 $24
Table 3. The variables’ values assumed in a single-stage scheme of the same problem.
Product i Ci i P1,i h1,i λi Ki
1 $80 0.2 58000 $16 3000 $17000
2 $90 0.2 59000 $18 3200 $17500
3 $100 0.2 60000 $20 3400 $18000
4 $110 0.2 61000 $22 3600 $18500
5 $120 0.2 62000 $24 3800 $19000
Through calculating formulas (23) and (20), we find TZ* = 0.5950 years and E[TCU(TZ*)] =
$2,301,559 for the studied multi-item production lot sizing problem containing postponement,
external source for common parts, and adjustable-rate for end products fabrication.
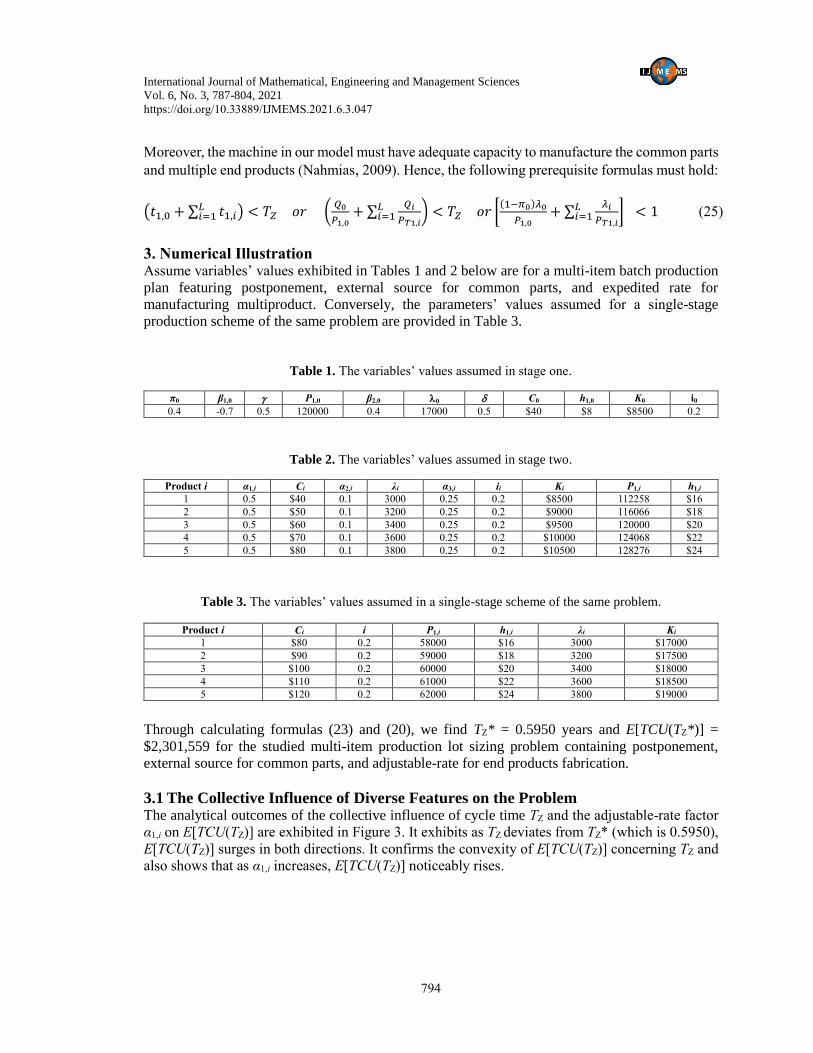
3.1 The Collective Influence of Diverse Features on the Problem The analytical outcomes of the collective influence of cycle time TZ and the adjustable-rate factor
α1,i on E[TCU(TZ)] are exhibited in Figure 3. It exhibits as TZ deviates from TZ* (which is 0.5950),
E[TCU(TZ)] surges in both directions. It confirms the convexity of E[TCU(TZ)] concerning TZ and
also shows that as α1,i increases, E[TCU(TZ)] noticeably rises.
International Journal of Mathematical, Engineering and Management Sciences
Vol. 6, No. 3, 787-804, 2021
https://doi.org/10.33889/IJMEMS.2021.6.3.047
795
Figure 3. The analytical outcomes of the collective influence of TZ and α1,i on E[TCU(TZ)].
Figure 4 exhibits the combined impact of the adjustable-rate and outsourcing factors (i.e., α1,i and
π0) on utilization. It exposes the utilization drops severely, as π0 increases; utilization decreases
noticeably, as α1,i increases.
Figure 4. The combined impact of α1,i and π0 on the utilization.
International Journal of Mathematical, Engineering and Management Sciences
Vol. 6, No. 3, 787-804, 2021
https://doi.org/10.33889/IJMEMS.2021.6.3.047
796
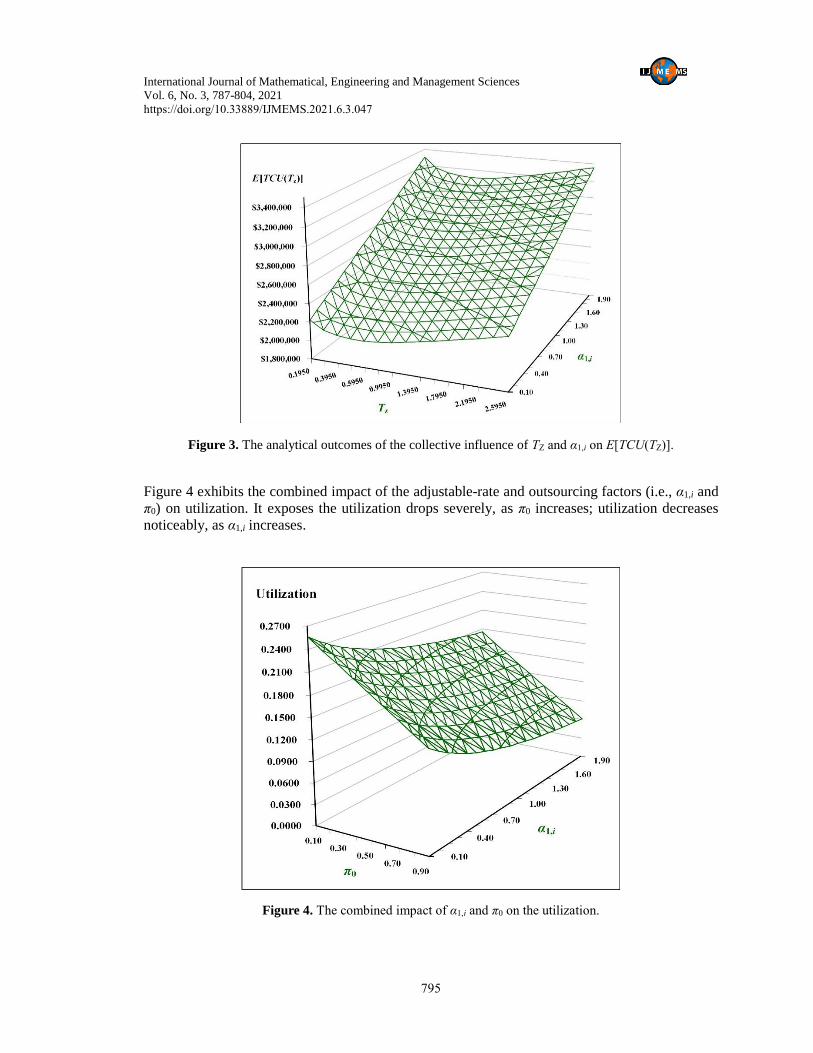
Figure 5 shows the investigative outcomes of the collective effect of π0 and α1,i on E[TCU(TZ*)]. It
exposes as both π0 and α1,i increase, E[TCU(TZ*)] rises considerably. It discovers that in our
example, α1,i has more impact π0 on E[TCU(TZ*)] increase.
Figure 5. The collective effect of π0 and α1,i on E[TCU(TZ*)].
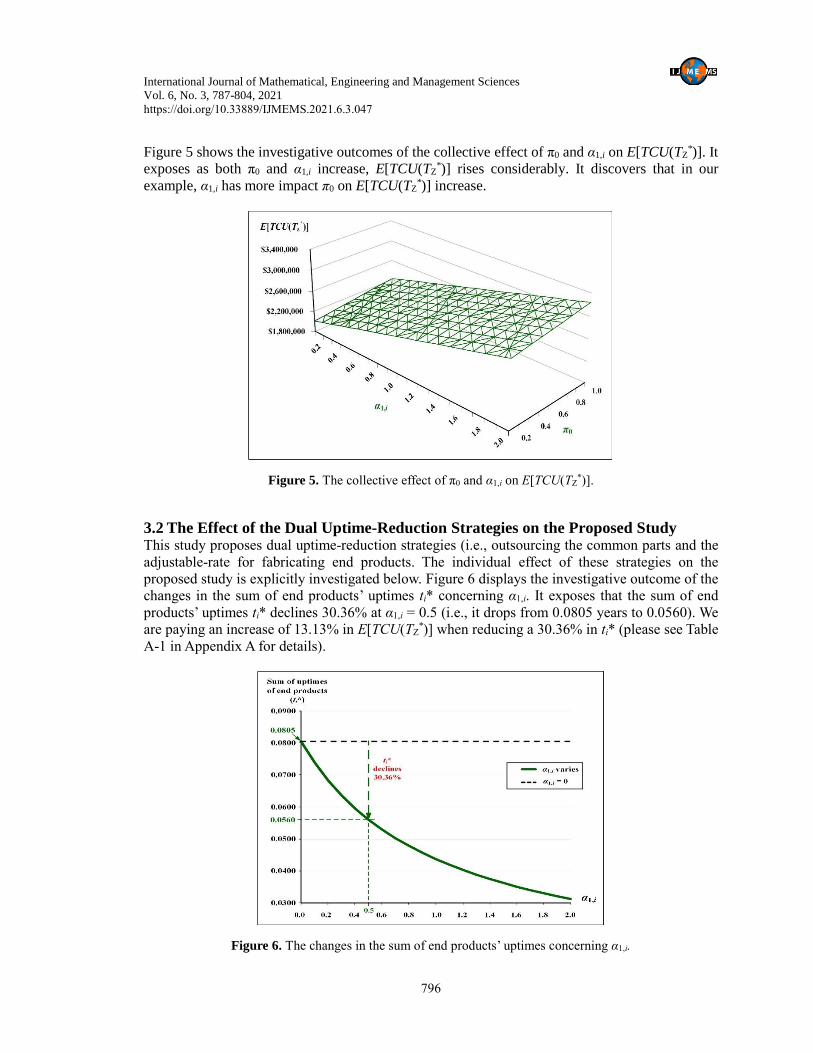
3.2 The Effect of the Dual Uptime-Reduction Strategies on the Proposed Study This study proposes dual uptime-reduction strategies (i.e., outsourcing the common parts and the
adjustable-rate for fabricating end products. The individual effect of these strategies on the
proposed study is explicitly investigated below. Figure 6 displays the investigative outcome of the
changes in the sum of end products’ uptimes ti* concerning α1,i. It exposes that the sum of end
products’ uptimes ti* declines 30.36% at α1,i = 0.5 (i.e., it drops from 0.0805 years to 0.0560). We
are paying an increase of 13.13% in E[TCU(TZ*)] when reducing a 30.36% in ti* (please see Table
A-1 in Appendix A for details).
Figure 6. The changes in the sum of end products’ uptimes concerning α1,i.
International Journal of Mathematical, Engineering and Management Sciences
Vol. 6, No. 3, 787-804, 2021
https://doi.org/10.33889/IJMEMS.2021.6.3.047
797
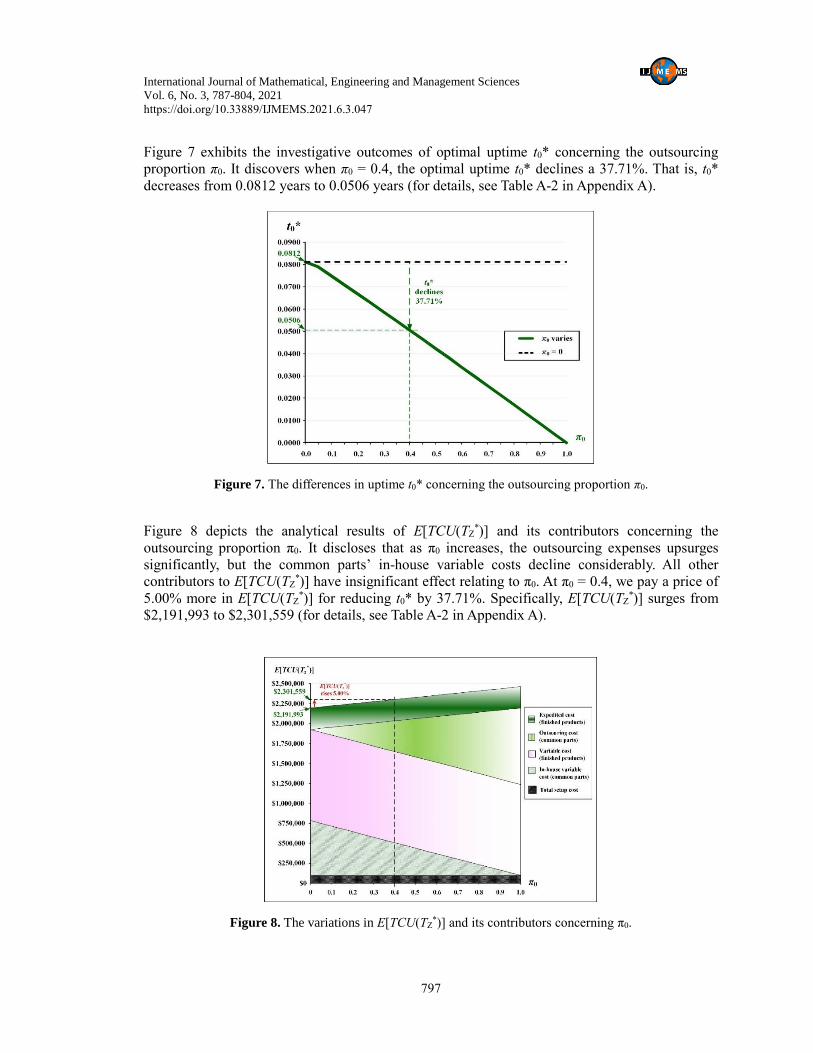
Figure 7 exhibits the investigative outcomes of optimal uptime t0* concerning the outsourcing
proportion π0. It discovers when π0 = 0.4, the optimal uptime t0* declines a 37.71%. That is, t0*
decreases from 0.0812 years to 0.0506 years (for details, see Table A-2 in Appendix A).
Figure 7. The differences in uptime t0* concerning the outsourcing proportion π0.
Figure 8 depicts the analytical results of E[TCU(TZ*)] and its contributors concerning the
outsourcing proportion π0. It discloses that as π0 increases, the outsourcing expenses upsurges
significantly, but the common parts’ in-house variable costs decline considerably. All other
contributors to E[TCU(TZ*)] have insignificant effect relating to π0. At π0 = 0.4, we pay a price of
5.00% more in E[TCU(TZ*)] for reducing t0* by 37.71%. Specifically, E[TCU(TZ
*)] surges from
$2,191,993 to $2,301,559 (for details, see Table A-2 in Appendix A).
Figure 8. The variations in E[TCU(TZ*)] and its contributors concerning π0.
International Journal of Mathematical, Engineering and Management Sciences
Vol. 6, No. 3, 787-804, 2021
https://doi.org/10.33889/IJMEMS.2021.6.3.047
798
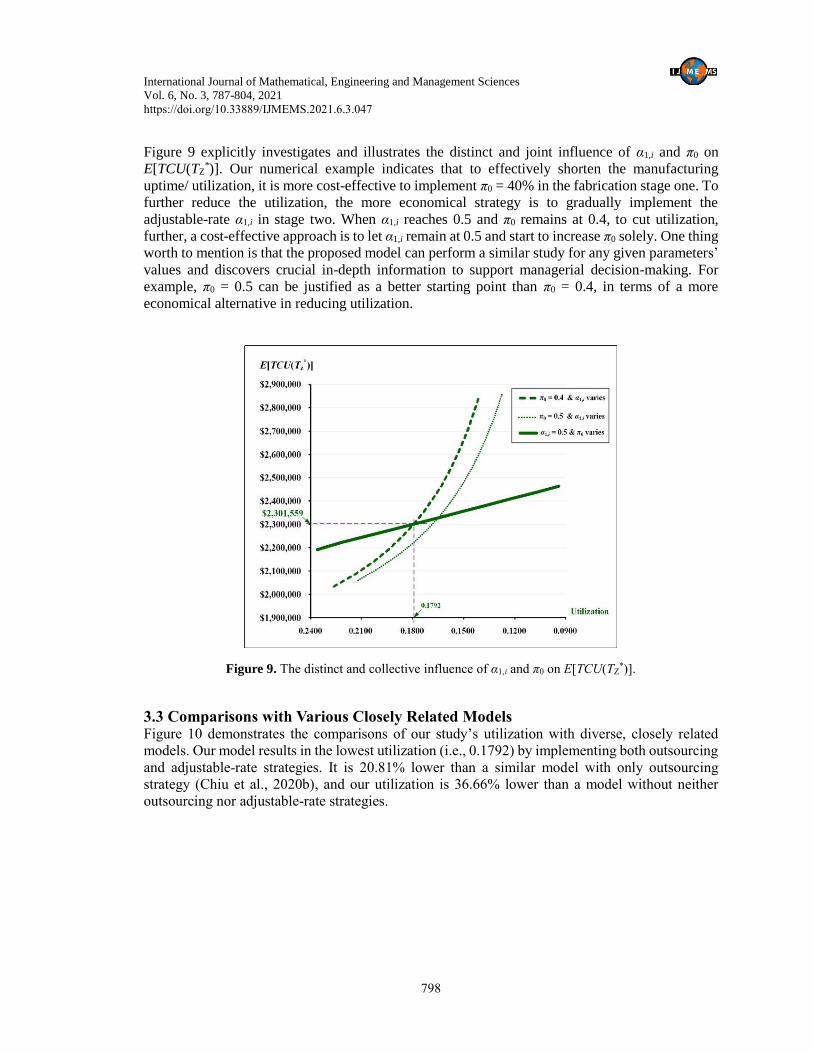
Figure 9 explicitly investigates and illustrates the distinct and joint influence of α1,i and π0 on
E[TCU(TZ*)]. Our numerical example indicates that to effectively shorten the manufacturing
uptime/ utilization, it is more cost-effective to implement π0 = 40% in the fabrication stage one. To
further reduce the utilization, the more economical strategy is to gradually implement the
adjustable-rate α1,i in stage two. When α1,i reaches 0.5 and π0 remains at 0.4, to cut utilization,
further, a cost-effective approach is to let α1,i remain at 0.5 and start to increase π0 solely. One thing
worth to mention is that the proposed model can perform a similar study for any given parameters’
values and discovers crucial in-depth information to support managerial decision-making. For
example, π0 = 0.5 can be justified as a better starting point than π0 = 0.4, in terms of a more
economical alternative in reducing utilization.
Figure 9. The distinct and collective influence of α1,i and π0 on E[TCU(TZ*)].
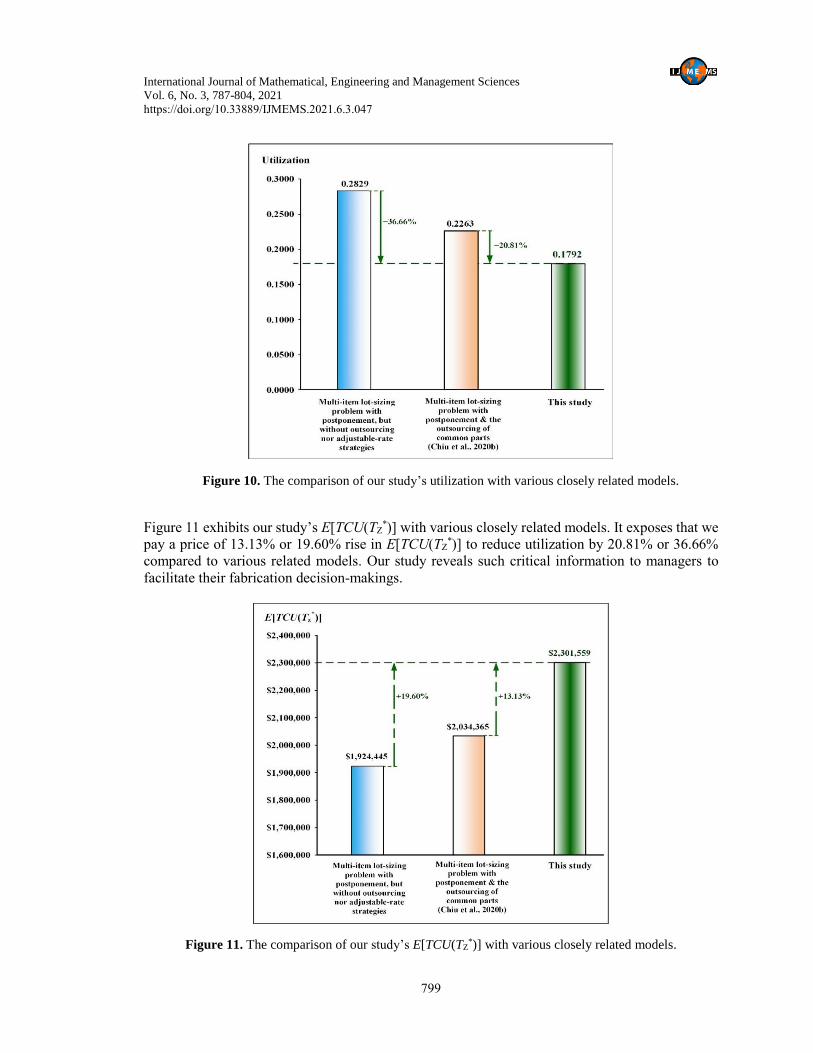
3.3 Comparisons with Various Closely Related Models
Figure 10 demonstrates the comparisons of our study’s utilization with diverse, closely related
models. Our model results in the lowest utilization (i.e., 0.1792) by implementing both outsourcing
and adjustable-rate strategies. It is 20.81% lower than a similar model with only outsourcing
strategy (Chiu et al., 2020b), and our utilization is 36.66% lower than a model without neither
outsourcing nor adjustable-rate strategies.
International Journal of Mathematical, Engineering and Management Sciences
Vol. 6, No. 3, 787-804, 2021
https://doi.org/10.33889/IJMEMS.2021.6.3.047
799
Figure 10. The comparison of our study’s utilization with various closely related models.
Figure 11 exhibits our study’s E[TCU(TZ*)] with various closely related models. It exposes that we
pay a price of 13.13% or 19.60% rise in E[TCU(TZ*)] to reduce utilization by 20.81% or 36.66%
compared to various related models. Our study reveals such critical information to managers to
facilitate their fabrication decision-makings.
Figure 11. The comparison of our study’s E[TCU(TZ*)] with various closely related models.
International Journal of Mathematical, Engineering and Management Sciences
Vol. 6, No. 3, 787-804, 2021
https://doi.org/10.33889/IJMEMS.2021.6.3.047
800
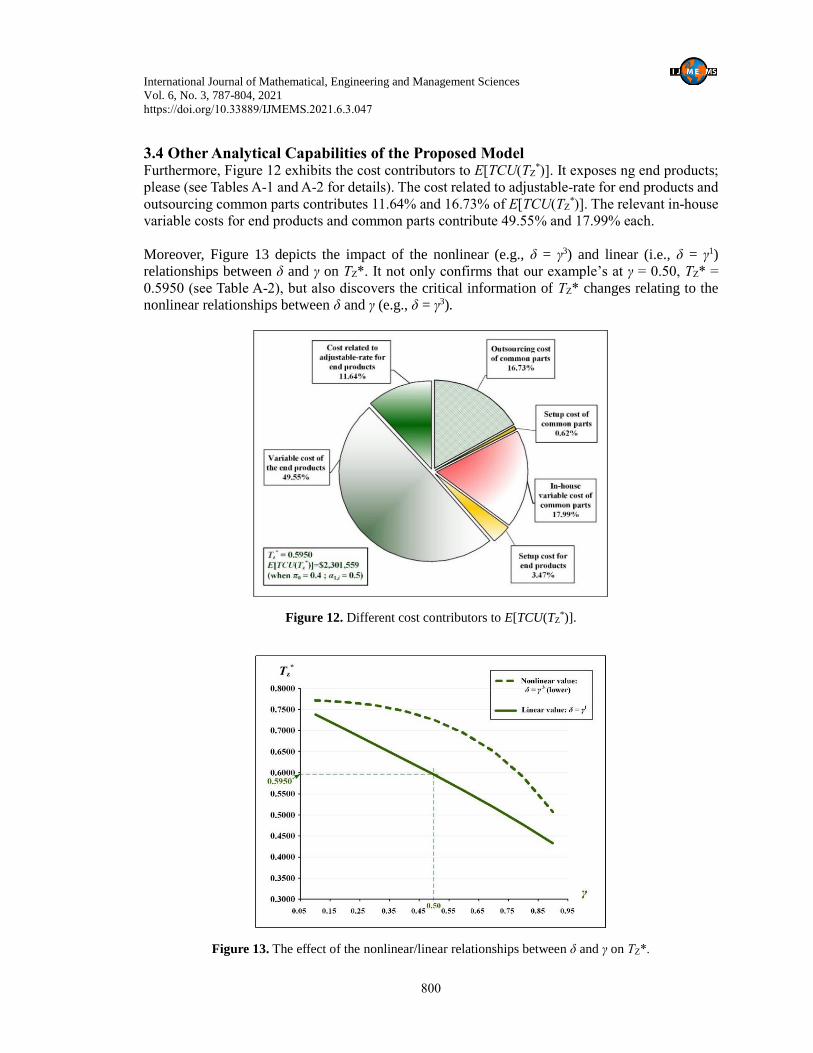
3.4 Other Analytical Capabilities of the Proposed Model Furthermore, Figure 12 exhibits the cost contributors to E[TCU(TZ
*)]. It exposes ng end products;
please (see Tables A-1 and A-2 for details). The cost related to adjustable-rate for end products and
outsourcing common parts contributes 11.64% and 16.73% of E[TCU(TZ*)]. The relevant in-house
variable costs for end products and common parts contribute 49.55% and 17.99% each.
Moreover, Figure 13 depicts the impact of the nonlinear (e.g., δ = γ3) and linear (i.e., δ = γ1)
relationships between δ and γ on TZ*. It not only confirms that our example’s at γ = 0.50, TZ* =
0.5950 (see Table A-2), but also discovers the critical information of TZ* changes relating to the
nonlinear relationships between δ and γ (e.g., δ = γ3).
Figure 12. Different cost contributors to E[TCU(TZ*)].
Figure 13. The effect of the nonlinear/linear relationships between δ and γ on TZ*.
International Journal of Mathematical, Engineering and Management Sciences
Vol. 6, No. 3, 787-804, 2021
https://doi.org/10.33889/IJMEMS.2021.6.3.047
801
4. Conclusions This work investigates a multi-item production lot-size problem incorporating postponement, the
external source for common parts, and adjustable-rate for end products. We proposed a two-stage
postponement scheme and built a model to explicitly characterize the problem’s features, including
an external common-part source and an end-product adjustable rate. The objective is to help
managers make a cost-effective lot-size decision and allow manufacturers to gain competitive
advantages. We use the mathematical analysis and optimization methods to prove the problem’s
total cost function’s convexity and derive the optimal rotation cycle time (see Section two). A
numerical illustration is used to validate the obtained result’s capability and applicability. It reveals
the combined/individual impact of variations in cycle length, outsourcing portion, common part’s
completion rate, and expedited-rate factor on the total fabrication related expenses, utilization, end
product’s variable cost, different cost contributors, and uptimes of stage one and stage two (refer
to Figures 4 to 9, and 12). We further compare our study’s utilization and system’s cost with closely
relating problems (refer to Figures 10 to 11). Furthermore, the nonlinear and linear relationships
between the common part’s value and completion rate are investigated (see Figure 13). Main
contributions of this study include (1) A decision-support model is now available to explore this
particular problem and determine the optimal rotation cycle. (2) The collective and individual
influence of dual uptime-reduction strategies on the problem’s operating policy and various
performance indexes is revealed to facilitate managerial decision-making. For future work,
combining the product quality relevant matters into the problem is a worth-investigated topic.
Conflict of Interest
The authors confirm that there is no conflict of interest to declare for this publication.
Acknowledgments
The authors appreciate the Ministry of Science and Technology of Taiwan for supporting this work (No. MOST 109-
2221-E-324-015).
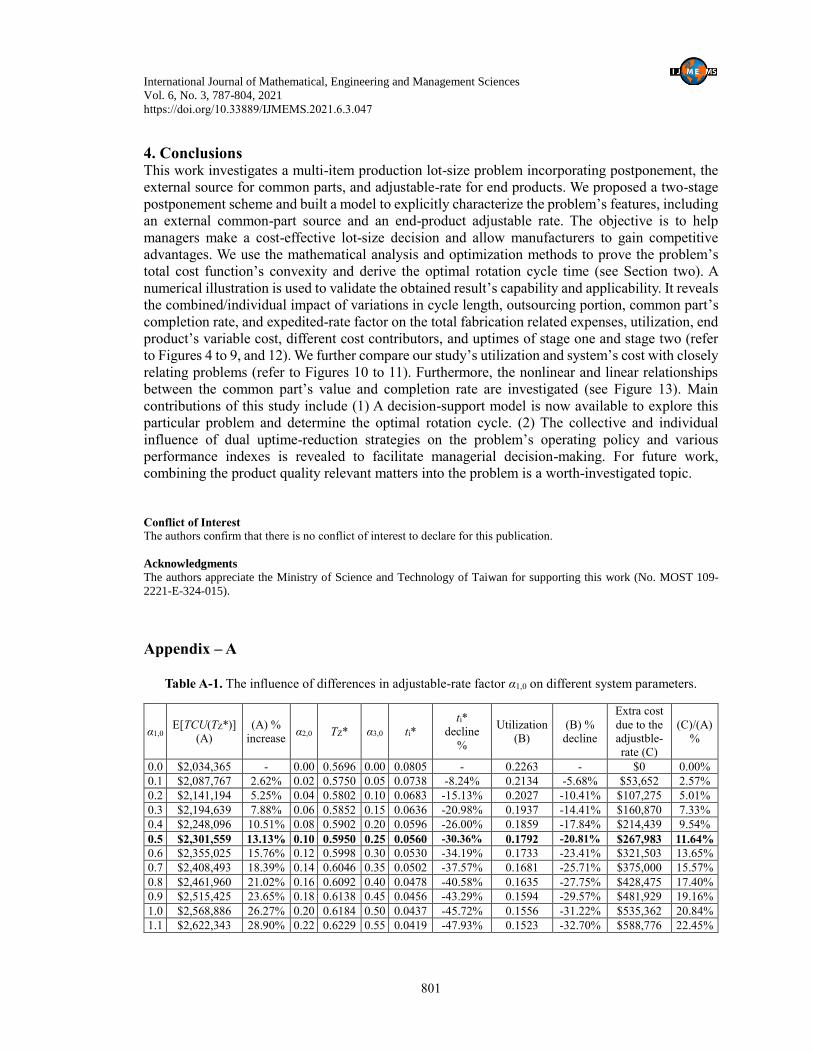
Appendix – A
Table A-1. The influence of differences in adjustable-rate factor α1,0 on different system parameters.
α1,0 E[TCU(TZ*)]
(A)
(A) %
increase α2,0 TZ* α3,0 ti*
ti*
decline
%
Utilization
(B)
(B) %
decline
Extra cost
due to the
adjustble-
rate (C)
(C)/(A)
%
0.0 $2,034,365 - 0.00 0.5696 0.00 0.0805 - 0.2263 - $0 0.00%
0.1 $2,087,767 2.62% 0.02 0.5750 0.05 0.0738 -8.24% 0.2134 -5.68% $53,652 2.57%
0.2 $2,141,194 5.25% 0.04 0.5802 0.10 0.0683 -15.13% 0.2027 -10.41% $107,275 5.01%
0.3 $2,194,639 7.88% 0.06 0.5852 0.15 0.0636 -20.98% 0.1937 -14.41% $160,870 7.33%
0.4 $2,248,096 10.51% 0.08 0.5902 0.20 0.0596 -26.00% 0.1859 -17.84% $214,439 9.54%
0.5 $2,301,559 13.13% 0.10 0.5950 0.25 0.0560 -30.36% 0.1792 -20.81% $267,983 11.64%
0.6 $2,355,025 15.76% 0.12 0.5998 0.30 0.0530 -34.19% 0.1733 -23.41% $321,503 13.65%
0.7 $2,408,493 18.39% 0.14 0.6046 0.35 0.0502 -37.57% 0.1681 -25.71% $375,000 15.57%
0.8 $2,461,960 21.02% 0.16 0.6092 0.40 0.0478 -40.58% 0.1635 -27.75% $428,475 17.40%
0.9 $2,515,425 23.65% 0.18 0.6138 0.45 0.0456 -43.29% 0.1594 -29.57% $481,929 19.16%
1.0 $2,568,886 26.27% 0.20 0.6184 0.50 0.0437 -45.72% 0.1556 -31.22% $535,362 20.84%
1.1 $2,622,343 28.90% 0.22 0.6229 0.55 0.0419 -47.93% 0.1523 -32.70% $588,776 22.45%
International Journal of Mathematical, Engineering and Management Sciences
Vol. 6, No. 3, 787-804, 2021
https://doi.org/10.33889/IJMEMS.2021.6.3.047
802
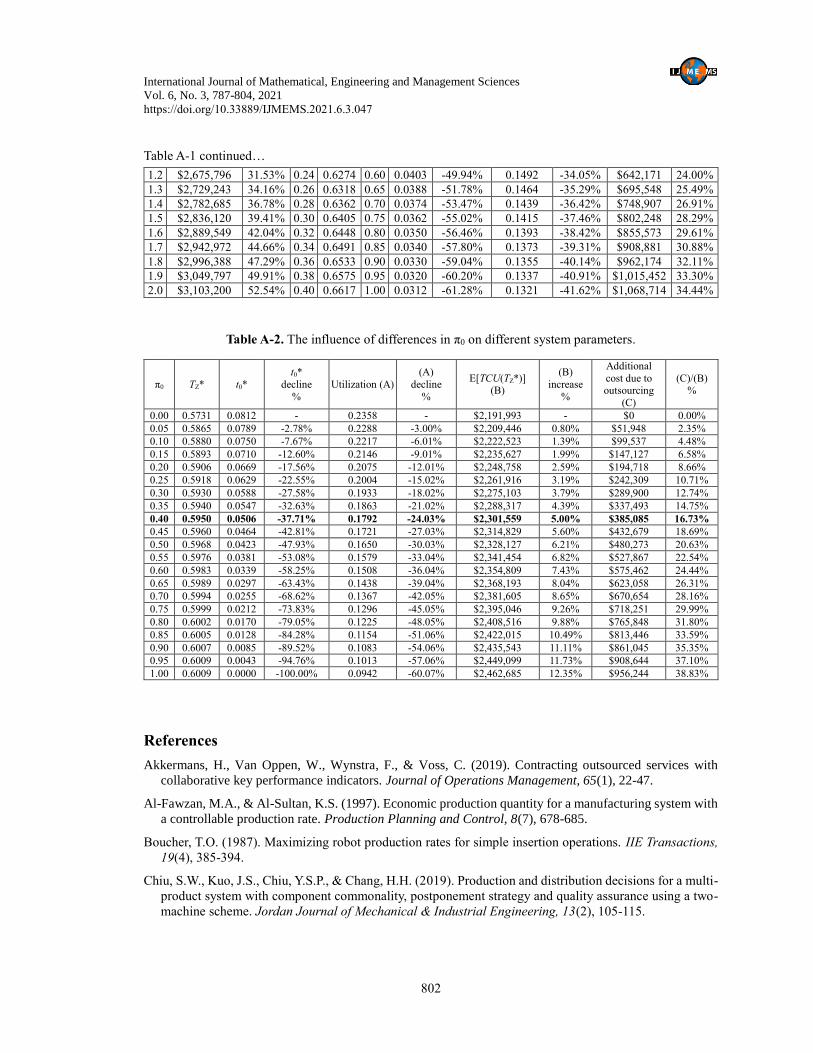
Table A-1 continued…
1.2 $2,675,796 31.53% 0.24 0.6274 0.60 0.0403 -49.94% 0.1492 -34.05% $642,171 24.00%
1.3 $2,729,243 34.16% 0.26 0.6318 0.65 0.0388 -51.78% 0.1464 -35.29% $695,548 25.49%
1.4 $2,782,685 36.78% 0.28 0.6362 0.70 0.0374 -53.47% 0.1439 -36.42% $748,907 26.91%
1.5 $2,836,120 39.41% 0.30 0.6405 0.75 0.0362 -55.02% 0.1415 -37.46% $802,248 28.29%
1.6 $2,889,549 42.04% 0.32 0.6448 0.80 0.0350 -56.46% 0.1393 -38.42% $855,573 29.61%
1.7 $2,942,972 44.66% 0.34 0.6491 0.85 0.0340 -57.80% 0.1373 -39.31% $908,881 30.88%
1.8 $2,996,388 47.29% 0.36 0.6533 0.90 0.0330 -59.04% 0.1355 -40.14% $962,174 32.11%
1.9 $3,049,797 49.91% 0.38 0.6575 0.95 0.0320 -60.20% 0.1337 -40.91% $1,015,452 33.30%
2.0 $3,103,200 52.54% 0.40 0.6617 1.00 0.0312 -61.28% 0.1321 -41.62% $1,068,714 34.44%
Table A-2. The influence of differences in π0 on different system parameters.
π0 TZ* t0*
t0*
decline
%
Utilization (A)
(A)
decline
%
E[TCU(TZ*)] (B)
(B)
increase
%
Additional
cost due to outsourcing
(C)
(C)/(B) %
0.00 0.5731 0.0812 - 0.2358 - $2,191,993 - $0 0.00%
0.05 0.5865 0.0789 -2.78% 0.2288 -3.00% $2,209,446 0.80% $51,948 2.35%
0.10 0.5880 0.0750 -7.67% 0.2217 -6.01% $2,222,523 1.39% $99,537 4.48%
0.15 0.5893 0.0710 -12.60% 0.2146 -9.01% $2,235,627 1.99% $147,127 6.58%
0.20 0.5906 0.0669 -17.56% 0.2075 -12.01% $2,248,758 2.59% $194,718 8.66%
0.25 0.5918 0.0629 -22.55% 0.2004 -15.02% $2,261,916 3.19% $242,309 10.71%
0.30 0.5930 0.0588 -27.58% 0.1933 -18.02% $2,275,103 3.79% $289,900 12.74%
0.35 0.5940 0.0547 -32.63% 0.1863 -21.02% $2,288,317 4.39% $337,493 14.75%
0.40 0.5950 0.0506 -37.71% 0.1792 -24.03% $2,301,559 5.00% $385,085 16.73%
0.45 0.5960 0.0464 -42.81% 0.1721 -27.03% $2,314,829 5.60% $432,679 18.69%
0.50 0.5968 0.0423 -47.93% 0.1650 -30.03% $2,328,127 6.21% $480,273 20.63%
0.55 0.5976 0.0381 -53.08% 0.1579 -33.04% $2,341,454 6.82% $527,867 22.54%
0.60 0.5983 0.0339 -58.25% 0.1508 -36.04% $2,354,809 7.43% $575,462 24.44%
0.65 0.5989 0.0297 -63.43% 0.1438 -39.04% $2,368,193 8.04% $623,058 26.31%
0.70 0.5994 0.0255 -68.62% 0.1367 -42.05% $2,381,605 8.65% $670,654 28.16%
0.75 0.5999 0.0212 -73.83% 0.1296 -45.05% $2,395,046 9.26% $718,251 29.99%
0.80 0.6002 0.0170 -79.05% 0.1225 -48.05% $2,408,516 9.88% $765,848 31.80%
0.85 0.6005 0.0128 -84.28% 0.1154 -51.06% $2,422,015 10.49% $813,446 33.59%
0.90 0.6007 0.0085 -89.52% 0.1083 -54.06% $2,435,543 11.11% $861,045 35.35%
0.95 0.6009 0.0043 -94.76% 0.1013 -57.06% $2,449,099 11.73% $908,644 37.10%
1.00 0.6009 0.0000 -100.00% 0.0942 -60.07% $2,462,685 12.35% $956,244 38.83%
References
Akkermans, H., Van Oppen, W., Wynstra, F., & Voss, C. (2019). Contracting outsourced services with
collaborative key performance indicators. Journal of Operations Management, 65(1), 22-47.
Al-Fawzan, M.A., & Al-Sultan, K.S. (1997). Economic production quantity for a manufacturing system with
a controllable production rate. Production Planning and Control, 8(7), 678-685.
Boucher, T.O. (1987). Maximizing robot production rates for simple insertion operations. IIE Transactions,
19(4), 385-394.
Chiu, S.W., Kuo, J.S., Chiu, Y.S.P., & Chang, H.H. (2019). Production and distribution decisions for a multi-
product system with component commonality, postponement strategy and quality assurance using a two-
machine scheme. Jordan Journal of Mechanical & Industrial Engineering, 13(2), 105-115.
International Journal of Mathematical, Engineering and Management Sciences
Vol. 6, No. 3, 787-804, 2021
https://doi.org/10.33889/IJMEMS.2021.6.3.047
803
Chiu, S.W., Zhao, Z.Y., Chiu, T., & Chiu, Y.S.P. (2020b). Combining the delayed differentiation policy and
common parts’ partial outsourcing strategy into a multi-item FPR-based system. Journal of Applied
Engineering Science, 18(2), 273-280.
Chiu, Y.S.P., Jhan, J.H., Chiu, V., & Chiu, S.W. (2020d). Fabrication cycle time and shipment decision for
a multiproduct intra-supply chain system with external source and scrap. International Journal of
Mathematical, Engineering and Management Sciences, 5(4), 614-630.
Chiu, Y.S.P., Lin, H.D., & Wu, H.Y. (2020a). Note on cost minimization for a multi-product fabrication-
distribution problem with commonality, postponement and quality assurance. Journal of Applied Research
and Technology, 18(1), 21-26.
Chiu, Y.S.P., Zhao, Z.Y., Chiu, S.W., & Chiu, V. (2020c). A vendor-buyer coordinated system featuring an
unreliable machine, scrap, outsourcing, and multiple shipments. International Journal of Industrial
Engineering Computations, 11(3), 341-358.
Daugherty, P.J., & Dröge, C. (1997). Organizational structure in divisionalized manufacturers: the potential
for outsourcing logistical services. International Journal of Physical Distribution & Logistics
Management, 27(5/6), 337-349.
Demić, M., Rakićević, B., Jovanović, M., & Miličić, B. (2020). Research into truck transmission torsion
vibrations under longitudinal acceleration. Journal of Applied Engineering Science, 18(2), 243-250.
Elahi, E. (2013). Outsourcing through competition: what is the best competition parameter? International
Journal of Production Economics, 144(1), 370-382.
Fathallah, B.B., Saidi, R., Dakhli, C., Belhadi, S., & Yallese, M.A. (2019). Mathematical modelling and
optimization of surface quality and productivity in turning process of aisi 12L14 free-cutting steel.
International Journal of Industrial Engineering Computations, 10(4), 557-576.
Gerchak, Y., & Henig, M. (1986). An inventory model with component commonality. Operations Research
Letters, 5(3), 157-160.
Gharbi, A., Kenné, J.P., & Hajji, A. (2006). Operational level-based policies in production rate control of
unreliable manufacturing systems with set-ups. International Journal of Production Research, 44(3), 545-
567.
Glock, C.H., & Grosse, E.H. (2021). The impact of controllable production rates on the performance of
inventory systems: a systematic review of the literature. European Journal of Operational Research,
288(3), 703-720.
İnkaya, T., Armbruster, D., Li, H., & Kempf, K.G. (2018). Product variety strategies for vertically
differentiated products in a two-stage supply chain. International Journal of Production Research, 56(17),
5930-5944.
Iqbal, J., Ahmad, R.B., Khan, M., Fazal-E-Amin, Alyahya, S., Nasir, M.H.N., Akhunzada, A., & Shoaib, M.
(2020). Requirements engineering issues causing software development outsourcing failure. PLoS ONE,
15(4), Art. No. e0229785.
Jabbarzadeh, A., Haughton, M., & Pourmehdi, F. (2019). A robust optimization model for efficient and green
supply chain planning with postponement strategy. International Journal of Production Economics, 214,
266-283.
Le Pape, N., & Wang, Y. (2020). Can product differentiation mitigate conflicts of interest between principal
stakeholders? A cournot-bertrand comparison. Economic Modelling, 91, 341-346.
Lee-Mortimer, A. (2006). Improved product design as an alternative to outsourcing manufacture and
assembly. Assembly Automation, 26(2), 121-126.
International Journal of Mathematical, Engineering and Management Sciences
Vol. 6, No. 3, 787-804, 2021
https://doi.org/10.33889/IJMEMS.2021.6.3.047
804
Lesmono, D., Limansyah, T., & Loedy, N. (2020). A joint return policy for a multi-item perishable inventory
model with deterministic demands, return and all-units discount. International Journal of Mathematical,
Engineering and Management Sciences, 5(3), 416-431.
Lin, H.D., Chen, Y.R., Chiu, V., & Chiu, Y.S.P. (2019). A decision model for a quality-assured EPQ-based
intra-supply chain system considering overtime option. Journal of Applied Engineering Science, 17(3),
362-371.
Moin, C.J., Iqbal, M., Malek, A.B.M.A., & Haque, R. (2020). Time-based process mapping for lead time
compression in the apparel supply chain: a case study. International Journal of Mathematical,
Engineering and Management Sciences, 5(1), 96-107.
Nahmias, S. (2009). Production and operations analysis. McGraw-Hill Co. Inc., New York.
Sajadieh, M.S., Larsen, C. (2015). A coordinated manufacturer-retailer model under stochastic demand and
production rate. International Journal of Production Economics, 168, 64-70.
Schulze, L., & Li, L. (2009). A logistics network model for postponement supply chain. International Journal
of Applied Mathematics, 39 (2).
Van Mieghem, J.A., & Dada, M. (1999). Price versus production postponement: capacity and competition.
Management Science, 45(12), 1631-1649.
Wu, J., Du, G., & Jiao, R.J. (2021). Optimal postponement contracting decisions in crowdsourced
manufacturing: a three-level game-theoretic model for product family architecting considering
subcontracting. European Journal of Operational Research, 291(2), 722-737.
Yadavalli, V.S.S., Udayabaskaran, S., Dora Pravina, C.T., & Sreelakshmi, S. (2020). A two-stage mutation
stochastic model of carcinogenesis driven by a two level random environment. International Journal of
Mathematical, Engineering and Management Sciences, 5(6), 1392-1408.
Original content of this work is copyright © International Journal of Mathematical, Engineering and Management Sciences. Uses
under the Creative Commons Attribution 4.0 International (CC BY 4.0) license at https://creativecommons.org/licenses/by/4.0/