Embed Size (px)
Citation preview
L a p o r a n S t a t i S t i kS t a t i S t i c R e p o R t
Laporan Statistik 2013Statistic Report 2013
laporan statistik 2013 PT Indonesia Power2
Laporan Statistik 2013 | 2013 Statistic Report
Java Bali System
ElEctricity Supply
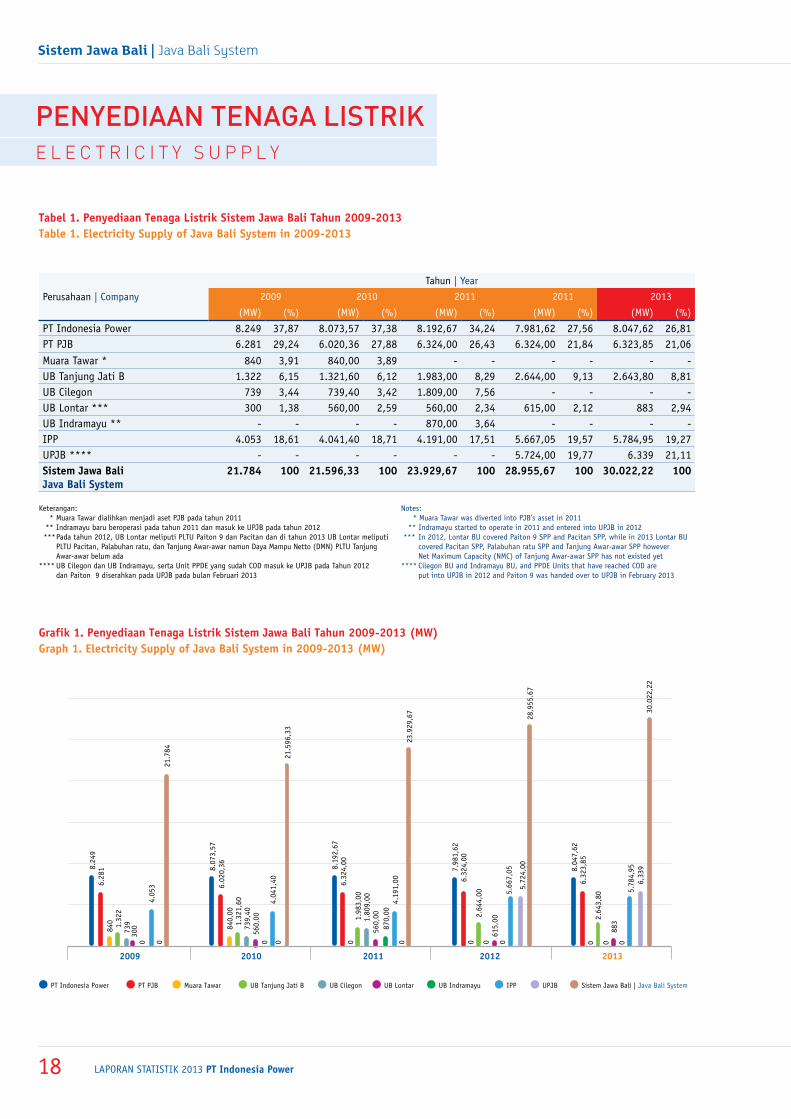
In 2013, the total of Java Bali System Electricity Supply (net maximum capacity) reached 30,022.22 MW, with details as follows: Indonesia Power by 26.81% (8,047.62 MW), PT PJB by 21.06% (6,323.85 MW), UPJB by 21.11% (6,339 MW), UB Tanjung Jati B by 8.81% (2,643.80 MW), UB Lontar by 2.94% (883 MW), and IPP by 19.27% (5,784.95 MW).
EnErgy tranSfErrEd
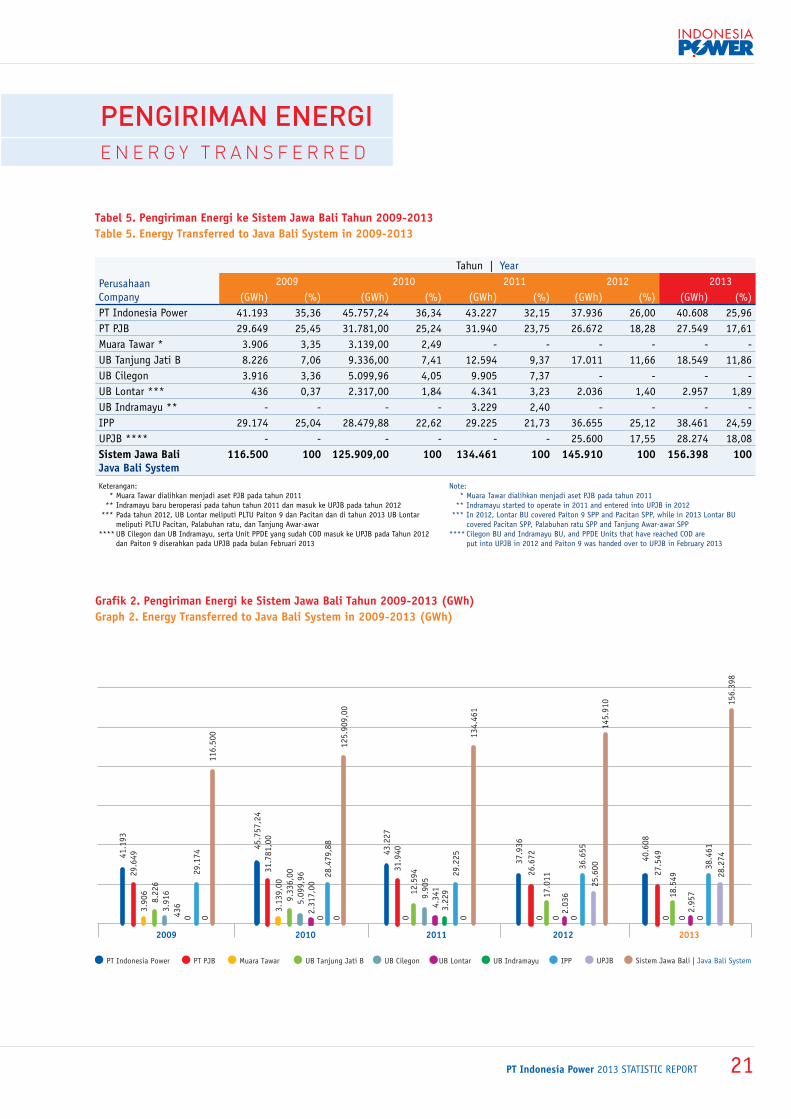
During 2013, total electricity transferred to Java Bali System reached 156,398 GWh, an increase of 7.19% compared to the previous year. Indonesia Power transferred 25.96% of it while PJB transferred 17.61%, UPJB transferred 18.08%, UB Tanjung Jati B transferred 11.86%, UB Lontar transferred 1.89% and IPP transferred 24.59%.
indonesia power
inStallEd capacity
The total of installed capacity of Indonesia Power through its 8 Generating Business Units (GBU) in 2013 for the grid and embedded Java Bali System reached 8,935.86 MW. The biggest installed capacity of Indonesia Power was Suralaya GBU by 3,400 MW (38.05%), followed by Semarang GBU by 1,408.93 MW (15.77%), Priok GBU by 1,348.08 MW (15.09%), Perak Grati GBU by 864.08 MW (9.67%),
Sistem Jawa Bali
pEnyEdiaan tEnaga liStrik
Pada Tahun 2013, total penyediaan tenaga listrik (daya mampu netto) untuk Sistem Jawa Bali mencapai 30.022,22 MW, dengan perincian: Indonesia Power sebesar 26,81% (8.047,62 MW), PT PJB sebesar 21,06% (6.323,85 MW), UPJB sebesar 21,11% (6.339 MW), UB Tanjung Jati B sebesar 8,81% (2.643,80 MW), UB Lontar sebesar 2,94% (883 MW), dan IPP sebesar 19,27% (5.784,95 MW).
pEngiriman EnErgi
Selama tahun 2013, jumlah energi listrik yang dikirim ke Sistem Jawa Bali sebesar 156.398 GWh meningkat 7,19% dibandingkan tahun sebelumnya. Dari jumlah tersebut, 25,96% dikirim oleh Indonesia Power, 17,61% dikirim oleh PT PJB, 18,08% dikirim oleh UPJB, 11,86% dikirim oleh UB Tanjung Jati B, 1,89% dikirim oleh UB Lontar, dan 24,59% dikirim oleh IPP.
indonesia power
daya tErpaSang
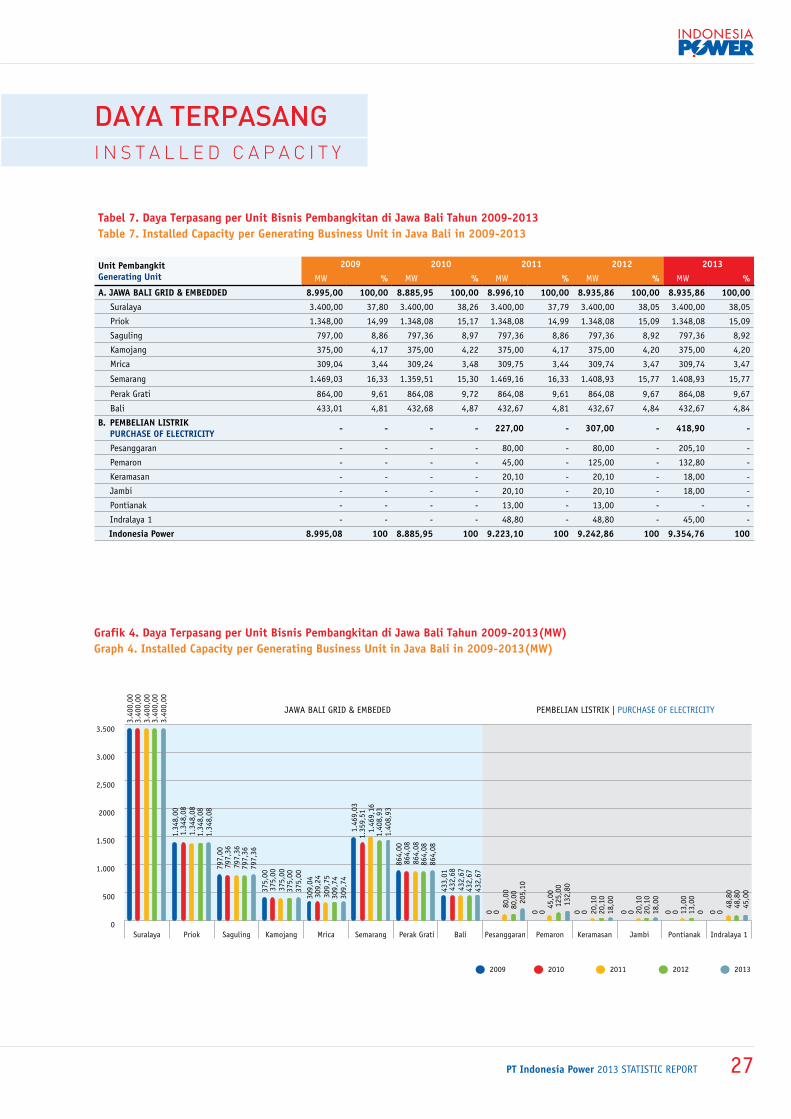
Jumlah daya terpasang Indonesia Power melalui 8 Unit Bisnis Pembangkitan (UBP) di tahun 2013 untuk Sistem Jawa Bali Grid dan Embedded sebesar 8.935,86 MW. Kapasitas terpasang terbesar milik Indonesia Power adalah UBP Suralaya dengan kapasitas terpasang 3.400 MW (38,05%), kemudian UBP Semarang sebesar 1.408,93 MW (15,77%), UBP Priok sebesar 1.348,08 MW (15,09%) UBP Perak
RingkasanS u m m a R y

PT Indonesia Power 2013 statistic report 3
Grati sebesar 864,08 MW (9,67%), UBP Saguling sebesar 797,36 MW (8,92%), UBP Bali 432,67 MW (4,84%), UBP Kamojang sebesar 375 MW (4,20%), dan UBP Mrica sebesar 309,74 MW (3,47%). Selain itu, sebagai fungsi pendukung Indonesia Power juga memiliki pembangkit di sebagian wilayah Sumatera serta melakukan pembelian listrik di Bali dengan total kapasitas terpasang sebesar 418,90 MW.
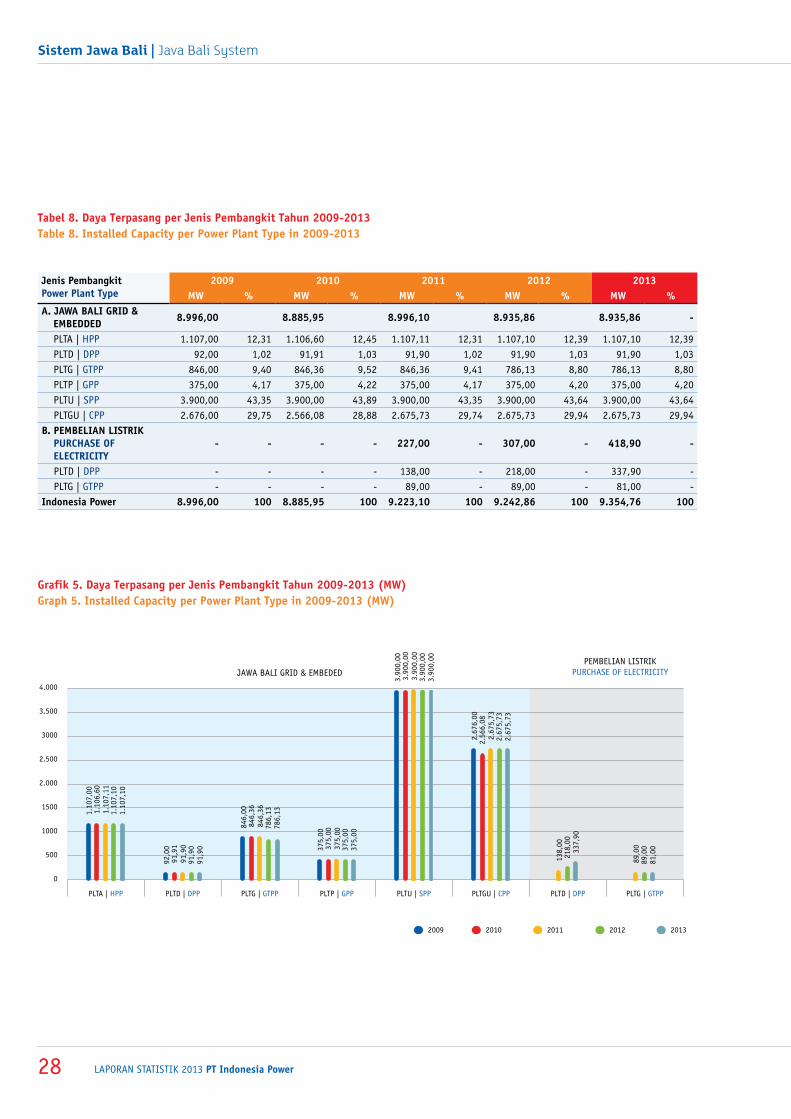
Untuk per jenis pembangkit kapasitas terpasang terbesar di Sistem Jawa Bali Grid dan Embedded adalah PLTU sebesar 3.900 MW (43,64%) kemudian PLTGU sebesar 2.675,73 MW (29,94%), PLTA sebesar 1.107,10 MW (12,39%), PLTG sebesar 786,13 MW (8,80%), PLTP sebesar 375 MW (4,20%) dan PLTD sebesar 91,90 MW (1,03%).
produkSi
Selama tahun 2013 melalui 8 UBP di sistem Jawa Bali Grid dan Embedded, Indonesia Power telah memproduksi energi listrik sebanyak 40.685,85 GWh meningkat 6,76% dari tahun sebelumnya. Produksi listrik terbesar dihasilkan oleh UBP Suralaya sebesar 23.911,17 GWh, kemudian UBP Priok sebesar 4.181,66 GWh, UBP Perak Grati sebesar 3.473,18 GWh, UBP Kamojang sebesar 2.970,89 GWh, UBP Saguling sebesar 3.579,04 GWh, UBP Bali sebesar 1.454,16 GWh, UBP Mrica sebesar 990,41 GWh dan UBP Semarang sebesar 125,34 GWh.
Sedangkan realisasi produksi dari pembangkit di sebagian wilayah Sumatera serta pembelian listrik di Bali adalah sebesar 1.938,32 GWh.
Sehingga total produksi listrik yang dihasilkan Indonesia Power tahun 2013 adalah sebesar 42.624,17 GWh.
Saguling GBU by 797.36 MW (8.92%), Bali GBU 432.67 MW (4.84%), Kamojang GBU by 375 MW (4.20%), and Mrica GBU by 309.74 MW (3.47%). Furthermore, as its supporting function, Indonesia Power also has power plants in greater Sumatra and carried out purchase of electricity in Bali with the total of installed capacity of 418.90 MW.
Based on power plant type, the biggest installed capacity in Grid and Embedded Java Bali System is SPP by 3,900 MW (43.64%) then CPP by 2,675.73 MW (29.94%), HPP by 1,107.10 MW (12.39%), GTPP by 786.13 MW (8.80%), GPP by 375 MW (4.20%) and DPP by 91.90 MW (1.03%).
production
In 2013, through its 8 GBUs in Grid and Embedded Java Bali System, Indonesia Power has produced electricity by 40,685.85 GWh, an increase of 6.76% compared to the previous year. The biggest electricity production was produced by Suralaya GBU by 23,911.17 GWh, followed by Priok GBU by 4,181.66 GWh, Perak Grati GBU by 3,473.18 GWh, Kamojang GBU by 2,970.89 GWh, Saguling GBU by 3,579.04 GWh, Bali GBU by 1,454.16 GWh, Mrica GBU by 990.41 GWh and Semarang GBU by 125.34 GWh.
Meanwhile, production realization from power plants in greater Sumatra and the purchase of electricity in Bali was amounted to 1,938.32 GWh.
So that the total electricity production of Indonesia Power in 2013 was amounted to 42,624.17 GWh.
laporan statistik 2013 PT Indonesia Power4
Laporan Statistik 2013 | 2013 Statistic Report
Based on power plant type in Grid and Embedded Java Bali System, SPP has attained the biggest production by 23,911.88 GWh, followed by CPP by 7,448.58 GWh, HPP by 4,569.45 GWh, GPP by 2,970.89 GWh, GTPP by 1,718.82 GWh, and DPP by 66.24 GWh.
SalES
The electricity distributed by Indonesia Power to Grid and Embedded Java Bali System in 2013 by 38,986.88 GWh. Suralaya GBU has distributed the largest electricity by 22,589.85 GWh, followed by Priok GBU by 4,081.36 GWh, Perak Grati GBU by 3,388.74 GWh, Kamojang GBU by 2,839.92 GWh, Saguling GBU by 3,571.18 GWh, Bali GBU by 1,435.14 GWh, Mrica GBU by 976.11 GWh and Semarang GBU by 104.57 GWh. While sales realization from power plants in greater Sumatra and the purchase of electricity in Bali was amounted to 1,930.50 GWh.
Therefore, the total sales of electricity produced by Indonesia Power in 2013 was 40,917.38 GWh.
Based on power plant type in Grid and Embedded Java Bali System, SPP has attained the biggest sales by 22,581.31 GWh, followed by CPP by 7,275.50 GWh, HPP by 4,547.30 GWh, GPP by 2,839.92 GWh, GTPP by 1,683.01 GWh, and DPP by 59.75 GWh.
Self consumption
The self consumption of Indonesia Power electricity in 2013 attained 1,698.97 GWh (4.18%), a decrease of 4.09% compared to the previous year. Suralaya GBU was the largest self consumer by 1,321.32 GWh (5.53%), followed by Kamojang GBU by 130.98 GWh (4.41%), Priok GBU by 100.30 GWh (2.40%), Perak Grati GBU by 84.43 GWh (2.43%), Semarang GBU by 20.77 GWh (16.57%), Bali GBU by 19.02 GWh (1.31%), Mrica GBU by 14.30 GWh (1.44%) and Saguling GBU by 7.86 GWh (0.22%).
fuEl conSumption
In 2013, the consumption of HSD and MFO decreased, while the consumption of coal and gas increased. The consumption of MFO reached 132,096.78 kilolitres, a decrease of 33.60% and the consumption of HSD reached 915,700.03 kilolitres, a decreased of 11.88% and the coal consumption reached 12,147,717.11 tons an increase of 9.70% and the consumption of gas reached 65,226,077.55 MMBTU, an increase of 13.15%.
Berdasarkan jenis pembangkit di sistem Jawa Bali Grid dan Embedded, PLTU mencapai produksi tertinggi sebesar 23.911,88 GWh, kemudian PLTGU sebesar 7.448,58 GWh, PLTA sebesar 4.569,45 GWh, PLTP sebesar 2.970,89 GWh, PLTG sebesar 1.718,82 GWh, dan PLTD sebesar 66,24 GWh.
pEnJualan
Energi listrik yang telah disalurkan Indonesia Power ke Sistem Jawa Bali Grid and Embedded selama tahun 2013 sebanyak 38.986,88 GWh. UBP Suralaya menyalurkan energi terbesar sebanyak 22.589,85 GWh, UBP Priok sebesar 4.081,36 GWh, UBP Perak Grati sebesar 3.388,74 GWh, UBP Kamojang sebesar 2.839,92 GWh, UBP Saguling sebesar 3.571,18 GWh, UBP Bali sebesar 1.435,14 GWh, UBP Mrica sebesar 976,11 GWh dan UBP Semarang sebesar 104,57 GWh.
Sedangkan realisasi penjualan dari pembangkit di sebagian wilayah Sumatera serta pembelian listrik di Bali adalah sebesar 1.930,50 GWh.
Sehingga total penjualan energi listrik yang dihasilkan Indonesia Power tahun 2013 adalah sebesar 40.917,38 GWh.
Berdasarkan jenis pembangkit di sistem Jawa Bali Grid dan Embedded, PLTU mencapai penjualan tertinggi sebesar 22.581,31 GWh, kemudian PLTGU sebesar 7.275,50 GWh, PLTA sebesar 4.547,30 GWh, PLTP sebesar 2.839,92 GWh, PLTG sebesar 1.683,01 GWh, dan PLTD sebesar 59,75 GWh.
pemakaian Sendiri
Untuk jumlah pemakaian sendiri Indonesia Power di tahun 2013 sebesar 1.698,97 GWh (4,18%), menurun 4,09% dari tahun sebelumnya. UBP Suralaya adalah unit yang paling banyak mengkonsumsi energi listrik untuk pemakaian sendiri yaitu sebesar 1.321,32 GWh (5,53%), kemudian UBP Kamojang sebesar 130,98 GWh (4,41%), UBP Priok sebesar 100,30 GWh (2,40%), UBP Perak Grati sebesar 84,43 GWh (2,43%), UBP Semarang sebesar 20,77 GWh (16,57%), UBP Bali sebesar 19,02 GWh (1,31%), UBP Mrica sebesar 14,30 GWh (1,44%) dan UBP Saguling sebesar 7,86 GWh (0,22%).
pEmakaian Bahan Bakar
Selama tahun 2013 terjadi penurunan pemakaian jenis bahan bakar HSD dan MFO, sedangkan pemakaian jenis bahan bakar batubara dan gas terjadi kenaikan. Untuk pemakaian jenis MFO sebesar 132.096,78 kiloliter, turun 33,60% dan pemakaian HSD sebesar 915.700,03 kiloliter, turun 11,88%. Untuk pemakaian batubara mencapai 12.147.717,11 ton atau naik 9,70% dan pemakaian gas mencapai 65.226.077,55 MMBTU atau naik 13,15%.
PT Indonesia Power 2013 statistic report 5
pErformancE
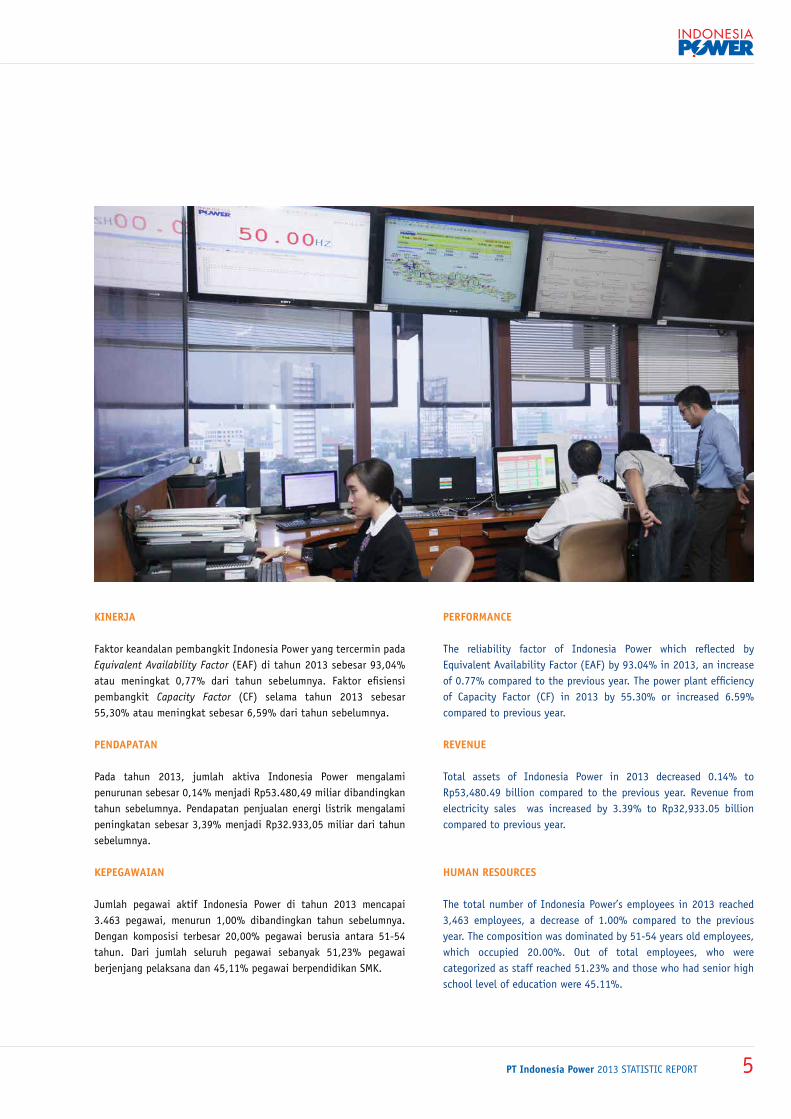
The reliability factor of Indonesia Power which reflected by Equivalent Availability Factor (EAF) by 93.04% in 2013, an increase of 0.77% compared to the previous year. The power plant efficiency of Capacity Factor (CF) in 2013 by 55.30% or increased 6.59% compared to previous year.
rEvEnuE
Total assets of Indonesia Power in 2013 decreased 0.14% to Rp53,480.49 billion compared to the previous year. Revenue from electricity sales was increased by 3.39% to Rp32,933.05 billion compared to previous year.
human rESourcES
The total number of Indonesia Power’s employees in 2013 reached 3,463 employees, a decrease of 1.00% compared to the previous year. The composition was dominated by 51-54 years old employees, which occupied 20.00%. Out of total employees, who were categorized as staff reached 51.23% and those who had senior high school level of education were 45.11%.
kinErJa
Faktor keandalan pembangkit Indonesia Power yang tercermin pada Equivalent Availability Factor (EAF) di tahun 2013 sebesar 93,04% atau meningkat 0,77% dari tahun sebelumnya. Faktor efisiensi pembangkit Capacity Factor (CF) selama tahun 2013 sebesar 55,30% atau meningkat sebesar 6,59% dari tahun sebelumnya.
pEndapatan
Pada tahun 2013, jumlah aktiva Indonesia Power mengalami penurunan sebesar 0,14% menjadi Rp53.480,49 miliar dibandingkan tahun sebelumnya. Pendapatan penjualan energi listrik mengalami peningkatan sebesar 3,39% menjadi Rp32.933,05 miliar dari tahun sebelumnya.
kEpEgawaian
Jumlah pegawai aktif Indonesia Power di tahun 2013 mencapai 3.463 pegawai, menurun 1,00% dibandingkan tahun sebelumnya. Dengan komposisi terbesar 20,00% pegawai berusia antara 51-54 tahun. Dari jumlah seluruh pegawai sebanyak 51,23% pegawai berjenjang pelaksana dan 45,11% pegawai berpendidikan SMK.
laporan statistik 2013 PT Indonesia Power6
Laporan Statistik 2013 | 2013 Statistic Report
Direktur Utama | President Director
Supangkat iwan Santoso
Indonesia Power publishes the 2013 Statistic Book, which is continuous edition from the previous year. Data is classified based on Business Unit Report, Consolidated Report of Indonesia Power and PT PLN Penyaluran dan Pusat Pengaturan Beban Jawa Bali (PLN P3BJB). Statistic Book provides information about Indonesia Power’s performance in several areas, i.e. Electricity Supply, Sales, Finance and Human Resource in 2013 and its development during the last 5 year. Statistical data presented in the from of graphs and tables are broken down by business unit and plant types. Statistic Book of Indonesia Power in 2013 consisted of two parts:
1. The electrical system of Java Bali; electricity supply and energy production of PT Indonesia Power, PT Pembangkit Jawa Bali, Tanjung Jati B, Lontar, UPJB and Independent Power Producers.
2. Performance of Indonesia Power; Power Plant, Sales, Finance and Human Resources Performance.
Hopefully this book will provide any information you need. We look forward for your feedback and critics in order to make this book better in the future.
PT Indonesia Power tahun ini menerbitkan Buku Statistik Indonesia Power Tahun 2013 yang merupakan penerbitan lanjutan dari buku statistik tahun sebelumnya. Data pada buku ini disusun berdasarkan hasil data laporan Unit Bisnis, konsolidasi laporan Kantor Pusat Indonesia Power dan PLN Penyaluran dan Pusat Pengaturan Beban Jawa Bali (PLN P3BJB). Buku ini dimaksudkan untuk memberikan informasi mengenai hasil kerja perusahaan di bidang Perusahaan Pembangkit, Niaga, Keuangan, dan SDM tahun 2013 dan perkembangannya selama 5 tahun terakhir. Data statistik dalam bentuk grafik dan tabel yang dirinci berdasarkan satuan unit bisnis dan jenis pembangkit. Isi Buku Statistik Indonesia Power 2013 terdiri atas dua bagian:
1. Sistem kelistrikan Jawa Bali, yaitu data penyediaan tenaga listrik dan produksi energi listrik PT Indonesia Power, PT Pembangkit Jawa Bali, Tanjung Jati B, Lontar, UPJB dan Penyedia Listrik Swasta.
2. Kinerja PT Indonesia Power yang terdiri dari Data Perusahaan Pembangkit, Niaga, Keuangan dan Kepegawaian.
Kami sangat mengharapkan saran dan kritik yang membangun dari para pembaca untuk meningkatkan buku statistik PT Indonesia Power berikutnya.
kata PengantaRf o R e w o R d
PT Indonesia Power 2013 statistic report 7
nama pEruSahaanPT Indonesia Power
Bidang uSahaPenyediaan tenaga listrik
kompoSiSi pEmEgang Sahama. PT PLN (Persero) sebanyak 1 lembar saham seri 1 dan
5.215.647.598 lembar saham seri 2b. Yayasan Pendidikan dan Kesejahteraan PT PLN (Persero) sebanyak
1 lembar saham seri 2
tanggal pEndirian3 Oktober 1995
daSar hukum pEndiriana. Akte Pendirian PT PLN Pembangkitan Tenaga Listrik Jawa-Bali I
(PT PLN PJB I) tanggal 3 Oktober 1995b. Akte Perubahan Nama dari PT PLN PJB I menjadi PT Indonesia
Power tanggal 8 Agustus 2000
modal daSarRp10.000.000.000.000 (sepuluh triliun rupiah)
modal ditEmpatkan dan tElah diSEtor pEnuhRp2.607.823.800.000 (dua triliun enam ratus tujuh miliar delapan ratus dua puluh tiga juta delapan ratus ribu rupiah)
kronologiS pEncatatan SahamIndonesia Power belum pernah mencatatkan saham di Bursa Efek Indonesia
kronologiS pEncatatan EfEk lainnyaIndonesia Power belum mencatatkan kepemilikan efek dan surat berbagai lainnya di Bursa Efek Indonesia
kantor puSatJl. Jenderal Gatot Subroto Kav. 18 Jakarta Selatan 12950Phone : (62-21) 526 7666 (Hunting)Faximile : (62-21) 525 1923, 525 2623E-mail : [email protected] : www.indonesiapower.co.id
corporation namEPT Indonesia Power
corE BuSinESSElectricity power service
compoSition of SharE holdErSa. PT PLN (Persero) owns 1 share series 1 and 5,215,647,598 shares
series 2b. Yayasan Pendidikan dan Kesejahteraan PT PLN (Persero) owns 1
shares series 2
datE of EStaBliShmEntOctober 3rd, 1995
EStaBliShmEnt lEgal BaSiSa. PT PLN Pembangkitan Tenaga Listrik Jawa-Bali I (PT PLN PJB I)
deed of establishment dated on October 3rd, 1995b. Change of name deed from PT PLN PJB I into PT Indonesia Power
dated on August 8th, 2000
authorizEd capitalRp10,000,000,000,000 (ten trillion rupiah)
capital iSSuEd and fully paidRp2,607,823,800,000 (two trillion, six hundred and seven billion eight hundred twenty three million eight hundred thousand rupiah)
chronological liSting SharESIndonesia Power has never been listed its shares on the Indonesia Stock Exchange
chronological liSting of othEr StockIndonesia Power has never listed the ownership of stocks and other securities in Indonesia Stock Exchange
hEad officEJl. Jenderal Gatot Subroto Kav.18 Jakarta Selatan 12950Phone : (62-21) 526 7666 (Hunting)Faximile : (62-21) 525 1923, 525 2623E-mail : [email protected] : www.indonesiapower.co.id
identitas PeRusahaanc o R p o R a t e i d e n t i t y
laporan statistik 2013 PT Indonesia Power8
Laporan Statistik 2013 | 2013 Statistic Report
PT Indonesia Power selanjutnya disebut “Indonesia Power” merupakan salah satu anak perusahaan PT PLN (Persero) yang didirikan pada tanggal 3 Oktober 1995 dengan nama PT PLN Pembangkitan Jawa-Bali I (PT PLN PJB I) melalui Surat Keputusan Menteri Kehakiman Republik Indonesia No. C2-12496-HT.01.01. Th.1995.
Pada tanggal 8 Agustus 2000 PT PJB I berganti nama menjadi PT Indonesia Power sebagai penegasan atas tujuan perusahaan yang menjadi perusahaan pembangkit tenaga listrik independen yang berorientasi bisnis murni. Indonesia Power merupakan perusahaan pembangkit tenaga listrik terbesar di Indonesia dengan kepemilikan saham sebanyak 1 lembar saham seri 1 dan 5.215.647.598 lembar saham seri 2 oleh PT PLN (Persero) dan sebanyak 1 lembar saham seri 2 oleh Yayasan Pendidikan dan Kesejahteraan PT PLN (Persero).
Dengan identitas baru, Indonesia Power mendeklarasikan visi dan misi yang terintegrasi dengan rencana baru untuk menjadi perusahaan publik dan meningkatkan diri menjadi pembangkit kelas dunia. Untuk mendukung terealisasinya keinginan tersebut, Indonesia Power dan seluruh unit bisnisnya telah berbenah diri melalui implementasi Indonesia Power-Integrated Management System (InPower IMS) yang mengintegrasikan berbagai standar antara lain ISO 14001 (Sistem Manajemen Lingkungan), ISO 9001 (Sistem Manajemen Mutu), OHSAS 18001, ISO 28001 (Security Management System for Supply Chain), PAS 55, Malcom Baldrige, SMP (Sistem Manajemen Pengamanan), dan SMK3 (Sistem Manajemen K3). Selain itu, Perusahaan telah memperoleh penghargaan di tingkat nasional dan internasional seperti Annual Report Award, Indonesia Sustainability Report Award, Vision Award, Spotlight Award, PROPER, dan Gelar Karya Pemberdayaan Masyarakat (GKPM) Award.
Indonesia Power memegang peran penting dalam mendukung tersedianya energi listrik di sistem Jawa Bali dengan mengoperasikan berbagai jenis pembangkit dengan total kapasitas terpasang sebesar 8.935,86 MW dan di sebagian wilayah Sumatera sebesar 81 MW. Indonesia Power juga melakukan pembelian listrik di Bali dengan kapasitas sebesar 337,90 MW. Sehingga total kapasitas yang dikelola oleh PT Indonesia Power adalah 9.354,76 MW.
PT Indonesia Power, hereinafter referred to as “Indonesia Power”, is one of the subsidiaries of PT PLN (Persero) which was established in October 3rd, 1995 and formerly known as PT PLN Pembangkitan Jawa-Bali I (PT PLN PJB I) as stipulated on the Minister of Justice of the Republic of Indonesia’s Decree No. C2-12496-HT.01.01. Th.1995.
In August 8th, 2000 PT PJB I changed its name to PT Indonesia Power to assert the Company’s goal, being an independent power company with purely business-oriented. Indonesia Power is the largest power plant in Indonesia with the share ownership that consist of 1 stock sheet series 1 and 5,215,647,598 stock sheets series 2 by PT PLN (Persero) and 1 stock sheet series 2 by Yayasan Pendidikan dan Kesejahteraan PT PLN (Persero).
With its new identity, Indonesia Power declared its vision and mission that integrated with the new plan to become public company and improved itself to be the world class power plant. In order to sustain the realization of its objectives, Indonesia Power and all of its business unit has been improving itself through Indonesia Power-Integrated Management System (InPower IMS) that integrates different standardsnamely ISO 14001 (Environmental Management System), ISO 9001 (Quality Management System), OHSAS 18001, ISO 28001 (Security Management System for Supply Chain), PAS 55, Malcom Baldrige, SMP (Security Management System), and SMK3 (OHS Management System). Furthermore, the Company has been awarded at the national and international level, such as Annual Report Award, Indonesia Sustainability Report Award, Vision Award, Spotlight Award, PROPER, and Creative Society Empowerment Award (GKPM) Award.
Indonesia Power plays an important role in providing electrical energy in Java Bali System by operating various types of power plant with total capacity installed reached to 8,935.86 MW and 81 MW in greater Sumatra. Indonesia Power also puchased electricity in Bali with the capacity of 337.90 MW. Therefore, the total capacity managed by PT Indonesia Power is 9,354.76 MW.
sejaRah singkat Pt indonesia PoweRp t i n d o n e S i a p o w e R i n B R i e f
PT Indonesia Power 2013 statistic report 9
laporan statistik 2013 PT Indonesia Power10
Laporan Statistik 2013 | 2013 Statistic Report
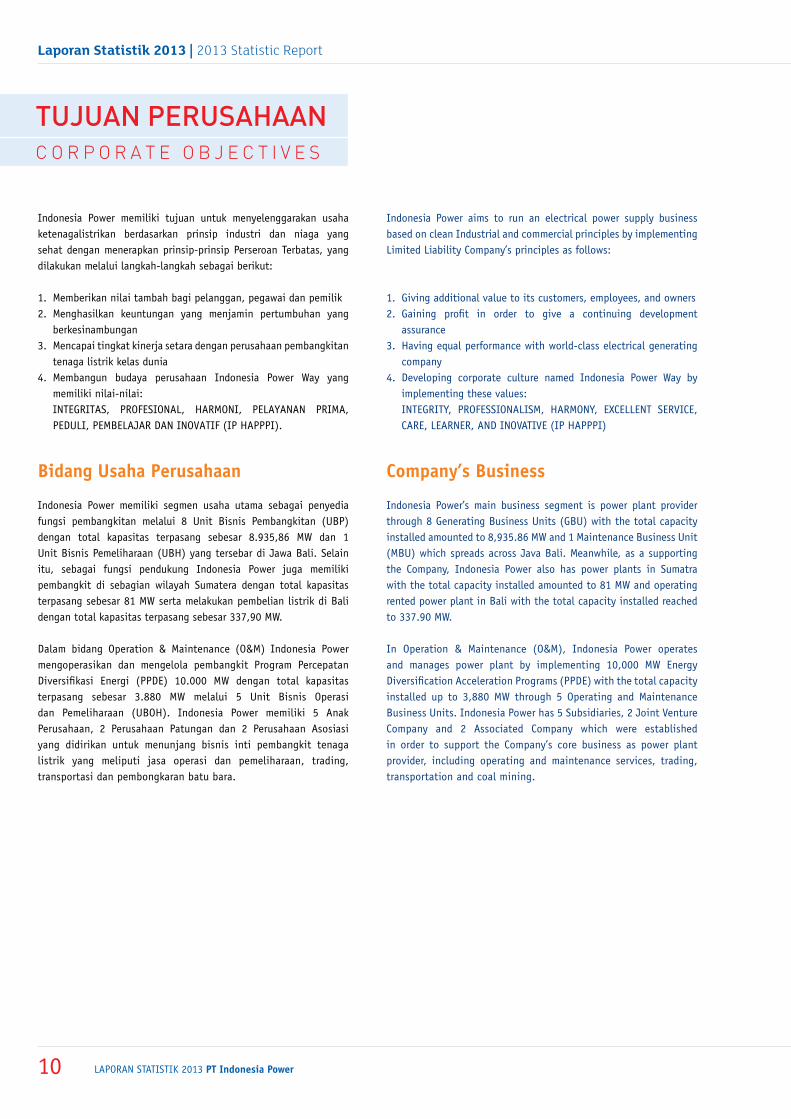
Indonesia Power memiliki tujuan untuk menyelenggarakan usaha ketenagalistrikan berdasarkan prinsip industri dan niaga yang sehat dengan menerapkan prinsip-prinsip Perseroan Terbatas, yang dilakukan melalui langkah-langkah sebagai berikut:
1. Memberikan nilai tambah bagi pelanggan, pegawai dan pemilik2. Menghasilkan keuntungan yang menjamin pertumbuhan yang
berkesinambungan3. Mencapai tingkat kinerja setara dengan perusahaan pembangkitan
tenaga listrik kelas dunia4. Membangun budaya perusahaan Indonesia Power Way yang
memiliki nilai-nilai: INTEGRITAS, PROFESIONAL, HARMONI, PELAYANAN PRIMA,
PEDULI, PEMBELAJAR DAN INOVATIF (IP HAPPPI).
Bidang usaha perusahaan
Indonesia Power memiliki segmen usaha utama sebagai penyedia fungsi pembangkitan melalui 8 Unit Bisnis Pembangkitan (UBP) dengan total kapasitas terpasang sebesar 8.935,86 MW dan 1 Unit Bisnis Pemeliharaan (UBH) yang tersebar di Jawa Bali. Selain itu, sebagai fungsi pendukung Indonesia Power juga memiliki pembangkit di sebagian wilayah Sumatera dengan total kapasitas terpasang sebesar 81 MW serta melakukan pembelian listrik di Bali dengan total kapasitas terpasang sebesar 337,90 MW.
Dalam bidang Operation & Maintenance (O&M) Indonesia Power mengoperasikan dan mengelola pembangkit Program Percepatan Diversifikasi Energi (PPDE) 10.000 MW dengan total kapasitas terpasang sebesar 3.880 MW melalui 5 Unit Bisnis Operasi dan Pemeliharaan (UBOH). Indonesia Power memiliki 5 Anak Perusahaan, 2 Perusahaan Patungan dan 2 Perusahaan Asosiasi yang didirikan untuk menunjang bisnis inti pembangkit tenaga listrik yang meliputi jasa operasi dan pemeliharaan, trading, transportasi dan pembongkaran batu bara.
Indonesia Power aims to run an electrical power supply business based on clean Industrial and commercial principles by implementing Limited Liability Company’s principles as follows:
1. Giving additional value to its customers, employees, and owners 2. Gaining profit in order to give a continuing development
assurance 3. Having equal performance with world-class electrical generating
company 4. Developing corporate culture named Indonesia Power Way by
implementing these values: INTEGRITY, PROFESSIONALISM, HARMONY, EXCELLENT SERVICE,
CARE, LEARNER, AND INOVATIVE (IP HAPPPI)
company’s Business
Indonesia Power’s main business segment is power plant provider through 8 Generating Business Units (GBU) with the total capacity installed amounted to 8,935.86 MW and 1 Maintenance Business Unit (MBU) which spreads across Java Bali. Meanwhile, as a supporting the Company, Indonesia Power also has power plants in Sumatra with the total capacity installed amounted to 81 MW and operating rented power plant in Bali with the total capacity installed reached to 337.90 MW.
In Operation & Maintenance (O&M), Indonesia Power operates and manages power plant by implementing 10,000 MW Energy Diversification Acceleration Programs (PPDE) with the total capacity installed up to 3,880 MW through 5 Operating and Maintenance Business Units. Indonesia Power has 5 Subsidiaries, 2 Joint Venture Company and 2 Associated Company which were established in order to support the Company’s core business as power plant provider, including operating and maintenance services, trading, transportation and coal mining.
tujuan PeRusahaanc o R p o R a t e o B j e c t i v e S

PT Indonesia Power 2013 statistic report 11
Ringkasan Summary 2
Kata Pengantar Foreword 6
Identitas Perusahaan Corporate Identity 7
Sejarah Singkat PT Indonesia Power PT Indonesia Power in Brief 8
Tujuan Perusahaan Corporate Objectives 10
Daftar Isi Table of Contents 11
Daftar Tabel Table List 12
Daftar Grafik Graphic List 14
Penyediaan Tenaga Listrik Electricity Supply 18
Pengiriman Energi Energy Transferred 21
Daya Terpasang Installed Capacity 27
Produksi, Penjualan dan Pemakaian Sendiri Production, Sales and Self Consumption 32
Produksi Per Unit Bisnis Pembangkitan Production Per Generating Business Unit 34
Penjualan Per Unit Bisnis Pembangkitan Sales Per Generating Business Unit 37
Pemakaian Sendiri Per Unit Bisnis Pembangkitan Self Consumption Per Generating Business Unit 40
Produksi Per Jenis Pembangkit Production Per Power Plant Type 44
Penjualan Per Jenis Pembangkit Sales Per Power Plant Type 47
Pemakaian Sendiri Per Jenis Pembangkit Self Consumption Per Power Plant Type 50
Pemakaian Bahan Bakar Fuel Consumption 56
Pemakaian Bahan Bakar Per Unit Bisnis Pembangkitan Fuel Consumption Per Generating Business Unit 59
Pemakaian Bahan Bakar Per Jenis Pembangkitan Fuel Consumption Per Power Plant Type 62
Kinerja Performance 66
Kinerja Per Unit Bisnis Pembangkitan Performance Per Generating Business Unit 67
Kinerja Per Jenis Pembangkitan Performance Per Power Plant Type 75
Pendapatan Penjualan Energi Listrik Electricity Sales Revenue 84
Kepegawaian Human Resources 88
Penjelasan Glossary of Terms 93
Daftar Singkatan List of Abbreviation 94
daftaR isit a B l e o f c o n t e n t S
laporan statistik 2013 PT Indonesia Power12
Laporan Statistik 2013 | 2013 Statistic Report
Penyediaan Tenaga Listrik Sistem Jawa Bali Tahun 2009-2013 Electricity Supply of Java Bali System in 2009-2013 18
Penyediaan Tenaga Listrik PT PJB Tahun 2013 Electricity Supply of PT PJB in 2013 19
Penyediaan Tenaga Listrik Tanjung Jati B, Lontar, dan UPJB Tahun 2013
Electricity Supply of Tanjung Jati B, Lontar and UPJB in 2013 20
Penyediaan Tenaga Listrik IPP Tahun 2013 Electricity Supply of IPP in 2013 20
Pengiriman Energi ke Sistem Jawa Bali Tahun 2009-2013 Energy Transferred to Java Bali System in 2009-2013 21
Realisasi Pengiriman Energi ke Sistem Jawa Bali Tahun 2012-2013 dan Rencana Tahun 2014
Realization of Energy Transferred to Java Bali System in 2012-2013 and Plan of 2014
22
Daya Terpasang per Unit Bisnis Pembangkitan di Jawa Bali Tahun 2009-2013
Installed Capacity per Generating Business Unit in Java Bali in 2009-2013
27
Daya Terpasang per Jenis Pembangkit Tahun 2009-2013 Installed Capacity per Power Plant Type in 2009-2013 28
Daya Terpasang Tahun 2013 Installed Capacity in 2013 29
Pertumbuhan Produksi, Penjualan dan Pemakaian Sendiri Tahun 2009-2013
Production Growth, Sales and Self Consumption in 2009-2013 32
Realisasi Produksi Tahun 2012-2013 dan Rencana Tahun 2014 Production Realization in 2012-2013 and Plan of 2014 34
Produksi per Unit Bisnis Pembangkitan Tahun 2013 Production per Generating Business Unit in 2013 35
Realisasi Penjualan Tahun 2012-2013 dan Rencana Tahun 2014 Sales Realization in 2012-2013 and Plan of 2014 37
Penjualan per Unit Bisnis Pembangkitan Tahun 2013 Sales per Generating Business Unit in 2013 38
Realisasi Pemakaian Sendiri Tahun 2012-2013 dan Rencana Tahun 2014
Self Consumption Realization in 2012-2013 and Plan of 2014
40
Prosentase Pemakaian Sendiri Tahun 2012-2013 dan Rencana Tahun 2014
Self Consumption Percentage in 2012-2013 and Plan of 2014
41
Pemakaian Sendiri per Unit Bisnis Pembangkitan Tahun 2013 Self Consumption per Generating Business Unit in 2013 42
Realisasi Produksi per Jenis Pembangkit Tahun 2012-2013 dan Rencana Tahun 2014
Production Realization of Power Plant Type in 2012-2013 and Plan of 2014
44
Produksi per Jenis Pembangkit Tahun 2013 Production of Power Plant Type in 2013 45
Realisasi Penjualan per Jenis Pembangkit Tahun 2012-2013 dan Rencana Tahun 2014
Sales Realization of Power Plant in 2012-2013 and Plan of 2014
47
Penjualan per Jenis Pembangkit Tahun 2013 Sales of Power Plant Type in 2013 48
Realisasi Pemakaian Sendiri per Jenis Pembangkit Tahun 2012-2013 dan Rencana Tahun 2014
Self Consumption Realization of Power Plant Type in 2012-2013 and Plan of 2014
50
Prosentase Pemakaian Sendiri per Jenis Pembangkit Tahun 2012-2013 dan Rencana Tahun 2014
Self Consumption Percentage of Power Plant Type in 2012-2013 and Plan of 2014
51
Pemakaian Sendiri per Jenis Pembangkit Tahun 2013 Self Consumption of Power Plant Type in 2013 52
Pemakaian Bahan Bakar Tahun 2009-2013 Fuel Consumption in 2009-2013 56
Realisasi Pemakaian Bahan Bakar per Unit Bisnis Pembangkitan Tahun 2012-2013 dan Rencana Tahun 2014
Fuel Consumption Realization per Generating Business Unit in 2012-2013 and Plan of 2014
59
Pemakaian Bahan Bakar per Unit Bisnis Pembangkitan Tahun 2013
Fuel Consumption per Generating Business Unit in 2013
60
Realisasi Pemakaian Bahan Bakar per Jenis Pembangkit Tahun 2012-2013 dan Rencana Tahun 2014
Fuel Consumption Realization per Power Plant Type in 2012-2013 and Plan of 2014
62
daftaR tabelt a B l e l i S t
PT Indonesia Power 2013 statistic report 13
Pemakaian Bahan Bakar per Jenis Pembangkit Tahun 2013 Fuel Consumption per Power Plant Type in 2013 63
Kinerja Unit Bisnis Pembangkitan Indonesia Power Tahun 2009-2013
Indonesia Power Generating Business Unit Performance in 2009-2013
66
Realisasi EAF Tahun 2012-2013 dan Rencana Tahun 2014 EAF Realization in 2012-2013 and Plan of 2014 66
Kinerja Unit Bisnis Pembangkitan Suralaya Tahun 2013 Suralaya Generating Business Unit Performance in 2013 67
Kinerja Unit Bisnis Pembangkitan Priok Tahun 2013 Priok Generating Business Unit Performance in 2013 68
Kinerja Unit Bisnis Pembangkitan Saguling Tahun 2013 Saguling Generating Business Unit Performance in 2013 69
Kinerja Unit Bisnis Pembangkitan Kamojang Tahun 2013 Kamojang Generating Business Unit Performance in 2013 70
Kinerja Unit Bisnis Pembangkitan Mrica Tahun 2013 Mrica Generating Business Unit Performance in 2013 71
Kinerja Unit Bisnis Pembangkitan Semarang Tahun 2013 Semarang Generating Business Unit Performance in 2013 72
Kinerja Unit Bisnis Pembangkitan Perak Grati Tahun 2013 Perak Grati Generating Business Unit Performance in 2013 73
Kinerja Unit Bisnis Pembangkitan Bali Tahun 2013 Bali Generating Business Unit Performance in 2013 74
Kinerja PLTA Tahun 2013 Hydro Power Plant Performance in 2013 75
Kinerja PLTU Tahun 2013 Steam Power Plant Performance in 2013 76
Kinerja PLTGU Tahun 2013 Combined-Cycle Power Plant Performance in 2013 77
Kinerja PLTG Tahun 2013 Gas Turbine Power Plant Performance in 2013 78
Kinerja PLTP Tahun 2013 Geothermal Power Plant Performance in 2013 79
Kinerja PLTD Tahun 2013 Diesel Power Plant Performance in 2013 80
Pertumbuhan Jumlah Aktiva dan Pendapatan Penjualan Energi Listrik Tahun 2009-2013
Total Asset Growth and Electricity Sales Revenue in 2009-2013 84
Pendapatan Penjualan Energi Listrik per Unit Bisnis Pembangkitan Tahun 2013
Electricity Sales Revenue per Generating Business Unit in 2013
85
Pendapatan Penjualan Energi Listrik per Jenis Pembangkit Tahun 2013
Electricity Sales Revenue per Power Plant Type in 2013
85
Jumlah Pegawai Aktif Tahun 2009-2013 Total of Active Employees in 2009-2013 88
Jumlah Pegawai berdasarkan Usia Tahun 2013 Total Employees based on Age in 2013 89
Jumlah Pegawai berdasarkan Jenjang Jabatan Tahun 2013 Total Employees based on Position Level in 2013 90
Jumlah Pegawai berdasarkan Jenis Kelamin Tahun 2013 Total Employees based on Gender in 2013 91
Jumlah Pegawai berdasarkan Pendidikan Tahun 2013 Total Employees based on Education in 2013 92
laporan statistik 2013 PT Indonesia Power14
Laporan Statistik 2013 | 2013 Statistic Report
Penyediaan Tenaga Listrik Sistem Jawa Bali Tahun 2009-2013 (MW)
Electricity Supply of Java Bali System in 2009-2013 (MW) 18
Pengiriman Energi ke Sistem Jawa Bali Tahun 2009-2013 (GWh)
Energy Transferred to Java Bali System in 2009-2013 (GWh) 21
Realisasi Pengiriman Energi ke Sistem Jawa Bali Tahun 2012-2013 dan Rencana Tahun 2014 (GWh)
Realization of Energy Transferred to Java Bali System in 2012-2013 and Plan of 2014 (GWh)
22
Daya Terpasang per Unit Bisnis Pembangkitan di Jawa Bali Tahun 2009-2013 (MW)
Installed Capacity per Generating Business Unit in Java Bali in 2009-2013 (MW)
27
Daya Terpasang per Jenis Pembangkit Tahun 2009-2013 (MW) Installed Capacity per Power Plant Type in 2009-2013 (MW) 28
Produksi dan Penjualan Tahun 2009-2013 (GWh) Production and Sales in 2009-2013 (GWh) 33
Pertumbuhan Produksi dan Penjualan Tahun 2009-2013 (%) Growth of Production and Sales in 2009-2013 (%) 33
Realisasi Produksi Tahun 2012-2013 dan Rencana Tahun 2014 (GWh) Production Realization in 2012-2013 and Plan of 2014 (GWh) 34
Pertumbuhan Produksi Tahun 2012 dan Tahun 2013 (%) Production Growth in 2012 and 2013 (%) 35
Produksi per Unit Bisnis Pembangkitan Tahun 2013 (GWh) Production per Generating Business Unit in 2013 (GWh) 36
Realisasi Penjualan Tahun 2012-2013 dan Rencana Tahun 2014 (GWh) Sales Realization in 2012-2013 and Plan of 2014 (GWh) 37
Pertumbuhan Penjualan Tahun 2012 dan Tahun 2013 (%) Sales Growth in 2012 and 2013 (%) 38
Penjualan per Unit Bisnis Pembangkitan Tahun 2013 (GWh) Sales per Generating Business Unit in 2013 (GWh) 39
Realisasi Pemakaian Sendiri Tahun 2012-2013 dan Rencana Tahun 2014 (GWh)
Self Consumption Realization in 2012-2013 and Plan of 2014 (GWh)
40
Prosentase Pemakaian Sendiri Tahun 2012-2013 dan Rencana Tahun 2014 (%)
Self Consumption Percentage in 2012-2013 and Plan of 2014 (%)
41
Pemakaian Sendiri per Unit Bisnis Pembangkitan Tahun 2013 (GWh)
Self Consumption per Generating Business Unitin 2013 (GWh)
43
Realisasi Produksi per Jenis Pembangkit Tahun 2012-2013 dan Rencana Tahun 2014 (GWh)
Production Realization of Power Plant Type in 2012-2013 and Plan of 2014 (GWh)
44
Pertumbuhan Produksi per Jenis Pembangkit Tahun 2012 dan Tahun 2013 (%)
Production Growth of Power Plant Type in 2012 and 2013 (%) 45
Produksi per Jenis Pembangkit Tahun 2013 (GWh) Production of Power Plant Type in 2013 (GWh) 46
Realisasi Penjualan per Jenis Pembangkit Tahun 2012-2013 dan Rencana Tahun 2014 (GWh)
Sales Realization of Power Plant Type in 2012-2013 and Plan of 2014 (GWh)
47
Pertumbuhan Penjualan per Jenis Pembangkit Tahun 2012 dan 2013 (%)
Sales Growth of Power Plant Type in 2012 and 2013 (%)
48
Penjualan per Jenis Pembangkit Tahun 2013 (GWh) Sales of Power Plant Type in 2013 (GWh) 49
Realisasi Pemakaian Sendiri per Jenis Pembangkit Tahun 2012-2013 dan Rencana Tahun 2014 (GWh)
Self Consumption Realization of Power Plant Type in 2012-2013 and Plan of 2014 (GWh)
50
Prosentase Pemakaian Sendiri per Jenis Pembangkit Tahun 2012-2013 dan Rencana Tahun 2014 (%)
Self Consumption Percentage of Power Plant Type in 2012-2013 and Plan of 2014 (%)
51
Pemakaian Sendiri per Jenis Pembangkit Tahun 2013 (GWh) Self Consumption of Power Plant Type in 2013 (GWh) 52
Pemakaian Bahan Bakar HSD dan MFO Tahun 2009-2013 (kiloliter)
HSD and MFO Fuel Consumption in 2009-2013 (kiloliter) 56
Pertumbuhan Pemakaian Bahan Bakar HSD dan MFO Tahun 2009-2013 (%)
HSD and MFO Consumption Growth in 2009-2013 (%) 57
Pemakaian Bahan Bakar Gas (mmbtu) dan Batubara (ton) Tahun 2009-2013
Gas (mmbtu) and Coal (ton) Consumption in 2009-2013 57
Pertumbuhan Pemakaian Bahan Bakar Gas dan Batubara Tahun 2009-2013 (%)
Gas and Coal Consumption Growth in 2009-2013 (%) 58
daftaR gRafikg R a p h i c l i S t
PT Indonesia Power 2013 statistic report 15
Realisasi Pemakaian Bahan Bakar HSD dan MFO Tahun 2012-2013 dan Rencana Tahun 2014 (kiloliter)
HSD and MFO Consumption Realization in 2012-2013 and Plan of 2014 (kiloliter)
59
Realisasi Pemakaian Bahan Bakar Gas (mmbtu) dan Batubara (ton) Tahun 2012-2013 dan Rencana Tahun 2014
Gas (mmbtu) and Coal (ton) Consumption Realization in 2012-2013 and Plan of 2014
60
Pemakaian Bahan Bakar HSD dan MFO Tahun 2013 (kiloliter) HSD and MFO Fuel Consumption in 2013 (kiloliter) 61
Pemakaian Bahan Bakar Gas (mmbtu) dan Batubara (ton) Tahun 2013
Gas (mmbtu) and Coal (ton) Consumption in 2013 61
Kinerja Unit Bisnis Pembangkitan Indonesia Power Tahun 2009-2013 (%)
Indonesia Power Generating Business Unit Performance in 2009-2013 (%)
66
Kinerja Unit Bisnis Pembangkitan Suralaya Tahun 2013 (%) Suralaya Generating Business Unit Performance in 2013 (%) 67
Kinerja Unit Bisnis Pembangkitan Priok Tahun 2013 (%) Priok Generating Business Unit Performance in 2013 (%) 68
Kinerja Unit Bisnis Pembangkitan Saguling Tahun 2013 (%) Saguling Generating Business Unit Performance in 2013 (%) 69
Kinerja Unit Bisnis Pembangkitan Kamojang Tahun 2013 (%) Kamojang Generating Business Unit Performance in 2013 (%) 70
Kinerja Unit Bisnis Pembangkitan Mrica Tahun 2013 (%) Mrica Generating Business Unit Performance in 2013 (%) 71
Kinerja Unit Bisnis Pembangkitan Semarang Tahun 2013 (%) Semarang Generating Business Unit Performance in 2013 (%) 72
Kinerja Unit Bisnis Pembangkitan Perak Grati Tahun 2013 (%)
Perak Grati Generating Business Unit Performance in 2013 (%)
73
Kinerja Unit Bisnis Pembangkitan Bali Tahun 2013 (%) Bali Generating Business Unit Performance in 2013 (%) 74
Kinerja Unit Bisnis Pembangkitan PLTA Tahun 2013 (%) Hydro Power Plant Performance in 2013 (%) 75
Kinerja PLTU Tahun 2013 (%) Steam Power Plant Performance in 2013 (%) 76
Kinerja PLTGU Tahun 2013 (%) Combined-Cycle Power Plant Performance in 2013 (%) 77
Kinerja PLTG Tahun 2013 (%) Gas Turbine Power Plant Performance in 2013 (%) 78
Kinerja PLTP Tahun 2013 (%) Geothermal Power Plant Performance in 2013 (%) 79
Kinerja PLTD Tahun 2013 (%) Diesel Power Plant Performance in 2013 (%) 80
Jumlah Aktiva dan Pendapatan Penjualan Energi Listrik Tahun 2009-2013 (dalam Rp miliar)
Total Asset and Electricity Sales Revenue in 2009-2013 (in billion Rp)
84
Pertumbuhan Jumlah Aktiva dan Pendapatan Penjualan Energi Listrik Tahun 2009-2013 (%)
Total Asset and Electricity Sales Revenue Growth in 2009-2013 (%)
85
Jumlah Pegawai Aktif Tahun 2009-2013 Total of Active Employees in 2009-2013 88
Jumlah Pegawai berdasarkan Usia Tahun 2013 Total Employees based on Age in 2013 89
Jumlah Pegawai berdasarkan Jenjang Jabatan Tahun 2013 Total Employees based on Position Level in 2013 90
Jumlah Pegawai berdasarkan Jenis Kelamin Tahun 2013 Total Employees based on Gender in 2013 91
Jumlah Pegawai berdasarkan Pendidikan Tahun 2013 Total Employees based on Education in 2013 92
laporan statistik 2013 PT Indonesia Power16
Sistem Jawa Bali | Java Bali System
PT Indonesia Power 2013 statistic report 17
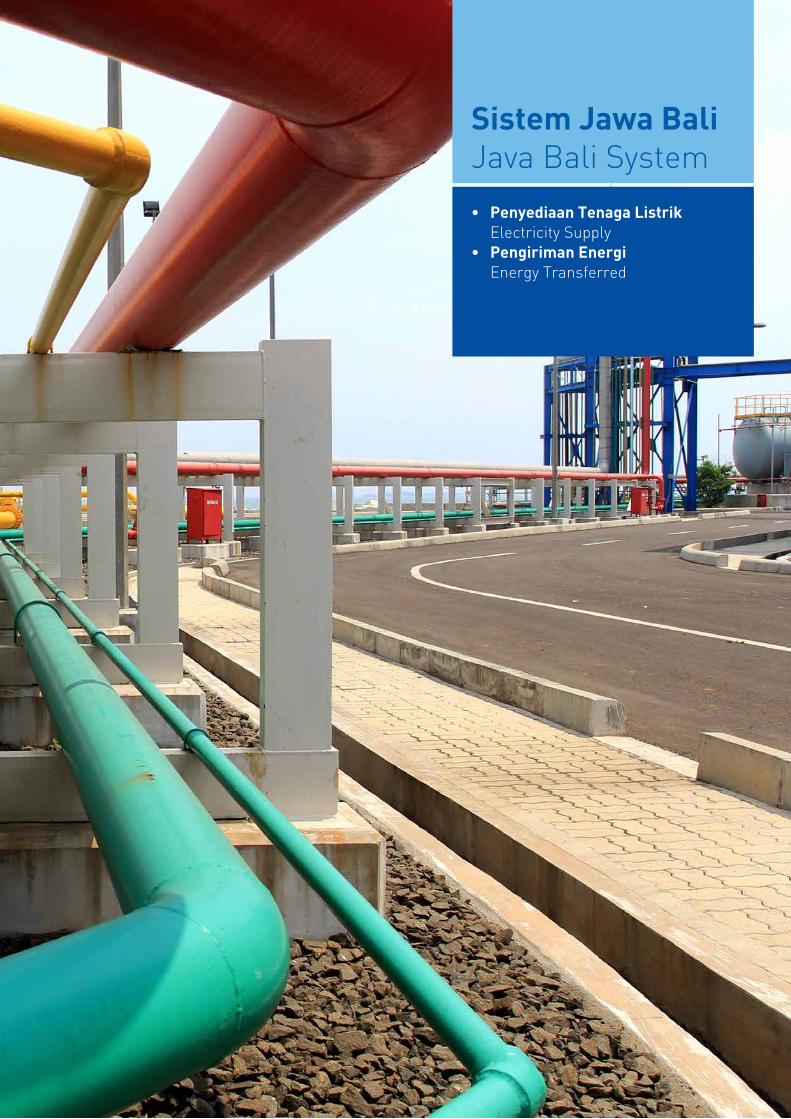
• PenyediaanTenagaListrik electricity Supply• PengirimanEnergi energy transferred
SistemJawaBalijava Bali System
laporan statistik 2013 PT Indonesia Power18
Sistem Jawa Bali | Java Bali System
tabel 1. penyediaan tenaga listrik Sistem Jawa Bali tahun 2009-2013table 1. Electricity Supply of Java Bali System in 2009-2013
Perusahaan | Company
Tahun | Year
2009 2010 2011 2011 2013
(MW) (%) (MW) (%) (MW) (%) (MW) (%) (MW) (%)
PT Indonesia Power 8.249 37,87 8.073,57 37,38 8.192,67 34,24 7.981,62 27,56 8.047,62 26,81 PT PJB 6.281 29,24 6.020,36 27,88 6.324,00 26,43 6.324,00 21,84 6.323,85 21,06 Muara Tawar * 840 3,91 840,00 3,89 - - - - - - UB Tanjung Jati B 1.322 6,15 1.321,60 6,12 1.983,00 8,29 2.644,00 9,13 2.643,80 8,81 UB Cilegon 739 3,44 739,40 3,42 1.809,00 7,56 - - - - UB Lontar *** 300 1,38 560,00 2,59 560,00 2,34 615,00 2,12 883 2,94 UB Indramayu ** - - - - 870,00 3,64 - - - - IPP 4.053 18,61 4.041,40 18,71 4.191,00 17,51 5.667,05 19,57 5.784,95 19,27 UPJB **** - - - - - - 5.724,00 19,77 6.339 21,11Sistem Jawa BaliJava Bali System
21.784 100 21.596,33 100 23.929,67 100 28.955,67 100 30.022,22 100
Keterangan: * Muara Tawar dialihkan menjadi aset PJB pada tahun 2011 ** Indramayu baru beroperasi pada tahun 2011 dan masuk ke UPJB pada tahun 2012 *** Pada tahun 2012, UB Lontar meliputi PLTU Paiton 9 dan Pacitan dan di tahun 2013 UB Lontar meliputi PLTU Pacitan, Palabuhan ratu, dan Tanjung Awar-awar namun Daya Mampu Netto (DMN) PLTU Tanjung Awar-awar belum ada**** UB Cilegon dan UB Indramayu, serta Unit PPDE yang sudah COD masuk ke UPJB pada Tahun 2012 dan Paiton 9 diserahkan pada UPJB pada bulan Februari 2013
Notes: * Muara Tawar was diverted into PJB’s asset in 2011 ** Indramayu started to operate in 2011 and entered into UPJB in 2012 *** In 2012, Lontar BU covered Paiton 9 SPP and Pacitan SPP, while in 2013 Lontar BU covered Pacitan SPP, Palabuhan ratu SPP and Tanjung Awar-awar SPP however Net Maximum Capacity (NMC) of Tanjung Awar-awar SPP has not existed yet**** Cilegon BU and Indramayu BU, and PPDE Units that have reached COD are put into UPJB in 2012 and Paiton 9 was handed over to UPJB in February 2013
grafik 1. penyediaan tenaga listrik Sistem Jawa Bali tahun 2009-2013 (mw)graph 1. Electricity Supply of Java Bali System in 2009-2013 (mw)
2009 2010 2011 2012 2013
PT Indonesia Power PT PJB Muara Tawar UB Tanjung Jati B UB Cilegon UB Lontar UB Indramayu IPP UPJB Sistem Jawa Bali | Java Bali System
0 0 0 0 0 0 000
8.2
49
6.2
81
840 1.32
273
930
0
560,
00
560,
00
4.0
53
21.
784
8.0
73,5
7
840
,00
0 0 0
1.3
21,6
0 7
39,4
0
870
,00
4.0
41,4
0
21.5
96,3
3
8.1
92,6
7 6
.324
,00
1.9
83,0
0 1
.809
,00
4.1
91,0
0
23.9
29,6
7
7.9
81,6
2 6
.324
,00
2.6
44,0
0
615
,00
5.6
67,0
5
5.7
24,0
0 28
,955
.67
8.0
47,6
26.
323,
85
2.64
3,80
883
5.78
4,95
6,3
3930
.022
,22
6.0
20,3
6
Penyediaan tenaga listRike l e c t R i c i t y S u p p l y
PT Indonesia Power 2013 statistic report 19
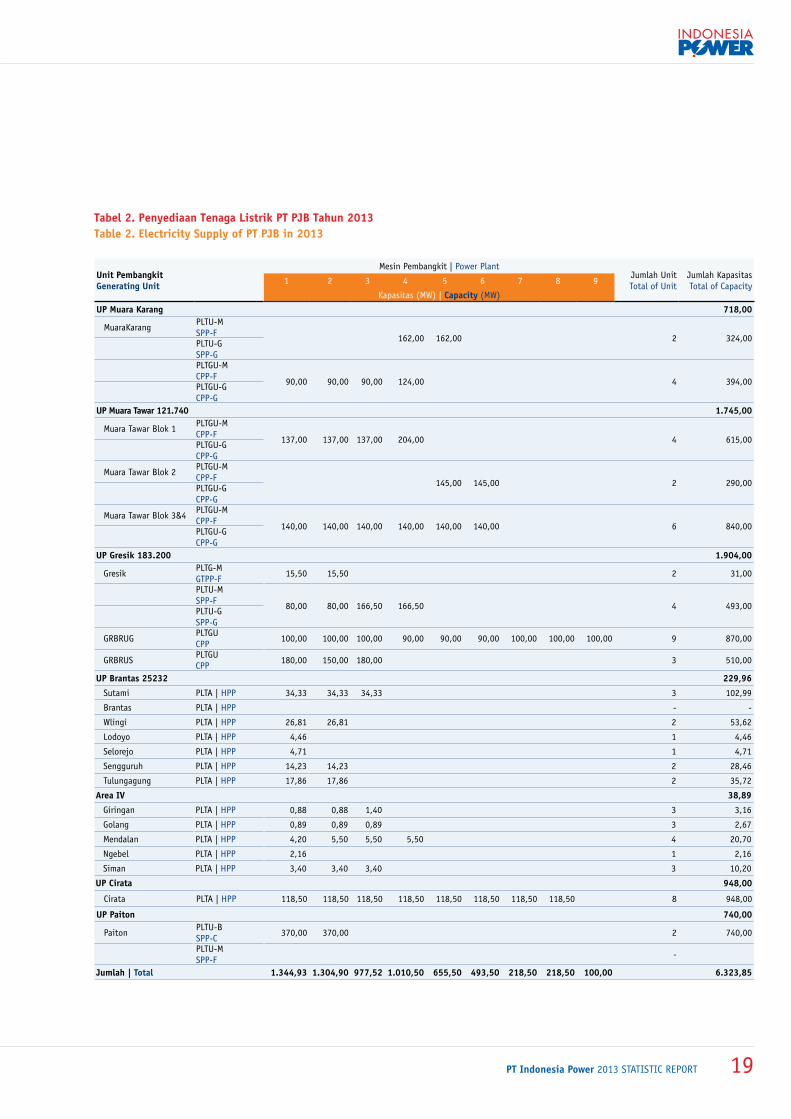
tabel 2. penyediaan tenaga listrik pt pJB tahun 2013table 2. Electricity Supply of pt pJB in 2013
unit pembangkitgenerating unit
Mesin Pembangkit | Power PlantJumlah UnitTotal of Unit
Jumlah KapasitasTotal of Capacity1 2 3 4 5 6 7 8 9
Kapasitas (MW) | capacity (MW)
up muara karang 718,00
MuaraKarangPLTU-M SPP-F 162,00 162,00 2 324,00
PLTU-GSPP-G
PLTGU-MCPP-F 90,00 90,00 90,00 124,00 4 394,00
PLTGU-GCPP-G
up muara tawar 121.740 1.745,00
Muara Tawar Blok 1PLTGU-MCPP-F 137,00 137,00 137,00 204,00 4 615,00
PLTGU-GCPP-G
Muara Tawar Blok 2PLTGU-MCPP-F 145,00 145,00 2 290,00
PLTGU-G CPP-G
Muara Tawar Blok 3&4PLTGU-MCPP-F 140,00 140,00 140,00 140,00 140,00 140,00 6 840,00
PLTGU-G CPP-G
up gresik 183.200 1.904,00
GresikPLTG-MGTPP-F
15,50 15,50 2 31,00
PLTU-MSPP-F 80,00 80,00 166,50 166,50 4 493,00
PLTU-GSPP-G
GRBRUGPLTGUCPP
100,00 100,00 100,00 90,00 90,00 90,00 100,00 100,00 100,00 9 870,00
GRBRUSPLTGUCPP
180,00 150,00 180,00 3 510,00
up Brantas 25232 229,96
Sutami PLTA | HPP 34,33 34,33 34,33 3 102,99
Brantas PLTA | HPP - -
Wlingi PLTA | HPP 26,81 26,81 2 53,62
Lodoyo PLTA | HPP 4,46 1 4,46
Selorejo PLTA | HPP 4,71 1 4,71
Sengguruh PLTA | HPP 14,23 14,23 2 28,46
Tulungagung PLTA | HPP 17,86 17,86 2 35,72
area iv 38,89
Giringan PLTA | HPP 0,88 0,88 1,40 3 3,16
Golang PLTA | HPP 0,89 0,89 0,89 3 2,67
Mendalan PLTA | HPP 4,20 5,50 5,50 5,50 4 20,70
Ngebel PLTA | HPP 2,16 1 2,16
Siman PLTA | HPP 3,40 3,40 3,40 3 10,20
up cirata 948,00
Cirata PLTA | HPP 118,50 118,50 118,50 118,50 118,50 118,50 118,50 118,50 8 948,00
up paiton 740,00
PaitonPLTU-B SPP-C
370,00 370,00 2 740,00
PLTU-M SPP-F
-
Jumlah | total 1.344,93 1.304,90 977,52 1.010,50 655,50 493,50 218,50 218,50 100,00 6.323,85
laporan statistik 2013 PT Indonesia Power20
Sistem Jawa Bali | Java Bali System
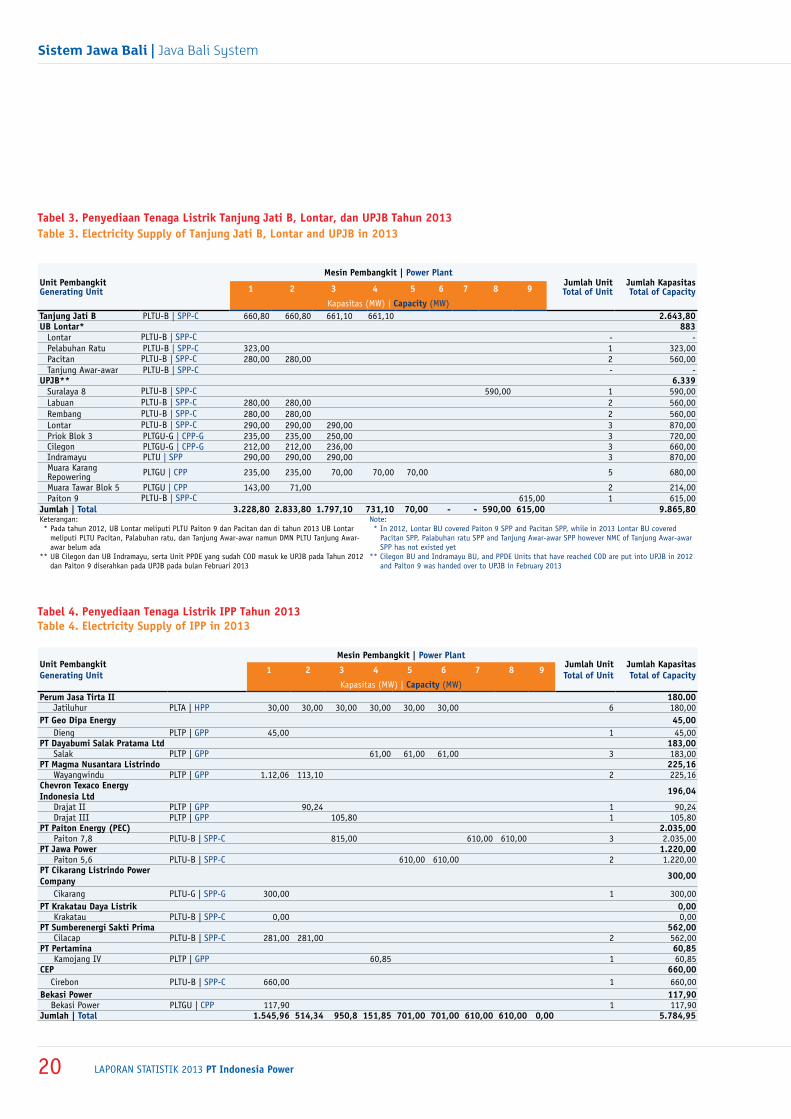
tabel 3. penyediaan tenaga listrik tanjung Jati B, lontar, dan upJB tahun 2013table 3. Electricity Supply of tanjung Jati B, lontar and upJB in 2013
tabel 4. penyediaan tenaga listrik ipp tahun 2013table 4. Electricity Supply of ipp in 2013
unit pembangkitgenerating unit
mesin pembangkit | power plantJumlah unittotal of unit
Jumlah kapasitastotal of capacity1 2 3 4 5 6 7 8 9
Kapasitas (MW) | capacity (MW)tanjung Jati B PLTU-B | SPP-C 660,80 660,80 661,10 661,10 2.643,80uB lontar* 883
Lontar PLTU-B | SPP-C - -Pelabuhan Ratu PLTU-B | SPP-C 323,00 1 323,00Pacitan PLTU-B | SPP-C 280,00 280,00 2 560,00Tanjung Awar-awar PLTU-B | SPP-C - -
upJB** 6.339Suralaya 8 PLTU-B | SPP-C 590,00 1 590,00Labuan PLTU-B | SPP-C 280,00 280,00 2 560,00Rembang PLTU-B | SPP-C 280,00 280,00 2 560,00Lontar PLTU-B | SPP-C 290,00 290,00 290,00 3 870,00Priok Blok 3 PLTGU-G | CPP-G 235,00 235,00 250,00 3 720,00Cilegon PLTGU-G | CPP-G 212,00 212,00 236,00 3 660,00Indramayu PLTU | SPP 290,00 290,00 290,00 3 870,00Muara Karang Repowering PLTGU | CPP 235,00 235,00 70,00 70,00 70,00 5 680,00
Muara Tawar Blok 5 PLTGU | CPP 143,00 71,00 2 214,00Paiton 9 PLTU-B | SPP-C 615,00 1 615,00
Jumlah | total 3.228,80 2.833,80 1.797,10 731,10 70,00 - - 590,00 615,00 9.865,80Keterangan: * Pada tahun 2012, UB Lontar meliputi PLTU Paiton 9 dan Pacitan dan di tahun 2013 UB Lontar meliputi PLTU Pacitan, Palabuhan ratu, dan Tanjung Awar-awar namun DMN PLTU Tanjung Awar-
awar belum ada ** UB Cilegon dan UB Indramayu, serta Unit PPDE yang sudah COD masuk ke UPJB pada Tahun 2012
dan Paiton 9 diserahkan pada UPJB pada bulan Februari 2013
Note: * In 2012, Lontar BU covered Paiton 9 SPP and Pacitan SPP, while in 2013 Lontar BU covered
Pacitan SPP, Palabuhan ratu SPP and Tanjung Awar-awar SPP however NMC of Tanjung Awar-awar SPP has not existed yet
** Cilegon BU and Indramayu BU, and PPDE Units that have reached COD are put into UPJB in 2012 and Paiton 9 was handed over to UPJB in February 2013
unit pembangkitgenerating unit
mesin pembangkit | power plantJumlah unittotal of unit
Jumlah kapasitastotal of capacity1 2 3 4 5 6 7 8 9
Kapasitas (MW) | capacity (MW)perum Jasa tirta ii 180.00 Jatiluhur PLTA | HPP 30,00 30,00 30,00 30,00 30,00 30,00 6 180,00pt geo dipa Energy 45,00 Dieng PLTP | GPP 45,00 1 45,00pt dayabumi Salak pratama ltd 183,00 Salak PLTP | GPP 61,00 61,00 61,00 3 183,00pt magma nusantara listrindo 225,16 Wayangwindu PLTP | GPP 1.12,06 113,10 2 225,16chevron texaco Energy indonesia ltd 196,04
Drajat II PLTP | GPP 90,24 1 90,24 Drajat III PLTP | GPP 105,80 1 105,80pt paiton Energy (pEc) 2.035,00 Paiton 7,8 PLTU-B | SPP-C 815,00 610,00 610,00 3 2.035,00 pt Jawa power 1.220,00 Paiton 5,6 PLTU-B | SPP-C 610,00 610,00 2 1.220,00 pt cikarang listrindo power company 300,00
Cikarang PLTU-G | SPP-G 300,00 1 300,00pt krakatau daya listrik 0,00 Krakatau PLTU-B | SPP-C 0,00 0,00pt Sumberenergi Sakti prima 562,00 Cilacap PLTU-B | SPP-C 281,00 281,00 2 562,00pt pertamina 60,85 Kamojang IV PLTP | GPP 60,85 1 60,85cEp 660,00
Cirebon PLTU-B | SPP-C 660,00 1 660,00Bekasi power 117,90
Bekasi Power PLTGU | CPP 117,90 1 117,90Jumlah | total 1.545,96 514,34 950,8 151,85 701,00 701,00 610,00 610,00 0,00 5.784,95
PT Indonesia Power 2013 statistic report 21
grafik 2. pengiriman Energi ke Sistem Jawa Bali tahun 2009-2013 (gwh)graph 2. Energy transferred to Java Bali System in 2009-2013 (gwh)
tabel 5. pengiriman Energi ke Sistem Jawa Bali tahun 2009-2013table 5. Energy transferred to Java Bali System in 2009-2013
PerusahaanCompany
Tahun | Year2009 2010 2011 2012 2013
(GWh) (%) (GWh) (%) (GWh) (%) (GWh) (%) (GWh) (%)PT Indonesia Power 41.193 35,36 45.757,24 36,34 43.227 32,15 37.936 26,00 40.608 25,96 PT PJB 29.649 25,45 31.781,00 25,24 31.940 23,75 26.672 18,28 27.549 17,61 Muara Tawar * 3.906 3,35 3.139,00 2,49 - - - - - - UB Tanjung Jati B 8.226 7,06 9.336,00 7,41 12.594 9,37 17.011 11,66 18.549 11,86 UB Cilegon 3.916 3,36 5.099,96 4,05 9.905 7,37 - - - - UB Lontar *** 436 0,37 2.317,00 1,84 4.341 3,23 2.036 1,40 2.957 1,89 UB Indramayu ** - - - - 3.229 2,40 - - - - IPP 29.174 25,04 28.479,88 22,62 29.225 21,73 36.655 25,12 38.461 24,59 UPJB **** - - - - - - 25.600 17,55 28.274 18,08 Sistem Jawa Bali Java Bali System
116.500 100 125.909,00 100 134.461 100 145.910 100 156.398 100
Keterangan: * Muara Tawar dialihkan menjadi aset PJB pada tahun 2011 ** Indramayu baru beroperasi pada tahun tahun 2011 dan masuk ke UPJB pada tahun 2012 *** Pada tahun 2012, UB Lontar meliputi PLTU Paiton 9 dan Pacitan dan di tahun 2013 UB Lontar meliputi PLTU Pacitan, Palabuhan ratu, dan Tanjung Awar-awar **** UB Cilegon dan UB Indramayu, serta Unit PPDE yang sudah COD masuk ke UPJB pada Tahun 2012 dan Paiton 9 diserahkan pada UPJB pada bulan Februari 2013
Note: * Muara Tawar dialihkan menjadi aset PJB pada tahun 2011 ** Indramayu started to operate in 2011 and entered into UPJB in 2012 *** In 2012, Lontar BU covered Paiton 9 SPP and Pacitan SPP, while in 2013 Lontar BU covered Pacitan SPP, Palabuhan ratu SPP and Tanjung Awar-awar SPP **** Cilegon BU and Indramayu BU, and PPDE Units that have reached COD are put into UPJB in 2012 and Paiton 9 was handed over to UPJB in February 2013
43.2
2731
.940
12.5
940 0
9.90
54.
341
3.22
929
.225 37.9
3626
.672
17.0
110 0 0
2.03
6
36.6
5525
.600
145.
910
40.
608
27.5
49
18.5
490 0 0
2.95
7
38.4
6128
.274
156.
398
134.
461
45.
757,
2431
.781
,00
9.33
6,00
3.13
9,00
0 0
5.0
99,9
62.
317,
00
28.4
79,8
8
125.
909,
00
41.1
9329
.649
8.22
63.
906
0 0
3.91
643
6
29.1
74
116.
500
PT Indonesia Power PT PJB Muara Tawar UB Tanjung Jati B UB Cilegon UB Lontar UB Indramayu IPP UPJB Sistem Jawa Bali | Java Bali System
2009 2010 2011 2012 2013
PengiRiman eneRgie n e R g y t R a n S f e R R e d
laporan statistik 2013 PT Indonesia Power22
Sistem Jawa Bali | Java Bali System
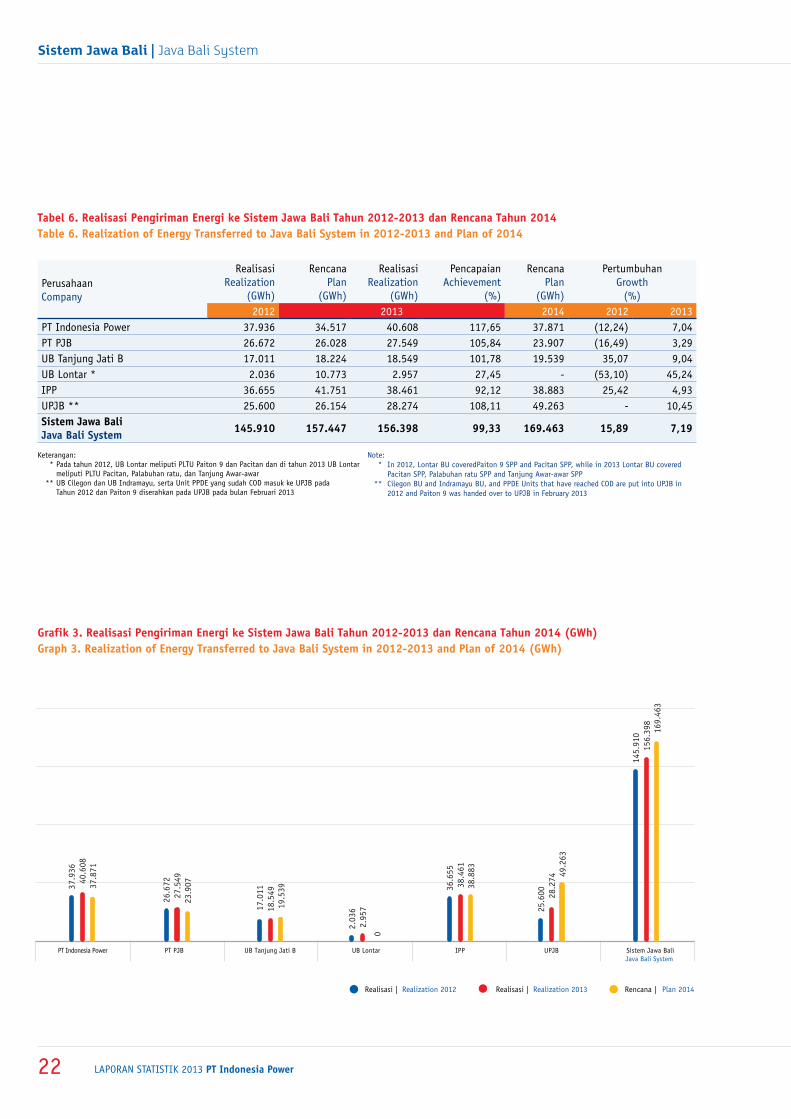
grafik 3. realisasi pengiriman Energi ke Sistem Jawa Bali tahun 2012-2013 dan rencana tahun 2014 (gwh)graph 3. realization of Energy transferred to Java Bali System in 2012-2013 and plan of 2014 (gwh)
tabel 6. realisasi pengiriman Energi ke Sistem Jawa Bali tahun 2012-2013 dan rencana tahun 2014table 6. realization of Energy transferred to Java Bali System in 2012-2013 and plan of 2014
PerusahaanCompany
RealisasiRealization
(GWh)
Rencana Plan
(GWh)
Realisasi Realization
(GWh)
Pencapaian Achievement
(%)
RencanaPlan
(GWh)
Pertumbuhan Growth
(%)2012 2013 2014 2012 2013
PT Indonesia Power 37.936 34.517 40.608 117,65 37.871 (12,24) 7,04PT PJB 26.672 26.028 27.549 105,84 23.907 (16,49) 3,29UB Tanjung Jati B 17.011 18.224 18.549 101,78 19.539 35,07 9,04UB Lontar * 2.036 10.773 2.957 27,45 - (53,10) 45,24IPP 36.655 41.751 38.461 92,12 38.883 25,42 4,93UPJB ** 25.600 26.154 28.274 108,11 49.263 - 10,45Sistem Jawa BaliJava Bali System 145.910 157.447 156.398 99,33 169.463 15,89 7,19
Keterangan: * Pada tahun 2012, UB Lontar meliputi PLTU Paiton 9 dan Pacitan dan di tahun 2013 UB Lontar meliputi PLTU Pacitan, Palabuhan ratu, dan Tanjung Awar-awar ** UB Cilegon dan UB Indramayu, serta Unit PPDE yang sudah COD masuk ke UPJB pada Tahun 2012 dan Paiton 9 diserahkan pada UPJB pada bulan Februari 2013
Note: * In 2012, Lontar BU coveredPaiton 9 SPP and Pacitan SPP, while in 2013 Lontar BU covered
Pacitan SPP, Palabuhan ratu SPP and Tanjung Awar-awar SPP ** Cilegon BU and Indramayu BU, and PPDE Units that have reached COD are put into UPJB in
2012 and Paiton 9 was handed over to UPJB in February 2013
PT Indonesia Power PT PJB UB Tanjung Jati B UB Lontar IPP UPJB Sistem Jawa BaliJava Bali System
Realisasi | Realization 2012 Realisasi | Realization 2013 Rencana | Plan 2014
37.9
36 4
0.60
8 3
7.87
1
26.6
72
27.
549
23.
907
0
17.
011
18.5
49 1
9.53
9 36.6
5538
.461
38.8
83
25.6
00 2
8.27
4 49.2
63
145.
910
156.
398
169
.463
2.03
6 2.
957
PT Indonesia Power 2013 statistic report 23
DayaTerpasanginstalled capacity
PT Indonesia Power 2013 statistic report 27
grafik 4. daya terpasang per unit Bisnis pembangkitan di Jawa Bali tahun 2009-2013(mw)graph 4. installed capacity per generating Business unit in Java Bali in 2009-2013(mw)
tabel 7. daya terpasang per unit Bisnis pembangkitan di Jawa Bali tahun 2009-2013table 7. installed capacity per generating Business unit in Java Bali in 2009-2013
unit pembangkitgenerating unit
2009 2010 2011 2012 2013
MW % MW % MW % MW % MW %
a. Jawa Bali grid & EmBEddEd 8.995,00 100,00 8.885,95 100,00 8.996,10 100,00 8.935,86 100,00 8.935,86 100,00
Suralaya 3.400,00 37,80 3.400,00 38,26 3.400,00 37,79 3.400,00 38,05 3.400,00 38,05
Priok 1.348,00 14,99 1.348,08 15,17 1.348,08 14,99 1.348,08 15,09 1.348,08 15,09
Saguling 797,00 8,86 797,36 8,97 797,36 8,86 797,36 8,92 797,36 8,92
Kamojang 375,00 4,17 375,00 4,22 375,00 4,17 375,00 4,20 375,00 4,20
Mrica 309,04 3,44 309,24 3,48 309,75 3,44 309,74 3,47 309,74 3,47
Semarang 1.469,03 16,33 1.359,51 15,30 1.469,16 16,33 1.408,93 15,77 1.408,93 15,77
Perak Grati 864,00 9,61 864,08 9,72 864,08 9,61 864,08 9,67 864,08 9,67
Bali 433,01 4,81 432,68 4,87 432,67 4,81 432,67 4,84 432,67 4,84
B. pEmBElian liStrik purchaSE of ElEctricity - - - - 227,00 - 307,00 - 418,90 -
Pesanggaran - - - - 80,00 - 80,00 - 205,10 -
Pemaron - - - - 45,00 - 125,00 - 132,80 -
Keramasan - - - - 20,10 - 20,10 - 18,00 -
Jambi - - - - 20,10 - 20,10 - 18,00 -
Pontianak - - - - 13,00 - 13,00 - - -
Indralaya 1 - - - - 48,80 - 48,80 - 45,00 -
indonesia power 8.995,08 100 8.885,95 100 9.223,10 100 9.242,86 100 9.354,76 100
daya teRPasangi n S t a l l e d c a p a c i t y
JAWA BALI GRID & EMBEDED PEMBELIAN LISTRIK | PURCHASE OF ELECTRICITY
3.40
0,00
3.40
0,00
3.40
0,00
3.40
0,00
3.40
0,00
1.34
8,08
1.34
8,00
1.34
8,08
1.34
8,08
1.34
8,08
797,
3679
7,00
797,
3679
7,36
797,
36
375,
0037
5,00
375,
0037
5,00
375,
00
864,
0886
4,00
864,
0886
4,08
864,
08
432,
6843
3,01
432,
6743
2,67
432,
67
80,0
080
,00
205,
10
45,0
012
5,00
132,
80
48,8
048
,80
45,0
0
13,0
013
,00
000 0000000000 20,1
020
,10
18,0
0
20,1
020
,10
18,0
0309,
2430
9,04
309,
7530
9,74
309,
74
1.35
9,51
1.46
9,03
1.46
9,16
1.40
8,93
1.40
8,93
2009 2010 2011 2012 2013
0
500
1.000
1.500
2000
2,500
3.000
3.500
Indralaya 1PontianakJambiKeramasanPemaronPesanggaran Bali Perak Grati Semarang Mrica Kamojang Saguling Priok Suralaya
laporan statistik 2013 PT Indonesia Power28
Sistem Jawa Bali | Java Bali System
tabel 8. daya terpasang per Jenis pembangkit tahun 2009-2013table 8. installed capacity per power plant type in 2009-2013
Jenis pembangkitpower plant type
2009 2010 2011 2012 2013mw % mw % mw % mw % mw %
a. Jawa Bali grid & EmBEddEd 8.996,00 8.885,95 8.996,10 8.935,86 8.935,86 -
PLTA | HPP 1.107,00 12,31 1.106,60 12,45 1.107,11 12,31 1.107,10 12,39 1.107,10 12,39 PLTD | DPP 92,00 1,02 91,91 1,03 91,90 1,02 91,90 1,03 91,90 1,03 PLTG | GTPP 846,00 9,40 846,36 9,52 846,36 9,41 786,13 8,80 786,13 8,80 PLTP | GPP 375,00 4,17 375,00 4,22 375,00 4,17 375,00 4,20 375,00 4,20 PLTU | SPP 3.900,00 43,35 3.900,00 43,89 3.900,00 43,35 3.900,00 43,64 3.900,00 43,64 PLTGU | CPP 2.676,00 29,75 2.566,08 28,88 2.675,73 29,74 2.675,73 29,94 2.675,73 29,94
B. pEmBElian liStrik purchaSE of ElEctricity
- - - - 227,00 - 307,00 - 418,90 -
PLTD | DPP - - - - 138,00 - 218,00 - 337,90 - PLTG | GTPP - - - - 89,00 - 89,00 - 81,00 -
indonesia power 8.996,00 100 8.885,95 100 9.223,10 100 9.242,86 100 9.354,76 100
grafik 5. daya terpasang per Jenis pembangkit tahun 2009-2013 (mw)graph 5. installed capacity per power plant type in 2009-2013 (mw)
JAWA BALI GRID & EMBEDEDPEMBELIAN LISTRIK
PURCHASE OF ELECTRICITY
1.1
06,6
0 1
.107
,00
1.1
07,1
1 1
.107
,10
1.1
07,1
0
91,
91
92,
00
91,
90
91,
90
91,
90
375
,00
375
,00
375
,00
375
,00
375
,00
89,
00
89,
00
81,
00
3.9
00,0
0 3
.900
,00
3.9
00,0
0 3
.900
,00
3.9
00,0
0
2.5
66,0
8 2
.676
,00
2.6
75,7
3 2
.675
,73
2.6
75,7
3
138
,00
218
,00
337
,90
846
,36
846
,00
846
,36
786
,13
786
,13
2009 2010 2011 2012 2013
0
500
1000
1500
2.000
2.500
3000
3.500
4.000
PLTG | GTPPPLTD | DPPPLTGU | CPPPLTU | SPPPLTP | GPPPLTG | GTPPPLTD | DPPPLTA | HPP
PT Indonesia Power 2013 statistic report 29
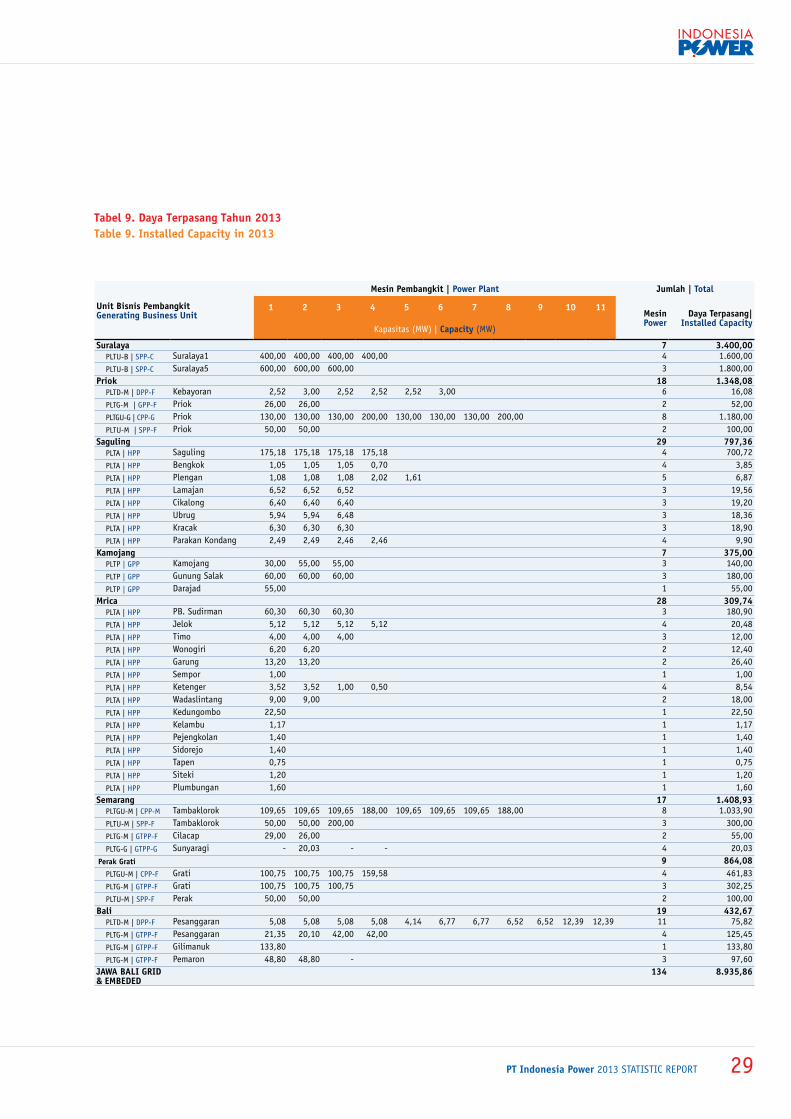
tabel 9. daya terpasang tahun 2013table 9. installed capacity in 2013
unit Bisnis pembangkitgenerating Business unit
mesin pembangkit | power plant Jumlah | total
1 2 3 4 5 6 7 8 9 10 11mesin power
daya terpasang| installed capacity
Kapasitas (MW) | capacity (MW)
Suralaya 7 3.400,00PLTU-B | SPP-C Suralaya1 400,00 400,00 400,00 400,00 4 1.600,00PLTU-B | SPP-C Suralaya5 600,00 600,00 600,00 3 1.800,00
priok 18 1.348,08PLTD-M | DPP-F Kebayoran 2,52 3,00 2,52 2,52 2,52 3,00 6 16,08PLTG-M | GPP-F Priok 26,00 26,00 2 52,00PLTGU-G | CPP-G Priok 130,00 130,00 130,00 200,00 130,00 130,00 130,00 200,00 8 1.180,00PLTU-M | SPP-F Priok 50,00 50,00 2 100,00
Saguling 29 797,36PLTA | HPP Saguling 175,18 175,18 175,18 175,18 4 700,72PLTA | HPP Bengkok 1,05 1,05 1,05 0,70 4 3,85PLTA | HPP Plengan 1,08 1,08 1,08 2,02 1,61 5 6,87PLTA | HPP Lamajan 6,52 6,52 6,52 3 19,56PLTA | HPP Cikalong 6,40 6,40 6,40 3 19,20PLTA | HPP Ubrug 5,94 5,94 6,48 3 18,36PLTA | HPP Kracak 6,30 6,30 6,30 3 18,90PLTA | HPP Parakan Kondang 2,49 2,49 2,46 2,46 4 9,90
kamojang 7 375,00PLTP | GPP Kamojang 30,00 55,00 55,00 3 140,00PLTP | GPP Gunung Salak 60,00 60,00 60,00 3 180,00PLTP | GPP Darajad 55,00 1 55,00
mrica 28 309,74PLTA | HPP PB. Sudirman 60,30 60,30 60,30 3 180,90PLTA | HPP Jelok 5,12 5,12 5,12 5,12 4 20,48PLTA | HPP Timo 4,00 4,00 4,00 3 12,00PLTA | HPP Wonogiri 6,20 6,20 2 12,40PLTA | HPP Garung 13,20 13,20 2 26,40PLTA | HPP Sempor 1,00 1 1,00PLTA | HPP Ketenger 3,52 3,52 1,00 0,50 4 8,54PLTA | HPP Wadaslintang 9,00 9,00 2 18,00PLTA | HPP Kedungombo 22,50 1 22,50PLTA | HPP Kelambu 1,17 1 1,17PLTA | HPP Pejengkolan 1,40 1 1,40PLTA | HPP Sidorejo 1,40 1 1,40PLTA | HPP Tapen 0,75 1 0,75PLTA | HPP Siteki 1,20 1 1,20PLTA | HPP Plumbungan 1,60 1 1,60
Semarang 17 1.408,93PLTGU-M | CPP-M Tambaklorok 109,65 109,65 109,65 188,00 109,65 109,65 109,65 188,00 8 1.033,90PLTU-M | SPP-F Tambaklorok 50,00 50,00 200,00 3 300,00PLTG-M | GTPP-F Cilacap 29,00 26,00 2 55,00PLTG-G | GTPP-G Sunyaragi - 20,03 - - 4 20,03
perak grati 9 864,08PLTGU-M | CPP-F Grati 100,75 100,75 100,75 159,58 4 461,83PLTG-M | GTPP-F Grati 100,75 100,75 100,75 3 302,25PLTU-M | SPP-F Perak 50,00 50,00 2 100,00
Bali 19 432,67PLTD-M | DPP-F Pesanggaran 5,08 5,08 5,08 5,08 4,14 6,77 6,77 6,52 6,52 12,39 12,39 11 75,82PLTG-M | GTPP-F Pesanggaran 21,35 20,10 42,00 42,00 4 125,45PLTG-M | GTPP-F Gilimanuk 133,80 1 133,80PLTG-M | GTPP-F Pemaron 48,80 48,80 - 3 97,60
Jawa Bali grid & EmBEdEd
134 8.935,86
laporan statistik 2013 PT Indonesia Power30
Indonesia Power
PT Indonesia Power 2013 statistic report 31
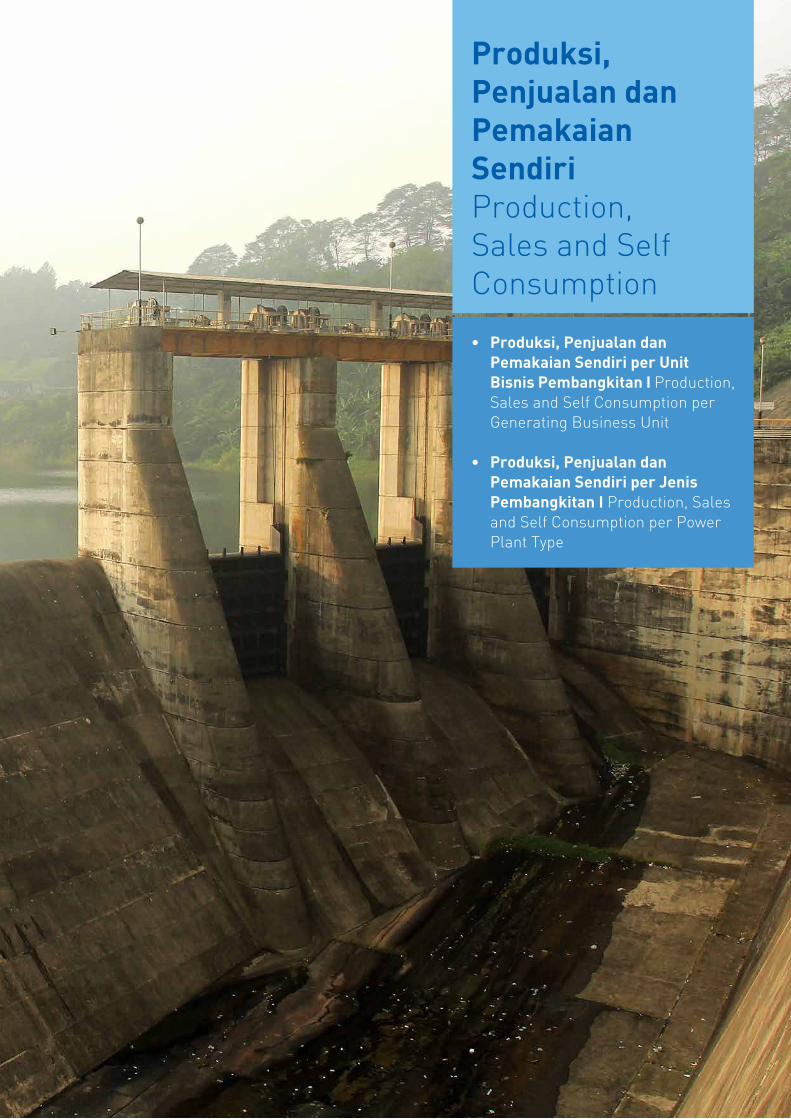
Produksi,PenjualandanPemakaianSendiriproduction, Sales and Self consumption
• Produksi,PenjualandanPemakaianSendiriperUnitBisnisPembangkitanIproduction, Sales and Self consumption per generating Business unit
• Produksi,PenjualandanPemakaianSendiriperJenisPembangkitanIproduction, Sales and Self consumption per power plant type
laporan statistik 2013 PT Indonesia Power32
Produksi, Penjualan dan Pemakaian Sendiri | Production, Sales and Self Consumption
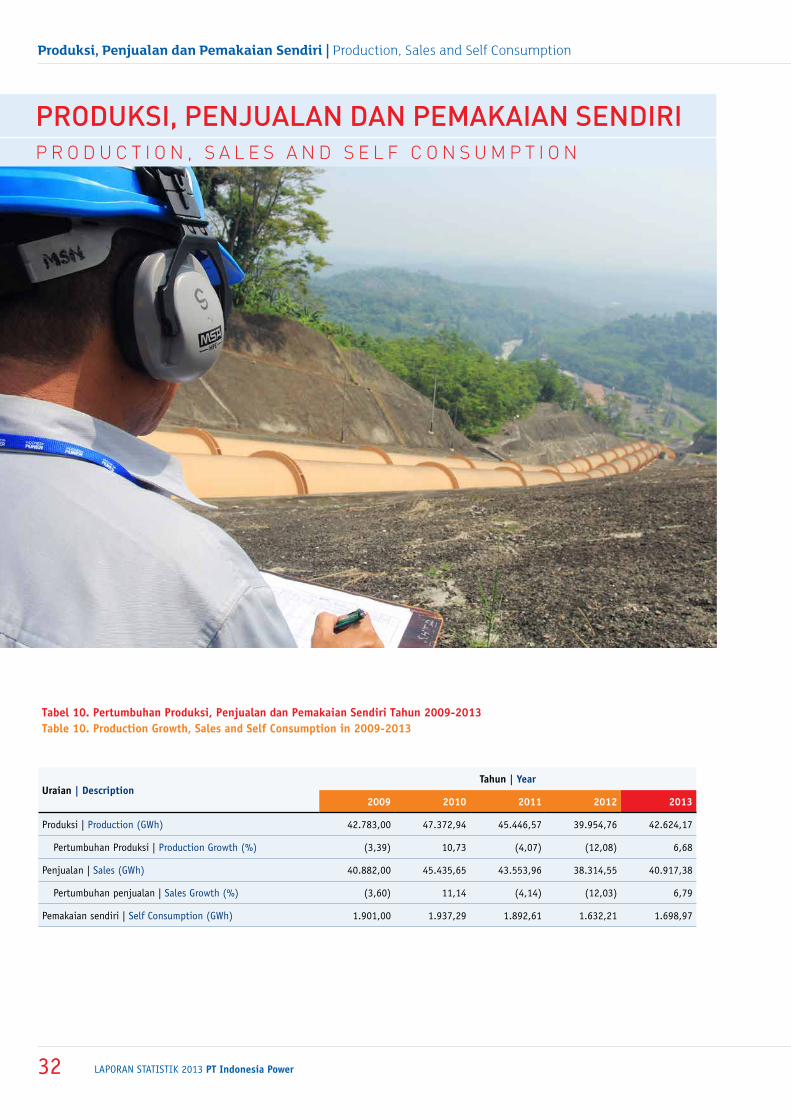
tabel 10. pertumbuhan produksi, penjualan dan pemakaian Sendiri tahun 2009-2013table 10. production growth, Sales and Self consumption in 2009-2013
uraian | descriptiontahun | year
2009 2010 2011 2012 2013
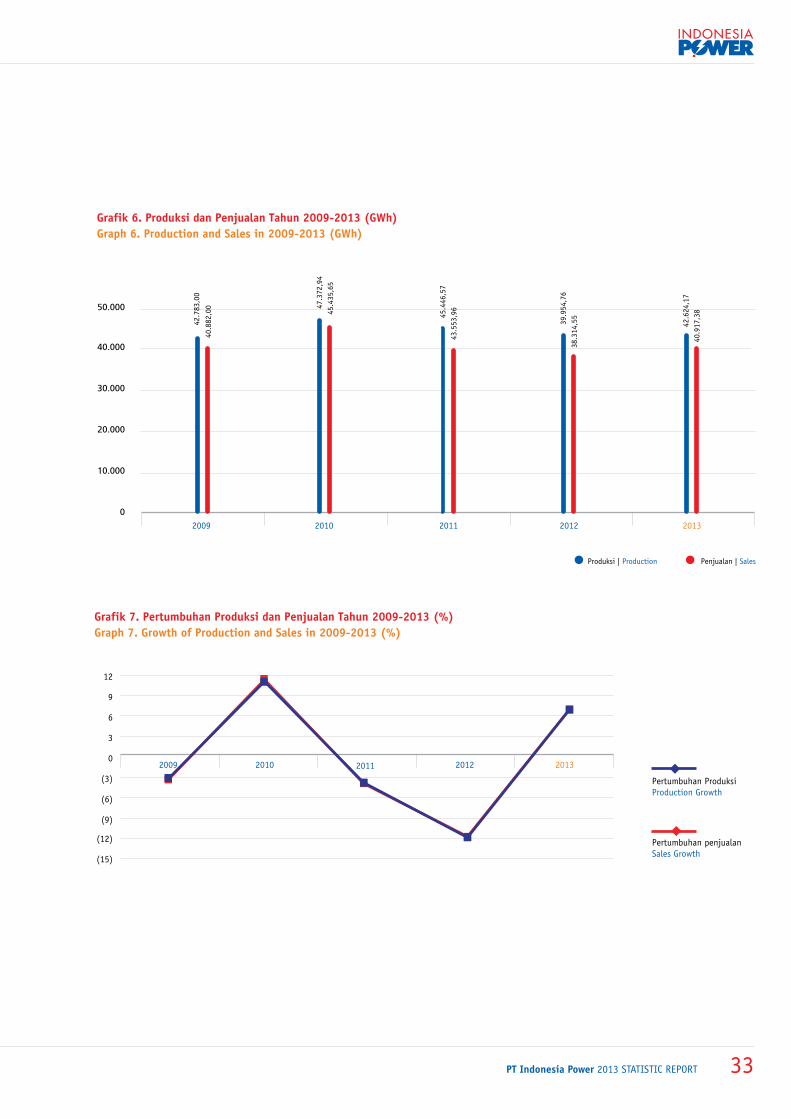
Produksi | Production (GWh) 42.783,00 47.372,94 45.446,57 39.954,76 42.624,17
Pertumbuhan Produksi | Production Growth (%) (3,39) 10,73 (4,07) (12,08) 6,68
Penjualan | Sales (GWh) 40.882,00 45.435,65 43.553,96 38.314,55 40.917,38
Pertumbuhan penjualan | Sales Growth (%) (3,60) 11,14 (4,14) (12,03) 6,79
Pemakaian sendiri | Self Consumption (GWh) 1.901,00 1.937,29 1.892,61 1.632,21 1.698,97
PRoduksi, Penjualan dan Pemakaian sendiRip R o d u c t i o n , S a l e S a n d S e l f c o n S u m p t i o n
PT Indonesia Power 2013 statistic report 33
grafik 6. produksi dan penjualan tahun 2009-2013 (gwh)graph 6. production and Sales in 2009-2013 (gwh)
grafik 7. pertumbuhan produksi dan penjualan tahun 2009-2013 (%)graph 7. growth of production and Sales in 2009-2013 (%)
Produksi | Production
50.000
40.000
30.000
20.000
10.000
0
2009 2010 2011 2012 2013
42.
783,
00
47.
372,
94
40.
882,
00
45.
435,
65
45.
446,
57
43.
553,
96
39.
954,
76
38.
314,
55
42.6
24,1
740
.917
,38
Penjualan | Sales
Pertumbuhan Produksi Production Growth
Pertumbuhan penjualan Sales Growth
(15)
(12)
(9)
(6)
(3)
0
3
6
9
12
2009 2010 2011 20132012
laporan statistik 2013 PT Indonesia Power34
Produksi, Penjualan dan Pemakaian Sendiri | Production, Sales and Self Consumption
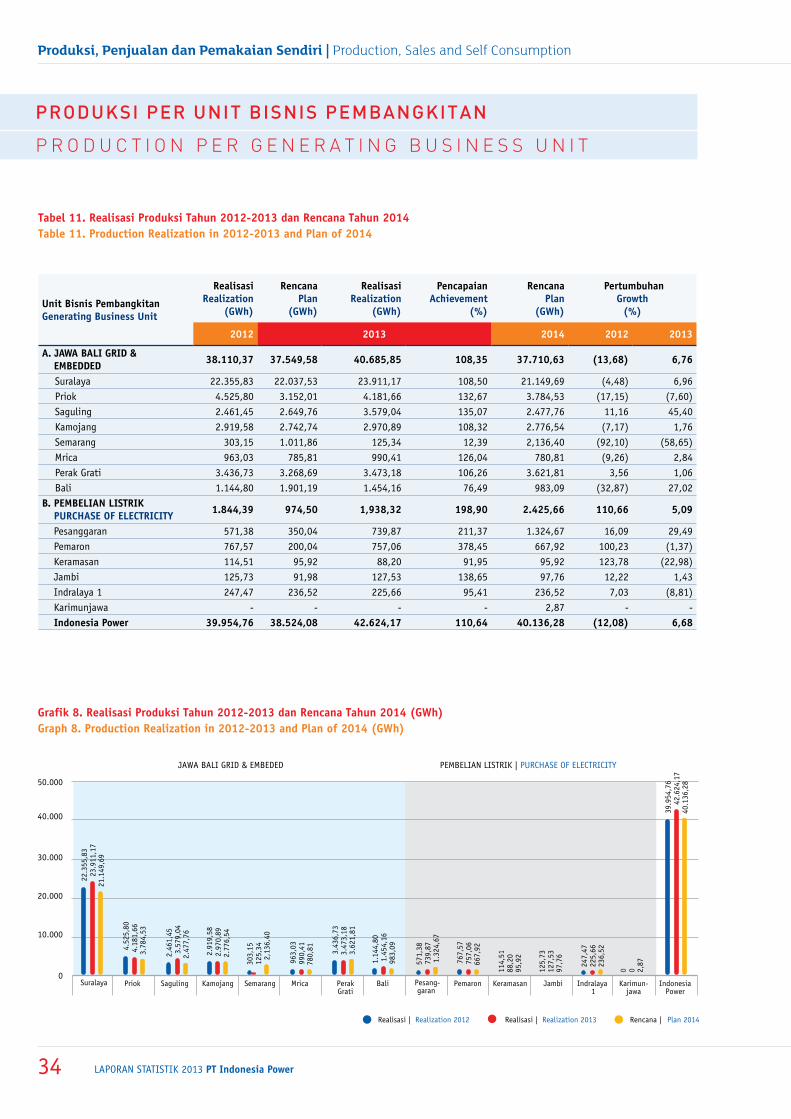
grafik 8. realisasi produksi tahun 2012-2013 dan rencana tahun 2014 (gwh)graph 8. production realization in 2012-2013 and plan of 2014 (gwh)
tabel 11. realisasi produksi tahun 2012-2013 dan rencana tahun 2014table 11. production realization in 2012-2013 and plan of 2014
unit Bisnis pembangkitangenerating Business unit
realisasi realization
(gwh)
rencana plan
(gwh)
realisasi realization
(gwh)
pencapaian achievement
(%)
rencanaplan
(gwh)
pertumbuhangrowth
(%)
2012 2013 2014 2012 2013
a. Jawa Bali grid & EmBEddEd 38.110,37 37.549,58 40.685,85 108,35 37.710,63 (13,68) 6,76
Suralaya 22.355,83 22.037,53 23.911,17 108,50 21.149,69 (4,48) 6,96 Priok 4.525,80 3.152,01 4.181,66 132,67 3.784,53 (17,15) (7,60) Saguling 2.461,45 2.649,76 3.579,04 135,07 2.477,76 11,16 45,40 Kamojang 2.919,58 2.742,74 2.970,89 108,32 2.776,54 (7,17) 1,76 Semarang 303,15 1.011,86 125,34 12,39 2,136,40 (92,10) (58,65) Mrica 963,03 785,81 990,41 126,04 780,81 (9,26) 2,84 Perak Grati 3.436,73 3.268,69 3.473,18 106,26 3.621,81 3,56 1,06 Bali 1.144,80 1.901,19 1.454,16 76,49 983,09 (32,87) 27,02
B. pEmBElian liStrik purchaSE of ElEctricity 1.844,39 974,50 1,938,32 198,90 2.425,66 110,66 5,09
Pesanggaran 571,38 350,04 739,87 211,37 1.324,67 16,09 29,49Pemaron 767,57 200,04 757,06 378,45 667,92 100,23 (1,37)Keramasan 114,51 95,92 88,20 91,95 95,92 123,78 (22,98)Jambi 125,73 91,98 127,53 138,65 97,76 12,22 1,43Indralaya 1 247,47 236,52 225,66 95,41 236,52 7,03 (8,81)Karimunjawa - - - - 2,87 - -indonesia power 39.954,76 38.524,08 42.624,17 110,64 40.136,28 (12,08) 6,68
PRoduksi PeR unit bisnis Pembangkitan
p R o d u c t i o n p e R g e n e R a t i n g B u S i n e S S u n i t
Realisasi | Realization 2012 Realisasi | Realization 2013 Rencana | Plan 2014
Priok Saguling Kamojang Mrica Semarang PerakGrati
Bali Suralaya Pemaron Keramasan Jambi Indralaya 1
Karimun-jawa
IndonesiaPower
Pesang-garan
50.000
JAWA BALI GRID & EMBEDED PEMBELIAN LISTRIK | PURCHASE OF ELECTRICITY
40.000
30.000
20.000
10.000
0
22.3
55,8
323
.911
,17
21.1
49,6
9
4.52
5,80
4.18
1,66
3.78
4,53
2.46
1,45
3.57
9,04
2.47
7,76
2.91
9,58
2.97
0,89
2.77
6,54
303,
15 1
25,3
42,
136,
40
963,
0399
0,41
780,
81 3.43
6,73
3.47
3,18
3.62
1,81
1.14
4,80
1.45
4,16
983,
09
571,
38
739,
871.
324,
67
767,
5775
7,06
667,
92
114,
5188
,20
95,9
2
125,
7312
7,53
97,7
6
0 0 2,8724
7,47
225,
6623
6,52
39.9
54,7
642
.624
,17
40.1
36,2
8
PT Indonesia Power 2013 statistic report 35
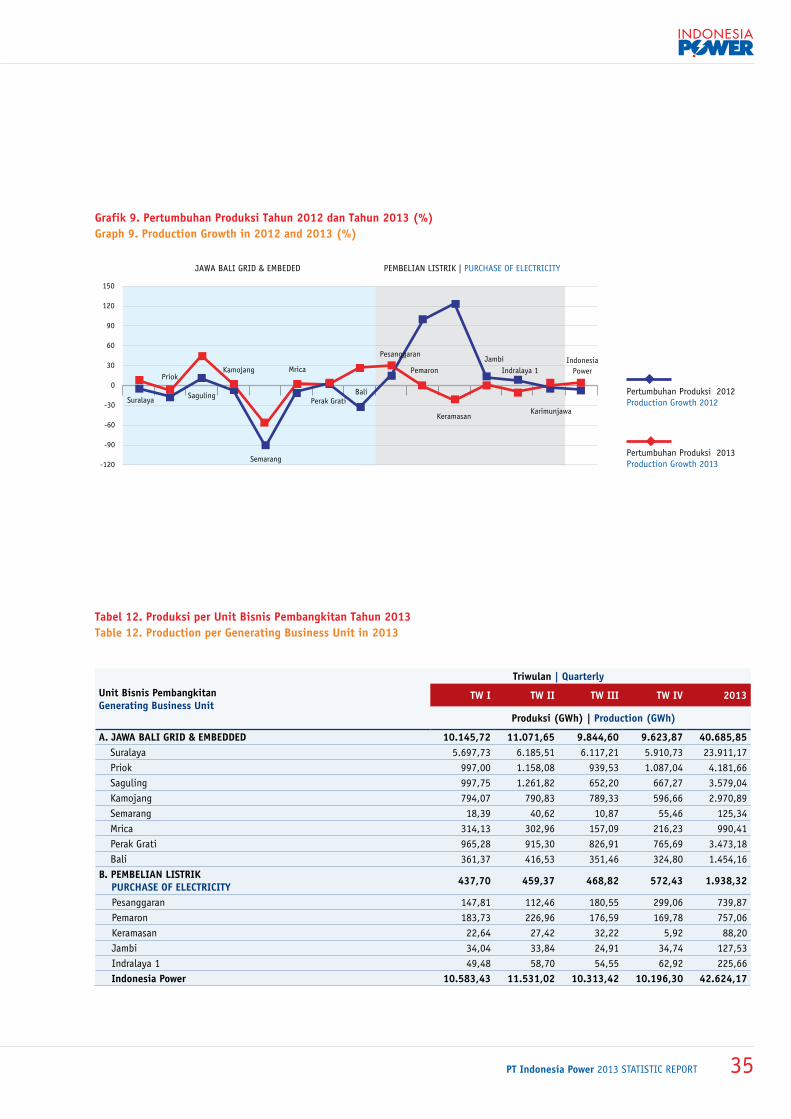
grafik 9. pertumbuhan produksi tahun 2012 dan tahun 2013 (%)graph 9. production growth in 2012 and 2013 (%)
tabel 12. produksi per unit Bisnis pembangkitan tahun 2013 table 12. production per generating Business unit in 2013
unit Bisnis pembangkitangenerating Business unit
triwulan | Quarterly
tw i tw ii tw iii tw iv 2013
produksi (gwh) | production (gwh)
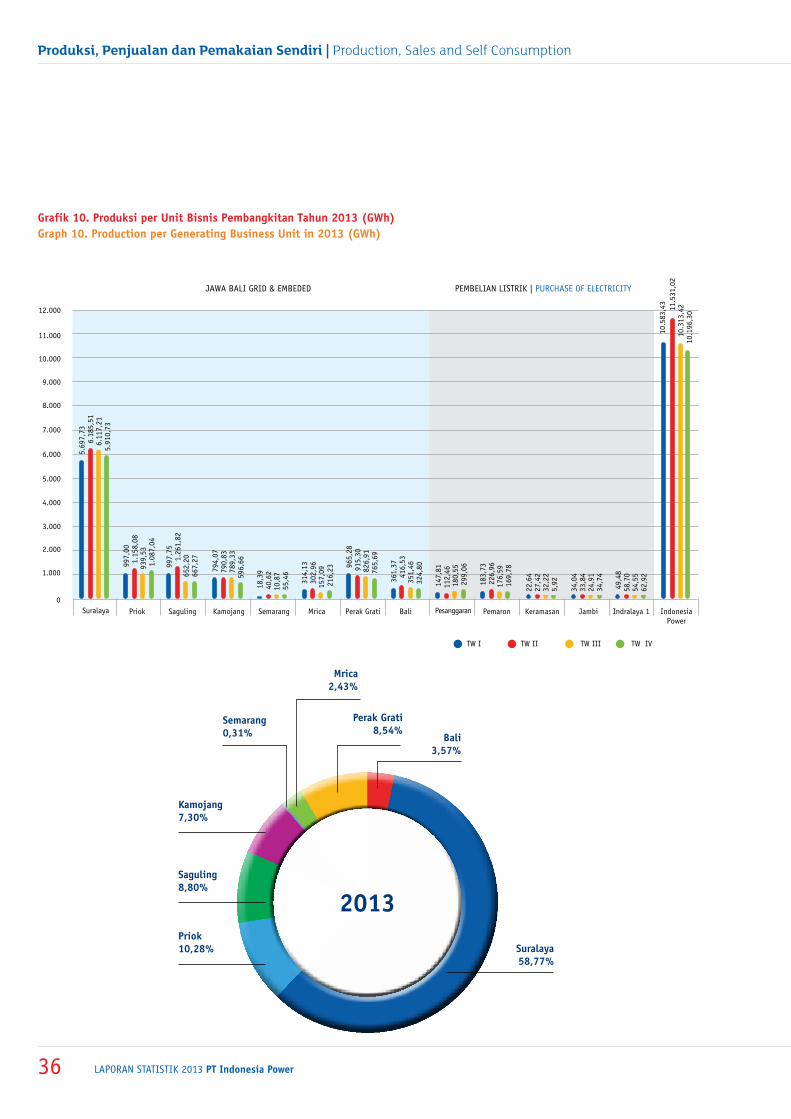
a. Jawa Bali grid & EmBEddEd 10.145,72 11.071,65 9.844,60 9.623,87 40.685,85 Suralaya 5.697,73 6.185,51 6.117,21 5.910,73 23.911,17 Priok 997,00 1.158,08 939,53 1.087,04 4.181,66 Saguling 997,75 1.261,82 652,20 667,27 3.579,04 Kamojang 794,07 790,83 789,33 596,66 2.970,89 Semarang 18,39 40,62 10,87 55,46 125,34 Mrica 314,13 302,96 157,09 216,23 990,41 Perak Grati 965,28 915,30 826,91 765,69 3.473,18 Bali 361,37 416,53 351,46 324,80 1.454,16
B. pEmBElian liStrik purchaSE of ElEctricity 437,70 459,37 468,82 572,43 1.938,32
Pesanggaran 147,81 112,46 180,55 299,06 739,87 Pemaron 183,73 226,96 176,59 169,78 757,06 Keramasan 22,64 27,42 32,22 5,92 88,20 Jambi 34,04 33,84 24,91 34,74 127,53 Indralaya 1 49,48 58,70 54,55 62,92 225,66
indonesia power 10.583,43 11.531,02 10.313,42 10.196,30 42.624,17
Pertumbuhan Produksi 2012 Production Growth 2012
Pertumbuhan Produksi 2013 Production Growth 2013
Suralaya
Priok
Saguling
Kamojang
Semarang
Mrica
Perak GratiBali
Pemaron
Keramasan
JambiIndralaya 1
Karimunjawa
IndonesiaPower
-120
-90
-60
-30
0
30
60
90
120
150
JAWA BALI GRID & EMBEDED PEMBELIAN LISTRIK | PURCHASE OF ELECTRICITY
Pesanggaran
laporan statistik 2013 PT Indonesia Power36
Produksi, Penjualan dan Pemakaian Sendiri | Production, Sales and Self Consumption
grafik 10. produksi per unit Bisnis pembangkitan tahun 2013 (gwh)graph 10. production per generating Business unit in 2013 (gwh)
2013
Bali 3,57%
perak grati 8,54%
mrica 2,43%
Saguling 8,80%
kamojang 7,30%
priok 10,28% Suralaya
58,77%
Semarang 0,31%
JAWA BALI GRID & EMBEDED PEMBELIAN LISTRIK | PURCHASE OF ELECTRICITY
Priok Saguling Kamojang Mrica Semarang Perak Grati Bali Suralaya Pemaron Keramasan Jambi Indralaya 1 IndonesiaPower
Pesanggaran
5.000
6.000
7.000
8.000
9.000
10.000
11.000
12.000
4.000
3.000
2.000
1.000
0
5.69
7,73
6.18
5,51
6.11
7,21
5.91
0,73
10.
583,
43
11.
531,
02
10.
313,
42
10.
196,
30
997,
001.
158,
0893
9,53
1.08
7,04
997,
751.
261,
8265
2,20
667,
27
794,
0779
0,83
789,
3359
6,66
18,
3940
,62
10,8
755
,46
314,
1330
2,96
157,
0921
6,23 96
5,28
915,
3082
6,91
765,
69
361,
37 4
16,5
335
1,46
324,
80
147,
8111
2,46
180,
5529
9,06
183,
7322
6,96
17
6,59
169,
78
22,6
427
,42
32,2
25,
92
34,0
433
,84
24,9
134
,74
49,
4858
,70
54,5
562
,92
TW I TW II TW III TW IV
PT Indonesia Power 2013 statistic report 37
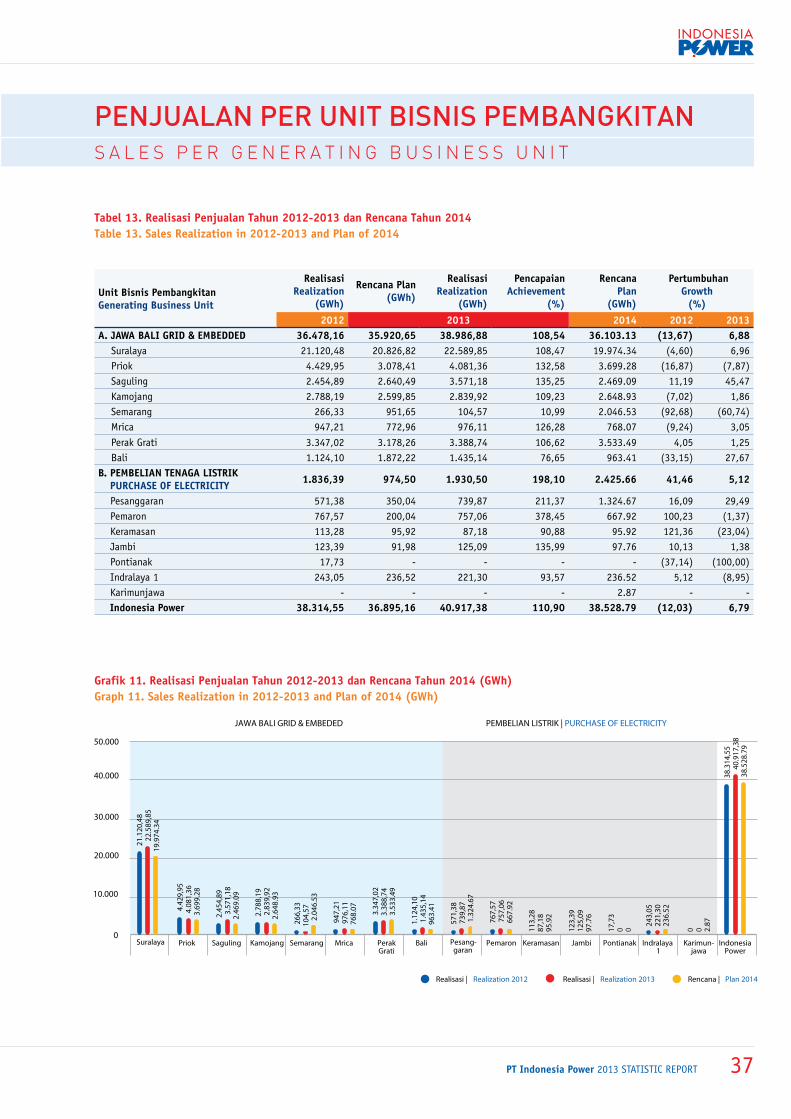
grafik 11. realisasi penjualan tahun 2012-2013 dan rencana tahun 2014 (gwh)graph 11. Sales realization in 2012-2013 and plan of 2014 (gwh)
tabel 13. realisasi penjualan tahun 2012-2013 dan rencana tahun 2014table 13. Sales realization in 2012-2013 and plan of 2014
unit Bisnis pembangkitangenerating Business unit
realisasi realization
(gwh)
rencana plan (gwh)
realisasi realization
(gwh)
pencapaian achievement
(%)
rencanaplan
(gwh)
pertumbuhan growth
(%) 2012 2013 2014 2012 2013
a. Jawa Bali grid & EmBEddEd 36.478,16 35.920,65 38.986,88 108,54 36.103.13 (13,67) 6,88 Suralaya 21.120,48 20.826,82 22.589,85 108,47 19.974.34 (4,60) 6,96 Priok 4.429,95 3.078,41 4.081,36 132,58 3.699.28 (16,87) (7,87) Saguling 2.454,89 2.640,49 3.571,18 135,25 2.469.09 11,19 45,47 Kamojang 2.788,19 2.599,85 2.839,92 109,23 2.648.93 (7,02) 1,86 Semarang 266,33 951,65 104,57 10,99 2.046.53 (92,68) (60,74) Mrica 947,21 772,96 976,11 126,28 768.07 (9,24) 3,05 Perak Grati 3.347,02 3.178,26 3.388,74 106,62 3.533.49 4,05 1,25 Bali 1.124,10 1.872,22 1.435,14 76,65 963.41 (33,15) 27,67
B. pEmBElian tEnaga liStrik purchaSE of ElEctricity 1.836,39 974,50 1.930,50 198,10 2.425.66 41,46 5,12
Pesanggaran 571,38 350,04 739,87 211,37 1.324.67 16,09 29,49Pemaron 767,57 200,04 757,06 378,45 667.92 100,23 (1,37)Keramasan 113,28 95,92 87,18 90,88 95.92 121,36 (23,04)Jambi 123,39 91,98 125,09 135,99 97.76 10,13 1,38Pontianak 17,73 - - - - (37,14) (100,00)Indralaya 1 243,05 236,52 221,30 93,57 236.52 5,12 (8,95)Karimunjawa - - - - 2.87 - -indonesia power 38.314,55 36.895,16 40.917,38 110,90 38.528.79 (12,03) 6,79
JAWA BALI GRID & EMBEDED PEMBELIAN LISTRIK | PURCHASE OF ELECTRICITY
Realisasi | Realization 2012 Realisasi | Realization 2013 Rencana | Plan 2014
Priok Saguling Kamojang Mrica Semarang PerakGrati
Bali Suralaya Pemaron Keramasan Jambi Indralaya 1
Pontianak Karimun-jawa
IndonesiaPower
Pesang-garan
50.000
40.000
30.000
20.000
10.000
0
21.1
20,4
822
.589
,85
19.9
74.3
4
4.42
9,95
4.08
1,36
3.69
9.28
2.45
4,89
3.
571,
18
2.46
9.09
2.78
8,19
2.8
39,9
22.
648.
93
266,
3310
4,57
2.04
6.53
947,
2197
6,11
768.
07
3.34
7,02
3.38
8,74
3.
533.
49
1.12
4,10
1.43
5,14
963.
41
571,
38
739,
871.
324.
67
767,
57 7
57,0
6 6
67.9
2
113,
2887
,18
95.9
2
123,
39
125,
0997
.76
17,7
30 0 0 0 2.
87243,
0522
1,30
236.
52
38.3
14,5
5 40
.917
,38
38.5
28.7
9
Penjualan PeR unit bisnis PembangkitanS a l e S p e R g e n e R a t i n g B u S i n e S S u n i t
laporan statistik 2013 PT Indonesia Power38
Produksi, Penjualan dan Pemakaian Sendiri | Production, Sales and Self Consumption
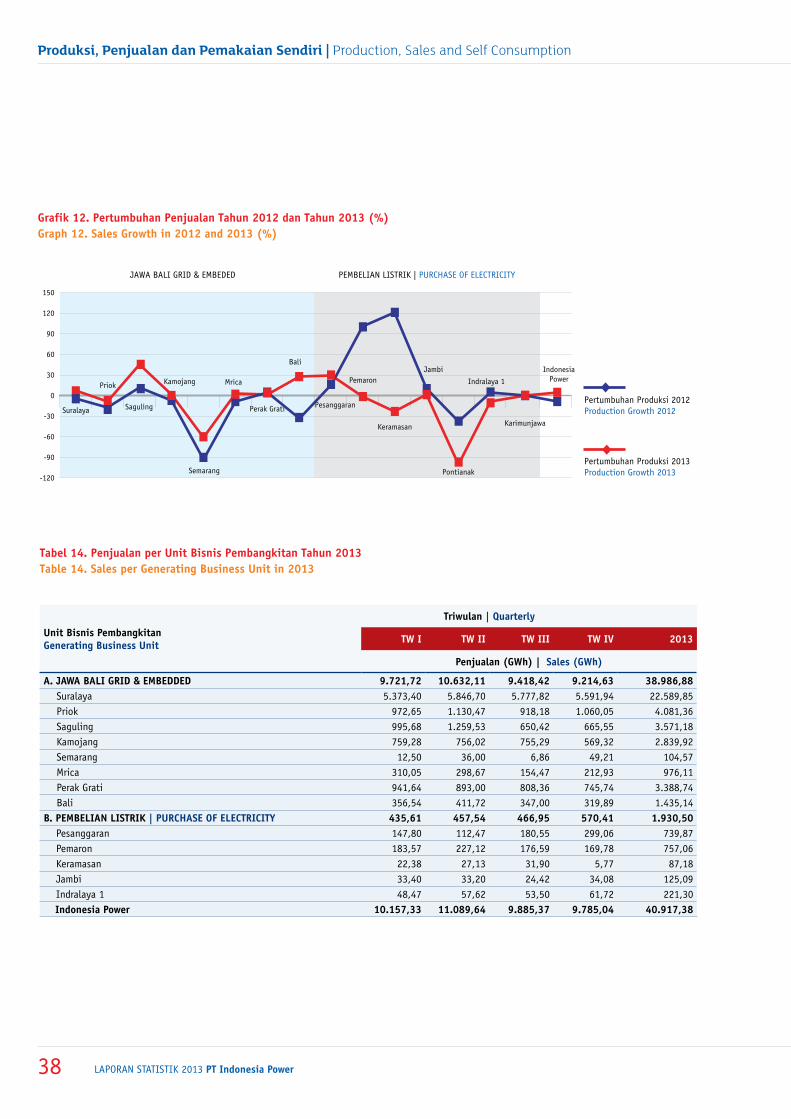
grafik 12. pertumbuhan penjualan tahun 2012 dan tahun 2013 (%)graph 12. Sales growth in 2012 and 2013 (%)
tabel 14. penjualan per unit Bisnis pembangkitan tahun 2013table 14. Sales per generating Business unit in 2013
unit Bisnis pembangkitangenerating Business unit
triwulan | Quarterly
tw i tw ii tw iii tw iv 2013
penjualan (gwh) | Sales (gwh)
a. Jawa Bali grid & EmBEddEd 9.721,72 10.632,11 9.418,42 9.214,63 38.986,88 Suralaya 5.373,40 5.846,70 5.777,82 5.591,94 22.589,85 Priok 972,65 1.130,47 918,18 1.060,05 4.081,36 Saguling 995,68 1.259,53 650,42 665,55 3.571,18 Kamojang 759,28 756,02 755,29 569,32 2.839,92 Semarang 12,50 36,00 6,86 49,21 104,57 Mrica 310,05 298,67 154,47 212,93 976,11 Perak Grati 941,64 893,00 808,36 745,74 3.388,74 Bali 356,54 411,72 347,00 319,89 1.435,14
B. pEmBElian liStrik | purchaSE of ElEctricity 435,61 457,54 466,95 570,41 1.930,50 Pesanggaran 147,80 112,47 180,55 299,06 739,87 Pemaron 183,57 227,12 176,59 169,78 757,06 Keramasan 22,38 27,13 31,90 5,77 87,18 Jambi 33,40 33,20 24,42 34,08 125,09 Indralaya 1 48,47 57,62 53,50 61,72 221,30 indonesia power 10.157,33 11.089,64 9.885,37 9.785,04 40.917,38
JAWA BALI GRID & EMBEDED PEMBELIAN LISTRIK | PURCHASE OF ELECTRICITY
Pertumbuhan Produksi 2012 Production Growth 2012
Pertumbuhan Produksi 2013 Production Growth 2013
Suralaya
Priok
Saguling
Kamojang
Semarang
Mrica
Perak Grati
Bali
Pesanggaran
Pemaron
Keramasan
Jambi
Pontianak
Indralaya 1
Karimunjawa
IndonesiaPower
-120
-90
-60
-30
0
30
60
90
120
150
PT Indonesia Power 2013 statistic report 39
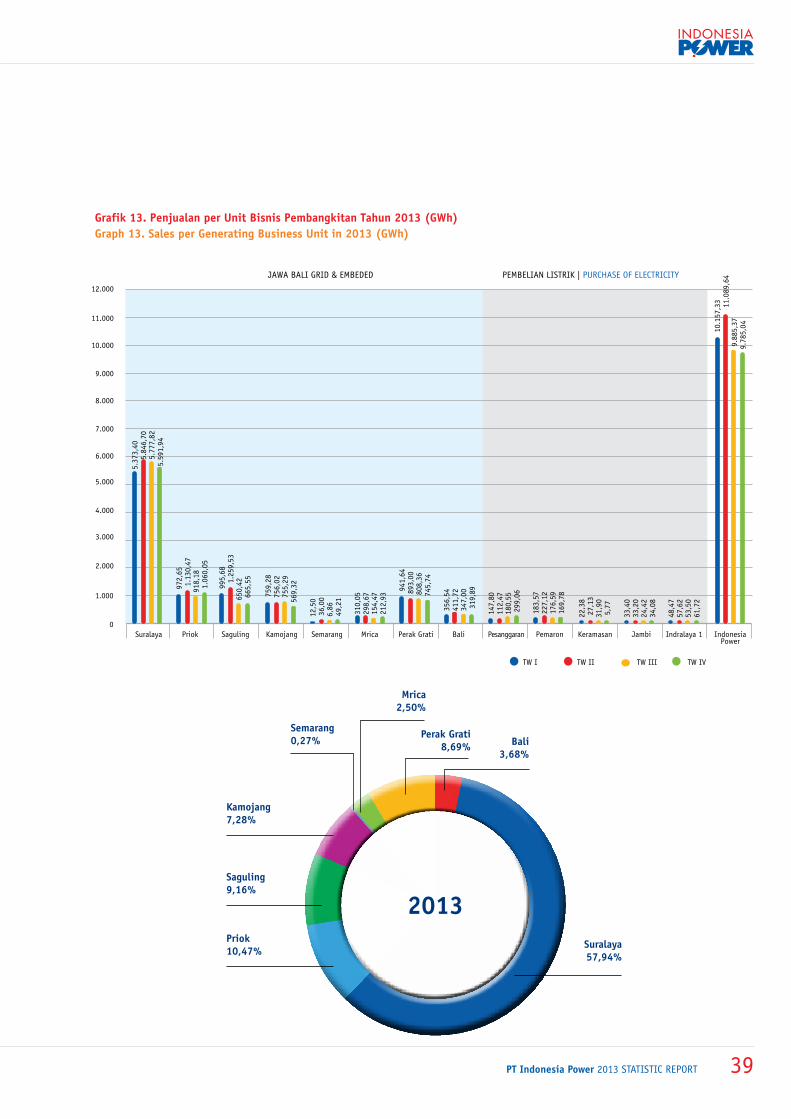
grafik 13. penjualan per unit Bisnis pembangkitan tahun 2013 (gwh)graph 13. Sales per generating Business unit in 2013 (gwh)
2013
Bali 3,68%
perak grati 8,69%
mrica 2,50%
Saguling 9,16%
kamojang 7,28%
priok 10,47%
Suralaya 57,94%
Semarang 0,27%
JAWA BALI GRID & EMBEDED PEMBELIAN LISTRIK | PURCHASE OF ELECTRICITY
Priok Saguling Kamojang Mrica Semarang Perak Grati Bali Suralaya Pemaron Keramasan Jambi Indralaya 1 IndonesiaPower
Pesanggaran
5.000
6.000
7.000
8.000
9.000
10.000
11.000
12.000
4.000
3.000
2.000
1.000
0
5.37
3,40
5.84
6,70
5
.777
,82
5.59
1,94
10.1
57,3
3 1
1.08
9,64
9.88
5,37
9.
785,
04
972,
65
1.13
0,47
918,
18
1.06
0,05
995,
681.
259,
5365
0,42
665
,55
759,
2875
6,02
755,
2956
9,32
12,5
036
,00
6,86
49,2
1
310,
0529
8,67
154,
4721
2,93
941,
64
893,
00
808,
3674
5,74
356,
5441
1,72
347,
00
319
,89
147,
80
112,
4718
0,55
299
,06
183,
5722
7,12
176,
5916
9,78
22,3
8 2
7,13
31,9
0 5
,77
33,4
0 33
,20
24,4
234
,08
48,4
757
,62
53,5
061
,72
TW I TW II TW III TW IV
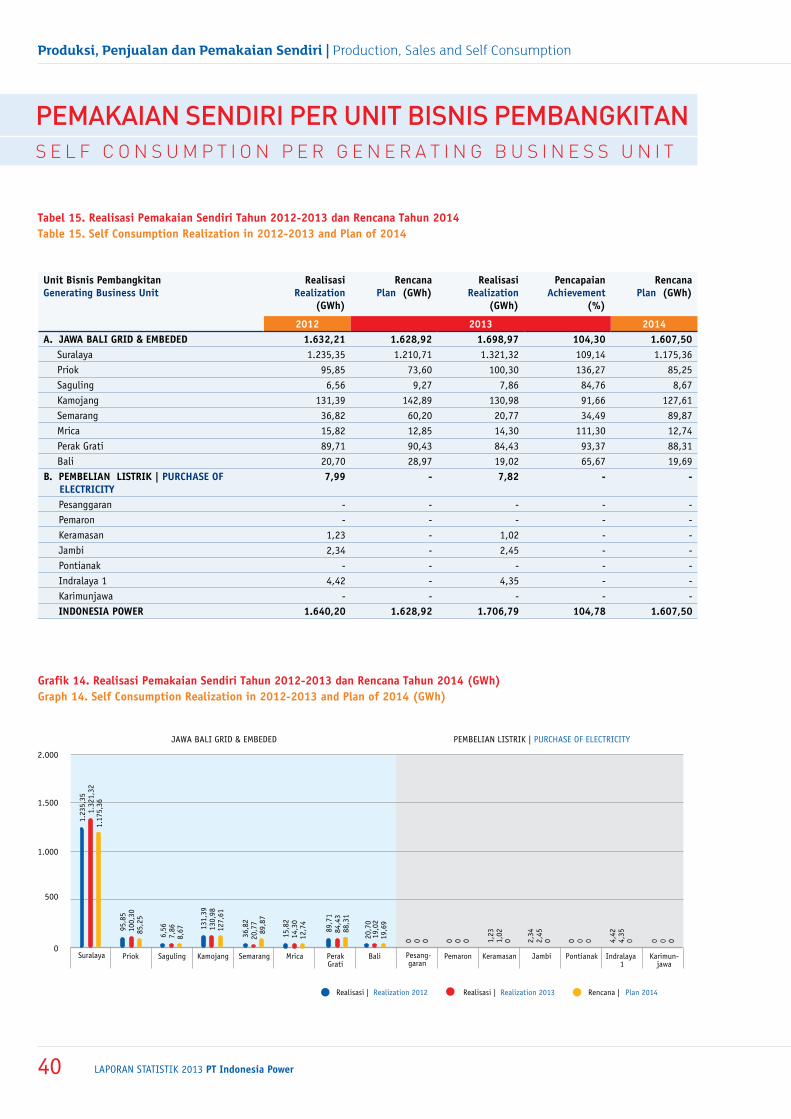
laporan statistik 2013 PT Indonesia Power40
Produksi, Penjualan dan Pemakaian Sendiri | Production, Sales and Self Consumption
grafik 14. realisasi pemakaian Sendiri tahun 2012-2013 dan rencana tahun 2014 (gwh)graph 14. Self consumption realization in 2012-2013 and plan of 2014 (gwh)
tabel 15. realisasi pemakaian Sendiri tahun 2012-2013 dan rencana tahun 2014table 15. Self consumption realization in 2012-2013 and plan of 2014
JAWA BALI GRID & EMBEDED PEMBELIAN LISTRIK | PURCHASE OF ELECTRICITY
Realisasi | Realization 2012 Realisasi | Realization 2013 Rencana | Plan 2014
Priok Saguling Kamojang Mrica Semarang PerakGrati
Bali Suralaya Pemaron Keramasan Jambi Indralaya 1
Pontianak Karimun-jawa
Pesang-garan
2.000
1.500
1.000
500
0
1.23
5,35
1.32
1,32
1.17
5,36
95,8
510
0,30
85,2
5
6,56
7,86
8,67 13
1,39
130,
9812
7,61
36,8
220
,77
89,8
7
15,8
214
,30
12,7
4
89,7
184
,43
88,3
1
20,7
019
,02
19,6
9
0 0 0 0 0 0 1,23
1,02
0 2,34
2,45
0 0 0 0 4,42
4,35
0 0 0 0
Pemakaian sendiRi PeR unit bisnis PembangkitanS e l f c o n S u m p t i o n p e R g e n e R a t i n g B u S i n e S S u n i t
unit Bisnis pembangkitangenerating Business unit
realisasi realization
(gwh)
rencanaplan (gwh)
realisasi realization
(gwh)
pencapaian achievement
(%)
rencanaplan (gwh)
2012 2013 2014a. Jawa Bali grid & EmBEdEd 1.632,21 1.628,92 1.698,97 104,30 1.607,50
Suralaya 1.235,35 1.210,71 1.321,32 109,14 1.175,36 Priok 95,85 73,60 100,30 136,27 85,25 Saguling 6,56 9,27 7,86 84,76 8,67 Kamojang 131,39 142,89 130,98 91,66 127,61 Semarang 36,82 60,20 20,77 34,49 89,87 Mrica 15,82 12,85 14,30 111,30 12,74 Perak Grati 89,71 90,43 84,43 93,37 88,31 Bali 20,70 28,97 19,02 65,67 19,69
B. pEmBElian liStrik | purchaSE of ElEctricity
7,99 - 7,82 - -
Pesanggaran - - - - -Pemaron - - - - -Keramasan 1,23 - 1,02 - -Jambi 2,34 - 2,45 - -Pontianak - - - - -Indralaya 1 4,42 - 4,35 - -Karimunjawa - - - - -indonESia powEr 1.640,20 1.628,92 1.706,79 104,78 1.607,50
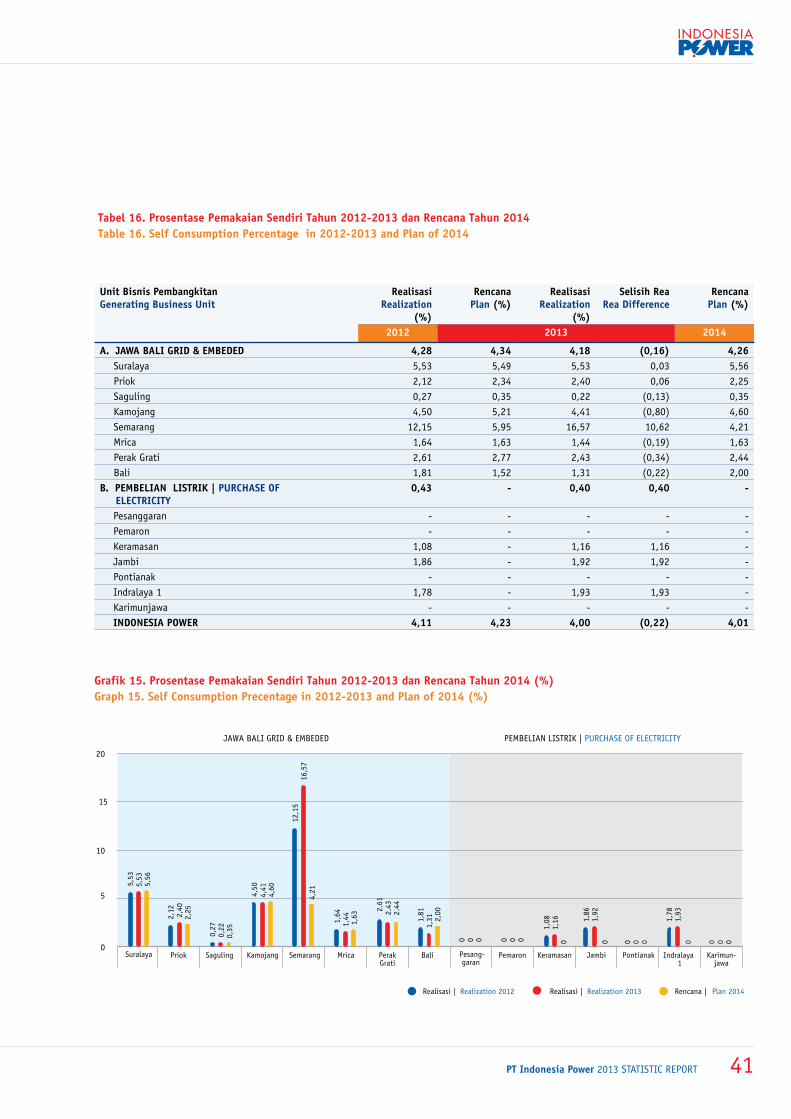
PT Indonesia Power 2013 statistic report 41
grafik 15. prosentase pemakaian Sendiri tahun 2012-2013 dan rencana tahun 2014 (%)graph 15. Self consumption precentage in 2012-2013 and plan of 2014 (%)
tabel 16. prosentase pemakaian Sendiri tahun 2012-2013 dan rencana tahun 2014 table 16. Self consumption percentage in 2012-2013 and plan of 2014
JAWA BALI GRID & EMBEDED PEMBELIAN LISTRIK | PURCHASE OF ELECTRICITY
Realisasi | Realization 2012 Realisasi | Realization 2013 Rencana | Plan 2014
Priok Saguling Kamojang Mrica Semarang PerakGrati
Bali Suralaya Pemaron Keramasan Jambi Indralaya 1
Pontianak Karimun-jawa
Pesang-garan
20
15
10
5
0
5,53
5,53
5,56
2,12 2,40
2,25
0,27
0,22
0,35
4,50
4,41
4,60
12,1
516
,57
4,21
2.6
1 2
.43
2.4
4
1,81
1,31 2,
00
1,64
1,44 1,63
0 0 0 0 0 0
1,08
1,16 1,
861,
92
1,78
1,93
0 0 0 0 0 0 0 0 0
unit Bisnis pembangkitangenerating Business unit
realisasi realization
(%)
rencanaplan (%)
realisasi realization
(%)
Selisih rea rea difference
rencanaplan (%)
2012 2013 2014
a. Jawa Bali grid & EmBEdEd 4,28 4,34 4,18 (0,16) 4,26 Suralaya 5,53 5,49 5,53 0,03 5,56 Priok 2,12 2,34 2,40 0,06 2,25 Saguling 0,27 0,35 0,22 (0,13) 0,35 Kamojang 4,50 5,21 4,41 (0,80) 4,60 Semarang 12,15 5,95 16,57 10,62 4,21 Mrica 1,64 1,63 1,44 (0,19) 1,63 Perak Grati 2,61 2,77 2,43 (0,34) 2,44 Bali 1,81 1,52 1,31 (0,22) 2,00
B. pEmBElian liStrik | purchaSE of ElEctricity
0,43 - 0,40 0,40 -
Pesanggaran - - - - -Pemaron - - - - -Keramasan 1,08 - 1,16 1,16 -Jambi 1,86 - 1,92 1,92 -Pontianak - - - - -Indralaya 1 1,78 - 1,93 1,93 -Karimunjawa - - - - -indonESia powEr 4,11 4,23 4,00 (0,22) 4,01
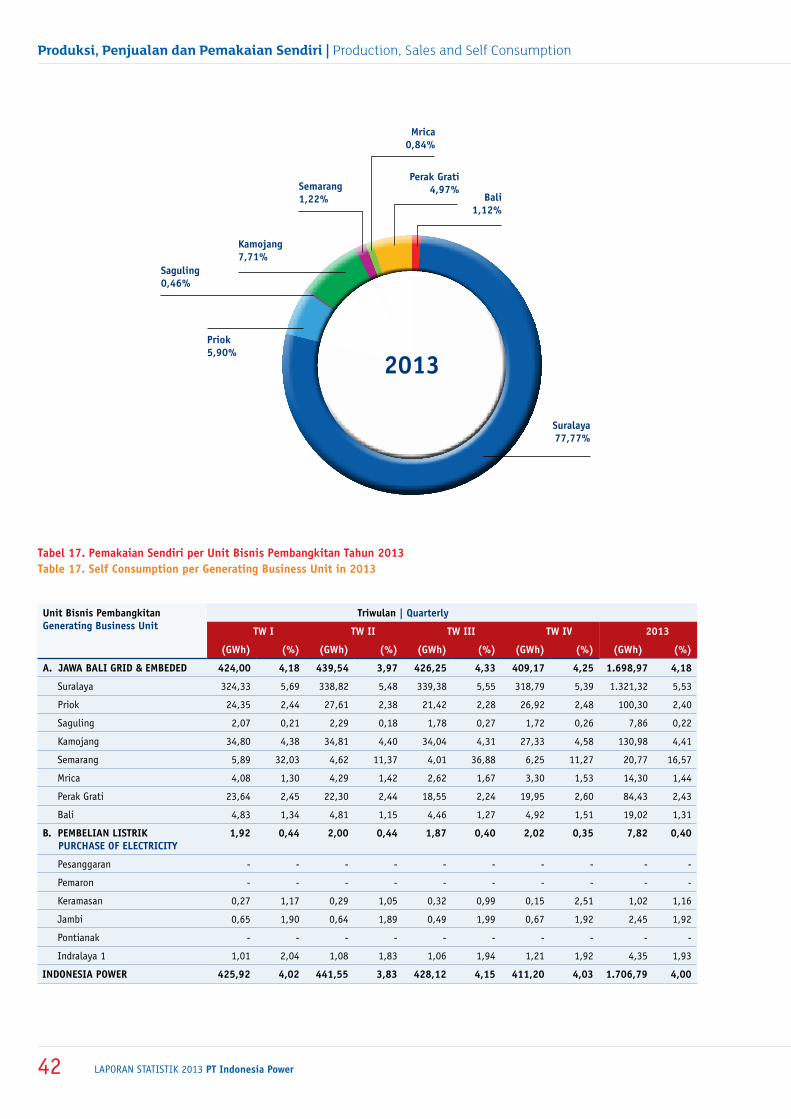
laporan statistik 2013 PT Indonesia Power42
Produksi, Penjualan dan Pemakaian Sendiri | Production, Sales and Self Consumption
2013
Bali 1,12%
perak grati 4,97%
mrica 0,84%
Saguling 0,46%
kamojang 7,71%
priok 5,90%
Suralaya 77,77%
Semarang 1,22%
tabel 17. pemakaian Sendiri per unit Bisnis pembangkitan tahun 2013 table 17. Self consumption per generating Business unit in 2013
unit Bisnis pembangkitangenerating Business unit
triwulan | Quarterly
tw i tw ii tw iii tw iv 2013
(gwh) (%) (gwh) (%) (gwh) (%) (gwh) (%) (gwh) (%)
a. Jawa Bali grid & EmBEdEd 424,00 4,18 439,54 3,97 426,25 4,33 409,17 4,25 1.698,97 4,18
Suralaya 324,33 5,69 338,82 5,48 339,38 5,55 318,79 5,39 1.321,32 5,53
Priok 24,35 2,44 27,61 2,38 21,42 2,28 26,92 2,48 100,30 2,40
Saguling 2,07 0,21 2,29 0,18 1,78 0,27 1,72 0,26 7,86 0,22
Kamojang 34,80 4,38 34,81 4,40 34,04 4,31 27,33 4,58 130,98 4,41
Semarang 5,89 32,03 4,62 11,37 4,01 36,88 6,25 11,27 20,77 16,57
Mrica 4,08 1,30 4,29 1,42 2,62 1,67 3,30 1,53 14,30 1,44
Perak Grati 23,64 2,45 22,30 2,44 18,55 2,24 19,95 2,60 84,43 2,43
Bali 4,83 1,34 4,81 1,15 4,46 1,27 4,92 1,51 19,02 1,31
B. pEmBElian liStrik purchaSE of ElEctricity
1,92 0,44 2,00 0,44 1,87 0,40 2,02 0,35 7,82 0,40
Pesanggaran - - - - - - - - - -
Pemaron - - - - - - - - - -
Keramasan 0,27 1,17 0,29 1,05 0,32 0,99 0,15 2,51 1,02 1,16
Jambi 0,65 1,90 0,64 1,89 0,49 1,99 0,67 1,92 2,45 1,92
Pontianak - - - - - - - - - -
Indralaya 1 1,01 2,04 1,08 1,83 1,06 1,94 1,21 1,92 4,35 1,93
indonESia powEr 425,92 4,02 441,55 3,83 428,12 4,15 411,20 4,03 1.706,79 4,00
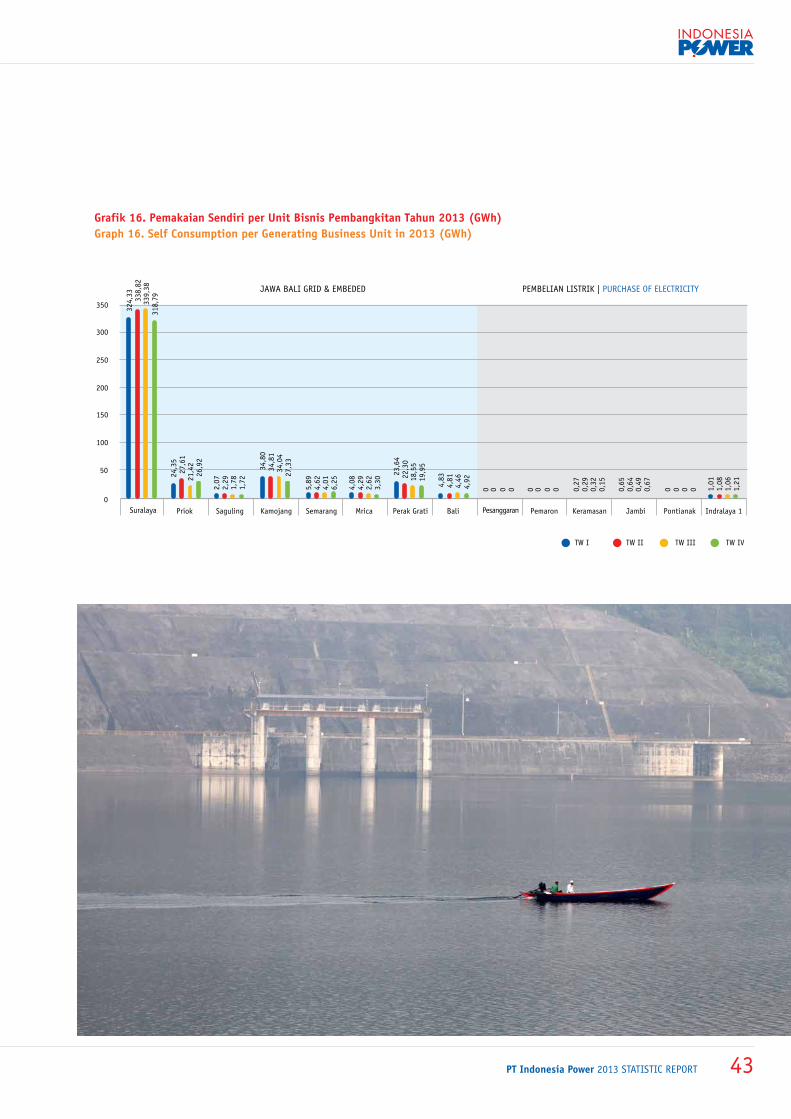
PT Indonesia Power 2013 statistic report 43
grafik 16. pemakaian Sendiri per unit Bisnis pembangkitan tahun 2013 (gwh)graph 16. Self consumption per generating Business unit in 2013 (gwh)
JAWA BALI GRID & EMBEDED PEMBELIAN LISTRIK | PURCHASE OF ELECTRICITY
Priok Saguling Kamojang Mrica Semarang Perak Grati Bali Suralaya Pemaron Keramasan Jambi Indralaya 1Pontianak Pesanggaran
300
250
350
200
150
100
50
0
324,
33 338,
8233
9,38
318,
79
24,3
527
,61
21,4
226
,92
2,07
2,29
1,78
1,72
34,8
034
,81
34,0
427
,33
5,89
4,62
4,01
6,25
4,08
4,29
2,62
3,30
23,6
422
,30
18,5
519
,95
4,83
4,81
4,46
4,92
0 00 0 0 00 0 0,27
0,29
0,32
0,15
0,65
0,64
0,49
0,67
1,01
1,08
1,06
1,21
0 0 0 0
TW I TW II TW III TW IV
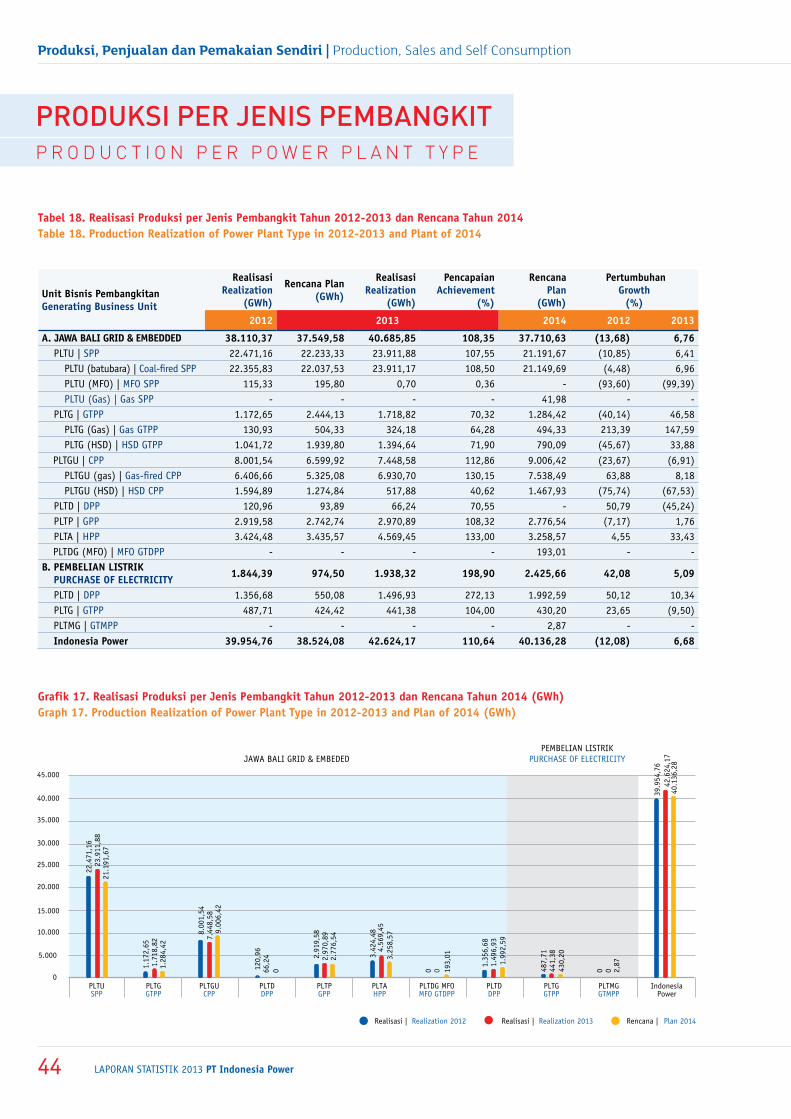
laporan statistik 2013 PT Indonesia Power44
Produksi, Penjualan dan Pemakaian Sendiri | Production, Sales and Self Consumption
grafik 17. realisasi produksi per Jenis pembangkit tahun 2012-2013 dan rencana tahun 2014 (gwh)graph 17. production realization of power plant type in 2012-2013 and plan of 2014 (gwh)
tabel 18. realisasi produksi per Jenis pembangkit tahun 2012-2013 dan rencana tahun 2014table 18. production realization of power plant type in 2012-2013 and plant of 2014
unit Bisnis pembangkitangenerating Business unit
realisasi realization
(gwh)
rencana plan (gwh)
realisasi realization
(gwh)
pencapaian achievement
(%)
rencana plan
(gwh)
pertumbuhangrowth
(%)
2012 2013 2014 2012 2013
a. Jawa Bali grid & EmBEddEd 38.110,37 37.549,58 40.685,85 108,35 37.710,63 (13,68) 6,76PLTU | SPP 22.471,16 22.233,33 23.911,88 107,55 21.191,67 (10,85) 6,41
PLTU (batubara) | Coal-fired SPP 22.355,83 22.037,53 23.911,17 108,50 21.149,69 (4,48) 6,96PLTU (MFO) | MFO SPP 115,33 195,80 0,70 0,36 - (93,60) (99,39)PLTU (Gas) | Gas SPP - - - - 41,98 - -
PLTG | GTPP 1.172,65 2.444,13 1.718,82 70,32 1.284,42 (40,14) 46,58PLTG (Gas) | Gas GTPP 130,93 504,33 324,18 64,28 494,33 213,39 147,59PLTG (HSD) | HSD GTPP 1.041,72 1.939,80 1.394,64 71,90 790,09 (45,67) 33,88
PLTGU | CPP 8.001,54 6.599,92 7.448,58 112,86 9.006,42 (23,67) (6,91)PLTGU (gas) | Gas-fired CPP 6.406,66 5.325,08 6.930,70 130,15 7.538,49 63,88 8,18PLTGU (HSD) | HSD CPP 1.594,89 1.274,84 517,88 40,62 1.467,93 (75,74) (67,53)
PLTD | DPP 120,96 93,89 66,24 70,55 - 50,79 (45,24)PLTP | GPP 2.919,58 2.742,74 2.970,89 108,32 2.776,54 (7,17) 1,76PLTA | HPP 3.424,48 3.435,57 4.569,45 133,00 3.258,57 4,55 33,43PLTDG (MFO) | MFO GTDPP - - - - 193,01 - -
B. pEmBElian liStrik purchaSE of ElEctricity 1.844,39 974,50 1.938,32 198,90 2.425,66 42,08 5,09
PLTD | DPP 1.356,68 550,08 1.496,93 272,13 1.992,59 50,12 10,34PLTG | GTPP 487,71 424,42 441,38 104,00 430,20 23,65 (9,50)PLTMG | GTMPP - - - - 2,87 - -indonesia power 39.954,76 38.524,08 42.624,17 110,64 40.136,28 (12,08) 6,68
PRoduksi PeR jenis Pembangkitp R o d u c t i o n p e R p o w e R p l a n t t y p e
Realisasi | Realization 2012 Realisasi | Realization 2013 Rencana | Plan 2014
PLTU SPP
PLTG GTPP
PLTGUCPP
PLTD DPP
PLTP GPP
PLTA HPP
PLTDG MFO MFO GTDPP
PLTD DPP
PLTG GTPP
PLTMG GTMPP
25.000
30.000
35.000
40.000
45.000
15.000
20.000
10.000
5.000
0
22.4
71,1
6 23
.911
,88
21.1
91,6
7
39.9
54,7
6
40.1
36,2
842
.624
,17
1.17
2,65
1.
718,
821.
284,
42
1.99
2,59
193,
01
8.0
01,5
47.
448,
58
9.00
6,42
3.42
4,48
3.25
8,57
4
.569
,45
120
,96
66,2
4 0
2.9
19,5
8 2.
970,
892.
776,
54
1.35
6,68
1.49
6,93
430,
20
487,
7144
1,38
0 0 0 0 2,87
IndonesiaPower
JAWA BALI GRID & EMBEDEDPEMBELIAN LISTRIK
PURCHASE OF ELECTRICITY
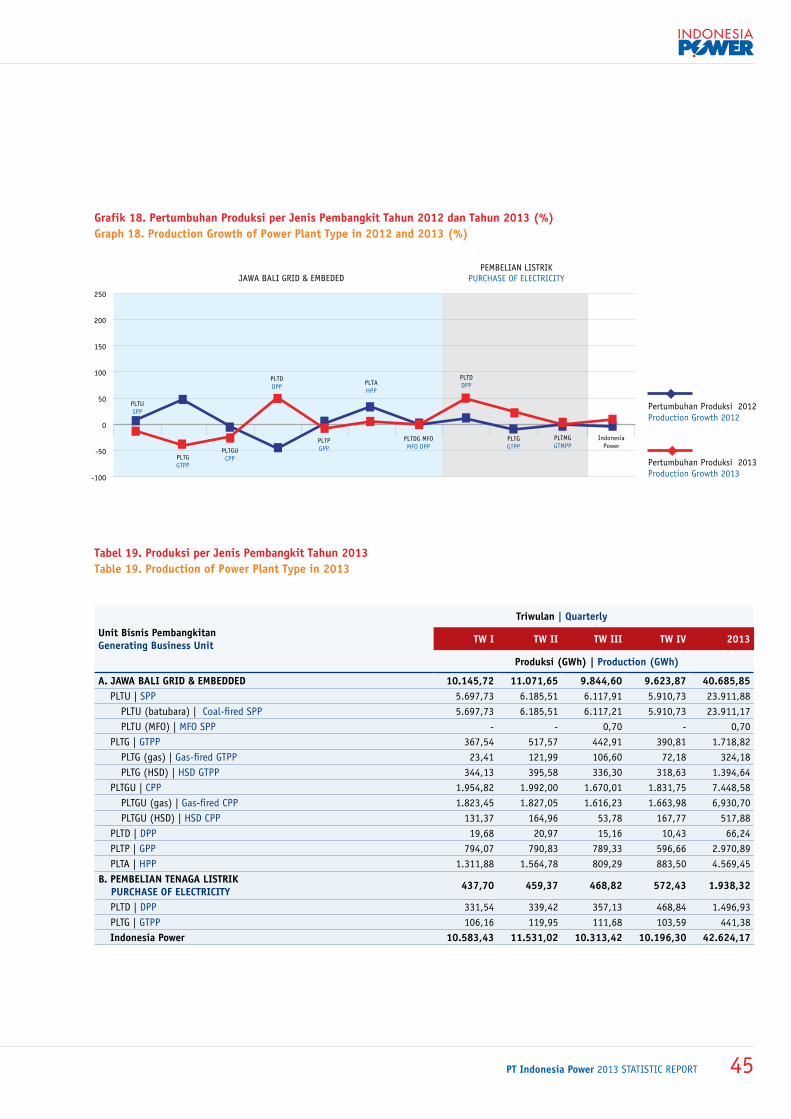
PT Indonesia Power 2013 statistic report 45
grafik 18. pertumbuhan produksi per Jenis pembangkit tahun 2012 dan tahun 2013 (%)graph 18. production growth of power plant type in 2012 and 2013 (%)
tabel 19. produksi per Jenis pembangkit tahun 2013table 19. production of power plant type in 2013
unit Bisnis pembangkitangenerating Business unit
triwulan | Quarterly
tw i tw ii tw iii tw iv 2013
produksi (gwh) | production (gwh)
a. Jawa Bali grid & EmBEddEd 10.145,72 11.071,65 9.844,60 9.623,87 40.685,85PLTU | SPP 5.697,73 6.185,51 6.117,91 5.910,73 23.911,88
PLTU (batubara) | Coal-fired SPP 5.697,73 6.185,51 6.117,21 5.910,73 23.911,17 PLTU (MFO) | MFO SPP - - 0,70 - 0,70
PLTG | GTPP 367,54 517,57 442,91 390,81 1.718,82 PLTG (gas) | Gas-fired GTPP 23,41 121,99 106,60 72,18 324,18 PLTG (HSD) | HSD GTPP 344,13 395,58 336,30 318,63 1.394,64
PLTGU | CPP 1.954,82 1.992,00 1.670,01 1.831,75 7.448,58 PLTGU (gas) | Gas-fired CPP 1.823,45 1.827,05 1.616,23 1.663,98 6,930,70 PLTGU (HSD) | HSD CPP 131,37 164,96 53,78 167,77 517,88
PLTD | DPP 19,68 20,97 15,16 10,43 66,24 PLTP | GPP 794,07 790,83 789,33 596,66 2.970,89 PLTA | HPP 1.311,88 1.564,78 809,29 883,50 4.569,45
B. pEmBElian tEnaga liStrik purchaSE of ElEctricity 437,70 459,37 468,82 572,43 1.938,32
PLTD | DPP 331,54 339,42 357,13 468,84 1.496,93 PLTG | GTPP 106,16 119,95 111,68 103,59 441,38 indonesia power 10.583,43 11.531,02 10.313,42 10.196,30 42.624,17
JAWA BALI GRID & EMBEDEDPEMBELIAN LISTRIK
PURCHASE OF ELECTRICITY
Pertumbuhan Produksi 2012 Production Growth 2012
Pertumbuhan Produksi 2013 Production Growth 2013-100
-50
0
50
100
150
200
250
PLTU SPP
PLTG GTPP
PLTGUCPP
PLTD DPP
PLTP GPP
PLTA HPP
PLTDG MFO MFO DPP
PLTD DPP
PLTG GTPP
PLTMG GTMPP
IndonesiaPower
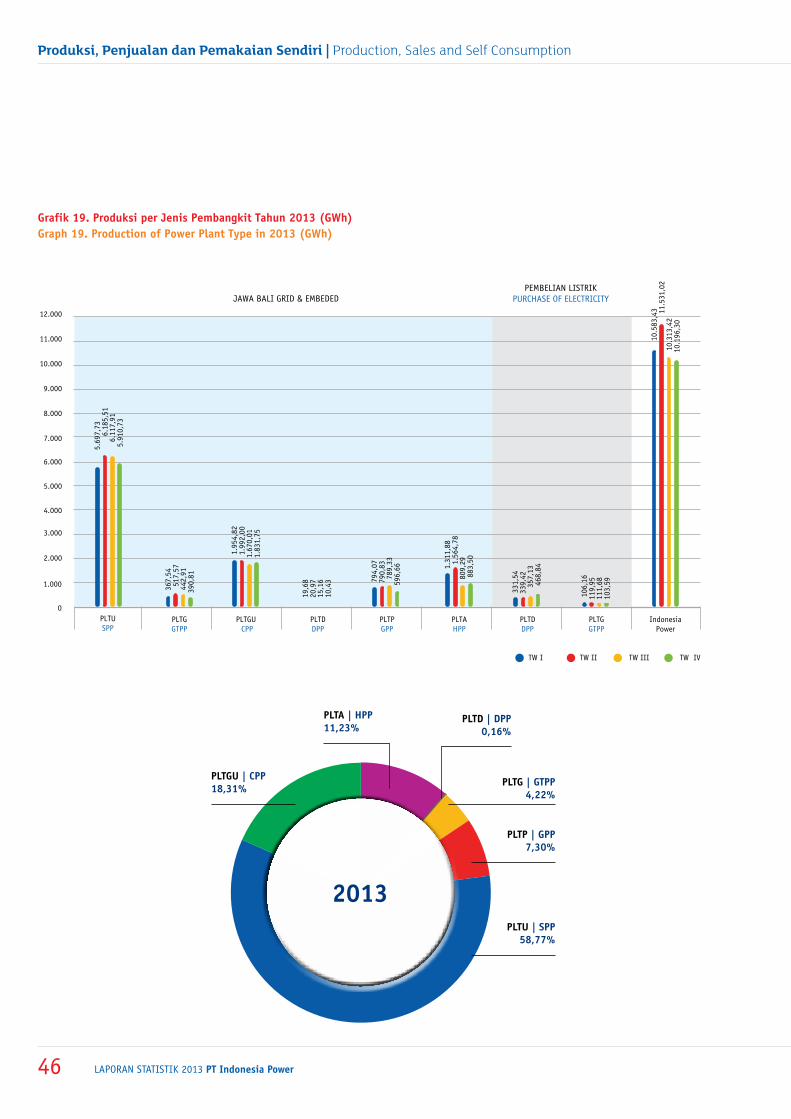
laporan statistik 2013 PT Indonesia Power46
Produksi, Penjualan dan Pemakaian Sendiri | Production, Sales and Self Consumption
grafik 19. produksi per Jenis pembangkit tahun 2013 (gwh)graph 19. production of power plant type in 2013 (gwh)
2013
pltg | gtpp 4,22%
pltp | gpp 7,30%
pltd | dpp 0,16%
pltu | Spp 58,77%
pltgu | cpp 18,31%
plta | hpp 11,23%
JAWA BALI GRID & EMBEDEDPEMBELIAN LISTRIK
PURCHASE OF ELECTRICITY
PLTGGTPP
PLTGU CPP
PLTU SPP
PLTPGPP
PLTDDPP
PLTAHPP
PLTGGTPP
PLTDDPP
IndonesiaPower
7.000
6.000
5.000
8.000
9.000
10.000
11.000
12.000
4.000
3.000
2.000
1.000
0
5.69
7,73
6.18
5,51
6.
117,
915.
910,
73
10.5
83,4
3 11.5
31,0
210
.313
,42
10.1
96,3
0
367,
54 5
17,5
744
2,91
390,
81
1.95
4,82
1.99
2,00
1.6
70,0
11.
831,
75
794,
07
790,
8378
9,33
596,
66
331,
5433
9,42
357
,13
468
,841.
311,
88
1.56
4,78
809,
2988
3,50
19,6
820
,97
15,1
610
,43
106
,16
119,
9511
1,68
10
3,59
TW I TW II TW III TW IV
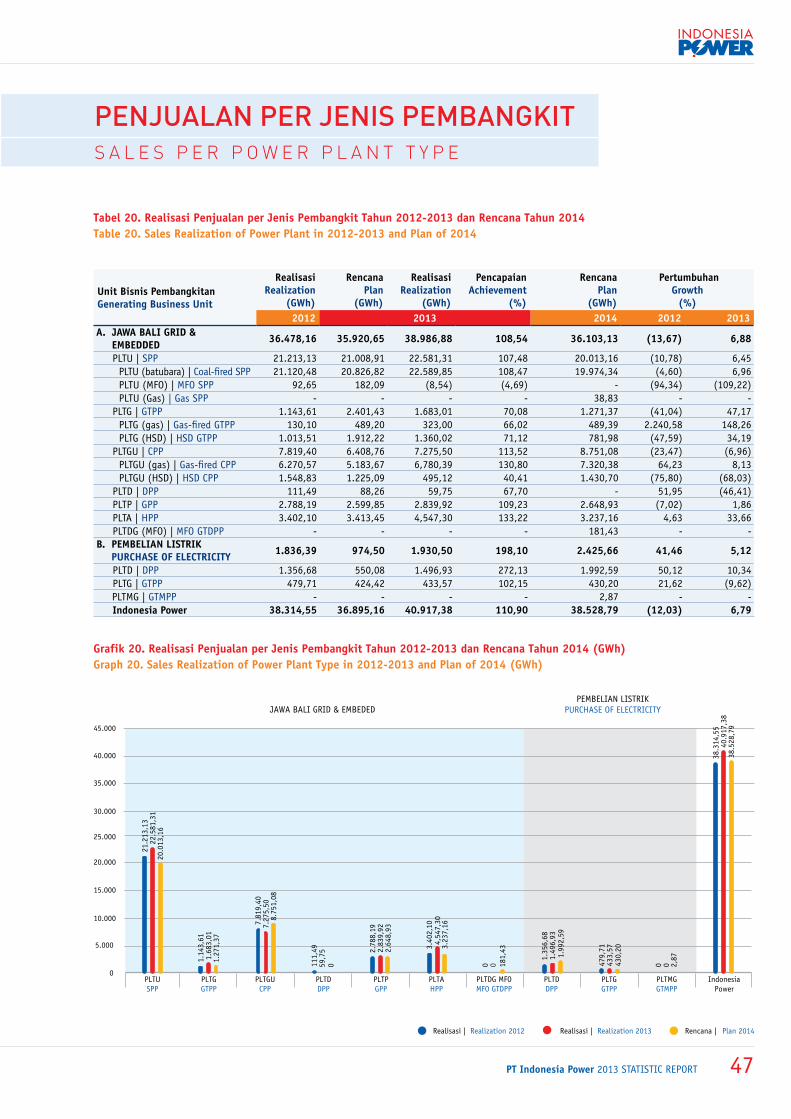
PT Indonesia Power 2013 statistic report 47
grafik 20. realisasi penjualan per Jenis pembangkit tahun 2012-2013 dan rencana tahun 2014 (gwh)graph 20. Sales realization of power plant type in 2012-2013 and plan of 2014 (gwh)
tabel 20. realisasi penjualan per Jenis pembangkit tahun 2012-2013 dan rencana tahun 2014table 20. Sales realization of power plant in 2012-2013 and plan of 2014
unit Bisnis pembangkitangenerating Business unit
realisasi realization
(gwh)
rencana plan
(gwh)
realisasirealization
(gwh)
pencapaian achievement
(%)
rencana plan
(gwh)
pertumbuhan growth
(%) 2012 2013 2014 2012 2013
a. Jawa Bali grid & EmBEddEd 36.478,16 35.920,65 38.986,88 108,54 36.103,13 (13,67) 6,88
PLTU | SPP 21.213,13 21.008,91 22.581,31 107,48 20.013,16 (10,78) 6,45PLTU (batubara) | Coal-fired SPP 21.120,48 20.826,82 22.589,85 108,47 19.974,34 (4,60) 6,96PLTU (MFO) | MFO SPP 92,65 182,09 (8,54) (4,69) - (94,34) (109,22)PLTU (Gas) | Gas SPP - - - - 38,83 - -
PLTG | GTPP 1.143,61 2.401,43 1.683,01 70,08 1.271,37 (41,04) 47,17PLTG (gas) | Gas-fired GTPP 130,10 489,20 323,00 66,02 489,39 2.240,58 148,26PLTG (HSD) | HSD GTPP 1.013,51 1.912,22 1.360,02 71,12 781,98 (47,59) 34,19
PLTGU | CPP 7.819,40 6.408,76 7.275,50 113,52 8.751,08 (23,47) (6,96)PLTGU (gas) | Gas-fired CPP 6.270,57 5.183,67 6,780,39 130,80 7.320,38 64,23 8,13PLTGU (HSD) | HSD CPP 1.548,83 1.225,09 495,12 40,41 1.430,70 (75,80) (68,03)
PLTD | DPP 111,49 88,26 59,75 67,70 - 51,95 (46,41)PLTP | GPP 2.788,19 2.599,85 2.839,92 109,23 2.648,93 (7,02) 1,86PLTA | HPP 3.402,10 3.413,45 4,547,30 133,22 3.237,16 4,63 33,66PLTDG (MFO) | MFO GTDPP - - - - 181,43 - -
B. pEmBElian liStrik purchaSE of ElEctricity 1.836,39 974,50 1.930,50 198,10 2.425,66 41,46 5,12
PLTD | DPP 1.356,68 550,08 1.496,93 272,13 1.992,59 50,12 10,34PLTG | GTPP 479,71 424,42 433,57 102,15 430,20 21,62 (9,62)PLTMG | GTMPP - - - - 2,87 - - indonesia power 38.314,55 36.895,16 40.917,38 110,90 38.528,79 (12,03) 6,79
Penjualan PeR jenis PembangkitS a l e S p e R p o w e R p l a n t t y p e
JAWA BALI GRID & EMBEDEDPEMBELIAN LISTRIK
PURCHASE OF ELECTRICITY
Realisasi | Realization 2012 Realisasi | Realization 2013 Rencana | Plan 2014
PLTU SPP
PLTG GTPP
PLTGUCPP
PLTD DPP
PLTP GPP
PLTA HPP
PLTDG MFO MFO GTDPP
PLTD DPP
PLTG GTPP
PLTMG GTMPP
25.000
30.000
35.000
40.000
45.000
15.000
20.000
10.000
5.000
0
21.2
13,1
322
.581
,31
20.0
13,1
6
38.3
14,5
540
.917
,38
38.5
28,7
9
1.14
3,61
1.68
3,01
1.27
1,37
1.99
2,59
181,
43
7.81
9,40
7.
275,
50
8.75
1,08
3.40
2,10
3.2
37,1
64,
547,
30
111,
49
59,7
50
2.78
8,19
2.
839,
922.
648,
93
1.35
6,68
1.49
6,93
430,
20
479,
7143
3,57
0 0 0 0 2,87
IndonesiaPower
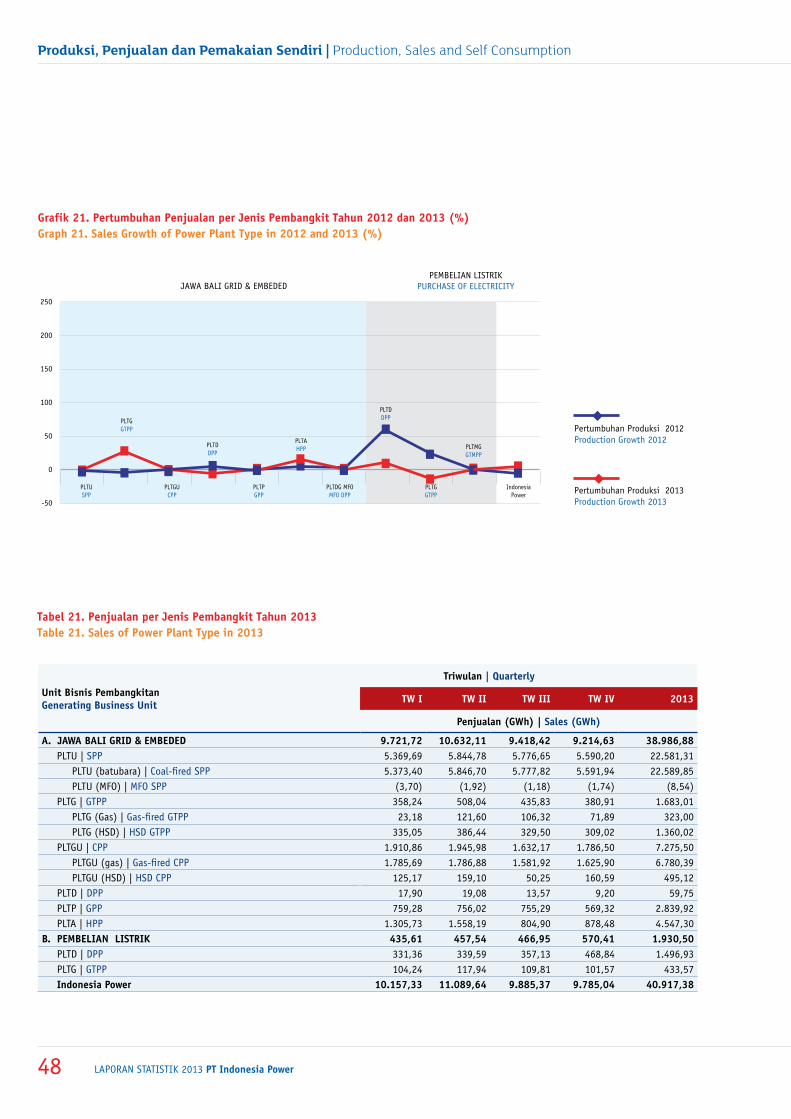
laporan statistik 2013 PT Indonesia Power48
Produksi, Penjualan dan Pemakaian Sendiri | Production, Sales and Self Consumption
grafik 21. pertumbuhan penjualan per Jenis pembangkit tahun 2012 dan 2013 (%)graph 21. Sales growth of power plant type in 2012 and 2013 (%)
tabel 21. penjualan per Jenis pembangkit tahun 2013table 21. Sales of power plant type in 2013
unit Bisnis pembangkitangenerating Business unit
triwulan | Quarterly
tw i tw ii tw iii tw iv 2013
penjualan (gwh) | Sales (gwh)
a. Jawa Bali grid & EmBEdEd 9.721,72 10.632,11 9.418,42 9.214,63 38.986,88PLTU | SPP 5.369,69 5.844,78 5.776,65 5.590,20 22.581,31
PLTU (batubara) | Coal-fired SPP 5.373,40 5.846,70 5.777,82 5.591,94 22.589,85 PLTU (MFO) | MFO SPP (3,70) (1,92) (1,18) (1,74) (8,54)
PLTG | GTPP 358,24 508,04 435,83 380,91 1.683,01 PLTG (Gas) | Gas-fired GTPP 23,18 121,60 106,32 71,89 323,00 PLTG (HSD) | HSD GTPP 335,05 386,44 329,50 309,02 1.360,02
PLTGU | CPP 1.910,86 1.945,98 1.632,17 1.786,50 7.275,50 PLTGU (gas) | Gas-fired CPP 1.785,69 1.786,88 1.581,92 1.625,90 6.780,39 PLTGU (HSD) | HSD CPP 125,17 159,10 50,25 160,59 495,12
PLTD | DPP 17,90 19,08 13,57 9,20 59,75 PLTP | GPP 759,28 756,02 755,29 569,32 2.839,92PLTA | HPP 1.305,73 1.558,19 804,90 878,48 4.547,30
B. pEmBElian liStrik 435,61 457,54 466,95 570,41 1.930,50 PLTD | DPP 331,36 339,59 357,13 468,84 1.496,93 PLTG | GTPP 104,24 117,94 109,81 101,57 433,57 indonesia power 10.157,33 11.089,64 9.885,37 9.785,04 40.917,38
JAWA BALI GRID & EMBEDEDPEMBELIAN LISTRIK
PURCHASE OF ELECTRICITY
Pertumbuhan Produksi 2012 Production Growth 2012
Pertumbuhan Produksi 2013 Production Growth 2013
PLTU SPP
PLTG GTPP
PLTGUCPP
PLTD DPP
PLTP GPP
PLTA HPP
PLTDG MFO MFO DPP
PLTD DPP
PLTG GTPP
PLTMGGTMPP
IndonesiaPower
-50
0
50
100
150
200
250
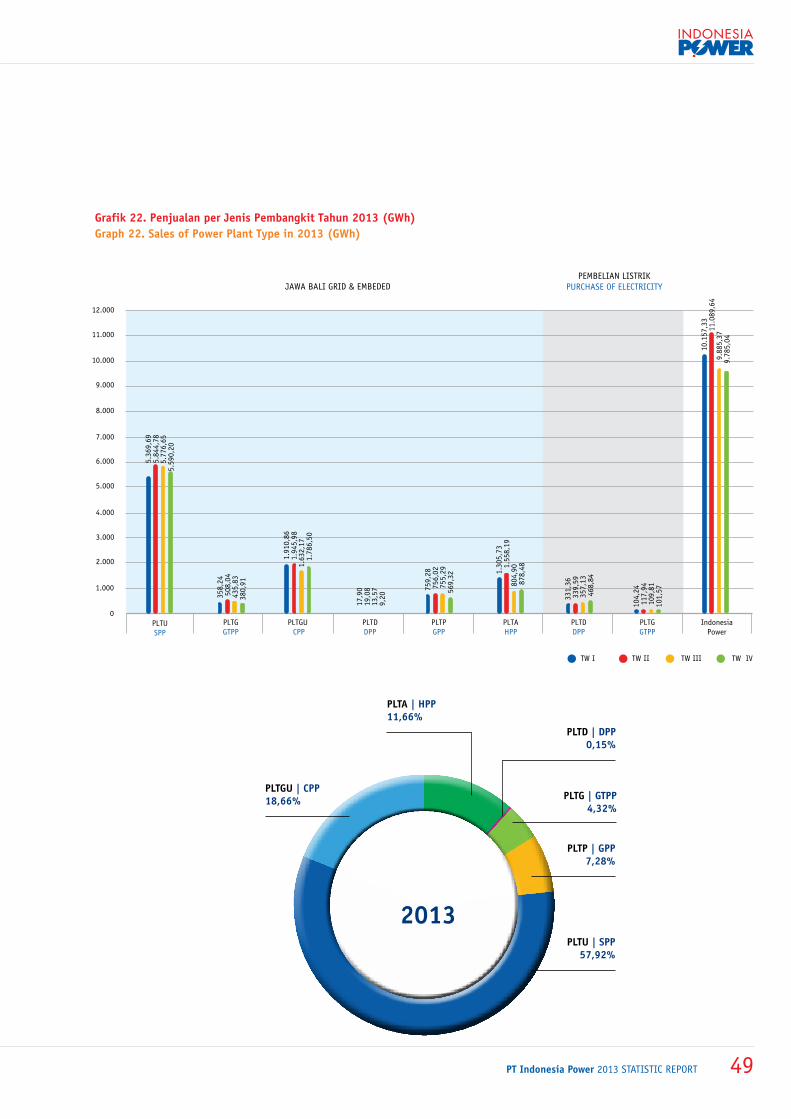
PT Indonesia Power 2013 statistic report 49
grafik 22. penjualan per Jenis pembangkit tahun 2013 (gwh)graph 22. Sales of power plant type in 2013 (gwh)
2013
pltg | gtpp 4,32%
pltp | gpp 7,28%
pltd | dpp 0,15%
pltu | Spp 57,92%
pltgu | cpp 18,66%
plta | hpp 11,66%
JAWA BALI GRID & EMBEDEDPEMBELIAN LISTRIK
PURCHASE OF ELECTRICITY
PLTGGTPP
PLTGU CPP
PLTU SPP
PLTPGPP
PLTDDPP
PLTAHPP
PLTGGTPP
PLTDDPP
IndonesiaPower
5.000
4.000
6.000
7.000
8.000
9.000
10.000
11.000
12.000
3.000
2.000
1.000
0
5.36
9,69
5.84
4,78
5.77
6,65
5
.590
,20
10.1
57,3
311
.089
,64
9.88
5,37
9.78
5,04
358,
2450
8,04
435,
83
380,
91
1.91
0,86
1.94
5,98
1.63
2,17
1
.786
,50
759,
28 7
56,0
275
5,29
56
9,32
331,
36
339
,59
357,
1346
8,84
1.30
5,73
1.5
58,1
980
4,90
87
8,48
17,9
0 19
,08
13,5
79,
20
104,
24 1
17,9
4 1
09,8
110
1,57
TW I TW II TW III TW IV
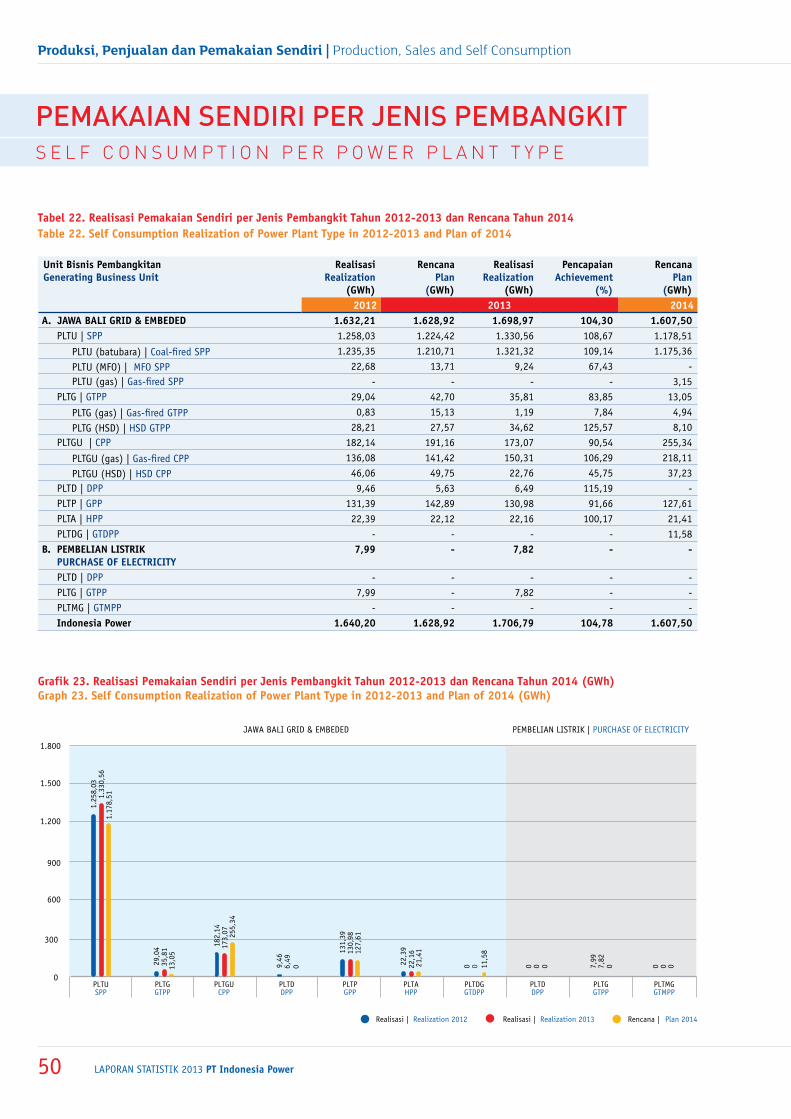
laporan statistik 2013 PT Indonesia Power50
Produksi, Penjualan dan Pemakaian Sendiri | Production, Sales and Self Consumption
grafik 23. realisasi pemakaian Sendiri per Jenis pembangkit tahun 2012-2013 dan rencana tahun 2014 (gwh)graph 23. Self consumption realization of power plant type in 2012-2013 and plan of 2014 (gwh)
tabel 22. realisasi pemakaian Sendiri per Jenis pembangkit tahun 2012-2013 dan rencana tahun 2014table 22. Self consumption realization of power plant type in 2012-2013 and plan of 2014
Pemakaian sendiRi PeR jenis PembangkitS e l f c o n S u m p t i o n p e R p o w e R p l a n t t y p e
unit Bisnis pembangkitangenerating Business unit
realisasi realization
(gwh)
rencanaplan
(gwh)
realisasi realization
(gwh)
pencapaian achievement
(%)
rencanaplan
(gwh) 2012 2013 2014
a. Jawa Bali grid & EmBEdEd 1.632,21 1.628,92 1.698,97 104,30 1.607,50 PLTU | SPP 1.258,03 1.224,42 1.330,56 108,67 1.178,51
PLTU (batubara) | Coal-fired SPP 1.235,35 1.210,71 1.321,32 109,14 1.175,36
PLTU (MFO) | MFO SPP 22,68 13,71 9,24 67,43 - PLTU (gas) | Gas-fired SPP - - - - 3,15
PLTG | GTPP 29,04 42,70 35,81 83,85 13,05
PLTG (gas) | Gas-fired GTPP 0,83 15,13 1,19 7,84 4,94
PLTG (HSD) | HSD GTPP 28,21 27,57 34,62 125,57 8,10 PLTGU | CPP 182,14 191,16 173,07 90,54 255,34
PLTGU (gas) | Gas-fired CPP 136,08 141,42 150,31 106,29 218,11
PLTGU (HSD) | HSD CPP 46,06 49,75 22,76 45,75 37,23 PLTD | DPP 9,46 5,63 6,49 115,19 - PLTP | GPP 131,39 142,89 130,98 91,66 127,61 PLTA | HPP 22,39 22,12 22,16 100,17 21,41 PLTDG | GTDPP - - - - 11,58
B. pEmBElian liStrik purchaSE of ElEctricity
7,99 - 7,82 - -
PLTD | DPP - - - - - PLTG | GTPP 7,99 - 7,82 - - PLTMG | GTMPP - - - - - indonesia power 1.640,20 1.628,92 1.706,79 104,78 1.607,50
JAWA BALI GRID & EMBEDED PEMBELIAN LISTRIK | PURCHASE OF ELECTRICITY
Realisasi | Realization 2012 Realisasi | Realization 2013 Rencana | Plan 2014
PLTU SPP
PLTG GTPP
PLTGUCPP
PLTD DPP
PLTP GPP
PLTA HPP
PLTDG GTDPP
PLTD DPP
PLTG GTPP
PLTMG GTMPP
1.500
1.800
900
1.200
600
300
0
1.25
8,03
1.33
0,56
1.17
8,51
29,0
435
,81
13,0
5
011,5
8
182,
1417
3,07 255,
34
22,3
9
21,4
122
,16
9,46
6,49
0
131,
3913
0,98
127,
61
0 0 07,99
7,82
0 0 0 0 0
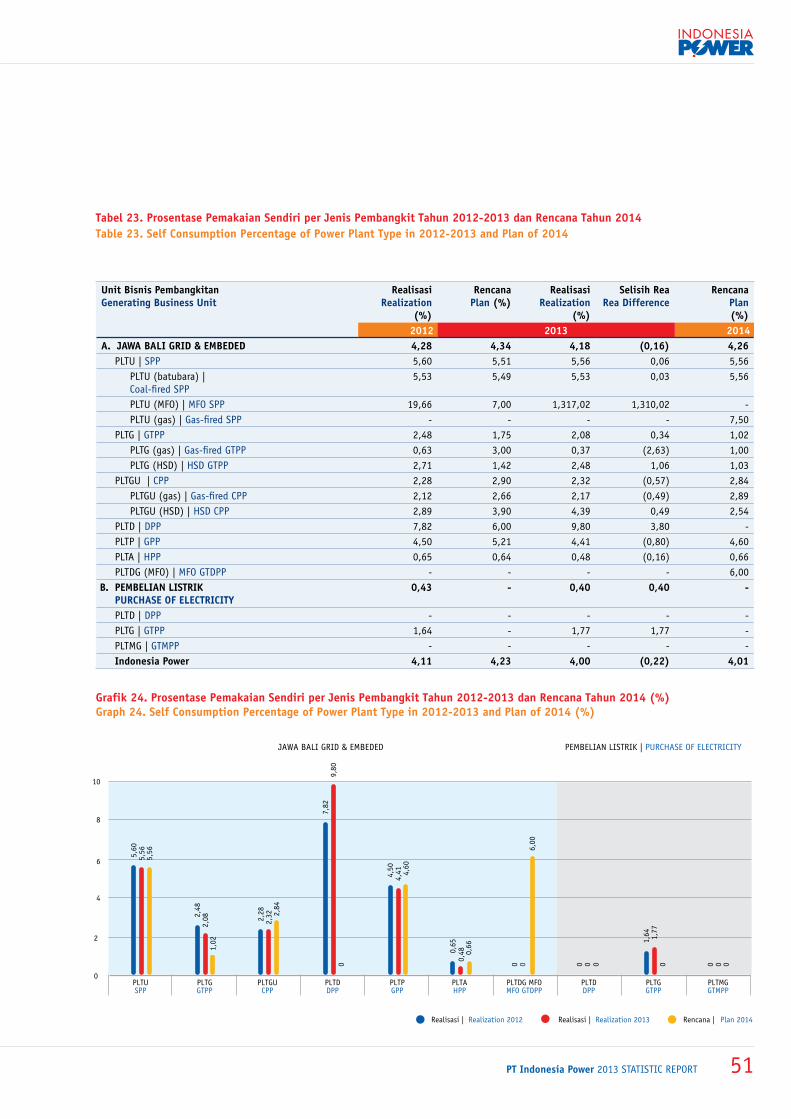
PT Indonesia Power 2013 statistic report 51
grafik 24. prosentase pemakaian Sendiri per Jenis pembangkit tahun 2012-2013 dan rencana tahun 2014 (%)graph 24. Self consumption percentage of power plant type in 2012-2013 and plan of 2014 (%)
tabel 23. prosentase pemakaian Sendiri per Jenis pembangkit tahun 2012-2013 dan rencana tahun 2014table 23. Self consumption percentage of power plant type in 2012-2013 and plan of 2014
unit Bisnis pembangkitangenerating Business unit
realisasi realization
(%)
rencana plan (%)
realisasi realization
(%)
Selisih rearea difference
rencana plan (%)
2012 2013 2014a. Jawa Bali grid & EmBEdEd 4,28 4,34 4,18 (0,16) 4,26
PLTU | SPP 5,60 5,51 5,56 0,06 5,56 PLTU (batubara) | Coal-fired SPP
5,53 5,49 5,53 0,03 5,56
PLTU (MFO) | MFO SPP 19,66 7,00 1,317,02 1,310,02 - PLTU (gas) | Gas-fired SPP - - - - 7,50
PLTG | GTPP 2,48 1,75 2,08 0,34 1,02 PLTG (gas) | Gas-fired GTPP 0,63 3,00 0,37 (2,63) 1,00 PLTG (HSD) | HSD GTPP 2,71 1,42 2,48 1,06 1,03
PLTGU | CPP 2,28 2,90 2,32 (0,57) 2,84 PLTGU (gas) | Gas-fired CPP 2,12 2,66 2,17 (0,49) 2,89 PLTGU (HSD) | HSD CPP 2,89 3,90 4,39 0,49 2,54
PLTD | DPP 7,82 6,00 9,80 3,80 - PLTP | GPP 4,50 5,21 4,41 (0,80) 4,60 PLTA | HPP 0,65 0,64 0,48 (0,16) 0,66 PLTDG (MFO) | MFO GTDPP - - - - 6,00
B. pEmBElian liStrik purchaSE of ElEctricity
0,43 - 0,40 0,40 -
PLTD | DPP - - - - - PLTG | GTPP 1,64 - 1,77 1,77 -
PLTMG | GTMPP - - - - - indonesia power 4,11 4,23 4,00 (0,22) 4,01
JAWA BALI GRID & EMBEDED PEMBELIAN LISTRIK | PURCHASE OF ELECTRICITY
Realisasi | Realization 2012 Realisasi | Realization 2013 Rencana | Plan 2014
PLTU SPP
PLTG GTPP
PLTGUCPP
PLTD DPP
PLTP GPP
PLTA HPP
PLTDG MFO MFO GTDPP
PLTD DPP
PLTG GTPP
PLTMG GTMPP
10
6
8
4
2
0
5,6
0 5
,56
5,5
6
2,4
8 2
,08
1,02
0
6,0
0
2,2
8
2,
32 2,84
0,6
5
0,6
6 0
,48
4,5
0 4
,41
4,6
0
1,6
4 1
,77
0
7,8
2 9
,80
0 0 00 0 0 0 0
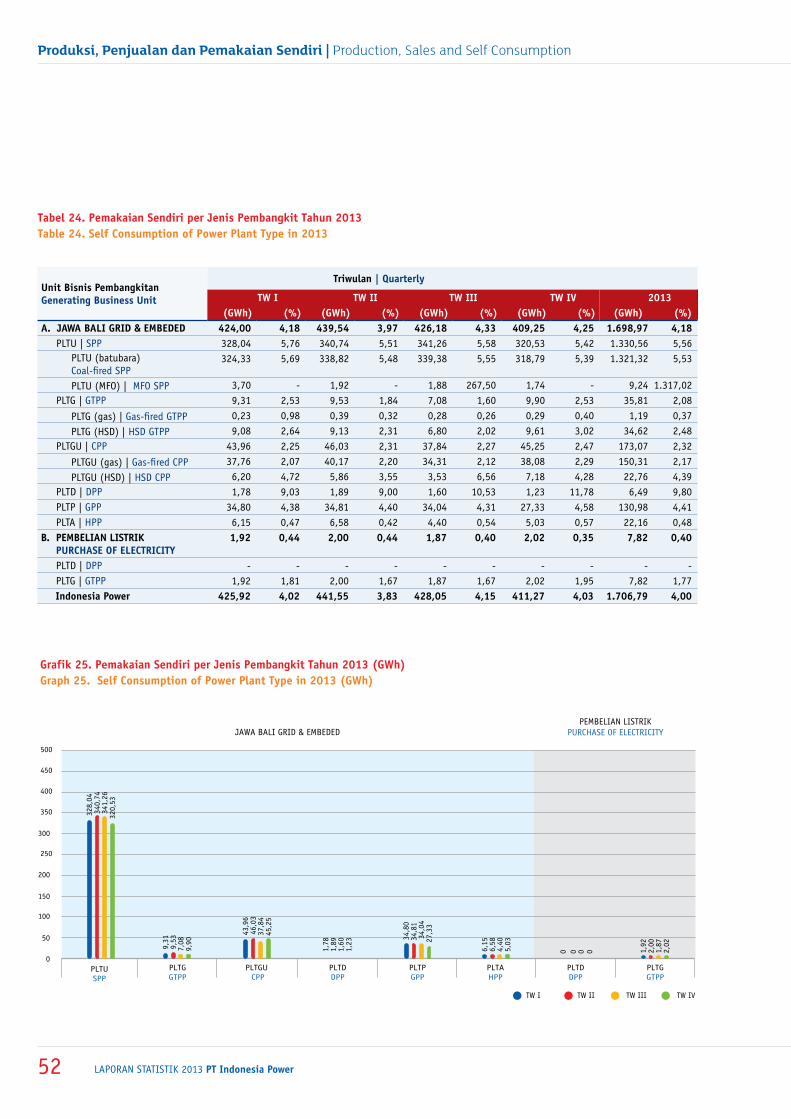
laporan statistik 2013 PT Indonesia Power52
Produksi, Penjualan dan Pemakaian Sendiri | Production, Sales and Self Consumption
tabel 24. pemakaian Sendiri per Jenis pembangkit tahun 2013table 24. Self consumption of power plant type in 2013
grafik 25. pemakaian Sendiri per Jenis pembangkit tahun 2013 (gwh)graph 25. Self consumption of power plant type in 2013 (gwh)
unit Bisnis pembangkitangenerating Business unit
triwulan | Quarterly
tw i tw ii tw iii tw iv 2013 (gwh) (%) (gwh) (%) (gwh) (%) (gwh) (%) (gwh) (%)
a. Jawa Bali grid & EmBEdEd 424,00 4,18 439,54 3,97 426,18 4,33 409,25 4,25 1.698,97 4,18PLTU | SPP 328,04 5,76 340,74 5,51 341,26 5,58 320,53 5,42 1.330,56 5,56
PLTU (batubara)Coal-fired SPP
324,33 5,69 338,82 5,48 339,38 5,55 318,79 5,39 1.321,32 5,53
PLTU (MFO) | MFO SPP 3,70 - 1,92 - 1,88 267,50 1,74 - 9,24 1.317,02PLTG | GTPP 9,31 2,53 9,53 1,84 7,08 1,60 9,90 2,53 35,81 2,08
PLTG (gas) | Gas-fired GTPP 0,23 0,98 0,39 0,32 0,28 0,26 0,29 0,40 1,19 0,37
PLTG (HSD) | HSD GTPP 9,08 2,64 9,13 2,31 6,80 2,02 9,61 3,02 34,62 2,48PLTGU | CPP 43,96 2,25 46,03 2,31 37,84 2,27 45,25 2,47 173,07 2,32
PLTGU (gas) | Gas-fired CPP 37,76 2,07 40,17 2,20 34,31 2,12 38,08 2,29 150,31 2,17
PLTGU (HSD) | HSD CPP 6,20 4,72 5,86 3,55 3,53 6,56 7,18 4,28 22,76 4,39PLTD | DPP 1,78 9,03 1,89 9,00 1,60 10,53 1,23 11,78 6,49 9,80PLTP | GPP 34,80 4,38 34,81 4,40 34,04 4,31 27,33 4,58 130,98 4,41PLTA | HPP 6,15 0,47 6,58 0,42 4,40 0,54 5,03 0,57 22,16 0,48
B. pEmBElian liStrik purchaSE of ElEctricity
1,92 0,44 2,00 0,44 1,87 0,40 2,02 0,35 7,82 0,40
PLTD | DPP - - - - - - - - - -PLTG | GTPP 1,92 1,81 2,00 1,67 1,87 1,67 2,02 1,95 7,82 1,77indonesia power 425,92 4,02 441,55 3,83 428,05 4,15 411,27 4,03 1.706,79 4,00
JAWA BALI GRID & EMBEDEDPEMBELIAN LISTRIK
PURCHASE OF ELECTRICITY
PLTGGTPP
PLTGU CPP
PLTU SPP
PLTPGPP
PLTDDPP
PLTAHPP
PLTGGTPP
PLTDDPP
250
200
350
400
450
500
300
150
100
50
0
328,
0434
0,74
341,
2632
0,53
9,31
9,53
7,08
9,90
43,9
646
,03
37,8
445
,25
34,8
034
,81
34,0
427
,33
00 0 06,15
6,58
4,40
5,03
1,78
1,89
1,60
1,23
1,92
2,00
1,87
2,02
TW I TW II TW III TW IV
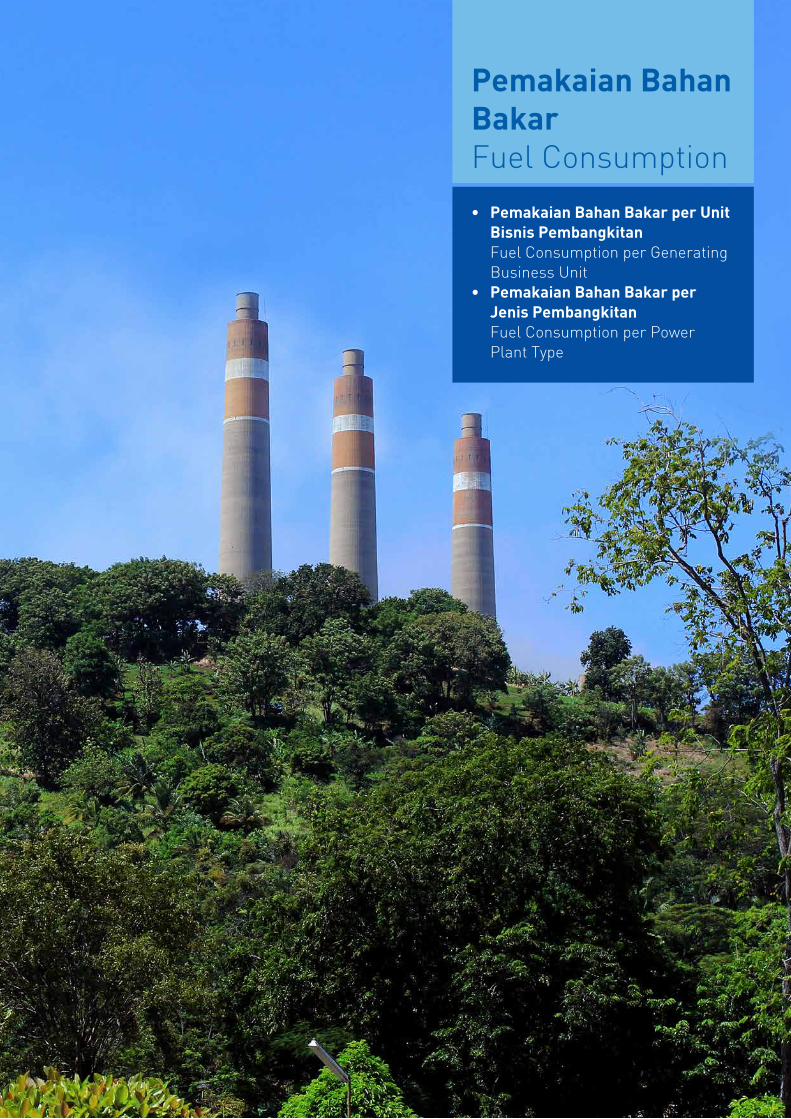
• PemakaianBahanBakarperUnitBisnisPembangkitan
fuel consumption per generating Business unit
• PemakaianBahanBakarperJenisPembangkitan
fuel consumption per power plant type
PemakaianBahanBakarfuel consumption
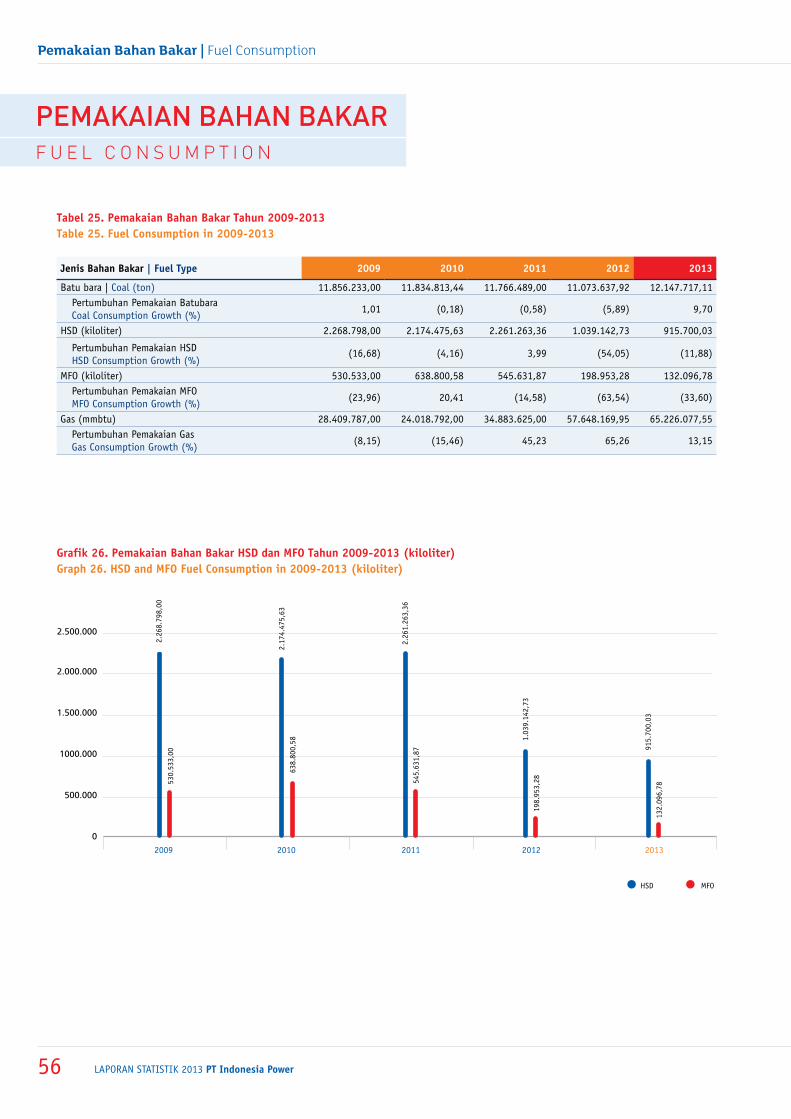
laporan statistik 2013 PT Indonesia Power56
Pemakaian Bahan Bakar | Fuel Consumption
grafik 26. pemakaian Bahan Bakar hSd dan mfo tahun 2009-2013 (kiloliter)graph 26. hSd and mfo fuel consumption in 2009-2013 (kiloliter)
tabel 25. pemakaian Bahan Bakar tahun 2009-2013table 25. fuel consumption in 2009-2013
Jenis Bahan Bakar | fuel type 2009 2010 2011 2012 2013
Batu bara | Coal (ton) 11.856.233,00 11.834.813,44 11.766.489,00 11.073.637,92 12.147.717,11 Pertumbuhan Pemakaian BatubaraCoal Consumption Growth (%)
1,01 (0,18) (0,58) (5,89) 9,70
HSD (kiloliter) 2.268.798,00 2.174.475,63 2.261.263,36 1.039.142,73 915.700,03
Pertumbuhan Pemakaian HSD HSD Consumption Growth (%)
(16,68) (4,16) 3,99 (54,05) (11,88)
MFO (kiloliter) 530.533,00 638.800,58 545.631,87 198.953,28 132.096,78 Pertumbuhan Pemakaian MFO MFO Consumption Growth (%)
(23,96) 20,41 (14,58) (63,54) (33,60)
Gas (mmbtu) 28.409.787,00 24.018.792,00 34.883.625,00 57.648.169,95 65.226.077,55 Pertumbuhan Pemakaian GasGas Consumption Growth (%)
(8,15) (15,46) 45,23 65,26 13,15
HSD
2.500.000
2.000.000
1.500.000
1000.000
500.000
0
2009 2010 2011 2012 2013
2.26
8.79
8,00
2.17
4.47
5,63
530.
533,
00
638.
800,
58
2.26
1.26
3,36
54
5.63
1,87
1.0
39.1
42,7
3 19
8.95
3,28
915
.700
,03
132.
096,
78
MFO
Pemakaian bahan bakaRf u e l c o n S u m p t i o n
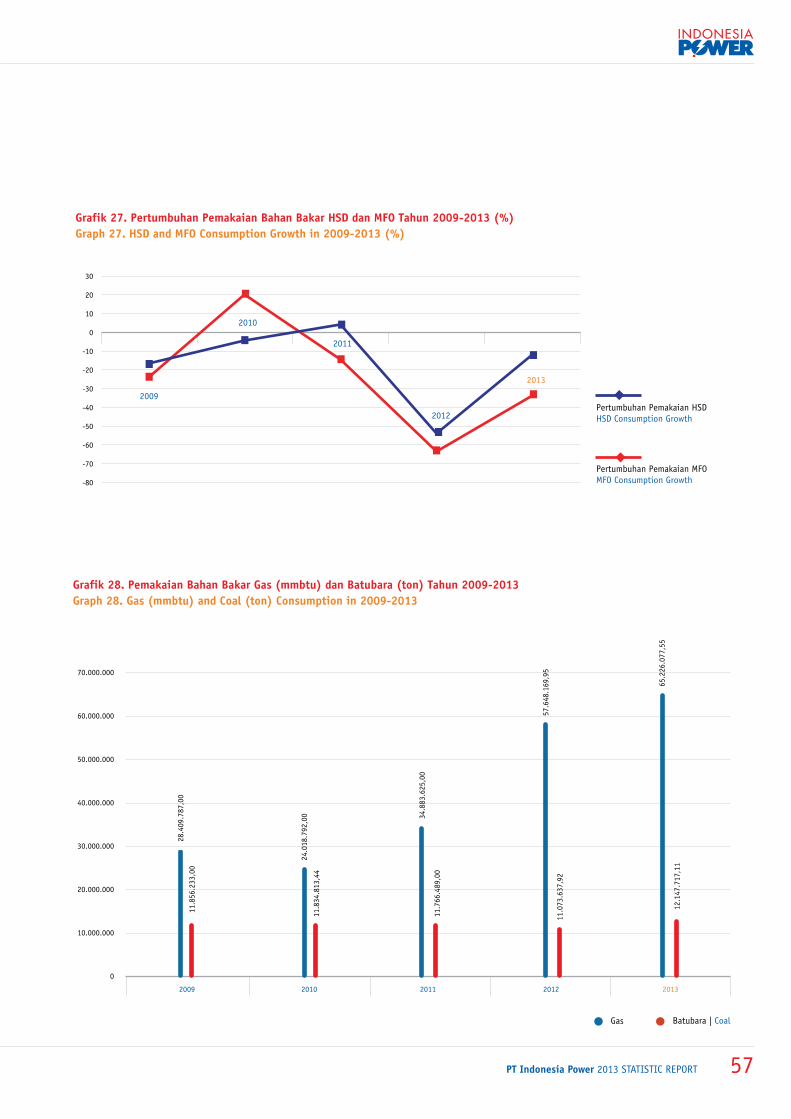
PT Indonesia Power 2013 statistic report 57
grafik 27. pertumbuhan pemakaian Bahan Bakar hSd dan mfo tahun 2009-2013 (%)graph 27. hSd and mfo consumption growth in 2009-2013 (%)
Pertumbuhan Pemakaian HSDHSD Consumption Growth
Pertumbuhan Pemakaian MFOMFO Consumption Growth
2009
2010
2011
2013
2012
-80
-70
-60
-50
-40
-30
-20
-10
0
10
20
30
grafik 28. pemakaian Bahan Bakar gas (mmbtu) dan Batubara (ton) tahun 2009-2013graph 28. gas (mmbtu) and coal (ton) consumption in 2009-2013
0
10.000.000
20.000.000
30.000.000
40.000.000
50.000.000
60.000.000
70.000.000
2009
28.4
09.7
87,0
0 1
1.85
6.23
3,00
2010
24.0
18.7
92,0
0
11.8
34.8
13,4
4
2011 2012 2013
11.7
66.4
89,0
0
Gas Batubara | Coal
34.8
83.6
25,0
0
11.
073.
637,
92
57.
648.
169,
95
12.
147.
717,
11
65.
226.
077,
55
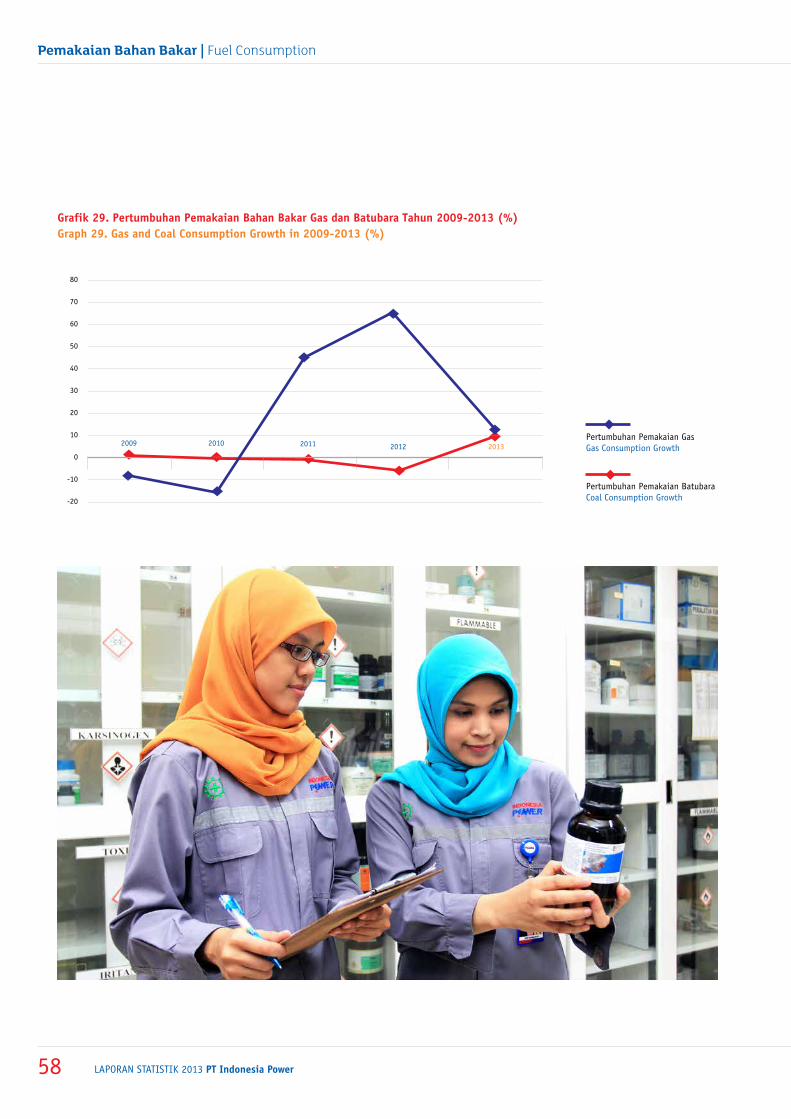
laporan statistik 2013 PT Indonesia Power58
Pemakaian Bahan Bakar | Fuel Consumption
grafik 29. pertumbuhan pemakaian Bahan Bakar gas dan Batubara tahun 2009-2013 (%)graph 29. gas and coal consumption growth in 2009-2013 (%)
Pertumbuhan Pemakaian GasGas Consumption Growth
Pertumbuhan Pemakaian BatubaraCoal Consumption Growth
2012201120102009
-20
-10
0
10
20
30
40
50
60
70
80
2013
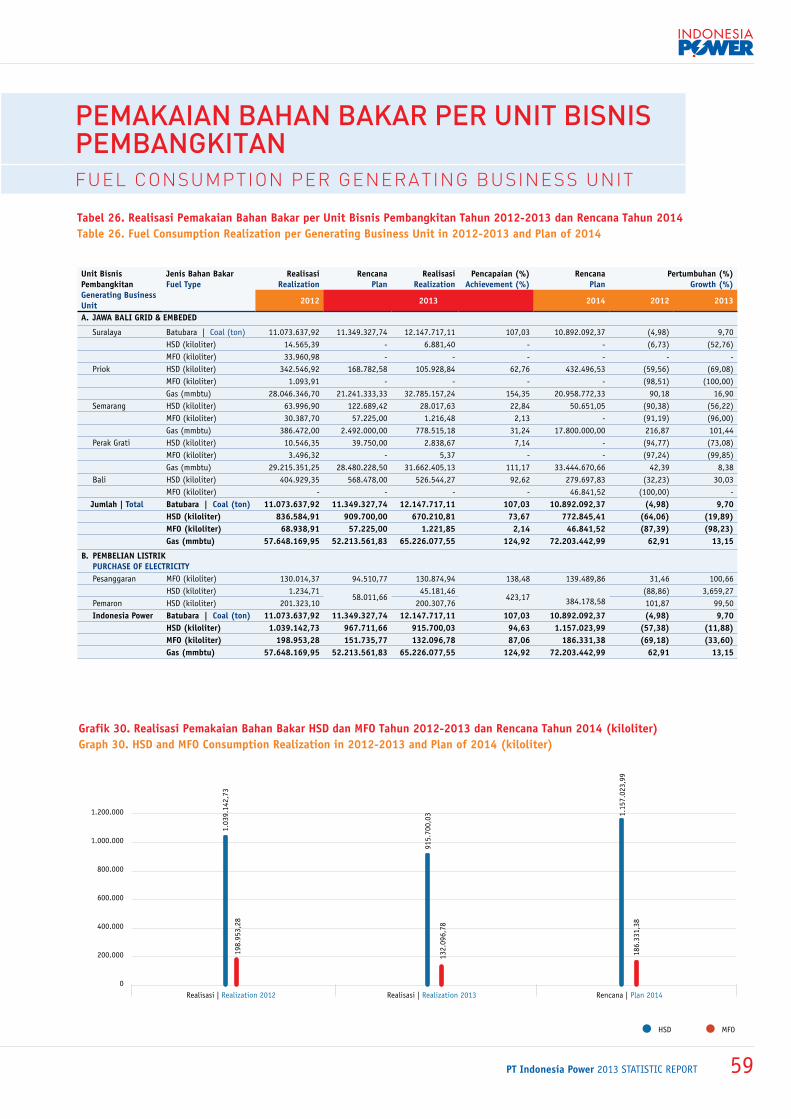
PT Indonesia Power 2013 statistic report 59
grafik 30. realisasi pemakaian Bahan Bakar hSd dan mfo tahun 2012-2013 dan rencana tahun 2014 (kiloliter)graph 30. hSd and mfo consumption realization in 2012-2013 and plan of 2014 (kiloliter)
tabel 26. realisasi pemakaian Bahan Bakar per unit Bisnis pembangkitan tahun 2012-2013 dan rencana tahun 2014table 26. fuel consumption realization per generating Business unit in 2012-2013 and plan of 2014
unit Bisnis pembangkitangenerating Business unit
Jenis Bahan Bakarfuel type
realisasirealization
rencanaplan
realisasi realization
pencapaian (%) achievement (%)
rencanaplan
pertumbuhan (%) growth (%)
2012 2013 2014 2012 2013
a. Jawa Bali grid & EmBEdEd
Suralaya Batubara | Coal (ton) 11.073.637,92 11.349.327,74 12.147.717,11 107,03 10.892.092,37 (4,98) 9,70 HSD (kiloliter) 14.565,39 - 6.881,40 - - (6,73) (52,76) MFO (kiloliter) 33.960,98 - - - - - - Priok HSD (kiloliter) 342.546,92 168.782,58 105.928,84 62,76 432.496,53 (59,56) (69,08) MFO (kiloliter) 1.093,91 - - - - (98,51) (100,00) Gas (mmbtu) 28.046.346,70 21.241.333,33 32.785.157,24 154,35 20.958.772,33 90,18 16,90 Semarang HSD (kiloliter) 63.996,90 122.689,42 28.017,63 22,84 50.651,05 (90,38) (56,22) MFO (kiloliter) 30.387,70 57.225,00 1.216,48 2,13 - (91,19) (96,00) Gas (mmbtu) 386.472,00 2.492.000,00 778.515,18 31,24 17.800.000,00 216,87 101,44 Perak Grati HSD (kiloliter) 10.546,35 39.750,00 2.838,67 7,14 - (94,77) (73,08) MFO (kiloliter) 3.496,32 - 5,37 - - (97,24) (99,85) Gas (mmbtu) 29.215.351,25 28.480.228,50 31.662.405,13 111,17 33.444.670,66 42,39 8,38 Bali HSD (kiloliter) 404.929,35 568.478,00 526.544,27 92,62 279.697,83 (32,23) 30,03 MFO (kiloliter) - - - - 46.841,52 (100,00) - Jumlah | total Batubara | coal (ton) 11.073.637,92 11.349.327,74 12.147.717,11 107,03 10.892.092,37 (4,98) 9,70 hSd (kiloliter) 836.584,91 909.700,00 670.210,81 73,67 772.845,41 (64,06) (19,89) mfo (kiloliter) 68.938,91 57.225,00 1.221,85 2,14 46.841,52 (87,39) (98,23) gas (mmbtu) 57.648.169,95 52.213.561,83 65.226.077,55 124,92 72.203.442,99 62,91 13,15
B. pEmBElian liStrik purchaSE of ElEctricity
Pesanggaran MFO (kiloliter) 130.014,37 94.510,77 130.874,94 138,48 139.489,86 31,46 100,66 HSD (kiloliter) 1.234,71
58.011,66 45.181,46
423,17
384.178,58 (88,86) 3,659,27
Pemaron HSD (kiloliter) 201.323,10 200.307,76 101,87 99,50 indonesia power Batubara | coal (ton) 11.073.637,92 11.349.327,74 12.147.717,11 107,03 10.892.092,37 (4,98) 9,70 hSd (kiloliter) 1.039.142,73 967.711,66 915.700,03 94,63 1.157.023,99 (57,38) (11,88) mfo (kiloliter) 198.953,28 151.735,77 132.096,78 87,06 186.331,38 (69,18) (33,60) gas (mmbtu) 57.648.169,95 52.213.561,83 65.226.077,55 124,92 72.203.442,99 62,91 13,15
HSD MFO
Realisasi | Realization 2013 Rencana | Plan 2014Realisasi | Realization 2012
1.03
9.14
2,73
198.
953,
28
132
.096
,78
915.
700,
03
186
.331
,38
1.15
7.02
3,99
0
200.000
400.000
600.000
800.000
1.000.000
1.200.000
Pemakaian bahan bakaR PeR unit bisnis Pembangkitanfuel conSumption peR geneRating BuSineSS unit
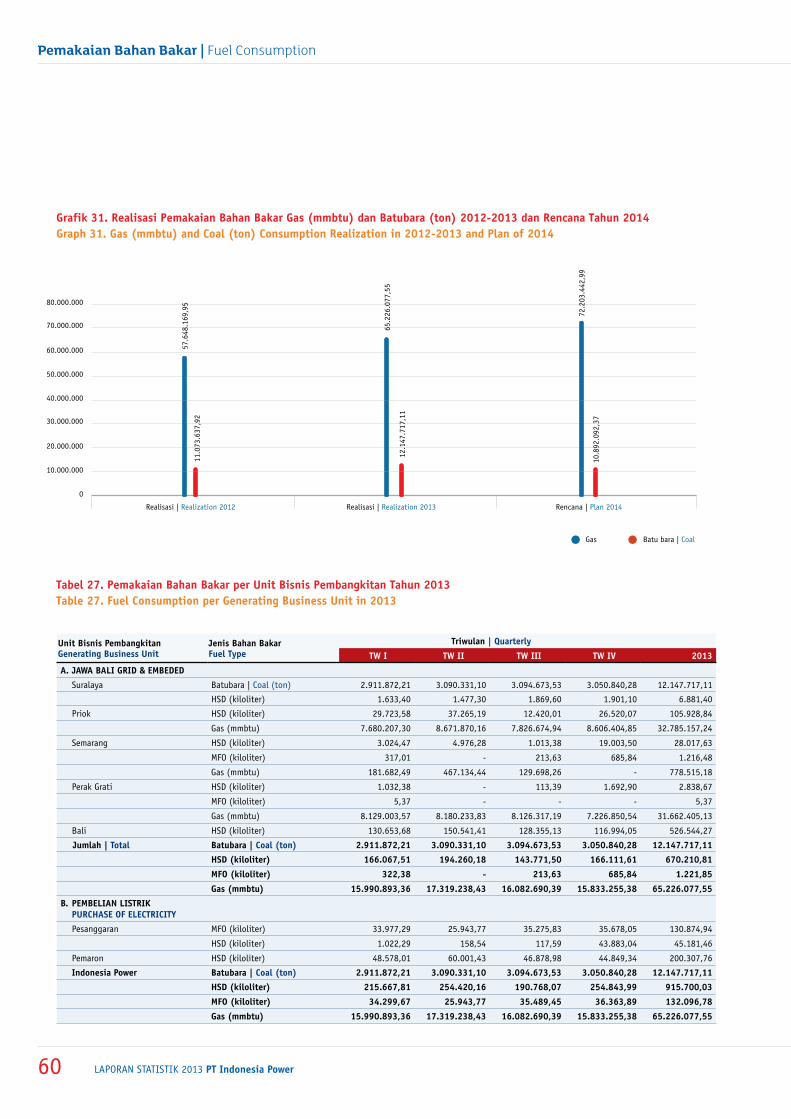
laporan statistik 2013 PT Indonesia Power60
Pemakaian Bahan Bakar | Fuel Consumption
grafik 31. realisasi pemakaian Bahan Bakar gas (mmbtu) dan Batubara (ton) 2012-2013 dan rencana tahun 2014graph 31. gas (mmbtu) and coal (ton) consumption realization in 2012-2013 and plan of 2014
tabel 27. pemakaian Bahan Bakar per unit Bisnis pembangkitan tahun 2013table 27. fuel consumption per generating Business unit in 2013
unit Bisnis pembangkitangenerating Business unit
Jenis Bahan Bakar fuel type
triwulan | Quarterly
tw i tw ii tw iii tw iv 2013
a. Jawa Bali grid & EmBEdEd
Suralaya Batubara | Coal (ton) 2.911.872,21 3.090.331,10 3.094.673,53 3.050.840,28 12.147.717,11
HSD (kiloliter) 1.633,40 1.477,30 1.869,60 1.901,10 6.881,40
Priok HSD (kiloliter) 29.723,58 37.265,19 12.420,01 26.520,07 105.928,84
Gas (mmbtu) 7.680.207,30 8.671.870,16 7.826.674,94 8.606.404,85 32.785.157,24
Semarang HSD (kiloliter) 3.024,47 4.976,28 1.013,38 19.003,50 28.017,63
MFO (kiloliter) 317,01 - 213,63 685,84 1.216,48
Gas (mmbtu) 181.682,49 467.134,44 129.698,26 - 778.515,18
Perak Grati HSD (kiloliter) 1.032,38 - 113,39 1.692,90 2.838,67
MFO (kiloliter) 5,37 - - - 5,37
Gas (mmbtu) 8.129.003,57 8.180.233,83 8.126.317,19 7.226.850,54 31.662.405,13
Bali HSD (kiloliter) 130.653,68 150.541,41 128.355,13 116.994,05 526.544,27
Jumlah | total Batubara | coal (ton) 2.911.872,21 3.090.331,10 3.094.673,53 3.050.840,28 12.147.717,11
hSd (kiloliter) 166.067,51 194.260,18 143.771,50 166.111,61 670.210,81
mfo (kiloliter) 322,38 - 213,63 685,84 1.221,85
gas (mmbtu) 15.990.893,36 17.319.238,43 16.082.690,39 15.833.255,38 65.226.077,55
B. pEmBElian liStrik purchaSE of ElEctricity
Pesanggaran MFO (kiloliter) 33.977,29 25.943,77 35.275,83 35.678,05 130.874,94
HSD (kiloliter) 1.022,29 158,54 117,59 43.883,04 45.181,46
Pemaron HSD (kiloliter) 48.578,01 60.001,43 46.878,98 44.849,34 200.307,76
indonesia power Batubara | coal (ton) 2.911.872,21 3.090.331,10 3.094.673,53 3.050.840,28 12.147.717,11
hSd (kiloliter) 215.667,81 254.420,16 190.768,07 254.843,99 915.700,03
mfo (kiloliter) 34.299,67 25.943,77 35.489,45 36.363,89 132.096,78
gas (mmbtu) 15.990.893,36 17.319.238,43 16.082.690,39 15.833.255,38 65.226.077,55
Realisasi | Realization 2013 Rencana | Plan 2014Realisasi | Realization 2012
57.
648.
169,
95
11.
073.
637,
92
12.
147.
717,
11
65.
226.
077,
55
10.
892.
092,
37
72.
203.
442,
99
0
20.000.000
10.000.000
30.000.000
50.000.000
40.000.000
60.000.000
70.000.000
80.000.000
Gas Batu bara | Coal
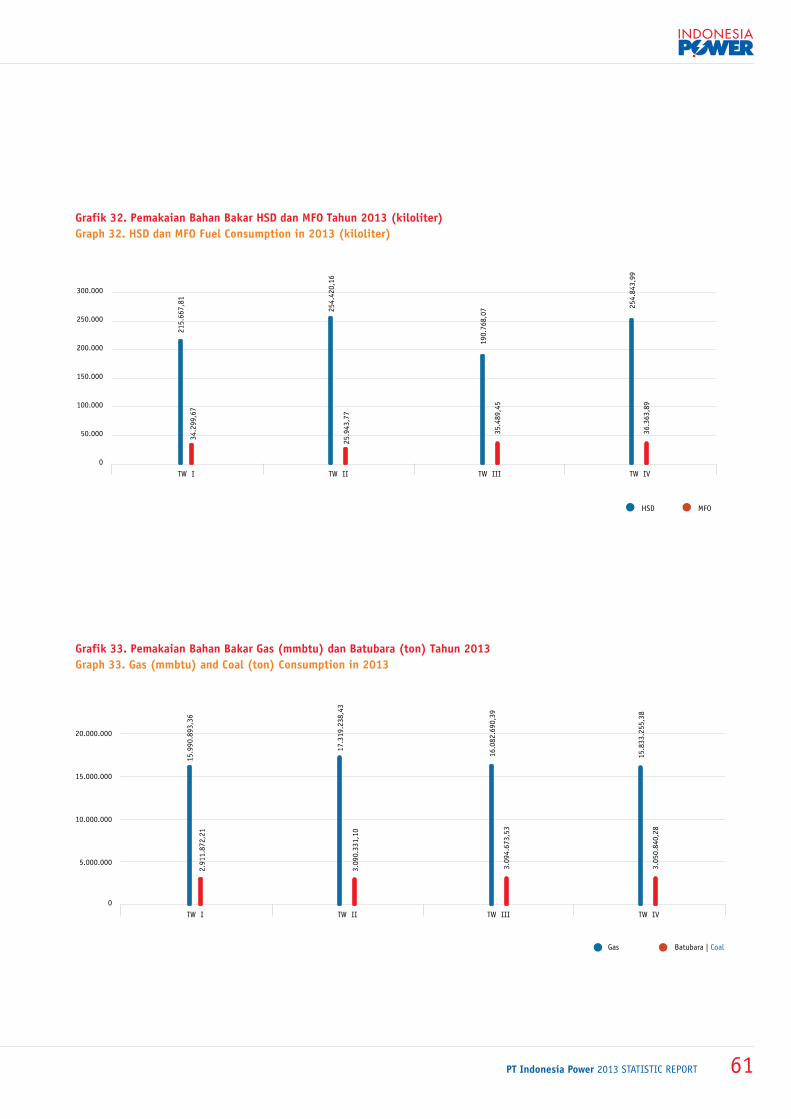
PT Indonesia Power 2013 statistic report 61
grafik 32. pemakaian Bahan Bakar hSd dan mfo tahun 2013 (kiloliter)graph 32. hSd dan mfo fuel consumption in 2013 (kiloliter)
grafik 33. pemakaian Bahan Bakar gas (mmbtu) dan Batubara (ton) tahun 2013graph 33. gas (mmbtu) and coal (ton) consumption in 2013
HSD MFO
215
.667
,81
34.2
99,6
7
25.9
43,7
7
254.
420,
16
36.
363,
89
254
.843
,99
35.
489,
45
190
.768
,07
0
50.000
100.000
150.000
200.000
250.000
300.000
TW I TW II TW III TW IV
15.9
90.8
93,3
6
2.91
1.87
2,21
3.09
0.33
1,10
17.3
19.2
38,4
3
3.05
0.84
0,28
15.8
33.2
55,3
8
3.09
4.67
3,53
16.0
82.6
90,3
9
0
5.000.000
10.000.000
15.000.000
20.000.000
TW I TW II TW III TW IV
Gas Batubara | Coal
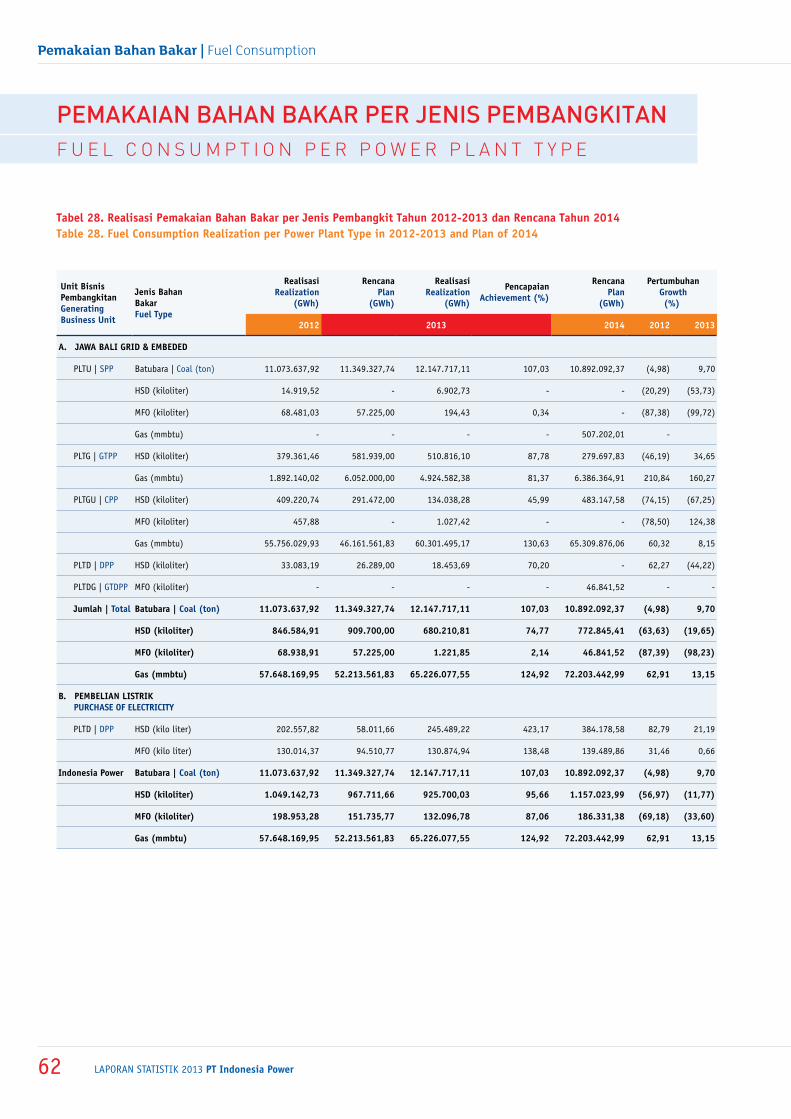
laporan statistik 2013 PT Indonesia Power62
Pemakaian Bahan Bakar | Fuel Consumption
tabel 28. realisasi pemakaian Bahan Bakar per Jenis pembangkit tahun 2012-2013 dan rencana tahun 2014table 28. fuel consumption realization per power plant type in 2012-2013 and plan of 2014
unit Bisnis pembangkitangenerating Business unit
Jenis Bahan Bakar fuel type
realisasi realization
(gwh)
rencana plan
(gwh)
realisasi realization
(gwh)
pencapaian achievement (%)
rencana plan
(gwh)
pertumbuhan growth
(%)
2012 2013 2014 2012 2013
a. Jawa Bali grid & EmBEdEd
PLTU | SPP Batubara | Coal (ton) 11.073.637,92 11.349.327,74 12.147.717,11 107,03 10.892.092,37 (4,98) 9,70
HSD (kiloliter) 14.919,52 - 6.902,73 - - (20,29) (53,73)
MFO (kiloliter) 68.481,03 57.225,00 194,43 0,34 - (87,38) (99,72)
Gas (mmbtu) - - - - 507.202,01 -
PLTG | GTPP HSD (kiloliter) 379.361,46 581.939,00 510.816,10 87,78 279.697,83 (46,19) 34,65
Gas (mmbtu) 1.892.140,02 6.052.000,00 4.924.582,38 81,37 6.386.364,91 210,84 160,27
PLTGU | CPP HSD (kiloliter) 409.220,74 291.472,00 134.038,28 45,99 483.147,58 (74,15) (67,25)
MFO (kiloliter) 457,88 - 1.027,42 - - (78,50) 124,38
Gas (mmbtu) 55.756.029,93 46.161.561,83 60.301.495,17 130,63 65.309.876,06 60,32 8,15
PLTD | DPP HSD (kiloliter) 33.083,19 26.289,00 18.453,69 70,20 - 62,27 (44,22)
PLTDG | GTDPP MFO (kiloliter) - - - - 46.841,52 - -
Jumlah | total Batubara | coal (ton) 11.073.637,92 11.349.327,74 12.147.717,11 107,03 10.892.092,37 (4,98) 9,70
hSd (kiloliter) 846.584,91 909.700,00 680.210,81 74,77 772.845,41 (63,63) (19,65)
mfo (kiloliter) 68.938,91 57.225,00 1.221,85 2,14 46.841,52 (87,39) (98,23)
gas (mmbtu) 57.648.169,95 52.213.561,83 65.226.077,55 124,92 72.203.442,99 62,91 13,15
B. pEmBElian liStrik purchaSE of ElEctricity
PLTD | DPP HSD (kilo liter) 202.557,82 58.011,66 245.489,22 423,17 384.178,58 82,79 21,19
MFO (kilo liter) 130.014,37 94.510,77 130.874,94 138,48 139.489,86 31,46 0,66
indonesia power Batubara | coal (ton) 11.073.637,92 11.349.327,74 12.147.717,11 107,03 10.892.092,37 (4,98) 9,70
hSd (kiloliter) 1.049.142,73 967.711,66 925.700,03 95,66 1.157.023,99 (56,97) (11,77)
mfo (kiloliter) 198.953,28 151.735,77 132.096,78 87,06 186.331,38 (69,18) (33,60)
gas (mmbtu) 57.648.169,95 52.213.561,83 65.226.077,55 124,92 72.203.442,99 62,91 13,15
Pemakaian bahan bakaR PeR jenis Pembangkitanf u e l c o n S u m p t i o n p e R p o w e R p l a n t t y p e
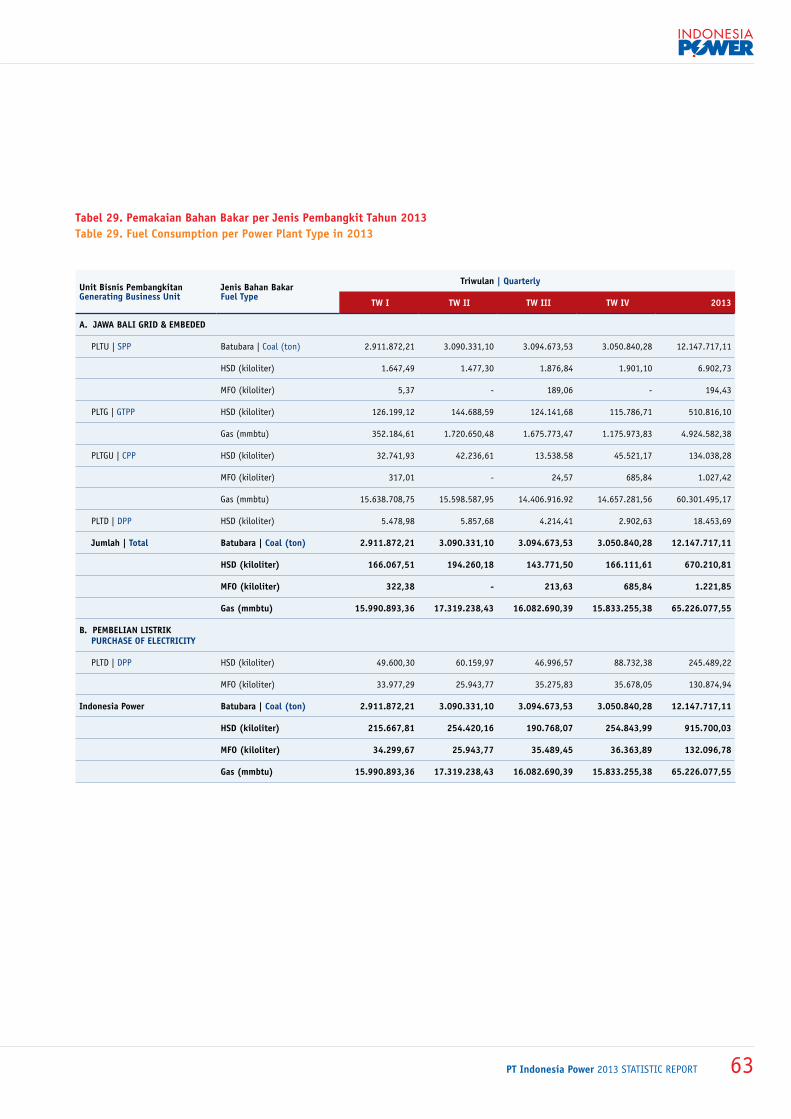
PT Indonesia Power 2013 statistic report 63
tabel 29. pemakaian Bahan Bakar per Jenis pembangkit tahun 2013table 29. fuel consumption per power plant type in 2013
unit Bisnis pembangkitan generating Business unit
Jenis Bahan Bakar fuel type
triwulan | Quarterly
tw i tw ii tw iii tw iv 2013
a. Jawa Bali grid & EmBEdEd
PLTU | SPP Batubara | Coal (ton) 2.911.872,21 3.090.331,10 3.094.673,53 3.050.840,28 12.147.717,11
HSD (kiloliter) 1.647,49 1.477,30 1.876,84 1.901,10 6.902,73
MFO (kiloliter) 5,37 - 189,06 - 194,43
PLTG | GTPP HSD (kiloliter) 126.199,12 144.688,59 124.141,68 115.786,71 510.816,10
Gas (mmbtu) 352.184,61 1.720.650,48 1.675.773,47 1.175.973,83 4.924.582,38
PLTGU | CPP HSD (kiloliter) 32.741,93 42.236,61 13.538.58 45.521,17 134.038,28
MFO (kiloliter) 317,01 - 24,57 685,84 1.027,42
Gas (mmbtu) 15.638.708,75 15.598.587,95 14.406.916.92 14.657.281,56 60.301.495,17
PLTD | DPP HSD (kiloliter) 5.478,98 5.857,68 4.214,41 2.902,63 18.453,69
Jumlah | total Batubara | coal (ton) 2.911.872,21 3.090.331,10 3.094.673,53 3.050.840,28 12.147.717,11
hSd (kiloliter) 166.067,51 194.260,18 143.771,50 166.111,61 670.210,81
mfo (kiloliter) 322,38 - 213,63 685,84 1.221,85
gas (mmbtu) 15.990.893,36 17.319.238,43 16.082.690,39 15.833.255,38 65.226.077,55
B. pEmBElian liStrik purchaSE of ElEctricity
PLTD | DPP HSD (kiloliter) 49.600,30 60.159,97 46.996,57 88.732,38 245.489,22
MFO (kiloliter) 33.977,29 25.943,77 35.275,83 35.678,05 130.874,94
indonesia power Batubara | coal (ton) 2.911.872,21 3.090.331,10 3.094.673,53 3.050.840,28 12.147.717,11
hSd (kiloliter) 215.667,81 254.420,16 190.768,07 254.843,99 915.700,03
mfo (kiloliter) 34.299,67 25.943,77 35.489,45 36.363,89 132.096,78
gas (mmbtu) 15.990.893,36 17.319.238,43 16.082.690,39 15.833.255,38 65.226.077,55
• KinerjaperUnitBisnisPembangkitan
performance per generating Business unit
• KinerjaperJenisPembangkitan performance per power plant
type
Kinerjaperformance
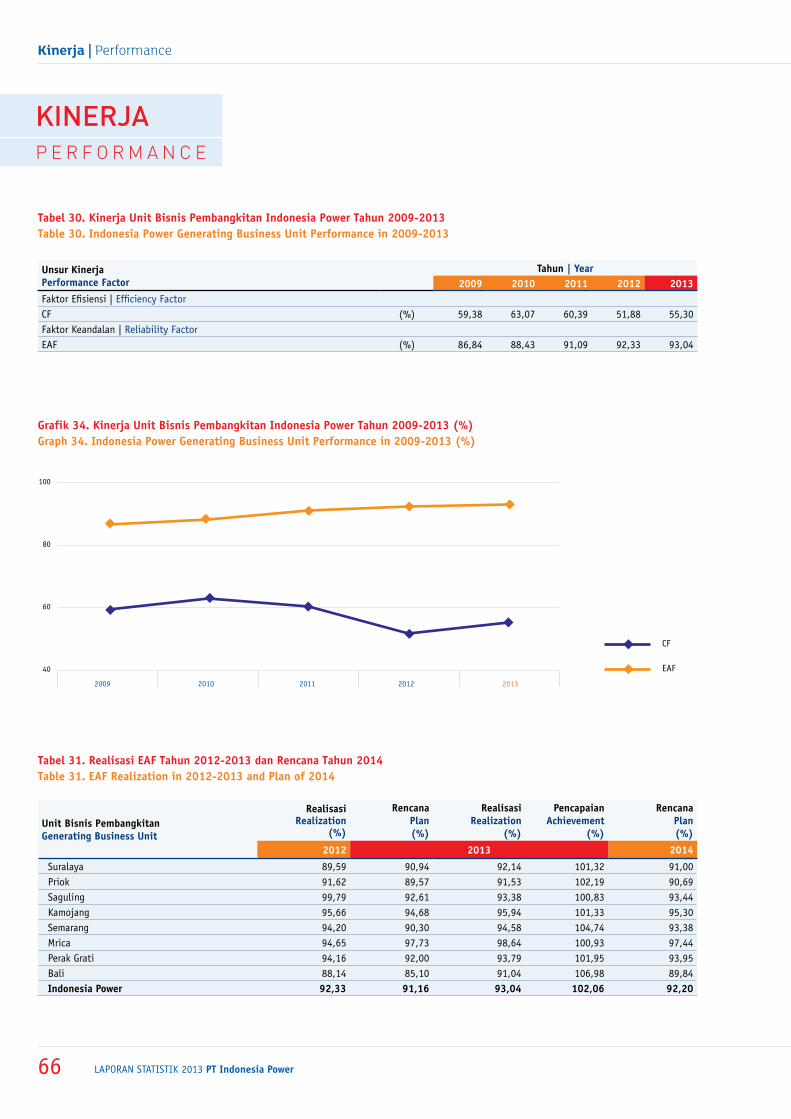
laporan statistik 2013 PT Indonesia Power66
Kinerja | Performance
grafik 34. kinerja unit Bisnis pembangkitan indonesia power tahun 2009-2013 (%)graph 34. indonesia power generating Business unit performance in 2009-2013 (%)
tabel 30. kinerja unit Bisnis pembangkitan indonesia power tahun 2009-2013table 30. indonesia power generating Business unit performance in 2009-2013
unsur kinerjaperformance factor
tahun | year 2009 2010 2011 2012 2013
Faktor Efisiensi | Efficiency Factor CF (%) 59,38 63,07 60,39 51,88 55,30Faktor Keandalan | Reliability Factor EAF (%) 86,84 88,43 91,09 92,33 93,04
tabel 31. realisasi Eaf tahun 2012-2013 dan rencana tahun 2014table 31. Eaf realization in 2012-2013 and plan of 2014
unit Bisnis pembangkitangenerating Business unit
realisasi realization
(%)
rencana plan(%)
realisasi realization
(%)
pencapaianachievement
(%)
rencana plan(%)
2012 2013 2014
Suralaya 89,59 90,94 92,14 101,32 91,00 Priok 91,62 89,57 91,53 102,19 90,69 Saguling 99,79 92,61 93,38 100,83 93,44 Kamojang 95,66 94,68 95,94 101,33 95,30 Semarang 94,20 90,30 94,58 104,74 93,38 Mrica 94,65 97,73 98,64 100,93 97,44 Perak Grati 94,16 92,00 93,79 101,95 93,95 Bali 88,14 85,10 91,04 106,98 89,84 indonesia power 92,33 91,16 93,04 102,06 92,20
40
60
80
100
CF
EAF
2009 2010 2011 2012 2013
kineRjap e R f o R m a n c e
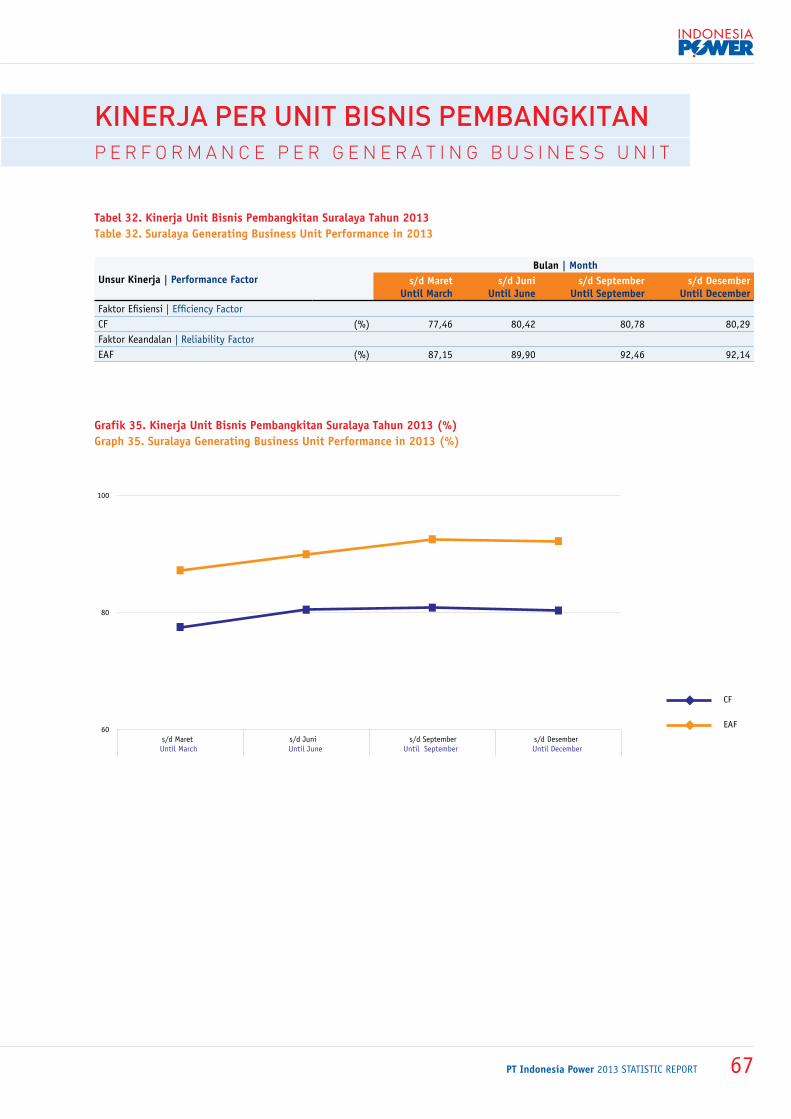
PT Indonesia Power 2013 statistic report 67
grafik 35. kinerja unit Bisnis pembangkitan Suralaya tahun 2013 (%)graph 35. Suralaya generating Business unit performance in 2013 (%)
tabel 32. kinerja unit Bisnis pembangkitan Suralaya tahun 2013table 32. Suralaya generating Business unit performance in 2013
unsur kinerja | performance factor Bulan | month
s/d maret
until marchs/d Juni
until Junes/d September
until Septembers/d desember
until decemberFaktor Efisiensi | Efficiency FactorCF (%) 77,46 80,42 80,78 80,29 Faktor Keandalan | Reliability FactorEAF (%) 87,15 89,90 92,46 92,14
CF
EAF60
80
100
s/d Maret s/d Juni s/d September s/d Desember Until March Until June Until September Until December
kineRja PeR unit bisnis Pembangkitanp e R f o R m a n c e p e R g e n e R a t i n g B u S i n e S S u n i t
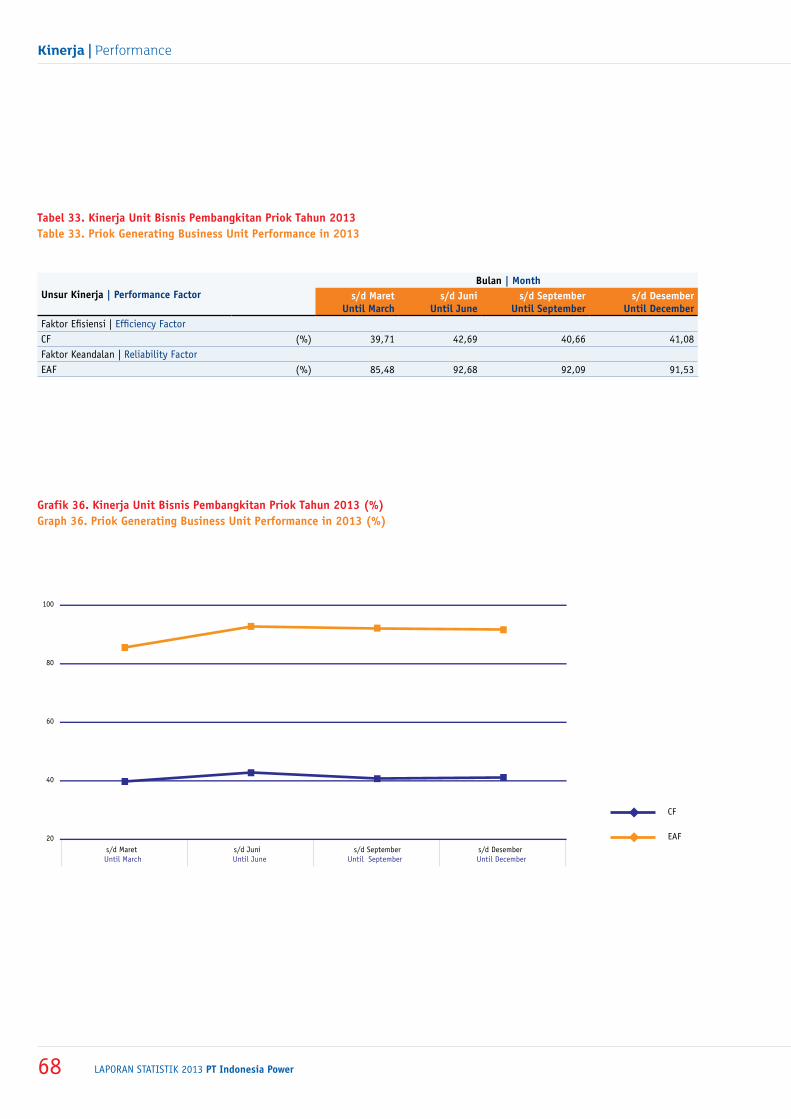
laporan statistik 2013 PT Indonesia Power68
Kinerja | Performance
grafik 36. kinerja unit Bisnis pembangkitan priok tahun 2013 (%)graph 36. priok generating Business unit performance in 2013 (%)
tabel 33. kinerja unit Bisnis pembangkitan priok tahun 2013table 33. priok generating Business unit performance in 2013
unsur kinerja | performance factor Bulan | month
s/d maret
until marchs/d Juni
until Junes/d September
until Septembers/d desember
until decemberFaktor Efisiensi | Efficiency Factor CF (%) 39,71 42,69 40,66 41,08 Faktor Keandalan | Reliability Factor EAF (%) 85,48 92,68 92,09 91,53
CF
EAF s/d Maret s/d Juni s/d September s/d Desember Until March Until June Until September Until December
20
40
60
80
100
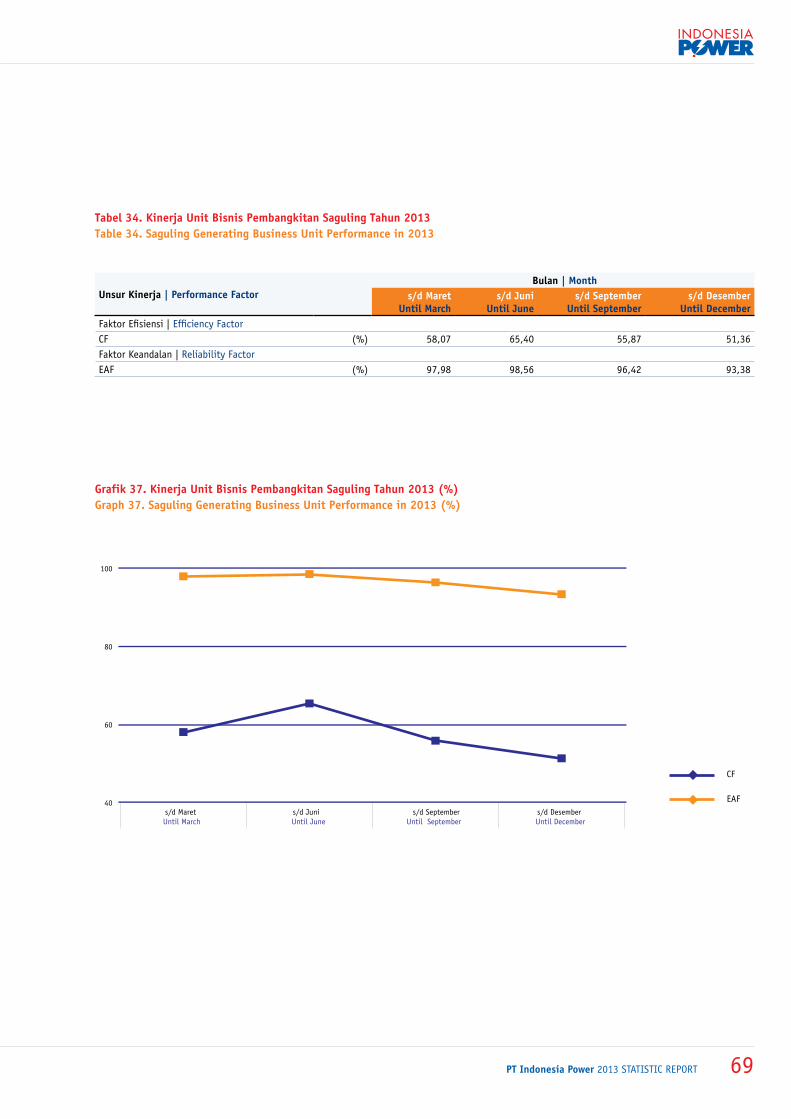
PT Indonesia Power 2013 statistic report 69
grafik 37. kinerja unit Bisnis pembangkitan Saguling tahun 2013 (%)graph 37. Saguling generating Business unit performance in 2013 (%)
tabel 34. kinerja unit Bisnis pembangkitan Saguling tahun 2013table 34. Saguling generating Business unit performance in 2013
unsur kinerja | performance factor Bulan | month
s/d maret
until marchs/d Juni
until Junes/d September
until Septembers/d desember
until decemberFaktor Efisiensi | Efficiency FactorCF (%) 58,07 65,40 55,87 51,36 Faktor Keandalan | Reliability FactorEAF (%) 97,98 98,56 96,42 93,38
CF
EAF s/d Maret s/d Juni s/d September s/d Desember Until March Until June Until September Until December
40
60
80
100
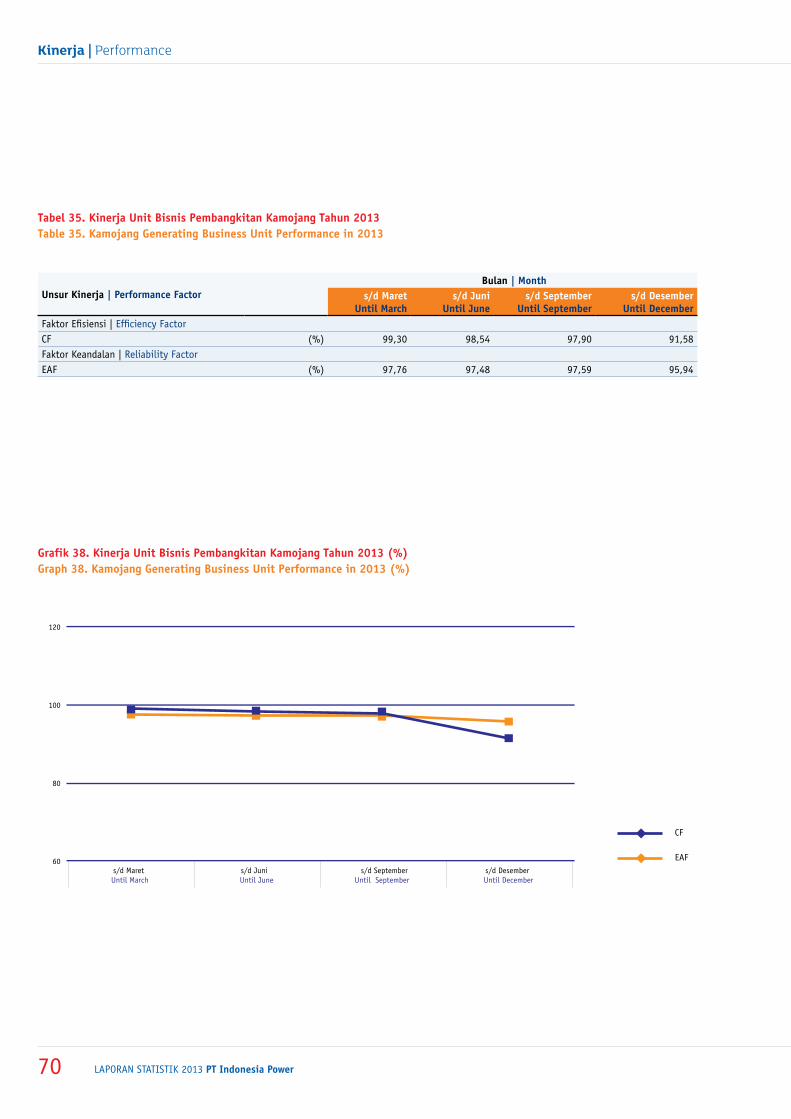
laporan statistik 2013 PT Indonesia Power70
Kinerja | Performance
grafik 38. kinerja unit Bisnis pembangkitan kamojang tahun 2013 (%)graph 38. kamojang generating Business unit performance in 2013 (%)
tabel 35. kinerja unit Bisnis pembangkitan kamojang tahun 2013table 35. kamojang generating Business unit performance in 2013
unsur kinerja | performance factor Bulan | month
s/d maret
until marchs/d Juni
until Junes/d September
until Septembers/d desember
until decemberFaktor Efisiensi | Efficiency FactorCF (%) 99,30 98,54 97,90 91,58 Faktor Keandalan | Reliability FactorEAF (%) 97,76 97,48 97,59 95,94
CF
EAF s/d Maret s/d Juni s/d September s/d Desember Until March Until June Until September Until December
60
80
100
120
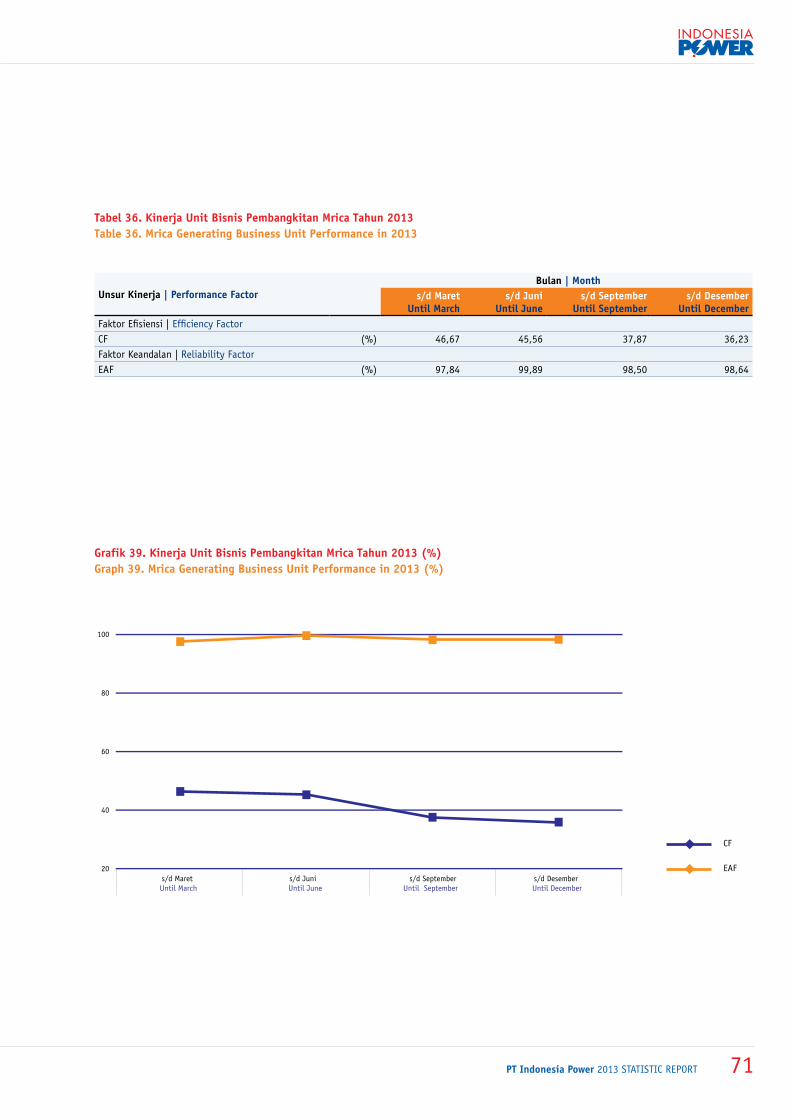
PT Indonesia Power 2013 statistic report 71
grafik 39. kinerja unit Bisnis pembangkitan mrica tahun 2013 (%)graph 39. mrica generating Business unit performance in 2013 (%)
tabel 36. kinerja unit Bisnis pembangkitan mrica tahun 2013table 36. mrica generating Business unit performance in 2013
unsur kinerja | performance factor Bulan | month
s/d maret
until marchs/d Juni
until Junes/d September
until Septembers/d desember
until decemberFaktor Efisiensi | Efficiency FactorCF (%) 46,67 45,56 37,87 36,23 Faktor Keandalan | Reliability FactorEAF (%) 97,84 99,89 98,50 98,64
CF
EAF s/d Maret s/d Juni s/d September s/d Desember Until March Until June Until September Until December
20
40
60
80
100
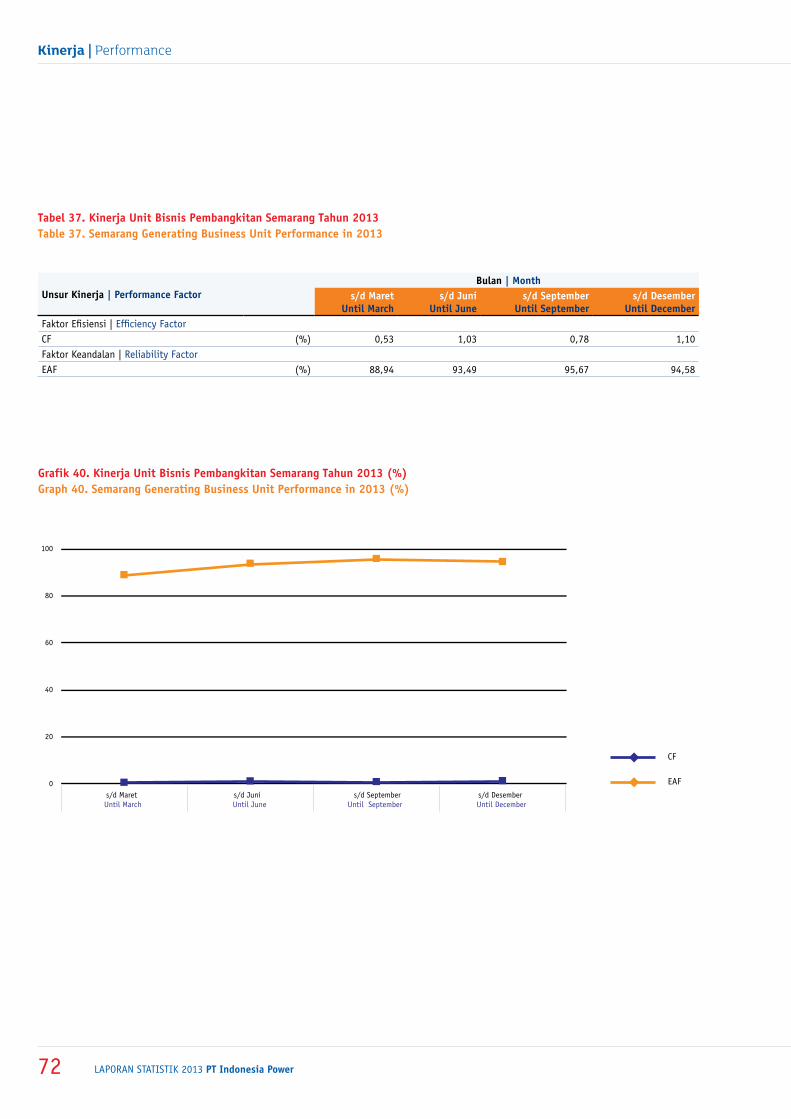
laporan statistik 2013 PT Indonesia Power72
Kinerja | Performance
grafik 40. kinerja unit Bisnis pembangkitan Semarang tahun 2013 (%)graph 40. Semarang generating Business unit performance in 2013 (%)
tabel 37. kinerja unit Bisnis pembangkitan Semarang tahun 2013table 37. Semarang generating Business unit performance in 2013
unsur kinerja | performance factor Bulan | month
s/d maret
until marchs/d Juni
until Junes/d September
until Septembers/d desember
until decemberFaktor Efisiensi | Efficiency FactorCF (%) 0,53 1,03 0,78 1,10 Faktor Keandalan | Reliability FactorEAF (%) 88,94 93,49 95,67 94,58
CF
EAF s/d Maret s/d Juni s/d September s/d Desember Until March Until June Until September Until December
0
20
40
60
80
100
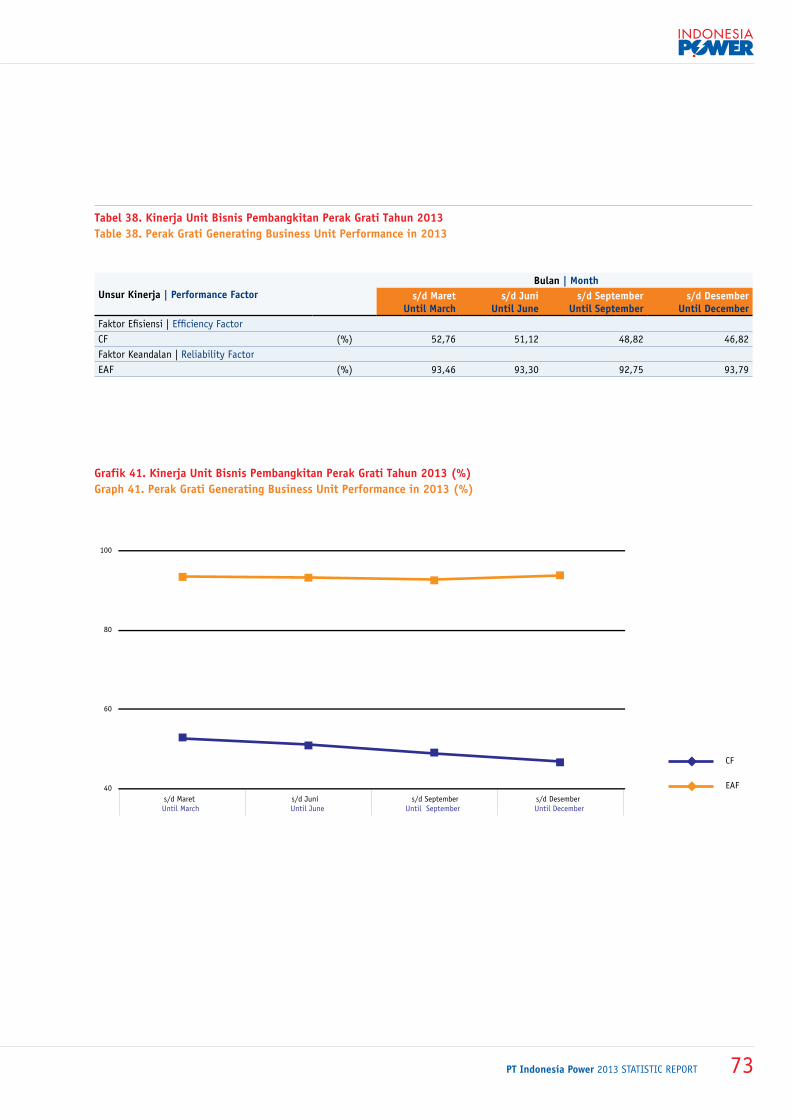
PT Indonesia Power 2013 statistic report 73
grafik 41. kinerja unit Bisnis pembangkitan perak grati tahun 2013 (%)graph 41. perak grati generating Business unit performance in 2013 (%)
tabel 38. kinerja unit Bisnis pembangkitan perak grati tahun 2013table 38. perak grati generating Business unit performance in 2013
unsur kinerja | performance factor Bulan | month
s/d maret
until marchs/d Juni
until Junes/d September
until Septembers/d desember
until decemberFaktor Efisiensi | Efficiency FactorCF (%) 52,76 51,12 48,82 46,82 Faktor Keandalan | Reliability FactorEAF (%) 93,46 93,30 92,75 93,79
CF
EAF s/d Maret s/d Juni s/d September s/d Desember Until March Until June Until September Until December
40
60
80
100
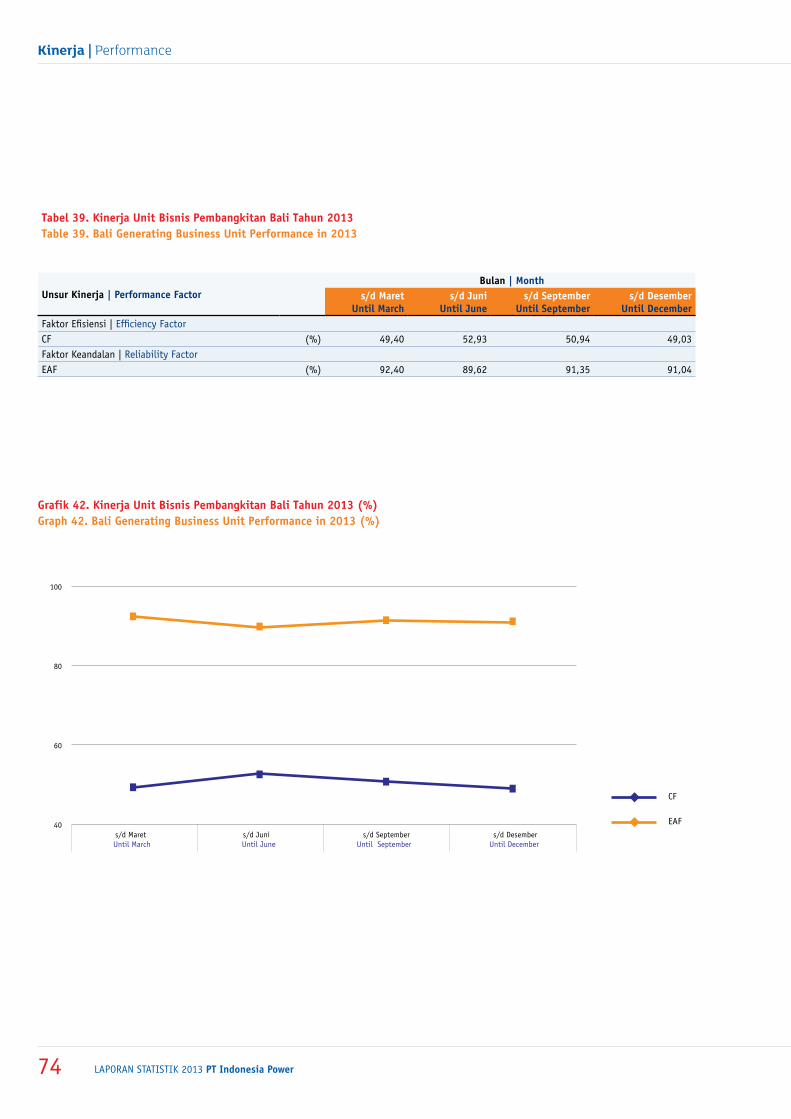
laporan statistik 2013 PT Indonesia Power74
Kinerja | Performance
grafik 42. kinerja unit Bisnis pembangkitan Bali tahun 2013 (%)graph 42. Bali generating Business unit performance in 2013 (%)
tabel 39. kinerja unit Bisnis pembangkitan Bali tahun 2013table 39. Bali generating Business unit performance in 2013
unsur kinerja | performance factor Bulan | month
s/d maret
until marchs/d Juni
until Junes/d September
until Septembers/d desember
until decemberFaktor Efisiensi | Efficiency FactorCF (%) 49,40 52,93 50,94 49,03 Faktor Keandalan | Reliability FactorEAF (%) 92,40 89,62 91,35 91,04
CF
EAF s/d Maret s/d Juni s/d September s/d Desember Until March Until June Until September Until December
40
60
80
100
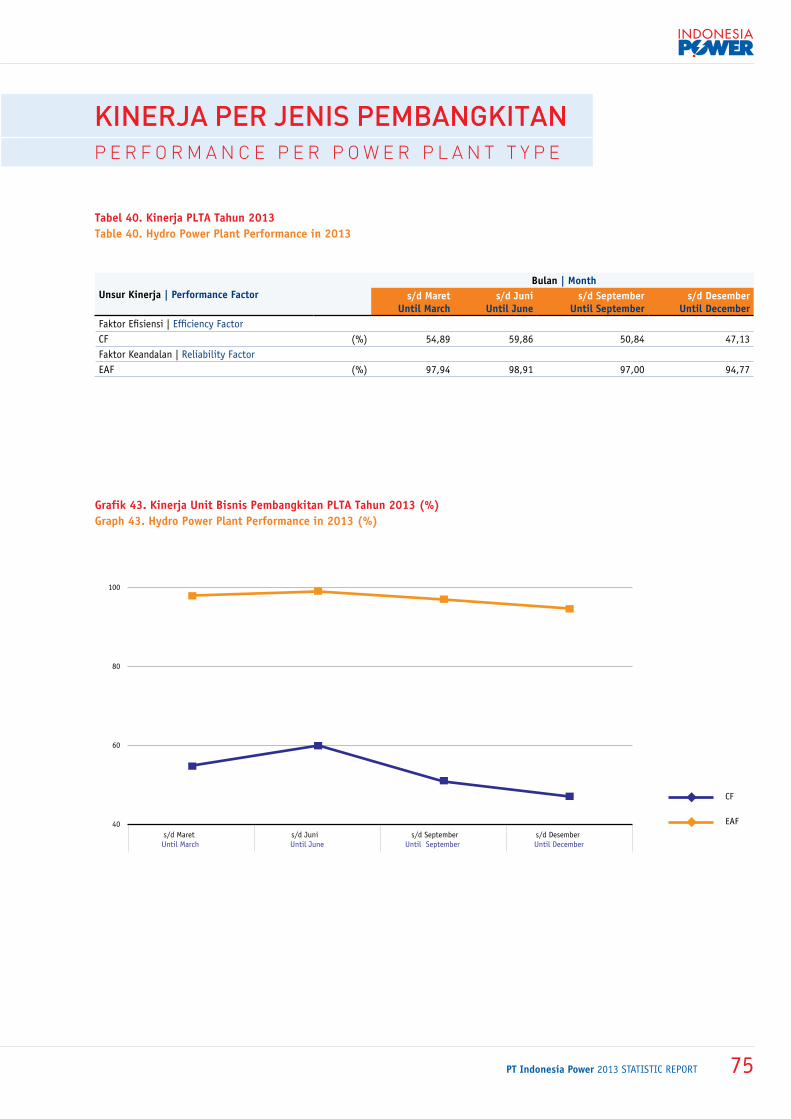
PT Indonesia Power 2013 statistic report 75
grafik 43. kinerja unit Bisnis pembangkitan plta tahun 2013 (%)graph 43. hydro power plant performance in 2013 (%)
tabel 40. kinerja plta tahun 2013table 40. hydro power plant performance in 2013
unsur kinerja | performance factor Bulan | month
s/d maret
until marchs/d Juni
until Junes/d September
until Septembers/d desember
until decemberFaktor Efisiensi | Efficiency FactorCF (%) 54,89 59,86 50,84 47,13 Faktor Keandalan | Reliability FactorEAF (%) 97,94 98,91 97,00 94,77
CF
EAF s/d Maret s/d Juni s/d September s/d Desember Until March Until June Until September Until December
40
60
80
100
kineRja PeR jenis Pembangkitanp e R f o R m a n c e p e R p o w e R p l a n t t y p e
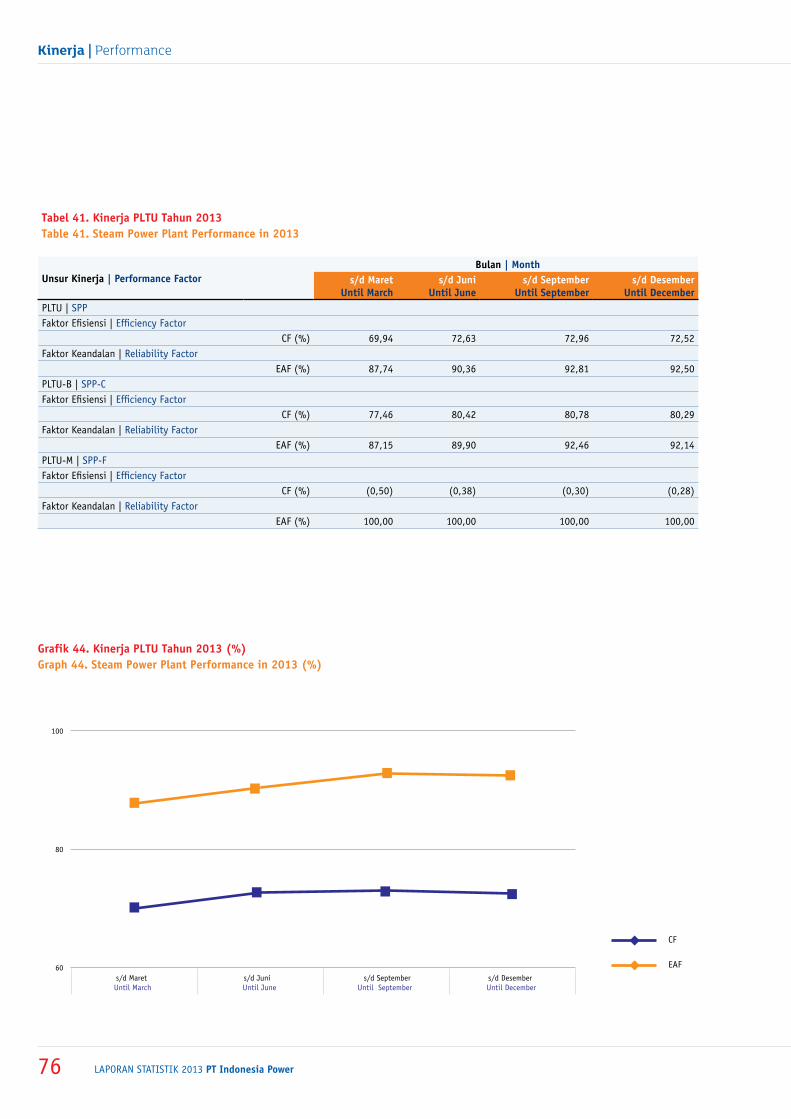
laporan statistik 2013 PT Indonesia Power76
Kinerja | Performance
grafik 44. kinerja pltu tahun 2013 (%)graph 44. Steam power plant performance in 2013 (%)
tabel 41. kinerja pltu tahun 2013table 41. Steam power plant performance in 2013
unsur kinerja | performance factor Bulan | month
s/d maret
until marchs/d Juni
until Junes/d September
until Septembers/d desember
until decemberPLTU | SPPFaktor Efisiensi | Efficiency Factor CF (%) 69,94 72,63 72,96 72,52 Faktor Keandalan | Reliability Factor
EAF (%) 87,74 90,36 92,81 92,50 PLTU-B | SPP-CFaktor Efisiensi | Efficiency Factor CF (%) 77,46 80,42 80,78 80,29 Faktor Keandalan | Reliability Factor
EAF (%) 87,15 89,90 92,46 92,14 PLTU-M | SPP-FFaktor Efisiensi | Efficiency Factor CF (%) (0,50) (0,38) (0,30) (0,28)Faktor Keandalan | Reliability Factor
EAF (%) 100,00 100,00 100,00 100,00
CF
EAF s/d Maret s/d Juni s/d September s/d Desember Until March Until June Until September Until December
60
80
100
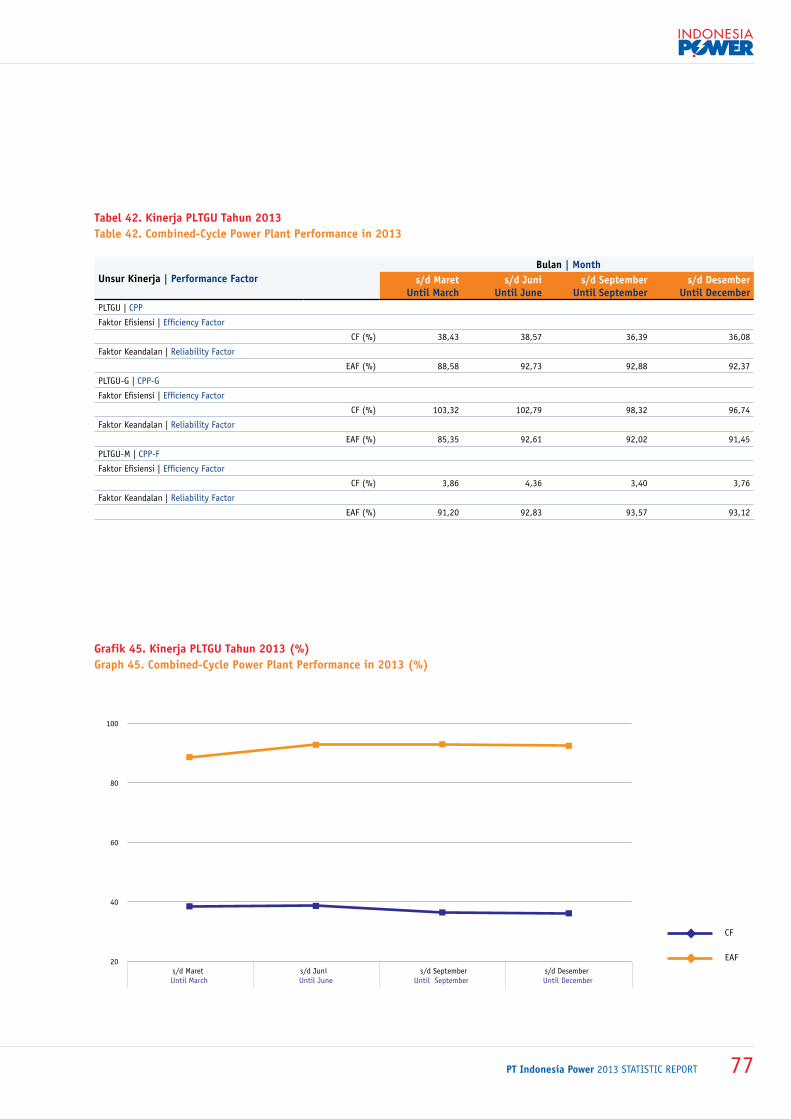
PT Indonesia Power 2013 statistic report 77
grafik 45. kinerja pltgu tahun 2013 (%)graph 45. combined-cycle power plant performance in 2013 (%)
tabel 42. kinerja pltgu tahun 2013table 42. combined-cycle power plant performance in 2013
unsur kinerja | performance factor Bulan | month
s/d maret
until marchs/d Juni
until Junes/d September
until Septembers/d desember
until decemberPLTGU | CPP
Faktor Efisiensi | Efficiency Factor
CF (%) 38,43 38,57 36,39 36,08
Faktor Keandalan | Reliability Factor
EAF (%) 88,58 92,73 92,88 92,37
PLTGU-G | CPP-G
Faktor Efisiensi | Efficiency Factor
CF (%) 103,32 102,79 98,32 96,74
Faktor Keandalan | Reliability Factor
EAF (%) 85,35 92,61 92,02 91,45
PLTGU-M | CPP-F
Faktor Efisiensi | Efficiency Factor
CF (%) 3,86 4,36 3,40 3,76
Faktor Keandalan | Reliability Factor
EAF (%) 91,20 92,83 93,57 93,12
CF
EAF s/d Maret s/d Juni s/d September s/d Desember Until March Until June Until September Until December
20
40
60
80
100
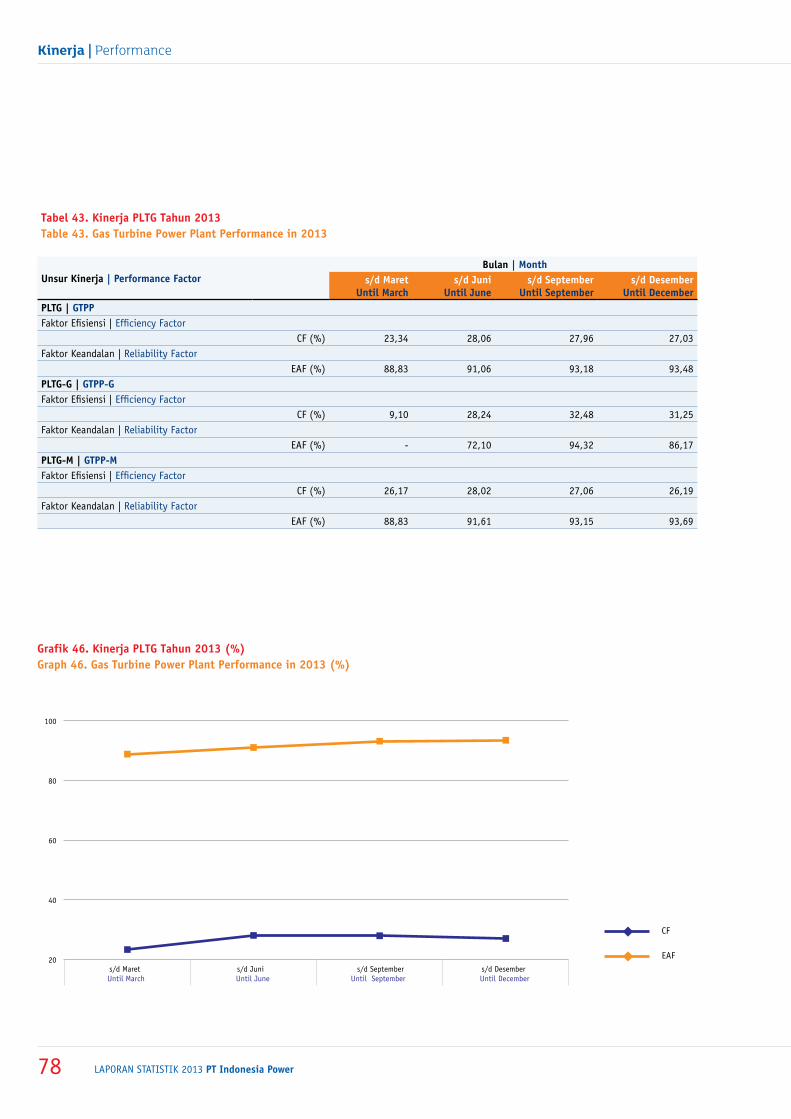
laporan statistik 2013 PT Indonesia Power78
Kinerja | Performance
grafik 46. kinerja pltg tahun 2013 (%)graph 46. gas turbine power plant performance in 2013 (%)
tabel 43. kinerja pltg tahun 2013table 43. gas turbine power plant performance in 2013
unsur kinerja | performance factor Bulan | month
s/d maret
until marchs/d Juni
until Junes/d September
until Septembers/d desember
until decemberpltg | gtpp Faktor Efisiensi | Efficiency Factor CF (%) 23,34 28,06 27,96 27,03 Faktor Keandalan | Reliability Factor
EAF (%) 88,83 91,06 93,18 93,48 pltg-g | gtpp-g Faktor Efisiensi | Efficiency Factor CF (%) 9,10 28,24 32,48 31,25 Faktor Keandalan | Reliability Factor
EAF (%) - 72,10 94,32 86,17 pltg-m | gtpp-m Faktor Efisiensi | Efficiency Factor CF (%) 26,17 28,02 27,06 26,19 Faktor Keandalan | Reliability Factor
EAF (%) 88,83 91,61 93,15 93,69
CF
EAF s/d Maret s/d Juni s/d September s/d Desember Until March Until June Until September Until December
20
40
60
80
100
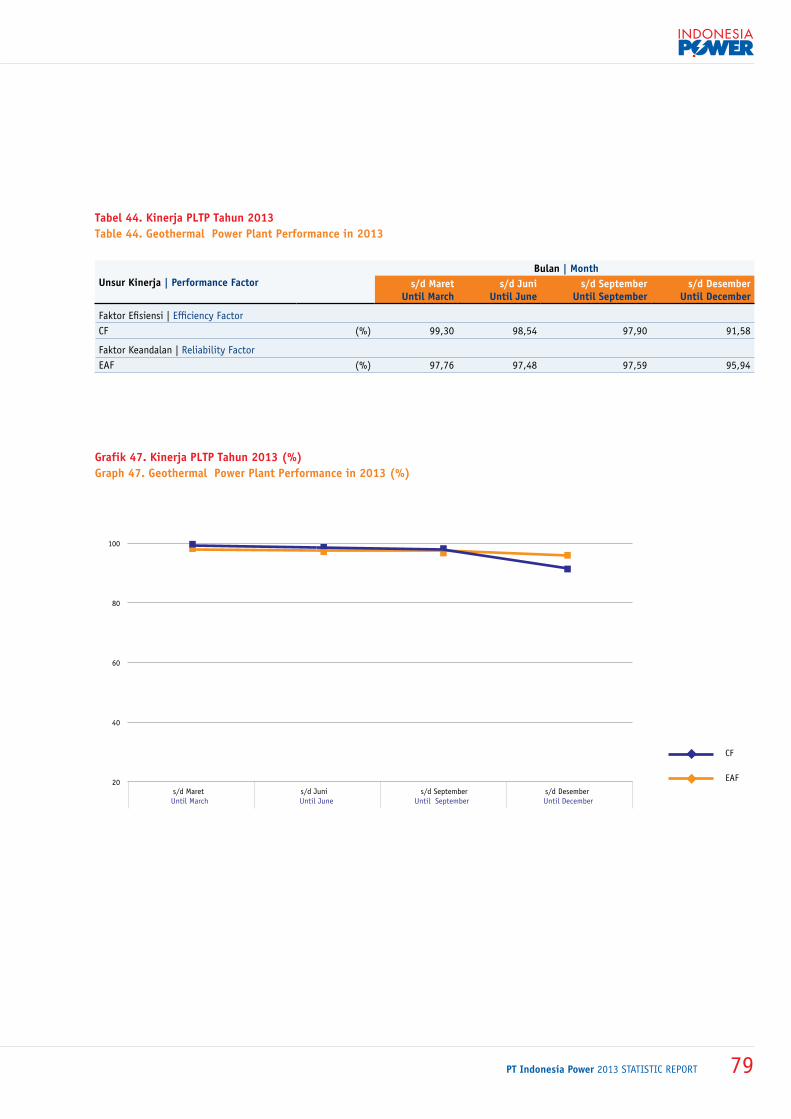
PT Indonesia Power 2013 statistic report 79
grafik 47. kinerja pltp tahun 2013 (%)graph 47. geothermal power plant performance in 2013 (%)
tabel 44. kinerja pltp tahun 2013table 44. geothermal power plant performance in 2013
unsur kinerja | performance factor Bulan | month
s/d maret
until marchs/d Juni
until Junes/d September
until Septembers/d desember
until december
Faktor Efisiensi | Efficiency FactorCF (%) 99,30 98,54 97,90 91,58
Faktor Keandalan | Reliability FactorEAF (%) 97,76 97,48 97,59 95,94
CF
EAF s/d Maret s/d Juni s/d September s/d Desember Until March Until June Until September Until December
20
40
60
80
100
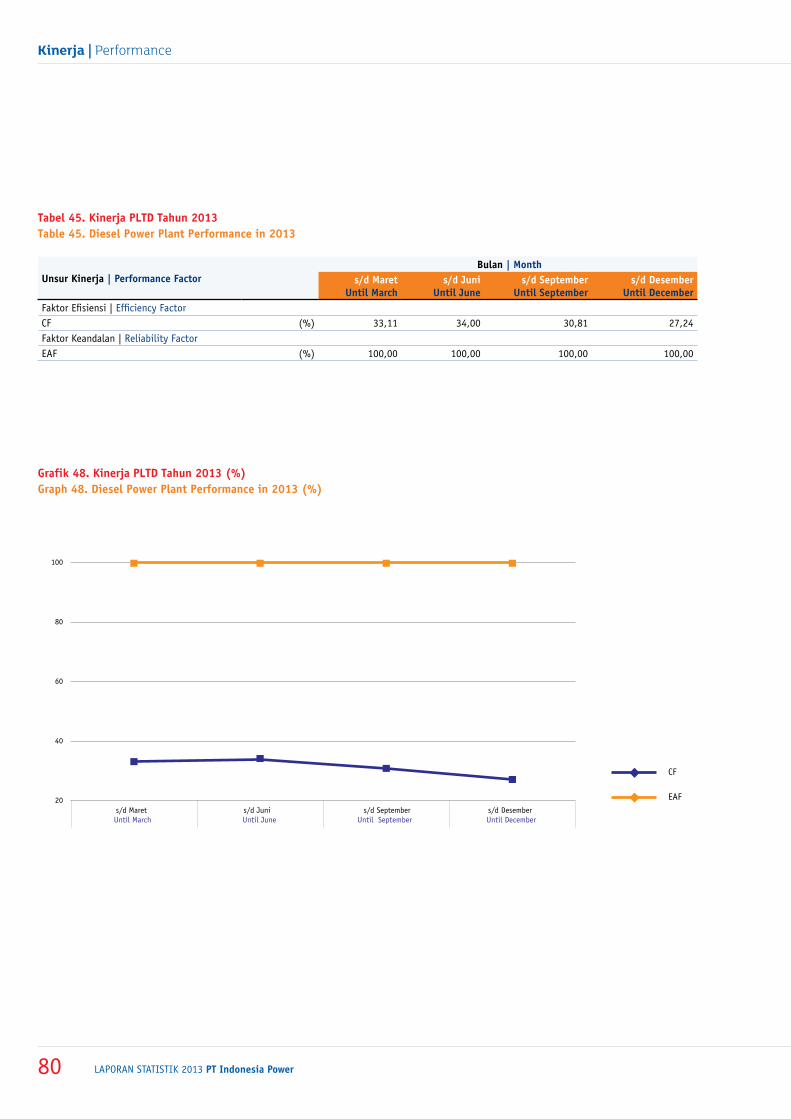
laporan statistik 2013 PT Indonesia Power80
Kinerja | Performance
grafik 48. kinerja pltd tahun 2013 (%)graph 48. diesel power plant performance in 2013 (%)
tabel 45. kinerja pltd tahun 2013table 45. diesel power plant performance in 2013
unsur kinerja | performance factor Bulan | month
s/d maret
until marchs/d Juni
until Junes/d September
until Septembers/d desember
until decemberFaktor Efisiensi | Efficiency FactorCF (%) 33,11 34,00 30,81 27,24 Faktor Keandalan | Reliability FactorEAF (%) 100,00 100,00 100,00 100,00
CF
EAF s/d Maret s/d Juni s/d September s/d Desember Until March Until June Until September Until December
20
40
60
80
100
PT Indonesia Power 2013 statistic report 81
PendapatanPenjualanEnergiListrikelectricity Sales Revenue
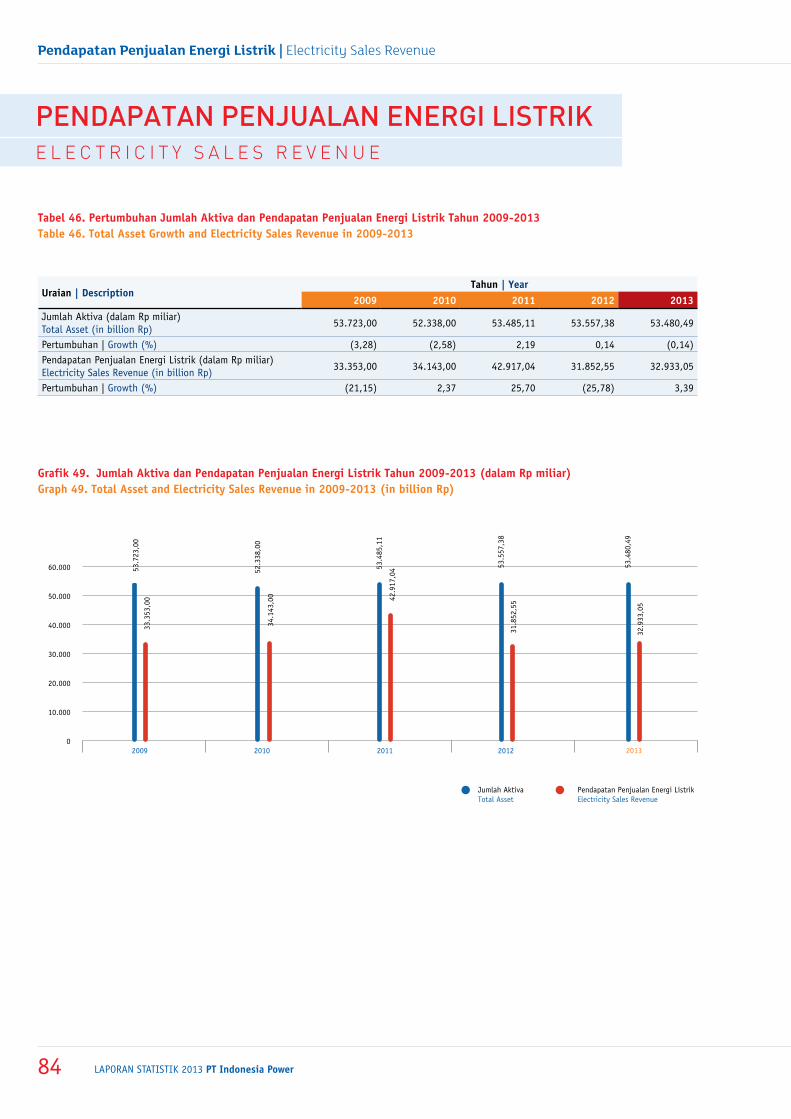
laporan statistik 2013 PT Indonesia Power84
Pendapatan Penjualan Energi Listrik | Electricity Sales Revenue
grafik 49. Jumlah aktiva dan pendapatan penjualan Energi listrik tahun 2009-2013 (dalam rp miliar) graph 49. total asset and Electricity Sales revenue in 2009-2013 (in billion rp)
tabel 46. pertumbuhan Jumlah aktiva dan pendapatan penjualan Energi listrik tahun 2009-2013table 46. total asset growth and Electricity Sales revenue in 2009-2013
uraian | descriptiontahun | year
2009 2010 2011 2012 2013Jumlah Aktiva (dalam Rp miliar) Total Asset (in billion Rp)
53.723,00 52.338,00 53.485,11 53.557,38 53.480,49
Pertumbuhan | Growth (%) (3,28) (2,58) 2,19 0,14 (0,14)Pendapatan Penjualan Energi Listrik (dalam Rp miliar)Electricity Sales Revenue (in billion Rp)
33.353,00 34.143,00 42.917,04 31.852,55 32.933,05
Pertumbuhan | Growth (%) (21,15) 2,37 25,70 (25,78) 3,39
Jumlah AktivaTotal Asset
Pendapatan Penjualan Energi ListrikElectricity Sales Revenue
0
10.000
20.000
30.000
40.000
50.000
60.000
2009 2010 2011 2012
53.
723,
00
52.
338,
00
53.
557,
38
31.
852,
55
53.
480,
49
32.9
33,0
5
33.
353,
00
34.
143,
00
53.
485,
11
42.9
17,0
4
2013
PendaPatan Penjualan eneRgi listRike l e c t R i c i t y S a l e S R e v e n u e
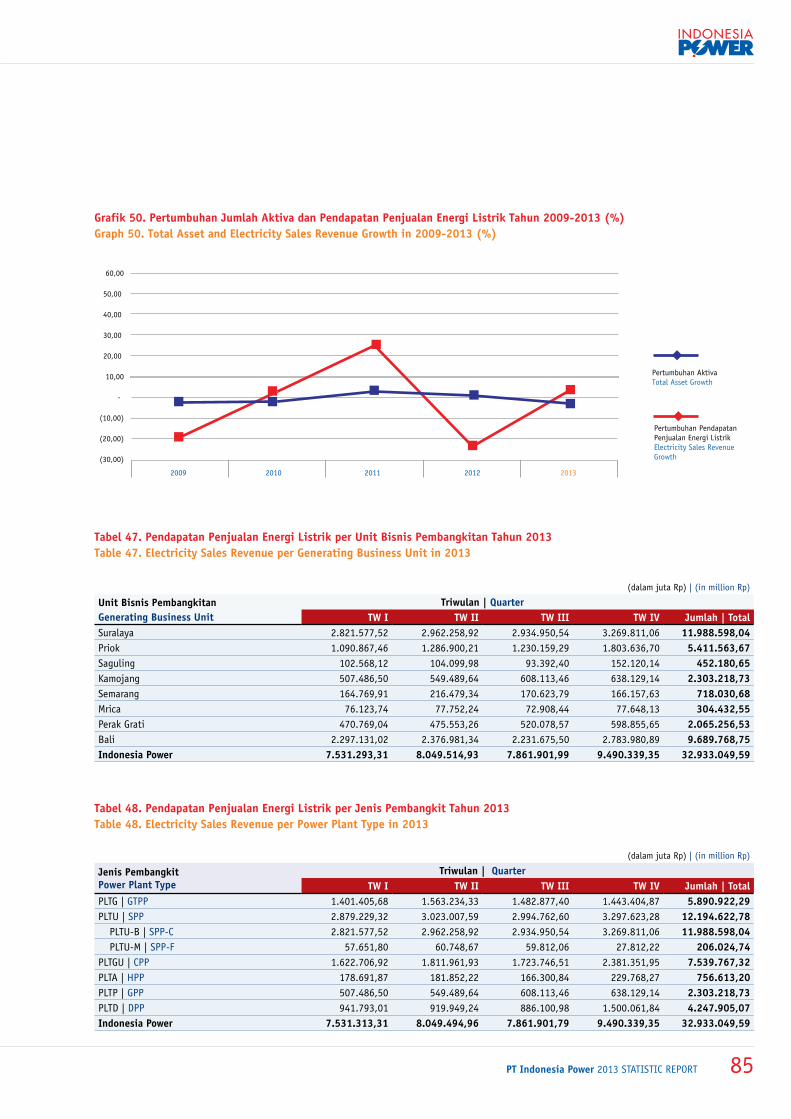
PT Indonesia Power 2013 statistic report 85
grafik 50. pertumbuhan Jumlah aktiva dan pendapatan penjualan Energi listrik tahun 2009-2013 (%)graph 50. total asset and Electricity Sales revenue growth in 2009-2013 (%)
tabel 47. pendapatan penjualan Energi listrik per unit Bisnis pembangkitan tahun 2013table 47. Electricity Sales revenue per generating Business unit in 2013
(dalam juta Rp) | (in million Rp)
unit Bisnis pembangkitangenerating Business unit
triwulan | Quarter tw i tw ii tw iii tw iv Jumlah | total
Suralaya 2.821.577,52 2.962.258,92 2.934.950,54 3.269.811,06 11.988.598,04 Priok 1.090.867,46 1.286.900,21 1.230.159,29 1.803.636,70 5.411.563,67 Saguling 102.568,12 104.099,98 93.392,40 152.120,14 452.180,65 Kamojang 507.486,50 549.489,64 608.113,46 638.129,14 2.303.218,73 Semarang 164.769,91 216.479,34 170.623,79 166.157,63 718.030,68 Mrica 76.123,74 77.752,24 72.908,44 77.648,13 304.432,55 Perak Grati 470.769,04 475.553,26 520.078,57 598.855,65 2.065.256,53 Bali 2.297.131,02 2.376.981,34 2.231.675,50 2.783.980,89 9.689.768,75 indonesia power 7.531.293,31 8.049.514,93 7.861.901,99 9.490.339,35 32.933.049,59
tabel 48. pendapatan penjualan Energi listrik per Jenis pembangkit tahun 2013table 48. Electricity Sales revenue per power plant type in 2013
(dalam juta Rp) | (in million Rp)
Jenis pembangkitpower plant type
triwulan | Quarter tw i tw ii tw iii tw iv Jumlah | total
PLTG | GTPP 1.401.405,68 1.563.234,33 1.482.877,40 1.443.404,87 5.890.922,29 PLTU | SPP 2.879.229,32 3.023.007,59 2.994.762,60 3.297.623,28 12.194.622,78
PLTU-B | SPP-C 2.821.577,52 2.962.258,92 2.934.950,54 3.269.811,06 11.988.598,04 PLTU-M | SPP-F 57.651,80 60.748,67 59.812,06 27.812,22 206.024,74
PLTGU | CPP 1.622.706,92 1.811.961,93 1.723.746,51 2.381.351,95 7.539.767,32 PLTA | HPP 178.691,87 181.852,22 166.300,84 229.768,27 756.613,20 PLTP | GPP 507.486,50 549.489,64 608.113,46 638.129,14 2.303.218,73 PLTD | DPP 941.793,01 919.949,24 886.100,98 1.500.061,84 4.247.905,07 indonesia power 7.531.313,31 8.049.494,96 7.861.901,79 9.490.339,35 32.933.049,59
-
60,00
50,00
40,00
30,00
20,00
10,00
(10,00)
(20,00)
(30,00)
Pertumbuhan Pendapatan Penjualan Energi Listrik Electricity Sales Revenue Growth
2009 2010 2011 2012
Pertumbuhan Aktiva Total Asset Growth
2013


Kepegawaianhuman Resources
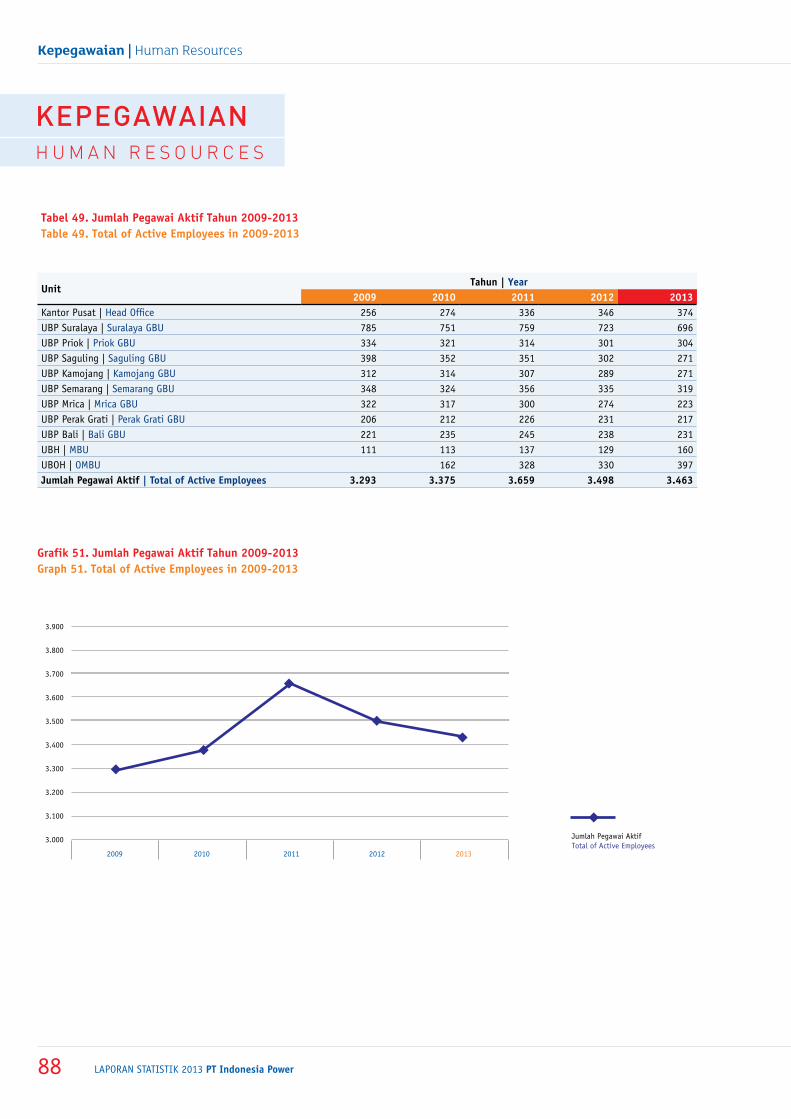
laporan statistik 2013 PT Indonesia Power88
Kepegawaian | Human Resources
grafik 51. Jumlah pegawai aktif tahun 2009-2013graph 51. total of active Employees in 2009-2013
tabel 49. Jumlah pegawai aktif tahun 2009-2013table 49. total of active Employees in 2009-2013
unittahun | year
2009 2010 2011 2012 2013Kantor Pusat | Head Office 256 274 336 346 374UBP Suralaya | Suralaya GBU 785 751 759 723 696UBP Priok | Priok GBU 334 321 314 301 304UBP Saguling | Saguling GBU 398 352 351 302 271UBP Kamojang | Kamojang GBU 312 314 307 289 271UBP Semarang | Semarang GBU 348 324 356 335 319UBP Mrica | Mrica GBU 322 317 300 274 223UBP Perak Grati | Perak Grati GBU 206 212 226 231 217UBP Bali | Bali GBU 221 235 245 238 231UBH | MBU 111 113 137 129 160UBOH | OMBU 162 328 330 397Jumlah pegawai aktif | total of active Employees 3.293 3.375 3.659 3.498 3.463
3.900
3.800
3.700
3.600
3.500
3.400
3.300
3.200
3.100
3.000
2009 2010 2011 2012
Jumlah Pegawai Aktif Total of Active Employees
2013
kePegawaianh u m a n R e S o u R c e S
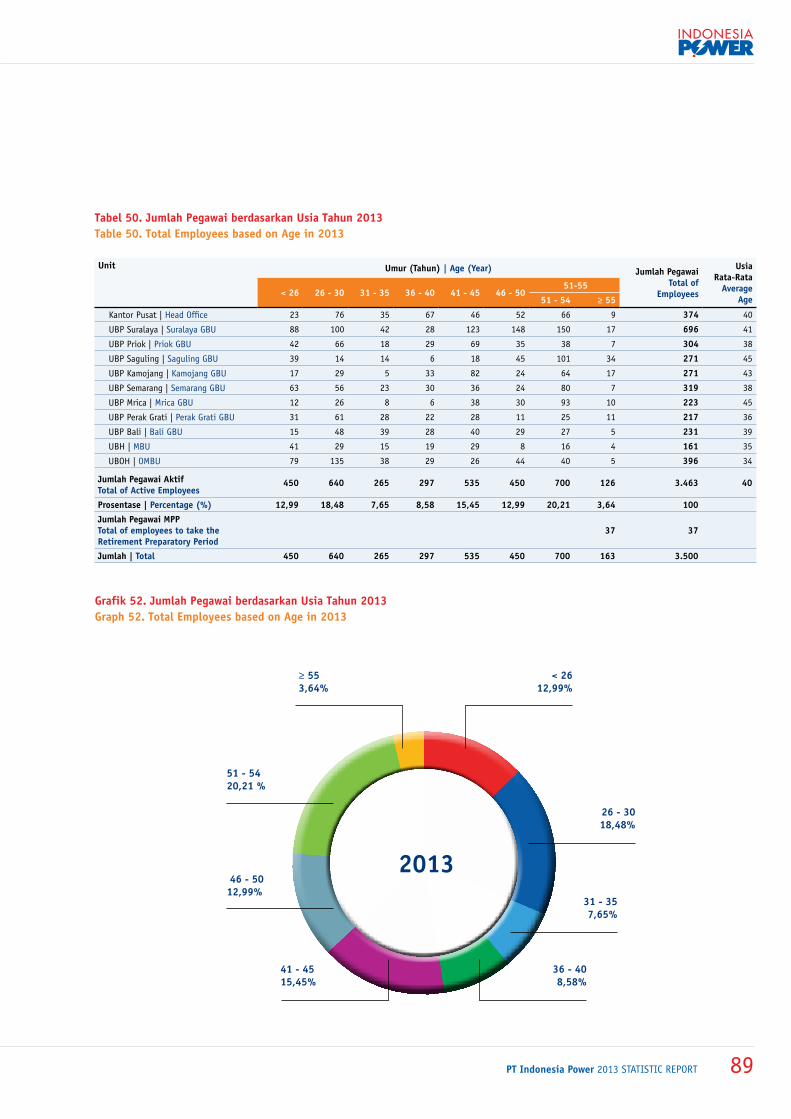
PT Indonesia Power 2013 statistic report 89
grafik 52. Jumlah pegawai berdasarkan usia tahun 2013graph 52. total Employees based on age in 2013
tabel 50. Jumlah pegawai berdasarkan usia tahun 2013table 50. total Employees based on age in 2013
unit umur (tahun) | age (year) Jumlah pegawai total of
Employees
usia rata-rata
average age
< 26 26 - 30 31 - 35 36 - 40 41 - 45 46 - 50 51-55
51 - 54 ≥ 55
Kantor Pusat | Head Office 23 76 35 67 46 52 66 9 374 40
UBP Suralaya | Suralaya GBU 88 100 42 28 123 148 150 17 696 41
UBP Priok | Priok GBU 42 66 18 29 69 35 38 7 304 38
UBP Saguling | Saguling GBU 39 14 14 6 18 45 101 34 271 45
UBP Kamojang | Kamojang GBU 17 29 5 33 82 24 64 17 271 43
UBP Semarang | Semarang GBU 63 56 23 30 36 24 80 7 319 38
UBP Mrica | Mrica GBU 12 26 8 6 38 30 93 10 223 45
UBP Perak Grati | Perak Grati GBU 31 61 28 22 28 11 25 11 217 36
UBP Bali | Bali GBU 15 48 39 28 40 29 27 5 231 39
UBH | MBU 41 29 15 19 29 8 16 4 161 35
UBOH | OMBU 79 135 38 29 26 44 40 5 396 34
Jumlah pegawai aktiftotal of active Employees
450 640 265 297 535 450 700 126 3.463 40
prosentase | percentage (%) 12,99 18,48 7,65 8,58 15,45 12,99 20,21 3,64 100
Jumlah pegawai mpptotal of employees to take the retirement preparatory period
37 37
Jumlah | total 450 640 265 297 535 450 700 163 3.500
201331 - 35 7,65%
36 - 40 8,58%
41 - 45 15,45%
46 - 50 12,99%
51 - 54 20,21 %
≥ 55 3,64%
< 26 12,99%
26 - 30 18,48%
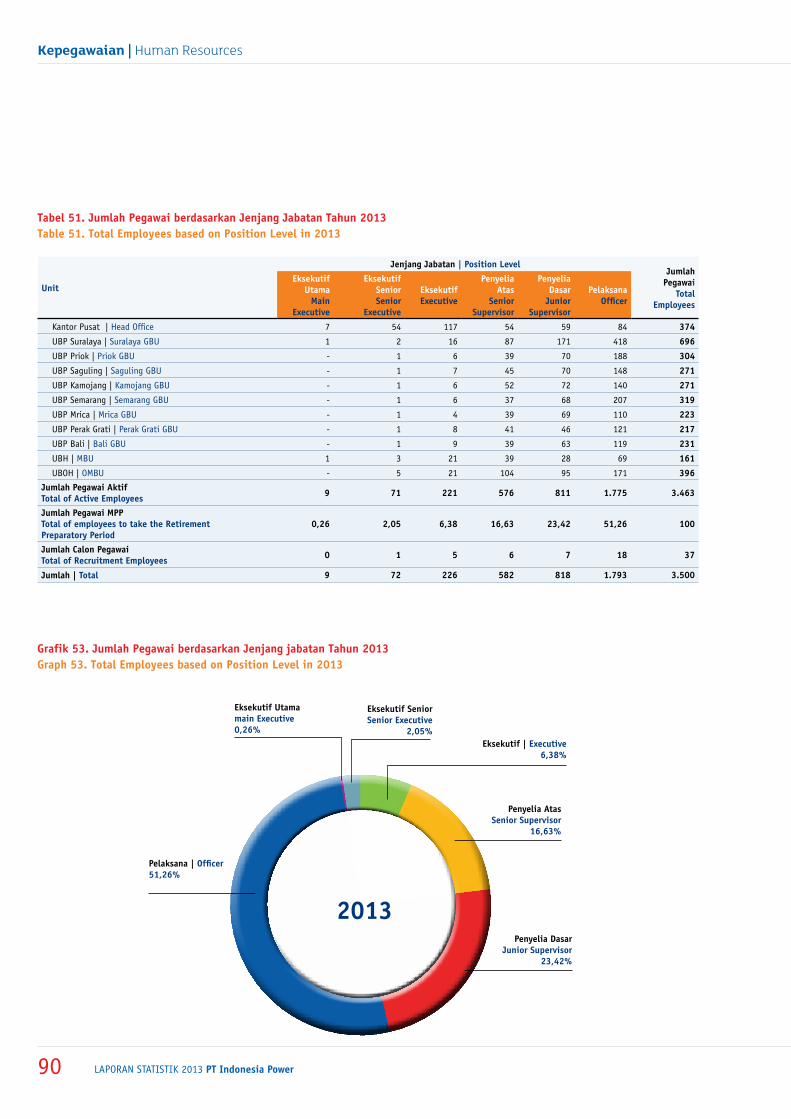
laporan statistik 2013 PT Indonesia Power90
Kepegawaian | Human Resources
grafik 53. Jumlah pegawai berdasarkan Jenjang jabatan tahun 2013graph 53. total Employees based on position level in 2013
tabel 51. Jumlah pegawai berdasarkan Jenjang Jabatan tahun 2013table 51. total Employees based on position level in 2013
unit
Jenjang Jabatan | position level Jumlah pegawai
total Employees
Eksekutif utama
main Executive
Eksekutif SeniorSenior
Executive
Eksekutif Executive
penyelia atas
Senior Supervisor
penyelia dasar
Junior Supervisor
pelaksana officer
Kantor Pusat | Head Office 7 54 117 54 59 84 374
UBP Suralaya | Suralaya GBU 1 2 16 87 171 418 696
UBP Priok | Priok GBU - 1 6 39 70 188 304
UBP Saguling | Saguling GBU - 1 7 45 70 148 271
UBP Kamojang | Kamojang GBU - 1 6 52 72 140 271
UBP Semarang | Semarang GBU - 1 6 37 68 207 319
UBP Mrica | Mrica GBU - 1 4 39 69 110 223
UBP Perak Grati | Perak Grati GBU - 1 8 41 46 121 217
UBP Bali | Bali GBU - 1 9 39 63 119 231
UBH | MBU 1 3 21 39 28 69 161
UBOH | OMBU - 5 21 104 95 171 396
Jumlah pegawai aktiftotal of active Employees 9 71 221 576 811 1.775 3.463
Jumlah pegawai mpptotal of employees to take the retirement preparatory period
0,26 2,05 6,38 16,63 23,42 51,26 100
Jumlah calon pegawaitotal of recruitment Employees 0 1 5 6 7 18 37
Jumlah | total 9 72 226 582 818 1.793 3.500
2013
Eksekutif utamamain Executive 0,26%
Eksekutif SeniorSenior Executive
2,05%Eksekutif | Executive
6,38%
penyelia atasSenior Supervisor
16,63%
pelaksana | officer 51,26%
penyelia dasarJunior Supervisor
23,42%
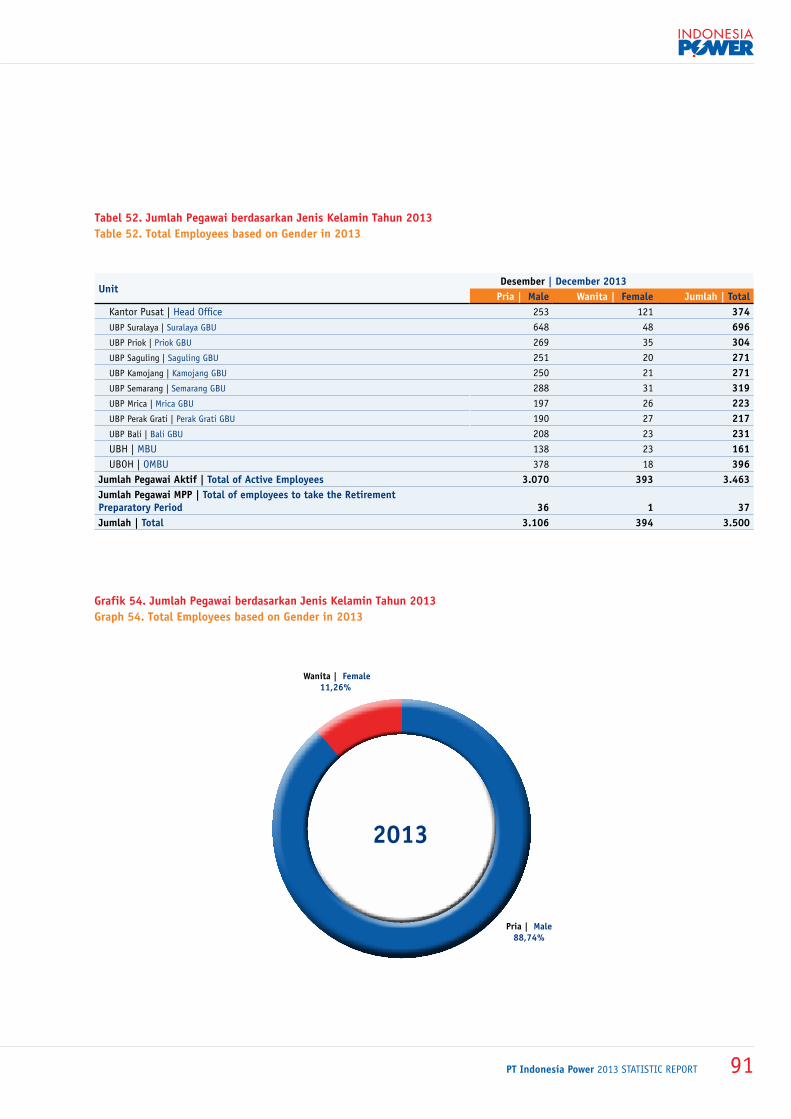
PT Indonesia Power 2013 statistic report 91
grafik 54. Jumlah pegawai berdasarkan Jenis kelamin tahun 2013graph 54. total Employees based on gender in 2013
tabel 52. Jumlah pegawai berdasarkan Jenis kelamin tahun 2013table 52. total Employees based on gender in 2013
unitdesember | december 2013
pria | male wanita | female Jumlah | totalKantor Pusat | Head Office 253 121 374 UBP Suralaya | Suralaya GBU 648 48 696 UBP Priok | Priok GBU 269 35 304 UBP Saguling | Saguling GBU 251 20 271 UBP Kamojang | Kamojang GBU 250 21 271 UBP Semarang | Semarang GBU 288 31 319 UBP Mrica | Mrica GBU 197 26 223 UBP Perak Grati | Perak Grati GBU 190 27 217 UBP Bali | Bali GBU 208 23 231 UBH | MBU 138 23 161 UBOH | OMBU 378 18 396
Jumlah pegawai aktif | total of active Employees 3.070 393 3.463 Jumlah pegawai mpp | total of employees to take the retirement preparatory period 36 1 37 Jumlah | total 3.106 394 3.500
wanita | female 11,26%
pria | male 88,74%
2013
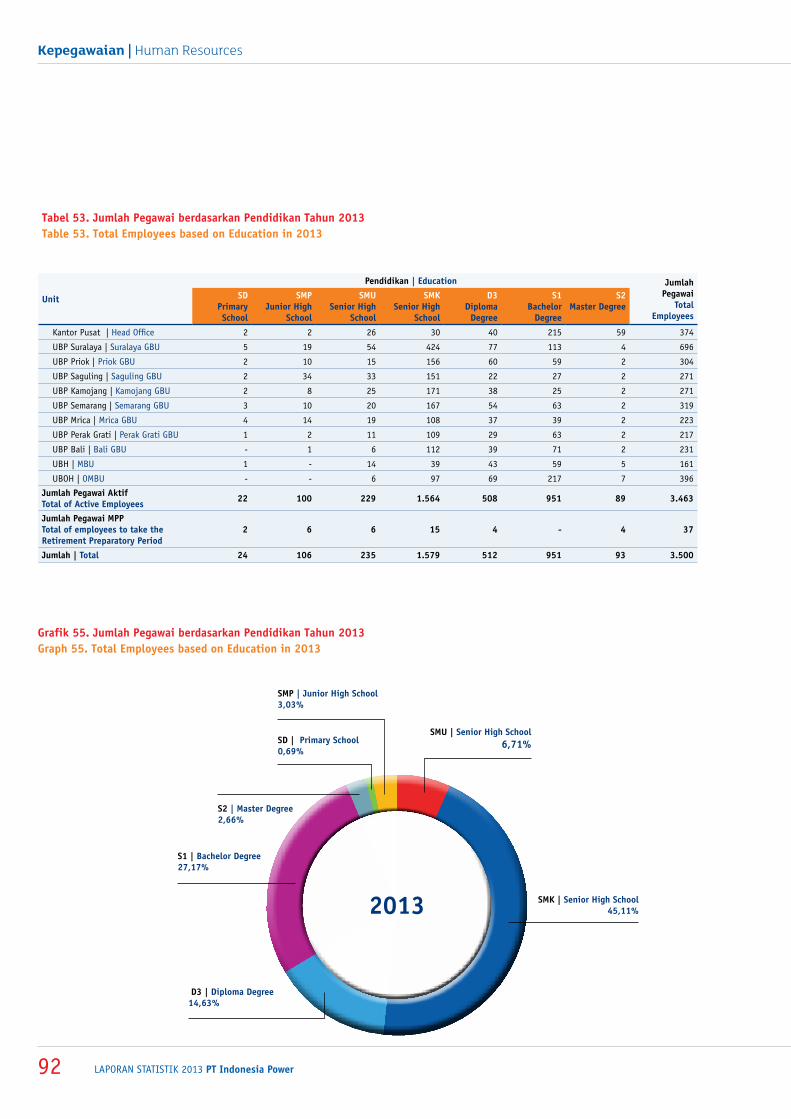
laporan statistik 2013 PT Indonesia Power92
Kepegawaian | Human Resources
grafik 55. Jumlah pegawai berdasarkan pendidikan tahun 2013graph 55. total Employees based on Education in 2013
tabel 53. Jumlah pegawai berdasarkan pendidikan tahun 2013 table 53. total Employees based on Education in 2013
unit
pendidikan | Education Jumlah pegawai
total Employees
Sd primary
School
Smp Junior high
School
Smu Senior high
School
Smk Senior high
School
d3 diploma
degree
S1 Bachelor
degree
S2master degree
Kantor Pusat | Head Office 2 2 26 30 40 215 59 374
UBP Suralaya | Suralaya GBU 5 19 54 424 77 113 4 696
UBP Priok | Priok GBU 2 10 15 156 60 59 2 304
UBP Saguling | Saguling GBU 2 34 33 151 22 27 2 271
UBP Kamojang | Kamojang GBU 2 8 25 171 38 25 2 271
UBP Semarang | Semarang GBU 3 10 20 167 54 63 2 319
UBP Mrica | Mrica GBU 4 14 19 108 37 39 2 223
UBP Perak Grati | Perak Grati GBU 1 2 11 109 29 63 2 217
UBP Bali | Bali GBU - 1 6 112 39 71 2 231
UBH | MBU 1 - 14 39 43 59 5 161
UBOH | OMBU - - 6 97 69 217 7 396
Jumlah pegawai aktiftotal of active Employees 22 100 229 1.564 508 951 89 3.463
Jumlah pegawai mpptotal of employees to take the retirement preparatory period
2 6 6 15 4 - 4 37
Jumlah | total 24 106 235 1.579 512 951 93 3.500
2013 Smk | Senior high School 45,11%
Smu | Senior high School 6,71%
Smp | Junior high School 3,03%
Sd | primary School 0,69%
S1 | Bachelor degree 27,17%
d3 | diploma degree 14,63%
S2 | master degree 2,66%
PT Indonesia Power 2013 statistic report 93
Istilah, definisi dan rumus-rumus yang digunakan adalah sebagai berikut:
1. faktor kapasitas yaitu kWh produksi bruto, adalah energi yang dibangkitkan
oleh generator sebelum dikurangi energi pemakaian sendiri (untuk peralatan bantu, penerangan sentral, dan lain-lain), atau produksi energi listrik yang diukur pada terminal generator.
2. kapasitas terpasang adalah kapasitas suatu unit pembangkit sebagaimana tertera
pada papan nama (name plate) dari generator atau mesin penggerak utama, dipilih mana yang lebih kecil. Khusus untuk PLTG, kapasitas terpasangnya adalah sebagaimana tertera pada papan nama berdasarkan base-load, bukan berdasarkan peak load.
3. Equivalent Availability Factor (Eaf) Equivalent Availability Factor (EAF) yaitu faktor ketersediaan
mesin pembangkit untuk beroperasi pada Daya Mampu Nettonya; dengan perhitungan = (jumlah jam unit pembangkit siap dioperasikan - (derating permanen + derating tidak permanen)) dibagi dengan jumlah jam dalam periode tertentu. Untuk PLTA yang dihitungkan adalah unit mesinnya, bukan ketersediaan debit air. Jam tersedia: jumlah jam dimana unit dalam keadaan operasi dan atau siap operasi.
4. pemakaian Sendiri (pS) Perhitungan pemakaian sendiri (PS), merupakan selisih antara
produksi bruto dengan penjualan (MWh) yang disalurkan ke sistem transmisi.
Term, definitions and formulas used in this report as follow:
1. capacity factor kWh gross production is the amount of power generated before
being subtracted by self consumption energy (for assisting machinery, central lighting,etc.), or production of energy as measured by terminal generator.
2. installed capacity is the capacity of a generating unit, as it shown on generator’s
name plate of prime mover, whichever is smaller. Especially GTPP, the installed capacity is whatever shown on the name plate based on base load, not based on peak load.
3. Equivalent availability factor (Eaf) Equivalent Availability Factor (EAF) is the availability factor of
power plant engine to operate the Net Maximum Capacity the calculation is (number of hours the generating unit is ready to operate - (permanent derating + non-permanent derating)) divided by the number of hours in a given period. For HPP the derivative is the number of machine (unit), not the water volume. Availability hours: total hours of operation and/ or running hours.
4. Self consumption Measurement for self consumption is the difference between
gross production value and sales (MWh) delivered to the transmission system.
Penjelasan
g l o S S a R y o f t e R m S
laporan statistik 2013 PT Indonesia Power94
Laporan Statistik 2013 | 2013 Statistic Report
CF : Capacity FactorEAF : Equivalent Available FactorGWh : Giga Watt-hourHSD : High Speed DieselIPP : Independent Power ProducerKw : Kilo WattkWh : kilo Watt-hourMFO : Marine Fuel OilMPP : Masa Persiapan PensiunMW : Mega WattMWh : Mega Watt-hourPJB : Pembangkitan Jawa-BaliPLTA : Pusat Listrik Tenaga AirPLTD : Pusat Listrik Tenaga DieselPLTDG : Pusat Listrik Tenaga Diesel GasPLTG : Pusat Listrik Tenaga GasPLTGU : Pusat Listrik Tenaga Gas dan UapPLTMG : Pusat Listrik Tenaga Mesin GasPLTP : Pusat Listrik Tenaga Panas BumiPLTU : Pusat Listrik Tenaga UapP3B : Penyaluran dan Pusat Pengatur Beban Jawa-BaliUB : Unit Bisnis UBH : Unit Bisnis Jasa PemeliharaanUBOH : Unit Bisnis Operasi dan PemeliharaanUBP : Unit Bisnis PembangkitanUPJB : Unit Pembangkitan Jawa Bali
MMBTU: 106 British Thermal Unit (MM=106)
British Thermal Unit (BTU) adalah jumlah kalori yang diperlukan untuk menaikan 1 pound air 1 derajat Fahrenheit pada temperatur 60 derajat Fahrenheit, pada tekanan absolute 14,7 pound per square inch.
Standard Cubic Foot (SCF) adalah sejumlah gas yang diperlukan untuk mengisi ruangan 1 Cubic Foot, dengan tekanan sebesar 14,7 pounds per square inch absolute dan pada temperatur 60 derajat Fahrenheit, dalam kondisi kering.
1.000 BTU Gas adalah gas yang mempunyai Gross Heating Value sebesar 1.000 BTU tiap SCF.
British Thermal Unit (BTU) is the total calories needed to raise 1 pound of water 1 Fahrenheit degree from temperature 60 Fahrenheit degrees with pressure 14.7 pound per square inc absolute.
Standard Cubic Foot (SCF) is the total gas which needed to fit 1 Cubic Foot room, with pressure 14.7 pounds per square inch absolute and in temperature of 60 Fahrenheit degrees in dry condition.
1,000 BTU Gas is gas which has Gross Heating Value 1,000 BTU per SCF.
daftaR singkatanl i S t o f a B B R e v i a t i o n


PT INDONESIA POWERJl. Jend Gatot Subroto Kav. 18Jakarta 12950Tel. (62-21) 526 7666 (hunting)Fax. (62-21) 525 1923, 525 2623
www.indonesiapower.co.id