Embed Size (px)
Citation preview
Prefatory Note
The attached document represents the most complete and accurate version available based on original copies culled from the files of the FOMC Secretariat at the Board of Governors of the Federal Reserve System. This electronic document was created through a comprehensive digitization process which included identifying the best-preserved paper copies, scanning those copies,1 and then making the scanned versions text-searchable.2 Though a stringent quality assurance process was employed, some imperfections may remain.
Please note that this document may contain occasional gaps in the text. These gaps are the result of a redaction process that removed information obtained on a confidential basis. All redacted passages are exempt from disclosure under applicable provisions of the Freedom of Information Act.
1 In some cases, original copies needed to be photocopied before being scanned into electronic format. All scanned images were deskewed (to remove the effects of printer- and scanner-introduced tilting) and lightly cleaned (to remove dark spots caused by staple holes, hole punches, and other blemishes caused after initial printing). 2 A two-step process was used. An advanced optimal character recognition computer program (OCR) first created electronic text from the document image. Where the OCR results were inconclusive, staff checked and corrected the text as necessary. Please note that the numbers and text in charts and tables were not reliably recognized by the OCR process and were not checked or corrected by staff.

Strictly Confidential (FR) Class I FOMC
MONETARY POLICY ALTERNATIVES
Prepared for the Federal Open Market Committee
By the staff Board of Governors of the Federal Reserve System
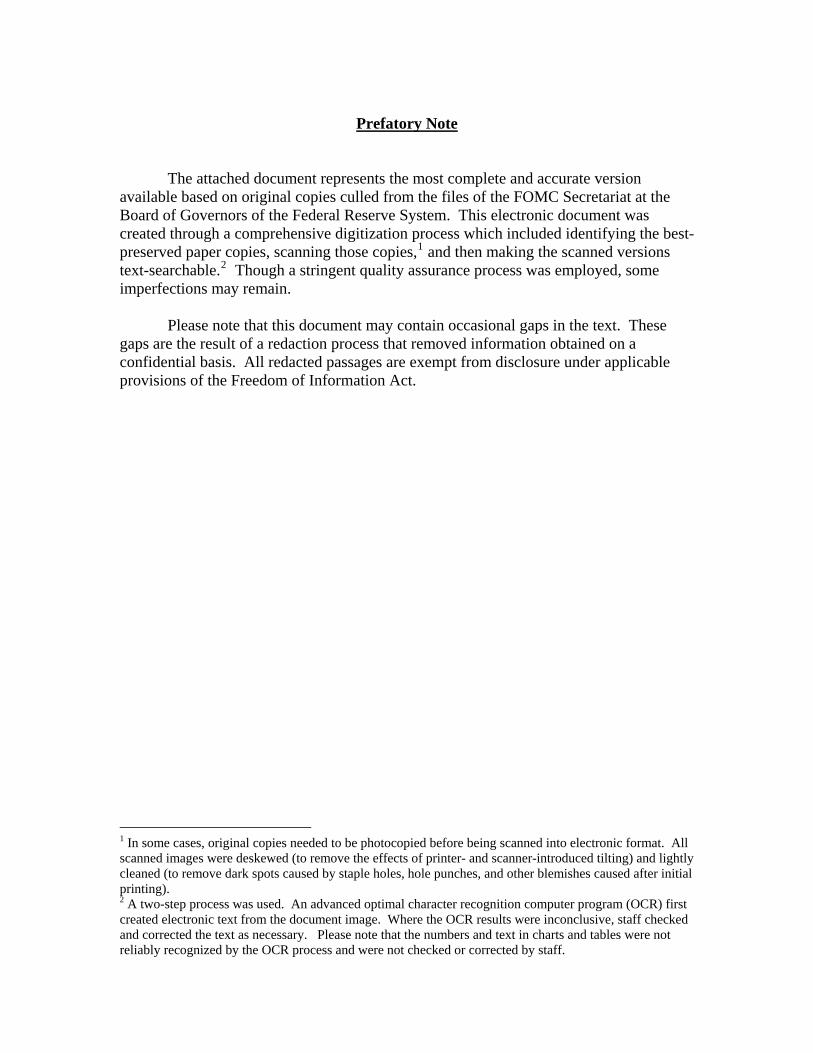
Strictly Confidential (FR)Class I - FOMC November 13, 1992
MONETARY POLICY ALTERNATIVES
Recent Developments
(1) The degree of reserve pressure was left unchanged over
the intermeeting period, with the expected level of the federal funds
rate remaining at 3 percent. The firmness in the federal funds rate
seen during much of the previous intermeeting period carried into the
first week of the current period, partly as a result of unexpected
strength in required reserves, but subsequently the rate has averaged
close to 3 percent.1 Markets had built in a quarter-point decline
in the federal funds rate, and the absence of an expected easing of
monetary policy after the October FOMC meeting, concerns about fiscal
stimulus, and some signs of firmer economic activity and money and
credit demands boosted market interest rates during the intermeeting
period. Both short- and long-term yields rose 15 to 50 basis points.
The largest increases, however, were at intermediate maturities, with
Treasury yields climbing as much as 80 basis points. Apparently, the
prospects of fiscal stimulus next year and a stronger economy had their
greatest effects on expectations of credit demands and the paths of
short-term rates one to five years hence. Interest rates in the pri-
mary mortgage market also rose over the intermeeting period, but by
less than the rise in yields on Treasuries, partly owing to narrowing
spreads in the secondary mortgage market. Expectations of firmer
economic growth boosted stock prices; major indexes rose 2 to 4 percent
over the period.
1. In view of diminishing demands for seasonal credit, the al-lowance for adjustment and seasonal borrowing was reduced in fivesteps of $25 million each during the intermeeting period to its cur-rent level of $75 million. Actual borrowing averaged close to itsallowance during the three maintenance periods completed since theOctober 6 meeting.
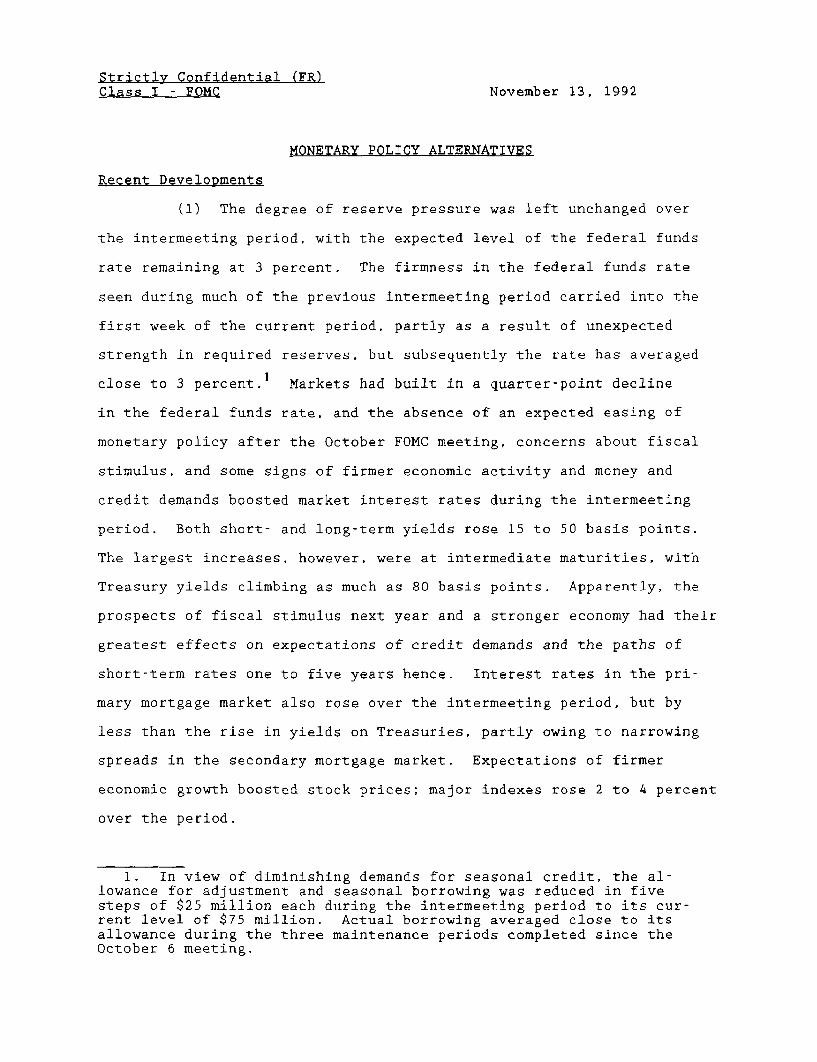
(2) With U.S. interest rates rising and foreign rates fall-
ing, the dollar appreciated about 7-1/2 percent on a weighted average
basis over the intermeeting period. The dollar was particularly robust
against European currencies, while advancing only moderately against
the yen. Interest rate declines abroad were widespread amid signs of
greater economic weakness and expectations of, together with some
actual, easing in monetary policies. On balance over the period, Ger-
man short- and long-term rates fell by 5 basis points, but rate de-
clines elsewhere in Europe were more substantial, as central banks took
advantage of the unwinding of some of the EMS exchange rate pressures.
In Japan, short- and long-term interest rates dropped by 5 and 15 basis
points, respectively.
(3) Monetary growth continued to strengthen in October.
Growth rates of M1 and M2 picked up to 22-3/4 and 5-1/4 percent rates,
respectively, bringing M2 a little closer to, but still below, the
lower end of its annual range.2 The acceleration of M2 in October
owed to strength in liquid accounts, which likely were lifted in part
by the lagged effects of previous declines in market interest rates and
opportunity costs, as well as by two special factors: heavy mortgage
refinancing activity and the reclassification in late October of about
$5-1/4 billion of large time deposits as other checkable deposits, as
2. The strong growth of transactions deposits increased expansionof required reserves to a 41 percent rate in October. With currencygrowth slowing considerably in October, perhaps owing to diminishingforeign demands, growth of the monetary base edged down to a still-rapid 14-1/2 percent rate last month.
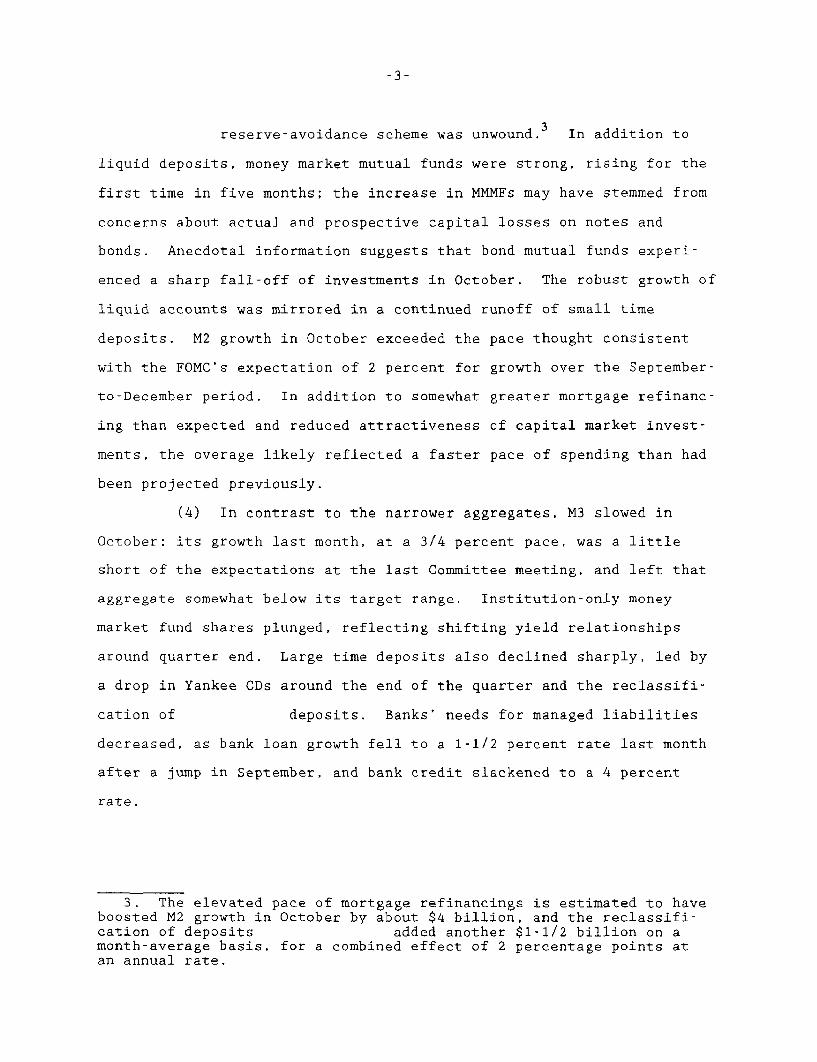
reserve-avoidance scheme was unwound. In addition to
liquid deposits, money market mutual funds were strong, rising for the
first time in five months; the increase in MMMFs may have stemmed from
concerns about actual and prospective capital losses on notes and
bonds. Anecdotal information suggests that bond mutual funds experi-
enced a sharp fall-off of investments in October. The robust growth of
liquid accounts was mirrored in a continued runoff of small time
deposits. M2 growth in October exceeded the pace thought consistent
with the FOMC's expectation of 2 percent for growth over the September-
to-December period. In addition to somewhat greater mortgage refinanc-
ing than expected and reduced attractiveness of capital market invest-
ments, the overage likely reflected a faster pace of spending than had
been projected previously.
(4) In contrast to the narrower aggregates, M3 slowed in
October; its growth last month, at a 3/4 percent pace, was a little
short of the expectations at the last Committee meeting, and left that
aggregate somewhat below its target range. Institution-only money
market fund shares plunged, reflecting shifting yield relationships
around quarter end. Large time deposits also declined sharply, led by
a drop in Yankee CDs around the end of the quarter and the reclassifi-
cation of deposits. Banks' needs for managed liabilities
decreased, as bank loan growth fell to a 1-1/2 percent rate last month
after a jump in September, and bank credit slackened to a 4 percent
rate.
3. The elevated pace of mortgage refinancings is estimated to haveboosted M2 growth in October by about $4 billion, and the reclassifi-cation of deposits added another $1-1/2 billion on amonth-average basis, for a combined effect of 2 percentage points atan annual rate.

(5) Growth of the debt of all nonfinancial sectors remained
just above the lower bound of its 4-1/2 to 8-1/2 percent range in
September. Only a few signs of a strengthening in nonfederal credit
flows have been glimpsed. Business loans expanded for the first time
in eleven months in September, but were about flat in October. Accord-
ing to this month's survey of senior loan officers, terms and standards
for business loans were largely unchanged in the past three months.
Gross issuance of corporate bonds remained brisk in October, but the
proceeds were directed mainly at refinancing debt, and activity has
tailed off in recent weeks in response to the backup in bond rates.
In the household sector, consumer credit expanded in September after
seven consecutive monthly declines; consumer loans at commercial banks,
after adjusting for securitizations, continued to rise at only a 2
percent pace in October. Mortgage refinancing activity remains rapid,
though net mortgage growth still appears to be moderate. Municipal
bond issuance also has been strong, but many of the issues have been
for refunding purposes and retirements have been heavy.

MONEY, CREDIT, AND RESERVE AGGREGATES(Seasonally adjusted annual rates of growth)
QIV'91to
Aug. Sept. Oct. Oct.
Money and credit aggregates
M1
M2
M3
Domestic nonfinancialdebt
FederalNonfederal
Bank credit
Reserve measures
2Nonborrowed reserves
Total reserves
Monetary base
Memo: (Millions of dollars)
Adjustment plus seasonalborrowing
Excess reserves
15.6
3.2
3.4
4.59.52.8
5.4
21.1
20.2
16.6
19.1
3.6
1.7
3.65.03.1
6.8
23.7
24.4
16.7
22.7
5.3
0.8
4.0
45.7
42.0
14.5
251 287 143
935 994 1073
1. 1991:QIV to September for debt measures.2. Includes "other extended credit" from the Federal Reserve.
NOTE: Monthly reserve measures, including excess reserves and borrow-ing, are calculated by prorating averages for two-week reservemaintenance periods that overlap months. Reserve data incor-porate adjustments for discontinuities associated with changesin reserve requirements.
14.4
2.2
0.5
4.711.62.5
3.8
20.4
20.2
10.5
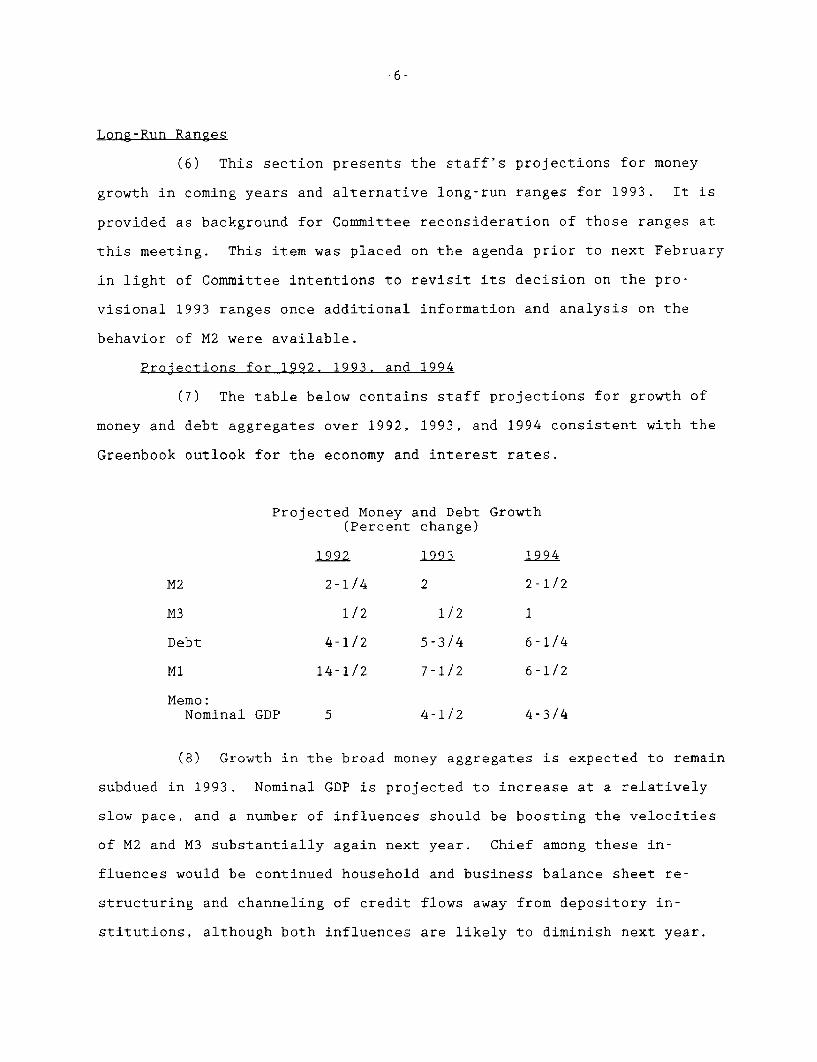
Long-Run Ranges
(6) This section presents the staff's projections for money
growth in coming years and alternative long-run ranges for 1993. It is
provided as background for Committee reconsideration of those ranges at
this meeting. This item was placed on the agenda prior to next February
in light of Committee intentions to revisit its decision on the pro-
visional 1993 ranges once additional information and analysis on the
behavior of M2 were available.
Projections for 1992, 1993, and 1994
(7) The table below contains staff projections for growth of
money and debt aggregates over 1992, 1993, and 1994 consistent with the
Greenbook outlook for the economy and interest rates.
Projected Money and Debt Growth(Percent change)
1992 1993 1994
M2 2-1/4 2 2-1/2
M3 1/2 1/2 1
Debt 4-1/2 5-3/4 6-1/4
M1 14-1/2 7-1/2 6-1/2
Memo:Nominal GDP 5 4-1/2 4-3/4
(8) Growth in the broad money aggregates is expected to remain
subdued in 1993. Nominal GDP is projected to increase at a relatively
slow pace, and a number of influences should be boosting the velocities
of M2 and M3 substantially again next year. Chief among these in-
fluences would be continued household and business balance sheet re-
structuring and channeling of credit flows away from depository in-
stitutions, although both influences are likely to diminish next year.

These processes are associated with widening opportunity costs, depress-
ing money demand relative to income. Prospective further declines in
offering rates on liquid deposits are key elements in this widening.
Depositories may be especially aggressive in reducing their offering
rates, partly as a consequence of higher deposit insurance premiums and
various provisions in last year's FDICIA legislation, which includes
constraints on brokered deposits and retail deposit offering rates and
incentives to bolster capital ratios. In addition, bank funding needs
are likely to be restrained again next year in light of still stringent
terms and conditions of credit availability and relatively modest in-
creases expected in demands for bank loans. Consumer loan rates may
move down, but a still wide spread over retail deposit rates will sus-
tain deleveraging incentives to a degree. Business credit demands at
banks, though firming, also probably will remain subdued, reflecting in
part continued reliance on bond issuance, given the projected decline in
long-term rates. Moreover, what pickup there might be in bank loans may
be funded in part by cutting back on securities purchases.
(9) Several additional forces will be restraining M2 and M3
growth next year and boosting their velocities. One is a pickup of RTC
and FDIC resolution activity, which may disrupt depositor relationships
and would involve Treasury funding of whatever assets are acquired,
replacing previous thrift and bank liabilities. In addition, the
special factors boosting M2 growth this year will hold down growth next
year relative to 1992: Mortgage refinancing, which surged to record
levels this quarter, is projected to level off in 1993, and the reclas-
sification of sweep accounts boosts only the level of M2
in 1993, and not its growth rate. Without special factors elevating
growth and with unchanged short-term rates after their decline this
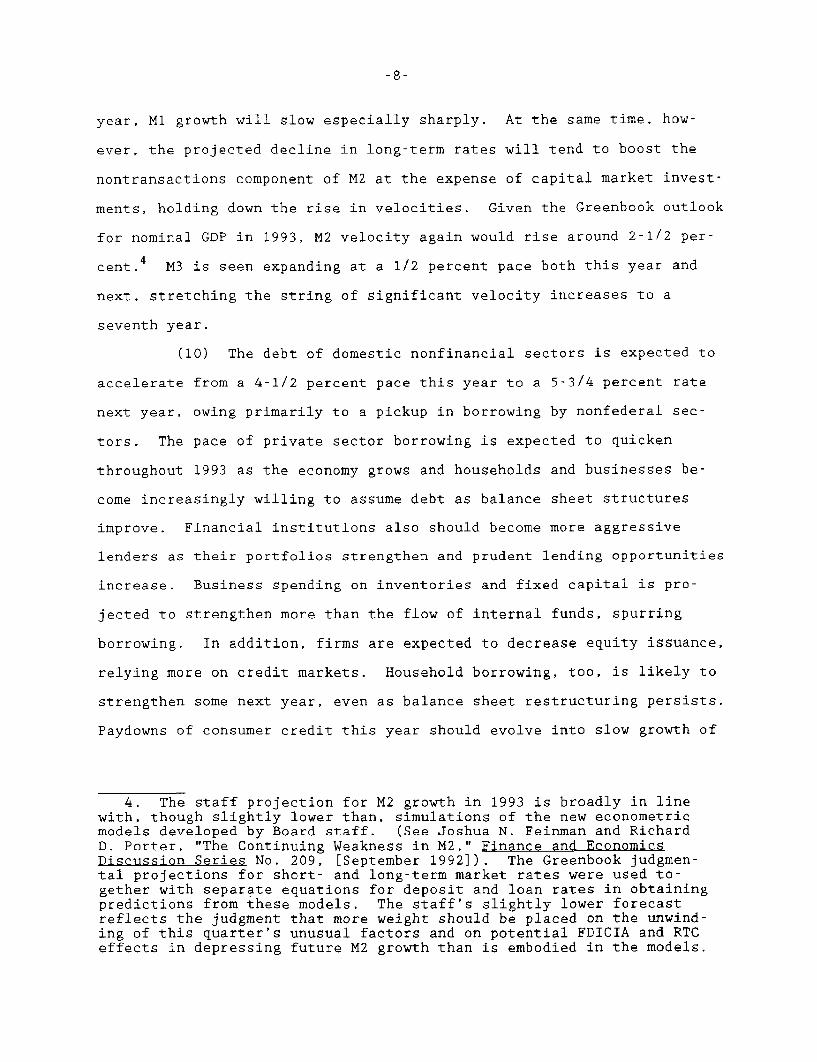
year, M1 growth will slow especially sharply. At the same time, how-
ever, the projected decline in long-term rates will tend to boost the
nontransactions component of M2 at the expense of capital market invest-
ments, holding down the rise in velocities. Given the Greenbook outlook
for nominal GDP in 1993, M2 velocity again would rise around 2-1/2 per-
cent. 4 M3 is seen expanding at a 1/2 percent pace both this year and
next, stretching the string of significant velocity increases to a
seventh year.
(10) The debt of domestic nonfinancial sectors is expected to
accelerate from a 4-1/2 percent pace this year to a 5-3/4 percent rate
next year, owing primarily to a pickup in borrowing by nonfederal sec-
tors. The pace of private sector borrowing is expected to quicken
throughout 1993 as the economy grows and households and businesses be-
come increasingly willing to assume debt as balance sheet structures
improve. Financial institutions also should become more aggressive
lenders as their portfolios strengthen and prudent lending opportunities
increase. Business spending on inventories and fixed capital is pro-
jected to strengthen more than the flow of internal funds, spurring
borrowing. In addition, firms are expected to decrease equity issuance,
relying more on credit markets. Household borrowing, too, is likely to
strengthen some next year, even as balance sheet restructuring persists.
Paydowns of consumer credit this year should evolve into slow growth of
4. The staff projection for M2 growth in 1993 is broadly in linewith, though slightly lower than, simulations of the new econometricmodels developed by Board staff. (See Joshua N. Feinman and RichardD. Porter, "The Continuing Weakness in M2," Finance and EconomicsDiscussion Series No. 209, [September 1992]). The Greenbook judgmen-tal projections for short- and long-term market rates were used to-gether with separate equations for deposit and loan rates in obtainingpredictions from these models. The staff's slightly lower forecastreflects the judgment that more weight should be placed on the unwind-ing of this quarter's unusual factors and on potential FDICIA and RTCeffects in depressing future M2 growth than is embodied in the models.

consumer installment debt next year, while the more buoyant housing
activity foreseen in the Greenbook should translate into faster growth
of mortgage debt. Only the debt growth of the state and local govern-
ment sector is expected to abate next year because of retirements of
bonds refunded earlier.
Alternative Ranges for 1993
(11) Two alternatives for money and debt growth ranges are
shown below for 1993, along with the staff projections. The alternative
I ranges represent the current provisional ranges announced last July;
the lower ends of these ranges are above the staff forecasts for broad
money growth. Alternative II ranges are 1 percentage point lower for M2
and M3 and encompass the staff forecasts for these aggregates. The
current provisional debt range, which readily includes the staff
forecast, is left unchanged in alternative II.5
Alternative Ranges for Money and Debt Growth for 1993(percent change)
Memo:Alternative I Staff
(current tentative ranges) Alternative II Projections
M2 2-1/2 to 6-1/2 1-1/2 to 5-1/2 2
M3 1 to 5 0 to 4 1/2
Debt 4-1/2 to 8-1/2 4-1/2 to 8-1/2 5-3/4
(12) The lower ranges embodied in alternative II might be
chosen on the rationale that since July experience with substantial
further increases in velocities and additional analysis have reduced the
uncertainty regarding the strength of the forces acting to boost veloci-
ties in 1993. Given the forecasts of velocities, the lower ranges seem
5. An appendix table gives the history of long-term ranges.
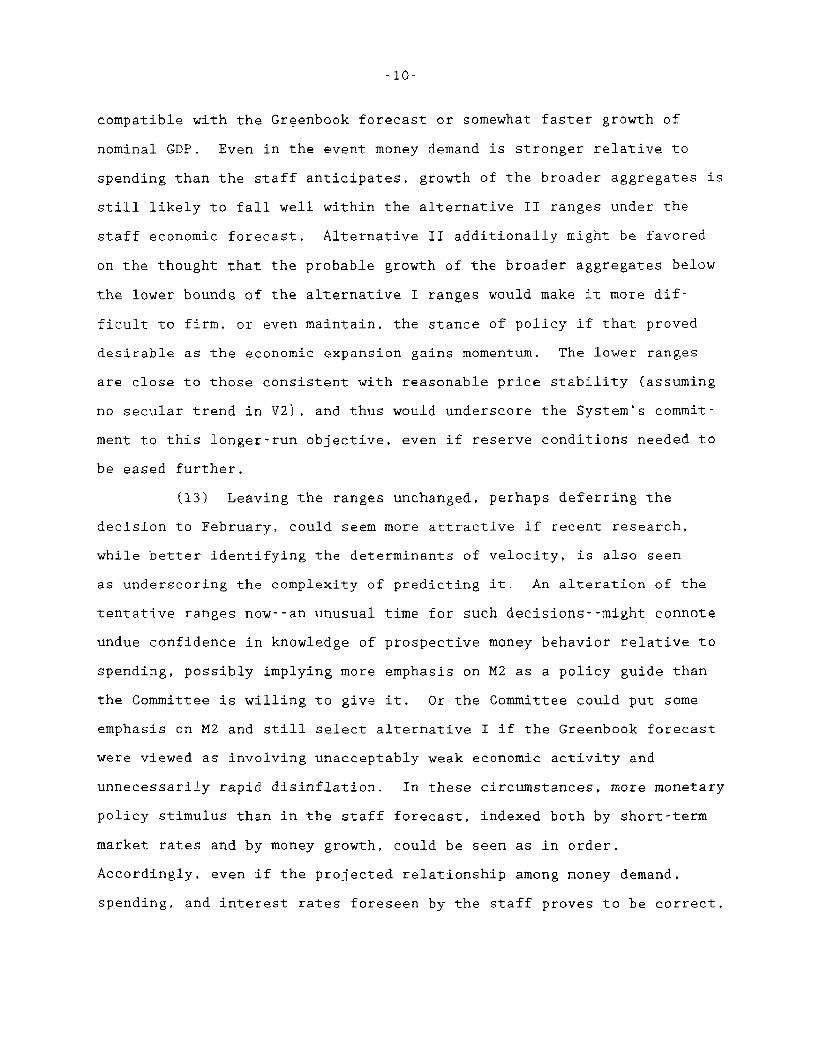
compatible with the Greenbook forecast or somewhat faster growth of
nominal GDP. Even in the event money demand is stronger relative to
spending than the staff anticipates, growth of the broader aggregates is
still likely to fall well within the alternative II ranges under the
staff economic forecast. Alternative II additionally might be favored
on the thought that the probable growth of the broader aggregates below
the lower bounds of the alternative I ranges would make it more dif-
ficult to firm, or even maintain, the stance of policy if that proved
desirable as the economic expansion gains momentum. The lower ranges
are close to those consistent with reasonable price stability (assuming
no secular trend in V2), and thus would underscore the System's commit-
ment to this longer-run objective, even if reserve conditions needed to
be eased further.
(13) Leaving the ranges unchanged, perhaps deferring the
decision to February, could seem more attractive if recent research,
while better identifying the determinants of velocity, is also seen
as underscoring the complexity of predicting it. An alteration of the
tentative ranges now--an unusual time for such decisions--might connote
undue confidence in knowledge of prospective money behavior relative to
spending, possibly implying more emphasis on M2 as a policy guide than
the Committee is willing to give it. Or the Committee could put some
emphasis on M2 and still select alternative I if the Greenbook forecast
were viewed as involving unacceptably weak economic activity and
unnecessarily rapid disinflation. In these circumstances, more monetary
policy stimulus than in the staff forecast, indexed both by short-term
market rates and by money growth, could be seen as in order.
Accordingly, even if the projected relationship among money demand,
spending, and interest rates foreseen by the staff proves to be correct,

-11-
the lower portions of the current ranges still could be seen as
representing appropriate intermediate targets for M2 and M3 growth next
year, more so than the lower portions of the alternative II ranges. In
this case, retaining the current ranges would convey a preference for
faster monetary growth next year than the outcomes this year.
-12-
Short-Run Policy Alternatives
(14) Two alternatives are presented below for the Committee's
consideration. Under alternative B, the trading range for the federal
funds rate would remain centered at 3 percent, in conjunction with an
initial assumption for adjustment plus seasonal borrowing of $75 mil-
lion.6 The policy ease envisaged under alternative A would trim the
expected federal funds rate to 2-1/2 percent. In keeping with the usual
practice of holding the expected federal funds rate at or above the
discount rate, this change could be effected by lowering the discount
rate by 1/2 percentage point while retaining the borrowing assumption at
$75 million. Technically, though, the lower federal funds rate of
alternative A could be achieved by reducing the borrowing assumption
$25 million with an unchanged discount rate.
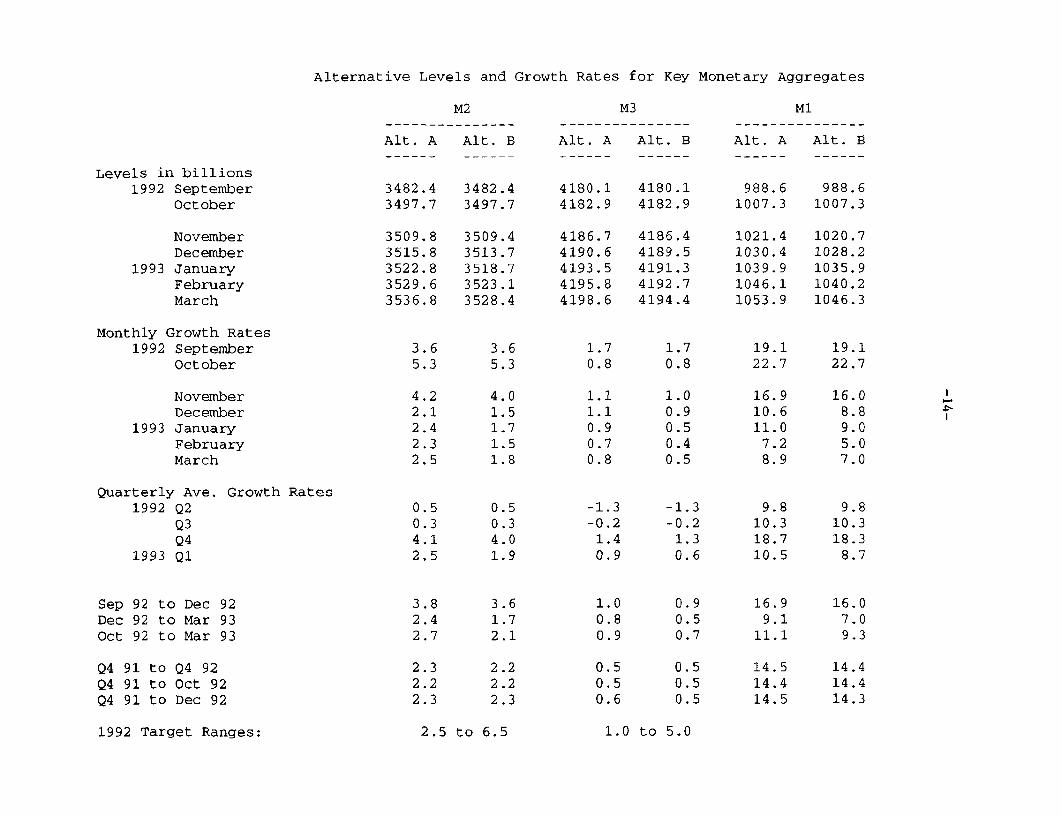
(15) Projected growth rates of the monetary aggregates under
the two policy alternatives are given in the table below. (More de-
tailed data appear in the tables and charts on the pages that follow.)
The lateness in the year limits the scope for the growth rates of the
monetary aggregates over the September-to-December period to differ much
under the two alternatives. The pickup in M2 already witnessed in Octo-
ber quite likely implies that growth in that aggregate from September to
December will be a bit above the Committee's expectation expressed in
the last directive. But with the recent expansion in liquid deposits
offset by a contraction in non-M2 components of M3, growth of M3 for the
September-to-December period remains consistent with the last directive.
Under either alternative, M2 and M3 fall shy of the lower bounds of
6. The already low borrowing assumption may have to be shavedfurther in a technical adjustment during the intermeeting period,since the typical winter downturn in seasonal borrowing probably hasnot yet run its course.

-13-
their target ranges in December by about 1/4 and 1/2 percent, respec-
tively. Beyond December, money growth rates under the alternatives
diverge more, as the effects of the different interest rate paths--
including the beginnings of effects on nominal spending--increasingly
influence the public's demands for monetary assets. Even over a longer
horizon, however, such as the October-to-March period shown in the
table, it is likely the differences in short-term market interest rates
under the two alternatives would continue to have only a modest impact
on the growth of the broad monetary aggregates.
Alt. A Alt. B
Growth from September toDecember
M2 3-3/4 3-1/2M3 1 1M1 17 16
Growth from October toMarch
M2 2-3/4 2M3 1 3/4M1 11 9-1/4
(16) The absence of System action over the current intermeet-
ing period and the flow of data releases pointing more clearly to sus-
tained expansion in economic activity have solidified the notion that
monetary policy will remain unchanged for some time. Thus, market par-
ticipants would be unlikely to react to the unchanged reserve conditions
of alternative B, especially if incoming data conform to the Greenbook
assessment of moderately expanding real activity in the fourth quarter.
Treasury bill rates would hold at their current levels, as would the
7. To attain the lower bounds of their target ranges by December,M2 and M3 would need to grow at average rates of 4-1/4 and 4 percent,respectively, in November and December.
Alternative Levels and Growth Rates for Key Monetary Aggregates
Levels in billions1992 September
October
NovemberDecember
1993 JanuaryFebruaryMarch
Monthly Growth Rates1992 September
October
NovemberDecember
1993 JanuaryFebruaryMarch
Quarterly Ave. Growth Rates1992 Q2
Q3Q4
1993 Q1
SepDecOct
92 to Dec 9292 to Mar 9392 to Mar 93
Q4 91 to Q4 92Q4 91 to Oct 92Q4 91 to Dec 92
1992 Target Ranges:
Alt. A Alt. B
3482.4 3482.43497.7 3497.7
3509.83515.83522.83529.63536.8
3.65.3
4.22.12.42.32.5
0.50.34.12.5
3.82.42.7
2.32.22.3
3509.43513.73518.73523.13528.4
3.65.3
4.01.51.71.51.8
0.50.34.01.9
3.61.72.1
2.22.22.3
Alt. A Alt. B
4180.1 4180.14182.9 4182.9
4186.74190.64193.54195.84198.6
1.70.8
1.11.10.90.70.8
-1.3-0.21.40.9
1.00.80.9
0.50.50.6
4186.44189.54191.34192.74194.4
1.70.8
1.00.90.50.40.5
-1.3-0.21.30.6
0.90.50.7
0.50.50.5
Alt. A Alt. B
988.6 988.61007.3 1007.3
1021.41030.41039.91046.11053.9
19.122.7
16.910.611.07.28.9
9.810.318.710.5
16.99.1
11.1
14.514.414.5
1020.71028.21035.91040.21046.3
19.122.7
16.08.89.05.07.0
9.810.318.38.7
16.07.09.3
14.414.414.3
2.5 to 6.5 1.0 to 5.0
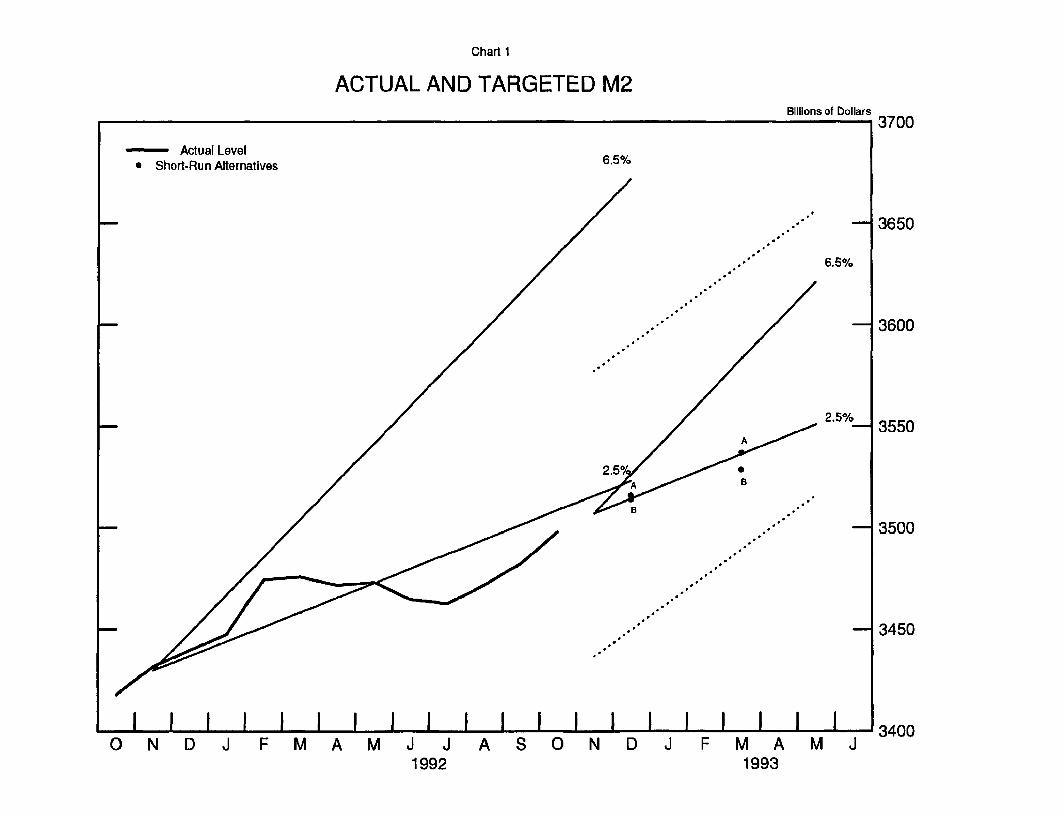
Chart 1
ACTUAL AND TARGETED M2Billions of Dollars
- 3700
Actual Level* Short-Run Alternatives 6.5%
2.5%
ON D J.I I I ai I I I I I I - I- 1 13400
F MA M J J A S ON D J F MA M J
3650
3600
3550
3500
3450
19931992
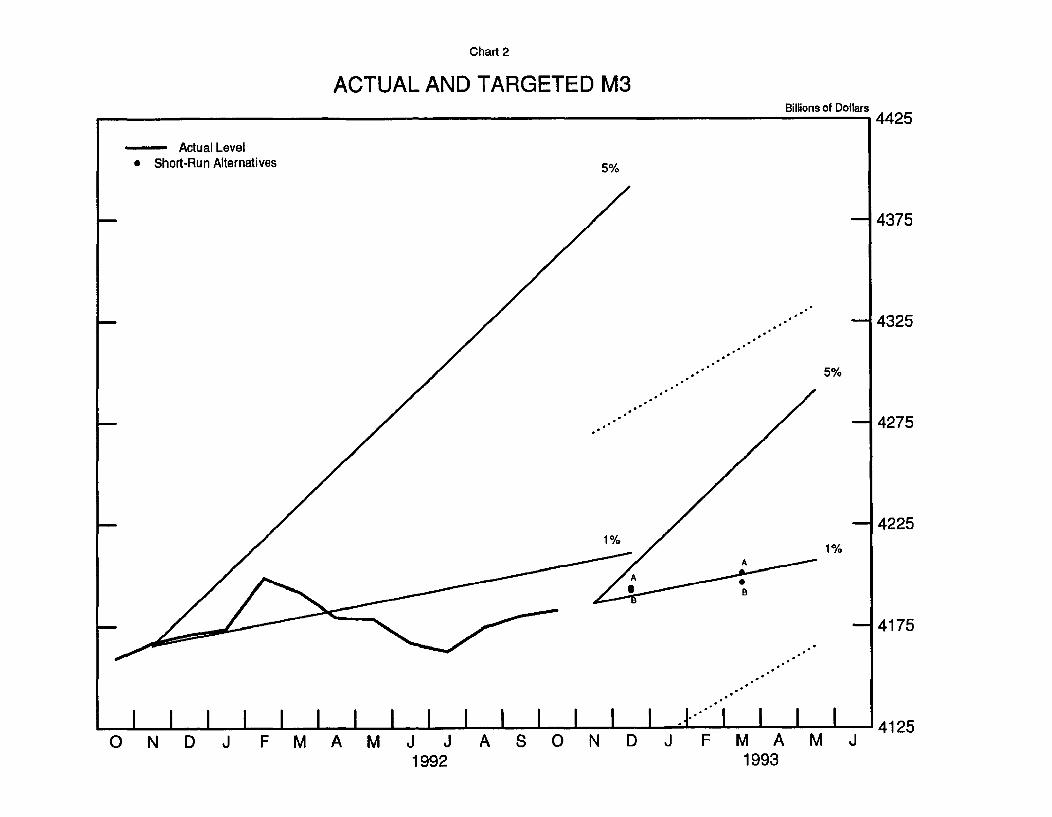
Chart 2
ACTUAL AND TARGETED M3Billions of Dollars
S4425
--- Actual Level* Short-Run Alternatives
I I I I I I . I I I 4125ON D J F MA M J J A S ON D J F MA MJ
-14375
-1 4325
-14275
-142251%
H4175
19931992

Chart 3
M1Billions of Dollars
.* 15%S Actual Level . - 1090
* Short-Run Alternatives
" 10%. - 1070
. , .. *"A
. - 1050
15% .. *-A..
- .. .' .. - 1030.*.'*0. %- %
.. . .................................... 0%
-. - 1010
10% - 990
970
950
5%.
- . . ... " 930
. . ... 910
:... . .......................................................... .......... 9 .. - 890890
I I I I I I I I I I I I I I I 870O N D J F M A M J J A S O N D J F M A M J
1992 1993
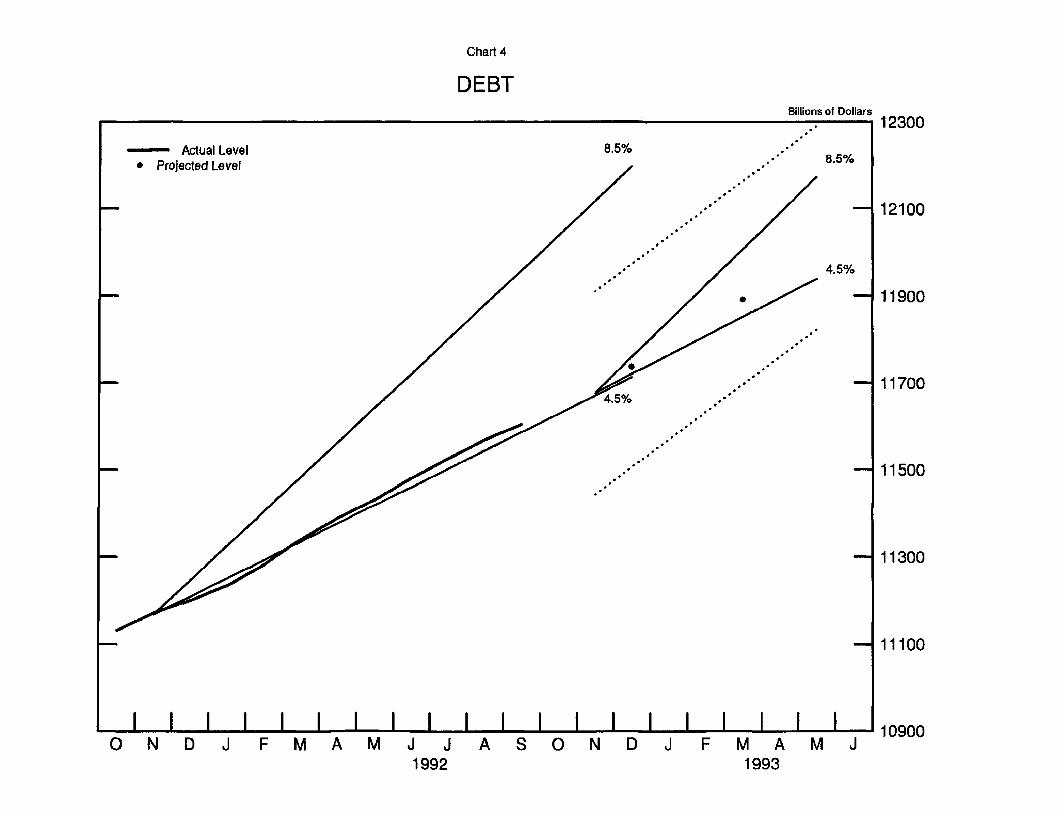
Chart 4
DEBTBillions of Dollars
S 12300
- Actual Level 8.5%* Projected Level 8.5%
-- I 12100
4.5%
-- 111900
-111700
-- 11500
-- 111300
-111100
I I I I I I I I I I I I I I I I I I I I 1 0 o900O N D J F M A M J J A S O N D J F M A M J
1992 1993
exchange value of the dollar, unless a further darkening in the economic
outlook abroad prompted unexpected reductions in foreign interest rates.
Private money market rates, however, may rise should skittishness about
the availability of funds at year-end intensify. As the December 19
date for implementation of prompt corrective action approaches, pres-
sures on quality spreads in the banking sector might be exacerbated by
uncertainty about the circle of candidates subject to early closure. In
capital markets, yields could edge down on balance as the readings that
trickle in over the intermeeting period indicate a modest pace to the
economic expansion and imply further progress toward price stability.
At the same time, concerns about the prospects for fiscal stimulus and
uncertainties about the economic policies of the new administration more
generally, which may not be resolved for some time, will continue to
weigh upon market sentiment.
(17) Under alternative B, the growth of M2 is projected to
slow somewhat from its pace of the last two months. Special factors are
continuing to boost M2 growth in November but will partly reverse there-
after, pulling average growth over the five month forecast horizon back
to an underlying rate of about 2 percent. On a quarterly average
basis, the near-term pickup in M2 puts that aggregate on a growth tra-
jectory somewhat below that for nominal GDP in the fourth quarter but
8. Additions to demand deposits and MMDAs to support mortgagerefinancings account for about $4 billion of the increase in M2 fromOctober to December, but the anticipated contraction in mortgagerefinancing activity subtracts a like amount from the change in thataggregate over the December-to-March period. The reclassification of
sweep accounts as other checkable rather than large timedeposits adds about $4 billion to M2 from October to December but hasno further effect. M1 growth is slowing, but the lagged effects ofprevious reductions in short-term market interest rates still showclearly in the projected near double-digit expansion of the narrowaggregates. With currency and total reserves projected at 7-3/4 and 6percent, respectively, over these five months, the monetary base wouldincrease at an 8 percent rate.
-16-
about 3 percentage points below it in the first quarter of 1993. This
upward tilt to M2 velocity over the two quarters reflects a continuation
of those forces that have been boosting velocity for some time--the
ongoing process of balance-sheet restructuring and deleveraging that
makes investors less willing to acquire monetary assets and depository
institutions less willing to compete aggressively for funds.
(18) The growth of M3 is projected at a 3/4 percent rate over.
the October-to-March period. With money market interest rates expected
to remain unchanged for the near term, or perhaps to increase should the
fear of year-end pressures take firmer hold, the prospects for M3-type
money funds remain subdued. Further, with the terms and standards of
lending expected to remain firm and with households and firms concen-
trating on longer-term borrowing, bank credit should grow at only a
modest pace, suggesting that depositories' need for additional funds
will remain limited.
(19) The projected slowdown in the growth of domestic non-
financial debt in the fourth quarter likely will be transitory, caused
by a temporary drop in federal borrowing. Nonfederal credit demand,
concentrated in large part in longer-term borrowing by households and
corporations, should edge above its third-quarter pace. A pickup in
activity by the FDIC after December 19, which will necessitate borrowing
from the federal government, should return the growth of the federal
debt to the neighborhood of 12 percent. Thus, the growth of total debt
should pick up appreciably in the first quarter of 1993, to around 5-1/2
percent, so that the debt aggregate moves somewhat above the lower bound
of its tentative monitoring range.
(20) Against a backdrop of public readings that suggested
some firming in economic activity, market participants would be sur-
prised by the 1/2 point decline in the funds rate under alternative A.
-17-
Most short-term interest rates would match the decrease in the federal
funds rate. Major commercial banks would take that cue, cutting the
prime rate 1/2 percentage point; even with a 5-1/2 percent prime rate,
banks still would enjoy a swollen margin over funding costs, at least in
comparison to the historical record. The foreign exchange value of the
dollar would decline. Long-term interest rates are likely to drop,
reversing much of the recent runup. Such a decline would be limited,
however, should the easing engender market fears that the lagged effects
of the monetary stimulus, reinforcing a boost provided by a prospective
fiscal policy package in 1993, would undercut the downward tilt to in-
flation.
(21) While the impetus to the monetary aggregates imparted by
choosing alternative A would be barely discernible in 1992, the lower
market interest rates embodied in that choice would push up both M2 and
M3 to the lower end of their current tentative ranges for 1993 by March.
The anticipated drop in nominal interest rates across the term structure
should speed balance-sheet adjustments, lowering debt service burdens
for households and corporations, and by reducing real rates as well,
provide some spur to spending.

-18-
Directive Language
(22) Draft language for the tentative ranges for 1993 and for
the operational paragraph is presented below.
Tentative Ranges for 1993
The following language is provided should the Committee decide
at this meeting to vote on the tentative ranges for 1993. Reaffirming
the current tentative ranges could be handled in the directive with
wording such as the following:
At this meeting the Committee voted to reaffirm the tentative
ranges for 1993 that it had set at the June 30-July 1 meeting; the
1993 ranges are the same as those for 1992 and cover the period
from the fourth quarter of 1992 to the fourth quarter of 1993.
The following wording for the directive is proposed if the
Committee chose to lower the ranges.
"In light of additional information suggesting significant
uptrends in the velocities of broad money measures, the Committee
voted at this meeting to lower the tentative ranges initially set
at the June 30-July 1 meeting to growth rates of ____ to ____ percent
for M2 and ____ to ____ percent for M3, measured from the fourth
quarter of 1992 to the fourth quarter of 1993. The Committee
retained the tentative monitoring range of 4-1/2 to 8-1/2 percent
for growth in total domestic nonfinancial debt in 1993.
Either sentence would be followed by the current sentence:
"The behavior of the monetary aggregates will continue to be
evaluated in the light of progress toward price level stability,
movements in their velocities, and developments in the economy and
financial markets."
-19-
Operational Paragraph
Draft language for the operational paragraph is presented
below. In keeping with the bluebook discussion, two alternatives,
labeled (a) and (b), are shown for the last sentence. The first would
follow the usual practice of retaining the current mid-quarter approach
of updating the Committee's expectations for the quarter. The second
would extend the money projections through March, 1993.
In the implementation of policy for the immediate future,
the Committee seeks to maintain/EASE SOMEWHAT/INCREASE SOMEWHAT
the existing degree of pressure on reserve positions. In the
context of the Committee's long-run objectives for price
stability and sustainable economic growth, and giving careful
consideration to economic, financial, and monetary developments,
slightly (SOMEWHAT) greater reserve restraint might (WOULD) or
slightly (SOMEWHAT) lesser reserve restraint (MIGHT) would be
acceptable in the intermeeting period.
(a) The contemplated reserve conditions are expected to be
consistent with growth of M2 and M3 over the period
from September through December at annual rates of
about ____ AND ____ {DEL: 2 and 1] percent, respectively.
(b) The contemplated reserve conditions are expected to be
consistent with growth of M2 and M3 over the period
from October through March at annual rates of about ____
AND ____ [DEL: 2 and 1] percent, respectively.
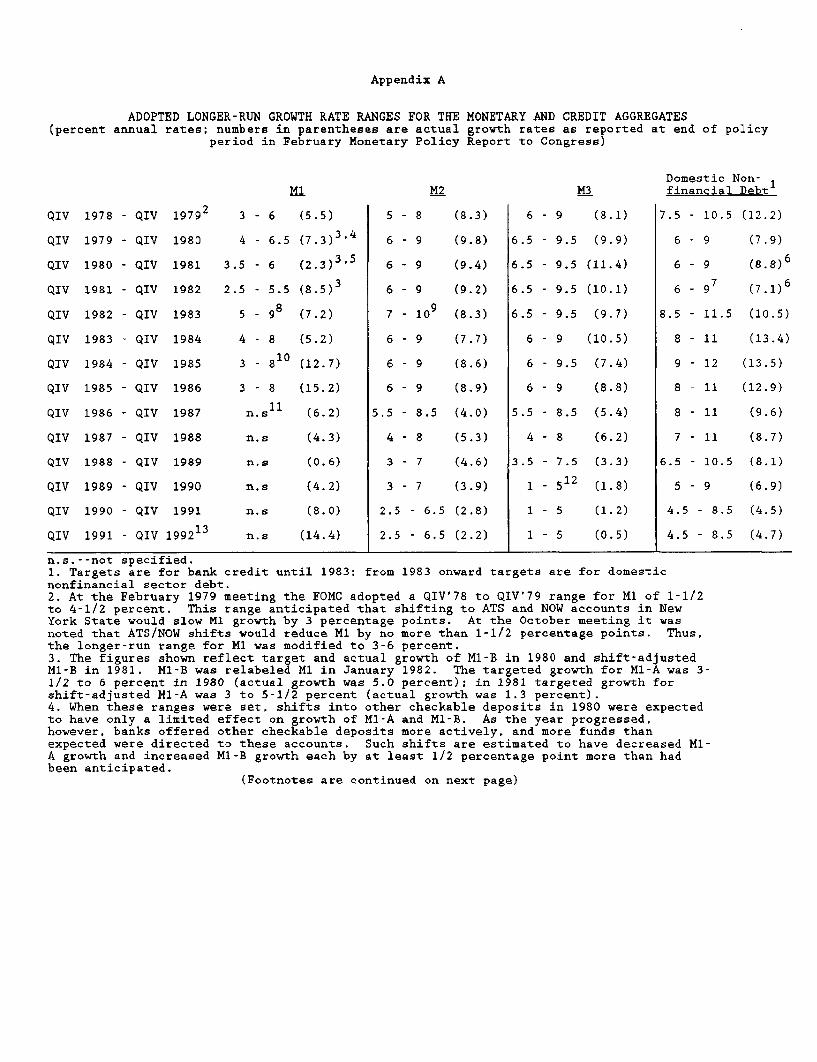
Appendix A
ADOPTED LONGER-RUN GROWTH RATE RANGES FOR THE MONETARY AND CREDIT AGGREGATES(percent annual rates; numbers in parentheses are actual growth rates as reported
period in February Monetary Policy Report to Congress)
1978 - QIV
1979 - QIV
1980 - QIV
1981 - QIV
1982 - QIV
1983 - QIV
1984 - QIV
1985 - QIV
1986 - QIV
1987 - QIV
1988 - QIV
1989 - QIV
1990 - QIV
1991 - QIV
3 - 6 (5.5)
4 - 6.5 (7.3) 3 , 4
3.5 - 6 (2.3) 3 , 5
2.5 - 5.5 (8.5) 3
5 - 9 8 (7.2)
4 - 8 (5.2)
3 - 810 (12.7)
3 - 8 (15.2)
QIV
QIV
QIV
QIV
QIV
QIV
QIV
QIV
QIV
QIV
QIV
QIV
QIV
QIV
19792
1980
1981
1982
1983
1984
1985
1986
1987
1988
1989
1990
1991
199213 n.s (14.4)
M2
5 - 8 (8.3)
6 - 9 (9.8)
6 - 9 (9.4)
6- 9 (9.2)
7 - 109 (8.3)
6 - 9 (7.7)
6 - 9 (8.6)
6 - 9 (8.9)
5.5 - 8.5 (4.0)
4 - 8 (5.3)
3 - 7 (4.6)
3 - 7 (3.9)
2.5 - 6.5 (2.8)
2.5 - 6.5 (2.2)
M3
6 - 9 (8.1)
6.5 - 9.5 (9.9)
6.5 - 9.5 (11.4)
6.5 - 9.5 (10.1)
6.5 - 9.5 (9.7)
6 - 9 (10.5)
6 - 9.5 (7.4)
6 - 9 (8.8)
5.5 - 8.5 (5.4)
4 - 8 (6.2)
3.5 - 7.5 (3.3)
1 - 512 (1.8)
1 - 5 (1.2)
1 - 5 (0.5)
at end of policy
Domestic Non-financial Debt
7.5 - 10.5 (12.2)
6 - 9 (7.9)
6 - 9 (8.8)6
6 - 9 7 (7.1)6
8.5 - 11.5 (10.5)
8 - 11 (13.4)
9 - 12 (13.5)
8 - 11 (12.9)
8 - 11 (9.6)
7 - 11 (8.7)
6.5 - 10.5 (8.1)
5 - 9 (6.9)
4.5 - 8.5 (4.5)
4.5 - 8.5 (4.7)
n.s.--not specified.1. Targets are for bank credit until 1983; from 1983 onward targets are for domesticnonfinancial sector debt.2. At the February 1979 meeting the FOMC adopted a QIV'78 to QIV'79 range for M1 of 1-1/2to 4-1/2 percent. This range anticipated that shifting to ATS and NOW accounts in NewYork State would slow M1 growth by 3 percentage points. At the October meeting it wasnoted that ATS/NOW shifts would reduce M1 by no more than 1-1/2 percentage points. Thus,the longer-run range for M1 was modified to 3-6 percent.3. The figures shown reflect target and actual growth of Ml-B in 1980 and shift-adjustedM1-B in 1981. MI-B was relabeled M1 in January 1982. The targeted growth for M1-A was 3-1/2 to 6 percent in 1980 (actual growth was 5.0 percent); in 1981 targeted growth forshift-adjusted M1-A was 3 to 5-1/2 percent (actual growth was 1.3 percent).4. When these ranges were set. shifts into other checkable deposits in 1980 were expectedto have only a limited effect on growth of Ml-A and M1-B. As the year progressed.however, banks offered other checkable deposits more actively, and more funds thanexpected were directed to these accounts. Such shifts are estimated to have decreased Ml-A growth and increased MI-B growth each by at least 1/2 percentage point more than hadbeen anticipated.
(Footnotes are continued on next page)
n.11
n.s
n.sn.s
(6.2)
(4.3)
(0.6)
(4.2)
(8.0)

5. Adjusted for the effects of shifts out of demand deposits and savings deposits intoother checkable deposits. At the February FOMC meeting, the target ranges for observedM1-A and M1-B in 1981 on an unadjusted basis, expected to be consistent with the adjustedranges, were -4-1/2 to -2 and 6 to 8-1/2 percent, respectively. Actual M1-B growth (notshift adjusted) was 5.0 percent.6. Adjusted for shifts of assets from domestic banking offices to International BankingFacilities.7. Range for bank credit is annualized growth from the December 1981-January 1982 averagelevel through the fourth quarter of 1982.8. Base period, adopted at the July 1983 FOMC meeting, is QII'83. At the February 1983meeting the FOMC had adopted a QIV'82 to QIV'83 target range for M1 of 4 to 8 percent.9. Base period is the February-March 1983 average.10. Base period, adopted at the July 1985 FOMC meeting, is QII'85. At the February 1985meeting the FOMC had adopted a QIV'84 to QIV'85 target range for M1 of 4 to 7 percent.11. No range for M1 has been specified since the February 1987 FOMC meeting because ofuncertainties about its underlying relationship to the behavior of the economy and itssensitivity to economic and financial circumstances.12. At the February 1990 meeting the FOMC specified a range of 2-1/2 to 6-1/2 percent.This range was lowered to 1 to 5 percent at the July 1990 meeting.13. Growth rates in parentheses for the monetary aggregates are from 1991 QIV toOctober 1992 and for nonfinancial debt are from 1991 QIV to September 1992.
11/13/92 (MARP)
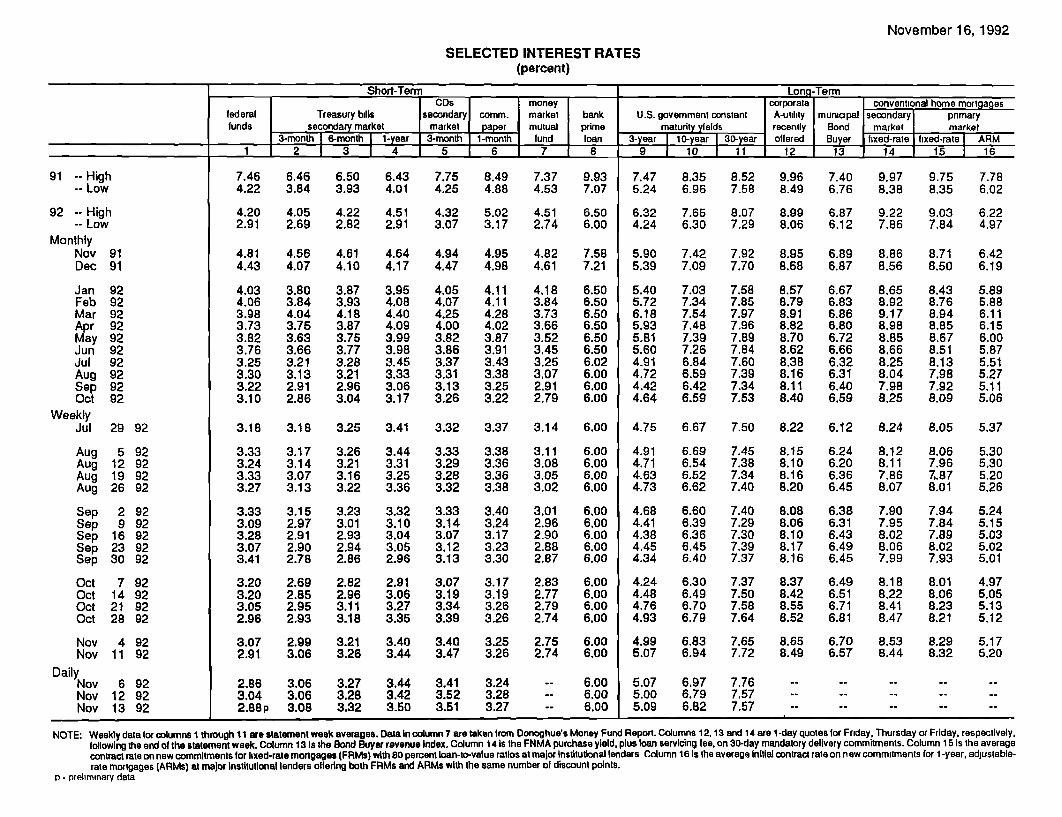
November 16,1992
SELECTED INTEREST RATES(percent)
Short-Term Long-TermCDs money corporate conventional home mortgages
federal Treasury bills secondary comm. market bank U.S. govemment constant A-utiity municpal secondary pnmaryfunds secondary market market paper mutual prime maturity yields recently Bond market market
3-month 6-month 1-year 3-month 1-month fund loan 3-year 10-year 30-year offered Buyer fixed-rate fixed-rate ARM_1 2 3 3 4 5 6 7 8 9 10 11 12 13 14 15 16
91 -- High-- Low
92 -- High-- Low
MonthlyNov 91Dec 91
Jan 92Feb 92Mar 92Apr 92May 92Jun 92Jul 92Aug 92Sep 92Oct 92
WeeklyJul 29 92
Aug 5 92Aug 12 92Aug 19 92Aug 26 92
Sep 2 92Sep 9 92Sep 16 92Sep 23 92Sep 30 92
Oct 7 92Oct 14 92Oct 21 92Oct 28 92
Nov 4 92Nov 11 92
DailyNov 6 92Nov 12 92Nov 13 92
2.86 3.063.04 3.062.88p 3.08
7.464.22
4.202.91
4.814.43
4.034.063.983.733.823.763.253.303.223.10
3.18
3.333.243.333.27
3.333.093.283.073.41
3.203.203.052.96
3.072.91
3.27 3.44 3.41 3.243.28 3.42 3.52 3.283.32 3.50 3.51 3.27
6.463.84
4.052.69
4.564.07
3.803.844.043.753.633.663.213.132.912.86
3.18
3.173.143.073.13
3.152.972.912.902.78
2.692.852.952.93
2.993.06
6.006.006.00
6.503.93
4.222.82
4.614.10
3.873.934.183.873.753.773.283.212.963.04
3.25
3.263.213.163.22
3.233.012.932.942.86
2.822.963.113.18
3.213.26
6.43 7.75 8.494.01 4.25 4.88
4.51 4.32 5.022.91 3.07 3.17
4.64 4.94 4.954.17 4.47 4.98
3.95 4.05 4.114.08 4.07 4.114.40 4.25 4.284.09 4.00 4.023.99 3.82 3.873.98 3.86 3.913.45 3.37 3.433.33 3.31 3.383.06 3.13 3.253.17 3.26 3.22
3.41 3.32 3.37
3.44 3.33 3.383.31 3.29 3.363.25 3.28 3.363.36 3.32 3.38
3.32 3.33 3.403.10 3.14 3.243.04 3.07 3.173.05 3.12 3.232.96 3.13 3.30
2.91 3.07 3.173.06 3.19 3.193.27 3.34 3.263.35 3.39 3.26
3.40 3.40 3.253.44 3.47 3.26
7.37 9.934.53 7.07
4.51 6.502.74 6.00
4.82 7.584.61 7.21
4.18 6.503.84 6.503.73 6.503.66 6.503.52 6.503.45 6.503.25 6.023.07 6.002.91 6.002.79 6.00
3.14 6.00
3.11 6.003.08 6.003.05 6.003.02 6.00
3.01 6.002.96 6.002.90 6.002.88 6.002.87 6.00
2.83 6.002.77 6.002.79 6.002.74 6.00
2.75 6.002.74 6.00
7.475.24
6.324.24
5.905.39
5.405.726.185.935.815.604.914.724.424.64
4.75
4.914.714.634.73
4.684.414.384.454.34
4.244.484.764.93
4.995.07
5.075.005.09
8.35 8.52 9.96 7.406.96 7.58 8.49 6.76
7.65 8.07 8.99 6.876.30 7.29 8.06 6.12
7.42 7.92 8.95 6.897.09 7.70 8.68 6.87
7.03 7.58 8.57 6.677.34 7.85 8.79 6.837.54 7.97 8.91 6.867.48 7.96 8.82 6.807.39 7.89 8.70 6.727.26 7.84 8.62 6.666.84 7.60 8.38 6.326.59 7.39 8.16 6.316.42 7.34 8.11 6.406.59 7.53 8.40 6.59
6.67 7.50 8.22 6.12
6.69 7.45 8.15 6.246.54 7.38 8.10 6.206.52 7.34 8.16 6.366.62 7.40 8.20 6.45
6.60 7.40 8.08 6.386.39 7.29 8.06 6.316.36 7.30 8.10 6.436.45 7.39 8.17 6.496.40 7.37 8.16 6.45
6.30 7.37 8.37 6.496.49 7.50 8.42 6.516.70 7.58 8.55 6.716.79 7.64 8.52 6.81
6.83 7.65 8.65 6.706.94 7.72 8.49 6.57
9.97 9.758.38 8.35
9.22 9.037.86 7.84
8.86 8.718.56 8.50
8.65 8.438.92 8.769.17 8.948.98 8.858.85 8.678.66 8.518.25 8.138.04 7.987.98 7.928.25 8.09
8.24 8.05
8.12 8.068.11 7.967.86 7,.878.07 8.01
7.90 7.947.95 7.848.02 7.898.06 8.027.99 7.93
8.18 8.018.22 8.068.41 8.238.47 8.21
8.53 8.298.44 8.32
6.97 7.766.79 7.576.82 7.57
7.786.02
6.224.97
6.426.19
5.895.886.116.156.005.875.515.275.115.06
5.37
5.305.305.205.26
5.245.155.035.025.01
4.975.055.135.12
5.175.20
NOTE: Weekly data for columns 1 through 11 are statement week averages. Data in column 7 are taken from Donoghue's Money Fund Report. Columns 12,13 and 14 are 1-day quotes for Friday, Thursday or Friday, respectively,following the end of the statement week. Column 13 is the Bond Buyer revenue index. Column 14 Is the FNMA purchase yield, plus loan servicing lee, on 30-day mandatory delivery commitments. Column 15 Is the averagecontract rate on new commitments for fixed-rate mongages (FRMs) with 80 percent loan-to-value ratios at major institutional lenders Column 16 is the average initial contract rate on new commitments for 1 -year, adjustable-rate mortgages (ARMs) at major institutional lenders offering both FRMs and ARMs with the same number ol discount points.
D - preliminary data
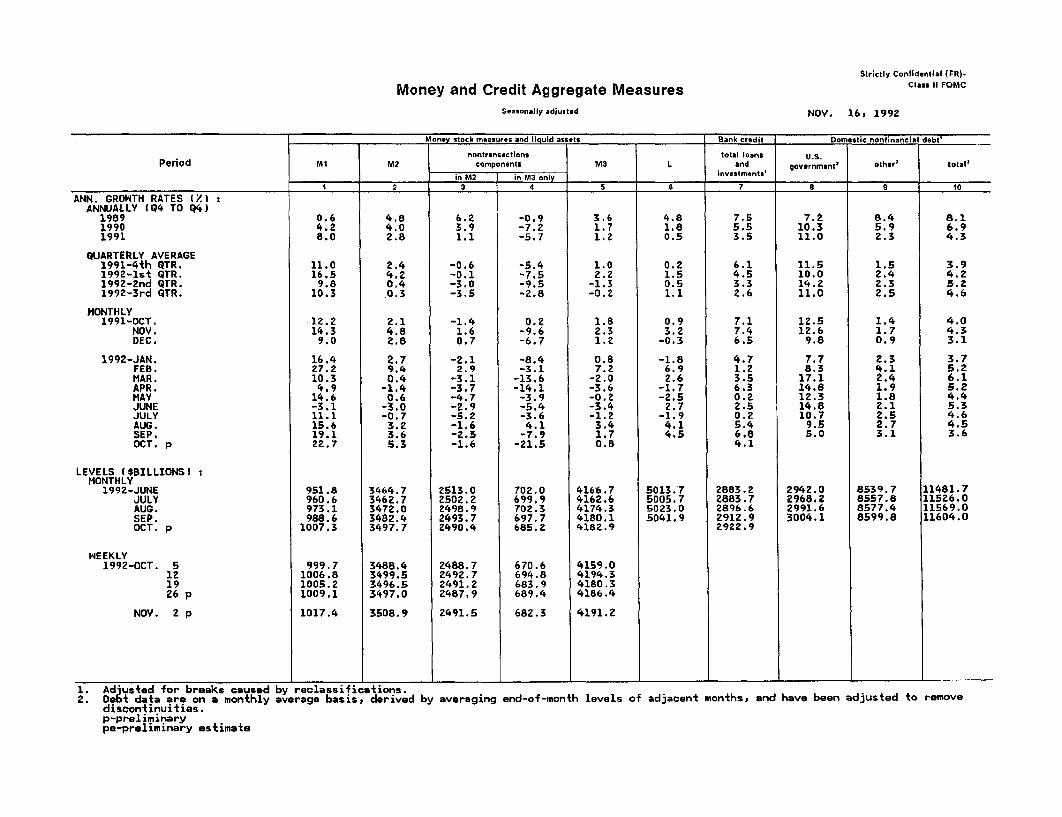
Strictly Confidential (FR)
Money and Credit Aggregate Measures Class II -FOMC
Seasonally adjusted NOV. 16, 1992
Money stock measures and liquid assets Bank credit Domestic nonfinancial debt'
nontransactions total loans U.S.Period Mt M2 components M3 L and government' other' total'
in M2 in M3 only investments'
1 2 3 4 5 6 7 8 9 10
ANN. GRONTH RATES (.) :ANNUALLY (Q4 TO Q4)
1989 0.6 4.8 6.2 -0,9 3.6 4.8 7.5 7.2 8.4 8.11990 4.2 4.0 3.9 -7.2 1.7 1.8 5.5 10.3 5.9 6.91991 8.0 2.8 1.1 -5.7 1.2 0.5 3.5 11.0 2.3 4.3
QUARTERLY AVERAGE1991-4th QTR. 11.0 2.4 -0.6 -5.4 1.0 0.2 6.1 11.5 1.5 3.91992-1st QTR. 16.5 4.2 -0.1 -7.5 2.2 1.5 4.5 10.0 2.4 4.21992-2nd QTR. 9.8 0.4 -3.0 -9.5 -1.3 0.5 3.3 14.2 2.3 5.21992-3rd QTR. 10.3 0.3 -3.5 -2.8 -0.2 1.1 2.6 11.0 2.5 4.6
MONTHLY1991-OCT. 12.2 2.1 -1.4 0.2 1.8 0.9 7.1 12.5 1.4 4.0
NOV. 14.3 4.8 1.6 -9.6 2.3 3.2 7.4 12.6 1.7 4.3DEC. 9.0 2.8 0.7 -6.7 1.2 -0.3 6.5 9.8 0.9 3.1
1992-JAN. 16.4 2.7 -2.1 -8.4 0.8 -1.8 4.7 7.7 2.3 3.7FEB. 27.2 9.4 2.9 -3.1 7.2 6.9 1.2 8.3 4.1 5.2MAR. 10.3 0.4 -3.1 -13.6 -2.0 2.6 3.5 17.1 2.4 6.1APR. 4.9 -1.4 -3.7 -14.1 -3.6 -1.7 6.3 14.8 1.9 5.2MAY 14.6 0.6 -4.7 -3.9 -0.2 -2.5 0.2 12.3 1.8 4.4JUNE -3.1 -3.0 -2.9 -5.4 -3.4 2.7 2.5 14.8 2.1 5.3JULY 11.1 -0.7 -5.2 -3.6 -1.2 -1.9 0.2 10.7 2.5 4.6AUG. 15.6 3.2 -1.6 4.1 3.4 4,1 5.4 9.5 2.7 4.5SEP. 19.1 3.6 -2.5 -7.9 1.7 4.5 6.8 5.0 3.1 3.6OCT. p 22.7 5.3 -1.6 -21.5 0.8 4.1
LEVELS ($BILLIONS) :MONTHLY
1992-JUNE 951.8 3464.7 2513.0 702.0 4166.7 5013.7 2883.2 2942.0 8539.7 11481.7JULY 960.6 3462.7 2502.2 699.9 4162.6 5005.7 2883.7 2968.2 8557.8 11526.0AUG. 973.1 3472.0 2498.9 702.3 4174.3 5023.0 2896.6 2991.6 8577.4 11569.0SEP. 988.6 3482.4 2493.7 697.7 4180.1 5041.9 2912.9 3004.1 8599.8 11604.0OCT. p 1007.3 3497.7 2490.4 685.2 4182.9 2922.9
MEEKLY1992-OCT. 5 999.7 3488.4 2488.7 670.6 4159.0
12 1006.8 3499.5 2492.7 694.8 4194.319 1005.2 3496.5 2491.2 683.9 4180.326 p 1009.1 3497.0 2487.9 689.4 4186.4
NOV. 2 p 1017.4 3508.9 2491.5 682.3 4191.2
1. Adjusted for breaks caused by reclassifications.2. Debt data are on a monthly average basis, derived by averaging end-of-month levels of adjacent months, and have been adjusted to remove
discontinuities.p-preliminarype-preliminary estimate
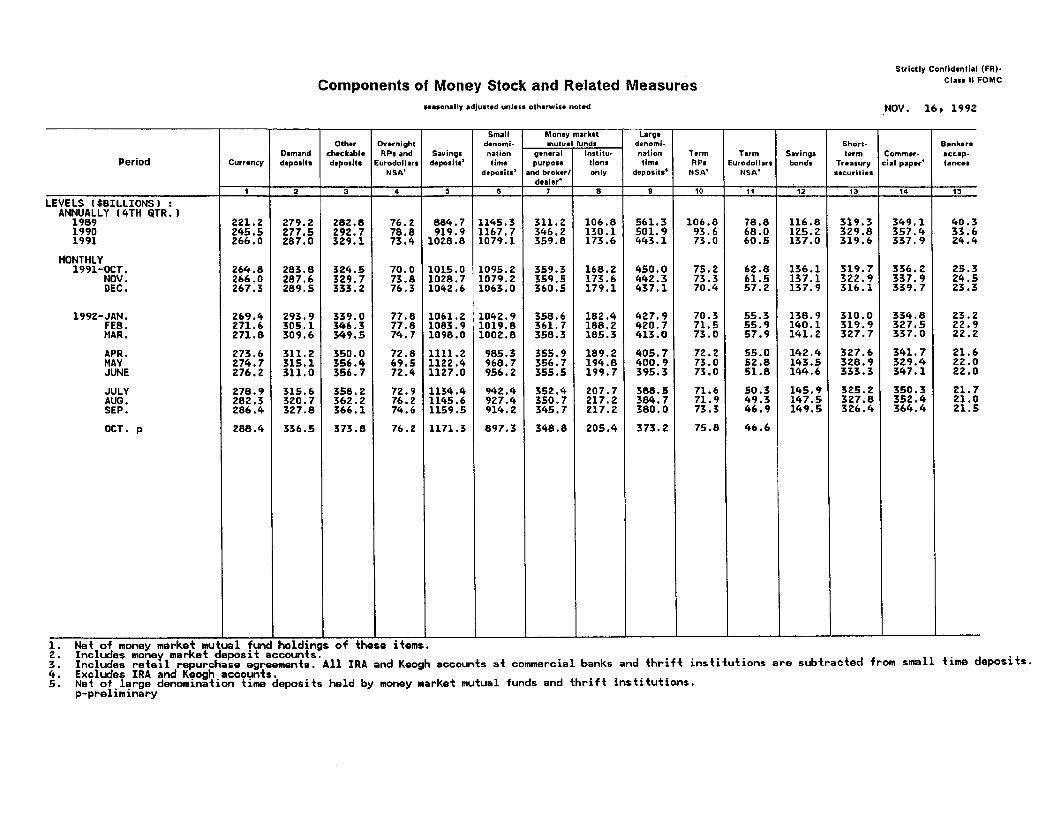
Strictly Confidential (FR)-
Components of Money Stock and Related Measures Class II FOMC
seasonally adjusted unless otherwise noted NOV. 16, 1992
Small Money market LargeOther Overnight denomi- mutual funds denomi- Short- Bankers
Demand checkable RPs and Savings nation general Institu- nation Term Term Savings term Commer- accep-Period Currency deposits deposits Eurodollars deposits' time purpose tions time RPs Eurodollars bonds Treasury cial paper' lances
NSA' deposits' and broker/ only deposits' NSA' NSA' securitiesdealer*
S 1 2 3 4 5 6 7 8 9 10 11 12 13 14 15
LEVELS ($BILLIONS) :ANNUALLY (4TH QTR.)
1989 221.2 279.2 282.8 76.2 884.7 1145.3 311.2 106.8 561.3 106.8 78.8 116.8 319.3 349.1 40.31990 245.5 277.5 292.7 78.8 919.9 1167.7 346.2 130.1 501.9 93.6 68.0 125.2 329.8 357.4 33.61991 266.0 287.0 329.1 73.4 1028.8 1079.1 359.8 173.6 443.1 73.0 60.5 137.0 319.6 337.9 24.4
MONTHLY1991-OCT. 264.8 283.8 324.5 70.0 1015.0 1095.2 359.3 168.2 450.0 75.2 62.8 136.1 319.7 336.2 25.3
NOV. 266.0 287.6 329.7 73.8 1028.7 1079.2 359.5 173.6 442.3 73.3 61.5 137.1 322.9 337.9 24.5DEC. 267.3 289.5 333.2 76.3 1042.6 1063.0 360.5 179.1 437.1 70.4 57.2 137.9 316.1 339.7 23.3
1992-JAN. 269.4 293.9 339.0 77.8 1061.2 1042.9 358.6 182.4 427.9 70.3 55.3 138.9 310.0 334.8 23.2FEB. 271.6 305.1 346.3 77.8 1083.9 1019.8 361.7 188.2 420.7 71.5 55.9 140.1 319.9 327.5 22.9MAR. 271.8 309.6 349.5 74.7 1098.0 1002.8 358.3 185.3 413.0 73.0 57.9 141.2 327.7 337.0 22.2
APR. 273.6 311.2 350.0 72.8 1111.2 985.3 355.9 189.2 405.7 72.2 55.0 142.4 327.6 341.7 21.6MAY 274.7 315.1 356.4 69.5 1122.4 968.7 356.7 194.8 400.9 73.0 52.8 143.5 328.9 329.4 22.0JUNE 276.2 311.0 356.7 72.4 1127.0 956.2 355.5 199.7 395.3 73.0 51.8 144.6 333.3 347.1 22.0
JULY 278.9 315.6 358.2 72.9 1134.4 942.4 352.4 207.7 388.5 71.6 50.3 145.9 325.2 350.3 21.7AUG. 282.3 320.7 362.2 76.2 1145.6 927.4 350.7 217.2 384.7 71.9 49.3 147.5 327.8 352.4 21.0SEP. 286.4 327.8 366.1 74.6 1159.5 914.2 345.7 217.2 380.0 73.3 46.9 149.5 326.4 364.4 21.5
OCT. p 288.4 336.5 373.8 76.2 1171.3 897.3 348.8 205.4 373.2 75.8 46.6
Net of money market mutual fund holdings of these items.Includes money market deposit accounts.Includes retail repurchase agreements. All IRA and Keogh accounts at commercial banks and thrift iExcludes IRA and Keogh accounts.Net of large denomination time deposits held by money market mutual funds and thrift institutions.p-preliminary
nstitutions are subtracted from small time deposits.
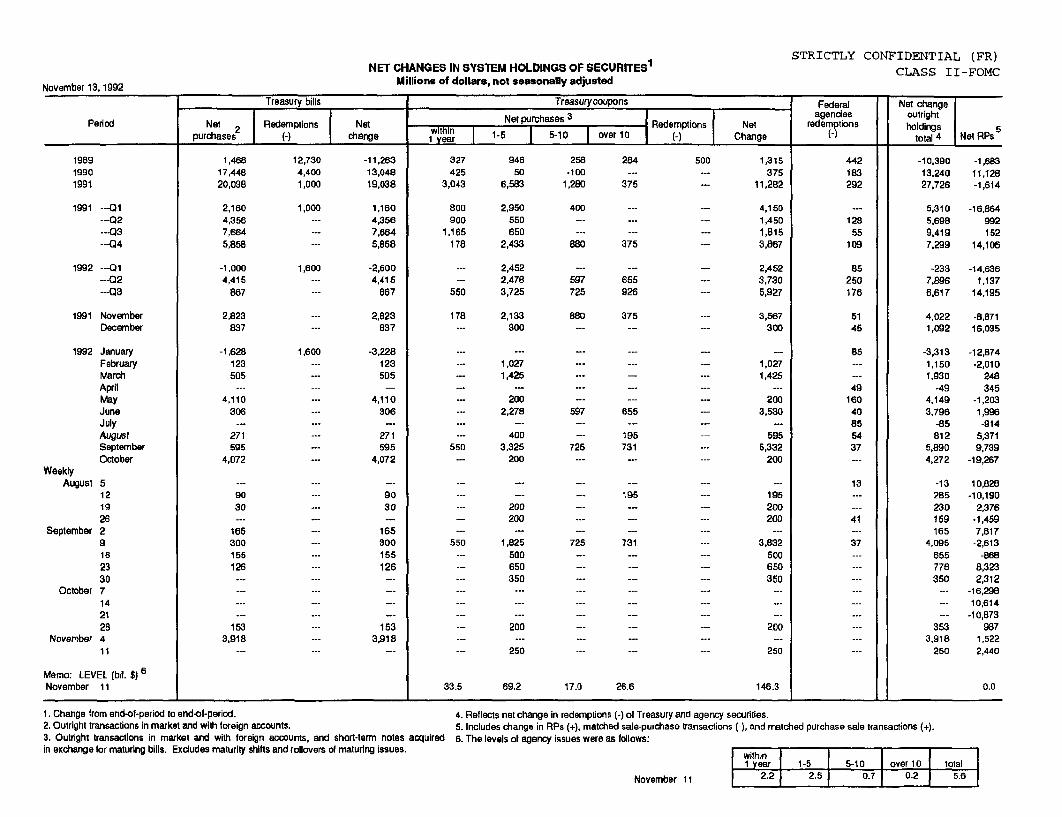
November 13,1992
NET CHANGES IN SYSTEM HOLDINGS OF SECURITES 1
Millions of dollars, not seasonally adjusted
STRICTLY CONFIDENTIAL (FR)CLASS II-FOMC
Treasury bills Treasurycoupons Federal Net changeNet purchases 3 agendes outright
Period Net 2 Redemptions Net withint Redemptions Net re pion holdingspurchases (-) change 1 year 1-5 5-10 over 10 (-) Change -) total 4 Net RPs
198919901991
1991 ---Q1---Q2---Q3---Q4
1992 ---Q1---Q2---Q3
1991 NovemberDecember
1992 JanuaryFebruaryMarchAprilMayJuneJulyAugustSeptemberOctober
WeeklyAugust 5
121926
September 29162330
October 7142128
November 411
Memo: LEVEL (bil. $) 6November 11
1,46817,44820,038
2,1604,3567,6645,858
-1,0004,415
867
2,823837
-1,628123505
4.110306
271595
4,072
9030
165300155126
1533,918
12,730 -11.2634,400 13,0481,000 19,038
1,000 1,160- 4,356--- 7,664--- 5,858
1,600 -2,600--- 4,415
--- 867
--- 2,823--- 837
1,600 -3,228--- 123--- 505
- 4,110--- 306
- 271-- 595
--- 4,072
9030
165300155126
1533,918
327 946
425 503,043 6,583
800 2,950900 550
1,165 650178 2,433
- 2,452-- 2,478
550 3,725
178 2,133300
-- 1,0271,425
2002,278
400550 3,325
200
200--- 200
550 1,825500
- 650--- 350
- 200
250
33.5 69.2
258 284-100
1,280 375
1,315375
11,282
4,1501,4501,8153,867
--- 2,4523,730
--- 5,927
--- 3,567300
1,0271,425
2003,530
5955,332
200
195200200
3,832500650350
200
250
17.0 26.6
-10.390 -1,68313,240 11,12827,726 -1,614
5.310 -16,8645.698 9929,419 1527,299 14,106
-233 -14,6367.896 1,1376.617 14.195
4,0221,092
-3,3131,1501,930
-494,1493,796
-85812
5,8904,272
-13285230159165
4,095655776350
3533,918
250
-8,87116,035
-12,874-2,010
248345
-1,2031,996-914
5,3719,739
-19,267
10,828-10.190
2,376-1,4597,817
-2,613-868
8,3232,312
-16,29810,614
-10,873987
1,5222,440
0.0
1. Change from end-of-period to end-of-period. 4. Reflects net change in redemptions (-) of TreE2. Outright transactions in market and with foreign accounts. 5. Includes change in RPs (+), matched sale-pu3. Outright transactions in market and with foreign accounts, and short-term notes acquired 6. The levels of agency issues were as follows:in exchange for maturing bills. Excludes maturity shifts and rollovers of maturing issues.
Isury and agency securities.rchase transactions (-), and matched purchase sale transactions (+).
November 11
within1 year 1-5 5-10 over 10 total
2.2 2.5 0.7 0.2 5.6
'