Embed Size (px)
Citation preview
Repsol YPF
Global Oil & Gas Conference 2004 June 2004
1
DISCLAIMERDISCLAIMER
Safe harbor statement under the Private Securities Litigation Reform Act of 1995:
This document contains statements that Repsol YPF believes constitute forward-looking statements within the meaning of the Private Securities Litigation Reform Act of 1995. These forward-looking statements may include statements regarding the intent, belief or current expectations of Repsol YPF and its management, including with respect to trends affecting Repsol YPF’s financial condition, results of operations, business, strategy, production volume and reserves, as well as Repsol YPF’s plans with respect to capital expenditures and investments. These statements are not guarantees of future performance and are subject to material risks, uncertainties, changes and other factors which may be beyond Repsol YPF’s control or may be difficult to predict.
Repsol YPF’s future financial condition, results of operations, business, strategy, production volumes, reserves, capital expenditures and investments could differ materially from those expressed or implied in any such forward-looking statements. Such factors include, but are not limited to, currency fluctuations, the price of petroleum products, the ability to realize cost reductions and operating efficiencies without unduly disrupting business operations, environmental and regulatory considerations and general economic and business conditions, as well as those factors described in the filings made by Repsol YPF and its affiliates with the Comisión Nacional del Mercado de Valores in Spain, the Comisión Nacional de Valores in Argentina and the Securities and Exchange Commission in the United States; in particular, those described in Section 1.3 “Key Information about RepsolYPF―Risk Factors” and Section 3 “Operating and Financial Review and Prospects” in Repsol YPF’s annual report on Form 20-F for the fiscal year ended December 31, 2002 filed with the Securities and Exchange Commission.
Repsol YPF does not undertake to publicly update or revise these forward looking statements even if experience or future changes make it clear that the projected results or condition expressed or implied therein will not be realized.
2
Maintaining Maintaining RepsolRepsol YPFYPF core businesses.core businesses.
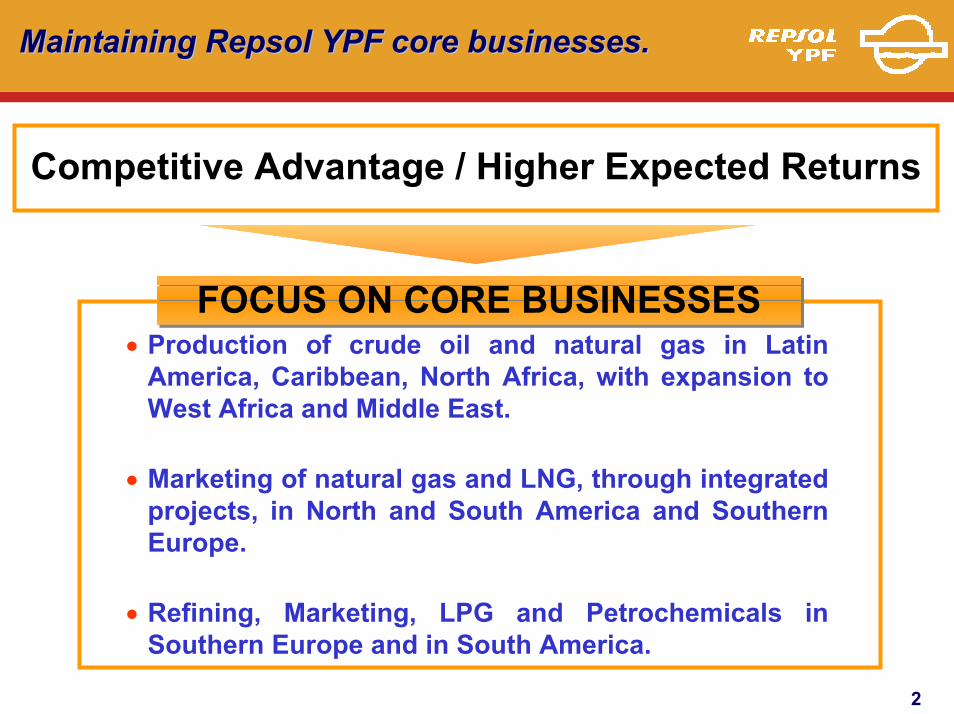
Competitive Advantage / Higher Expected Returns
• Production of crude oil and natural gas in Latin America, Caribbean, North Africa, with expansion to West Africa and Middle East.
• Marketing of natural gas and LNG, through integrated projects, in North and South America and Southern Europe.
• Refining, Marketing, LPG and Petrochemicals in Southern Europe and in South America.
FOCUS ON CORE BUSINESSESFOCUS ON CORE BUSINESSES
3
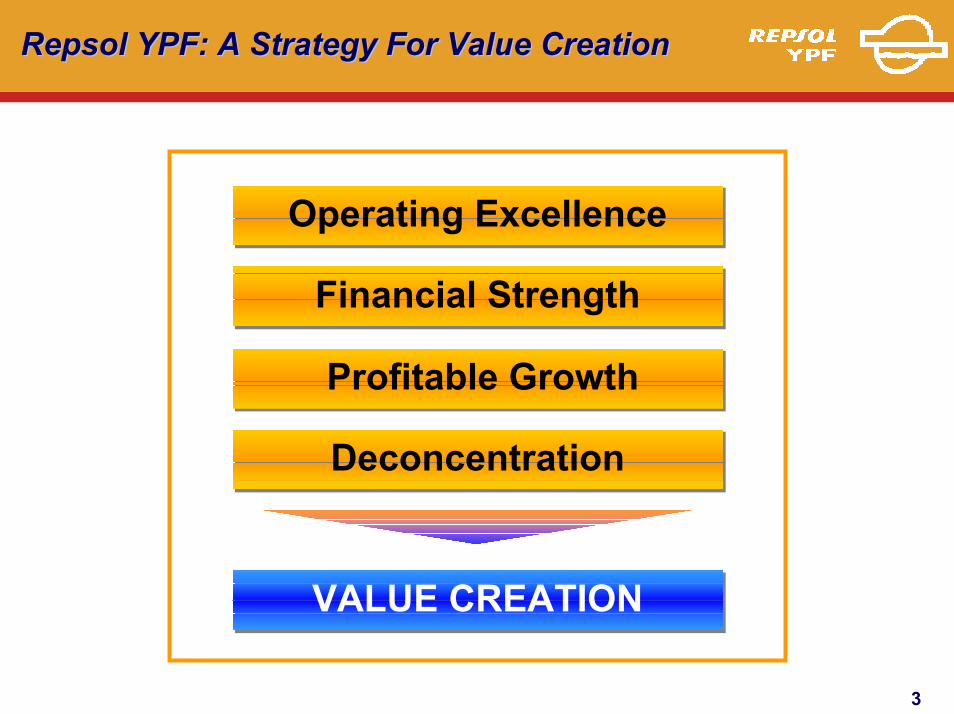
RepsolRepsol YPFYPF: A Strategy For Value Creation: A Strategy For Value Creation
VALUE CREATIONVALUE CREATION
Profitable GrowthProfitable Growth
DeconcentrationDeconcentration
Operating ExcellenceOperating Excellence
Financial StrengthFinancial Strength
4
... viable under a prudent scenario.
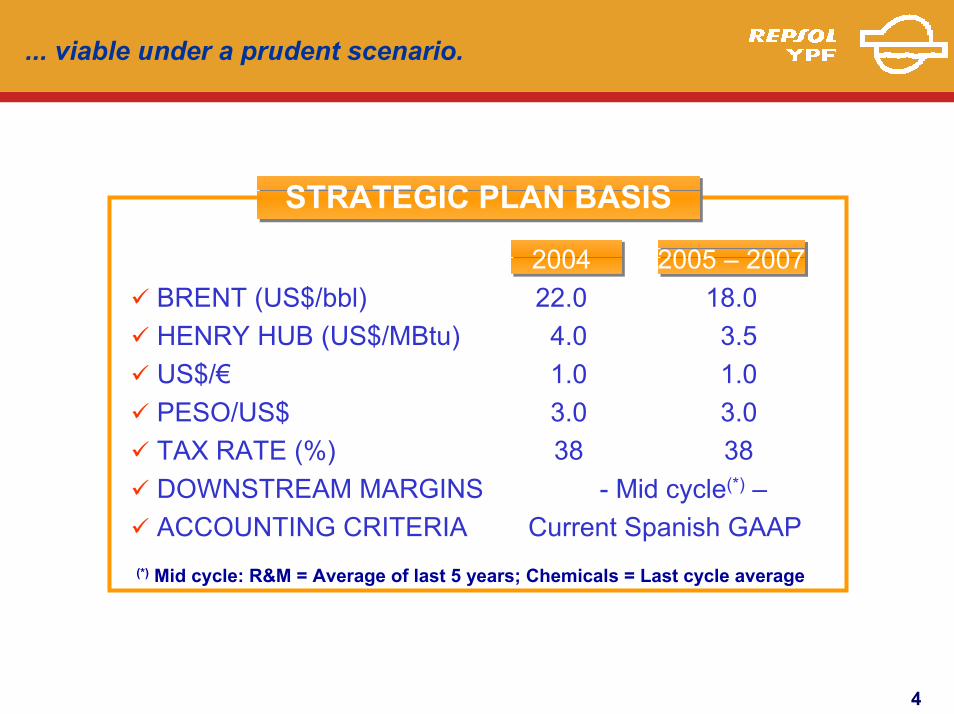
STRATEGIC PLAN BASISSTRATEGIC PLAN BASIS
(*) Mid cycle: R&M = Average of last 5 years; Chemicals = Last cycle average
3838TAX RATE (%)3.03.0PESO/US$
- Mid cycle(*) –DOWNSTREAM MARGINSCurrent Spanish GAAPACCOUNTING CRITERIA
1.01.0US$/€3.54.0HENRY HUB (US$/MBtu)
18.022.0BRENT (US$/bbl)2005 – 20072004
5
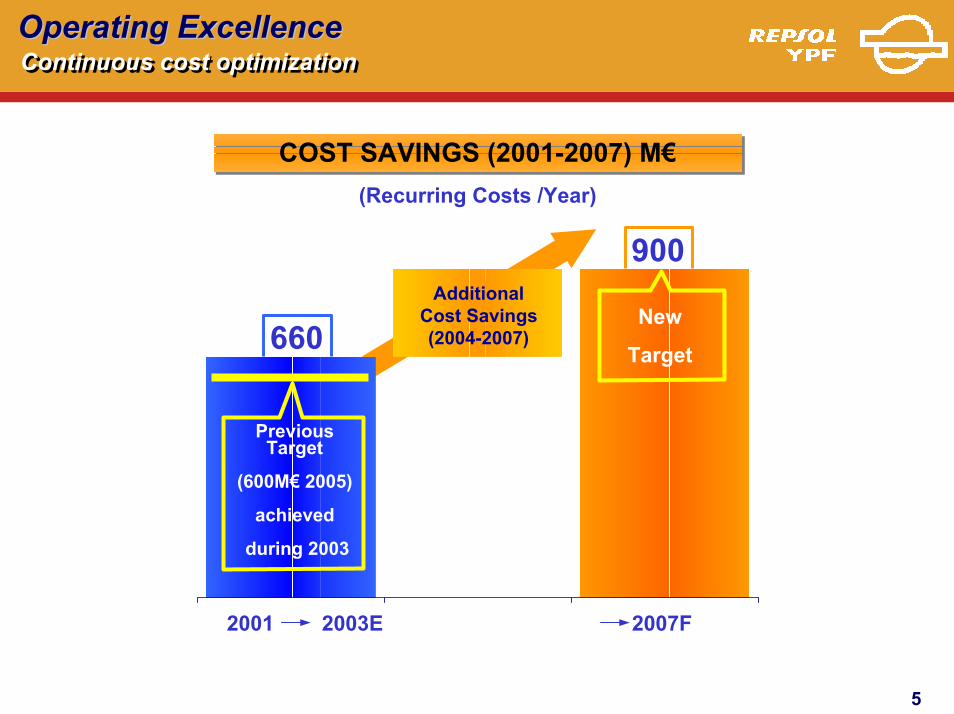
Operating ExcellenceOperating ExcellenceContinuous cost optimizationContinuous cost optimization
COST SAVINGS (2001-2007) M€COST SAVINGS (2001-2007) M€
900
660
2001 2003E 2007F
AdditionalCost Savings(2004-2007)
PreviousTarget
(600M€ 2005)
achieved
during 2003
New
Target
(Recurring Costs /Year)
6
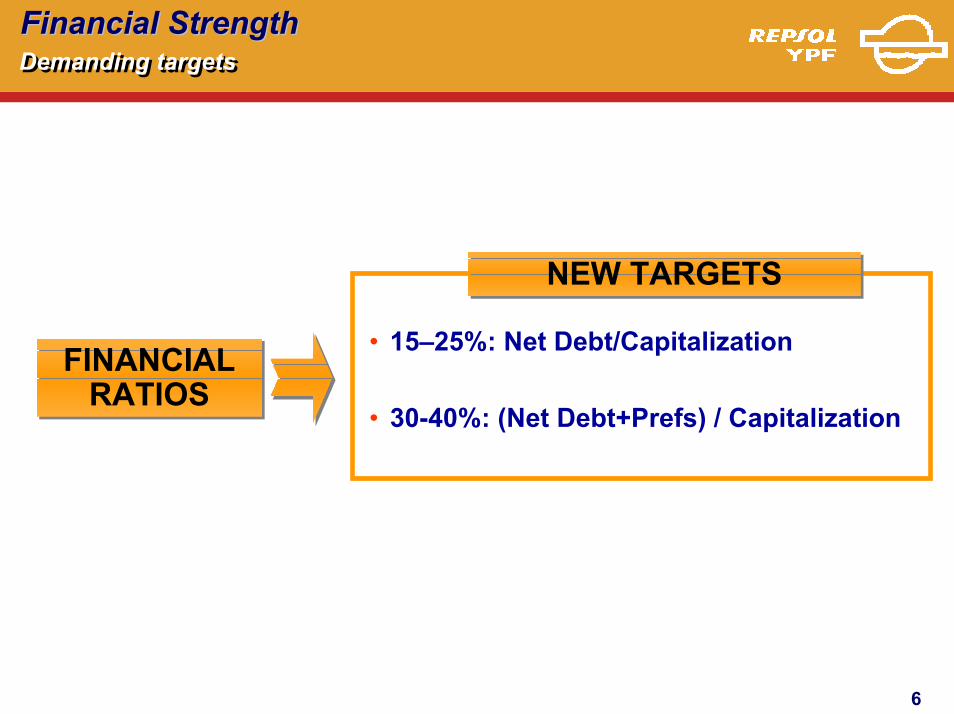
Financial StrengthFinancial StrengthDemanding targetsDemanding targets
• 15–25%: Net Debt/Capitalization
• 30-40%: (Net Debt+Prefs) / Capitalization
NEW TARGETSNEW TARGETS
FINANCIAL RATIOS
FINANCIAL RATIOS
7
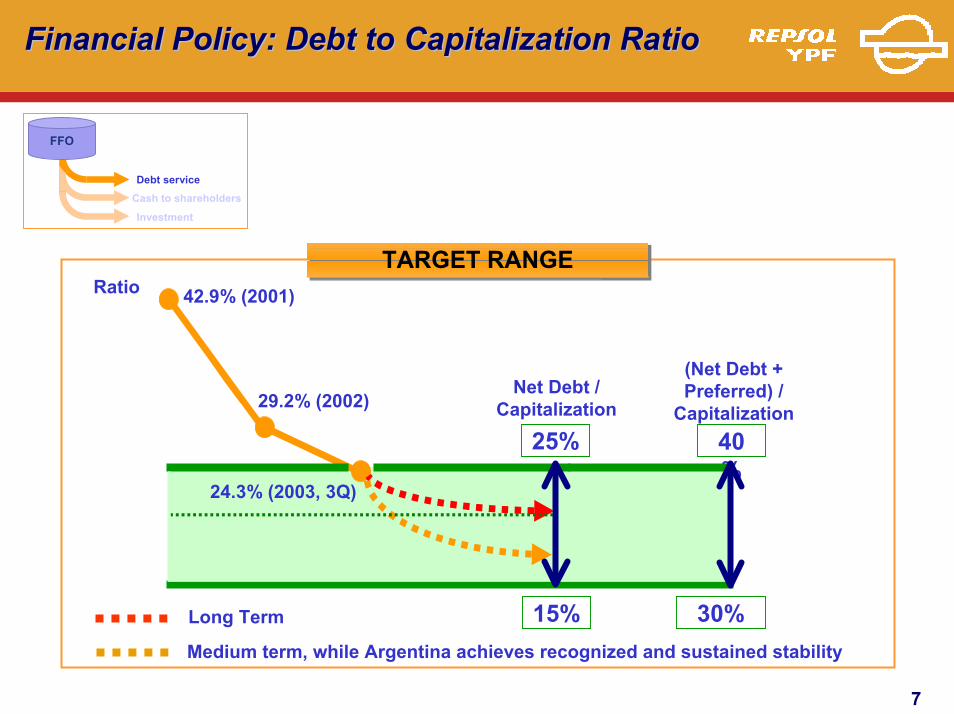
Financial Policy: Debt to Capitalization RatioFinancial Policy: Debt to Capitalization Ratio
FFO
Debt service
Investment
Cash to shareholders
Long Term
Medium term, while Argentina achieves recognized and sustained stability
(Net Debt + Preferred) /
CapitalizationNet Debt /
Capitalization
25% 40%
30%15%
TARGET RANGETARGET RANGERatio 42.9% (2001)
29.2% (2002)
24.3% (2003, 3Q)
8
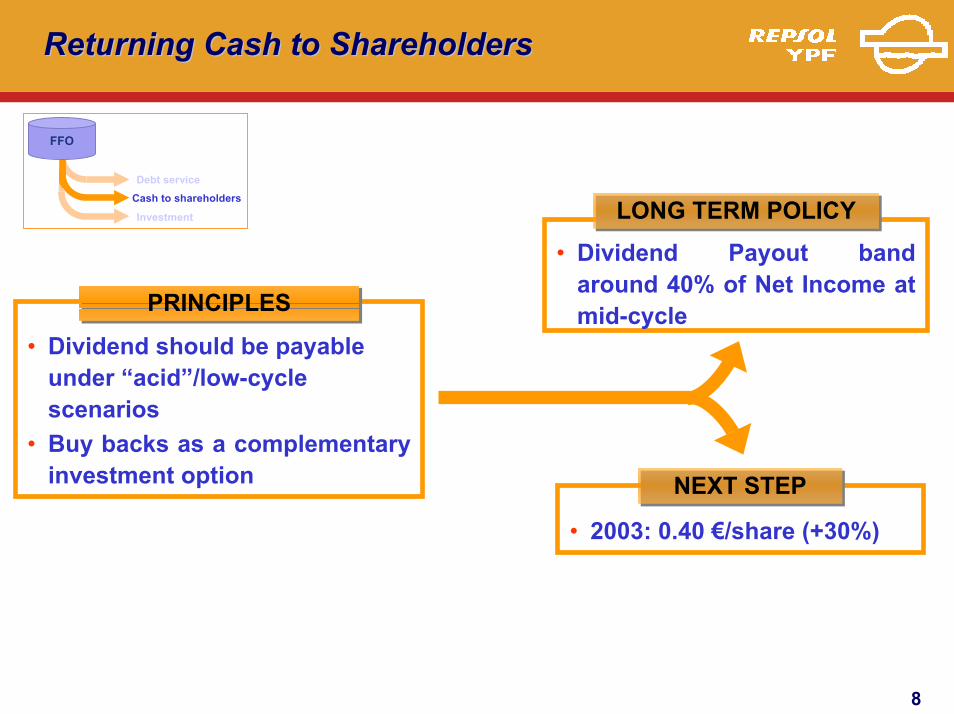
Returning Cash to ShareholdersReturning Cash to Shareholders
FFO
Debt service
Investment
Cash to shareholders
• Dividend Payout band around 40% of Net Income at mid-cycle
LONG TERM POLICYLONG TERM POLICY
PRINCIPLESPRINCIPLES
• Dividend should be payable under “acid”/low-cycle scenarios
• Buy backs as a complementary investment option NEXT STEPNEXT STEP
• 2003: 0.40 €/share (+30%)
9
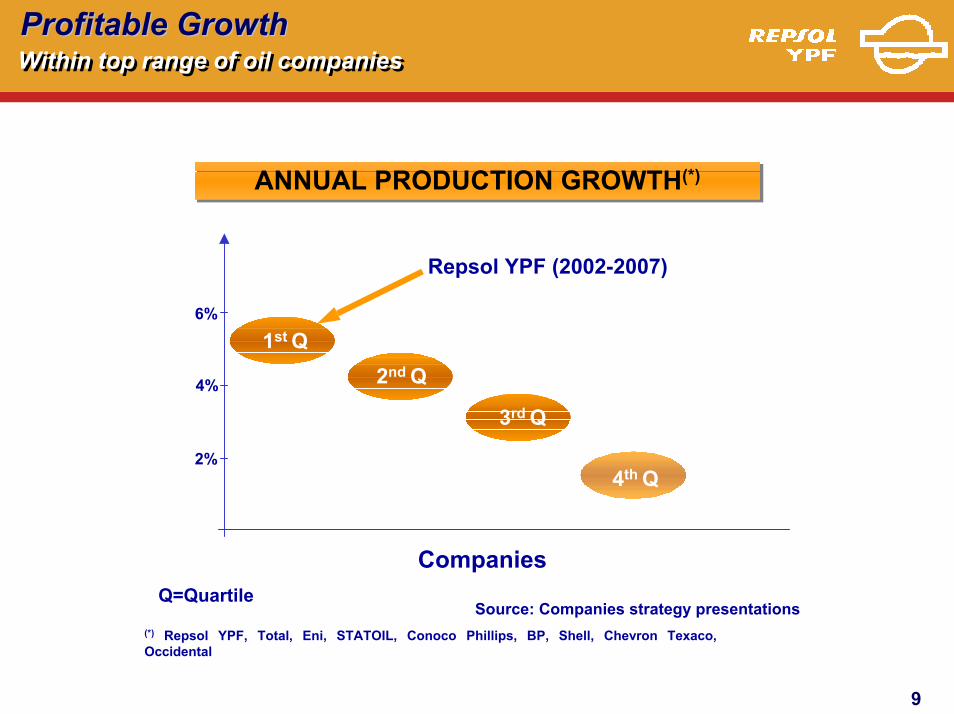
Profitable Profitable GrowthGrowthWithin top range of oil companiesWithin top range of oil companies
ANNUAL PRODUCTION GROWTH(*)ANNUAL PRODUCTION GROWTH(*)
4%
1st Q2nd Q
Repsol YPF (2002-2007)
6%
3rd Q
2%4th Q
CompaniesQ=Quartile
Source: Companies strategy presentations(*) Repsol YPF, Total, Eni, STATOIL, Conoco Phillips, BP, Shell, Chevron Texaco, Occidental
10
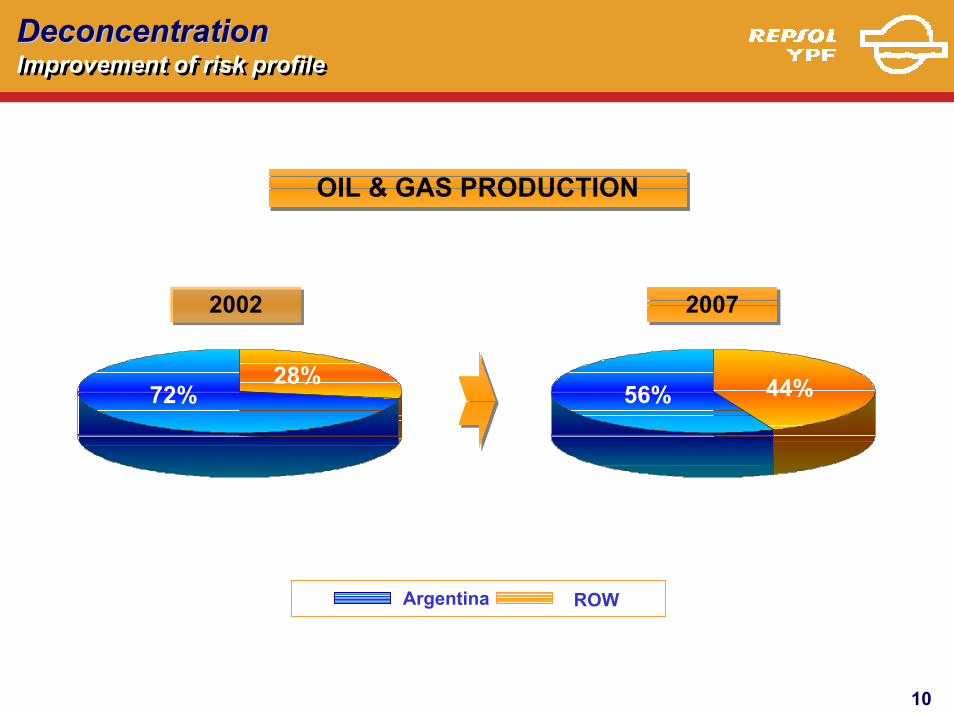
DeconcentrationDeconcentrationImprovement of risk profileImprovement of risk profile
OIL & GAS PRODUCTIONOIL & GAS PRODUCTION
72%28%
20022002
56% 44%
20072007
Argentina ROW
11
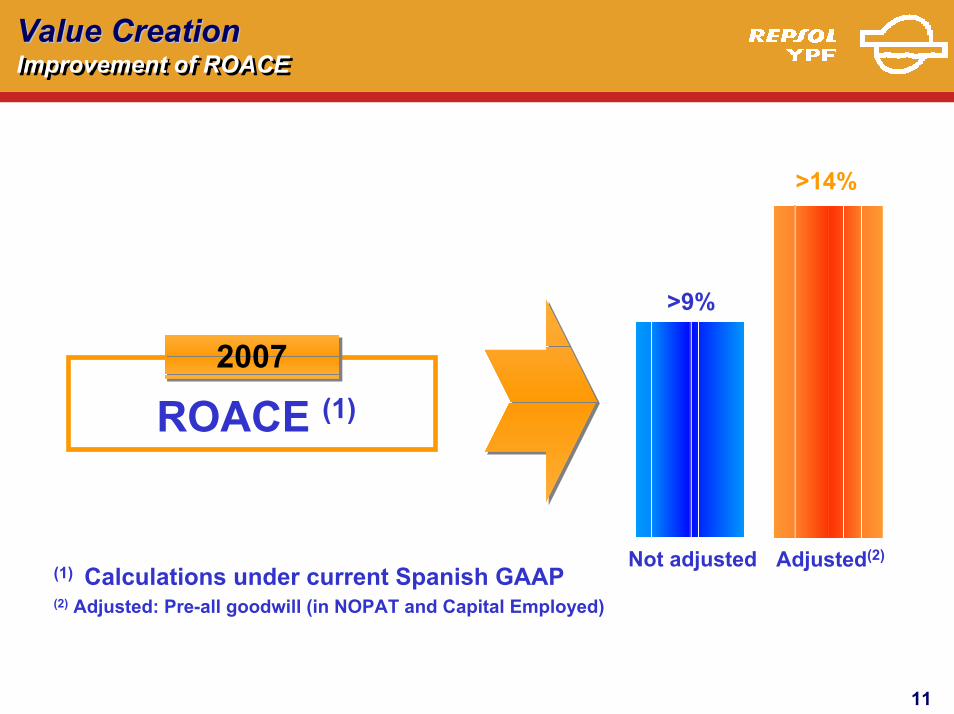
Value CreationValue CreationImprovement of ROACEImprovement of ROACE
>14%
>9%
ROACE (1)20072007
Not adjusted Adjusted(2)(1) Calculations under current Spanish GAAP(2) Adjusted: Pre-all goodwill (in NOPAT and Capital Employed)
12
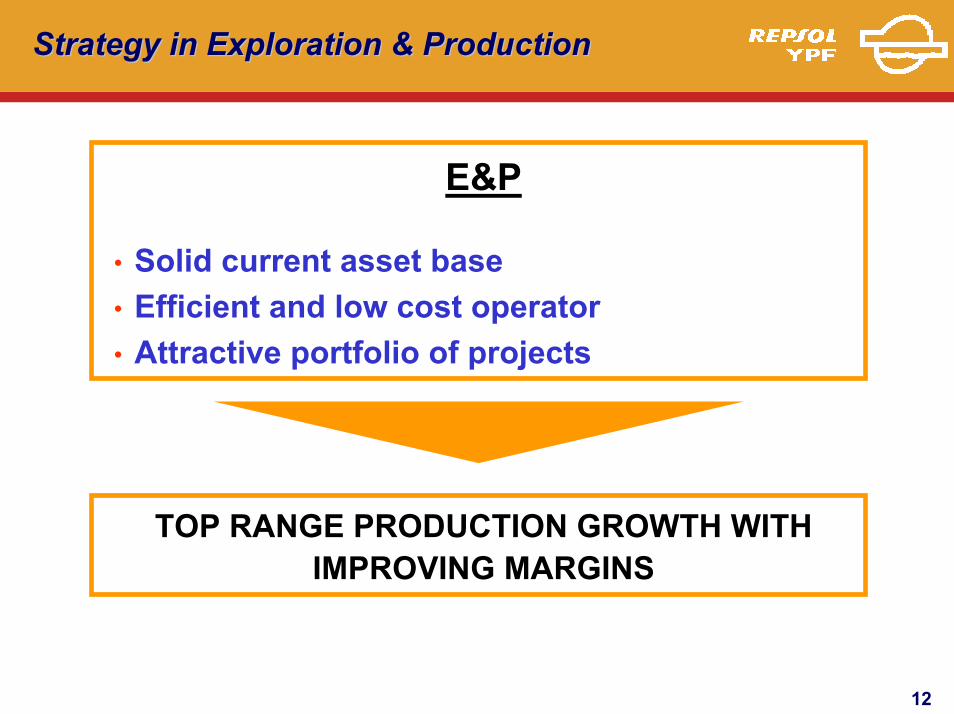
Strategy in Exploration & ProductionStrategy in Exploration & Production
E&P
• Solid current asset base• Efficient and low cost operator• Attractive portfolio of projects
TOP RANGE PRODUCTION GROWTH WITH IMPROVING MARGINS
13
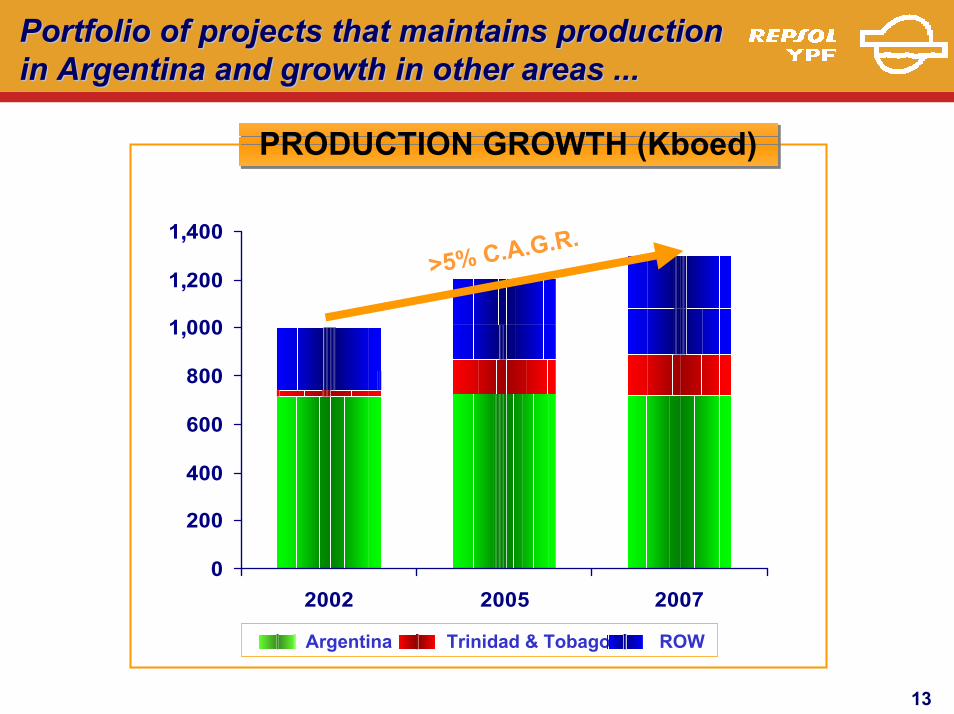
Portfolio of projects that maintains production Portfolio of projects that maintains production in Argentina and growth in other areas ...in Argentina and growth in other areas ...
PRODUCTION GROWTH (Kboed)PRODUCTION GROWTH (Kboed)
0
200
400
600
800
1.000
1.200
1.400
2002 2005 2007
>5% C.A.G.R.,
,
,
Argentina Trinidad & Tobago ROW
14
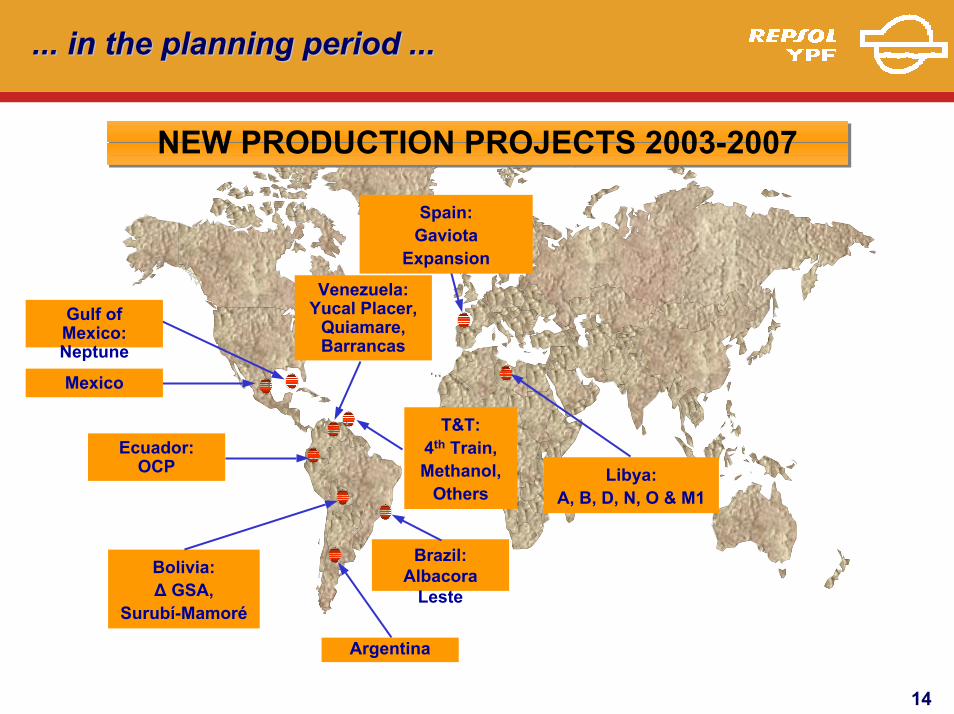
... in the planning period ...... in the planning period ...
Brazil: Albacora
Leste
Libya:A, B, D, N, O & M1
Venezuela: Yucal Placer,
Quiamare, Barrancas
T&T: 4th Train, Methanol,
Others
NEW PRODUCTION PROJECTS 2003-2007NEW PRODUCTION PROJECTS 2003-2007
Spain: Gaviota
Expansion
Gulf of Mexico: Neptune
Mexico
Ecuador:OCP
Bolivia:∆ GSA,
Surubí-Mamoré
Argentina
15
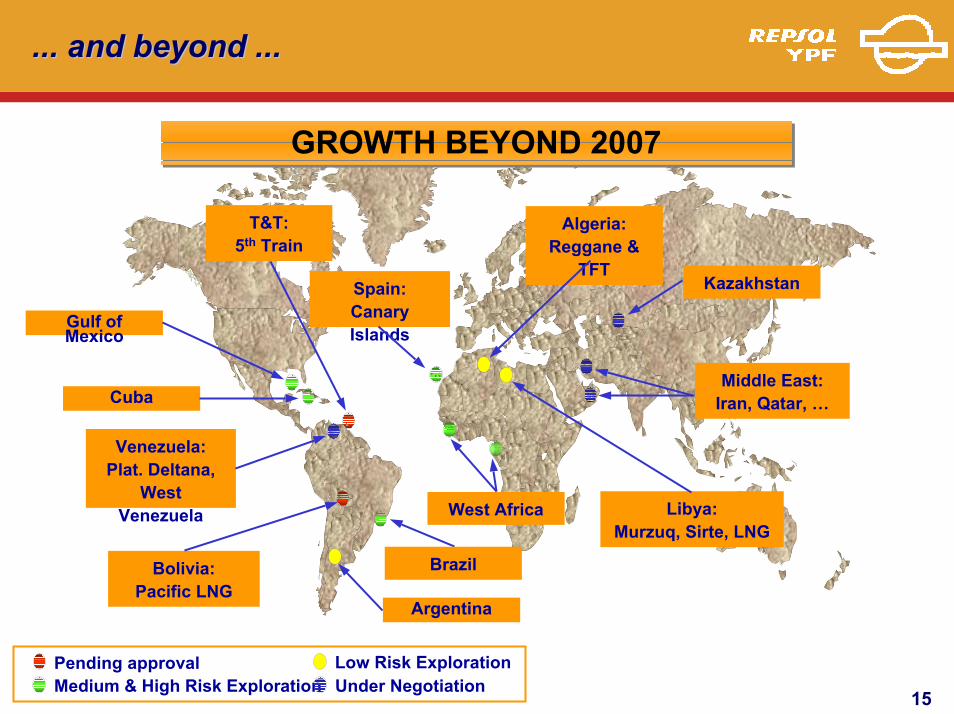
... and beyond ...... and beyond ...
Libya: Murzuq, Sirte, LNG
Venezuela: Plat. Deltana,
West Venezuela
T&T: 5th Train
Middle East: Iran, Qatar, …
GROWTH BEYOND 2007GROWTH BEYOND 2007
Algeria: Reggane &
TFTKazakhstan
West Africa
Spain: Canary Islands
Gulf of Mexico
Cuba
BrazilBolivia: Pacific LNG
Argentina
Medium & High Risk ExplorationPending approval Low Risk Exploration
Under Negotiation
16
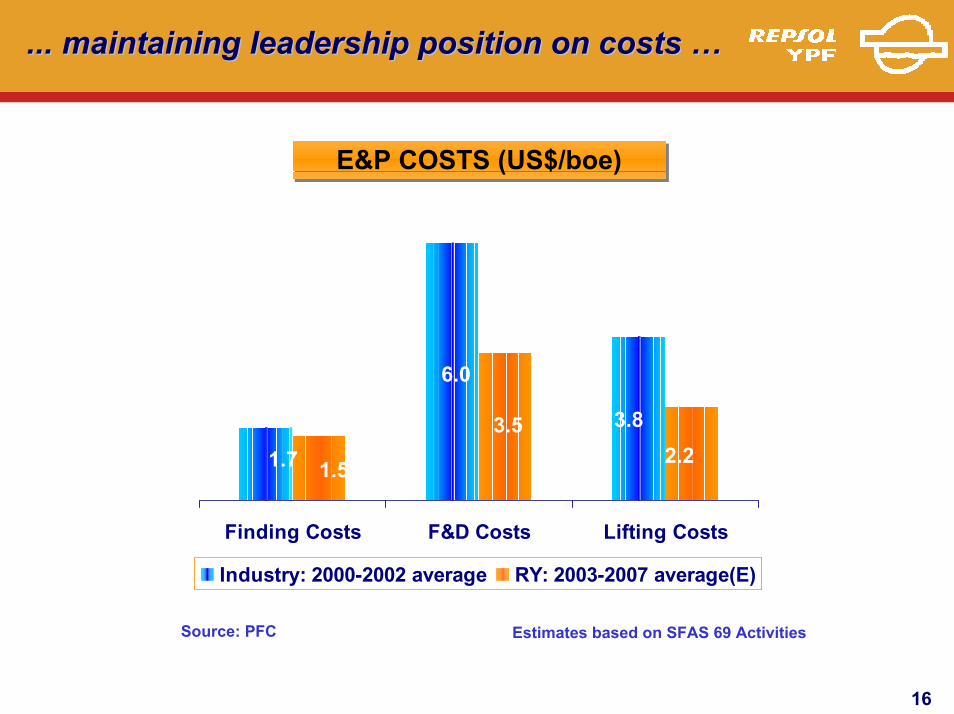
... maintaining leadership position on costs … ... maintaining leadership position on costs …
E&P COSTS (US$/boe)E&P COSTS (US$/boe)
Finding Costs F&D Costs Lifting Costs
Industry: 2000-2002 average RY: 2003-2007 average(E)
1.7 1.5
6.0
3.5 3.82.2
Source: PFC Estimates based on SFAS 69 Activities
17
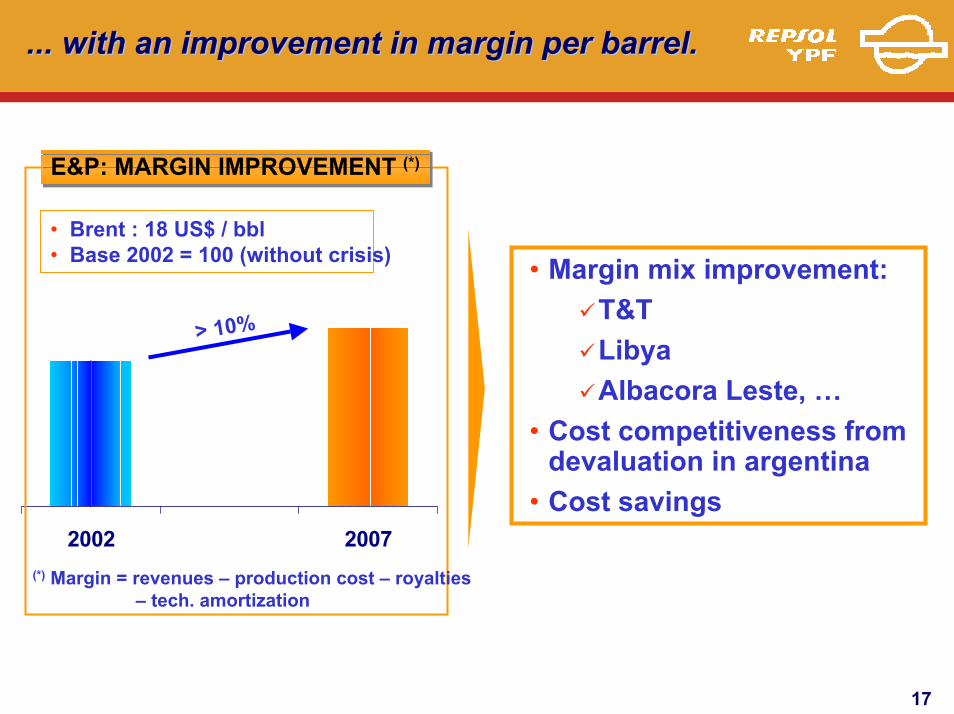
... with an improvement in margin per barrel. ... with an improvement in margin per barrel.
2002 2007
E&P: MARGIN IMPROVEMENT (*)E&P: MARGIN IMPROVEMENT (*)
• Brent : 18 US$ / bbl• Base 2002 = 100 (without crisis)
> 10%
(*) Margin = revenues – production cost – royalties– tech. amortization
• Margin mix improvement:T&TLibyaAlbacora Leste, …
• Cost competitiveness fromdevaluation in argentina
• Cost savings
18
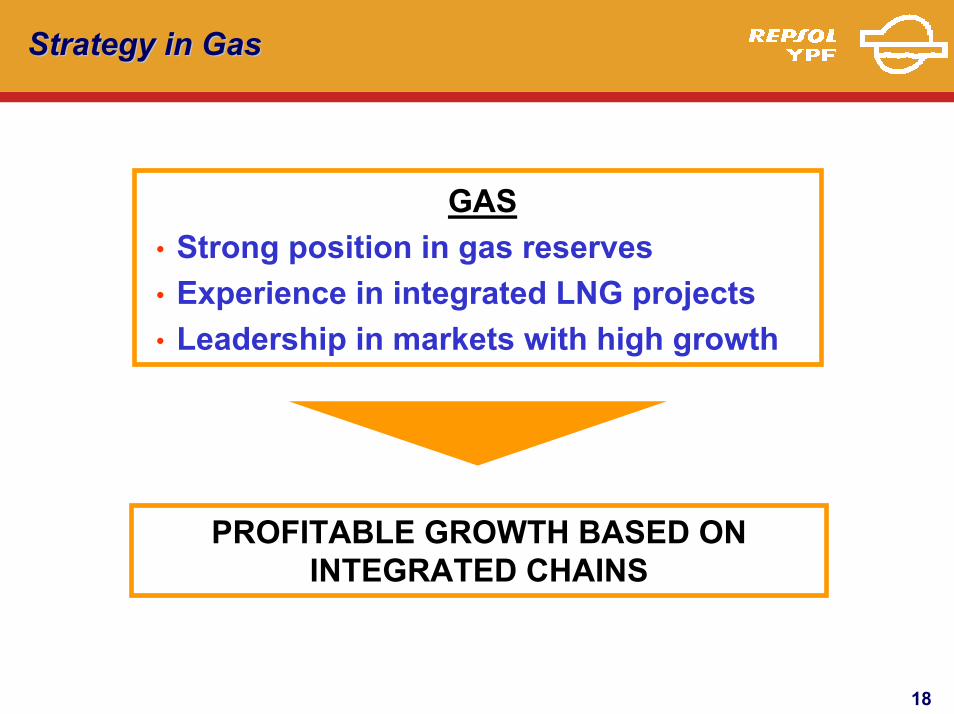
Strategy in GasStrategy in Gas
GAS• Strong position in gas reserves• Experience in integrated LNG projects• Leadership in markets with high growth
PROFITABLE GROWTH BASED ON INTEGRATED CHAINS
19
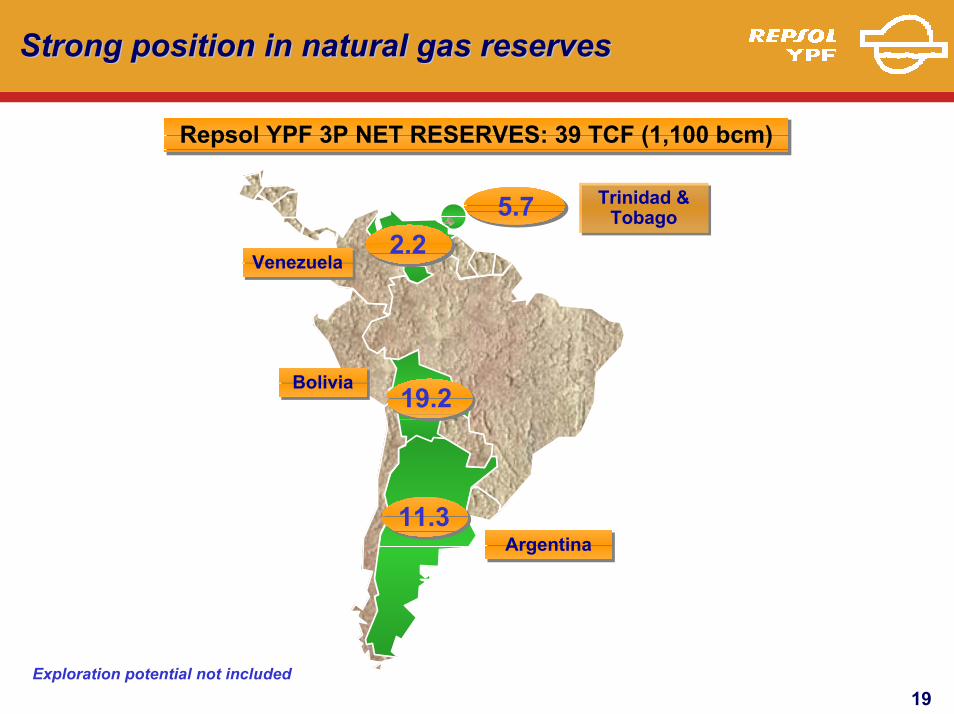
Strong position in natural gas reservesStrong position in natural gas reserves
Repsol YPF 3P NET RESERVES: 39 TCF (1,100 bcm)Repsol YPF 3P NET RESERVES: 39 TCF (1,100 bcm)
Exploration potential not included
11.3
19.2BoliviaBolivia
ArgentinaArgentina
Trinidad & Tobago
Trinidad & Tobago
VenezuelaVenezuela
5.72.2
20
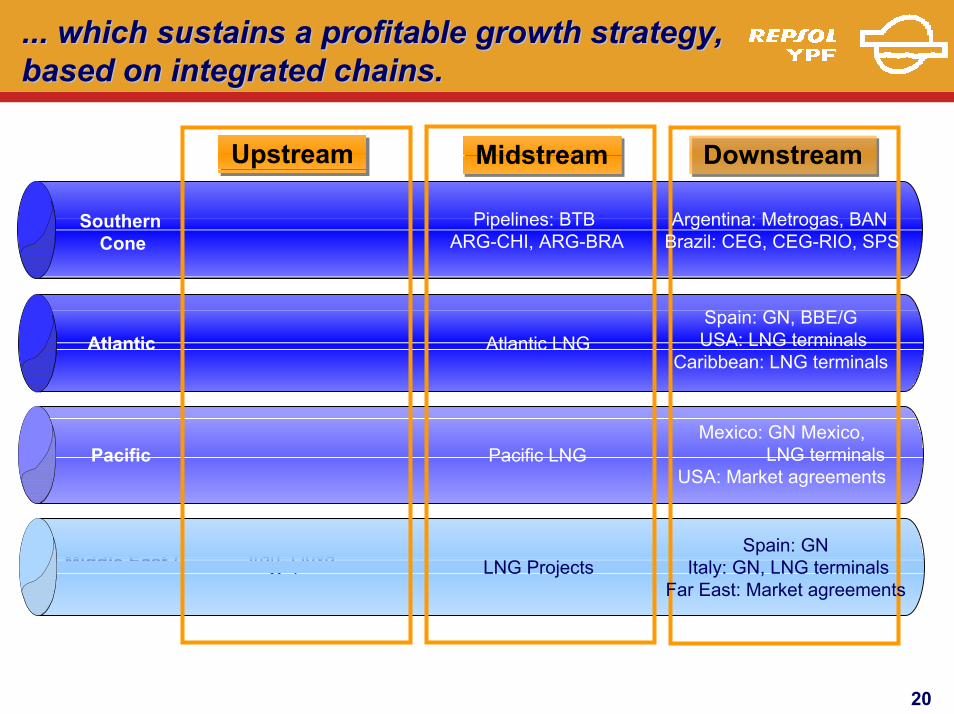
... which sustains a profitable growth strategy,... which sustains a profitable growth strategy,based on integrated chains. based on integrated chains.
UpstreamUpstream
Argentina: Neuquen, NOABolivia
Trinidad&TobagoVenezuela
Bolivia
Middle East /North Africa
Iran, LibyaQatar
MidstreamMidstream DownstreamDownstream
Pipelines: BTB ARG-CHI, ARG-BRA
Argentina: Metrogas, BANBrazil: CEG, CEG-RIO, SPS
Atlantic LNGSpain: GN, BBE/GUSA: LNG terminals
Caribbean: LNG terminals
Pacific LNGMexico: GN Mexico,
LNG terminalsUSA: Market agreements
LNG ProjectsSpain: GN
Italy: GN, LNG terminalsFar East: Market agreements
SouthernCone
Atlantic
Pacific
21
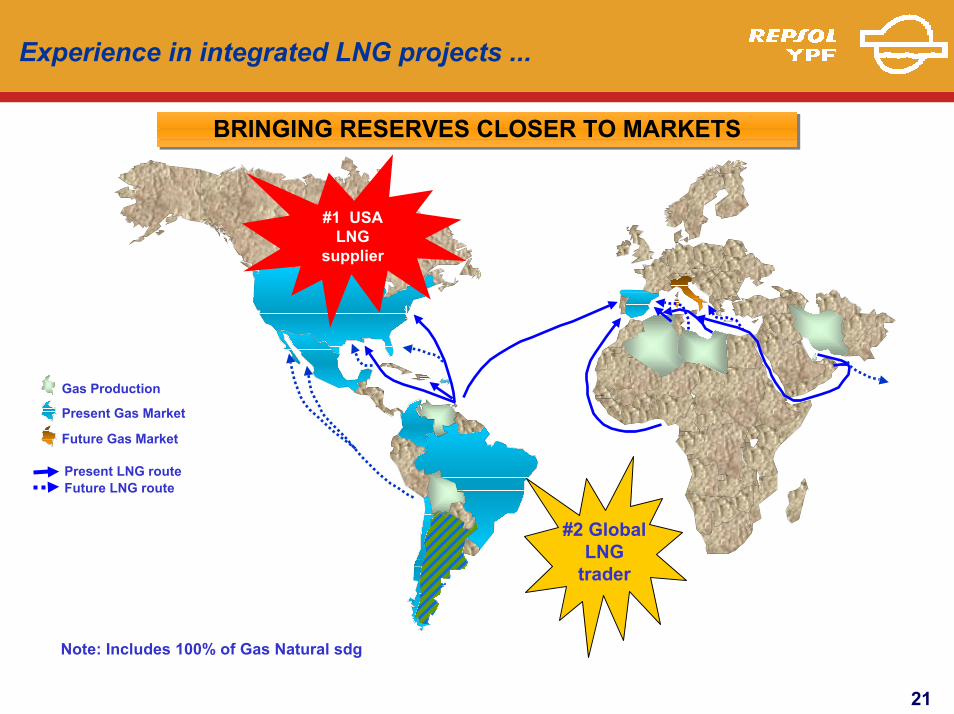
Experience in integrated LNG projects ...
Present LNG routeFuture LNG route
Gas Production
Present Gas Market
Future Gas Market
Note: Includes 100% of Gas Natural sdg
#2 Global LNG
trader
BRINGING RESERVES CLOSER TO MARKETSBRINGING RESERVES CLOSER TO MARKETS
#1 USALNG
supplier
22
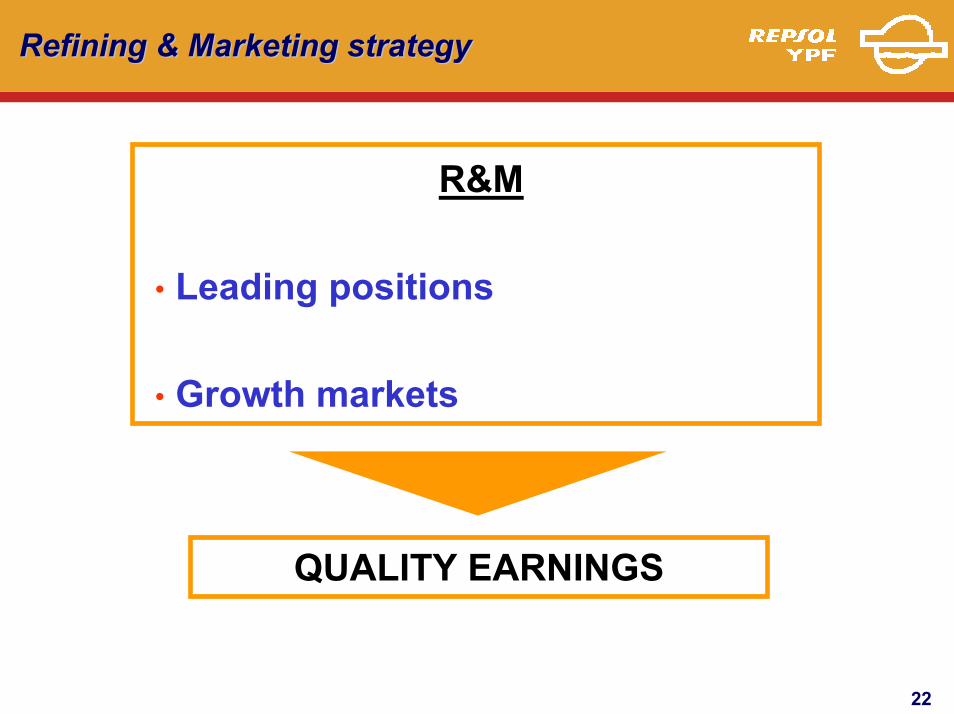
Refining & Marketing strategyRefining & Marketing strategy
R&M
• Leading positions
• Growth markets
QUALITY EARNINGS
23
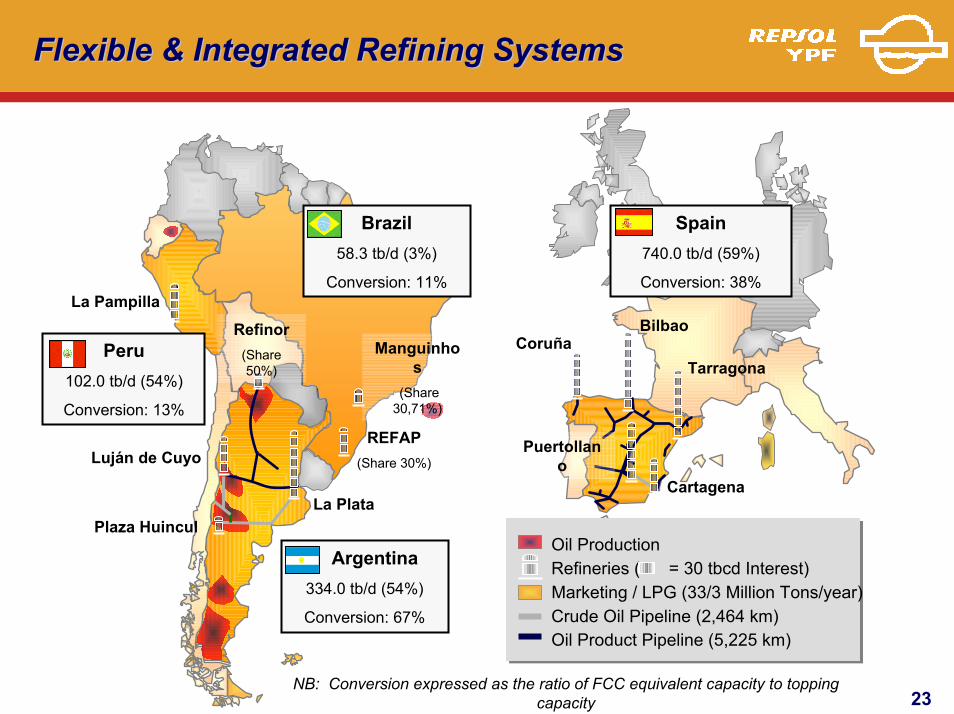
Flexible & Integrated Refining SystemsFlexible & Integrated Refining Systems
Tarragona
Cartagena
Puertollano
CoruñaBilbao
La Plata
Luján de Cuyo
Plaza Huincul
Refinor(Share 50%)
Spain740.0 tb/d (59%)
Conversion: 38%
REFAP(Share 30%)
Manguinhos
(Share 30,71%)
Brazil58.3 tb/d (3%)
Conversion: 11%
Argentina334.0 tb/d (54%)
Conversion: 67%
Peru102.0 tb/d (54%)
Conversion: 13%
La Pampilla
Refineries ( = 30 tbcd Interest) Oil Production
Marketing / LPG (33/3 Million Tons/year) Crude Oil Pipeline (2,464 km) Oil Product Pipeline (5,225 km)
NB: Conversion expressed as the ratio of FCC equivalent capacity to topping capacity
24
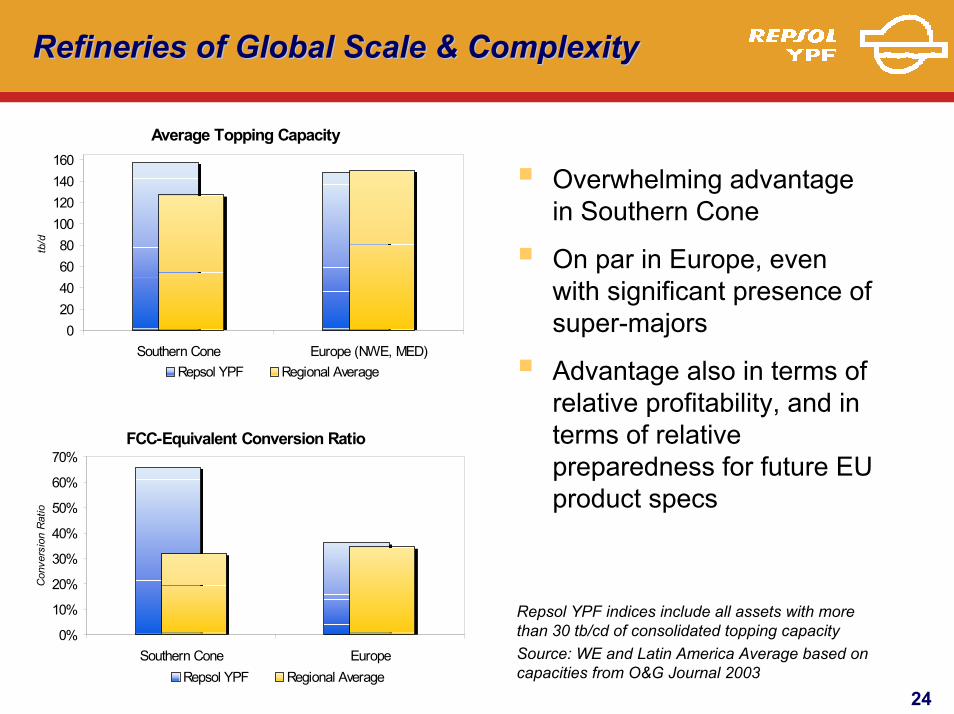
Refineries of Global Scale & Complexity Refineries of Global Scale & Complexity
Overwhelming advantage in Southern Cone
On par in Europe, even with significant presence of super-majors
Advantage also in terms of relative profitability, and in terms of relative preparedness for future EUproduct specs
Average Topping Capacity
020406080
100120140160
Southern Cone Europe (NWE, MED)
tb/d
Repsol YPF Regional Average
FCC-Equivalent Conversion Ratio
0%
10%
20%
30%
40%
50%
60%
70%
Southern Cone Europe
Con
vers
ion
Rat
io
Repsol YPF Regional Average
Repsol YPF indices include all assets with more than 30 tb/cd of consolidated topping capacitySource: WE and Latin America Average based on capacities from O&G Journal 2003
25
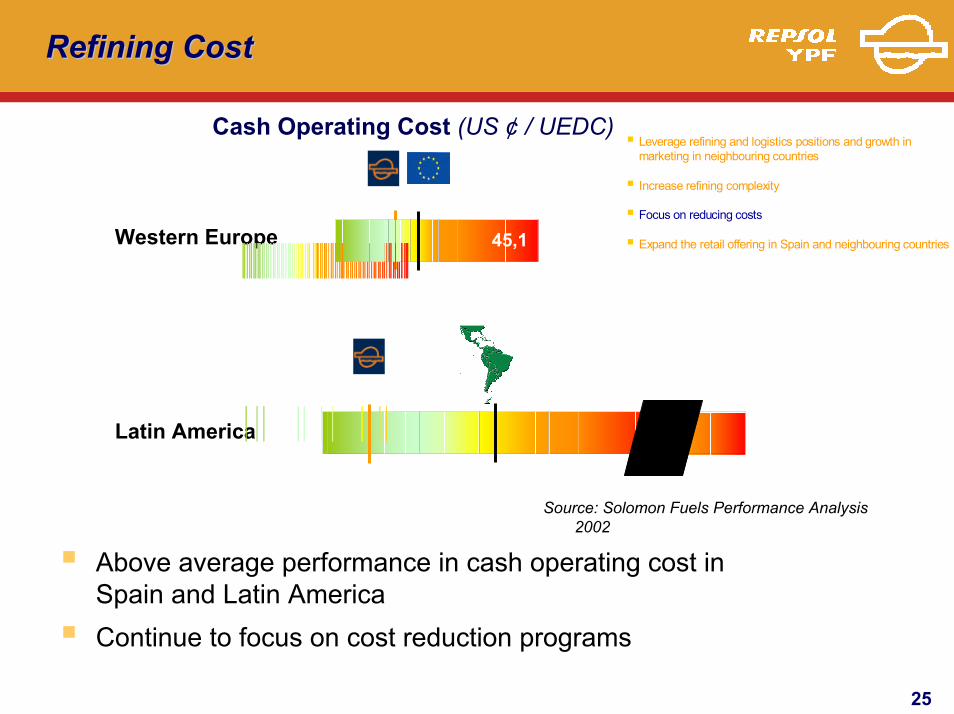
Refining CostRefining Cost
Latin America
Western Europe 18,8 45,1
25,9 28,9
16,4 116,3
22,2 38,4
Leverage refining and logistics positions and growth in marketing in neighbouring countries
Increase refining complexity
Focus on reducing costs
Expand the retail offering in Spain and neighbouring countries
Cash Operating Cost (US ¢ / UEDC)
Source: Solomon Fuels Performance Analysis2002
Above average performance in cash operating cost in Spain and Latin America Continue to focus on cost reduction programs
26
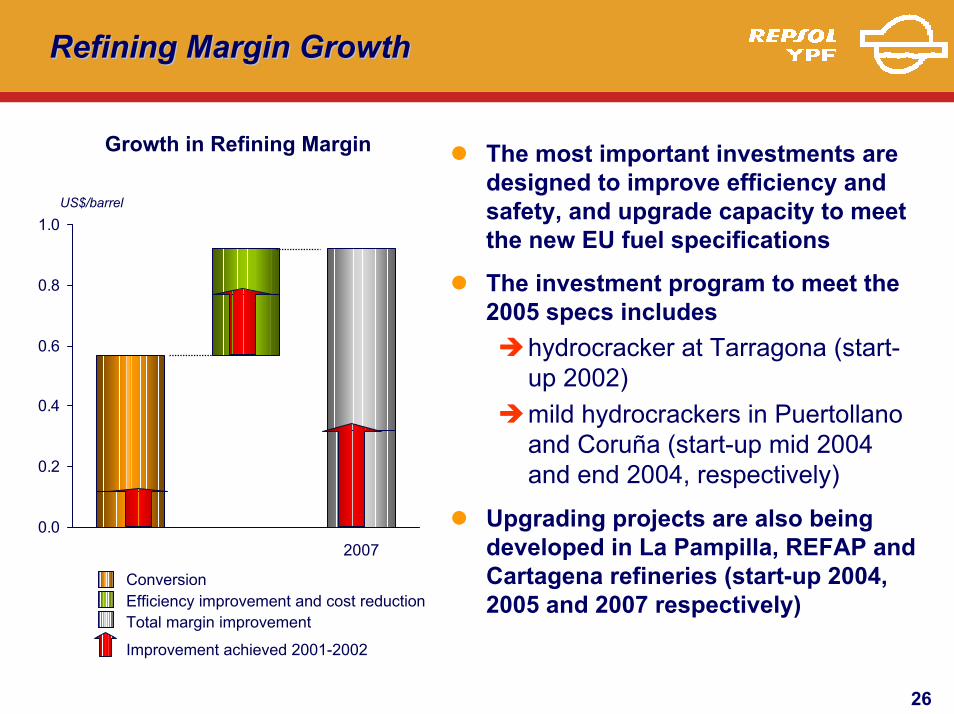
Refining Margin Growth Refining Margin Growth
The most important investments are designed to improve efficiency and safety, and upgrade capacity to meet the new EU fuel specifications
The investment program to meet the 2005 specs includes
hydrocracker at Tarragona (start-up 2002) mild hydrocrackers in Puertollanoand Coruña (start-up mid 2004 and end 2004, respectively)
Upgrading projects are also being developed in La Pampilla, REFAP and Cartagena refineries (start-up 2004, 2005 and 2007 respectively)
Growth in Refining Margin
0.0
0.2
0.4
0.6
0.8
1.0
2007
Efficiency improvement and cost reductionConversion
Total margin improvement
Improvement achieved 2001-2002
US$/barrel
27
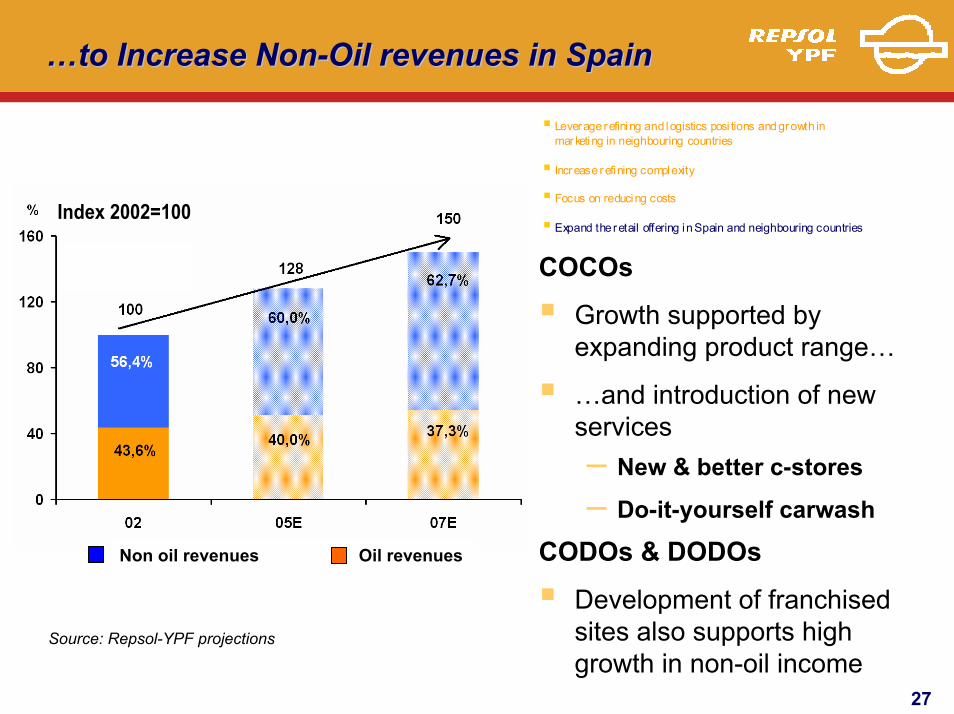
……to Increaseto Increase NonNon--Oil revenuesOil revenues in in SpainSpain
COCOs
Growth supported by expanding product range…
…and introduction of new services– New & better c-stores
– Do-it-yourself carwash
CODOs & DODOs
Development of franchised sites also supports high growth in non-oil income
Source: Repsol-YPF projections
Index 2002=100Index 2002=100
Non oil revenues Oil revenues
Leverage refining and logistics posi tions and growth in marketing in neighbouring countries
Increase refining complexity
Focus on reducing costs
Expand the retail offering in Spain and neighbouring countries
28
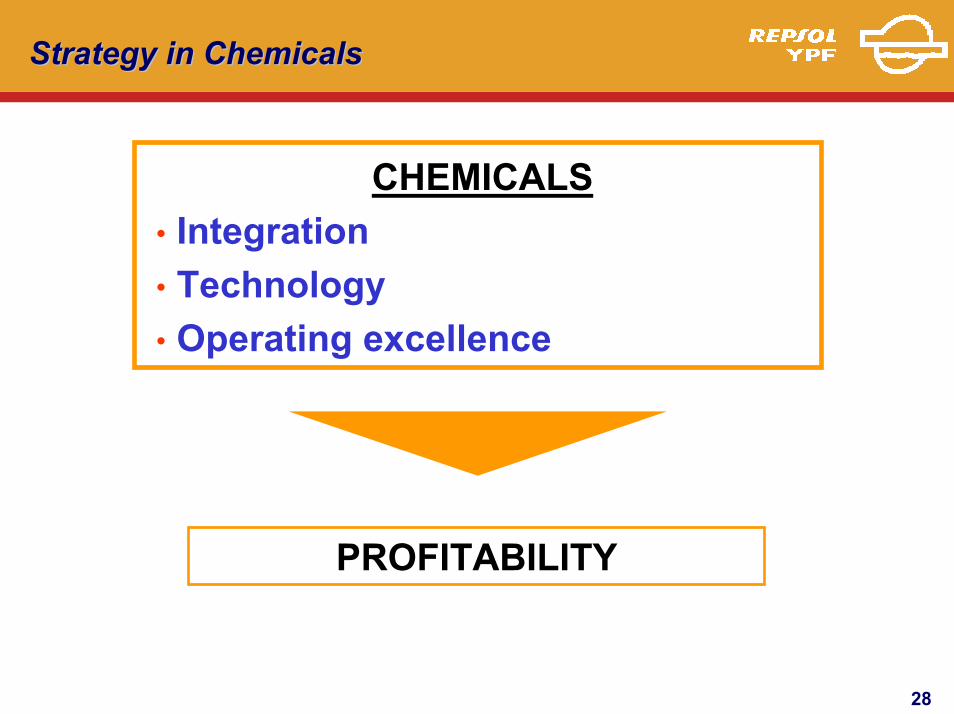
Strategy in ChemicalsStrategy in Chemicals
CHEMICALS• Integration• Technology• Operating excellence
PROFITABILITY
29
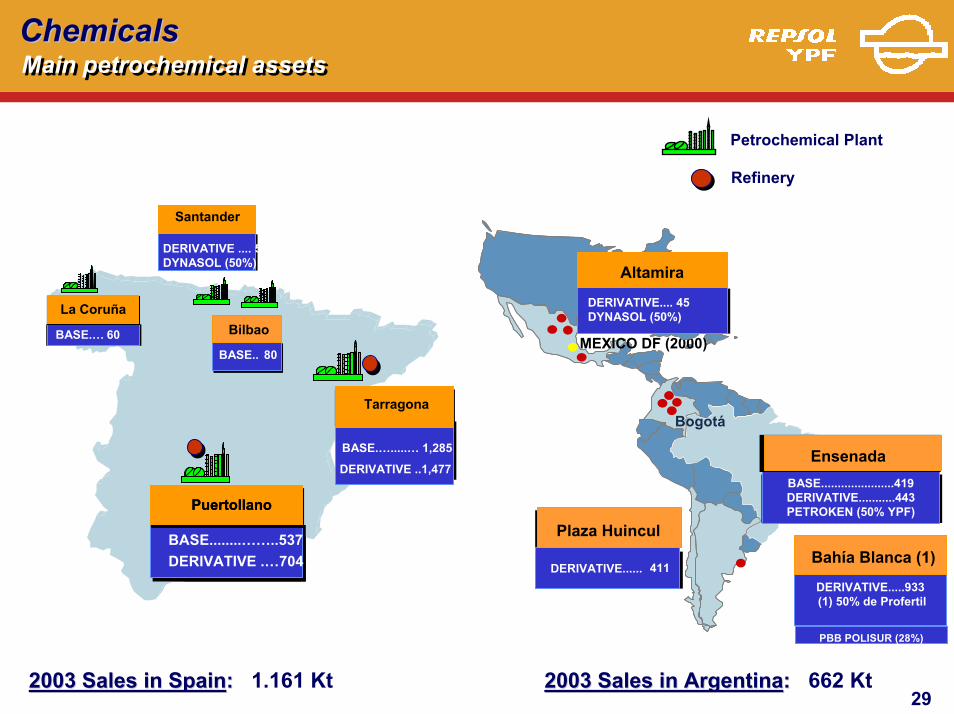
ChemicalsChemicalsMain petrochemical assetsMain petrochemical assets
Petrochemical Plant
Refinery
BASE.…60BASE.…60BASE.. 80BASE.. 80BilbaoBilbaoBilbao
BASE........……..542DERIVATIVE .…674BASE........……..542DERIVATIVE .…674
PuertollanoPuertollanoPuertollano
La CoruñaLa La CoruñaCoruña
BASE.….........… 945
TarragonaTarragonaTarragona
BASE.…60BASE.… 60
BASE.. 80Bilbao
BASE.. 80
Bilbao
BASE........……..542DERIVATIVE .…674BASE........……..537DERIVATIVE .…704
PuertollanoPuertollanoPuertollano
La CoruñaLa Coruña
BASE.….....… 1,285DERIVATIVE ..1,477
TarragonaTarragona
Santander
DERIVATIVE .... 54DYNASOL (50%)
.…
Bogotá
Buenos Aires
MEXICO DF (2000)
DERIVATIVE...... 411
Plaza Huincul
DERIVATIVE.....933(1) 50% de Profertil
Bahía Blanca (1)
PBB POLISUR (28%)
Río de Janeiro
BASE......................419 DERIVATIVE...........443PETROKEN (50% YPF)
Ensenada
Altamira
DERIVATIVE.... 45DYNASOL (50%)
20032003 SalesSales in Spainin Spain: : 1.161 Kt 20032003 SalesSales in Argentinain Argentina: : 662 Kt
30
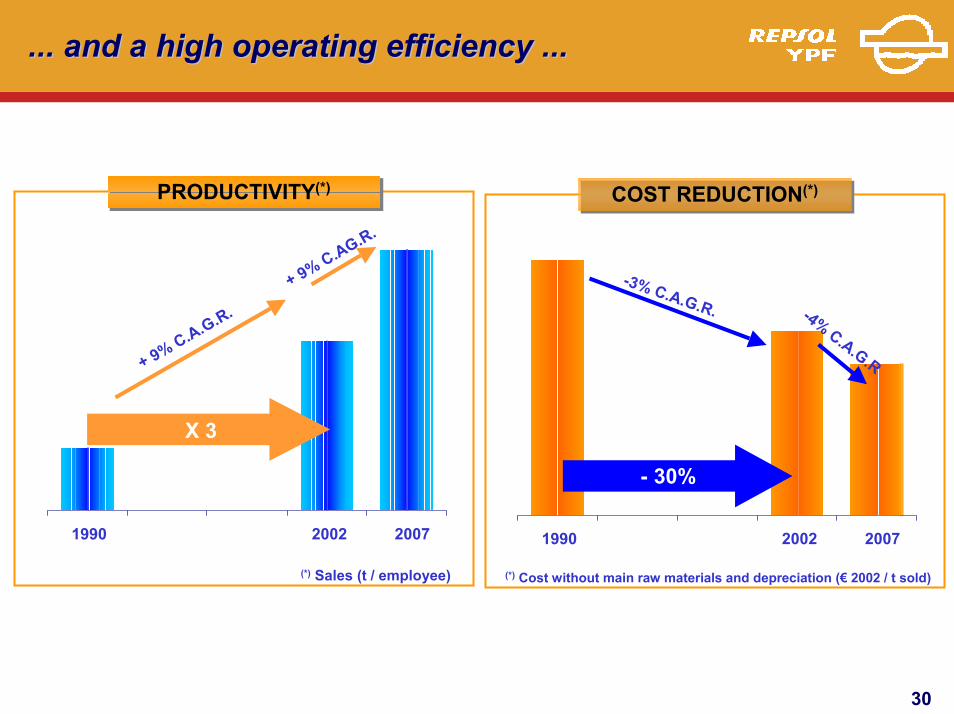
... and a high operating efficiency ...... and a high operating efficiency ...
PRODUCTIVITY(*)PRODUCTIVITY(*)
(*) Sales (t / employee)
X 3
+ 9% C.A.G.R.
1990 2002 2007
+ 9% C.AG.R.
COST REDUCTION(*)COST REDUCTION(*)
(*) Cost without main raw materials and depreciation (€ 2002 / t sold)
- 30%
-3% C.A.G.R. -4% C.A.G.R
1990 2002 2007
31
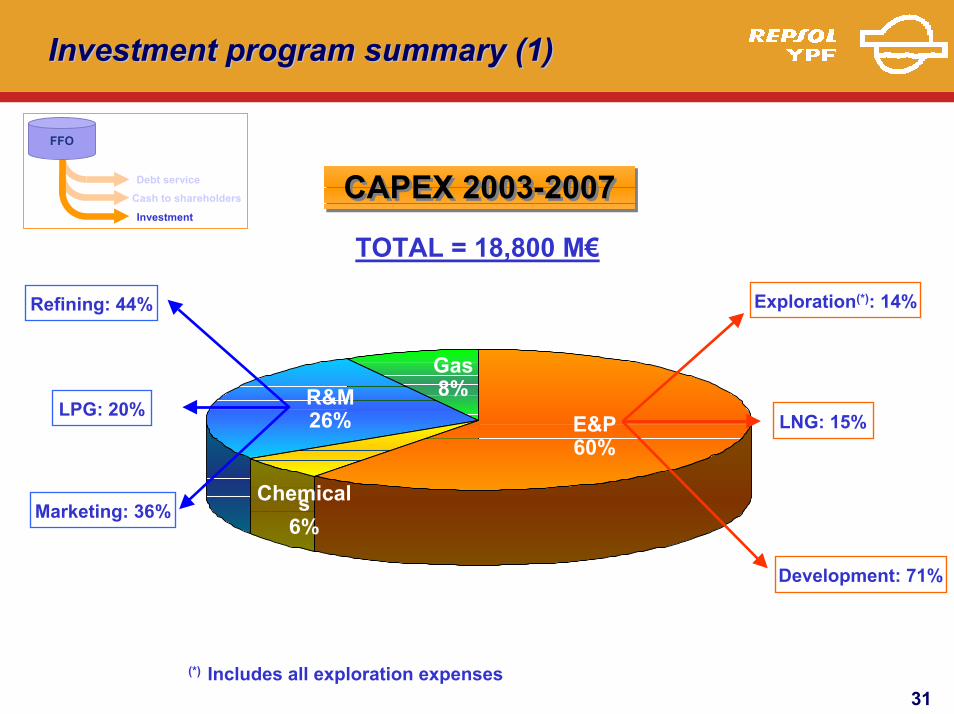
Investment program summaryInvestment program summary (1)(1)
Marketing: 36%
TOTAL = 18,800 M€
E&P60%
Chemicals6%
FFO
Debt service
Investment
Cash to shareholders
Gas8%R&M
26%
Exploration(*): 14%
Development: 71%
LNG: 15%
Refining: 44%
LPG: 20%
(*) Includes all exploration expenses
CAPEX 2003-2007CAPEX 2003-2007
32
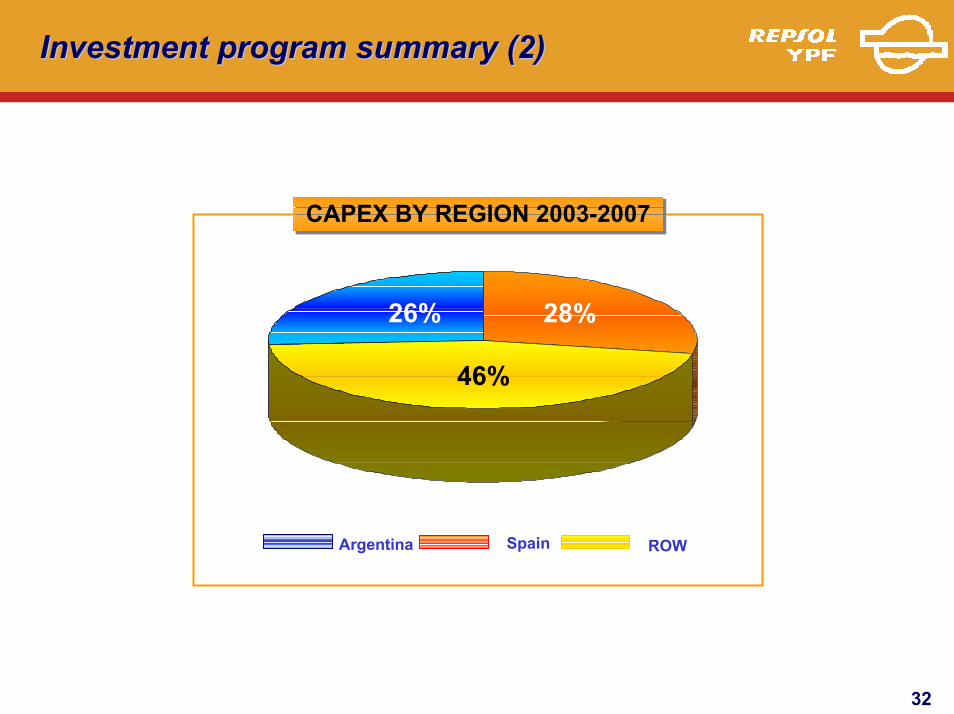
Investment program summaryInvestment program summary (2)(2)
26%
46%
CAPEX BY REGION 2003-2007CAPEX BY REGION 2003-2007
28%
Argentina Spain ROW
33
ConclusionConclusion
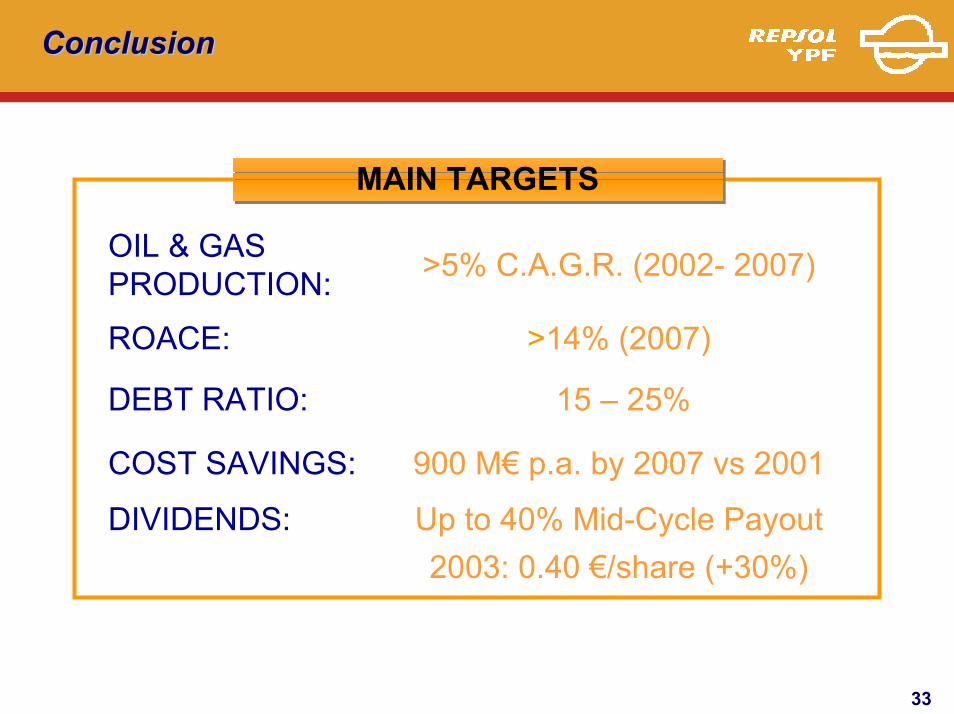
MAIN TARGETSMAIN TARGETS
Up to 40% Mid-Cycle PayoutDIVIDENDS:2003: 0.40 €/share (+30%)
900 M€ p.a. by 2007 vs 2001
15 – 25%DEBT RATIO:
COST SAVINGS:
>14% (2007)ROACE:
>5% C.A.G.R. (2002- 2007)OIL & GAS PRODUCTION:
34
NATURAL GAS MARKET IN ARGENTINA
35
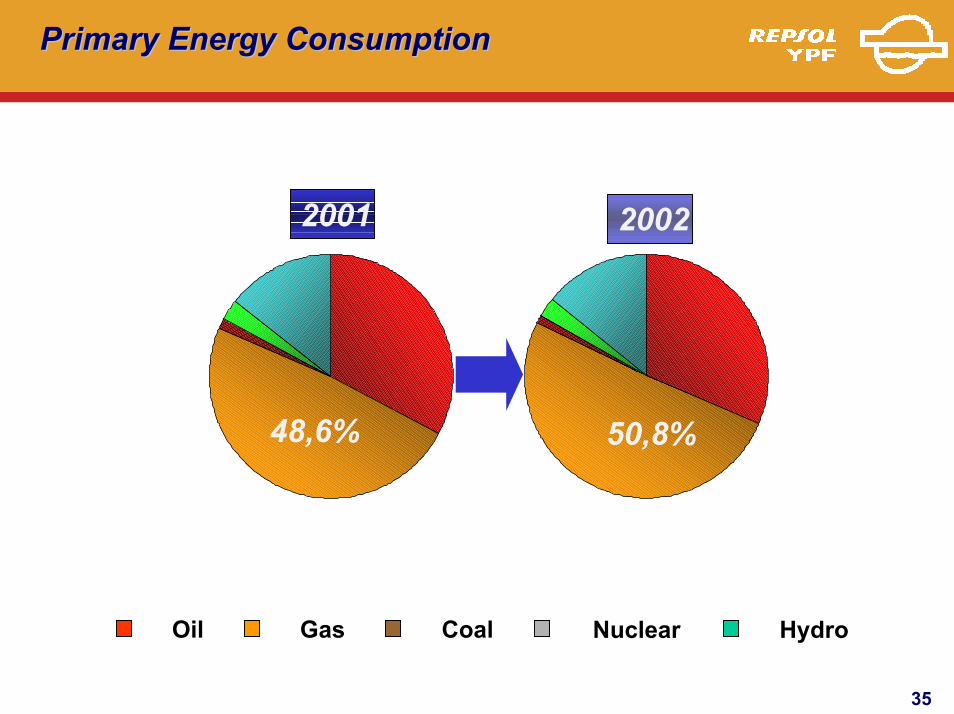
Primary Energy ConsumptionPrimary Energy Consumption
48,6% 50,8%
2001 2002
Oil Gas Coal Nuclear Hydro
36
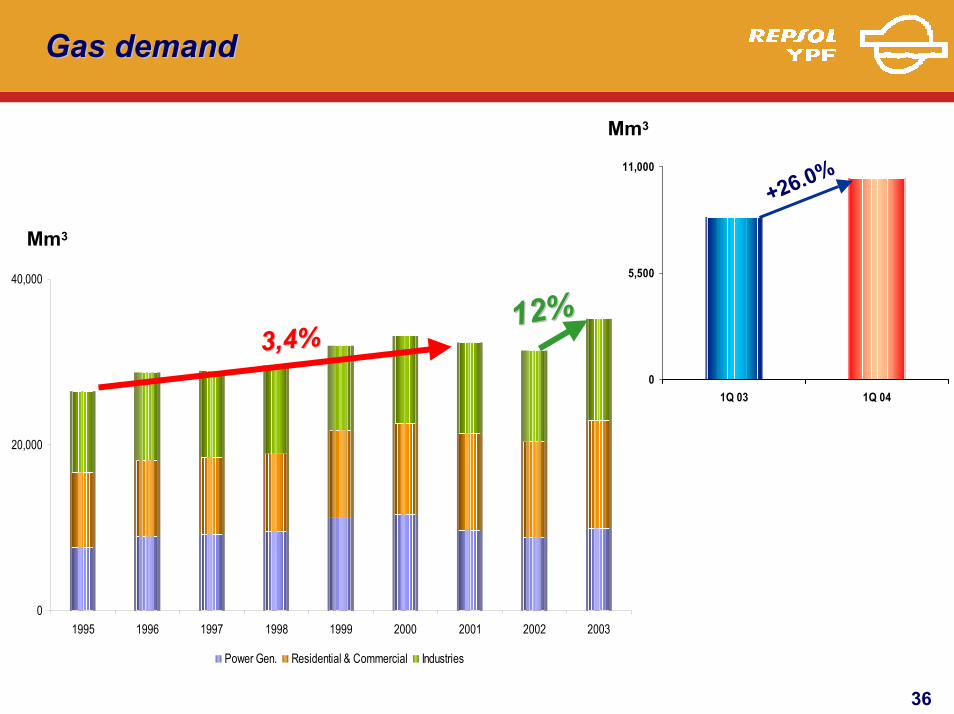
Gas demandGas demand
0
5,500
11,000
1Q 03 1Q 04
+26.0%
12%12%3,4%3,4%
0
20,000
40,000
1995 1996 1997 1998 1999 2000 2001 2002 2003
Power Gen. Residential & Commercial Industries
Mm3
Mm3
37
Increase in Gas demandIncrease in Gas demand
• Higher conversion to gas in the industrial sector
• CNG conversion for vehicles
• Increase demand by utilities
Increase in gas consumption:0.8 Bscf/d
Increase in gas consumption:0.8 Bscf/d
38
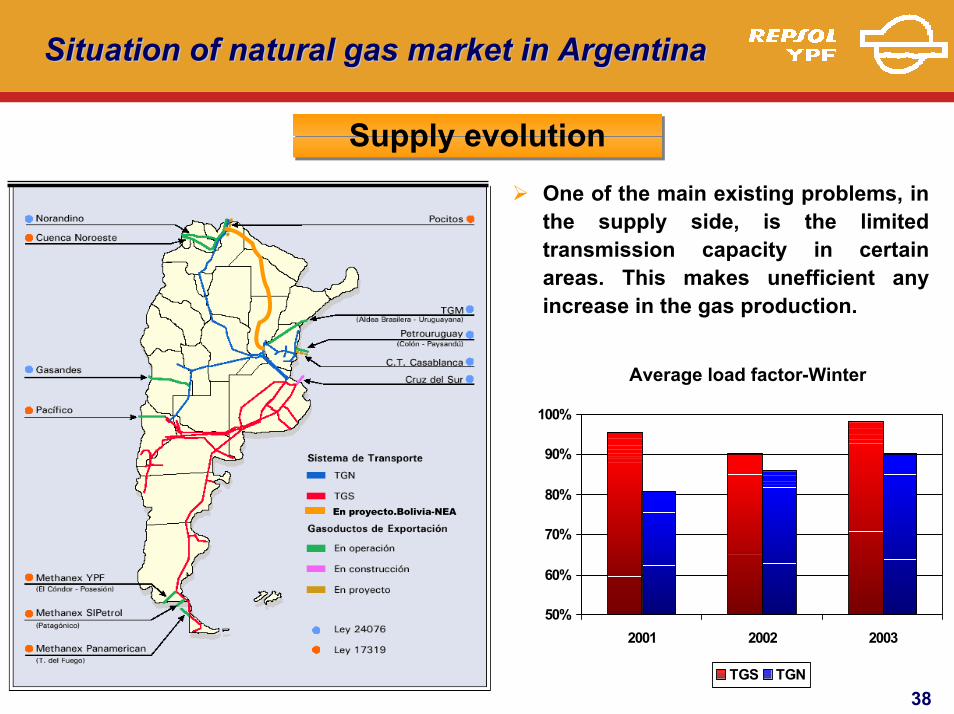
Situation of natural gas market in ArgentinaSituation of natural gas market in Argentina
One of the main existing problems, in the supply side, is the limited transmission capacity in certain areas. This makes unefficient any increase in the gas production.
En proyecto.Bolivia-NEA
Capacidad utilizada invierno
50%
60%
70%
80%
90%
100%
2001 2002 2003
TGS TGN
Supply evolutionSupply evolution
Average load factor-Winter
39
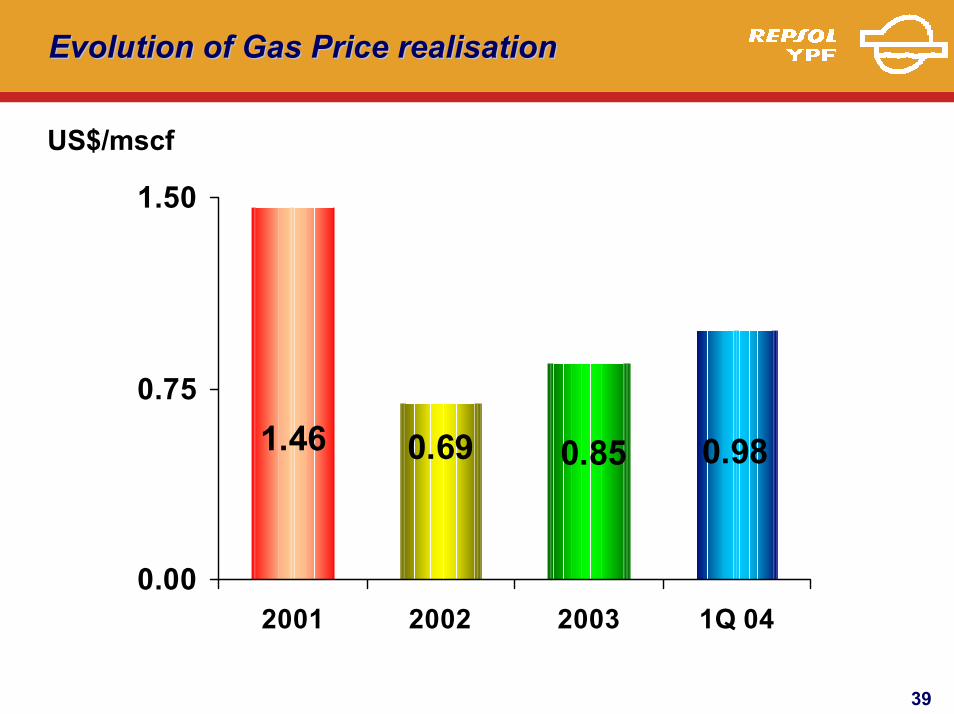
Evolution of Gas Price realisationEvolution of Gas Price realisation
0.980.851.46 0.69
0.00
0.75
1.50
2001 2002 2003 1Q 04
US$/mscf
40
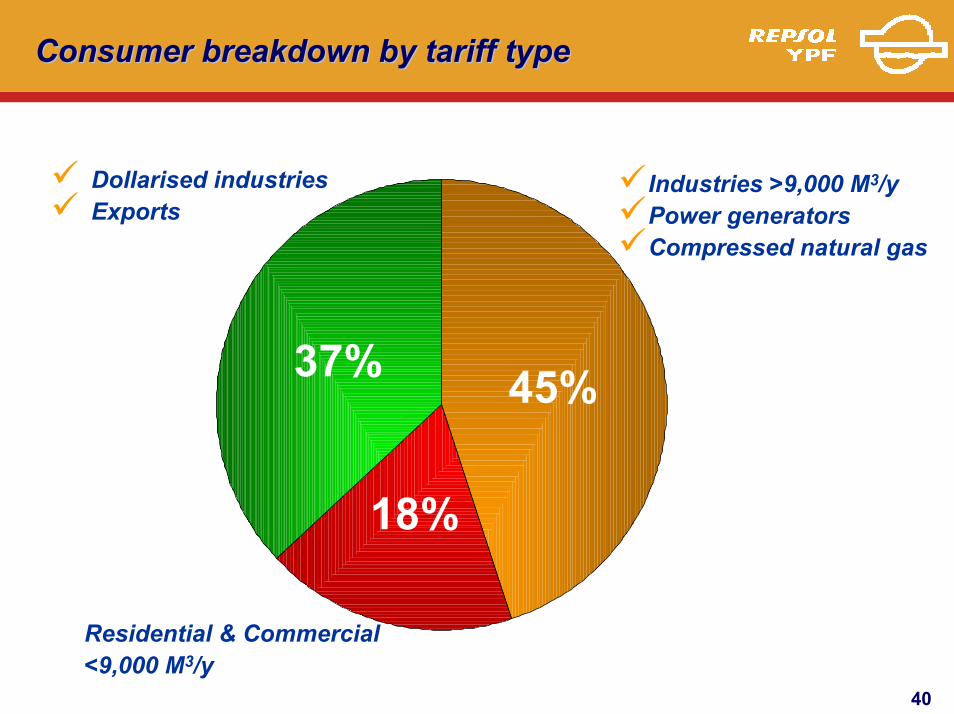
Consumer breakdown by tariff typeConsumer breakdown by tariff type
45%
18%
37%
Industries >9,000 M3/yPower generators Compressed natural gas
Dollarised industriesExports
Residential & Commercial<9,000 M3/y
41
Correcting the distortions in the marketCorrecting the distortions in the market
• Progressive liberalization of the market for:
IndustriesPower generators Compressed natural gas
• Spot market for gas will be created
• Obligation to release transportation capacity
• Prices will be risen in 4 steps
42
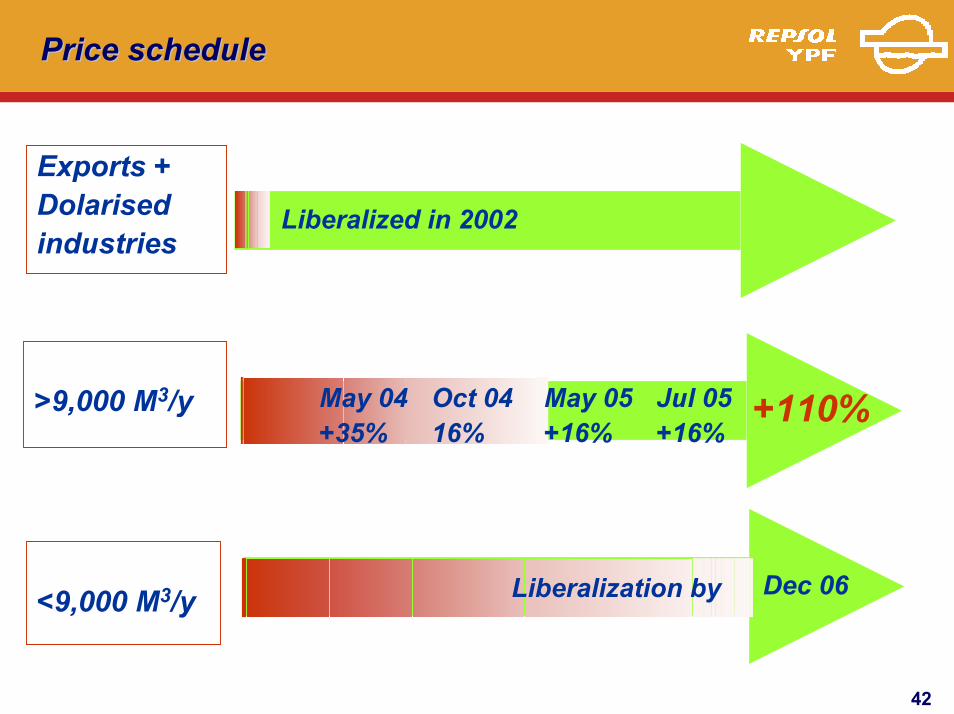
Price schedule
Dec 06
Price schedule
Exports +Dolarisedindustries
Liberalized in 2002
>9,000 M3/y Jul 05+16%
May 04+35%
Oct 0416%
May 05+16%
+110%
Liberalization by<9,000 M3/y
43
Medium term outlookMedium term outlook
• Moving in the right direction of gas liberalization
• Bolivia will accelerate its monetization of gas reserves
• Prices will be set according to market forces
• Argentina, Brazil and Bolivia will become interlinked markets
• Bolivia will be long run marginal supplier
44
RESULTS
45
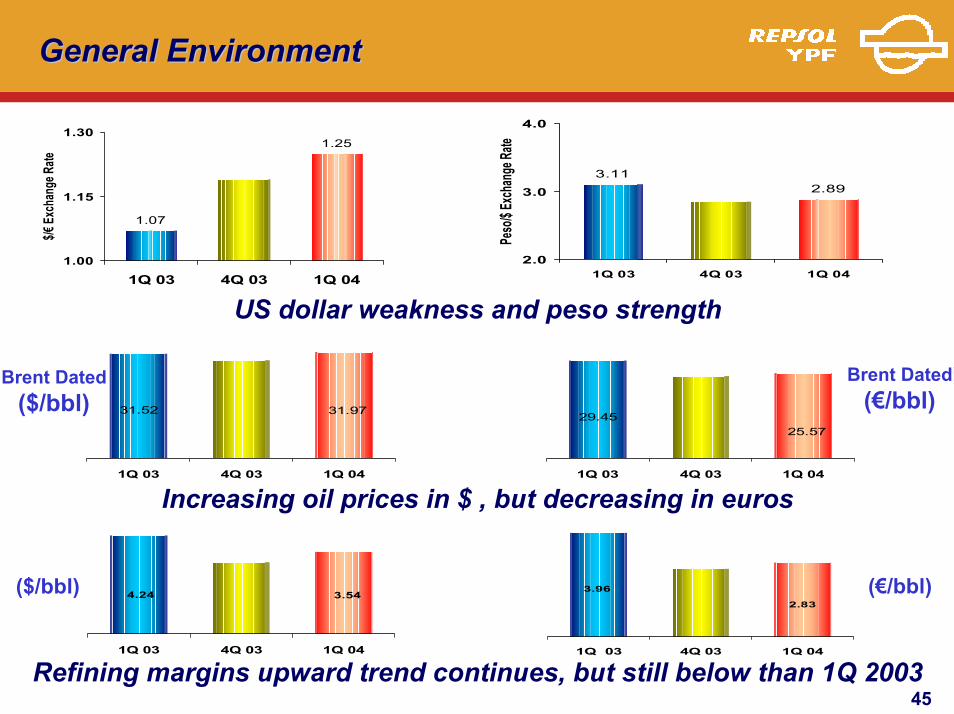
General EnvironmentGeneral Environment
US dollar weakness and peso strength
31.9731.52
1Q 03 4Q 03 1Q 04
3.544.24
1Q 03 4Q 03 1Q 04
Refining margins upward trend continues, but still below than 1Q 2003
1.25
1.07
1.00
1.15
1.30
1Q 03 4Q 03 1Q 04
$/€ Ex
chan
ge Ra
te
Increasing oil prices in $ , but decreasing in euros
2.83
3.96
1Q 03 4Q 03 1Q 04
(€/bbl)
Brent Dated($/bbl)
Brent Dated(€/bbl)
($/bbl)
2.893.11
2.0
3.0
4.0
1Q 03 4Q 03 1Q 04
Peso
/$ Exc
hang
e Rate
25.5729.45
1Q 03 4Q 03 1Q 04
46
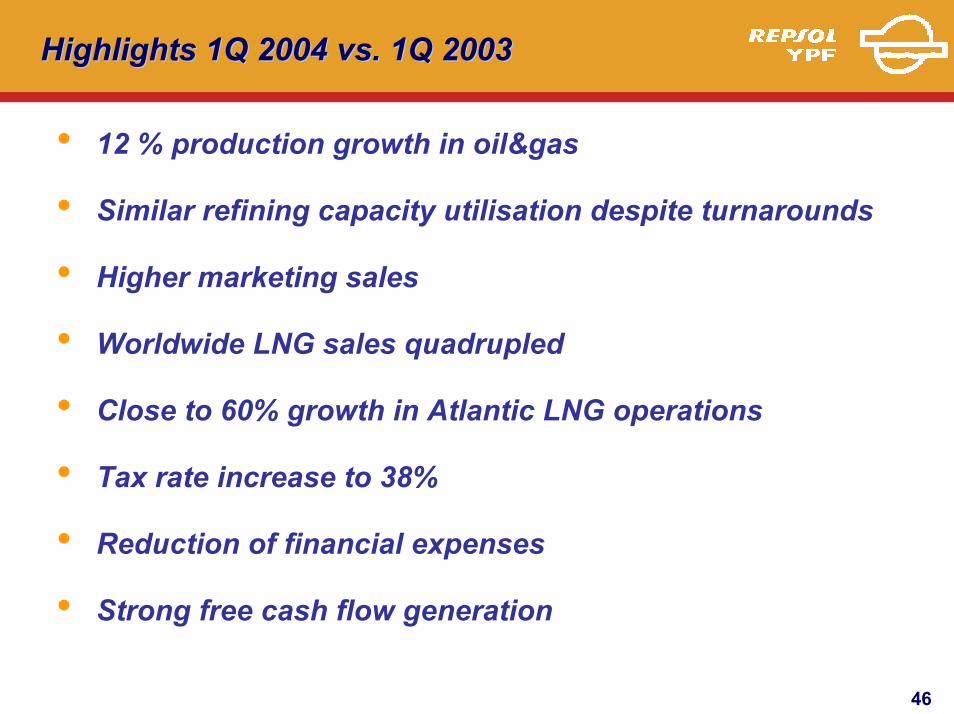
Highlights 1Q 2004 vs. 1Q 2003 Highlights 1Q 2004 vs. 1Q 2003
• 12 % production growth in oil&gas
• Similar refining capacity utilisation despite turnarounds
• Higher marketing sales
• Worldwide LNG sales quadrupled
• Close to 60% growth in Atlantic LNG operations
• Tax rate increase to 38%
• Reduction of financial expenses
• Strong free cash flow generation
47
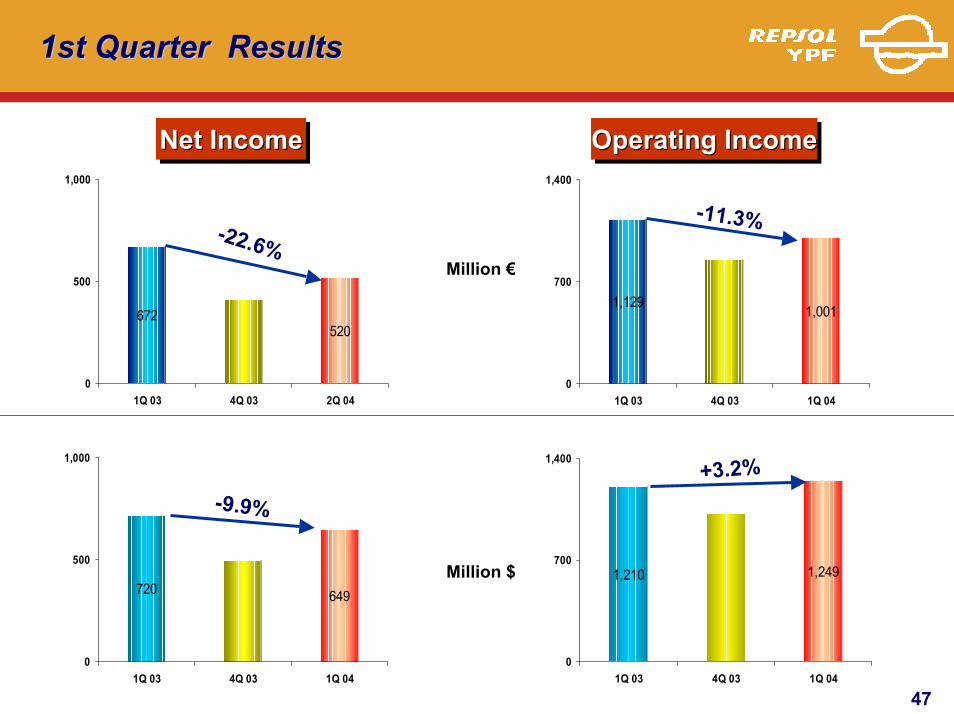
1st Quarter Results1st Quarter Results
Net IncomeNNet
Million €
Operating IncomeOperatingOperating IIncomencomeet IIncomencome
672520
0
500
1,000
1Q 03 4Q 03 2Q 04
-22.6%
1,129 1,001
0
700
1,400
1Q 03 4Q 03 1Q 04
-11.3%
720 649
0
500
1,000
1Q 03 4Q 03 1Q 04
-9.9%
1,210 1,249
0
700
1,400
1Q 03 4Q 03 1Q 04
+3.2%
Million $
48
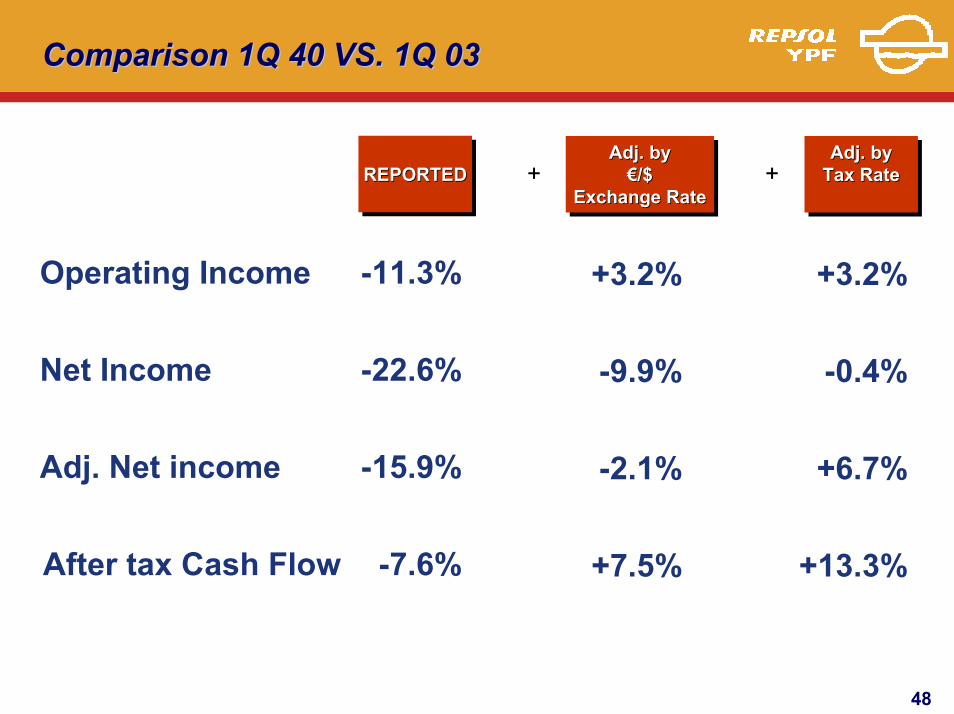
Comparison Comparison 1Q 40 VS. 1Q 031Q 40 VS. 1Q 03
After tax Cash Flow
REPORTEDREPORTEDREPORTED
-11.3%
-22.6%
-15.9%
-7.6%
Operating Income
Net Income
Adj. Net income
+3.2%
-0.4%
+6.7%
+13.3%
Adj. byTax RateAdj. byAdj. by
Tax RateTax RateAdj. by
€/$Exchange Rate
Adj. byAdj. by€/$€/$
Exchange RateExchange Rate+ +
+3.2%
-9.9%
-2.1%
+7.5%
49
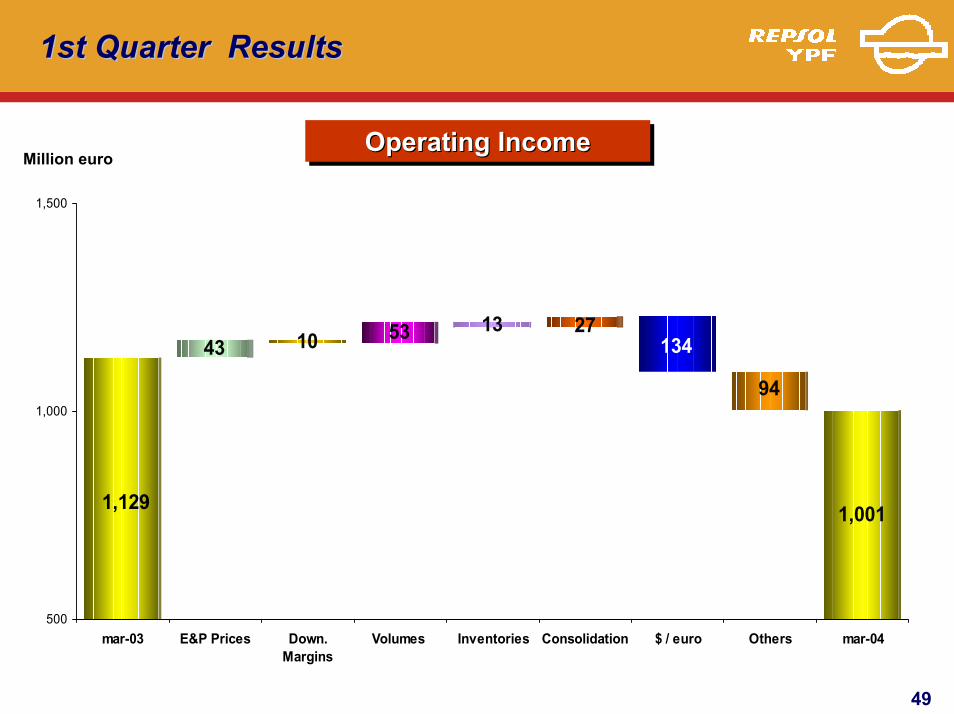
1st Quarter Results1st Quarter Results
10 53 13
1,0011,129
13427
94
43
500
1,000
1,500
mar-03 E&P Prices Down.Margins
Volumes Inventories Consolidation $ / euro Others mar-04
Operating IncomeOperating IncomeOperating IncomeMillion euro
50
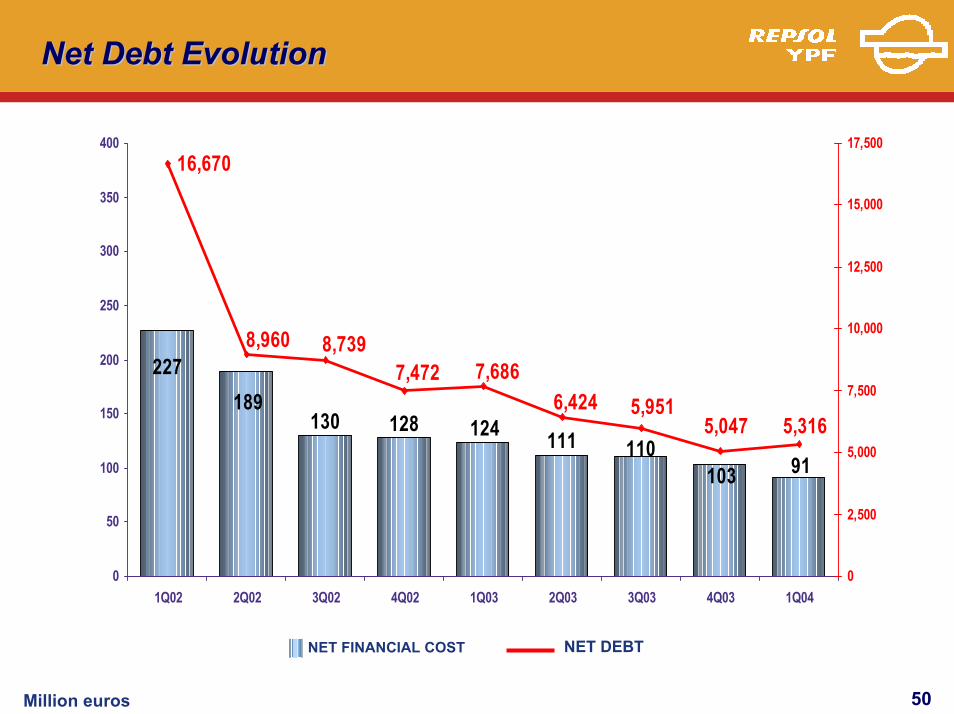
Net Debt EvolutionNet Debt Evolution
130 128 124 11191103
110
189227
16,670
5,047 5,3165,9516,424
7,6867,4728,7398,960
0
50
100
150
200
250
300
350
400
1Q02 2Q02 3Q02 4Q02 1Q03 2Q03 3Q03 4Q03 1Q040
2,500
5,000
7,500
10,000
12,500
15,000
17,500
NET FINANCIAL COST NET DEBT
Million euros
51
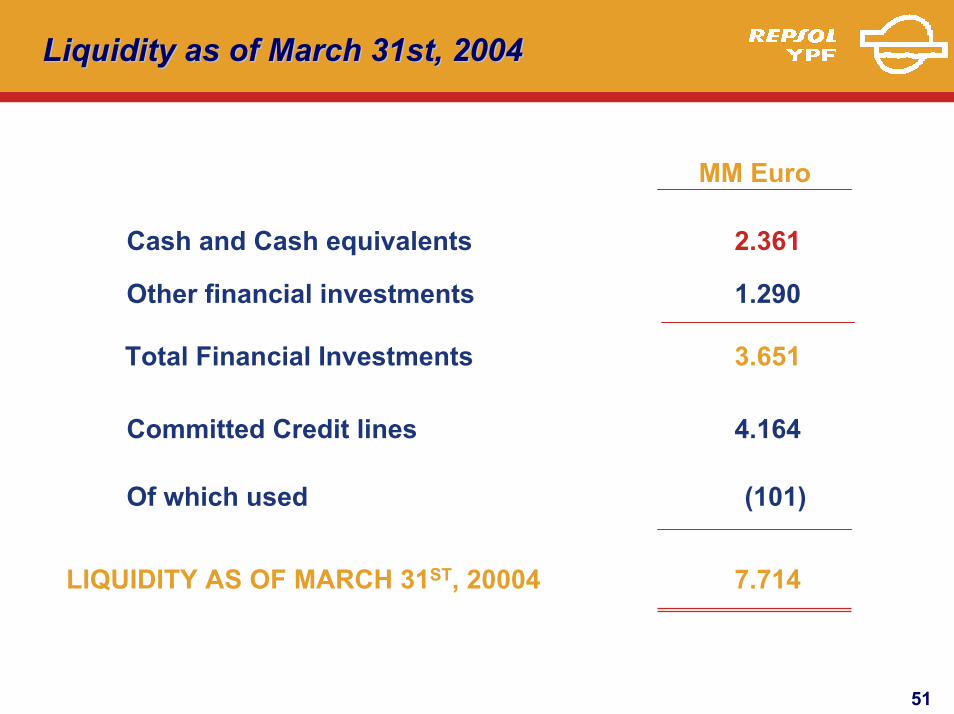
Liquidity as of March 31st, 2004Liquidity as of March 31st, 2004
MM Euro
Of which used
Committed Credit lines
LIQUIDITY AS OF MARCH 31ST, 20004
2.361
(101)
4.164
Cash and Cash equivalents
Other financial investments 1.290
3.651Total Financial Investments
7.714
52
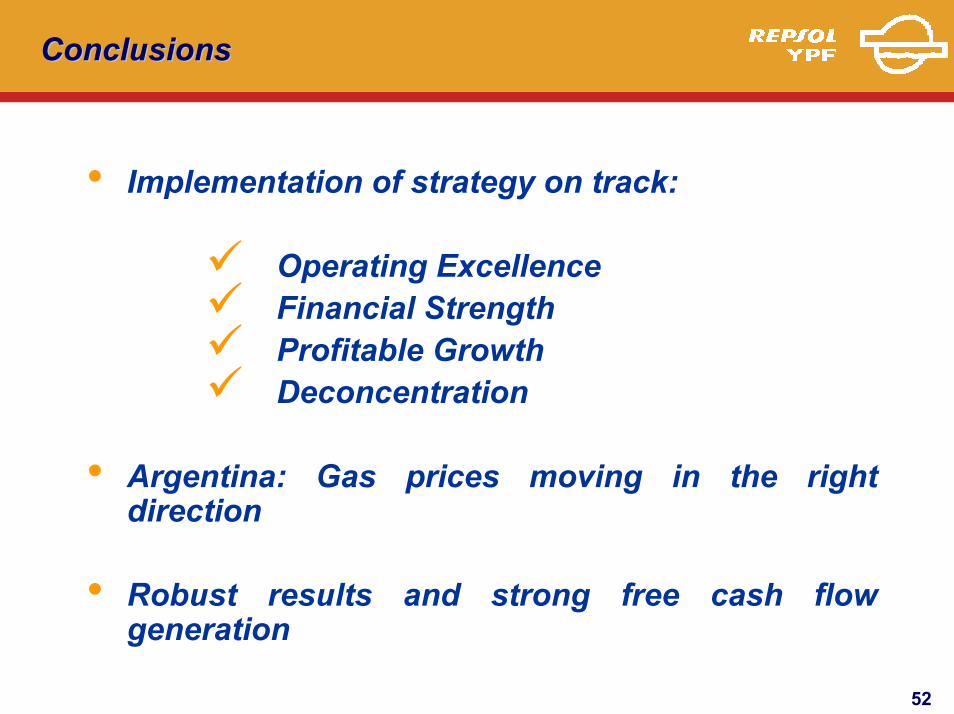
ConclusionsConclusions
• Implementation of strategy on track:
Operating ExcellenceFinancial StrengthProfitable GrowthDeconcentration
• Argentina: Gas prices moving in the right direction
• Robust results and strong free cash flow generation
Investor Relations
USA 410 Park Avenue, Suite 440New York 10022Tlf: +1 212 588 1087Fax: +1 212 355 0910
SpainPº Castellana 278-28028046 Madrid (Spain)
Tlf: 34 913 48 55 48Fax: 34 913 48 87 77
E-mail: [email protected]
Website: www.repsolypf.com