Embed Size (px)
Citation preview
CBIS Global Funds plc an umbrella fund with segregated liability between sub-funds Annual Report and Audited Financial Statements For the financial year ended 31 December 2018
CBIS Global Funds plc
1
CONTENTS PAGE
DIRECTORS AND OTHER INFORMATION………………………………………………………... 2
BACKGROUND TO THE COMPANY………………………………………………………………. 4
INVESTMENT MANAGER’S REPORT……………………………………………………………... 6
DIRECTORS’ REPORT……………………………………………………………………………….. 10
REPORT FROM THE DEPOSITARY TO THE SHAREHOLDERS………………………………… 13
INDEPENDENT AUDITORS’ REPORT TO THE MEMBERS OF CBIS GLOBAL FUNDS PLC... 14
STATEMENT OF FINANCIAL POSITION………………………………………………………….. 17
STATEMENT OF COMPREHENSIVE INCOME…………………………………………………… 19 STATEMENT OF CHANGES IN NET ASSETS ATTRIBUTABLE TO HOLDERS OF REDEEMABLE PARTICIPATING SHARES………………………………………………………... 21
NOTES TO THE FINANCIAL STATEMENTS……………………………………………………… 23
PORTFOLIO OF INVESTMENTS……………………………………………………………………. 48
SUPPLEMENTARY INFORMATION ON THE PORTFOLIO OF INVESTMENTS (unaudited)…. 73
STATEMENT OF CHANGES IN COMPOSITION OF PORTFOLIO (unaudited).…………………. 75
APPENDIX 1 – UCITS V REMUNERATION DISCLOSURE (unaudited)……….…………………. 81
CBIS Global Funds plc
2
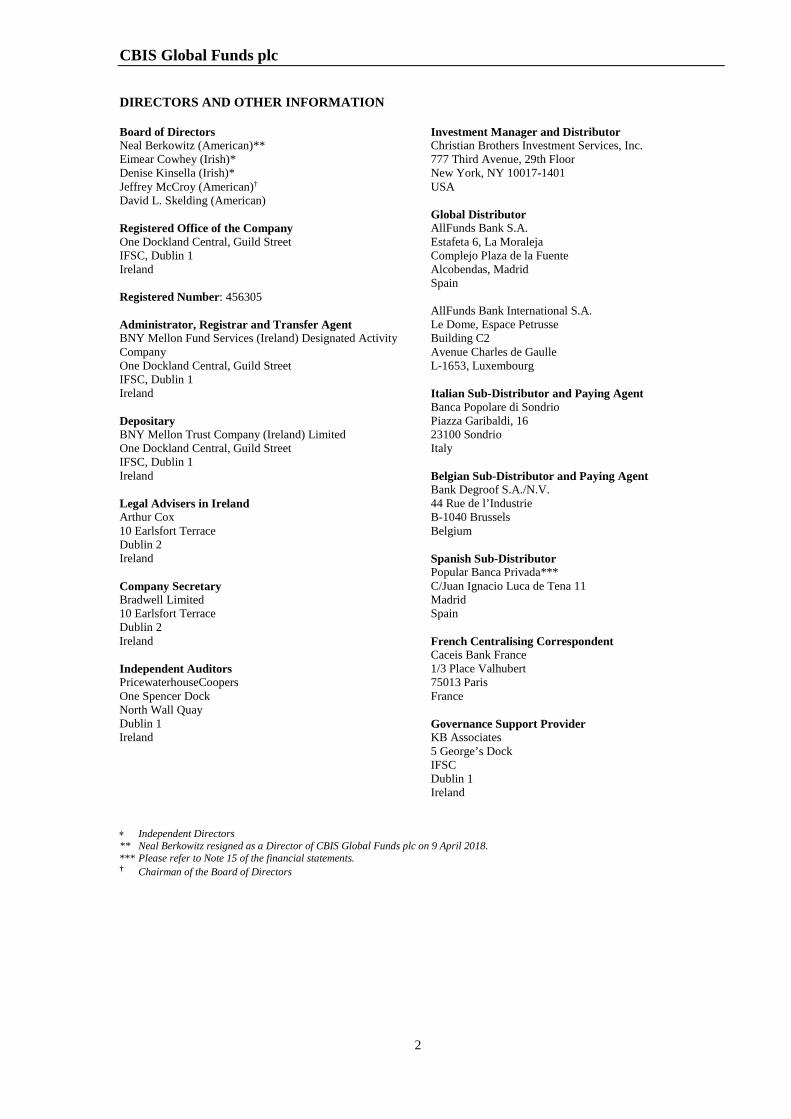
DIRECTORS AND OTHER INFORMATION Board of Directors Neal Berkowitz (American)** Eimear Cowhey (Irish)* Denise Kinsella (Irish)* Jeffrey McCroy (American)† David L. Skelding (American) Registered Office of the Company One Dockland Central, Guild Street IFSC, Dublin 1 Ireland Registered Number: 456305 Administrator, Registrar and Transfer Agent BNY Mellon Fund Services (Ireland) Designated Activity Company One Dockland Central, Guild Street IFSC, Dublin 1 Ireland Depositary BNY Mellon Trust Company (Ireland) Limited One Dockland Central, Guild Street IFSC, Dublin 1 Ireland Legal Advisers in Ireland Arthur Cox 10 Earlsfort Terrace Dublin 2 Ireland Company Secretary Bradwell Limited 10 Earlsfort Terrace Dublin 2 Ireland Independent Auditors PricewaterhouseCoopers One Spencer Dock North Wall Quay Dublin 1 Ireland
Investment Manager and Distributor Christian Brothers Investment Services, Inc. 777 Third Avenue, 29th Floor New York, NY 10017-1401 USA Global Distributor AllFunds Bank S.A. Estafeta 6, La Moraleja Complejo Plaza de la Fuente Alcobendas, Madrid Spain AllFunds Bank International S.A. Le Dome, Espace Petrusse Building C2 Avenue Charles de Gaulle L-1653, Luxembourg Italian Sub-Distributor and Paying Agent Banca Popolare di Sondrio Piazza Garibaldi, 16 23100 Sondrio Italy Belgian Sub-Distributor and Paying Agent Bank Degroof S.A./N.V. 44 Rue de l’Industrie B-1040 Brussels Belgium Spanish Sub-Distributor Popular Banca Privada*** C/Juan Ignacio Luca de Tena 11 Madrid Spain French Centralising Correspondent Caceis Bank France 1/3 Place Valhubert 75013 Paris France Governance Support Provider KB Associates 5 George’s Dock IFSC Dublin 1 Ireland
∗ Independent Directors ** Neal Berkowitz resigned as a Director of CBIS Global Funds plc on 9 April 2018. *** Please refer to Note 15 of the financial statements. † Chairman of the Board of Directors
CBIS Global Funds plc
3
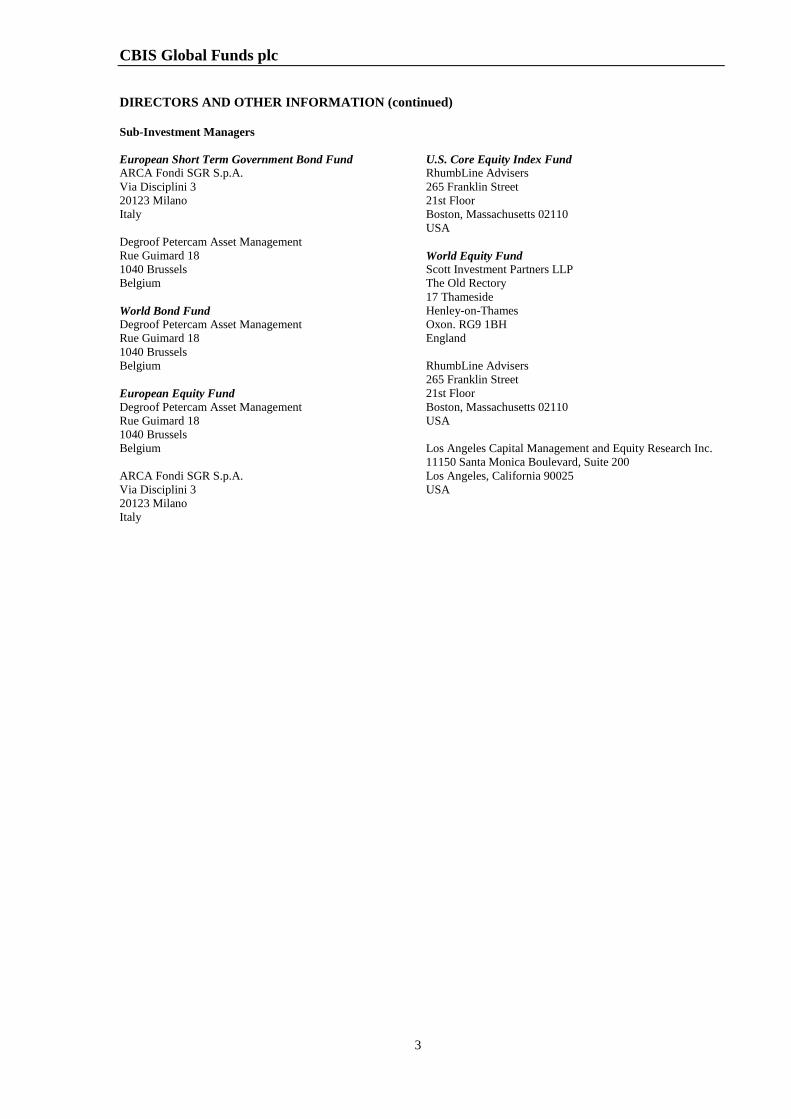
DIRECTORS AND OTHER INFORMATION (continued) Sub-Investment Managers European Short Term Government Bond Fund ARCA Fondi SGR S.p.A. Via Disciplini 3 20123 Milano Italy Degroof Petercam Asset Management Rue Guimard 18 1040 Brussels Belgium World Bond Fund Degroof Petercam Asset Management Rue Guimard 18 1040 Brussels Belgium European Equity Fund Degroof Petercam Asset Management Rue Guimard 18 1040 Brussels Belgium ARCA Fondi SGR S.p.A. Via Disciplini 3 20123 Milano Italy
U.S. Core Equity Index Fund RhumbLine Advisers 265 Franklin Street 21st Floor Boston, Massachusetts 02110 USA World Equity Fund Scott Investment Partners LLP The Old Rectory 17 Thameside Henley-on-Thames Oxon. RG9 1BH England RhumbLine Advisers 265 Franklin Street 21st Floor Boston, Massachusetts 02110 USA Los Angeles Capital Management and Equity Research Inc. 11150 Santa Monica Boulevard, Suite 200 Los Angeles, California 90025 USA
CBIS Global Funds plc
4
BACKGROUND TO THE COMPANY The following information is derived from, and should be read in conjunction with, the full text and definitions section of the Company’s prospectus (the “Prospectus”). Structure CBIS Global Funds plc (the “Company”) is an umbrella fund with segregated liability between sub-funds established as an investment company with variable capital incorporated with limited liability in Ireland on 18 April 2008. The Company is regulated by the Central Bank of Ireland (the “Central Bank”) pursuant to the European Communities (Undertakings for Collective Investment in Transferable Securities) Regulations, 2011, as amended (the “UCITS Regulations”) and the Central Bank of Ireland (Supervision and Enforcement) Act 2013 (Section 48(1)) (Undertakings for Collective Investment in Transferable Securities) Regulations 2015, as amended (the “Central Bank UCITS Regulations”) and was authorised by the Central Bank on 16 June 2008. The Company currently has the following sub-funds (each a “Fund” and collectively the “Funds”) as follows: Fund Name Date of approval Launch Date by Central Bank
European Short Term Government Bond Fund 17 April 2009 5 May 2009 European Equity Fund 16 June 2008 9 July 2010 World Bond Fund 16 June 2008 9 July 2010 World Equity Fund 19 June 2014 20 February 2015 U.S. Core Equity Index Fund 19 June 2014 Not yet launched A Fund may consist of one or more classes of shares. A separate pool of assets will not be maintained for each class within a Fund. Further classes of shares may be issued on advance notification to, and in accordance with the requirements of, the Central Bank. Investment objectives Each Fund aims to achieve its investment objective, as set out below, while spreading investment risks through investment in transferable securities and liquid financial assets in accordance with the UCITS Regulations. The allocation of the assets of a Fund between the sub-investment managers of that Fund is at the sole discretion of Christian Brothers Investment Services, Inc. (the “Investment Manager”) and the Investment Manager may from time to time, at its discretion, determine not to allocate any of the assets of the Fund to a sub-investment manager. In pursuing its investment objectives, each Fund shall adhere to the principles of ethical and socially responsible investing, as described in the Prospectus. European Short Term Government Bond Fund The investment objective of the European Short Term Government Bond Fund is to provide current income, consistent with preservation of capital through investment primarily in a diversified portfolio of high quality, Euro-denominated deposits and short term fixed-income securities, provided that not more than 50% of the net asset value of the Fund may be invested in Euro-denominated deposits. The sub-investment managers of the Fund are ARCA Fondi SGR S.p.A. and Degroof Petercam Asset Management SA. Since the launch of the Fund, the Investment Manager has allocated investment management of all of the assets of the Fund to ARCA Fondi SGR S.p.A. The functional currency of the Fund is Euro.
CBIS Global Funds plc
5
BACKGROUND TO THE COMPANY (continued) Investment objectives (continued) World Bond Fund The investment objective of the World Bond Fund is to seek to achieve sustainable income and modest capital appreciation through investment primarily in investment grade debt securities which may be sovereign, supranational, corporate, mortgage or securitised debt securities. The sub-investment manager of the Fund is Degroof Petercam Asset Management. The functional currency of the Fund is Euro. European Equity Fund The investment objective of the European Equity Fund is to seek to achieve capital appreciation through investment generally in the equity securities of European issuers with a market capitalisation greater than EUR 65 million. The investments of the Fund will be diversified with strict controls on the level of investment in any particular industry to maximise the impact of individual stock selection. The sub-investment managers of the Fund are ARCA Fondi SGR S.p.A. and Degroof Petercam Asset Management SA. Since the launch of the Fund the Investment Manager has allocated investment management of all of the assets of the Fund to Degroof Petercam Asset Management SA. The functional currency of the Fund is Euro. World Equity Fund The investment objective of the World Equity Fund is to seek to achieve capital appreciation and outperform its primary benchmark index, the MSCI All Country World Index, by combining a number of different yet complementary investment approaches employed by the sub-investment managers to invest in equity securities of medium to large capitalisation issuers on a worldwide basis while minimising downside risk by focusing on companies that exhibit a high internal rate of return and avoiding speculative investment. Generally, investments will be in companies with a market capitalisation of greater than EUR 0.35 billion and the Fund will be invested primarily in major developed markets. The sub-investment managers of the Fund are Scott Investment Partners LLP, RhumbLine Advisers and Los Angeles Capital Management and Equity Research Inc. Since the launch of the Fund the Investment Manager has allocated investment management of all of the assets of the Fund between Scott Investment Partners LLP and Los Angeles Capital Management and Equity Research Inc. The functional currency of the Fund is Euro. U.S. Core Equity Index Fund (not yet launched) The investment objective of the U.S. Core Equity Index Fund is to seek to replicate the price and yield performance of the S&P 500 Index, an index which emphasises large-capitalisation companies. The sub-investment manager of the Fund is RhumbLine Advisers. The functional currency of the Fund is US Dollar.
CBIS Global Funds plc
6
INVESTMENT MANAGER’S REPORT European Short Term Government Bond Fund (the “Fund”) Sub-Investment Managers: ARCA Fondi SGR S.p.A & Degroof Petercam Asset Management The European Central Bank (the “ECB”) ceased its bond buying program at the end of the year; however, the ECB plans to reinvest maturing securities over an extended period as they attempt to keep markets rates low due to signs of slowing economic growth. Subsequently, growth expectations in the Euro area were revised downward from 1.8% to 1.5% for 2019. Key indicators such as Euro-coin continued its decline from ~ 0.96 earlier this year to 0.42 at the end of December. The indicator continues to reflect the decline in business and consumer confidence across Europe and to some extent, reflects the tensions in European capital markets. Furthermore, the annual Eurozone core inflation, which excludes volatile prices of energy, food, alcohol & tobacco and at which the ECB reviews for its policy decisions, is likely to remain steady at 1%, unchanged from the prior month and in line with market consensus. 12 Month Review For the trailing twelve months, the Fund returned -0.56%, lagging the 80% Bloomberg Barclays Euro Aggregate Treasury Bond 1-3 Year Index/20% Bloomberg Barclays Euro Aggregate Corporate 1-3 Year Index return of -0.12%. The Fund’s duration was defensively positioned throughout the year (1.7 vs. 1.9), however rates declined, which caused a marginal drag on performance. Curve positioning was a minor negative. In addition, sector allocation was modestly negative due to the Fund’s overweight to Treasuries, which was supported by a corresponding underweight to corporates. For the period, security selection was the largest detractor from results (-6 bps) due to poor performance by 2-year Italian and French bonds. Portfolio Positioning and Outlook Given the low to negative levels of short-term interest rates across Europe, the Sub-Investment Manager remains cautious on portfolio positioning, particularly in adding to exposure in some of smaller European markets. The Fund continues to hold significant exposure to Italian and French bonds, with Italian exposure being the largest at 32% - an overweight by approximately 10% relative to the index. French bonds represent ~ 20% of the Fund’s exposure, an underweight relative to the index (~23%). Finally, the Sub-Investment Manager has increased corporate bond exposure from 15% to 17% as valuations improved towards the end of 2018. Top exposures are predominantly banking, automotive and communications sectors. Christian Brothers Investment Services, Inc.
February 2019
CBIS Global Funds plc
7
INVESTMENT MANAGER’S REPORT (continued) World Bond Fund (the “Fund”) Sub-Investment Manager: Degroof Petercam Asset Management 12 Month Review For 2018, the Fund returned -0.02% versus the Bloomberg Barclays Global Aggregate (EUR) benchmark’s (the "Benchmark") 3.78% return. The Fund lagged the benchmark for the year due in large part to the financial credit exposure and the overall credit spread widening throughout the year. Interest rate hedges also detracted versus a positive result on credit hedging. The exposure to hybrid corporate bonds was a major detractor. However, the Itraxx Europe CDS Crossover credit hedge, an index comprised of European sub investment grade credit default swaps, was partially offsetting. Nominal government bonds, exposure to inflation linked securities and investment grade corporate bonds contributed positively to overall performance during the year. Portfolio Positioning and Outlook The Sub-Investment Manager believes that the US yield curve holds value and therefore that global bond markets hold value. Their base case scenario is that US rates consolidate over 2019. In 10 years, they believe that the 2018 US 10-year Treasury high of 3.25% marked the upper band of the range. They expect the US Federal Reserve (the “Fed”) to be on a prolonged pause that would see US 10-year Treasuries fluctuating between 2.50% and 3.00% over 2019. That condition will open the possibility for German Bunds to converge and end the year between forwards and market consensus i.e. 40bp and 90bp respectively. Today with 10-year Bunds around 25bp the Sub-Investment Manager concludes that the forecasting character of this important reference rate has diminished in value. Effectively Germany has become the only risk-free yield curve in the world. The presence of a liquid interest rate derivative contract through the German Bund future only worsens this condition. It is important to realize that the Sub-Investment Manager’s base case centers around a gradual weakening of the US Dollar. The main drivers are stable central bank policy, widening budget deficits and overall US indebtedness. A US administration that does not instill confidence is the soft indicator that the US strength witnessed over the past 12 months might start waning. The Sub-Investment Manager believes that the current portfolio construction is well balanced to navigate current market conditions as well as more extreme risk scenarios. Security selection will be the focus for the foreseeable future. Christian Brothers Investment Services, Inc.
February 2019
CBIS Global Funds plc
8
INVESTMENT MANAGER’S REPORT (continued) European Equity Fund (the “Fund”) Sub-Investment Managers: ARCA Fondi SGR S.p.A & Degroof Petercam Asset Management 12 Month Review For the 12 months of 2018, the Fund returned -15.48% net of fees and trailed the MSCI Europe Index (the “Benchmark”) return of -10.0% by more than 500 basis points. A major portion of both the negative absolute return and the shortfall relative to the benchmark index occurred during the market turmoil in the fourth quarter. The Q4 fund return was -14.4% and the index return was -11.3%. Prior to the 2018 experience, the Fund had been performing almost consistently above the index return for the five-year period 2013 through 2017. But with the 2018 performance deficit, the trailing period returns relative to benchmark are now mostly negative. Before management fees, the Fund’s return was nearly identical to the benchmark in the first six months of 2018 but wound up the year trailing the index by nearly 400 basis points. Financial company stocks, which comprise 20% of the fund’s investments, declined in value by more than 20% in 2018. Other significantly sized market sectors, including industrials, consumer discretionary, information technology, and materials, also suffered valuation losses exceeding -20% for the year. The stock selection results in the five aforementioned sectors account for the fund’s entire negative excess return in 2018. The only significant positive for the period was the Sub-Investment Manager’s stock selection results in health care, where the composite return within the fund was +9.2% and contributed 80 bps of excess return. Quoting from the Sub-Investment Manager’s most recent quarterly report: “Markets heavily corrected in October, as negative factors accumulated. Concerns over China, input cost inflation or potentially rising rates shook investors’ confidence. Technical factors were also at play. Automatic selling from systematic strategies exacerbated the decline, while quarterly results were somewhat disappointing. In particular, companies missing estimates were severely punished, as markets seemed increasingly sensitive to fundamentals. Growth and momentum styles suffered from profit-taking, while defensive sectors benefited from the risk-off mood. Markets sank in December due to fears of a global recession and possible central bank policy mistakes. No market was spared, although emerging markets held up relatively well as the USD weakened a bit. Implied volatilities shot up, while bond yields (bunds, etc.) touched their yearly lows and the oil price lost another 10%. In Europe, utilities outperformed and barely budged. Materials held up relatively well thanks to their exposure to miners and emerging markets. The worst sectors were financials and real estate which lost momentum at the very end of the month. In terms of style, small-caps were hit the hardest, while the high dividend yielders outperformed once again. No wonder that over the entire year, the most defensive and highest dividend-paying sectors such as utilities and healthcare shined, while financials or cyclicals like consumer discretionary, materials and the smaller-cap style suffered the most.” Portfolio Positioning and Outlook The Fund holds 142 securities, encompassing large, mid and small cap stocks. The weighted average market cap of the portfolio is 45% below the benchmark index. Historically, excess returns can be contributed to small and mid-cap holdings. The overall P/E and P/B ratios for the portfolio are lower than the index, indicative of the Fund’s value tilt. While the value tilt has been a headwind for relative performance in recent years, we believe the fund is well positioned to reap the benefits when the inevitable market rotation away from growth oriented stocks occurs. Sector weights are nearly identical to the benchmark index by design. The manager targets excess return through a combination of quantitative analytical models and fundamental research to select superior stocks within the individual sectors. More than 30% of the holdings measured by market cap are in French domiciled companies; the index has 17.8%. At 21.6%, the Fund’s investments in UK companies is underweight the index by 5.5%. Italy is overweight by 3.7% and Germany underweight by 3.2%. The portfolio has an active share of 74.3%. Christian Brothers Investment Services, Inc.
February 2019
CBIS Global Funds plc
9
INVESTMENT MANAGER’S REPORT (continued) World Equity Fund (the “Fund”) Sub-Investment Managers: Scott Investment Partners LLP, RhumbLine Advisers & Los Angeles Capital Management and Equity Research Inc. 12 Month Review For the full calendar year 2018, the Fund returned -3.82% net of fees, 0.52% better than the MSCI All Country World Index (ACWI) benchmark (the “Benchmark”) return of -4.34%. Both Sub-Investment Managers, Los Angeles Capital Management and Equity Research Inc. (“LA Capital”) and Scott Investment Partners LLP (“Scott”), outperformed the index over the past 12 months. The Fund benefitted by being underweight in relatively poor performing financial company stocks, but more so from a good mix of holdings in the consumer discretionary sector (15.5% allocation within the Fund). Strong stock selection results were also noted in consumer staples, materials and health care. For the three-year period ended 12/31/2018, the Fund’s 3.81% annualized return (net of fees) was 156 basis points behind the index. For this period, the Sub-Investment Managers’ total return is nearly identical although both have experienced alternating periods of strength and weakness relative to the benchmark index.
The Fund had a year to date return of +8.4% at the end of September, but the fourth quarter’s 11.2% decline in valuation brought the full year return down to -3.82%. Energy stocks, which had advanced nicely in the first nine months of the year in tandem with increasing oil prices, declined nearly 19% on average during the final three months of the year. As a result, the energy sector wound up 2018 as one of the weaker performing segments of the global equity market and the fund’s overweight in energy detracted from excess return over the 12-month period.
Information Technology stocks also suffered sharp declines in valuations during Q4 (-15.7% on average) but still finished the year in positive territory with returns averaging +3.1% in 2018. IT, health care and utility companies were the only sectors with positive returns for the 12-month period. The fund’s overweight in information technology and strong specific stock selection in both health care and utilities were each additive to relative return.
The rebound in relative return for the Fund in 2018, albeit relatively modest, is welcome news after a very disappointing 2017. 2018 outperformance was mostly attributable to a significant spike in excess return by Scott, though LA Capital was also ahead of benchmark for the year. In 2017, both Sub-Investment Managers lagged the index. Scott’s concentrated portfolio, lacking financials and significantly overweight in energy and consumer discretionary, drives the fund’s sector weight imbalances relative to the index. Both managers strive to add significant value with specific stock selection results within the industry groupings.
Portfolio Positioning and Outlook
The Fund has 435 securities, the vast majority held exclusively by LA Capital utilizing a quantitative risk-controlled investment strategy. The high conviction portfolio managed by Scott continues to target 45 to 55 names. Scott currently believes, as they have since fund inception, that banks and most financial stocks around the globe are fully or over-valued; thus, they have zero holdings in Financials. The allocation within the benchmark index exceeds 17%. They maintain significant overweights to energy and consumer discretionary companies – consistent with the philosophy that global economic growth and wealth creation in the long term will be driven by these groupings of industries and companies.
54.6% of the holdings are US domiciled, 0.2% above the benchmark index weight. There are no significant regional or individual country allocation bets within the fund relative to the overall universe of potential investments in the ACWI index. The 2.3% overweight to Japan and 1.7% overweight in France are the largest differences for individual countries. As mentioned previously, the sector allocation bets can be significant, driven primarily by fundamental stock selection. The Fund currently maintains underweights in financials, health care, communications services and industrials – with offsetting overweights in energy, consumer discretionary and staples. Both Sub-Investment Managers utilize value–oriented metrics for security selection but are committed to seeking above average growth potential for their investments. We are encouraged by the recent rebound in relative performance and remain confident in the managers’ ability to post better than market returns over complete market cycles.
Christian Brothers Investment Services, Inc.
February 2019
CBIS Global Funds plc
10
DIRECTORS’ REPORT The Directors of CBIS Global Funds plc (the “Company”) submit their report together with the audited financial statements for the financial year ended 31 December 2018. The Directors have adopted all corporate governance practices and procedures in the voluntary Corporate Governance Code for Collective Investment Schemes and Management Companies as published by Irish Funds. Directors’ Responsibilities Statement The Directors are responsible for preparing the Annual Report and the financial statements in accordance with applicable Irish law and FRS 102 “The Financial Reporting Standard applicable in the United Kingdom and the Republic of Ireland” (“FRS 102”). Irish company law requires the Directors to prepare financial statements for each financial year which give a true and fair view of the Company’s assets, liabilities and financial positions as at the end of the financial year and of the profit or loss of the Company for that financial year. In preparing these financial statements, the Directors are required to: • select suitable accounting policies and then apply them consistently;
• make judgments and estimates that are reasonable and prudent;
• state whether the financial statements have been prepared in accordance with applicable accounting standards and identify the standards in question, subject to any material departure from the standards being disclosed and explained in the notes to the financial statements; and
• prepare the financial statements on a going concern basis unless it is inappropriate to presume that the Company will continue in business.
The Company is obliged to keep adequate accounting records that are sufficient to: • correctly record and explain the transactions of the Company;
• enable, at any time, the assets, liabilities, financial position and profit or loss of the Company to be determined with reasonable accuracy; and
• enable the Directors to ensure that the financial statements comply with the Companies Act 2014 and the UCITS Regulations and enable those financial statements to be audited.
Under the UCITS Regulations, the Directors are responsible for safeguarding the assets of the Company and hence taking the reasonable steps for the prevention and detection of fraud and other irregularities. In carrying out this duty, the Directors have entrusted custody of the Company’s assets to BNY Mellon Trust Company (Ireland) Limited (the “Depositary”). The financial statements of the Company are published on the website of Christian Brothers Investment Services Inc. (http://cbisonline.com/eu/). The Directors are responsible for the maintenance and integrity of the corporate and financial information relating to the Company published on this website. Legislation in Ireland governing the preparation and dissemination of financial statements may differ from legislation in other jurisdictions. Adequate accounting records The measures taken by the Directors to secure compliance with the Company’s obligation to keep adequate accounting records are the use of appropriate systems and procedures and employment of competent and qualified service providers. The Directors have delegated the administration of the Company to BNY Mellon Fund Services (Ireland) Designated Activity Company (the “Administrator”) who maintains the accounting records at One Dockland Central, Guild Street, IFSC, Dublin 1, Ireland. Statement on Relevant Audit Information So far as the Directors are aware, there is no relevant audit information of which the statutory auditors are unaware. The Directors have taken all steps that they ought to have taken to make themselves aware of any relevant audit information and they have established that the statutory auditors are aware of the information.
CBIS Global Funds plc
11
DIRECTORS’ REPORT (continued) Review of business and future developments The Company is an open-ended investment company with variable capital which has been authorised by the Central Bank under the UCITS Regulations. There was no change in the nature of the Company’s business during the financial year. The Directors do not anticipate any future change to the structure or investment objectives of the Company, other than as disclosed in the financial statements. A detailed review of activities and future developments is contained in the Investment Manager’s Report on pages 6 to 9. Risk management objectives and policies The Company’s investment activities expose it to the various types of risk, which are associated with the financial instruments and markets in which it invests. Details of certain risks inherent in investing in the Company are disclosed in Note 4 to the financial statements and in the Prospectus. Results and distributions The results for the financial year ended 31 December 2018 are set out in the Statement of Comprehensive Income. It is not proposed to declare distributions in respect of any of the Funds. Significant events during the financial year Please refer to Note 15 for details of significant events during the financial year. Subsequent events Please refer to Note 16 for details of significant subsequent events affecting the Company since the financial year end. Connected person transactions In accordance with the requirements of Chapter 10 of the Central Bank UCITS Regulations, all transactions carried out with the Company by the Depositary and the delegate or sub-delegate of the Company or the Depositary, and any associated or group company of the Company, the Depositary or such delegate or subdelegate (“connected persons”) must be conducted at arm’s length and in the best interests of shareholders. The Directors are satisfied that there are arrangements in place, evidenced by written procedures, to ensure that these obligations are applied to all transactions with connected persons and transactions with connected persons entered into during the financial year complied with these obligations. During the financial year, companies related to the Depositary were selected by the Investment Manager to execute investment trades and foreign exchange transactions and to accept deposits on behalf of the Funds. Directors The names of the persons who were Directors at any time during the financial year ended 31 December 2018 are set out below. Effective 9 April 2018, Mr. Neal Berkowitz resigned as a director of the Company. All other Directors’ held office for the entire financial year. Eimear Cowhey (Irish) Denise Kinsella (Irish) Jeffrey McCroy (American) David L. Skelding (American) Neal Berkowitz (American) Directors' and secretary's interests Other than those noted in Note 3 to the financial statements, the Directors and secretary and their families had no interests in the shares of the Company at 31 December 2018. No Director had at any time during the financial year, a material interest in any contract of significance, subsisting during or at the financial year end, in relation to the business of the Company. Related party transactions are disclosed in Note 7 of the financial statements.
Independent auditors' report to the members of CBIS Global Funds plc
Report on the audit of the financial statements
Opinion
In our opinion, CBIS Global Funds plc's financial statements:
give a true and fair view of the Company's and funds' assets, liabilities and financial position as at 31 December 2018 and of their results for the year then ended;
• have been properly prepared in accordance with Generally Accepted Accounting Practice in Ireland (accounting standards issued by the Financial Reporting Council of the UK, including Financial Reporting Standard 102 "The Financial Reporting Standard applicable in the UK and Republic of Ireland" and Irish law); and
• have been properly prepared in accordance with the requirements of the Companies Act 2014 and the European Communities (Undertakings for Collective Investment in Transferable Securities) Regulations 2011 (as amended).
We have audited the financial statements, included within the Annual Report and Audited Financial Statements, which comprise:
• the Statement of Financial Position as at 31 December 2018;
• the Statement of Comprehensive Income for the year then ended;
• the Statement of Changes in Net Assets Attributable to Holders of Redeemable Participating Shares for the year then ended;
• the Portfolio of Investments for each of the funds as at 31 December 2018; and
• the notes to the financial statements for the Company and for each of its funds, which include a description of the significant accounting policies.
Basis for opinion
We conducted our audit in accordance with International Standards on Auditing (Ireland) ("ISAs (Ireland)") and applicable law.
Our responsibilities under ISAs (Ireland) are further described in the Auditors' responsibilities for the audit of the financial statements section of our report. We believe that the audit evidence we have obtained is sufficient and appropriate to provide a basis for our opinion.
Irulepen c/er? cc
We remained independent of the Company in accordance with the ethical requirements that are relevant to our audit of the financial statements in Ireland, which includes IAASA's Ethical Standard, and we have fulfilled our other ethical responsibilities in accordance with these requirements.
Conclusions relating to going concern
We have nothing to report in respect of the following matters in relation to which ISAs (Ireland) require us to report to you where:
• the directors' use of the going concern basis of accounting in the preparation of the financial statements is not appropriate; or
• the directors have not disclosed in the financial statements any identified material uncertainties that may cast significant doubt about the Company's and funds' ability to continue to adopt the going concern basis of accounting for a period of at least twelve months from the date when the financial statements are authorised for issue.
However, because not all future events or conditions can be predicted, this statement is not a guarantee as to the Company's and funds' ability to continue as going concerns.
Reporting on other information
The other information comprises all of the information in the Annual Report and Audited Financial Statements other than the financial statements and our auditors' report thereon. The directors are responsible for the other information. Our opinion on the financial statements does not cover the other information and, accordingly, we do not express an audit opinion or, except to the extent otherwise explicitly stated in this report, any form of assurance thereon. In connection with our audit of the financial statements, our responsibility is to read the other information and, in doing so, consider whether the other information is materially inconsistent with the financial statements or our knowledge obtained in the audit, or otherwise appears to be materially misstated. If we identify an apparent material inconsistency or material misstatement, we are required to perform procedures to conclude whether there is a material misstatement of the financial statements or a material misstatement of the other information. If, based on the work we have performed, we conclude that there is a material misstatement of this other information, we are required to report that fact. We have nothing to report based on these responsibilities.
With respect to the Directors' Report, we also considered whether the disclosures required by the Companies Act 2014 have been included.
Based on the responsibilities described above and our work undertaken in the course of the audit, ISAs (Ireland) and the Companies Act 2014 require us to also report certain opinions and matters as described below:
• In our opinion, based on the work undertaken in the course of the audit, the information given in the Directors' Report for the year ended 31 December 2018 is consistent with the financial statements and has been prepared in accordance with applicable legal requirements.
• Based on our knowledge and understanding of the Company and its environment obtained in the course of the audit, we have not identified any material misstatements in the Directors' Report.
Responsibilities for the financial statements and the audit
Responsibilities of the directors for the financial statements
As explained more fully in the Directors' Responsibilities Statement set out on page io, the directors are responsible for the preparation of the financial statements in accordance with the applicable framework and for being satisfied that they give a true and fair view.
The directors are also responsible for such internal control as they determine is necessary to enable the preparation of financial statements that are free from material misstatement, whether due to fraud or error.
In preparing the financial statements, the directors are responsible for assessing the Company's and funds' ability to continue as going concerns, disclosing as applicable, matters related to going concern and using the going concern basis of accounting unless the directors either intend to liquidate the Company or to cease operations, or have no realistic alternative but to do so.
1luditors responsibilities for the audit of the financial statements
Our objectives are to obtain reasonable assurance about whether the financial statements as a whole are free from material misstatement, whether due to fraud or error, and to issue an auditors' report that includes our opinion. Reasonable assurance is a high level of assurance, but is not a guarantee that an audit conducted in accordance with ISAs (Ireland) will always detect a material misstatement when it exists. Misstatements can arise from fraud or error and are considered material if, individually or in the aggregate, they could reasonably be expected to influence the economic decisions of users taken on the basis of these financial statements.
A further description of our responsibilities for the audit of the financial statements is located on the LA.ASA website at:
htts://www.iaasa.ie/getmedia fb28go13-1cf6-4.8b-gb8f aq8202dc9c3a/Description of auditors responsibilities for audjp
This description forms part of our auditors' report.
Use of this report
This report, including the opinions, has been prepared for and only for the Company's members as a body in accordance with section 391 of the Companies Act 2014 and for no other purpose. We do not, in giving these opinions, accept or assume responsibility for any other purpose or to any other person to whom this report is shown or into whose hands it may come save where expressly agreed by our prior consent in writing.
Other required reporting
Companies Act 2014 opinions on other matters
• We have obtained all the information and explanations which we consider necessary for the purposes of our audit.
• In our opinion the accounting records of the Company were sufficient to permit the financial statements to be readily and properly audited.
The financial statements are in agreement with the accounting records.
Companies Act 2014 exception reporting
Directors' remuneration and transactions
Under the Companies Act 2014 we are required to report to you if, in our opinion, the disclosures of directors' remuneration and transactions specified by sections 305 to 312 of that Act have not been made. We have no exceptions to report arising from this responsibility.
//e tZ Sean Herlihy for and on behalf of PricewaterhouseCoopers Chartered Accountants and Statutory Audit Firm Dublin 18 April 2019
CBIS Global Funds plc
18
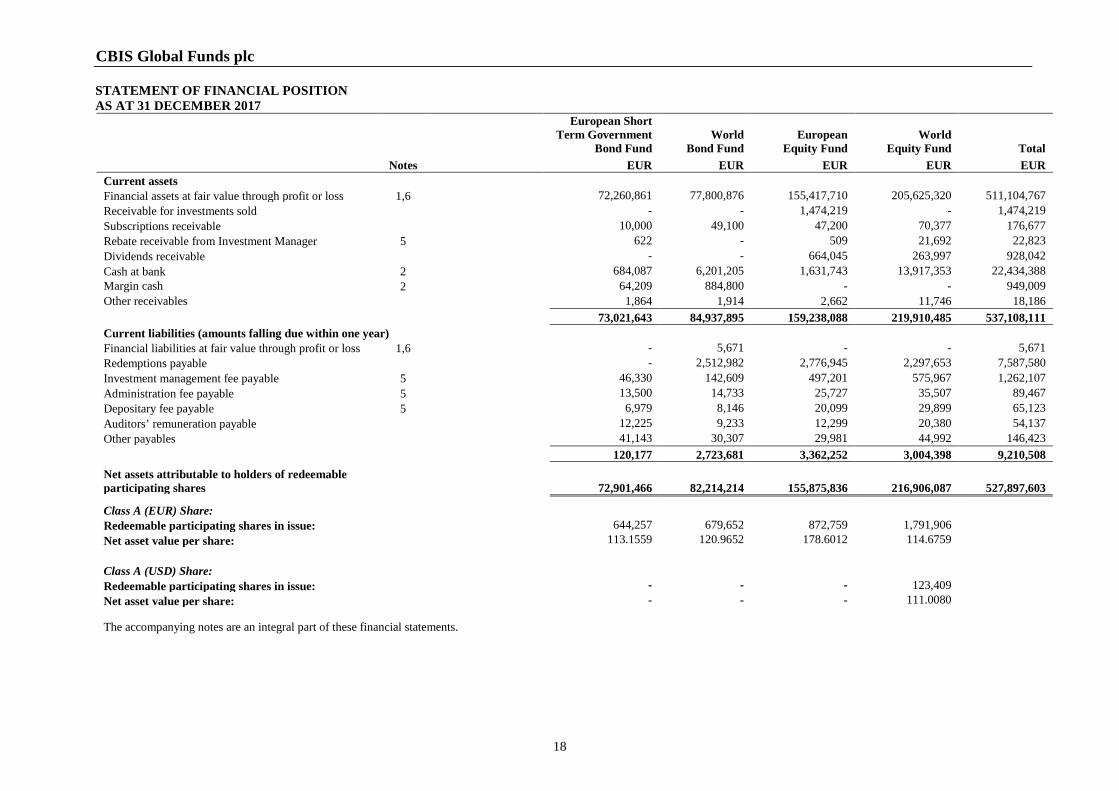
STATEMENT OF FINANCIAL POSITION AS AT 31 DECEMBER 2017
European Short Term Government
Bond Fund World
Bond Fund European
Equity Fund World
Equity Fund
Total Notes EUR EUR EUR EUR EUR Current assets Financial assets at fair value through profit or loss 1,6 72,260,861 77,800,876 155,417,710 205,625,320 511,104,767 Receivable for investments sold - - 1,474,219 - 1,474,219 Subscriptions receivable 10,000 49,100 47,200 70,377 176,677 Rebate receivable from Investment Manager 5 622 - 509 21,692 22,823 Dividends receivable - - 664,045 263,997 928,042 Cash at bank 2 684,087 6,201,205 1,631,743 13,917,353 22,434,388 Margin cash 2 64,209 884,800 - - 949,009 Other receivables 1,864 1,914 2,662 11,746 18,186 73,021,643 84,937,895 159,238,088 219,910,485 537,108,111 Current liabilities (amounts falling due within one year) Financial liabilities at fair value through profit or loss 1,6 - 5,671 - - 5,671 Redemptions payable - 2,512,982 2,776,945 2,297,653 7,587,580 Investment management fee payable 5 46,330 142,609 497,201 575,967 1,262,107 Administration fee payable 5 13,500 14,733 25,727 35,507 89,467 Depositary fee payable 5 6,979 8,146 20,099 29,899 65,123 Auditors’ remuneration payable 12,225 9,233 12,299 20,380 54,137 Other payables 41,143 30,307 29,981 44,992 146,423 120,177 2,723,681 3,362,252 3,004,398 9,210,508 Net assets attributable to holders of redeemable participating shares
72,901,466 82,214,214 155,875,836 216,906,087 527,897,603
Class A (EUR) Share: Redeemable participating shares in issue: 644,257 679,652 872,759 1,791,906 Net asset value per share: 113.1559 120.9652 178.6012 114.6759 Class A (USD) Share: Redeemable participating shares in issue: - - - 123,409 Net asset value per share: - - - 111.0080 The accompanying notes are an integral part of these financial statements.
CBIS Global Funds plc
19
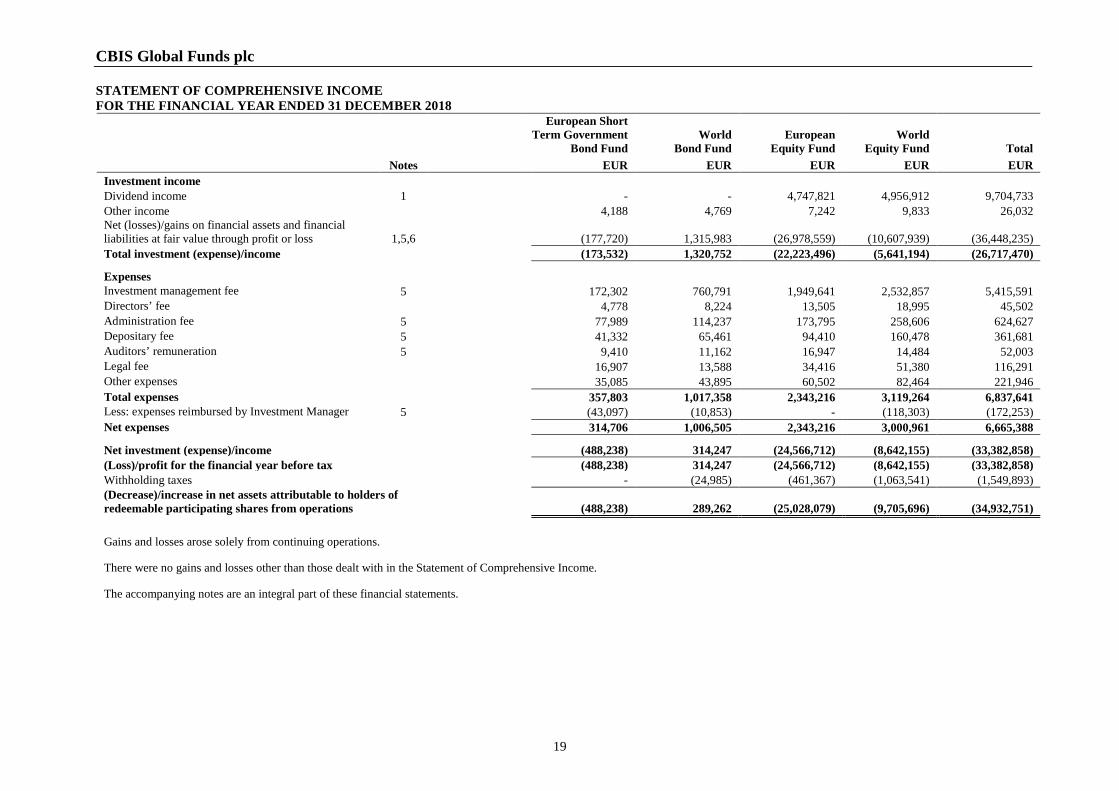
STATEMENT OF COMPREHENSIVE INCOME FOR THE FINANCIAL YEAR ENDED 31 DECEMBER 2018
European Short Term Government
Bond Fund World
Bond Fund European
Equity Fund World
Equity Fund Total Notes EUR EUR EUR EUR EUR Investment income Dividend income 1 - - 4,747,821 4,956,912 9,704,733 Other income 4,188 4,769 7,242 9,833 26,032 Net (losses)/gains on financial assets and financial liabilities at fair value through profit or loss 1,5,6 (177,720) 1,315,983 (26,978,559) (10,607,939) (36,448,235) Total investment (expense)/income (173,532) 1,320,752 (22,223,496) (5,641,194) (26,717,470) Expenses Investment management fee 5 172,302 760,791 1,949,641 2,532,857 5,415,591 Directors’ fee 4,778 8,224 13,505 18,995 45,502 Administration fee 5 77,989 114,237 173,795 258,606 624,627 Depositary fee 5 41,332 65,461 94,410 160,478 361,681 Auditors’ remuneration 5 9,410 11,162 16,947 14,484 52,003 Legal fee 16,907 13,588 34,416 51,380 116,291 Other expenses 35,085 43,895 60,502 82,464 221,946 Total expenses 357,803 1,017,358 2,343,216 3,119,264 6,837,641 Less: expenses reimbursed by Investment Manager 5 (43,097) (10,853) - (118,303) (172,253) Net expenses 314,706 1,006,505 2,343,216 3,000,961 6,665,388 Net investment (expense)/income (488,238) 314,247 (24,566,712) (8,642,155) (33,382,858) (Loss)/profit for the financial year before tax (488,238) 314,247 (24,566,712) (8,642,155) (33,382,858) Withholding taxes - (24,985) (461,367) (1,063,541) (1,549,893) (Decrease)/increase in net assets attributable to holders of redeemable participating shares from operations (488,238) 289,262 (25,028,079) (9,705,696) (34,932,751) Gains and losses arose solely from continuing operations. There were no gains and losses other than those dealt with in the Statement of Comprehensive Income. The accompanying notes are an integral part of these financial statements.
CBIS Global Funds plc
20
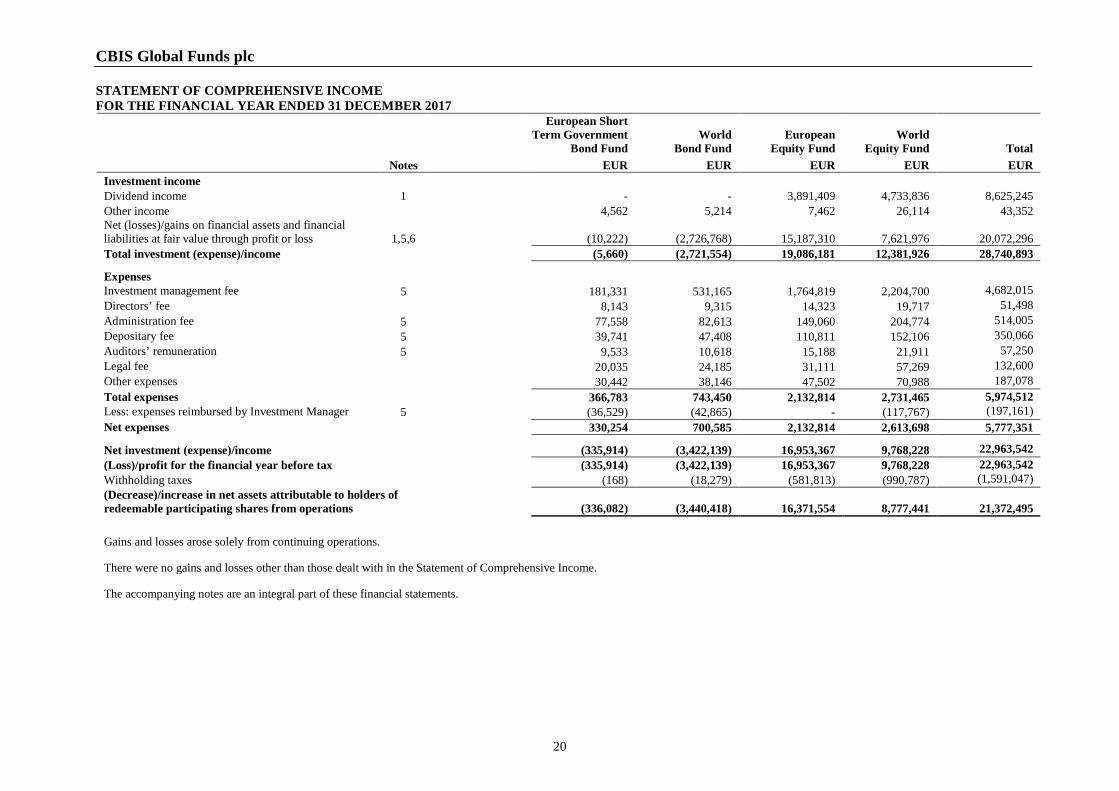
STATEMENT OF COMPREHENSIVE INCOME FOR THE FINANCIAL YEAR ENDED 31 DECEMBER 2017
European Short Term Government
Bond Fund World
Bond Fund European
Equity Fund World
Equity Fund Total Notes EUR EUR EUR EUR EUR Investment income Dividend income 1 - - 3,891,409 4,733,836 8,625,245 Other income 4,562 5,214 7,462 26,114 43,352 Net (losses)/gains on financial assets and financial liabilities at fair value through profit or loss 1,5,6 (10,222) (2,726,768) 15,187,310 7,621,976 20,072,296 Total investment (expense)/income (5,660) (2,721,554) 19,086,181 12,381,926 28,740,893 Expenses Investment management fee 5 181,331 531,165 1,764,819 2,204,700 4,682,015 Directors’ fee 8,143 9,315 14,323 19,717 51,498 Administration fee 5 77,558 82,613 149,060 204,774 514,005 Depositary fee 5 39,741 47,408 110,811 152,106 350,066 Auditors’ remuneration 5 9,533 10,618 15,188 21,911 57,250 Legal fee 20,035 24,185 31,111 57,269 132,600 Other expenses 30,442 38,146 47,502 70,988 187,078 Total expenses 366,783 743,450 2,132,814 2,731,465 5,974,512 Less: expenses reimbursed by Investment Manager 5 (36,529) (42,865) - (117,767) (197,161) Net expenses 330,254 700,585 2,132,814 2,613,698 5,777,351 Net investment (expense)/income (335,914) (3,422,139) 16,953,367 9,768,228 22,963,542 (Loss)/profit for the financial year before tax (335,914) (3,422,139) 16,953,367 9,768,228 22,963,542 Withholding taxes (168) (18,279) (581,813) (990,787) (1,591,047) (Decrease)/increase in net assets attributable to holders of redeemable participating shares from operations (336,082) (3,440,418) 16,371,554 8,777,441 21,372,495 Gains and losses arose solely from continuing operations. There were no gains and losses other than those dealt with in the Statement of Comprehensive Income. The accompanying notes are an integral part of these financial statements.
CBIS Global Funds plc
21
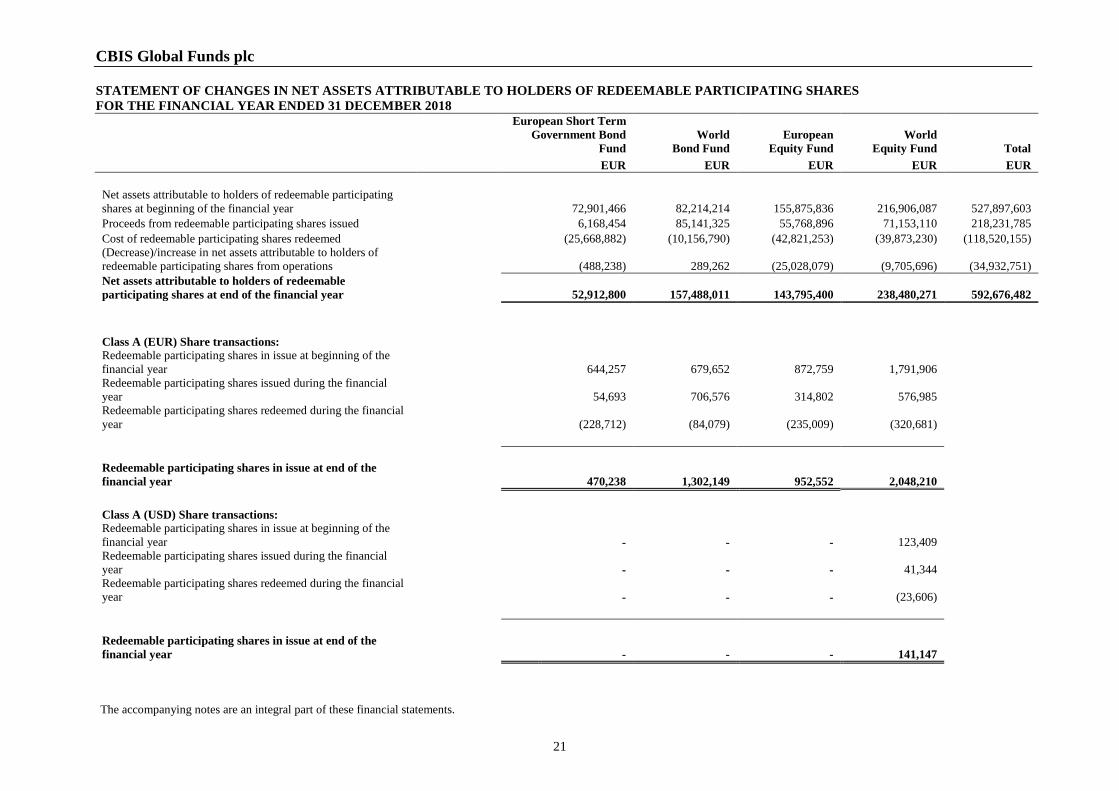
STATEMENT OF CHANGES IN NET ASSETS ATTRIBUTABLE TO HOLDERS OF REDEEMABLE PARTICIPATING SHARES FOR THE FINANCIAL YEAR ENDED 31 DECEMBER 2018
European Short Term Government Bond
Fund World
Bond Fund European
Equity Fund World
Equity Fund Total EUR EUR EUR EUR EUR Net assets attributable to holders of redeemable participating shares at beginning of the financial year 72,901,466 82,214,214 155,875,836 216,906,087 527,897,603 Proceeds from redeemable participating shares issued 6,168,454 85,141,325 55,768,896 71,153,110 218,231,785 Cost of redeemable participating shares redeemed (25,668,882) (10,156,790) (42,821,253) (39,873,230) (118,520,155) (Decrease)/increase in net assets attributable to holders of redeemable participating shares from operations (488,238) 289,262 (25,028,079) (9,705,696) (34,932,751) Net assets attributable to holders of redeemable participating shares at end of the financial year 52,912,800 157,488,011 143,795,400 238,480,271 592,676,482 Class A (EUR) Share transactions: Redeemable participating shares in issue at beginning of the financial year 644,257 679,652 872,759 1,791,906 Redeemable participating shares issued during the financial year 54,693 706,576 314,802 576,985 Redeemable participating shares redeemed during the financial year (228,712) (84,079) (235,009) (320,681) Redeemable participating shares in issue at end of the financial year 470,238 1,302,149 952,552 2,048,210 Class A (USD) Share transactions: Redeemable participating shares in issue at beginning of the financial year - - - 123,409 Redeemable participating shares issued during the financial year - - - 41,344 Redeemable participating shares redeemed during the financial year - - - (23,606) Redeemable participating shares in issue at end of the financial year - - - 141,147 The accompanying notes are an integral part of these financial statements.
CBIS Global Funds plc
22
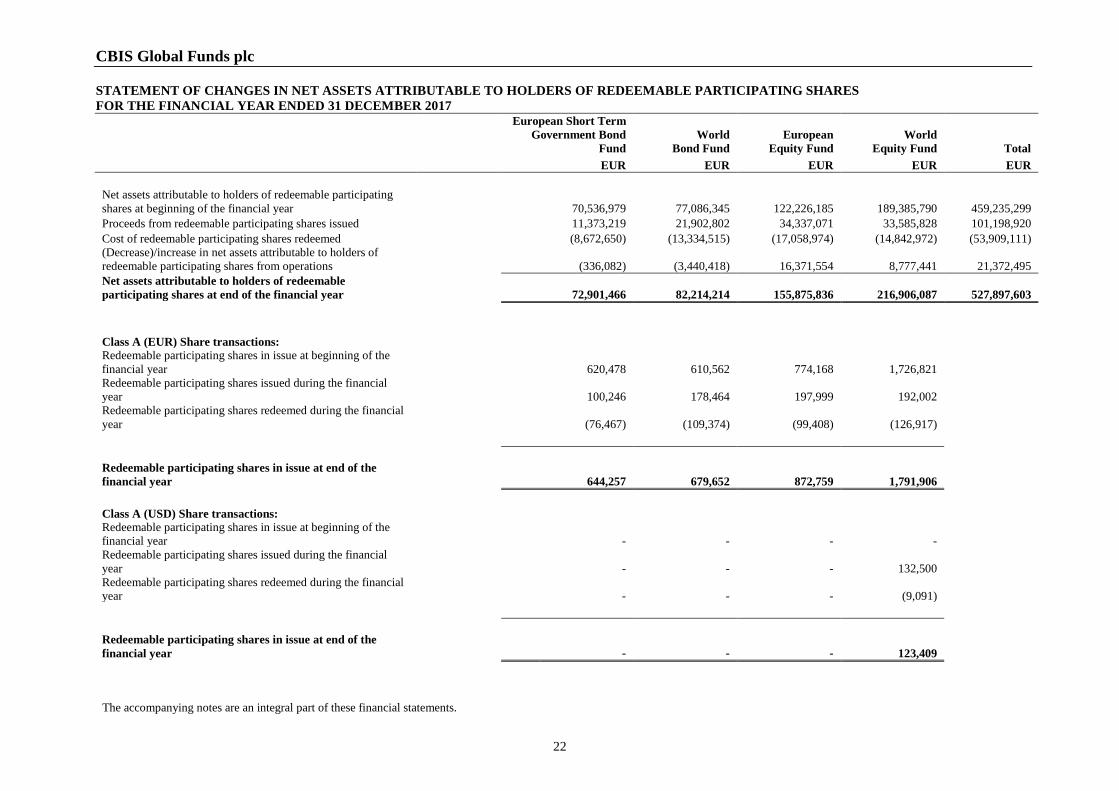
STATEMENT OF CHANGES IN NET ASSETS ATTRIBUTABLE TO HOLDERS OF REDEEMABLE PARTICIPATING SHARES FOR THE FINANCIAL YEAR ENDED 31 DECEMBER 2017
European Short Term Government Bond
Fund World
Bond Fund European
Equity Fund World
Equity Fund Total EUR EUR EUR EUR EUR Net assets attributable to holders of redeemable participating shares at beginning of the financial year 70,536,979 77,086,345 122,226,185 189,385,790 459,235,299 Proceeds from redeemable participating shares issued 11,373,219 21,902,802 34,337,071 33,585,828 101,198,920 Cost of redeemable participating shares redeemed (8,672,650) (13,334,515) (17,058,974) (14,842,972) (53,909,111) (Decrease)/increase in net assets attributable to holders of redeemable participating shares from operations (336,082) (3,440,418) 16,371,554 8,777,441 21,372,495 Net assets attributable to holders of redeemable participating shares at end of the financial year 72,901,466 82,214,214 155,875,836 216,906,087 527,897,603 Class A (EUR) Share transactions: Redeemable participating shares in issue at beginning of the financial year 620,478 610,562 774,168 1,726,821 Redeemable participating shares issued during the financial year 100,246 178,464 197,999 192,002 Redeemable participating shares redeemed during the financial year (76,467) (109,374) (99,408) (126,917) Redeemable participating shares in issue at end of the financial year 644,257 679,652 872,759 1,791,906 Class A (USD) Share transactions: Redeemable participating shares in issue at beginning of the financial year - - - - Redeemable participating shares issued during the financial year - - - 132,500 Redeemable participating shares redeemed during the financial year - - - (9,091) Redeemable participating shares in issue at end of the financial year - - - 123,409 The accompanying notes are an integral part of these financial statements.
CBIS Global Funds plc NOTES TO THE FINANCIAL STATEMENTS
23
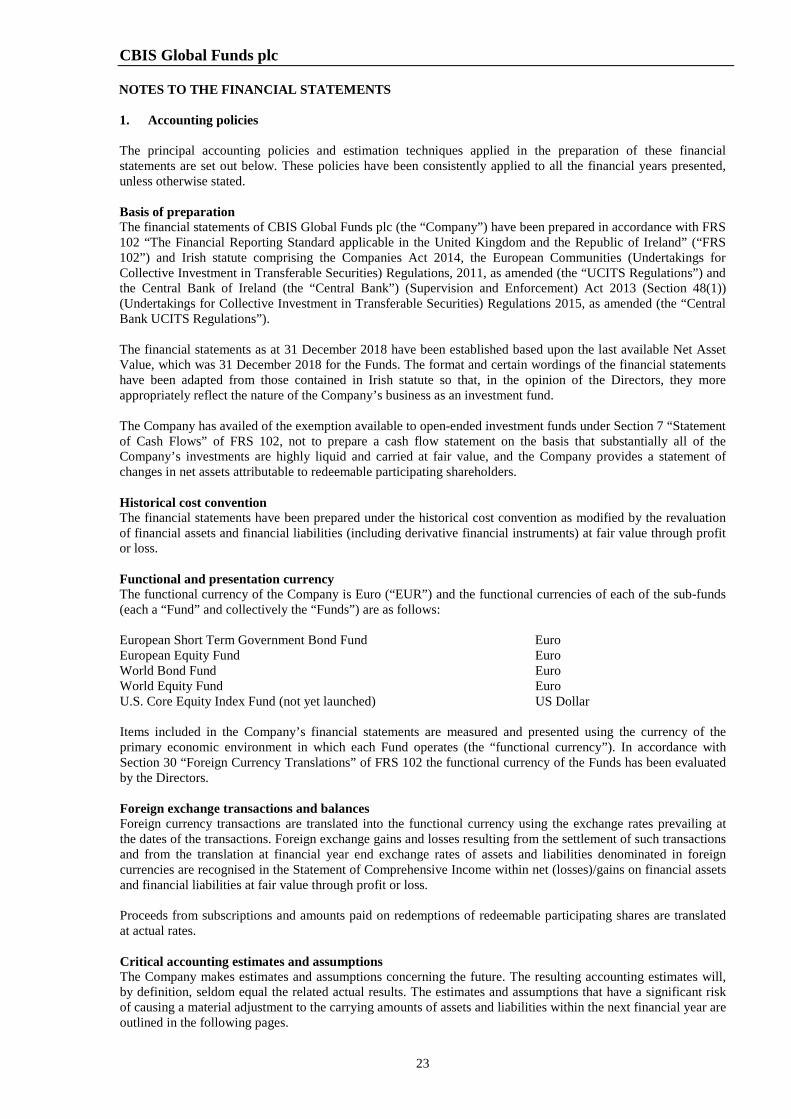
1. Accounting policies The principal accounting policies and estimation techniques applied in the preparation of these financial statements are set out below. These policies have been consistently applied to all the financial years presented, unless otherwise stated. Basis of preparation The financial statements of CBIS Global Funds plc (the “Company”) have been prepared in accordance with FRS 102 “The Financial Reporting Standard applicable in the United Kingdom and the Republic of Ireland” (“FRS 102”) and Irish statute comprising the Companies Act 2014, the European Communities (Undertakings for Collective Investment in Transferable Securities) Regulations, 2011, as amended (the “UCITS Regulations”) and the Central Bank of Ireland (the “Central Bank”) (Supervision and Enforcement) Act 2013 (Section 48(1)) (Undertakings for Collective Investment in Transferable Securities) Regulations 2015, as amended (the “Central Bank UCITS Regulations”). The financial statements as at 31 December 2018 have been established based upon the last available Net Asset Value, which was 31 December 2018 for the Funds. The format and certain wordings of the financial statements have been adapted from those contained in Irish statute so that, in the opinion of the Directors, they more appropriately reflect the nature of the Company’s business as an investment fund. The Company has availed of the exemption available to open-ended investment funds under Section 7 “Statement of Cash Flows” of FRS 102, not to prepare a cash flow statement on the basis that substantially all of the Company’s investments are highly liquid and carried at fair value, and the Company provides a statement of changes in net assets attributable to redeemable participating shareholders. Historical cost convention The financial statements have been prepared under the historical cost convention as modified by the revaluation of financial assets and financial liabilities (including derivative financial instruments) at fair value through profit or loss. Functional and presentation currency The functional currency of the Company is Euro (“EUR”) and the functional currencies of each of the sub-funds (each a “Fund” and collectively the “Funds”) are as follows: European Short Term Government Bond Fund Euro European Equity Fund Euro World Bond Fund Euro World Equity Fund Euro U.S. Core Equity Index Fund (not yet launched) US Dollar Items included in the Company’s financial statements are measured and presented using the currency of the primary economic environment in which each Fund operates (the “functional currency”). In accordance with Section 30 “Foreign Currency Translations” of FRS 102 the functional currency of the Funds has been evaluated by the Directors. Foreign exchange transactions and balances Foreign currency transactions are translated into the functional currency using the exchange rates prevailing at the dates of the transactions. Foreign exchange gains and losses resulting from the settlement of such transactions and from the translation at financial year end exchange rates of assets and liabilities denominated in foreign currencies are recognised in the Statement of Comprehensive Income within net (losses)/gains on financial assets and financial liabilities at fair value through profit or loss. Proceeds from subscriptions and amounts paid on redemptions of redeemable participating shares are translated at actual rates. Critical accounting estimates and assumptions The Company makes estimates and assumptions concerning the future. The resulting accounting estimates will, by definition, seldom equal the related actual results. The estimates and assumptions that have a significant risk of causing a material adjustment to the carrying amounts of assets and liabilities within the next financial year are outlined in the following pages.
CBIS Global Funds plc NOTES TO THE FINANCIAL STATEMENTS (continued)
24
1. Accounting policies (continued) Financial assets and financial liabilities at fair value through profit or loss Classification The Company classifies its investments in debt and equity securities, and related derivatives, as financial assets or financial liabilities at fair value through profit or loss. These financial assets and financial liabilities are designated by Christian Brothers Investment Services, Inc. (the “Investment Manager”) at fair value through profit or loss at inception. Financial assets and financial liabilities designated at fair value through profit or loss at inception are those that are managed and their performance evaluated on a fair value basis in accordance with the Company’s documented investment strategy. The Company’s policy is for the Investment Manager to evaluate the information about these financial assets and financial liabilities on a fair value basis together with other related financial information. Recognition/derecognition Regular-way purchases and sales of investments are recognised on the trade date, which is the date on which the Company commits to purchase or sell the investment. Investments are derecognised when the rights to receive cash flows from the investments have expired or the Company has transferred substantially all risks and rewards of ownership. Measurement Financial assets and financial liabilities at fair value through profit or loss are initially recognised at fair value. Subsequent to initial recognition, all financial assets and financial liabilities at fair value through profit or loss are measured at fair value. Gains and losses arising from changes in the fair value of the financial assets or financial liabilities at fair value through profit or loss category are presented in the Statement of Comprehensive Income in the financial year in which they arise. Interest earned on investments since the last coupon date is included in financial assets at fair value through profit or loss. Fair value estimation The fair value of financial instruments traded in active markets (such as publicly traded derivatives and trading securities) is based on quoted market prices at the Statement of Financial Position date. The quoted market price used for financial assets held by the Company is the last traded price. In accordance with FRS 102, the Company has applied the recognition and measurement provisions of International Accounting Standards 39 “Financial Instruments: Recognition and Measurement” (“IAS 39”) as adopted for use in the European Union and the disclosure requirements of Sections 11 and 12 of FRS 102. Under IAS 39, financial assets and liabilities are valued at last traded price, consistent with the Prospectus. The fair value of financial instruments that are not traded in an active market (for example, over-the-counter derivatives) is determined by using valuation techniques. The Company uses a variety of methods and makes assumptions that are based on market conditions existing at each Statement of Financial Position date. Valuation techniques used include the use of comparable recent arm’s length transactions, discounted cash flow analysis, option pricing models and other valuation techniques commonly used by market participants. There were no such investments held at 31 December 2018 or 31 December 2017. Fair value of derivative financial instruments Futures Contracts Initial margin deposits are made upon entering into futures contracts and are generally made in cash or cash equivalents. Futures contracts are fair valued based upon their quoted daily settlement prices. Changes in the value of open futures contracts are recognised as unrealised gains or losses on futures contracts until the contracts are terminated, at which time the realised gains and losses are recognised. Realised and unrealised gains or losses on futures contracts are included within the net (losses)/gains on financial assets and financial liabilities at fair value through profit or loss in the Statement of Comprehensive Income. At 31 December 2018, there were open futures contracts held by World Bond Fund of EUR (154,324) (31 December 2017: EUR 387,405).
CBIS Global Funds plc NOTES TO THE FINANCIAL STATEMENTS (continued)
25
1. Accounting policies (continued) Financial assets and financial liabilities at fair value through profit or loss (continued) Fair value of derivative financial instruments (continued) Foreign exchange contracts Foreign exchange contracts are used primarily to protect the Company from adverse currency and interest rate movements. Contracts outstanding at the financial year end are valued at their market value which is the applicable forward foreign exchange rate. Unrealised gains or losses on foreign exchange contracts held at the financial year end are shown in the Portfolio of Investments. Realised and unrealised gains or losses on foreign exchange contracts are included within the net (losses)/gains on financial assets and financial liabilities at fair value through profit or loss in the Statement of Comprehensive Income. There were no open foreign exchange contracts held by the Funds at 31 December 2018 or 31 December 2017. All of the Company’s financial assets and financial liabilities are held for the purpose of being traded or are expected to be realised within twelve months of the Statement of Financial Position date. Interest income Interest income on interest bearing financial instruments is shown as a component of net (losses)/gains on financial assets and financial liabilities at fair value through profit or loss in the Statement of Comprehensive Income. Interest earned on investments since the last coupon date is included in financial assets at fair value through profit or loss. Dividend income Dividend income from financial assets at fair value through profit or loss is recognised in the Statement of Comprehensive Income within ‘dividend income’ when the right of the Funds to receive payments is established. Dividend income is shown gross of any non-recoverable withholding taxes, which is disclosed in the Statement of Comprehensive Income and net of any tax credits. Expenses All expenses, including investment management fees, are recognised in the Statement of Comprehensive Income on an accruals basis. Distributions Each of the Funds will accumulate its income and capital gains. It is not proposed to declare distributions in respect of any of the Funds. Cash and other liquid assets Cash and other liquid assets will be valued at their face value with interest accrued, where applicable, at the close of business on a business day (at 4.00 pm. Eastern Standard Time). Receivables Receivables are non-derivative financial assets with fixed or determinable payments that are not quoted in an active market. Receivables are recognised initially at fair value plus transaction costs that are directly attributable to their acquisition origination. They are subsequently measured at amortised cost, less provision for impairment. Payables Payables are recognised initially at fair value and subsequently stated at amortised cost. Offsetting financial instruments Financial assets and liabilities are offset and the net amount reported in the Statement of Financial Position when there is a legally enforceable right to offset the recognised amounts and there is an intention to settle on a net basis or realise the asset and settle the liability simultaneously.
CBIS Global Funds plc NOTES TO THE FINANCIAL STATEMENTS (continued)
26
1. Accounting policies (continued) Redeemable participating shares The Company issues redeemable participating shares, which are redeemable at the holder’s option and are classified as financial liabilities. Redeemable participating shares can be put back to the Company at any time for cash equal to a proportionate share of the Company’s net asset value. The redeemable participating share is carried at the redemption amount that is payable at the Statement of Financial Position date if the holder exercises the right to put the share back to the Company. Redeemable participating shares are issued and redeemed at the holder’s option at prices based on each Fund’s net asset value per share at the time of issue or redemption. Each Fund’s net asset value per share is calculated by dividing the net assets attributable to the holders of redeemable participating shares by the total number of outstanding redeemable participating shares. In accordance with the provisions of the Company’s memorandum and articles of association, investment positions are valued based on the last traded price for the purpose of determining the net asset value per share for subscriptions and redemptions. Transaction costs Transaction costs are defined as the incremental costs that are directly attributable to the acquisition, issue or disposal of a financial asset or financial liability. An incremental cost is one that would not have been incurred if the entity had not acquired, issued or disposed of the financial instrument. When a financial asset or financial liability is recognised initially, an entity shall measure it at its fair value through profit or loss plus transaction costs that are directly attributable to the acquisition or issue of the financial asset or financial liability. Transaction costs on the purchase and sale of bonds and foreign exchange contracts are included in the purchase and sale price of the investment. They cannot be practically or reliably gathered as they are embedded in the cost of the investment and cannot be separately verified or disclosed. Transaction costs on purchases and sales of equities and future contracts are included in net (losses)/gains on financial assets and financial liabilities at fair value through profit or loss in the Statement of Comprehensive Income for each Fund. These costs are separately identifiable transaction costs and the total costs incurred by each Fund during the financial year are disclosed in Note 5 to the financial statements. 2. Cash at bank and bank overdraft Cash at bank and bank overdrafts held by the Company are deposited with BNY Mellon SA/NV (the “Global Sub-Custodian”). The ultimate parent company of the Global Sub-Custodian is the Bank of New York Mellon Corporation, a large American financial institution listed on the New York Stock Exchange whose long-term senior debt rating by Standard and Poor’s was AA- at the end of the financial year (31 December 2017: A). The margin cash of the European Short Term Government Bond Fund was held with UBS Limited, whose short term security rating by Standard & Poor’s was A-1 at the end of the financial year (31 December 2017: A-1). The margin cash of the World Bond Fund is held with Societe Generale International Limited, whose short term security rating by Standard & Poor's was A-1 at the end of the financial year (31 December 2017: A-1). The Central Bank (Supervision and Enforcement) Act 2013 (Section 48(1)) Investor Money Regulations 2015 for Fund Service Providers and the Central Bank (Supervision and Enforcement) Act 2013 (Section 48(1)) Client Asset Regulations 2015 for Investments Firms (together, the “Regulations”) came into effect on 1 July 2016. The Company has adopted the fund assets model under the Regulations. Accordingly, subscription and redemption monies are channelled through an umbrella cash collection account in the name of the Company.
CBIS Global Funds plc NOTES TO THE FINANCIAL STATEMENTS (continued)
27
3. Share capital Authorised The Directors are empowered to issue up to five hundred billion shares of no par value in the Company at the net asset value per share on such terms that they may think fit. Subscriber shares Two subscriber shares are in issue. Christian Brothers Investment Services, Inc. (the “Investment Manager”) and Mr. David Skelding each hold one subscriber share. The subscriber shares do not form part of the net asset value of the Company and are thus disclosed in these financial statements by way of this note only. Redeemable participating shares The issued redeemable participating share capital is at all times equal to the net asset value of the Company. Redeemable participating shares are redeemable at the shareholder’s option and are classified as financial liabilities. The Company’s capital is represented by these redeemable participating shares with no par value and each carrying one vote. They are entitled to dividends and to payment of a proportionate share based on the Company’s net asset value per share upon redemption. The minimum initial investment per shareholder in a Fund shall be EUR 50,000 in the case of classes whose functional currency is Euro and USD 65,000 in the case of classes whose functional currency is US Dollar and the minimum subsequent investment shall be EUR 5,000 in the case of classes whose functional currency is Euro and USD 6,500 in the case of classes whose functional currency is US Dollar. The relevant movements are shown in the statement of changes in net assets attributable to holders of redeemable participating shares. 4. Financial risk management Company risk The Company is exposed to various risks arising from the financial instruments it holds. The Investment Manager’s overall risk management programme focuses on the unpredictability of financial markets and seeks to minimise potential adverse effects on the Company’s financial performance. The Investment Manager does not oversee individual security portfolios directly, but rather after review of prospective managers for each Fund mandate, selects sub-investment managers which have in place risk management programmes that seek to limit the potential adverse effects of these risks on the Funds’ financial performance. The selection and monitoring process for sub-investment managers involves a ‘request for proposal’ review, as well as ongoing monthly and quarterly reporting, conference calls and face-to-face meetings with each sub-investment manager once selected. Global exposure UCITS funds are required to monitor exposures on a daily basis by utilising either the commitment approach or the value at risk (“VaR”) approach when financial derivative instruments (“FDI”) are held by the Funds. The sub-investment managers utilise the commitment approach in monitoring the exposures of the Funds when FDI are held as they are satisfied that the market risk can be adequately monitored through this method. Although permitted to employ FDI, the sub-investment managers of the European Equity Fund, the World Equity Fund and the U.S. Core Equity Index Fund do not currently propose to employ FDI for either efficient portfolio management purposes or for investment purposes. Each sub-investment manager will submit a risk management process to the Central Bank in accordance with the Central Bank UCITS Regulations prior to the engaging in FDI transactions in respect of the Fund it manages. The Funds will not invest in FDI until such time as a risk management process has been submitted to and cleared by the Central Bank by the relevant sub-investment manager. As at the financial year end, one of the sub-investment managers of the European Short Term Government Bond Fund, ARCA SGR S.p.A. and the sub-investment manager of the World Bond Fund, Degroof Petercam Asset Management have each submitted a risk management process to the Central Bank in accordance with the Central Bank UCITS Regulations. Each Fund’s activities expose it to a variety of financial risks: market risk (including market price risk, interest rate risk and currency risk), credit risk and liquidity risk. The main risks arising from the company’s financial instruments are summarised on the following pages.
CBIS Global Funds plc NOTES TO THE FINANCIAL STATEMENTS (continued)
28
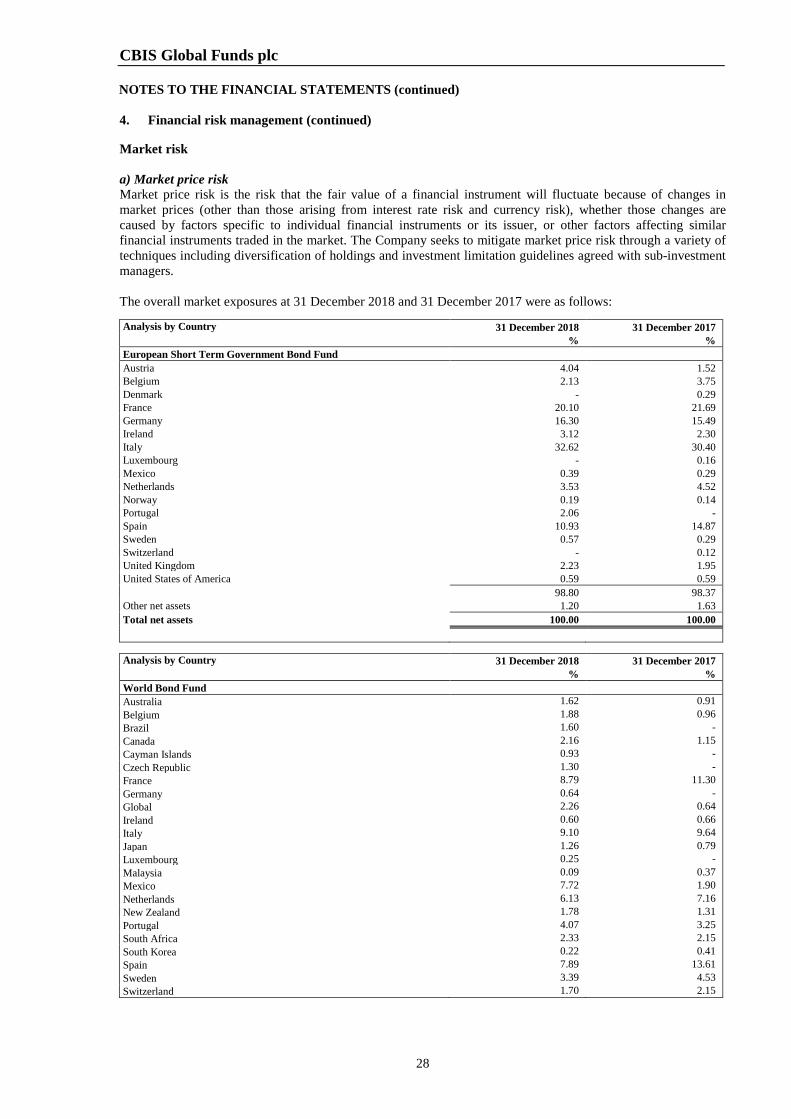
4. Financial risk management (continued) Market risk a) Market price risk Market price risk is the risk that the fair value of a financial instrument will fluctuate because of changes in market prices (other than those arising from interest rate risk and currency risk), whether those changes are caused by factors specific to individual financial instruments or its issuer, or other factors affecting similar financial instruments traded in the market. The Company seeks to mitigate market price risk through a variety of techniques including diversification of holdings and investment limitation guidelines agreed with sub-investment managers. The overall market exposures at 31 December 2018 and 31 December 2017 were as follows: Analysis by Country 31 December 2018 31 December 2017 % % European Short Term Government Bond Fund Austria 4.04 1.52 Belgium 2.13 3.75 Denmark - 0.29 France 20.10 21.69 Germany 16.30 15.49 Ireland 3.12 2.30 Italy 32.62 30.40 Luxembourg - 0.16 Mexico 0.39 0.29 Netherlands 3.53 4.52 Norway 0.19 0.14 Portugal 2.06 - Spain 10.93 14.87 Sweden 0.57 0.29 Switzerland - 0.12 United Kingdom 2.23 1.95 United States of America 0.59 0.59 98.80 98.37 Other net assets 1.20 1.63 Total net assets 100.00 100.00
Analysis by Country 31 December 2018 31 December 2017 % % World Bond Fund
Australia 1.62 0.91 Belgium 1.88 0.96 Brazil 1.60 - Canada 2.16 1.15 Cayman Islands 0.93 - Czech Republic 1.30 - France 8.79 11.30 Germany 0.64 - Global 2.26 0.64 Ireland 0.60 0.66 Italy 9.10 9.64 Japan 1.26 0.79 Luxembourg 0.25 - Malaysia 0.09 0.37 Mexico 7.72 1.90 Netherlands 6.13 7.16 New Zealand 1.78 1.31 Portugal 4.07 3.25 South Africa 2.33 2.15 South Korea 0.22 0.41 Spain 7.89 13.61 Sweden 3.39 4.53 Switzerland 1.70 2.15
CBIS Global Funds plc NOTES TO THE FINANCIAL STATEMENTS (continued)
29
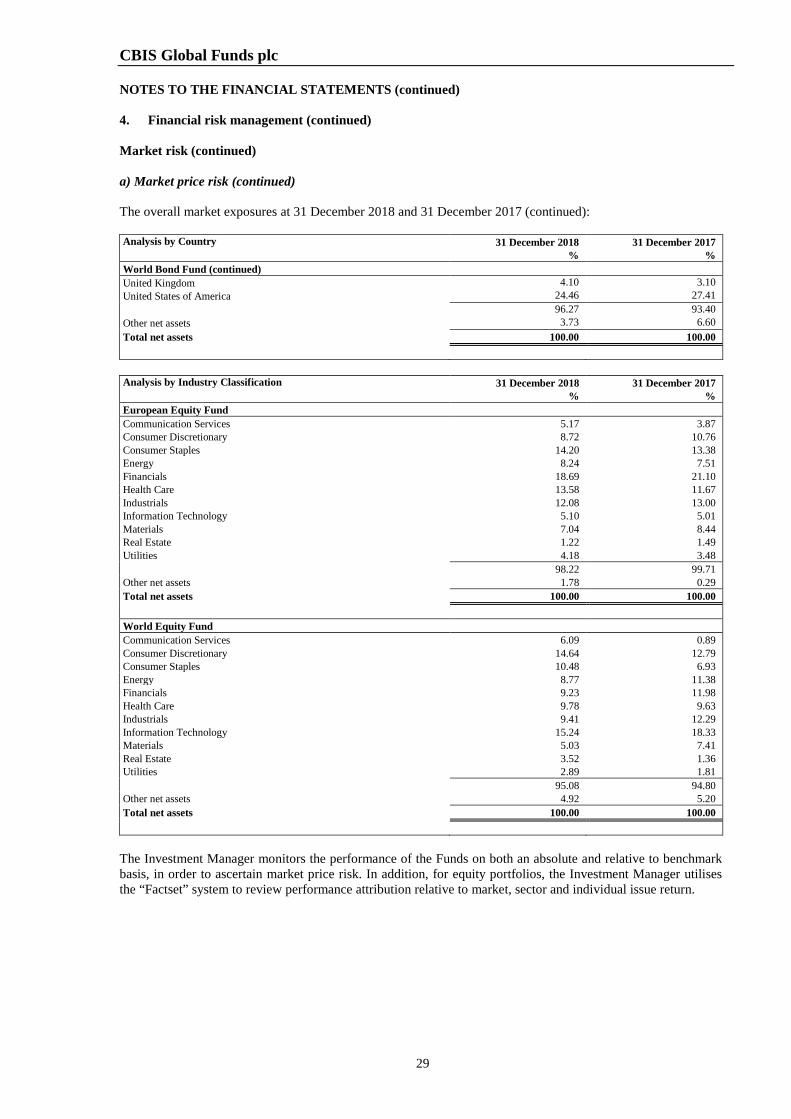
4. Financial risk management (continued) Market risk (continued) a) Market price risk (continued) The overall market exposures at 31 December 2018 and 31 December 2017 (continued): Analysis by Country 31 December 2018 31 December 2017 % % World Bond Fund (continued) United Kingdom 4.10 3.10 United States of America 24.46 27.41
96.27 93.40
Other net assets 3.73 6.60 Total net assets 100.00 100.00
Analysis by Industry Classification 31 December 2018 31 December 2017
% %
European Equity Fund Communication Services 5.17 3.87 Consumer Discretionary 8.72 10.76 Consumer Staples 14.20 13.38 Energy 8.24 7.51 Financials 18.69 21.10 Health Care 13.58 11.67 Industrials 12.08 13.00 Information Technology 5.10 5.01 Materials 7.04 8.44 Real Estate 1.22 1.49 Utilities 4.18 3.48
98.22 99.71
Other net assets 1.78 0.29 Total net assets 100.00 100.00
World Equity Fund Communication Services 6.09 0.89 Consumer Discretionary 14.64 12.79 Consumer Staples 10.48 6.93 Energy 8.77 11.38 Financials 9.23 11.98 Health Care 9.78 9.63 Industrials 9.41 12.29 Information Technology 15.24 18.33 Materials 5.03 7.41 Real Estate 3.52 1.36 Utilities 2.89 1.81
95.08 94.80
Other net assets 4.92 5.20 Total net assets 100.00 100.00
The Investment Manager monitors the performance of the Funds on both an absolute and relative to benchmark basis, in order to ascertain market price risk. In addition, for equity portfolios, the Investment Manager utilises the “Factset” system to review performance attribution relative to market, sector and individual issue return.
CBIS Global Funds plc NOTES TO THE FINANCIAL STATEMENTS (continued)
30
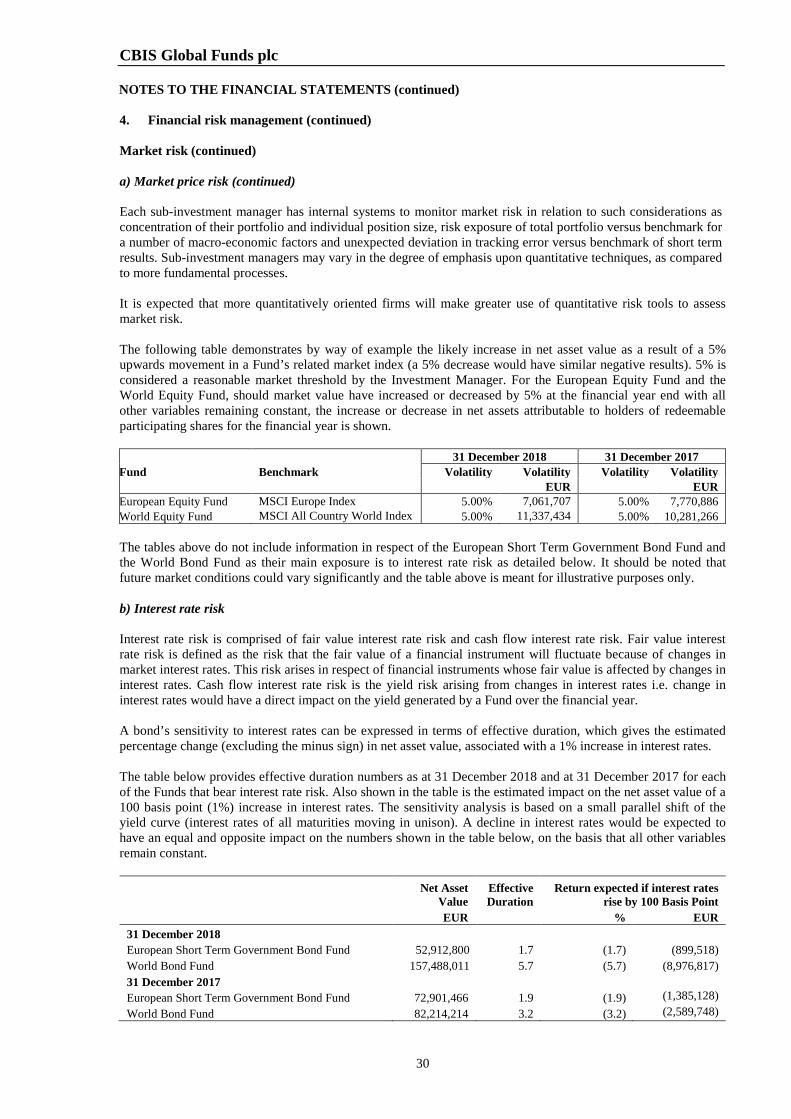
4. Financial risk management (continued) Market risk (continued) a) Market price risk (continued) Each sub-investment manager has internal systems to monitor market risk in relation to such considerations as concentration of their portfolio and individual position size, risk exposure of total portfolio versus benchmark for a number of macro-economic factors and unexpected deviation in tracking error versus benchmark of short term results. Sub-investment managers may vary in the degree of emphasis upon quantitative techniques, as compared to more fundamental processes. It is expected that more quantitatively oriented firms will make greater use of quantitative risk tools to assess market risk. The following table demonstrates by way of example the likely increase in net asset value as a result of a 5% upwards movement in a Fund’s related market index (a 5% decrease would have similar negative results). 5% is considered a reasonable market threshold by the Investment Manager. For the European Equity Fund and the World Equity Fund, should market value have increased or decreased by 5% at the financial year end with all other variables remaining constant, the increase or decrease in net assets attributable to holders of redeemable participating shares for the financial year is shown.
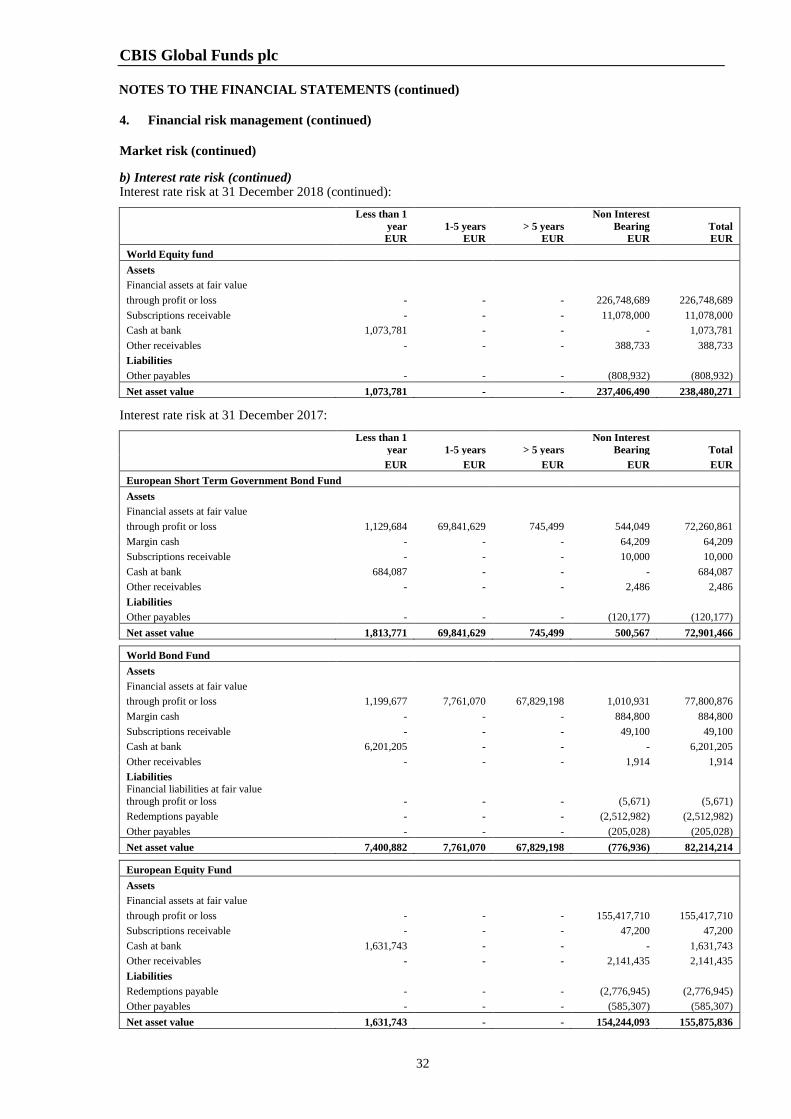
The tables above do not include information in respect of the European Short Term Government Bond Fund and the World Bond Fund as their main exposure is to interest rate risk as detailed below. It should be noted that future market conditions could vary significantly and the table above is meant for illustrative purposes only. b) Interest rate risk Interest rate risk is comprised of fair value interest rate risk and cash flow interest rate risk. Fair value interest rate risk is defined as the risk that the fair value of a financial instrument will fluctuate because of changes in market interest rates. This risk arises in respect of financial instruments whose fair value is affected by changes in interest rates. Cash flow interest rate risk is the yield risk arising from changes in interest rates i.e. change in interest rates would have a direct impact on the yield generated by a Fund over the financial year. A bond’s sensitivity to interest rates can be expressed in terms of effective duration, which gives the estimated percentage change (excluding the minus sign) in net asset value, associated with a 1% increase in interest rates. The table below provides effective duration numbers as at 31 December 2018 and at 31 December 2017 for each of the Funds that bear interest rate risk. Also shown in the table is the estimated impact on the net asset value of a 100 basis point (1%) increase in interest rates. The sensitivity analysis is based on a small parallel shift of the yield curve (interest rates of all maturities moving in unison). A decline in interest rates would be expected to have an equal and opposite impact on the numbers shown in the table below, on the basis that all other variables remain constant.
Net Asset Value
Effective Duration
Return expected if interest rates rise by 100 Basis Point
EUR
% EUR
31 December 2018 European Short Term Government Bond Fund 52,912,800 1.7 (1.7) (899,518)
World Bond Fund 157,488,011 5.7 (5.7) (8,976,817) 31 December 2017
European Short Term Government Bond Fund 72,901,466 1.9 (1.9) (1,385,128) World Bond Fund 82,214,214 3.2 (3.2) (2,589,748)
31 December 2018 31 December 2017 Fund Benchmark Volatility Volatility Volatility Volatility EUR EUR European Equity Fund MSCI Europe Index 5.00% 7,061,707 5.00% 7,770,886 World Equity Fund MSCI All Country World Index 5.00% 11,337,434 5.00% 10,281,266
CBIS Global Funds plc NOTES TO THE FINANCIAL STATEMENTS (continued)
31
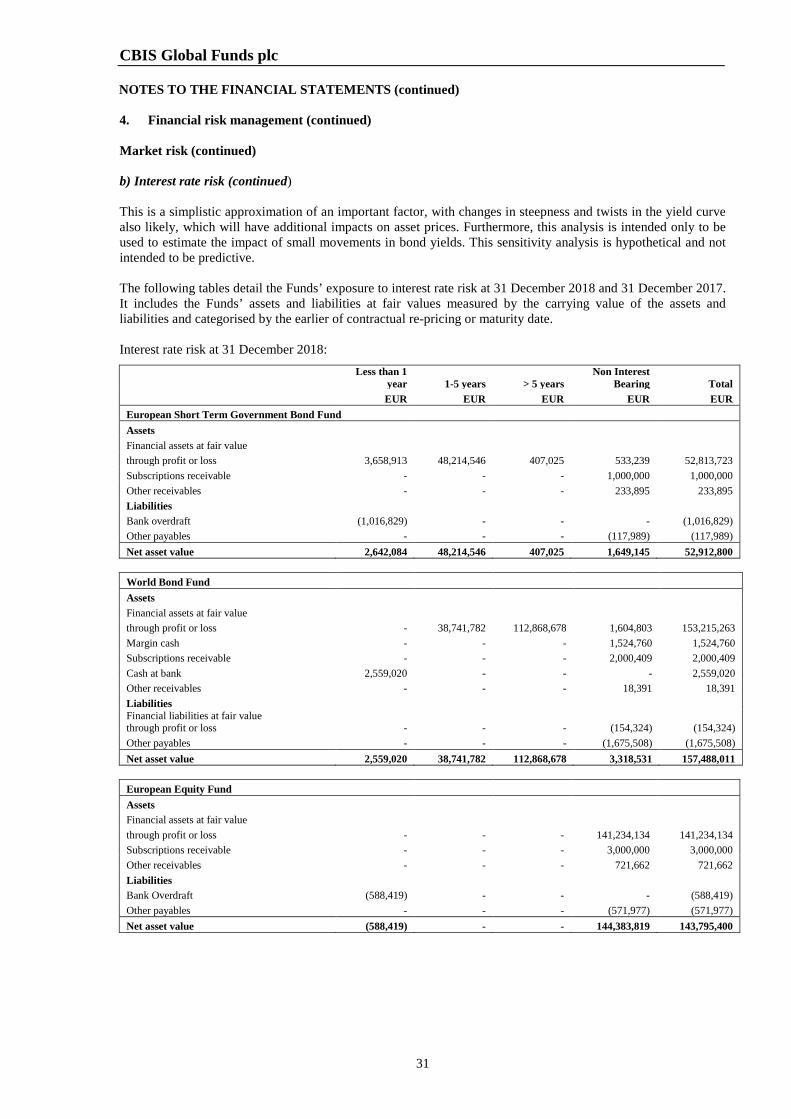
4. Financial risk management (continued) Market risk (continued) b) Interest rate risk (continued) This is a simplistic approximation of an important factor, with changes in steepness and twists in the yield curve also likely, which will have additional impacts on asset prices. Furthermore, this analysis is intended only to be used to estimate the impact of small movements in bond yields. This sensitivity analysis is hypothetical and not intended to be predictive. The following tables detail the Funds’ exposure to interest rate risk at 31 December 2018 and 31 December 2017. It includes the Funds’ assets and liabilities at fair values measured by the carrying value of the assets and liabilities and categorised by the earlier of contractual re-pricing or maturity date. Interest rate risk at 31 December 2018:
Less than 1 year 1-5 years > 5 years
Non Interest Bearing Total
EUR EUR EUR EUR EUR
European Short Term Government Bond Fund Assets
Financial assets at fair value through profit or loss 3,658,913 48,214,546 407,025 533,239 52,813,723 Subscriptions receivable - - - 1,000,000 1,000,000 Other receivables - - - 233,895 233,895 Liabilities Bank overdraft (1,016,829) - - - (1,016,829) Other payables - - - (117,989) (117,989) Net asset value 2,642,084 48,214,546 407,025 1,649,145 52,912,800
World Bond Fund Assets Financial assets at fair value through profit or loss - 38,741,782 112,868,678 1,604,803 153,215,263 Margin cash - - - 1,524,760 1,524,760 Subscriptions receivable - - - 2,000,409 2,000,409 Cash at bank 2,559,020 - - - 2,559,020 Other receivables - - - 18,391 18,391 Liabilities Financial liabilities at fair value through profit or loss - - - (154,324) (154,324) Other payables - - - (1,675,508) (1,675,508) Net asset value 2,559,020 38,741,782 112,868,678 3,318,531 157,488,011
European Equity Fund Assets Financial assets at fair value through profit or loss - - - 141,234,134 141,234,134 Subscriptions receivable - - - 3,000,000 3,000,000 Other receivables - - - 721,662 721,662 Liabilities Bank Overdraft (588,419) - - - (588,419) Other payables - - - (571,977) (571,977) Net asset value (588,419) - - 144,383,819 143,795,400
CBIS Global Funds plc NOTES TO THE FINANCIAL STATEMENTS (continued)
32
4. Financial risk management (continued) Market risk (continued) b) Interest rate risk (continued) Interest rate risk at 31 December 2018 (continued):
Less than 1 year EUR
1-5 years EUR
> 5 years EUR
Non Interest Bearing
EUR Total EUR
World Equity fund Assets Financial assets at fair value through profit or loss - - - 226,748,689 226,748,689 Subscriptions receivable - - - 11,078,000 11,078,000 Cash at bank 1,073,781 - - - 1,073,781 Other receivables - - - 388,733 388,733 Liabilities Other payables - - - (808,932) (808,932) Net asset value 1,073,781 - - 237,406,490 238,480,271
Interest rate risk at 31 December 2017:
Less than 1 year 1-5 years > 5 years
Non Interest Bearing Total
EUR EUR EUR EUR EUR
European Short Term Government Bond Fund Assets
Financial assets at fair value through profit or loss 1,129,684 69,841,629 745,499 544,049 72,260,861 Margin cash - - - 64,209 64,209 Subscriptions receivable - - - 10,000 10,000 Cash at bank 684,087 - - - 684,087 Other receivables - - - 2,486 2,486 Liabilities Other payables - - - (120,177) (120,177) Net asset value 1,813,771 69,841,629 745,499 500,567 72,901,466
World Bond Fund Assets Financial assets at fair value
through profit or loss 1,199,677 7,761,070 67,829,198 1,010,931 77,800,876 Margin cash - - - 884,800 884,800 Subscriptions receivable - - - 49,100 49,100 Cash at bank 6,201,205 - - - 6,201,205 Other receivables - - - 1,914 1,914 Liabilities Financial liabilities at fair value through profit or loss - - - (5,671) (5,671) Redemptions payable - - - (2,512,982) (2,512,982) Other payables - - - (205,028) (205,028) Net asset value 7,400,882 7,761,070 67,829,198 (776,936) 82,214,214
European Equity Fund Assets Financial assets at fair value through profit or loss - - - 155,417,710 155,417,710 Subscriptions receivable - - - 47,200 47,200 Cash at bank 1,631,743 - - - 1,631,743 Other receivables - - - 2,141,435 2,141,435 Liabilities Redemptions payable - - - (2,776,945) (2,776,945) Other payables - - - (585,307) (585,307) Net asset value 1,631,743 - - 154,244,093 155,875,836
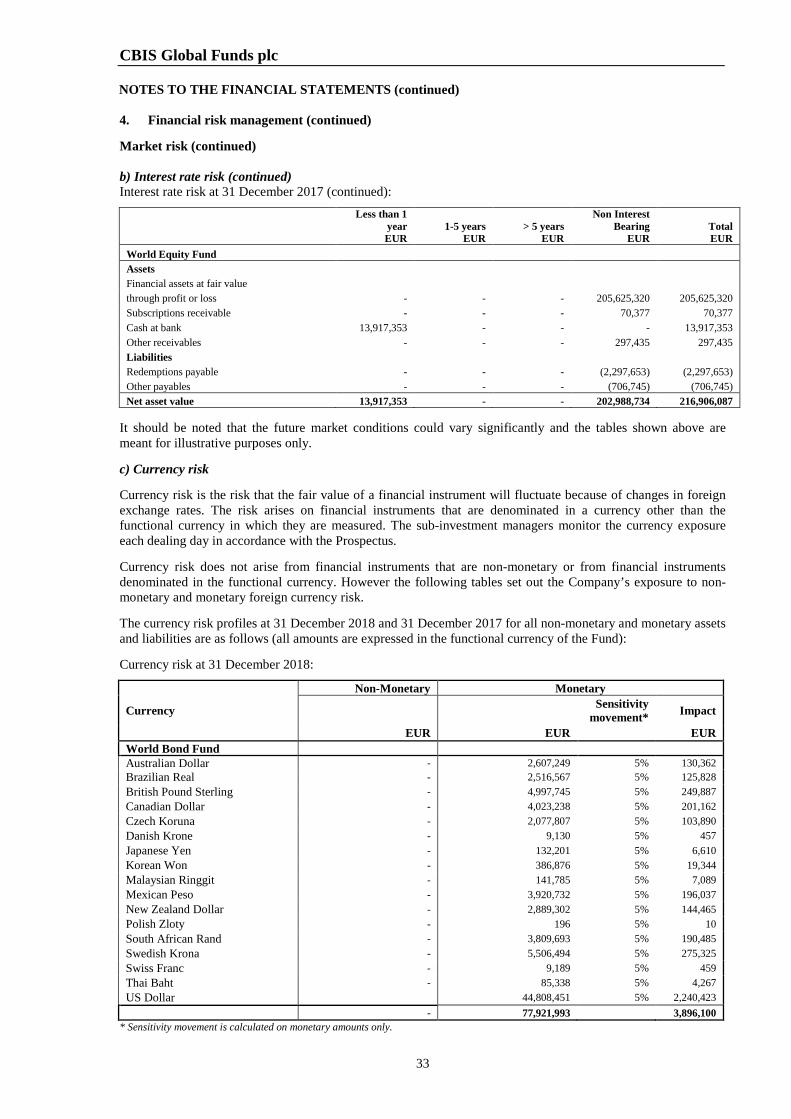
CBIS Global Funds plc NOTES TO THE FINANCIAL STATEMENTS (continued)
33
4. Financial risk management (continued) Market risk (continued) b) Interest rate risk (continued) Interest rate risk at 31 December 2017 (continued):
Less than 1 year EUR
1-5 years EUR
> 5 years EUR
Non Interest Bearing
EUR Total EUR
World Equity Fund Assets Financial assets at fair value
through profit or loss - - - 205,625,320 205,625,320 Subscriptions receivable - - - 70,377 70,377 Cash at bank 13,917,353 - - - 13,917,353 Other receivables - - - 297,435 297,435 Liabilities Redemptions payable - - - (2,297,653) (2,297,653) Other payables - - - (706,745) (706,745) Net asset value 13,917,353 - - 202,988,734 216,906,087
It should be noted that the future market conditions could vary significantly and the tables shown above are meant for illustrative purposes only. c) Currency risk Currency risk is the risk that the fair value of a financial instrument will fluctuate because of changes in foreign exchange rates. The risk arises on financial instruments that are denominated in a currency other than the functional currency in which they are measured. The sub-investment managers monitor the currency exposure each dealing day in accordance with the Prospectus. Currency risk does not arise from financial instruments that are non-monetary or from financial instruments denominated in the functional currency. However the following tables set out the Company’s exposure to non-monetary and monetary foreign currency risk. The currency risk profiles at 31 December 2018 and 31 December 2017 for all non-monetary and monetary assets and liabilities are as follows (all amounts are expressed in the functional currency of the Fund): Currency risk at 31 December 2018:
Non-Monetary Monetary Currency
Sensitivity movement* Impact
EUR EUR
EUR World Bond Fund Australian Dollar - 2,607,249 5% 130,362 Brazilian Real - 2,516,567 5% 125,828 British Pound Sterling - 4,997,745 5% 249,887 Canadian Dollar - 4,023,238 5% 201,162 Czech Koruna - 2,077,807 5% 103,890 Danish Krone - 9,130 5% 457 Japanese Yen - 132,201 5% 6,610 Korean Won - 386,876 5% 19,344 Malaysian Ringgit - 141,785 5% 7,089 Mexican Peso - 3,920,732 5% 196,037 New Zealand Dollar - 2,889,302 5% 144,465 Polish Zloty - 196 5% 10 South African Rand - 3,809,693 5% 190,485 Swedish Krona - 5,506,494 5% 275,325 Swiss Franc - 9,189 5% 459 Thai Baht - 85,338 5% 4,267 US Dollar 44,808,451 5% 2,240,423
- 77,921,993 3,896,100 * Sensitivity movement is calculated on monetary amounts only.
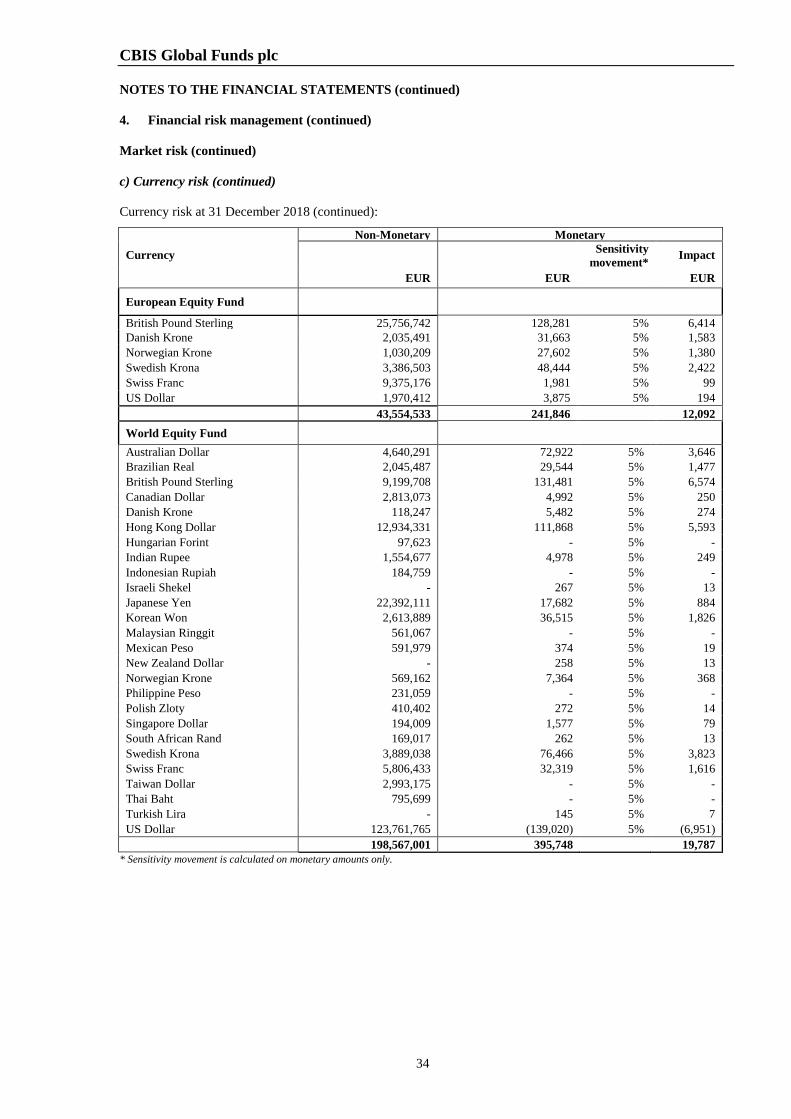
CBIS Global Funds plc NOTES TO THE FINANCIAL STATEMENTS (continued)
34
4. Financial risk management (continued) Market risk (continued) c) Currency risk (continued) Currency risk at 31 December 2018 (continued):
Non-Monetary Monetary
Currency Sensitivity movement* Impact
EUR EUR EUR
European Equity Fund
British Pound Sterling 25,756,742 128,281 5% 6,414 Danish Krone 2,035,491 31,663 5% 1,583 Norwegian Krone 1,030,209 27,602 5% 1,380 Swedish Krona 3,386,503 48,444 5% 2,422 Swiss Franc 9,375,176 1,981 5% 99 US Dollar 1,970,412 3,875 5% 194
43,554,533 241,846 12,092 World Equity Fund Australian Dollar 4,640,291 72,922 5% 3,646 Brazilian Real 2,045,487 29,544 5% 1,477 British Pound Sterling 9,199,708 131,481 5% 6,574 Canadian Dollar 2,813,073 4,992 5% 250 Danish Krone 118,247 5,482 5% 274 Hong Kong Dollar 12,934,331 111,868 5% 5,593 Hungarian Forint 97,623 - 5% - Indian Rupee 1,554,677 4,978 5% 249 Indonesian Rupiah 184,759 - 5% - Israeli Shekel - 267 5% 13 Japanese Yen 22,392,111 17,682 5% 884 Korean Won 2,613,889 36,515 5% 1,826 Malaysian Ringgit 561,067 - 5% - Mexican Peso 591,979 374 5% 19 New Zealand Dollar - 258 5% 13 Norwegian Krone 569,162 7,364 5% 368 Philippine Peso 231,059 - 5% - Polish Zloty 410,402 272 5% 14 Singapore Dollar 194,009 1,577 5% 79 South African Rand 169,017 262 5% 13 Swedish Krona 3,889,038 76,466 5% 3,823 Swiss Franc 5,806,433 32,319 5% 1,616 Taiwan Dollar 2,993,175 - 5% - Thai Baht 795,699 - 5% - Turkish Lira - 145 5% 7 US Dollar 123,761,765 (139,020) 5% (6,951) 198,567,001 395,748 19,787
* Sensitivity movement is calculated on monetary amounts only.
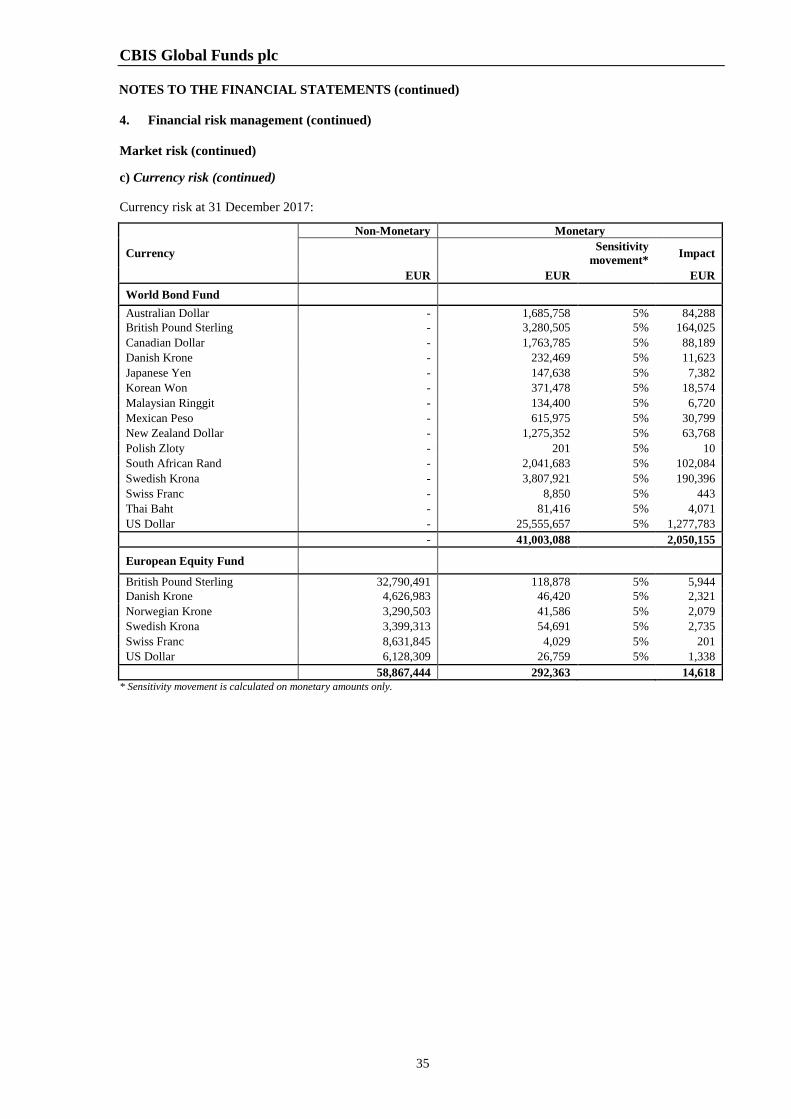
CBIS Global Funds plc NOTES TO THE FINANCIAL STATEMENTS (continued)
35
4. Financial risk management (continued) Market risk (continued) c) Currency risk (continued) Currency risk at 31 December 2017:
Non-Monetary Monetary Currency
Sensitivity movement* Impact
EUR EUR
EUR World Bond Fund Australian Dollar - 1,685,758 5% 84,288 British Pound Sterling - 3,280,505 5% 164,025 Canadian Dollar - 1,763,785 5% 88,189 Danish Krone - 232,469 5% 11,623 Japanese Yen - 147,638 5% 7,382 Korean Won - 371,478 5% 18,574 Malaysian Ringgit - 134,400 5% 6,720 Mexican Peso - 615,975 5% 30,799 New Zealand Dollar - 1,275,352 5% 63,768 Polish Zloty - 201 5% 10 South African Rand - 2,041,683 5% 102,084 Swedish Krona - 3,807,921 5% 190,396 Swiss Franc - 8,850 5% 443 Thai Baht - 81,416 5% 4,071 US Dollar - 25,555,657 5% 1,277,783
- 41,003,088 2,050,155
European Equity Fund
British Pound Sterling 32,790,491 118,878 5% 5,944 Danish Krone 4,626,983 46,420 5% 2,321 Norwegian Krone 3,290,503 41,586 5% 2,079 Swedish Krona 3,399,313 54,691 5% 2,735 Swiss Franc 8,631,845 4,029 5% 201 US Dollar 6,128,309 26,759 5% 1,338
58,867,444 292,363 14,618 * Sensitivity movement is calculated on monetary amounts only.
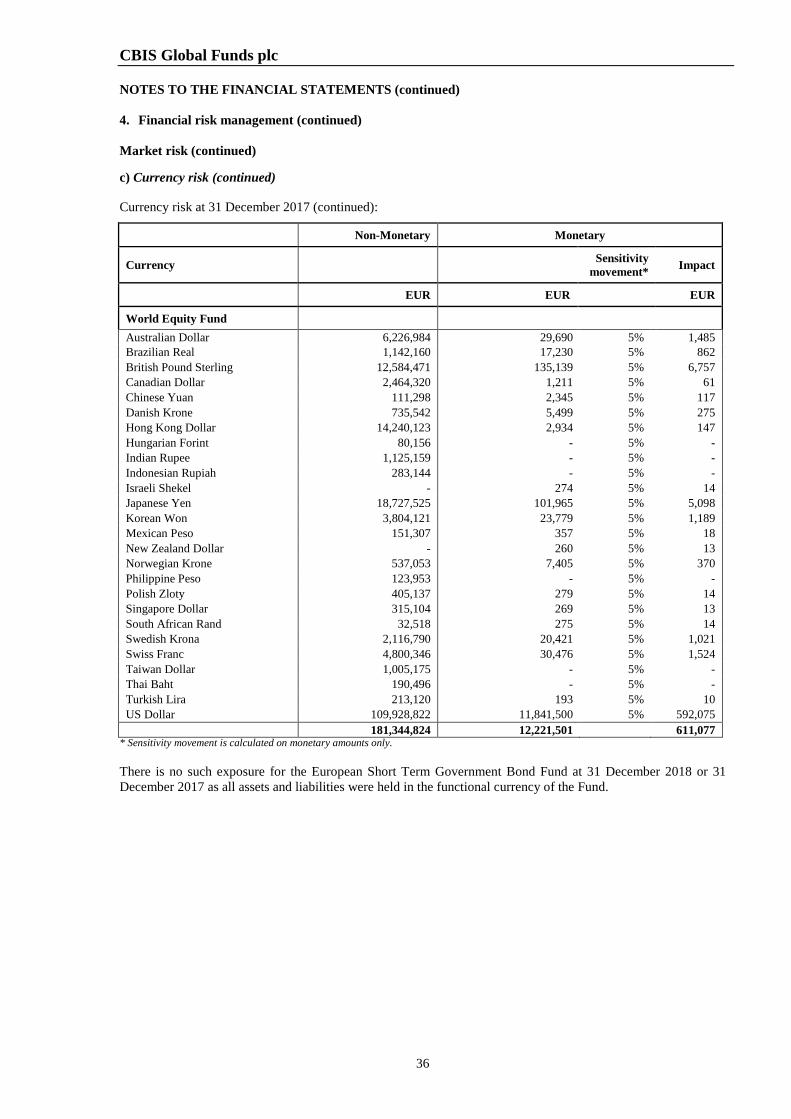
CBIS Global Funds plc NOTES TO THE FINANCIAL STATEMENTS (continued)
36
4. Financial risk management (continued) Market risk (continued) c) Currency risk (continued) Currency risk at 31 December 2017 (continued):
Non-Monetary Monetary
Currency Sensitivity movement* Impact
EUR EUR EUR
World Equity Fund Australian Dollar 6,226,984 29,690 5% 1,485 Brazilian Real 1,142,160 17,230 5% 862 British Pound Sterling 12,584,471 135,139 5% 6,757 Canadian Dollar 2,464,320 1,211 5% 61 Chinese Yuan 111,298 2,345 5% 117 Danish Krone 735,542 5,499 5% 275 Hong Kong Dollar 14,240,123 2,934 5% 147 Hungarian Forint 80,156 - 5% - Indian Rupee 1,125,159 - 5% - Indonesian Rupiah 283,144 - 5% - Israeli Shekel - 274 5% 14 Japanese Yen 18,727,525 101,965 5% 5,098 Korean Won 3,804,121 23,779 5% 1,189 Mexican Peso 151,307 357 5% 18 New Zealand Dollar - 260 5% 13 Norwegian Krone 537,053 7,405 5% 370 Philippine Peso 123,953 - 5% - Polish Zloty 405,137 279 5% 14 Singapore Dollar 315,104 269 5% 13 South African Rand 32,518 275 5% 14 Swedish Krona 2,116,790 20,421 5% 1,021 Swiss Franc 4,800,346 30,476 5% 1,524 Taiwan Dollar 1,005,175 - 5% - Thai Baht 190,496 - 5% - Turkish Lira 213,120 193 5% 10 US Dollar 109,928,822 11,841,500 5% 592,075 181,344,824 12,221,501 611,077
* Sensitivity movement is calculated on monetary amounts only. There is no such exposure for the European Short Term Government Bond Fund at 31 December 2018 or 31 December 2017 as all assets and liabilities were held in the functional currency of the Fund.
CBIS Global Funds plc NOTES TO THE FINANCIAL STATEMENTS (continued)
37
4. Financial risk management (continued) d) Credit risk Credit risk is the risk that one party to a financial instrument will cause a financial loss for the other party by failing to discharge an obligation. This includes counterparty risk and issuer risk. Financial assets, which potentially expose the Company to credit risk, consist principally of interest bearing securities such as bonds, derivative instruments and investments in cash balances and deposits with and receivable from brokers. The extent of the Company’s exposure to credit risk in respect of these financial assets approximates their carrying value as recorded in the Company’s Statement of Financial Position. The Investment Manager reviews the periodic holdings reports of the sub-investment managers to ensure that the Prospectus guidelines of the Funds are met in regard to overall portfolio credit quality, as well as reviewing changes in credit exposure that occur through portfolio trades. The sub-investment managers manage issuer risk through building diversified portfolios, reflecting reasonable levels of individual issuer exposure depending on type of issuer (i.e., sovereign, corporate, etc.) and in reference to Fund benchmarks, as well as in accordance with the UCITS Regulations and the investment objectives of the Funds. Additionally, if required, the sub-investment managers will limit ownership of debt instruments to those instruments carrying a credit rating equal to or in excess of that provided for in the individual investment objectives of the Funds. Substantially all of the assets of the Company are held by BNY Mellon Trust Company (Ireland) Limited (the “Depositary”) as depositary of the Company. Bankruptcy or insolvency of the Depositary may cause the Company’s rights with respect to securities and other positions held by the Depositary to be delayed or limited. The Company’s securities are segregated from the assets of either the Depositary or its agents. Thus in the event of the insolvency or bankruptcy of the Depositary, the Company’s securities are segregated from those of the Depositary or its agents. The Company will, however, be exposed to the credit risk of the Depositary, or any sub-custodian used by the Depositary, in relation to the Company’s cash held by the Global Sub-Custodian. In the event of the insolvency or bankruptcy of the Depositary, the Company will be treated as a general creditor of the Depositary in relation to cash holdings of the Company. The Investment Manager monitors the credit quality of the Depositary on a monthly basis in order to mitigate risk. The ultimate parent company of the Depositary is the Bank of New York Mellon Corporation, which is a large American financial institution listed on the New York Stock Exchange whose long-term senior debt rating by Standard and Poor’s was A at the end of the financial year (2017: A). The margin cash of the European Short Term Government Bond Fund was held with UBS Limited, whose short term security rating by Standard & Poor’s was A-1 at the end of the financial year (31 December 2017: A-1). The margin cash of the World Bond Fund is held with Societe Generale International Limited, whose short term security rating by Standard & Poor's was A-1 at the end of the financial year (31 December 2017: A-1). The margin cash balance can be found on page 31. The counterparty for the open futures contracts held by the World Bond Fund is Societe Generale International Limited whose rating for its short term securities by Standard & Poor’s is A-1 (31 December 2017: A-1).
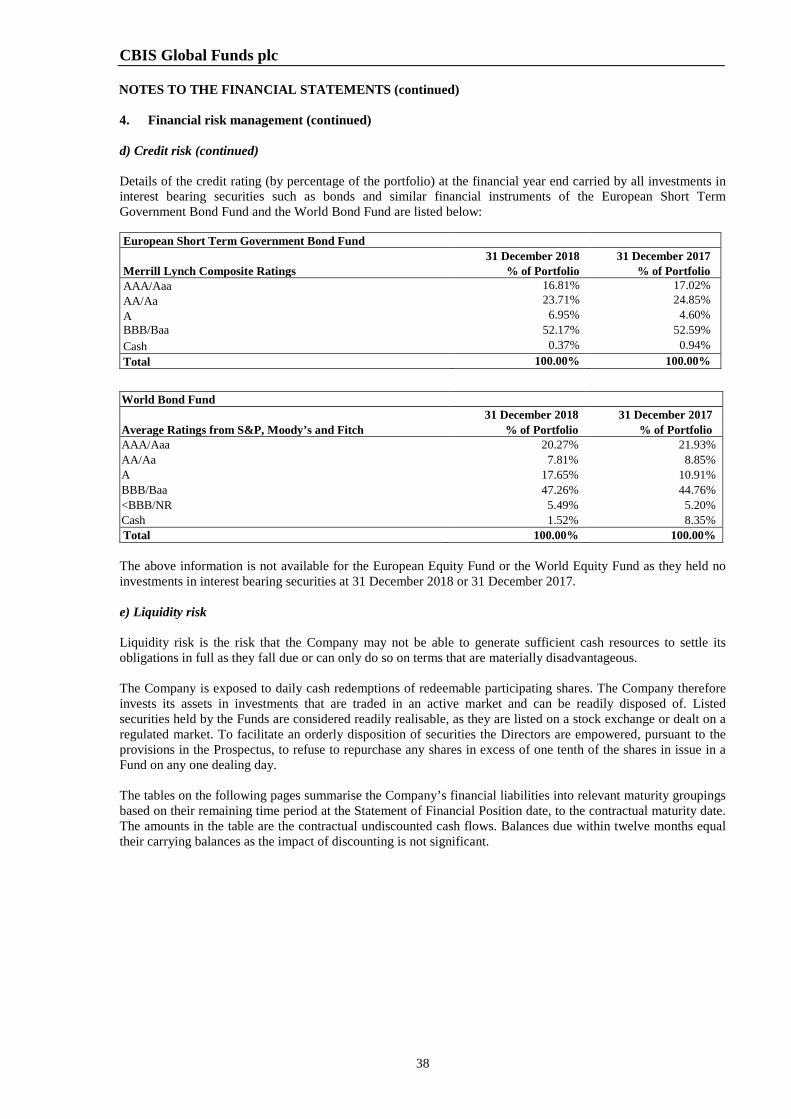
CBIS Global Funds plc NOTES TO THE FINANCIAL STATEMENTS (continued)
38
4. Financial risk management (continued) d) Credit risk (continued) Details of the credit rating (by percentage of the portfolio) at the financial year end carried by all investments in interest bearing securities such as bonds and similar financial instruments of the European Short Term Government Bond Fund and the World Bond Fund are listed below:
The above information is not available for the European Equity Fund or the World Equity Fund as they held no investments in interest bearing securities at 31 December 2018 or 31 December 2017. e) Liquidity risk Liquidity risk is the risk that the Company may not be able to generate sufficient cash resources to settle its obligations in full as they fall due or can only do so on terms that are materially disadvantageous. The Company is exposed to daily cash redemptions of redeemable participating shares. The Company therefore invests its assets in investments that are traded in an active market and can be readily disposed of. Listed securities held by the Funds are considered readily realisable, as they are listed on a stock exchange or dealt on a regulated market. To facilitate an orderly disposition of securities the Directors are empowered, pursuant to the provisions in the Prospectus, to refuse to repurchase any shares in excess of one tenth of the shares in issue in a Fund on any one dealing day. The tables on the following pages summarise the Company’s financial liabilities into relevant maturity groupings based on their remaining time period at the Statement of Financial Position date, to the contractual maturity date. The amounts in the table are the contractual undiscounted cash flows. Balances due within twelve months equal their carrying balances as the impact of discounting is not significant.
European Short Term Government Bond Fund 31 December 2018 31 December 2017 Merrill Lynch Composite Ratings % of Portfolio % of Portfolio AAA/Aaa 16.81% 17.02% AA/Aa 23.71% 24.85% A 6.95% 4.60% BBB/Baa
52.17% 52.59% Cash 0.37% 0.94% Total 100.00% 100.00%
World Bond Fund 31 December 2018 31 December 2017 Average Ratings from S&P, Moody’s and Fitch % of Portfolio % of Portfolio AAA/Aaa 20.27% 21.93% AA/Aa 7.81% 8.85% A 17.65% 10.91% BBB/Baa 47.26% 44.76% <BBB/NR 5.49% 5.20% Cash 1.52% 8.35% Total 100.00% 100.00%
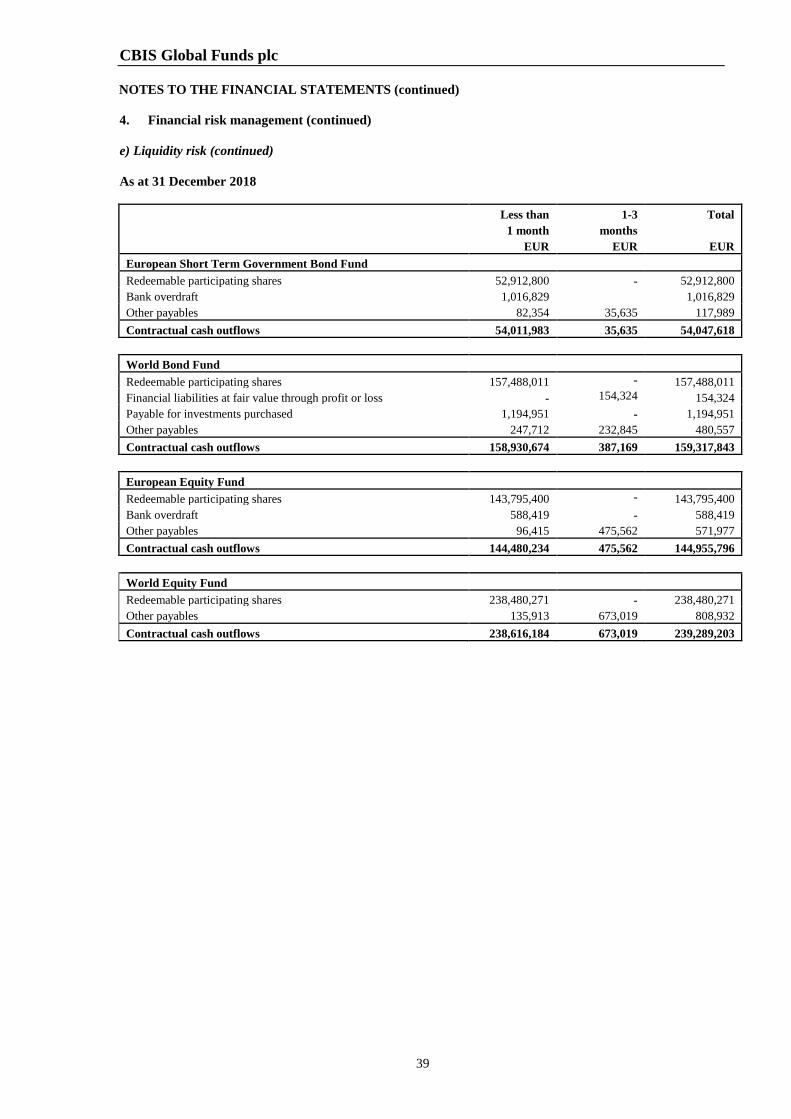
CBIS Global Funds plc NOTES TO THE FINANCIAL STATEMENTS (continued)
39
4. Financial risk management (continued) e) Liquidity risk (continued) As at 31 December 2018
Less than 1-3 Total 1 month months
EUR EUR EUR European Short Term Government Bond Fund Redeemable participating shares 52,912,800 - 52,912,800 Bank overdraft 1,016,829 1,016,829 Other payables 82,354 35,635 117,989 Contractual cash outflows 54,011,983 35,635 54,047,618
World Bond Fund Redeemable participating shares 157,488,011 - 157,488,011 Financial liabilities at fair value through profit or loss - 154,324 154,324 Payable for investments purchased 1,194,951 - 1,194,951 Other payables 247,712 232,845 480,557 Contractual cash outflows 158,930,674 387,169 159,317,843
European Equity Fund Redeemable participating shares 143,795,400 - 143,795,400 Bank overdraft 588,419 - 588,419 Other payables 96,415 475,562 571,977 Contractual cash outflows 144,480,234 475,562 144,955,796
World Equity Fund Redeemable participating shares 238,480,271 - 238,480,271 Other payables 135,913 673,019 808,932 Contractual cash outflows 238,616,184 673,019 239,289,203
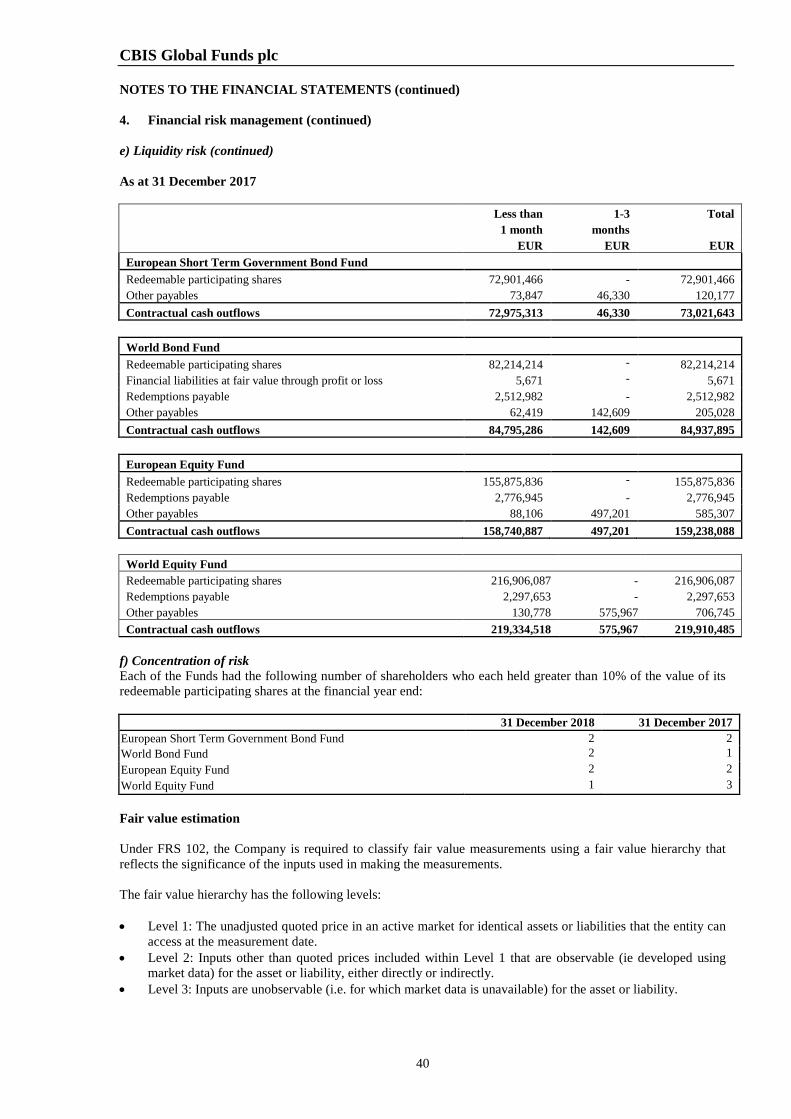
CBIS Global Funds plc NOTES TO THE FINANCIAL STATEMENTS (continued)
40
4. Financial risk management (continued) e) Liquidity risk (continued) As at 31 December 2017
Less than 1-3 Total 1 month months EUR EUR EUR European Short Term Government Bond Fund Redeemable participating shares 72,901,466 - 72,901,466 Other payables 73,847 46,330 120,177 Contractual cash outflows 72,975,313 46,330 73,021,643
World Bond Fund Redeemable participating shares 82,214,214 - 82,214,214 Financial liabilities at fair value through profit or loss 5,671 - 5,671 Redemptions payable 2,512,982 - 2,512,982 Other payables 62,419 142,609 205,028 Contractual cash outflows 84,795,286 142,609 84,937,895
European Equity Fund Redeemable participating shares 155,875,836 - 155,875,836 Redemptions payable 2,776,945 - 2,776,945 Other payables 88,106 497,201 585,307 Contractual cash outflows 158,740,887 497,201 159,238,088
World Equity Fund Redeemable participating shares 216,906,087 - 216,906,087 Redemptions payable 2,297,653 - 2,297,653 Other payables 130,778 575,967 706,745 Contractual cash outflows 219,334,518 575,967 219,910,485
f) Concentration of risk Each of the Funds had the following number of shareholders who each held greater than 10% of the value of its redeemable participating shares at the financial year end:
31 December 2018 31 December 2017 European Short Term Government Bond Fund 2 2 World Bond Fund 2 1 European Equity Fund 2 2 World Equity Fund 1 3 Fair value estimation Under FRS 102, the Company is required to classify fair value measurements using a fair value hierarchy that reflects the significance of the inputs used in making the measurements. The fair value hierarchy has the following levels: • Level 1: The unadjusted quoted price in an active market for identical assets or liabilities that the entity can
access at the measurement date. • Level 2: Inputs other than quoted prices included within Level 1 that are observable (ie developed using
market data) for the asset or liability, either directly or indirectly. • Level 3: Inputs are unobservable (i.e. for which market data is unavailable) for the asset or liability.
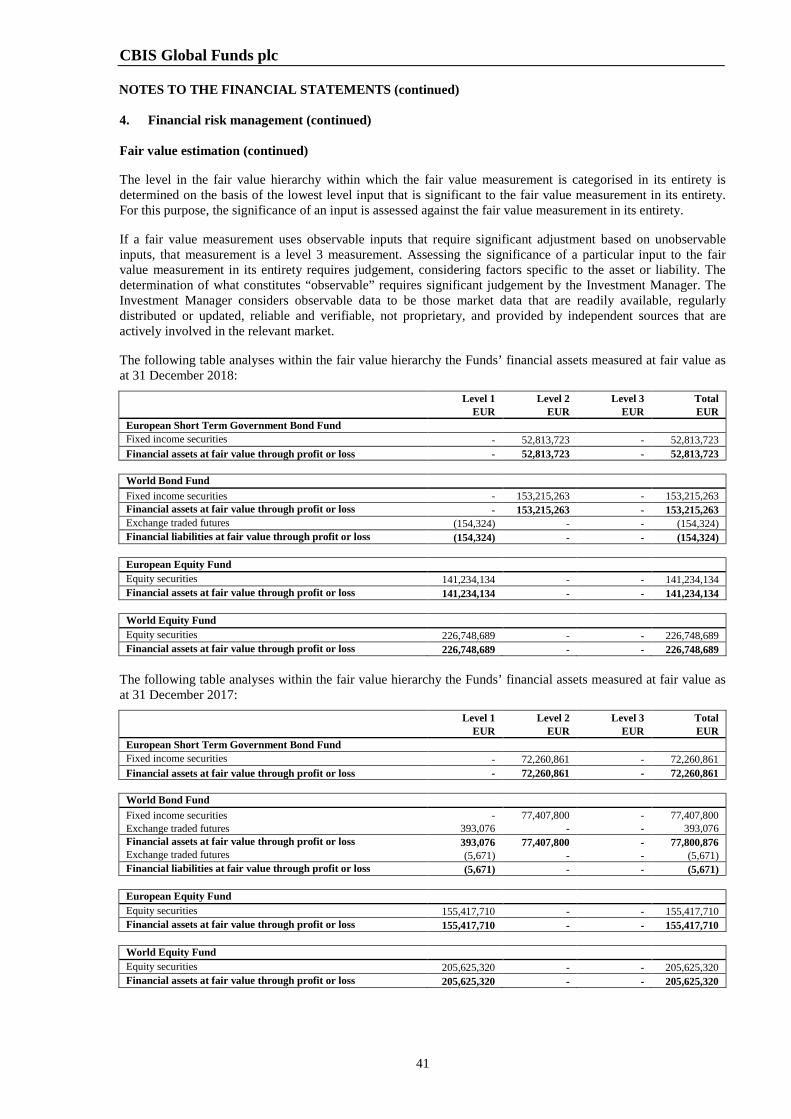
CBIS Global Funds plc NOTES TO THE FINANCIAL STATEMENTS (continued)
41
4. Financial risk management (continued) Fair value estimation (continued) The level in the fair value hierarchy within which the fair value measurement is categorised in its entirety is determined on the basis of the lowest level input that is significant to the fair value measurement in its entirety. For this purpose, the significance of an input is assessed against the fair value measurement in its entirety. If a fair value measurement uses observable inputs that require significant adjustment based on unobservable inputs, that measurement is a level 3 measurement. Assessing the significance of a particular input to the fair value measurement in its entirety requires judgement, considering factors specific to the asset or liability. The determination of what constitutes “observable” requires significant judgement by the Investment Manager. The Investment Manager considers observable data to be those market data that are readily available, regularly distributed or updated, reliable and verifiable, not proprietary, and provided by independent sources that are actively involved in the relevant market. The following table analyses within the fair value hierarchy the Funds’ financial assets measured at fair value as at 31 December 2018:
Level 1 Level 2 Level 3 Total EUR EUR EUR EUR European Short Term Government Bond Fund Fixed income securities - 52,813,723 - 52,813,723 Financial assets at fair value through profit or loss - 52,813,723 - 52,813,723
World Bond Fund Fixed income securities - 153,215,263 - 153,215,263 Financial assets at fair value through profit or loss - 153,215,263 - 153,215,263 Exchange traded futures (154,324) - - (154,324) Financial liabilities at fair value through profit or loss (154,324) - - (154,324)
European Equity Fund Equity securities 141,234,134 - - 141,234,134 Financial assets at fair value through profit or loss 141,234,134 - - 141,234,134 World Equity Fund Equity securities 226,748,689 - - 226,748,689 Financial assets at fair value through profit or loss 226,748,689 - - 226,748,689
The following table analyses within the fair value hierarchy the Funds’ financial assets measured at fair value as at 31 December 2017:
Level 1 Level 2 Level 3 Total EUR EUR EUR EUR European Short Term Government Bond Fund Fixed income securities - 72,260,861 - 72,260,861 Financial assets at fair value through profit or loss - 72,260,861 - 72,260,861
World Bond Fund Fixed income securities - 77,407,800 - 77,407,800 Exchange traded futures 393,076 - - 393,076 Financial assets at fair value through profit or loss 393,076 77,407,800 - 77,800,876 Exchange traded futures (5,671) - - (5,671) Financial liabilities at fair value through profit or loss (5,671) - - (5,671)
European Equity Fund Equity securities 155,417,710 - - 155,417,710 Financial assets at fair value through profit or loss 155,417,710 - - 155,417,710 World Equity Fund Equity securities 205,625,320 - - 205,625,320 Financial assets at fair value through profit or loss 205,625,320 - - 205,625,320
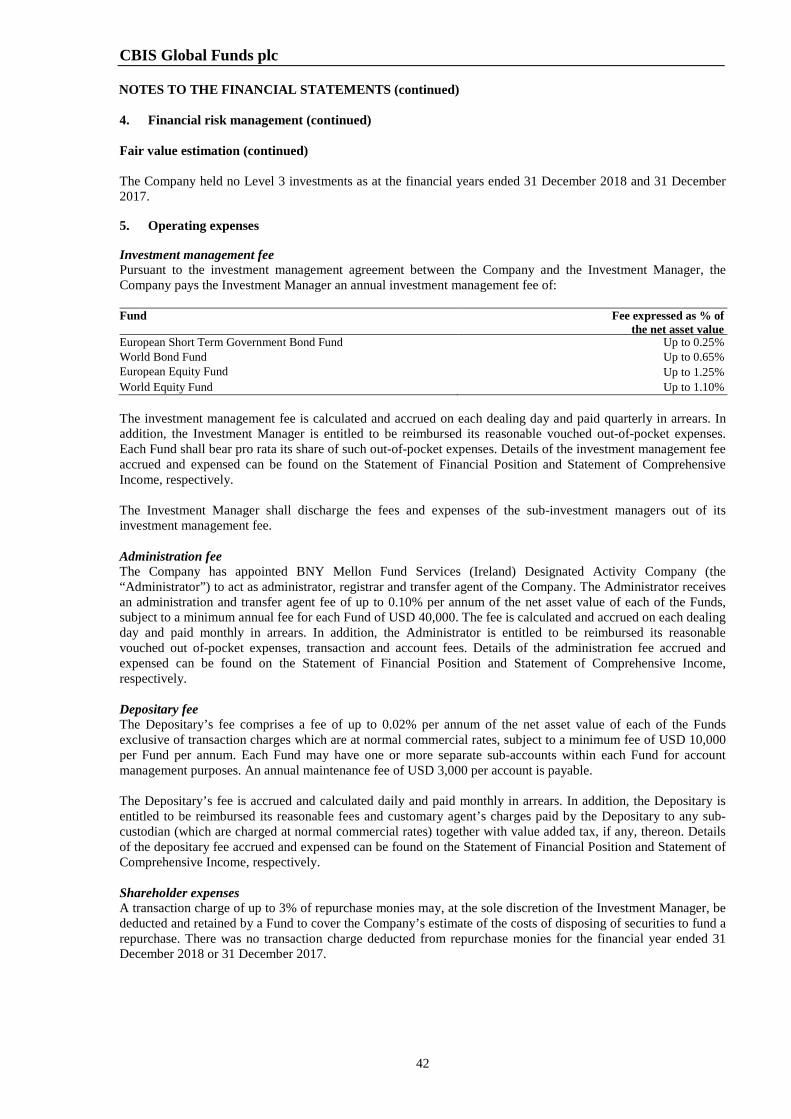
CBIS Global Funds plc NOTES TO THE FINANCIAL STATEMENTS (continued)
42
4. Financial risk management (continued) Fair value estimation (continued) The Company held no Level 3 investments as at the financial years ended 31 December 2018 and 31 December 2017. 5. Operating expenses Investment management fee Pursuant to the investment management agreement between the Company and the Investment Manager, the Company pays the Investment Manager an annual investment management fee of: Fund
Fee expressed as % of the net asset value
European Short Term Government Bond Fund Up to 0.25% World Bond Fund Up to 0.65% European Equity Fund
Up to 1.25% World Equity Fund Up to 1.10% The investment management fee is calculated and accrued on each dealing day and paid quarterly in arrears. In addition, the Investment Manager is entitled to be reimbursed its reasonable vouched out-of-pocket expenses. Each Fund shall bear pro rata its share of such out-of-pocket expenses. Details of the investment management fee accrued and expensed can be found on the Statement of Financial Position and Statement of Comprehensive Income, respectively. The Investment Manager shall discharge the fees and expenses of the sub-investment managers out of its investment management fee. Administration fee The Company has appointed BNY Mellon Fund Services (Ireland) Designated Activity Company (the “Administrator”) to act as administrator, registrar and transfer agent of the Company. The Administrator receives an administration and transfer agent fee of up to 0.10% per annum of the net asset value of each of the Funds, subject to a minimum annual fee for each Fund of USD 40,000. The fee is calculated and accrued on each dealing day and paid monthly in arrears. In addition, the Administrator is entitled to be reimbursed its reasonable vouched out of-pocket expenses, transaction and account fees. Details of the administration fee accrued and expensed can be found on the Statement of Financial Position and Statement of Comprehensive Income, respectively. Depositary fee The Depositary’s fee comprises a fee of up to 0.02% per annum of the net asset value of each of the Funds exclusive of transaction charges which are at normal commercial rates, subject to a minimum fee of USD 10,000 per Fund per annum. Each Fund may have one or more separate sub-accounts within each Fund for account management purposes. An annual maintenance fee of USD 3,000 per account is payable. The Depositary’s fee is accrued and calculated daily and paid monthly in arrears. In addition, the Depositary is entitled to be reimbursed its reasonable fees and customary agent’s charges paid by the Depositary to any sub-custodian (which are charged at normal commercial rates) together with value added tax, if any, thereon. Details of the depositary fee accrued and expensed can be found on the Statement of Financial Position and Statement of Comprehensive Income, respectively. Shareholder expenses A transaction charge of up to 3% of repurchase monies may, at the sole discretion of the Investment Manager, be deducted and retained by a Fund to cover the Company’s estimate of the costs of disposing of securities to fund a repurchase. There was no transaction charge deducted from repurchase monies for the financial year ended 31 December 2018 or 31 December 2017.
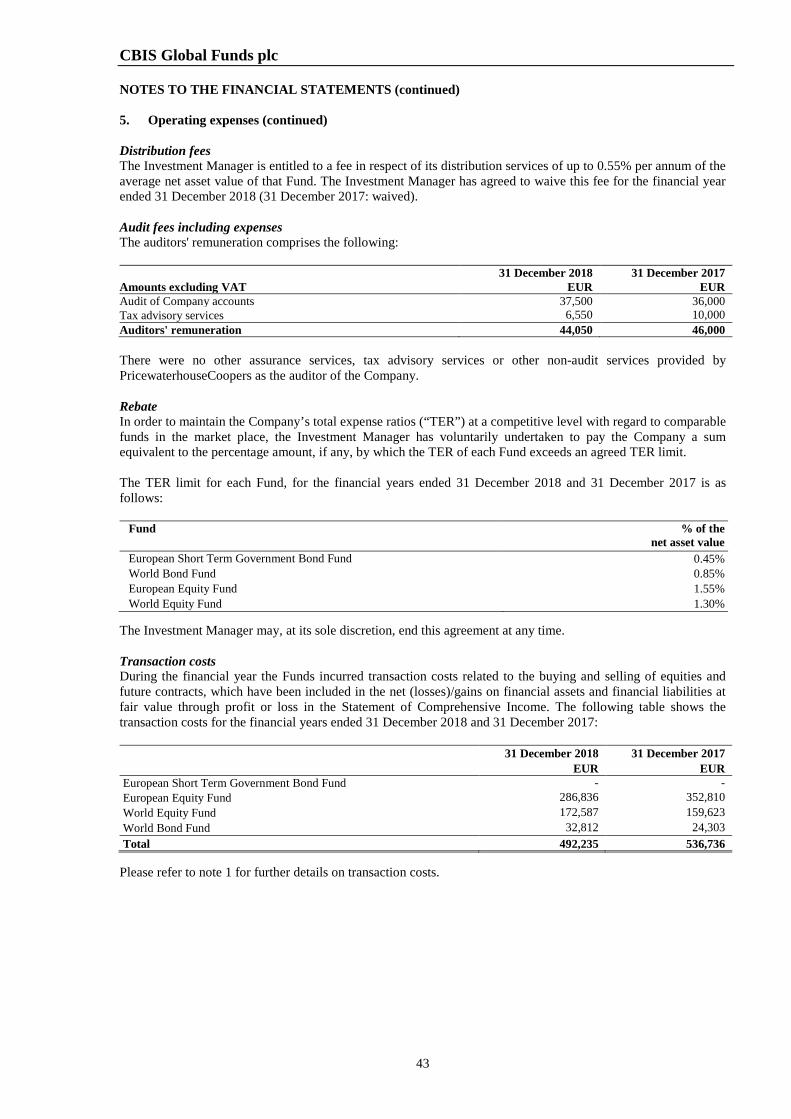
CBIS Global Funds plc NOTES TO THE FINANCIAL STATEMENTS (continued)
43
5. Operating expenses (continued) Distribution fees The Investment Manager is entitled to a fee in respect of its distribution services of up to 0.55% per annum of the average net asset value of that Fund. The Investment Manager has agreed to waive this fee for the financial year ended 31 December 2018 (31 December 2017: waived). Audit fees including expenses The auditors' remuneration comprises the following: 31 December 2018 31 December 2017 Amounts excluding VAT EUR EUR Audit of Company accounts 37,500 36,000 Tax advisory services 6,550 10,000 Auditors' remuneration 44,050 46,000 There were no other assurance services, tax advisory services or other non-audit services provided by PricewaterhouseCoopers as the auditor of the Company. Rebate In order to maintain the Company’s total expense ratios (“TER”) at a competitive level with regard to comparable funds in the market place, the Investment Manager has voluntarily undertaken to pay the Company a sum equivalent to the percentage amount, if any, by which the TER of each Fund exceeds an agreed TER limit. The TER limit for each Fund, for the financial years ended 31 December 2018 and 31 December 2017 is as follows:
Fund % of the net asset value
European Short Term Government Bond Fund
0.45% World Bond Fund 0.85% European Equity Fund 1.55% World Equity Fund 1.30%
The Investment Manager may, at its sole discretion, end this agreement at any time. Transaction costs During the financial year the Funds incurred transaction costs related to the buying and selling of equities and future contracts, which have been included in the net (losses)/gains on financial assets and financial liabilities at fair value through profit or loss in the Statement of Comprehensive Income. The following table shows the transaction costs for the financial years ended 31 December 2018 and 31 December 2017:
31 December 2018 31 December 2017 EUR EUR European Short Term Government Bond Fund - - European Equity Fund 286,836 352,810 World Equity Fund 172,587 159,623 World Bond Fund 32,812 24,303 Total 492,235 536,736
Please refer to note 1 for further details on transaction costs.
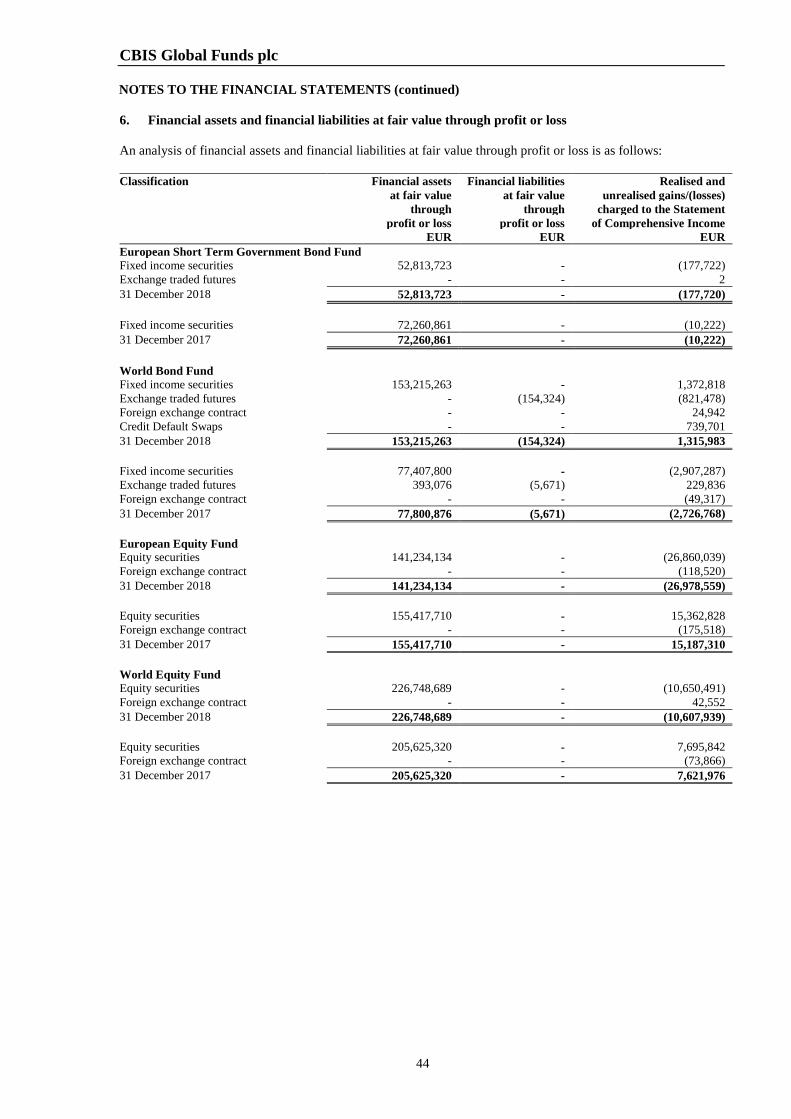
CBIS Global Funds plc NOTES TO THE FINANCIAL STATEMENTS (continued)
44
6. Financial assets and financial liabilities at fair value through profit or loss An analysis of financial assets and financial liabilities at fair value through profit or loss is as follows: Classification Financial assets Financial liabilities Realised and
at fair value at fair value unrealised gains/(losses) through through charged to the Statement profit or loss profit or loss of Comprehensive Income EUR EUR EUR
European Short Term Government Bond Fund Fixed income securities 52,813,723 - (177,722) Exchange traded futures - - 2 31 December 2018 52,813,723 - (177,720) Fixed income securities 72,260,861 - (10,222) 31 December 2017 72,260,861 - (10,222) World Bond Fund Fixed income securities 153,215,263 - 1,372,818 Exchange traded futures - (154,324) (821,478) Foreign exchange contract - - 24,942 Credit Default Swaps - - 739,701 31 December 2018 153,215,263 (154,324) 1,315,983 Fixed income securities 77,407,800 - (2,907,287) Exchange traded futures 393,076 (5,671) 229,836 Foreign exchange contract - - (49,317) 31 December 2017 77,800,876 (5,671) (2,726,768) European Equity Fund Equity securities 141,234,134 - (26,860,039) Foreign exchange contract - - (118,520) 31 December 2018 141,234,134 - (26,978,559) Equity securities 155,417,710 - 15,362,828 Foreign exchange contract - - (175,518) 31 December 2017 155,417,710 - 15,187,310 World Equity Fund Equity securities 226,748,689 - (10,650,491) Foreign exchange contract - - 42,552 31 December 2018 226,748,689 - (10,607,939) Equity securities 205,625,320 - 7,695,842 Foreign exchange contract - - (73,866) 31 December 2017 205,625,320 - 7,621,976
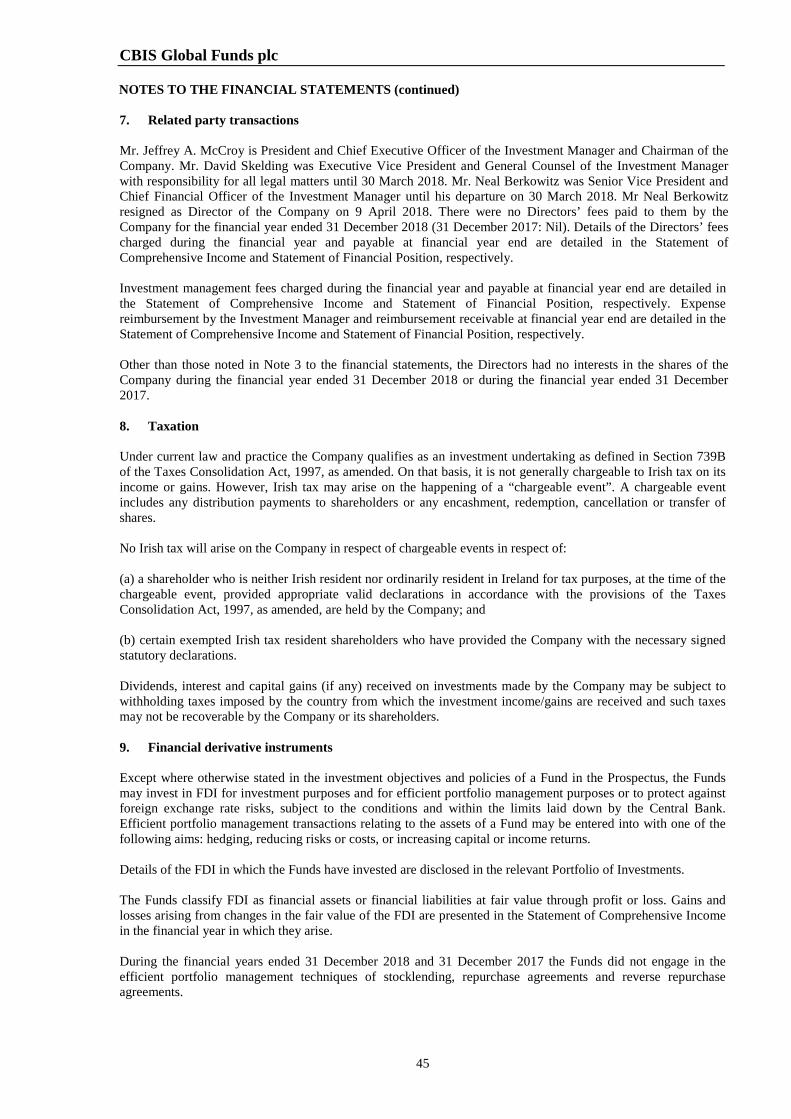
CBIS Global Funds plc NOTES TO THE FINANCIAL STATEMENTS (continued)
45
7. Related party transactions Mr. Jeffrey A. McCroy is President and Chief Executive Officer of the Investment Manager and Chairman of the Company. Mr. David Skelding was Executive Vice President and General Counsel of the Investment Manager with responsibility for all legal matters until 30 March 2018. Mr. Neal Berkowitz was Senior Vice President and Chief Financial Officer of the Investment Manager until his departure on 30 March 2018. Mr Neal Berkowitz resigned as Director of the Company on 9 April 2018. There were no Directors’ fees paid to them by the Company for the financial year ended 31 December 2018 (31 December 2017: Nil). Details of the Directors’ fees charged during the financial year and payable at financial year end are detailed in the Statement of Comprehensive Income and Statement of Financial Position, respectively. Investment management fees charged during the financial year and payable at financial year end are detailed in the Statement of Comprehensive Income and Statement of Financial Position, respectively. Expense reimbursement by the Investment Manager and reimbursement receivable at financial year end are detailed in the Statement of Comprehensive Income and Statement of Financial Position, respectively. Other than those noted in Note 3 to the financial statements, the Directors had no interests in the shares of the Company during the financial year ended 31 December 2018 or during the financial year ended 31 December 2017. 8. Taxation Under current law and practice the Company qualifies as an investment undertaking as defined in Section 739B of the Taxes Consolidation Act, 1997, as amended. On that basis, it is not generally chargeable to Irish tax on its income or gains. However, Irish tax may arise on the happening of a “chargeable event”. A chargeable event includes any distribution payments to shareholders or any encashment, redemption, cancellation or transfer of shares. No Irish tax will arise on the Company in respect of chargeable events in respect of: (a) a shareholder who is neither Irish resident nor ordinarily resident in Ireland for tax purposes, at the time of the chargeable event, provided appropriate valid declarations in accordance with the provisions of the Taxes Consolidation Act, 1997, as amended, are held by the Company; and (b) certain exempted Irish tax resident shareholders who have provided the Company with the necessary signed statutory declarations. Dividends, interest and capital gains (if any) received on investments made by the Company may be subject to withholding taxes imposed by the country from which the investment income/gains are received and such taxes may not be recoverable by the Company or its shareholders. 9. Financial derivative instruments Except where otherwise stated in the investment objectives and policies of a Fund in the Prospectus, the Funds may invest in FDI for investment purposes and for efficient portfolio management purposes or to protect against foreign exchange rate risks, subject to the conditions and within the limits laid down by the Central Bank. Efficient portfolio management transactions relating to the assets of a Fund may be entered into with one of the following aims: hedging, reducing risks or costs, or increasing capital or income returns. Details of the FDI in which the Funds have invested are disclosed in the relevant Portfolio of Investments. The Funds classify FDI as financial assets or financial liabilities at fair value through profit or loss. Gains and losses arising from changes in the fair value of the FDI are presented in the Statement of Comprehensive Income in the financial year in which they arise. During the financial years ended 31 December 2018 and 31 December 2017 the Funds did not engage in the efficient portfolio management techniques of stocklending, repurchase agreements and reverse repurchase agreements.
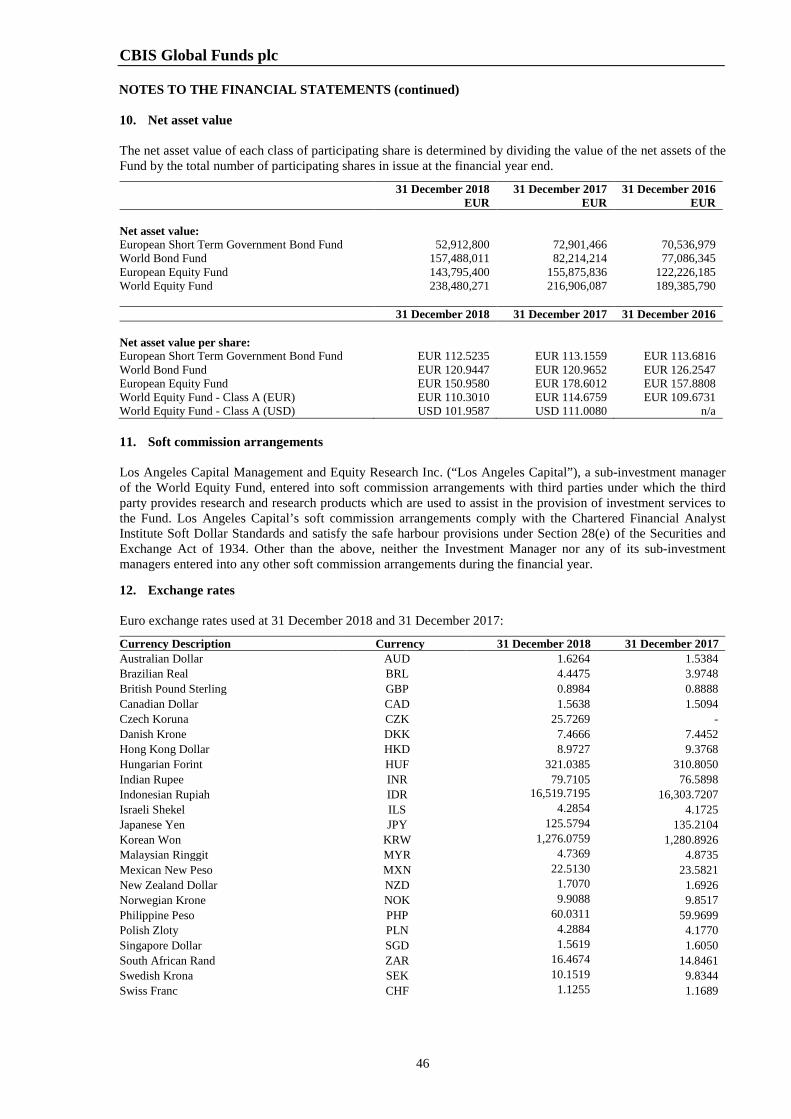
CBIS Global Funds plc NOTES TO THE FINANCIAL STATEMENTS (continued)
46
10. Net asset value The net asset value of each class of participating share is determined by dividing the value of the net assets of the Fund by the total number of participating shares in issue at the financial year end.
31 December 2018 31 December 2017 31 December 2016 EUR EUR EUR Net asset value: European Short Term Government Bond Fund 52,912,800 72,901,466 70,536,979 World Bond Fund 157,488,011 82,214,214 77,086,345 European Equity Fund 143,795,400 155,875,836 122,226,185 World Equity Fund 238,480,271 216,906,087 189,385,790 31 December 2018 31 December 2017 31 December 2016 Net asset value per share: European Short Term Government Bond Fund EUR 112.5235 EUR 113.1559 EUR 113.6816 World Bond Fund EUR 120.9447 EUR 120.9652 EUR 126.2547 European Equity Fund EUR 150.9580 EUR 178.6012 EUR 157.8808 World Equity Fund - Class A (EUR) EUR 110.3010 EUR 114.6759 EUR 109.6731 World Equity Fund - Class A (USD) USD 101.9587 USD 111.0080 n/a 11. Soft commission arrangements Los Angeles Capital Management and Equity Research Inc. (“Los Angeles Capital”), a sub-investment manager of the World Equity Fund, entered into soft commission arrangements with third parties under which the third party provides research and research products which are used to assist in the provision of investment services to the Fund. Los Angeles Capital’s soft commission arrangements comply with the Chartered Financial Analyst Institute Soft Dollar Standards and satisfy the safe harbour provisions under Section 28(e) of the Securities and Exchange Act of 1934. Other than the above, neither the Investment Manager nor any of its sub-investment managers entered into any other soft commission arrangements during the financial year. 12. Exchange rates Euro exchange rates used at 31 December 2018 and 31 December 2017:
Currency Description Currency 31 December 2018 31 December 2017 Australian Dollar AUD 1.6264 1.5384 Brazilian Real BRL 4.4475 3.9748 British Pound Sterling GBP 0.8984 0.8888 Canadian Dollar CAD 1.5638 1.5094 Czech Koruna CZK 25.7269 - Danish Krone DKK 7.4666 7.4452 Hong Kong Dollar HKD 8.9727 9.3768 Hungarian Forint HUF 321.0385 310.8050 Indian Rupee INR 79.7105 76.5898 Indonesian Rupiah IDR 16,519.7195
16,303.7207
Israeli Shekel ILS 4.2854
4.1725 Japanese Yen JPY 125.5794
135.2104
Korean Won KRW 1,276.0759
1,280.8926 Malaysian Ringgit MYR 4.7369
4.8735
Mexican New Peso MXN 22.5130
23.5821 New Zealand Dollar NZD 1.7070
1.6926
Norwegian Krone NOK 9.9088
9.8517 Philippine Peso PHP 60.0311
59.9699
Polish Zloty PLN 4.2884
4.1770 Singapore Dollar SGD 1.5619
1.6050
South African Rand ZAR 16.4674
14.8461 Swedish Krona SEK 10.1519
9.8344
Swiss Franc CHF 1.1255
1.1689
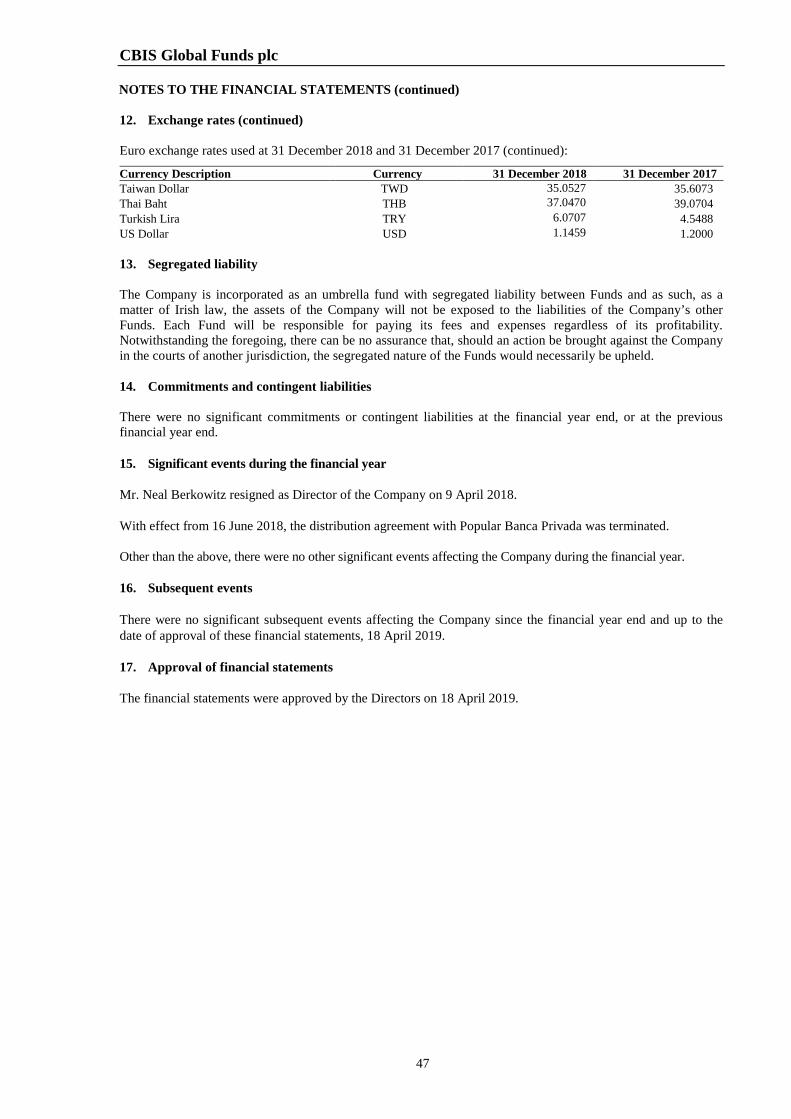
CBIS Global Funds plc NOTES TO THE FINANCIAL STATEMENTS (continued)
47
12. Exchange rates (continued) Euro exchange rates used at 31 December 2018 and 31 December 2017 (continued):
Currency Description Currency 31 December 2018 31 December 2017 Taiwan Dollar TWD 35.0527
35.6073
Thai Baht THB 37.0470
39.0704 Turkish Lira TRY 6.0707
4.5488
US Dollar USD 1.1459
1.2000 13. Segregated liability The Company is incorporated as an umbrella fund with segregated liability between Funds and as such, as a matter of Irish law, the assets of the Company will not be exposed to the liabilities of the Company’s other Funds. Each Fund will be responsible for paying its fees and expenses regardless of its profitability. Notwithstanding the foregoing, there can be no assurance that, should an action be brought against the Company in the courts of another jurisdiction, the segregated nature of the Funds would necessarily be upheld. 14. Commitments and contingent liabilities There were no significant commitments or contingent liabilities at the financial year end, or at the previous financial year end. 15. Significant events during the financial year Mr. Neal Berkowitz resigned as Director of the Company on 9 April 2018. With effect from 16 June 2018, the distribution agreement with Popular Banca Privada was terminated. Other than the above, there were no other significant events affecting the Company during the financial year. 16. Subsequent events There were no significant subsequent events affecting the Company since the financial year end and up to the date of approval of these financial statements, 18 April 2019. 17. Approval of financial statements The financial statements were approved by the Directors on 18 April 2019.
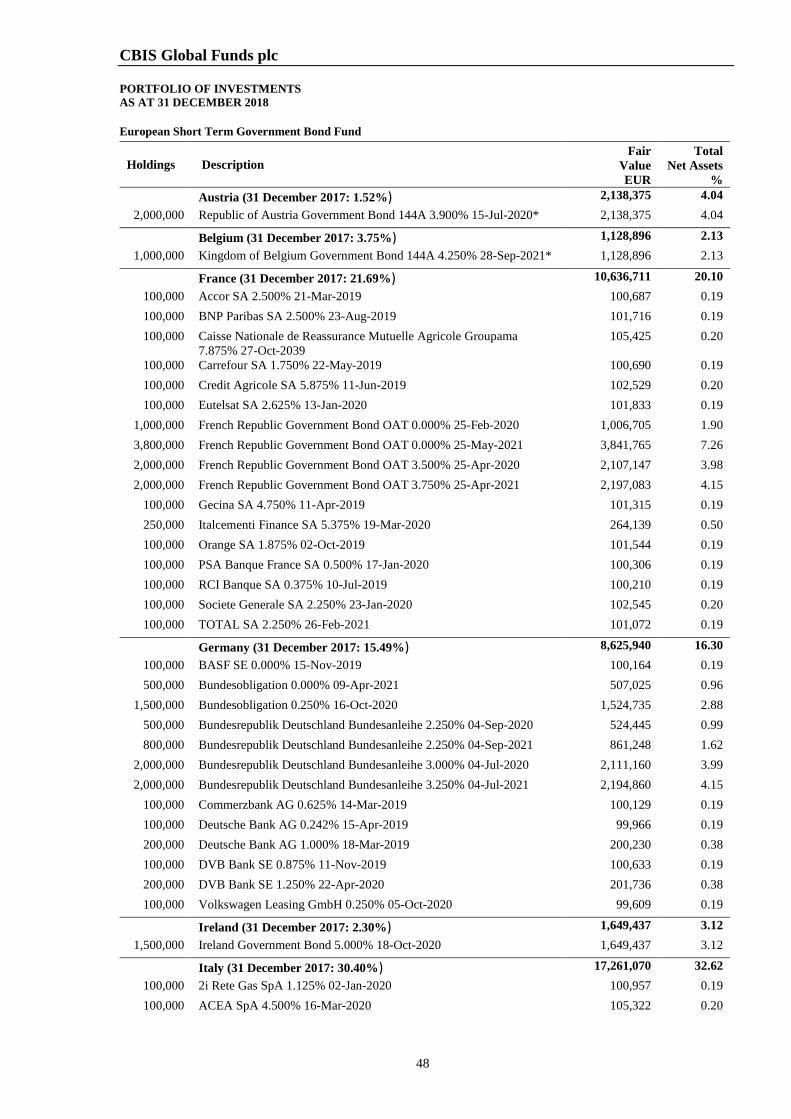
CBIS Global Funds plc PORTFOLIO OF INVESTMENTS AS AT 31 DECEMBER 2018
48
European Short Term Government Bond Fund
Holdings Description Fair
Value EUR
Total Net Assets
% Austria (31 December 2017: 1.52%) 2,138,375 4.04
2,000,000 Republic of Austria Government Bond 144A 3.900% 15-Jul-2020* 2,138,375 4.04
Belgium (31 December 2017: 3.75%) 1,128,896 2.13 1,000,000 Kingdom of Belgium Government Bond 144A 4.250% 28-Sep-2021* 1,128,896 2.13
France (31 December 2017: 21.69%) 10,636,711 20.10 100,000 Accor SA 2.500% 21-Mar-2019 100,687 0.19 100,000 BNP Paribas SA 2.500% 23-Aug-2019 101,716 0.19 100,000 Caisse Nationale de Reassurance Mutuelle Agricole Groupama
7.875% 27-Oct-2039 105,425 0.20
100,000 Carrefour SA 1.750% 22-May-2019 100,690 0.19 100,000 Credit Agricole SA 5.875% 11-Jun-2019 102,529 0.20 100,000 Eutelsat SA 2.625% 13-Jan-2020 101,833 0.19
1,000,000 French Republic Government Bond OAT 0.000% 25-Feb-2020 1,006,705 1.90 3,800,000 French Republic Government Bond OAT 0.000% 25-May-2021 3,841,765 7.26 2,000,000 French Republic Government Bond OAT 3.500% 25-Apr-2020 2,107,147 3.98 2,000,000 French Republic Government Bond OAT 3.750% 25-Apr-2021 2,197,083 4.15
100,000 Gecina SA 4.750% 11-Apr-2019 101,315 0.19 250,000 Italcementi Finance SA 5.375% 19-Mar-2020 264,139 0.50 100,000 Orange SA 1.875% 02-Oct-2019 101,544 0.19 100,000 PSA Banque France SA 0.500% 17-Jan-2020 100,306 0.19 100,000 RCI Banque SA 0.375% 10-Jul-2019 100,210 0.19 100,000 Societe Generale SA 2.250% 23-Jan-2020 102,545 0.20 100,000 TOTAL SA 2.250% 26-Feb-2021 101,072 0.19
Germany (31 December 2017: 15.49%) 8,625,940 16.30 100,000 BASF SE 0.000% 15-Nov-2019 100,164 0.19 500,000 Bundesobligation 0.000% 09-Apr-2021 507,025 0.96
1,500,000 Bundesobligation 0.250% 16-Oct-2020 1,524,735 2.88 500,000 Bundesrepublik Deutschland Bundesanleihe 2.250% 04-Sep-2020 524,445 0.99 800,000 Bundesrepublik Deutschland Bundesanleihe 2.250% 04-Sep-2021 861,248 1.62
2,000,000 Bundesrepublik Deutschland Bundesanleihe 3.000% 04-Jul-2020 2,111,160 3.99 2,000,000 Bundesrepublik Deutschland Bundesanleihe 3.250% 04-Jul-2021 2,194,860 4.15
100,000 Commerzbank AG 0.625% 14-Mar-2019 100,129 0.19 100,000 Deutsche Bank AG 0.242% 15-Apr-2019 99,966 0.19 200,000 Deutsche Bank AG 1.000% 18-Mar-2019 200,230 0.38 100,000 DVB Bank SE 0.875% 11-Nov-2019 100,633 0.19 200,000 DVB Bank SE 1.250% 22-Apr-2020 201,736 0.38 100,000 Volkswagen Leasing GmbH 0.250% 05-Oct-2020 99,609 0.19
Ireland (31 December 2017: 2.30%) 1,649,437 3.12 1,500,000 Ireland Government Bond 5.000% 18-Oct-2020 1,649,437 3.12
Italy (31 December 2017: 30.40%) 17,261,070 32.62 100,000 2i Rete Gas SpA 1.125% 02-Jan-2020 100,957 0.19 100,000 ACEA SpA 4.500% 16-Mar-2020 105,322 0.20
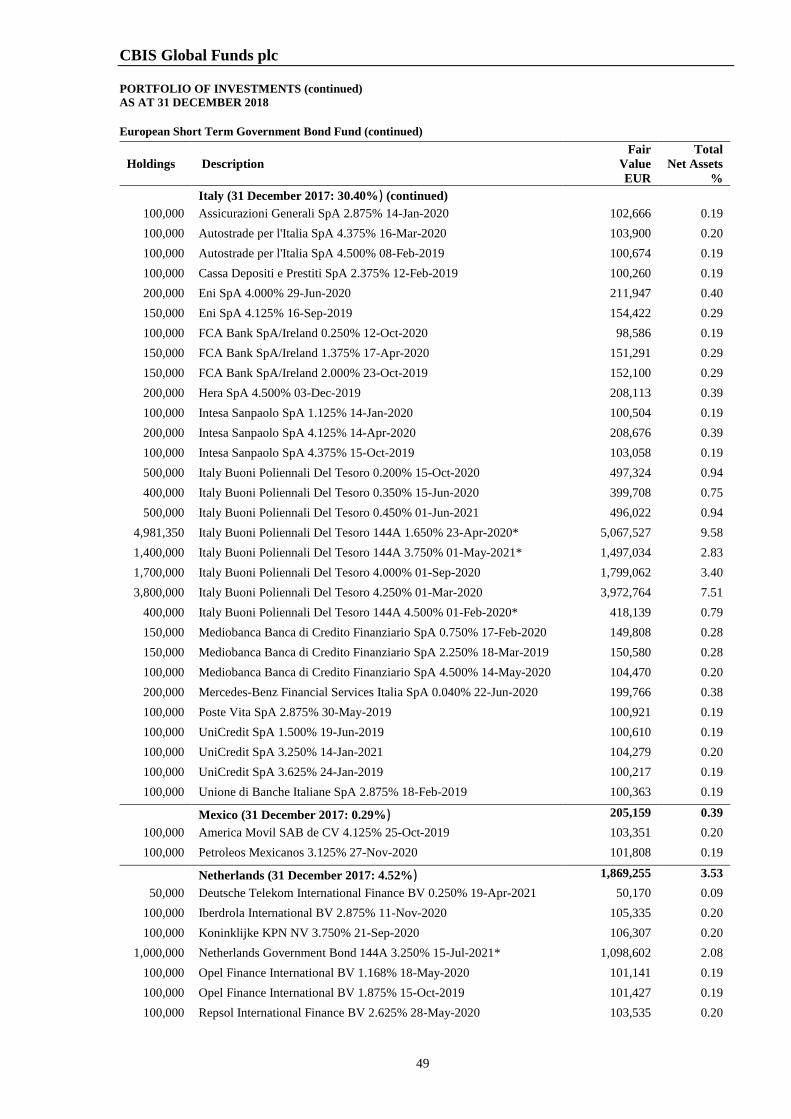
CBIS Global Funds plc PORTFOLIO OF INVESTMENTS (continued) AS AT 31 DECEMBER 2018
49
European Short Term Government Bond Fund (continued)
Holdings Description Fair
Value EUR
Total Net Assets
% Italy (31 December 2017: 30.40%) (continued)
100,000 Assicurazioni Generali SpA 2.875% 14-Jan-2020 102,666 0.19 100,000 Autostrade per l'Italia SpA 4.375% 16-Mar-2020 103,900 0.20 100,000 Autostrade per l'Italia SpA 4.500% 08-Feb-2019 100,674 0.19 100,000 Cassa Depositi e Prestiti SpA 2.375% 12-Feb-2019 100,260 0.19 200,000 Eni SpA 4.000% 29-Jun-2020 211,947 0.40 150,000 Eni SpA 4.125% 16-Sep-2019 154,422 0.29 100,000 FCA Bank SpA/Ireland 0.250% 12-Oct-2020 98,586 0.19 150,000 FCA Bank SpA/Ireland 1.375% 17-Apr-2020 151,291 0.29 150,000 FCA Bank SpA/Ireland 2.000% 23-Oct-2019 152,100 0.29 200,000 Hera SpA 4.500% 03-Dec-2019 208,113 0.39 100,000 Intesa Sanpaolo SpA 1.125% 14-Jan-2020 100,504 0.19 200,000 Intesa Sanpaolo SpA 4.125% 14-Apr-2020 208,676 0.39 100,000 Intesa Sanpaolo SpA 4.375% 15-Oct-2019 103,058 0.19 500,000 Italy Buoni Poliennali Del Tesoro 0.200% 15-Oct-2020 497,324 0.94 400,000 Italy Buoni Poliennali Del Tesoro 0.350% 15-Jun-2020 399,708 0.75 500,000 Italy Buoni Poliennali Del Tesoro 0.450% 01-Jun-2021 496,022 0.94
4,981,350 Italy Buoni Poliennali Del Tesoro 144A 1.650% 23-Apr-2020* 5,067,527 9.58 1,400,000 Italy Buoni Poliennali Del Tesoro 144A 3.750% 01-May-2021* 1,497,034 2.83 1,700,000 Italy Buoni Poliennali Del Tesoro 4.000% 01-Sep-2020 1,799,062 3.40 3,800,000 Italy Buoni Poliennali Del Tesoro 4.250% 01-Mar-2020 3,972,764 7.51
400,000 Italy Buoni Poliennali Del Tesoro 144A 4.500% 01-Feb-2020* 418,139 0.79 150,000 Mediobanca Banca di Credito Finanziario SpA 0.750% 17-Feb-2020 149,808 0.28 150,000 Mediobanca Banca di Credito Finanziario SpA 2.250% 18-Mar-2019 150,580 0.28 100,000 Mediobanca Banca di Credito Finanziario SpA 4.500% 14-May-2020 104,470 0.20 200,000 Mercedes-Benz Financial Services Italia SpA 0.040% 22-Jun-2020 199,766 0.38 100,000 Poste Vita SpA 2.875% 30-May-2019 100,921 0.19 100,000 UniCredit SpA 1.500% 19-Jun-2019 100,610 0.19 100,000 UniCredit SpA 3.250% 14-Jan-2021 104,279 0.20 100,000 UniCredit SpA 3.625% 24-Jan-2019 100,217 0.19 100,000 Unione di Banche Italiane SpA 2.875% 18-Feb-2019 100,363 0.19
Mexico (31 December 2017: 0.29%) 205,159 0.39 100,000 America Movil SAB de CV 4.125% 25-Oct-2019 103,351 0.20 100,000 Petroleos Mexicanos 3.125% 27-Nov-2020 101,808 0.19
Netherlands (31 December 2017: 4.52%) 1,869,255 3.53 50,000 Deutsche Telekom International Finance BV 0.250% 19-Apr-2021 50,170 0.09
100,000 Iberdrola International BV 2.875% 11-Nov-2020 105,335 0.20 100,000 Koninklijke KPN NV 3.750% 21-Sep-2020 106,307 0.20
1,000,000 Netherlands Government Bond 144A 3.250% 15-Jul-2021* 1,098,602 2.08 100,000 Opel Finance International BV 1.168% 18-May-2020 101,141 0.19 100,000 Opel Finance International BV 1.875% 15-Oct-2019 101,427 0.19 100,000 Repsol International Finance BV 2.625% 28-May-2020 103,535 0.20
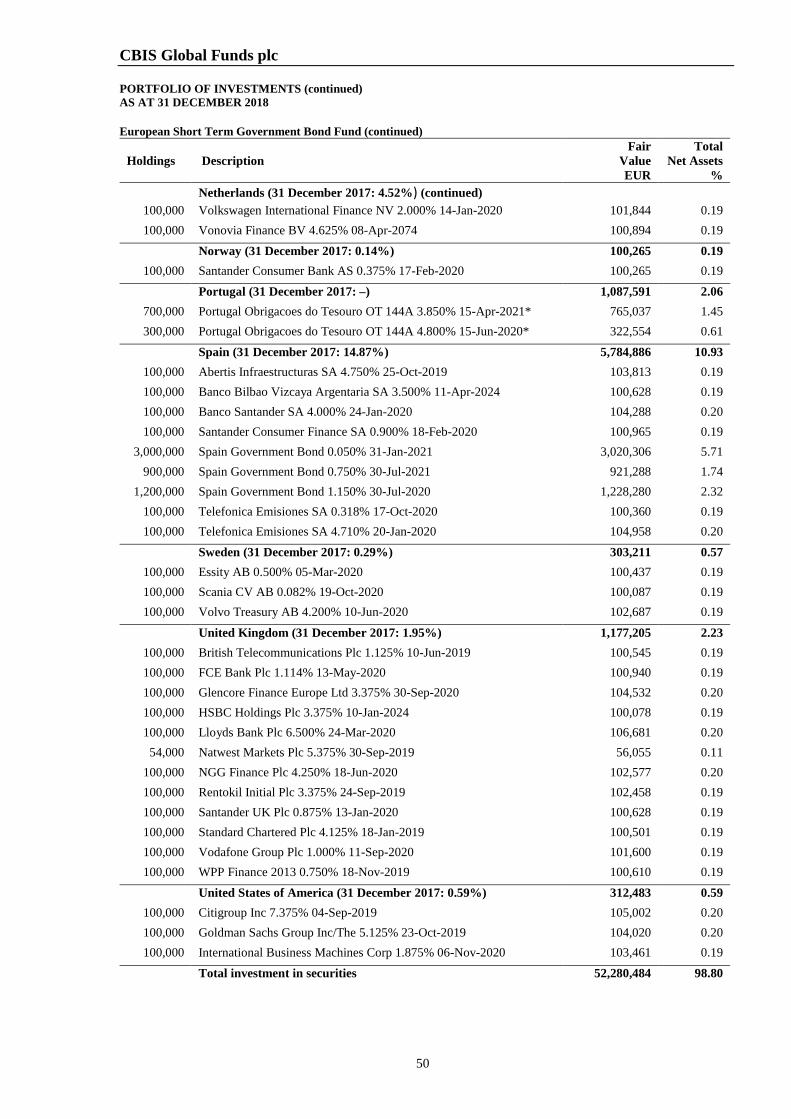
CBIS Global Funds plc PORTFOLIO OF INVESTMENTS (continued) AS AT 31 DECEMBER 2018
50
European Short Term Government Bond Fund (continued)
Holdings Description Fair
Value EUR
Total Net Assets
% Netherlands (31 December 2017: 4.52%) (continued)
100,000 Volkswagen International Finance NV 2.000% 14-Jan-2020 101,844 0.19 100,000 Vonovia Finance BV 4.625% 08-Apr-2074 100,894 0.19
Norway (31 December 2017: 0.14%) 100,265 0.19 100,000 Santander Consumer Bank AS 0.375% 17-Feb-2020 100,265 0.19
Portugal (31 December 2017: –) 1,087,591 2.06 700,000 Portugal Obrigacoes do Tesouro OT 144A 3.850% 15-Apr-2021* 765,037 1.45 300,000 Portugal Obrigacoes do Tesouro OT 144A 4.800% 15-Jun-2020* 322,554 0.61
Spain (31 December 2017: 14.87%) 5,784,886 10.93 100,000 Abertis Infraestructuras SA 4.750% 25-Oct-2019 103,813 0.19 100,000 Banco Bilbao Vizcaya Argentaria SA 3.500% 11-Apr-2024 100,628 0.19 100,000 Banco Santander SA 4.000% 24-Jan-2020 104,288 0.20 100,000 Santander Consumer Finance SA 0.900% 18-Feb-2020 100,965 0.19
3,000,000 Spain Government Bond 0.050% 31-Jan-2021 3,020,306 5.71 900,000 Spain Government Bond 0.750% 30-Jul-2021 921,288 1.74
1,200,000 Spain Government Bond 1.150% 30-Jul-2020 1,228,280 2.32 100,000 Telefonica Emisiones SA 0.318% 17-Oct-2020 100,360 0.19 100,000 Telefonica Emisiones SA 4.710% 20-Jan-2020 104,958 0.20
Sweden (31 December 2017: 0.29%) 303,211 0.57 100,000 Essity AB 0.500% 05-Mar-2020 100,437 0.19 100,000 Scania CV AB 0.082% 19-Oct-2020 100,087 0.19 100,000 Volvo Treasury AB 4.200% 10-Jun-2020 102,687 0.19
United Kingdom (31 December 2017: 1.95%) 1,177,205 2.23 100,000 British Telecommunications Plc 1.125% 10-Jun-2019 100,545 0.19 100,000 FCE Bank Plc 1.114% 13-May-2020 100,940 0.19 100,000 Glencore Finance Europe Ltd 3.375% 30-Sep-2020 104,532 0.20 100,000 HSBC Holdings Plc 3.375% 10-Jan-2024 100,078 0.19 100,000 Lloyds Bank Plc 6.500% 24-Mar-2020 106,681 0.20 54,000 Natwest Markets Plc 5.375% 30-Sep-2019 56,055 0.11
100,000 NGG Finance Plc 4.250% 18-Jun-2020 102,577 0.20 100,000 Rentokil Initial Plc 3.375% 24-Sep-2019 102,458 0.19 100,000 Santander UK Plc 0.875% 13-Jan-2020 100,628 0.19 100,000 Standard Chartered Plc 4.125% 18-Jan-2019 100,501 0.19 100,000 Vodafone Group Plc 1.000% 11-Sep-2020 101,600 0.19 100,000 WPP Finance 2013 0.750% 18-Nov-2019 100,610 0.19
United States of America (31 December 2017: 0.59%) 312,483 0.59 100,000 Citigroup Inc 7.375% 04-Sep-2019 105,002 0.20 100,000 Goldman Sachs Group Inc/The 5.125% 23-Oct-2019 104,020 0.20 100,000 International Business Machines Corp 1.875% 06-Nov-2020 103,461 0.19
Total investment in securities 52,280,484 98.80
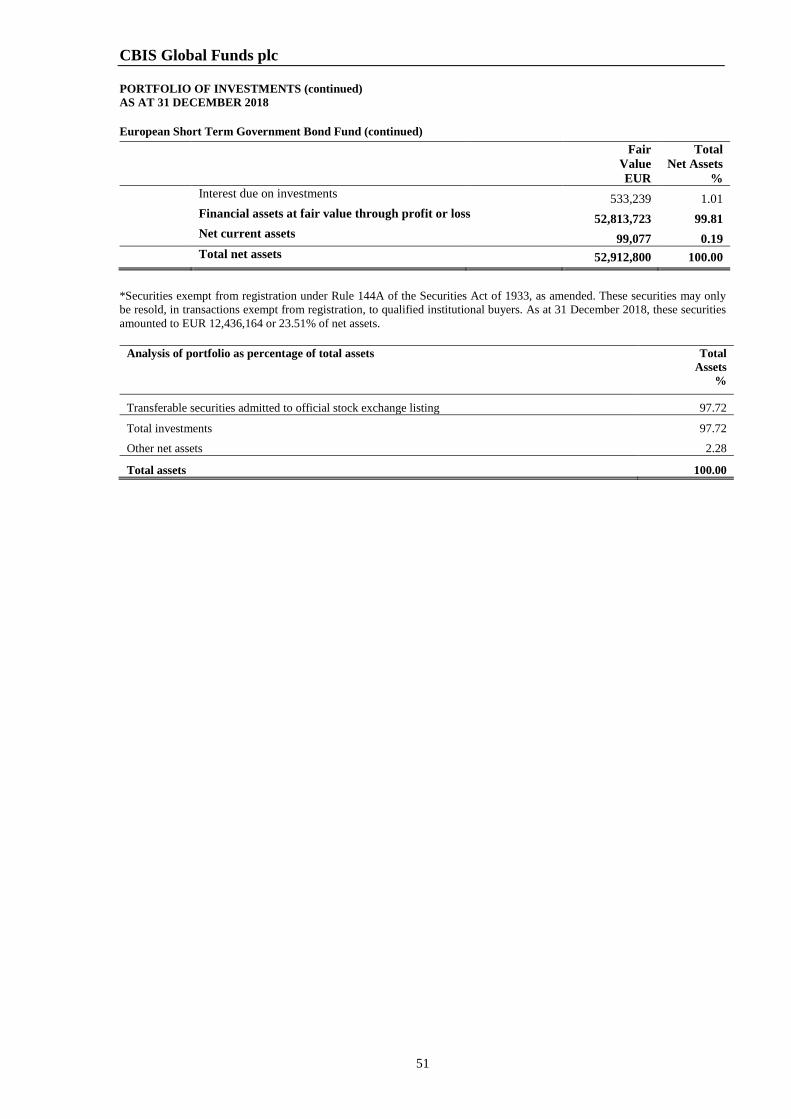
CBIS Global Funds plc PORTFOLIO OF INVESTMENTS (continued) AS AT 31 DECEMBER 2018
51
European Short Term Government Bond Fund (continued)
Fair
Value EUR
Total Net Assets
%
Interest due on investments
533,239 1.01
Financial assets at fair value through profit or loss 52,813,723 99.81
Net current assets
99,077 0.19
Total net assets 52,912,800 100.00
*Securities exempt from registration under Rule 144A of the Securities Act of 1933, as amended. These securities may only be resold, in transactions exempt from registration, to qualified institutional buyers. As at 31 December 2018, these securities amounted to EUR 12,436,164 or 23.51% of net assets.
Analysis of portfolio as percentage of total assets Total Assets
%
Transferable securities admitted to official stock exchange listing 97.72
Total investments 97.72
Other net assets 2.28
Total assets 100.00
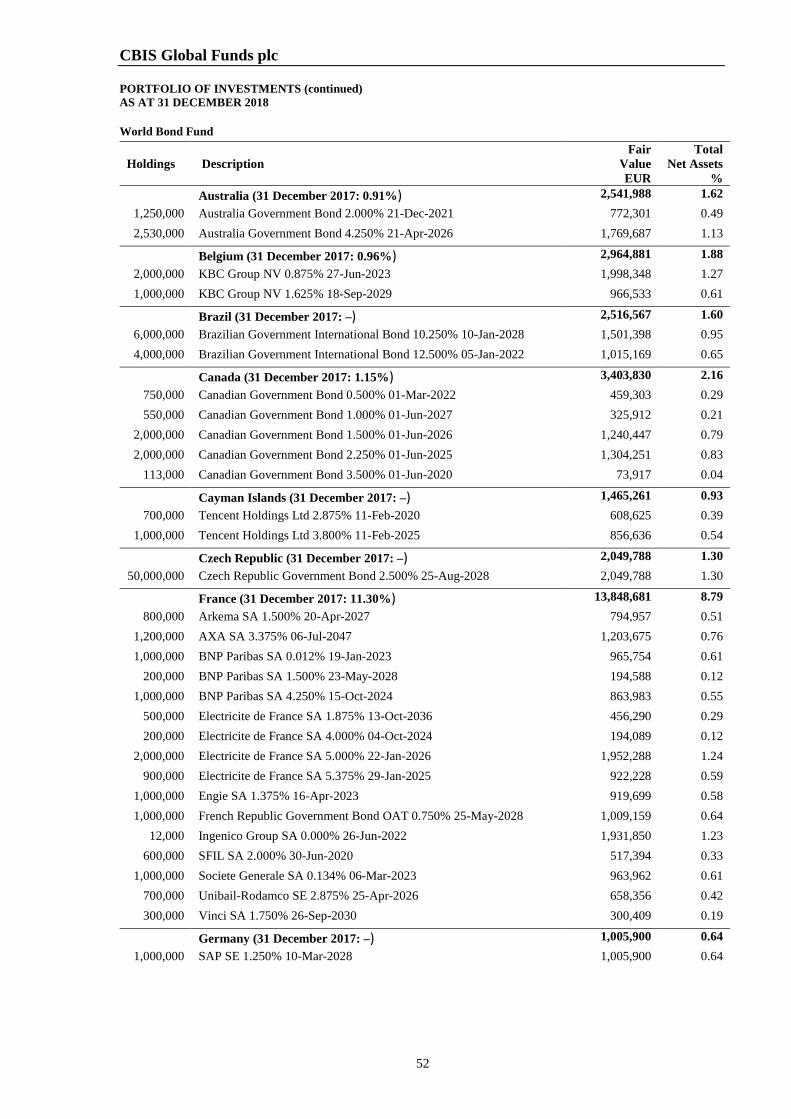
CBIS Global Funds plc PORTFOLIO OF INVESTMENTS (continued) AS AT 31 DECEMBER 2018
52
World Bond Fund
Holdings Description Fair
Value EUR
Total Net Assets
% Australia (31 December 2017: 0.91%) 2,541,988 1.62
1,250,000 Australia Government Bond 2.000% 21-Dec-2021 772,301 0.49 2,530,000 Australia Government Bond 4.250% 21-Apr-2026 1,769,687 1.13
Belgium (31 December 2017: 0.96%) 2,964,881 1.88 2,000,000 KBC Group NV 0.875% 27-Jun-2023 1,998,348 1.27 1,000,000 KBC Group NV 1.625% 18-Sep-2029 966,533 0.61
Brazil (31 December 2017: –) 2,516,567 1.60 6,000,000 Brazilian Government International Bond 10.250% 10-Jan-2028 1,501,398 0.95 4,000,000 Brazilian Government International Bond 12.500% 05-Jan-2022 1,015,169 0.65
Canada (31 December 2017: 1.15%) 3,403,830 2.16 750,000 Canadian Government Bond 0.500% 01-Mar-2022 459,303 0.29 550,000 Canadian Government Bond 1.000% 01-Jun-2027 325,912 0.21
2,000,000 Canadian Government Bond 1.500% 01-Jun-2026 1,240,447 0.79 2,000,000 Canadian Government Bond 2.250% 01-Jun-2025 1,304,251 0.83
113,000 Canadian Government Bond 3.500% 01-Jun-2020 73,917 0.04
Cayman Islands (31 December 2017: –) 1,465,261 0.93 700,000 Tencent Holdings Ltd 2.875% 11-Feb-2020 608,625 0.39
1,000,000 Tencent Holdings Ltd 3.800% 11-Feb-2025 856,636 0.54
Czech Republic (31 December 2017: –) 2,049,788 1.30 50,000,000 Czech Republic Government Bond 2.500% 25-Aug-2028 2,049,788 1.30
France (31 December 2017: 11.30%) 13,848,681 8.79 800,000 Arkema SA 1.500% 20-Apr-2027 794,957 0.51
1,200,000 AXA SA 3.375% 06-Jul-2047 1,203,675 0.76 1,000,000 BNP Paribas SA 0.012% 19-Jan-2023 965,754 0.61
200,000 BNP Paribas SA 1.500% 23-May-2028 194,588 0.12 1,000,000 BNP Paribas SA 4.250% 15-Oct-2024 863,983 0.55
500,000 Electricite de France SA 1.875% 13-Oct-2036 456,290 0.29 200,000 Electricite de France SA 4.000% 04-Oct-2024 194,089 0.12
2,000,000 Electricite de France SA 5.000% 22-Jan-2026 1,952,288 1.24 900,000 Electricite de France SA 5.375% 29-Jan-2025 922,228 0.59
1,000,000 Engie SA 1.375% 16-Apr-2023 919,699 0.58 1,000,000 French Republic Government Bond OAT 0.750% 25-May-2028 1,009,159 0.64
12,000 Ingenico Group SA 0.000% 26-Jun-2022 1,931,850 1.23 600,000 SFIL SA 2.000% 30-Jun-2020 517,394 0.33
1,000,000 Societe Generale SA 0.134% 06-Mar-2023 963,962 0.61 700,000 Unibail-Rodamco SE 2.875% 25-Apr-2026 658,356 0.42 300,000 Vinci SA 1.750% 26-Sep-2030 300,409 0.19
Germany (31 December 2017: –) 1,005,900 0.64 1,000,000 SAP SE 1.250% 10-Mar-2028 1,005,900 0.64
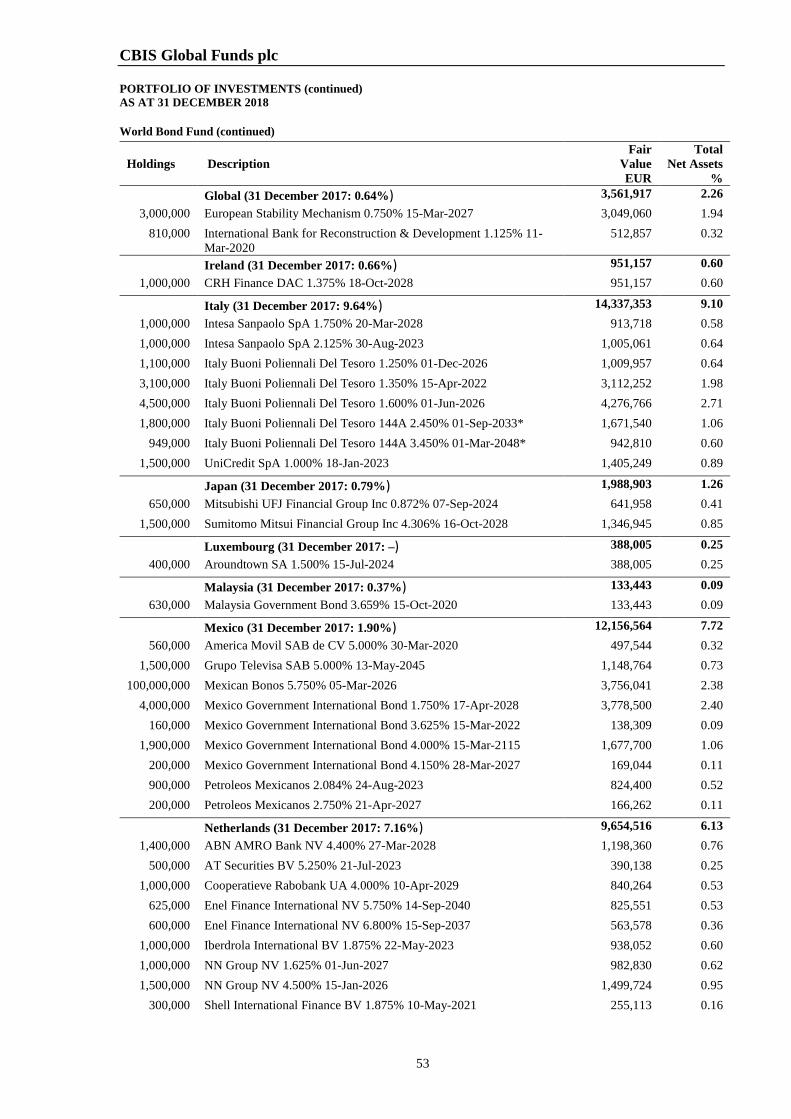
CBIS Global Funds plc PORTFOLIO OF INVESTMENTS (continued) AS AT 31 DECEMBER 2018
53
World Bond Fund (continued)
Holdings Description Fair
Value EUR
Total Net Assets
% Global (31 December 2017: 0.64%) 3,561,917 2.26
3,000,000 European Stability Mechanism 0.750% 15-Mar-2027 3,049,060 1.94 810,000 International Bank for Reconstruction & Development 1.125% 11-
Mar-2020 512,857 0.32
Ireland (31 December 2017: 0.66%) 951,157 0.60 1,000,000 CRH Finance DAC 1.375% 18-Oct-2028 951,157 0.60
Italy (31 December 2017: 9.64%) 14,337,353 9.10 1,000,000 Intesa Sanpaolo SpA 1.750% 20-Mar-2028 913,718 0.58 1,000,000 Intesa Sanpaolo SpA 2.125% 30-Aug-2023 1,005,061 0.64 1,100,000 Italy Buoni Poliennali Del Tesoro 1.250% 01-Dec-2026 1,009,957 0.64 3,100,000 Italy Buoni Poliennali Del Tesoro 1.350% 15-Apr-2022 3,112,252 1.98 4,500,000 Italy Buoni Poliennali Del Tesoro 1.600% 01-Jun-2026 4,276,766 2.71 1,800,000 Italy Buoni Poliennali Del Tesoro 144A 2.450% 01-Sep-2033* 1,671,540 1.06
949,000 Italy Buoni Poliennali Del Tesoro 144A 3.450% 01-Mar-2048* 942,810 0.60 1,500,000 UniCredit SpA 1.000% 18-Jan-2023 1,405,249 0.89
Japan (31 December 2017: 0.79%) 1,988,903 1.26 650,000 Mitsubishi UFJ Financial Group Inc 0.872% 07-Sep-2024 641,958 0.41
1,500,000 Sumitomo Mitsui Financial Group Inc 4.306% 16-Oct-2028 1,346,945 0.85
Luxembourg (31 December 2017: –) 388,005 0.25 400,000 Aroundtown SA 1.500% 15-Jul-2024 388,005 0.25
Malaysia (31 December 2017: 0.37%) 133,443 0.09 630,000 Malaysia Government Bond 3.659% 15-Oct-2020 133,443 0.09
Mexico (31 December 2017: 1.90%) 12,156,564 7.72 560,000 America Movil SAB de CV 5.000% 30-Mar-2020 497,544 0.32
1,500,000 Grupo Televisa SAB 5.000% 13-May-2045 1,148,764 0.73 100,000,000 Mexican Bonos 5.750% 05-Mar-2026 3,756,041 2.38
4,000,000 Mexico Government International Bond 1.750% 17-Apr-2028 3,778,500 2.40 160,000 Mexico Government International Bond 3.625% 15-Mar-2022 138,309 0.09
1,900,000 Mexico Government International Bond 4.000% 15-Mar-2115 1,677,700 1.06 200,000 Mexico Government International Bond 4.150% 28-Mar-2027 169,044 0.11 900,000 Petroleos Mexicanos 2.084% 24-Aug-2023 824,400 0.52 200,000 Petroleos Mexicanos 2.750% 21-Apr-2027 166,262 0.11
Netherlands (31 December 2017: 7.16%) 9,654,516 6.13 1,400,000 ABN AMRO Bank NV 4.400% 27-Mar-2028 1,198,360 0.76
500,000 AT Securities BV 5.250% 21-Jul-2023 390,138 0.25 1,000,000 Cooperatieve Rabobank UA 4.000% 10-Apr-2029 840,264 0.53
625,000 Enel Finance International NV 5.750% 14-Sep-2040 825,551 0.53 600,000 Enel Finance International NV 6.800% 15-Sep-2037 563,578 0.36
1,000,000 Iberdrola International BV 1.875% 22-May-2023 938,052 0.60 1,000,000 NN Group NV 1.625% 01-Jun-2027 982,830 0.62 1,500,000 NN Group NV 4.500% 15-Jan-2026 1,499,724 0.95
300,000 Shell International Finance BV 1.875% 10-May-2021 255,113 0.16
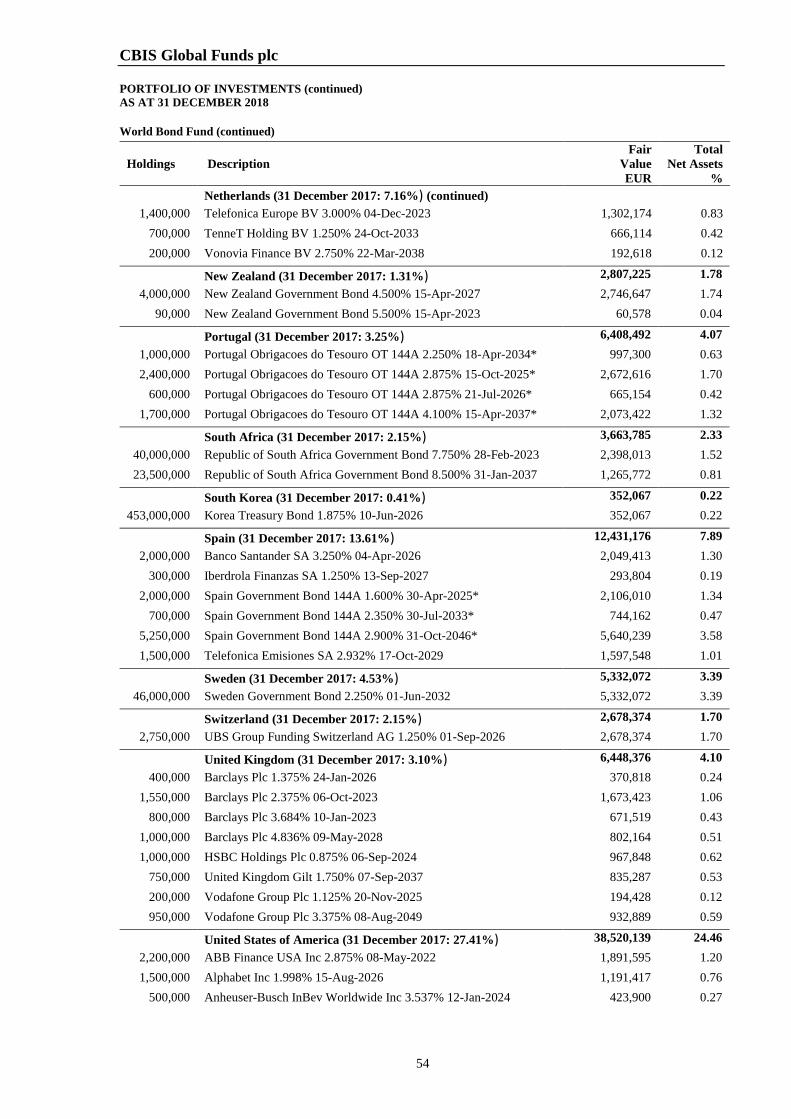
CBIS Global Funds plc PORTFOLIO OF INVESTMENTS (continued) AS AT 31 DECEMBER 2018
54
World Bond Fund (continued)
Holdings Description Fair
Value EUR
Total Net Assets
% Netherlands (31 December 2017: 7.16%) (continued)
1,400,000 Telefonica Europe BV 3.000% 04-Dec-2023 1,302,174 0.83 700,000 TenneT Holding BV 1.250% 24-Oct-2033 666,114 0.42 200,000 Vonovia Finance BV 2.750% 22-Mar-2038 192,618 0.12
New Zealand (31 December 2017: 1.31%) 2,807,225 1.78 4,000,000 New Zealand Government Bond 4.500% 15-Apr-2027 2,746,647 1.74
90,000 New Zealand Government Bond 5.500% 15-Apr-2023 60,578 0.04
Portugal (31 December 2017: 3.25%) 6,408,492 4.07 1,000,000 Portugal Obrigacoes do Tesouro OT 144A 2.250% 18-Apr-2034* 997,300 0.63 2,400,000 Portugal Obrigacoes do Tesouro OT 144A 2.875% 15-Oct-2025* 2,672,616 1.70
600,000 Portugal Obrigacoes do Tesouro OT 144A 2.875% 21-Jul-2026* 665,154 0.42 1,700,000 Portugal Obrigacoes do Tesouro OT 144A 4.100% 15-Apr-2037* 2,073,422 1.32
South Africa (31 December 2017: 2.15%) 3,663,785 2.33 40,000,000 Republic of South Africa Government Bond 7.750% 28-Feb-2023 2,398,013 1.52 23,500,000 Republic of South Africa Government Bond 8.500% 31-Jan-2037 1,265,772 0.81
South Korea (31 December 2017: 0.41%) 352,067 0.22 453,000,000 Korea Treasury Bond 1.875% 10-Jun-2026 352,067 0.22
Spain (31 December 2017: 13.61%) 12,431,176 7.89 2,000,000 Banco Santander SA 3.250% 04-Apr-2026 2,049,413 1.30
300,000 Iberdrola Finanzas SA 1.250% 13-Sep-2027 293,804 0.19 2,000,000 Spain Government Bond 144A 1.600% 30-Apr-2025* 2,106,010 1.34
700,000 Spain Government Bond 144A 2.350% 30-Jul-2033* 744,162 0.47 5,250,000 Spain Government Bond 144A 2.900% 31-Oct-2046* 5,640,239 3.58 1,500,000 Telefonica Emisiones SA 2.932% 17-Oct-2029 1,597,548 1.01
Sweden (31 December 2017: 4.53%) 5,332,072 3.39 46,000,000 Sweden Government Bond 2.250% 01-Jun-2032 5,332,072 3.39
Switzerland (31 December 2017: 2.15%) 2,678,374 1.70 2,750,000 UBS Group Funding Switzerland AG 1.250% 01-Sep-2026 2,678,374 1.70
United Kingdom (31 December 2017: 3.10%) 6,448,376 4.10 400,000 Barclays Plc 1.375% 24-Jan-2026 370,818 0.24
1,550,000 Barclays Plc 2.375% 06-Oct-2023 1,673,423 1.06 800,000 Barclays Plc 3.684% 10-Jan-2023 671,519 0.43
1,000,000 Barclays Plc 4.836% 09-May-2028 802,164 0.51 1,000,000 HSBC Holdings Plc 0.875% 06-Sep-2024 967,848 0.62
750,000 United Kingdom Gilt 1.750% 07-Sep-2037 835,287 0.53 200,000 Vodafone Group Plc 1.125% 20-Nov-2025 194,428 0.12 950,000 Vodafone Group Plc 3.375% 08-Aug-2049 932,889 0.59
United States of America (31 December 2017: 27.41%) 38,520,139 24.46 2,200,000 ABB Finance USA Inc 2.875% 08-May-2022 1,891,595 1.20 1,500,000 Alphabet Inc 1.998% 15-Aug-2026 1,191,417 0.76
500,000 Anheuser-Busch InBev Worldwide Inc 3.537% 12-Jan-2024 423,900 0.27
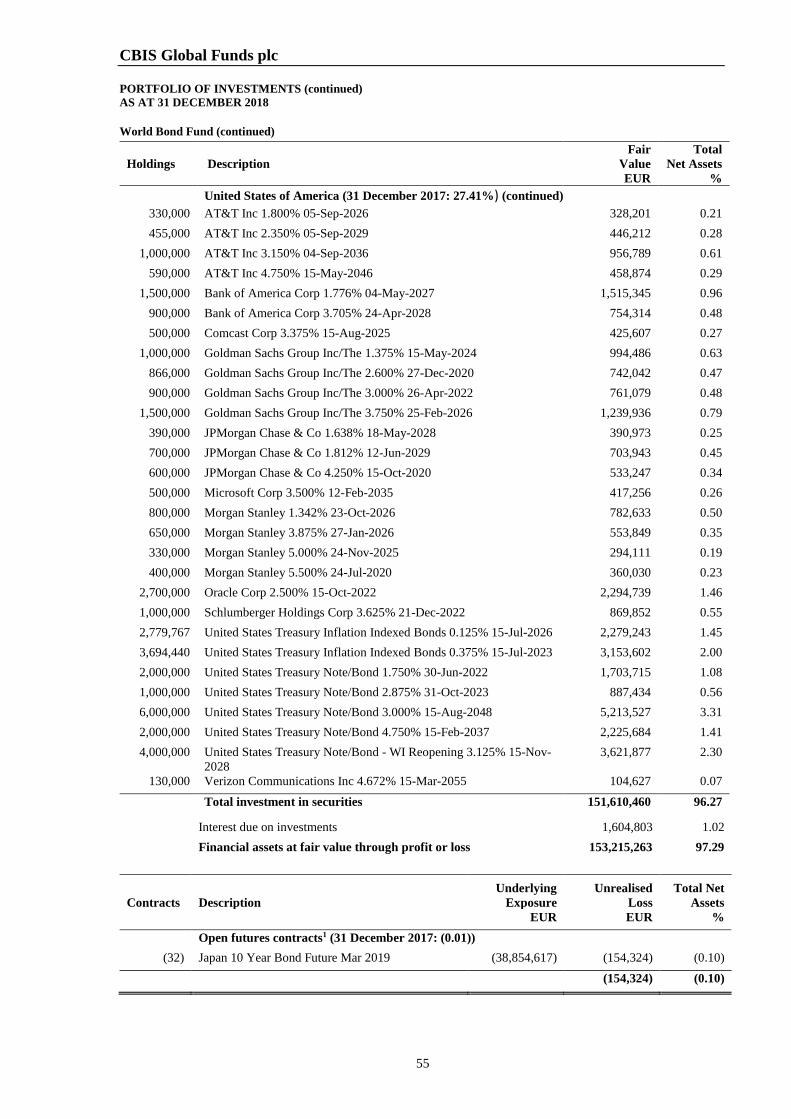
CBIS Global Funds plc PORTFOLIO OF INVESTMENTS (continued) AS AT 31 DECEMBER 2018
55
World Bond Fund (continued)
Holdings Description Fair
Value EUR
Total Net Assets
% United States of America (31 December 2017: 27.41%) (continued)
330,000 AT&T Inc 1.800% 05-Sep-2026 328,201 0.21 455,000 AT&T Inc 2.350% 05-Sep-2029 446,212 0.28
1,000,000 AT&T Inc 3.150% 04-Sep-2036 956,789 0.61 590,000 AT&T Inc 4.750% 15-May-2046 458,874 0.29
1,500,000 Bank of America Corp 1.776% 04-May-2027 1,515,345 0.96 900,000 Bank of America Corp 3.705% 24-Apr-2028 754,314 0.48 500,000 Comcast Corp 3.375% 15-Aug-2025 425,607 0.27
1,000,000 Goldman Sachs Group Inc/The 1.375% 15-May-2024 994,486 0.63 866,000 Goldman Sachs Group Inc/The 2.600% 27-Dec-2020 742,042 0.47 900,000 Goldman Sachs Group Inc/The 3.000% 26-Apr-2022 761,079 0.48
1,500,000 Goldman Sachs Group Inc/The 3.750% 25-Feb-2026 1,239,936 0.79 390,000 JPMorgan Chase & Co 1.638% 18-May-2028 390,973 0.25 700,000 JPMorgan Chase & Co 1.812% 12-Jun-2029 703,943 0.45 600,000 JPMorgan Chase & Co 4.250% 15-Oct-2020 533,247 0.34 500,000 Microsoft Corp 3.500% 12-Feb-2035 417,256 0.26 800,000 Morgan Stanley 1.342% 23-Oct-2026 782,633 0.50 650,000 Morgan Stanley 3.875% 27-Jan-2026 553,849 0.35 330,000 Morgan Stanley 5.000% 24-Nov-2025 294,111 0.19 400,000 Morgan Stanley 5.500% 24-Jul-2020 360,030 0.23
2,700,000 Oracle Corp 2.500% 15-Oct-2022 2,294,739 1.46 1,000,000 Schlumberger Holdings Corp 3.625% 21-Dec-2022 869,852 0.55 2,779,767 United States Treasury Inflation Indexed Bonds 0.125% 15-Jul-2026 2,279,243 1.45 3,694,440 United States Treasury Inflation Indexed Bonds 0.375% 15-Jul-2023 3,153,602 2.00 2,000,000 United States Treasury Note/Bond 1.750% 30-Jun-2022 1,703,715 1.08 1,000,000 United States Treasury Note/Bond 2.875% 31-Oct-2023 887,434 0.56 6,000,000 United States Treasury Note/Bond 3.000% 15-Aug-2048 5,213,527 3.31 2,000,000 United States Treasury Note/Bond 4.750% 15-Feb-2037 2,225,684 1.41 4,000,000 United States Treasury Note/Bond - WI Reopening 3.125% 15-Nov-
2028 3,621,877 2.30
130,000 Verizon Communications Inc 4.672% 15-Mar-2055 104,627 0.07 Total investment in securities 151,610,460 96.27
Interest due on investments
1,604,803 1.02
Financial assets at fair value through profit or loss 153,215,263 97.29
Contracts Description Underlying
Exposure Unrealised
Loss Total Net
Assets
EUR EUR %
Open futures contracts1 (31 December 2017: (0.01)) (32) Japan 10 Year Bond Future Mar 2019 (38,854,617) (154,324) (0.10)
(154,324) (0.10)
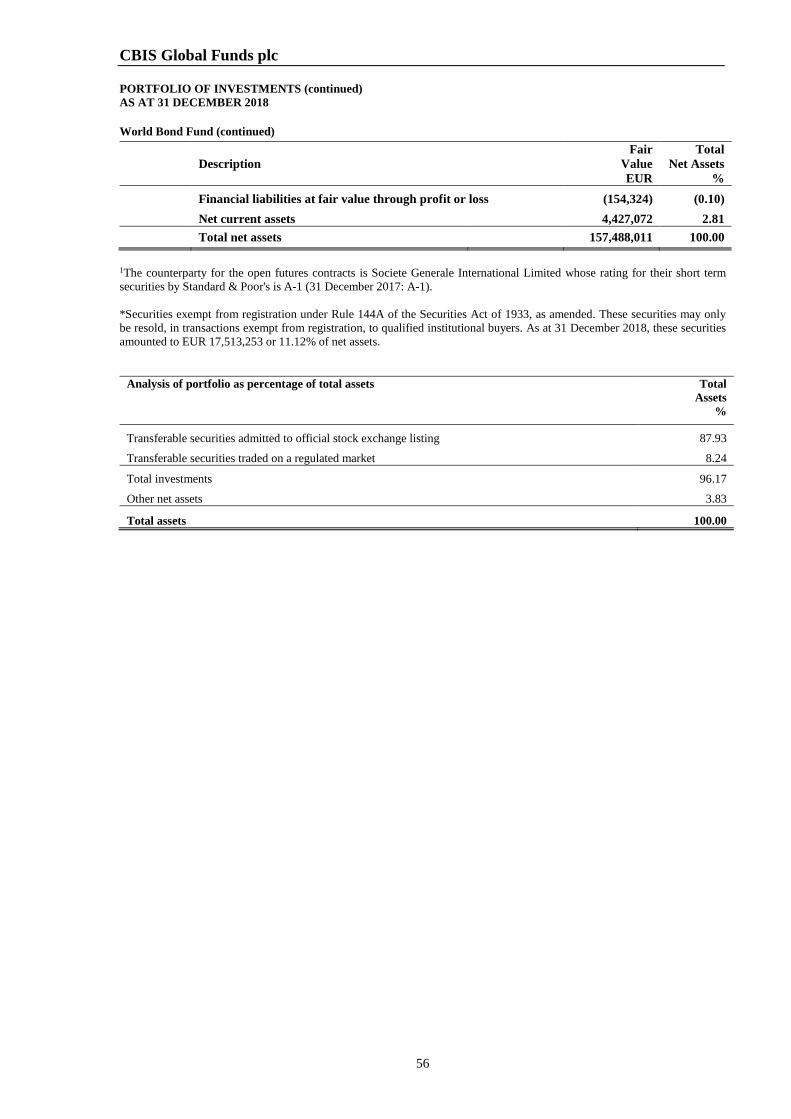
CBIS Global Funds plc PORTFOLIO OF INVESTMENTS (continued) AS AT 31 DECEMBER 2018
56
World Bond Fund (continued)
Description
Fair Value EUR
Total Net Assets
%
Financial liabilities at fair value through profit or loss (154,324) (0.10)
Net current assets
4,427,072 2.81
Total net assets 157,488,011 100.00
1The counterparty for the open futures contracts is Societe Generale International Limited whose rating for their short term securities by Standard & Poor's is A-1 (31 December 2017: A-1). *Securities exempt from registration under Rule 144A of the Securities Act of 1933, as amended. These securities may only be resold, in transactions exempt from registration, to qualified institutional buyers. As at 31 December 2018, these securities amounted to EUR 17,513,253 or 11.12% of net assets.
Analysis of portfolio as percentage of total assets Total Assets
%
Transferable securities admitted to official stock exchange listing 87.93
Transferable securities traded on a regulated market 8.24
Total investments 96.17
Other net assets 3.83
Total assets 100.00
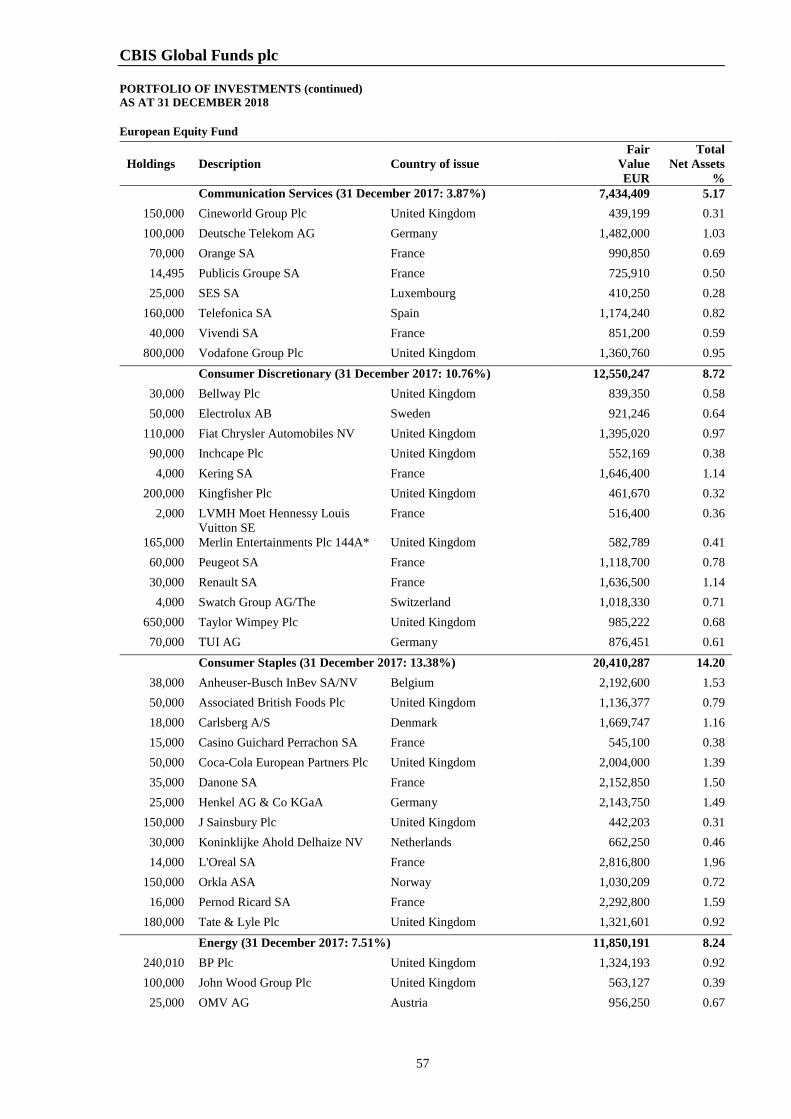
CBIS Global Funds plc PORTFOLIO OF INVESTMENTS (continued) AS AT 31 DECEMBER 2018
57
European Equity Fund
Holdings Description Country of issue Fair
Value EUR
Total Net Assets
% Communication Services (31 December 2017: 3.87%) 7,434,409 5.17
150,000 Cineworld Group Plc United Kingdom 439,199 0.31 100,000 Deutsche Telekom AG Germany 1,482,000 1.03 70,000 Orange SA France 990,850 0.69 14,495 Publicis Groupe SA France 725,910 0.50 25,000 SES SA Luxembourg 410,250 0.28
160,000 Telefonica SA Spain 1,174,240 0.82 40,000 Vivendi SA France 851,200 0.59
800,000 Vodafone Group Plc United Kingdom 1,360,760 0.95
Consumer Discretionary (31 December 2017: 10.76%) 12,550,247 8.72 30,000 Bellway Plc United Kingdom 839,350 0.58 50,000 Electrolux AB Sweden 921,246 0.64
110,000 Fiat Chrysler Automobiles NV United Kingdom 1,395,020 0.97 90,000 Inchcape Plc United Kingdom 552,169 0.38
4,000 Kering SA France 1,646,400 1.14 200,000 Kingfisher Plc United Kingdom 461,670 0.32
2,000 LVMH Moet Hennessy Louis Vuitton SE
France 516,400 0.36
165,000 Merlin Entertainments Plc 144A* United Kingdom 582,789 0.41 60,000 Peugeot SA France 1,118,700 0.78 30,000 Renault SA France 1,636,500 1.14
4,000 Swatch Group AG/The Switzerland 1,018,330 0.71 650,000 Taylor Wimpey Plc United Kingdom 985,222 0.68 70,000 TUI AG Germany 876,451 0.61
Consumer Staples (31 December 2017: 13.38%) 20,410,287 14.20 38,000 Anheuser-Busch InBev SA/NV Belgium 2,192,600 1.53 50,000 Associated British Foods Plc United Kingdom 1,136,377 0.79 18,000 Carlsberg A/S Denmark 1,669,747 1.16 15,000 Casino Guichard Perrachon SA France 545,100 0.38 50,000 Coca-Cola European Partners Plc United Kingdom 2,004,000 1.39 35,000 Danone SA France 2,152,850 1.50 25,000 Henkel AG & Co KGaA Germany 2,143,750 1.49
150,000 J Sainsbury Plc United Kingdom 442,203 0.31 30,000 Koninklijke Ahold Delhaize NV Netherlands 662,250 0.46 14,000 L'Oreal SA France 2,816,800 1.96
150,000 Orkla ASA Norway 1,030,209 0.72 16,000 Pernod Ricard SA France 2,292,800 1.59
180,000 Tate & Lyle Plc United Kingdom 1,321,601 0.92
Energy (31 December 2017: 7.51%) 11,850,191 8.24 240,010 BP Plc United Kingdom 1,324,193 0.92 100,000 John Wood Group Plc United Kingdom 563,127 0.39 25,000 OMV AG Austria 956,250 0.67
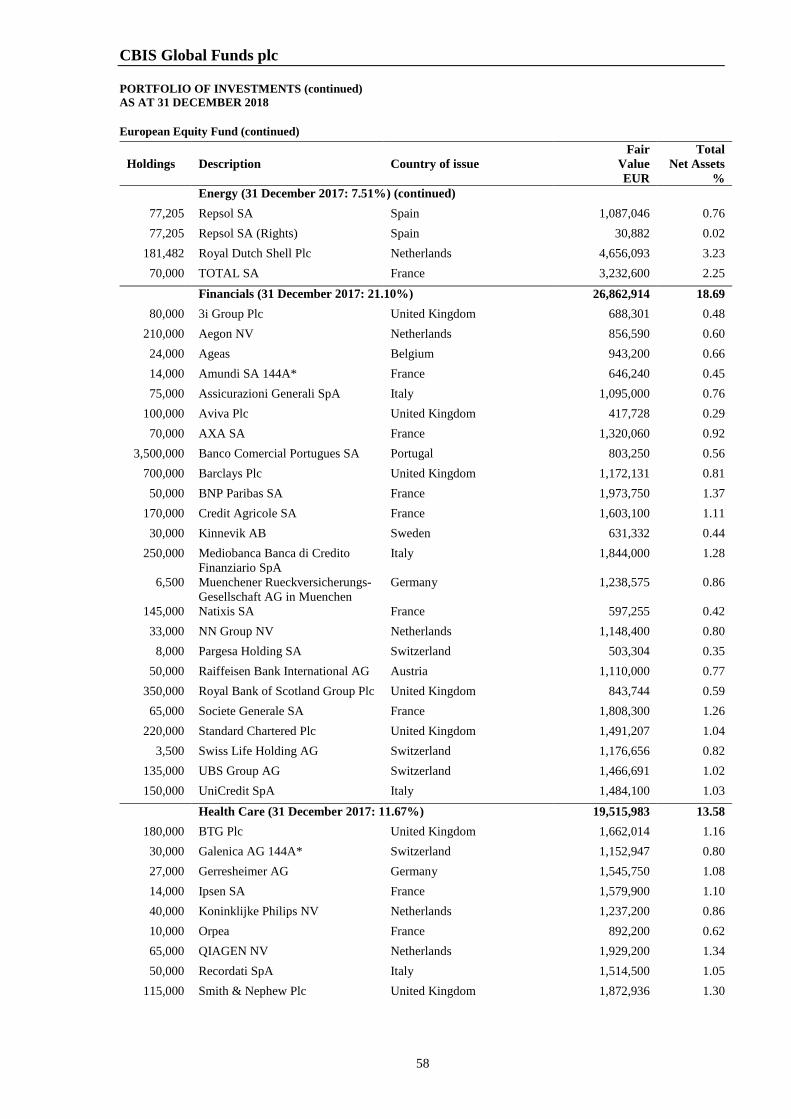
CBIS Global Funds plc PORTFOLIO OF INVESTMENTS (continued) AS AT 31 DECEMBER 2018
58
European Equity Fund (continued)
Holdings Description Country of issue Fair
Value EUR
Total Net Assets
% Energy (31 December 2017: 7.51%) (continued)
77,205 Repsol SA Spain 1,087,046 0.76 77,205 Repsol SA (Rights) Spain 30,882 0.02
181,482 Royal Dutch Shell Plc Netherlands 4,656,093 3.23 70,000 TOTAL SA France 3,232,600 2.25
Financials (31 December 2017: 21.10%) 26,862,914 18.69 80,000 3i Group Plc United Kingdom 688,301 0.48
210,000 Aegon NV Netherlands 856,590 0.60 24,000 Ageas Belgium 943,200 0.66 14,000 Amundi SA 144A* France 646,240 0.45 75,000 Assicurazioni Generali SpA Italy 1,095,000 0.76
100,000 Aviva Plc United Kingdom 417,728 0.29 70,000 AXA SA France 1,320,060 0.92
3,500,000 Banco Comercial Portugues SA Portugal 803,250 0.56 700,000 Barclays Plc United Kingdom 1,172,131 0.81 50,000 BNP Paribas SA France 1,973,750 1.37
170,000 Credit Agricole SA France 1,603,100 1.11 30,000 Kinnevik AB Sweden 631,332 0.44
250,000 Mediobanca Banca di Credito Finanziario SpA
Italy 1,844,000 1.28
6,500 Muenchener Rueckversicherungs-Gesellschaft AG in Muenchen
Germany 1,238,575 0.86
145,000 Natixis SA France 597,255 0.42 33,000 NN Group NV Netherlands 1,148,400 0.80
8,000 Pargesa Holding SA Switzerland 503,304 0.35 50,000 Raiffeisen Bank International AG Austria 1,110,000 0.77
350,000 Royal Bank of Scotland Group Plc United Kingdom 843,744 0.59 65,000 Societe Generale SA France 1,808,300 1.26
220,000 Standard Chartered Plc United Kingdom 1,491,207 1.04 3,500 Swiss Life Holding AG Switzerland 1,176,656 0.82
135,000 UBS Group AG Switzerland 1,466,691 1.02 150,000 UniCredit SpA Italy 1,484,100 1.03
Health Care (31 December 2017: 11.67%) 19,515,983 13.58 180,000 BTG Plc United Kingdom 1,662,014 1.16 30,000 Galenica AG 144A* Switzerland 1,152,947 0.80 27,000 Gerresheimer AG Germany 1,545,750 1.08 14,000 Ipsen SA France 1,579,900 1.10 40,000 Koninklijke Philips NV Netherlands 1,237,200 0.86 10,000 Orpea France 892,200 0.62 65,000 QIAGEN NV Netherlands 1,929,200 1.34 50,000 Recordati SpA Italy 1,514,500 1.05
115,000 Smith & Nephew Plc United Kingdom 1,872,936 1.30
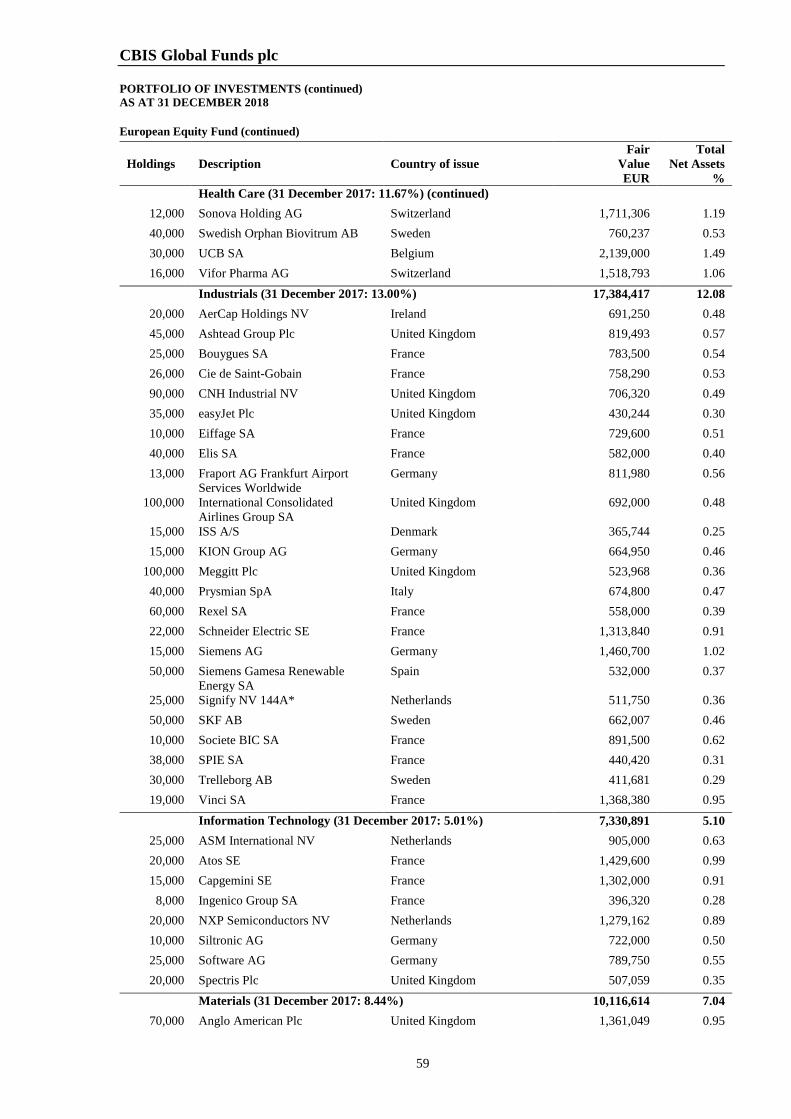
CBIS Global Funds plc PORTFOLIO OF INVESTMENTS (continued) AS AT 31 DECEMBER 2018
59
European Equity Fund (continued)
Holdings Description Country of issue Fair
Value EUR
Total Net Assets
% Health Care (31 December 2017: 11.67%) (continued)
12,000 Sonova Holding AG Switzerland 1,711,306 1.19 40,000 Swedish Orphan Biovitrum AB Sweden 760,237 0.53 30,000 UCB SA Belgium 2,139,000 1.49 16,000 Vifor Pharma AG Switzerland 1,518,793 1.06
Industrials (31 December 2017: 13.00%) 17,384,417 12.08 20,000 AerCap Holdings NV Ireland 691,250 0.48 45,000 Ashtead Group Plc United Kingdom 819,493 0.57 25,000 Bouygues SA France 783,500 0.54 26,000 Cie de Saint-Gobain France 758,290 0.53 90,000 CNH Industrial NV United Kingdom 706,320 0.49 35,000 easyJet Plc United Kingdom 430,244 0.30 10,000 Eiffage SA France 729,600 0.51 40,000 Elis SA France 582,000 0.40 13,000 Fraport AG Frankfurt Airport
Services Worldwide Germany 811,980 0.56
100,000 International Consolidated Airlines Group SA
United Kingdom 692,000 0.48
15,000 ISS A/S Denmark 365,744 0.25 15,000 KION Group AG Germany 664,950 0.46
100,000 Meggitt Plc United Kingdom 523,968 0.36 40,000 Prysmian SpA Italy 674,800 0.47 60,000 Rexel SA France 558,000 0.39 22,000 Schneider Electric SE France 1,313,840 0.91 15,000 Siemens AG Germany 1,460,700 1.02 50,000 Siemens Gamesa Renewable
Energy SA Spain 532,000 0.37
25,000 Signify NV 144A* Netherlands 511,750 0.36 50,000 SKF AB Sweden 662,007 0.46 10,000 Societe BIC SA France 891,500 0.62 38,000 SPIE SA France 440,420 0.31 30,000 Trelleborg AB Sweden 411,681 0.29 19,000 Vinci SA France 1,368,380 0.95
Information Technology (31 December 2017: 5.01%) 7,330,891 5.10 25,000 ASM International NV Netherlands 905,000 0.63 20,000 Atos SE France 1,429,600 0.99 15,000 Capgemini SE France 1,302,000 0.91
8,000 Ingenico Group SA France 396,320 0.28 20,000 NXP Semiconductors NV Netherlands 1,279,162 0.89 10,000 Siltronic AG Germany 722,000 0.50 25,000 Software AG Germany 789,750 0.55 20,000 Spectris Plc United Kingdom 507,059 0.35
Materials (31 December 2017: 8.44%) 10,116,614 7.04 70,000 Anglo American Plc United Kingdom 1,361,049 0.95
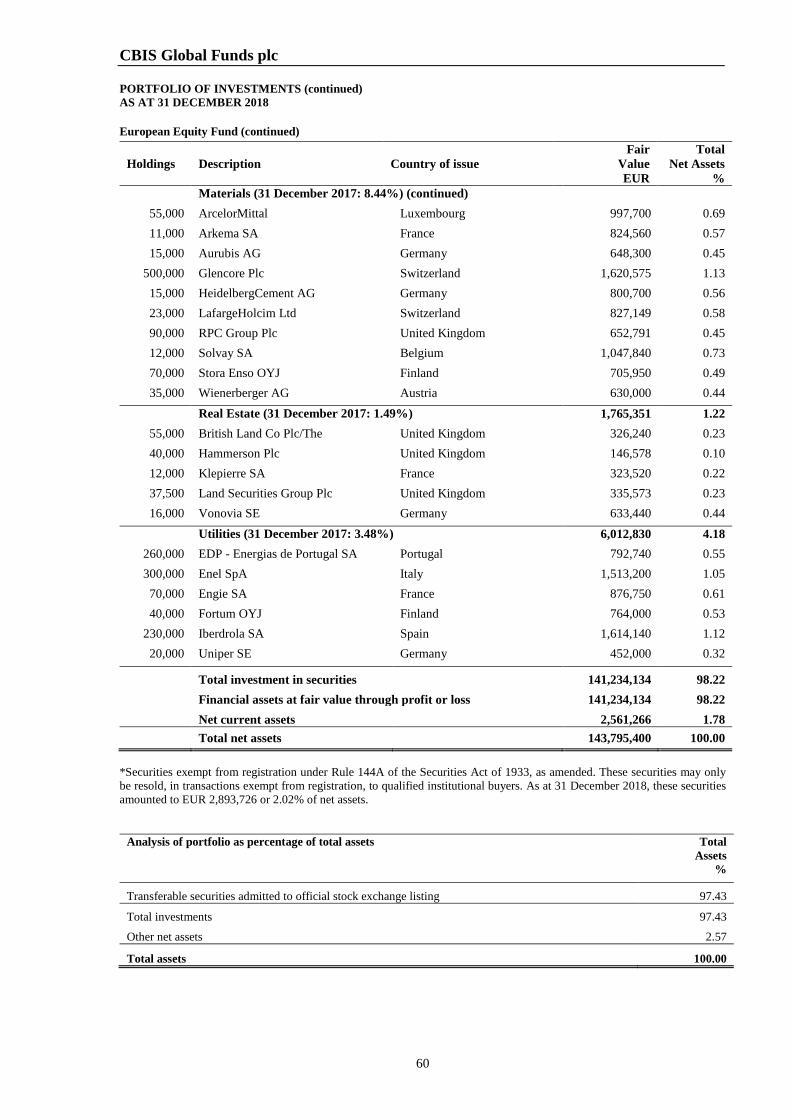
CBIS Global Funds plc PORTFOLIO OF INVESTMENTS (continued) AS AT 31 DECEMBER 2018
60
European Equity Fund (continued)
Holdings Description Country of issue Fair
Value EUR
Total Net Assets
% Materials (31 December 2017: 8.44%) (continued)
55,000 ArcelorMittal Luxembourg 997,700 0.69 11,000 Arkema SA France 824,560 0.57 15,000 Aurubis AG Germany 648,300 0.45
500,000 Glencore Plc Switzerland 1,620,575 1.13 15,000 HeidelbergCement AG Germany 800,700 0.56 23,000 LafargeHolcim Ltd Switzerland 827,149 0.58 90,000 RPC Group Plc United Kingdom 652,791 0.45 12,000 Solvay SA Belgium 1,047,840 0.73 70,000 Stora Enso OYJ Finland 705,950 0.49 35,000 Wienerberger AG Austria 630,000 0.44
Real Estate (31 December 2017: 1.49%) 1,765,351 1.22 55,000 British Land Co Plc/The United Kingdom 326,240 0.23 40,000 Hammerson Plc United Kingdom 146,578 0.10 12,000 Klepierre SA France 323,520 0.22 37,500 Land Securities Group Plc United Kingdom 335,573 0.23 16,000 Vonovia SE Germany 633,440 0.44
Utilities (31 December 2017: 3.48%) 6,012,830 4.18 260,000 EDP - Energias de Portugal SA Portugal 792,740 0.55 300,000 Enel SpA Italy 1,513,200 1.05 70,000 Engie SA France 876,750 0.61 40,000 Fortum OYJ Finland 764,000 0.53
230,000 Iberdrola SA Spain 1,614,140 1.12 20,000 Uniper SE Germany 452,000 0.32
Total investment in securities 141,234,134 98.22
Financial assets at fair value through profit or loss 141,234,134 98.22
Net current assets
2,561,266 1.78
Total net assets 143,795,400 100.00 *Securities exempt from registration under Rule 144A of the Securities Act of 1933, as amended. These securities may only be resold, in transactions exempt from registration, to qualified institutional buyers. As at 31 December 2018, these securities amounted to EUR 2,893,726 or 2.02% of net assets.
Analysis of portfolio as percentage of total assets Total Assets
%
Transferable securities admitted to official stock exchange listing 97.43
Total investments 97.43
Other net assets 2.57
Total assets 100.00
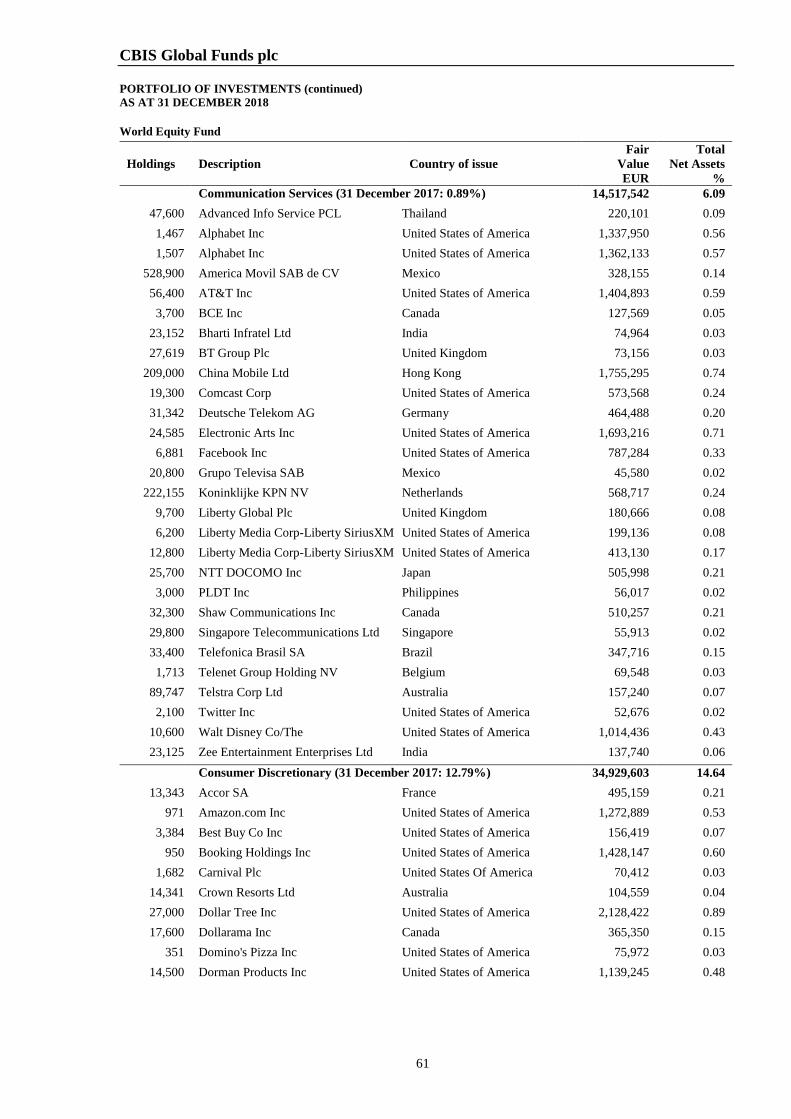
CBIS Global Funds plc PORTFOLIO OF INVESTMENTS (continued) AS AT 31 DECEMBER 2018
61
World Equity Fund
Holdings Description Country of issue Fair
Value EUR
Total Net Assets
% Communication Services (31 December 2017: 0.89%) 14,517,542 6.09
47,600 Advanced Info Service PCL Thailand 220,101 0.09 1,467 Alphabet Inc United States of America 1,337,950 0.56 1,507 Alphabet Inc United States of America 1,362,133 0.57
528,900 America Movil SAB de CV Mexico 328,155 0.14 56,400 AT&T Inc United States of America 1,404,893 0.59
3,700 BCE Inc Canada 127,569 0.05 23,152 Bharti Infratel Ltd India 74,964 0.03 27,619 BT Group Plc United Kingdom 73,156 0.03
209,000 China Mobile Ltd Hong Kong 1,755,295 0.74 19,300 Comcast Corp United States of America 573,568 0.24 31,342 Deutsche Telekom AG Germany 464,488 0.20 24,585 Electronic Arts Inc United States of America 1,693,216 0.71
6,881 Facebook Inc United States of America 787,284 0.33 20,800 Grupo Televisa SAB Mexico 45,580 0.02
222,155 Koninklijke KPN NV Netherlands 568,717 0.24 9,700 Liberty Global Plc United Kingdom 180,666 0.08 6,200 Liberty Media Corp-Liberty SiriusXM United States of America 199,136 0.08
12,800 Liberty Media Corp-Liberty SiriusXM United States of America 413,130 0.17 25,700 NTT DOCOMO Inc Japan 505,998 0.21
3,000 PLDT Inc Philippines 56,017 0.02 32,300 Shaw Communications Inc Canada 510,257 0.21 29,800 Singapore Telecommunications Ltd Singapore 55,913 0.02 33,400 Telefonica Brasil SA Brazil 347,716 0.15
1,713 Telenet Group Holding NV Belgium 69,548 0.03 89,747 Telstra Corp Ltd Australia 157,240 0.07
2,100 Twitter Inc United States of America 52,676 0.02 10,600 Walt Disney Co/The United States of America 1,014,436 0.43 23,125 Zee Entertainment Enterprises Ltd India 137,740 0.06
Consumer Discretionary (31 December 2017: 12.79%) 34,929,603 14.64 13,343 Accor SA France 495,159 0.21
971 Amazon.com Inc United States of America 1,272,889 0.53 3,384 Best Buy Co Inc United States of America 156,419 0.07
950 Booking Holdings Inc United States of America 1,428,147 0.60 1,682 Carnival Plc United States Of America 70,412 0.03
14,341 Crown Resorts Ltd Australia 104,559 0.04 27,000 Dollar Tree Inc United States of America 2,128,422 0.89 17,600 Dollarama Inc Canada 365,350 0.15
351 Domino's Pizza Inc United States of America 75,972 0.03 14,500 Dorman Products Inc United States of America 1,139,245 0.48
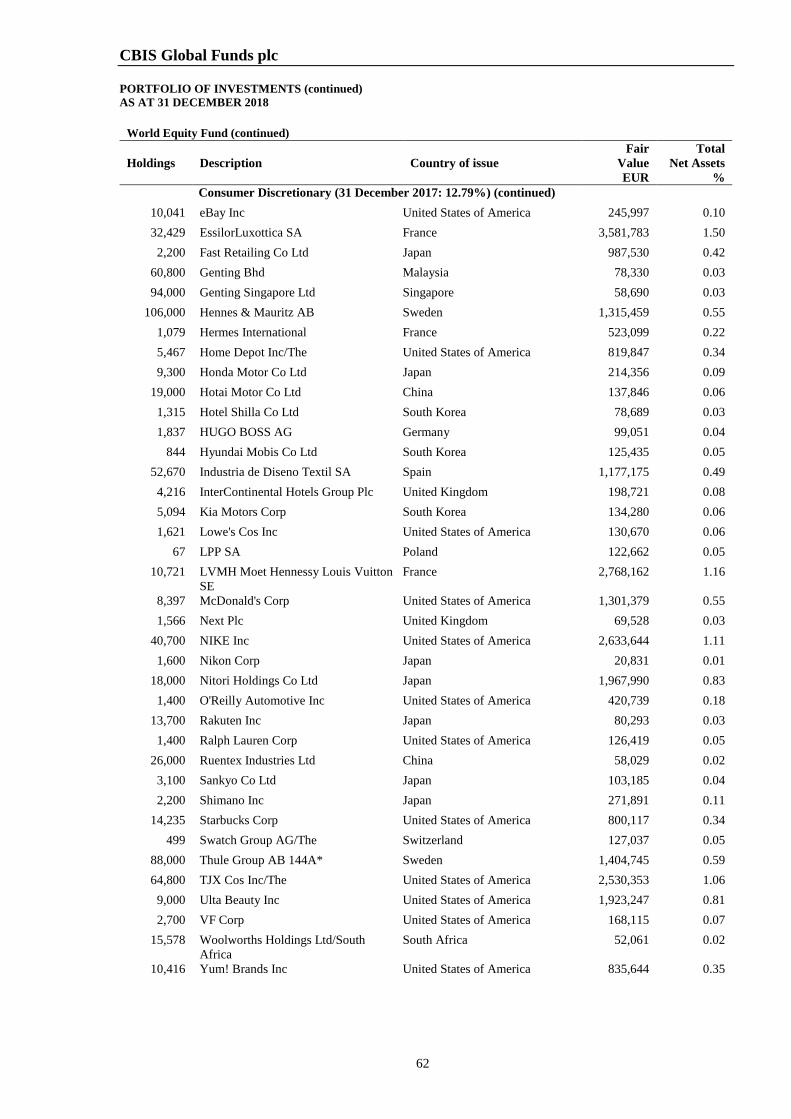
CBIS Global Funds plc PORTFOLIO OF INVESTMENTS (continued) AS AT 31 DECEMBER 2018
62
World Equity Fund (continued)
Holdings Description Country of issue Fair
Value EUR
Total Net Assets
% Consumer Discretionary (31 December 2017: 12.79%) (continued)
10,041 eBay Inc United States of America 245,997 0.10 32,429 EssilorLuxottica SA France 3,581,783 1.50
2,200 Fast Retailing Co Ltd Japan 987,530 0.42 60,800 Genting Bhd Malaysia 78,330 0.03 94,000 Genting Singapore Ltd Singapore 58,690 0.03
106,000 Hennes & Mauritz AB Sweden 1,315,459 0.55 1,079 Hermes International France 523,099 0.22 5,467 Home Depot Inc/The United States of America 819,847 0.34 9,300 Honda Motor Co Ltd Japan 214,356 0.09
19,000 Hotai Motor Co Ltd China 137,846 0.06 1,315 Hotel Shilla Co Ltd South Korea 78,689 0.03 1,837 HUGO BOSS AG Germany 99,051 0.04
844 Hyundai Mobis Co Ltd South Korea 125,435 0.05 52,670 Industria de Diseno Textil SA Spain 1,177,175 0.49
4,216 InterContinental Hotels Group Plc United Kingdom 198,721 0.08 5,094 Kia Motors Corp South Korea 134,280 0.06 1,621 Lowe's Cos Inc United States of America 130,670 0.06
67 LPP SA Poland 122,662 0.05 10,721 LVMH Moet Hennessy Louis Vuitton
SE France 2,768,162 1.16
8,397 McDonald's Corp United States of America 1,301,379 0.55 1,566 Next Plc United Kingdom 69,528 0.03
40,700 NIKE Inc United States of America 2,633,644 1.11 1,600 Nikon Corp Japan 20,831 0.01
18,000 Nitori Holdings Co Ltd Japan 1,967,990 0.83 1,400 O'Reilly Automotive Inc United States of America 420,739 0.18
13,700 Rakuten Inc Japan 80,293 0.03 1,400 Ralph Lauren Corp United States of America 126,419 0.05
26,000 Ruentex Industries Ltd China 58,029 0.02 3,100 Sankyo Co Ltd Japan 103,185 0.04 2,200 Shimano Inc Japan 271,891 0.11
14,235 Starbucks Corp United States of America 800,117 0.34 499 Swatch Group AG/The Switzerland 127,037 0.05
88,000 Thule Group AB 144A* Sweden 1,404,745 0.59 64,800 TJX Cos Inc/The United States of America 2,530,353 1.06
9,000 Ulta Beauty Inc United States of America 1,923,247 0.81 2,700 VF Corp United States of America 168,115 0.07
15,578 Woolworths Holdings Ltd/South Africa
South Africa 52,061 0.02
10,416 Yum! Brands Inc United States of America 835,644 0.35
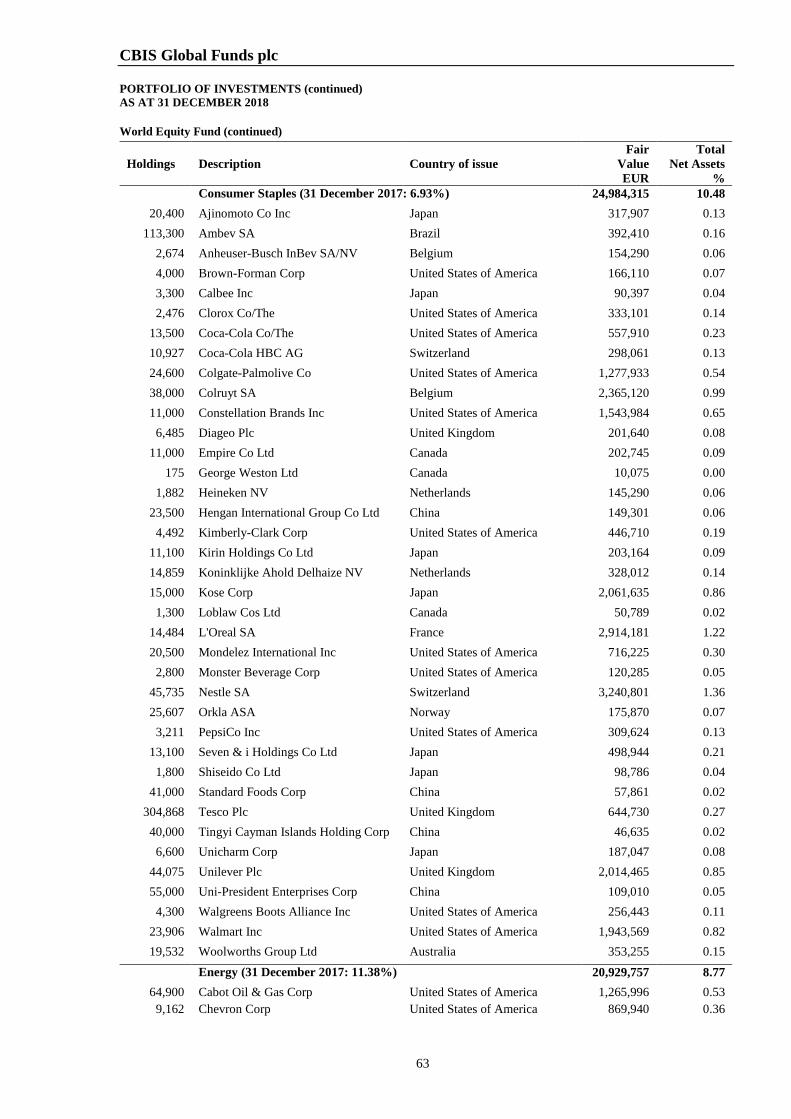
CBIS Global Funds plc PORTFOLIO OF INVESTMENTS (continued) AS AT 31 DECEMBER 2018
63
World Equity Fund (continued)
Holdings Description Country of issue Fair
Value EUR
Total Net Assets
% Consumer Staples (31 December 2017: 6.93%) 24,984,315 10.48
20,400 Ajinomoto Co Inc Japan 317,907 0.13 113,300 Ambev SA Brazil 392,410 0.16
2,674 Anheuser-Busch InBev SA/NV Belgium 154,290 0.06 4,000 Brown-Forman Corp United States of America 166,110 0.07 3,300 Calbee Inc Japan 90,397 0.04 2,476 Clorox Co/The United States of America 333,101 0.14
13,500 Coca-Cola Co/The United States of America 557,910 0.23 10,927 Coca-Cola HBC AG Switzerland 298,061 0.13 24,600 Colgate-Palmolive Co United States of America 1,277,933 0.54 38,000 Colruyt SA Belgium 2,365,120 0.99 11,000 Constellation Brands Inc United States of America 1,543,984 0.65
6,485 Diageo Plc United Kingdom 201,640 0.08 11,000 Empire Co Ltd Canada 202,745 0.09
175 George Weston Ltd Canada 10,075 0.00 1,882 Heineken NV Netherlands 145,290 0.06
23,500 Hengan International Group Co Ltd China 149,301 0.06 4,492 Kimberly-Clark Corp United States of America 446,710 0.19
11,100 Kirin Holdings Co Ltd Japan 203,164 0.09 14,859 Koninklijke Ahold Delhaize NV Netherlands 328,012 0.14 15,000 Kose Corp Japan 2,061,635 0.86
1,300 Loblaw Cos Ltd Canada 50,789 0.02 14,484 L'Oreal SA France 2,914,181 1.22 20,500 Mondelez International Inc United States of America 716,225 0.30
2,800 Monster Beverage Corp United States of America 120,285 0.05 45,735 Nestle SA Switzerland 3,240,801 1.36 25,607 Orkla ASA Norway 175,870 0.07
3,211 PepsiCo Inc United States of America 309,624 0.13 13,100 Seven & i Holdings Co Ltd Japan 498,944 0.21
1,800 Shiseido Co Ltd Japan 98,786 0.04 41,000 Standard Foods Corp China 57,861 0.02
304,868 Tesco Plc United Kingdom 644,730 0.27 40,000 Tingyi Cayman Islands Holding Corp China 46,635 0.02
6,600 Unicharm Corp Japan 187,047 0.08 44,075 Unilever Plc United Kingdom 2,014,465 0.85 55,000 Uni-President Enterprises Corp China 109,010 0.05
4,300 Walgreens Boots Alliance Inc United States of America 256,443 0.11 23,906 Walmart Inc United States of America 1,943,569 0.82 19,532 Woolworths Group Ltd Australia 353,255 0.15
Energy (31 December 2017: 11.38%) 20,929,757 8.77 64,900 Cabot Oil & Gas Corp United States of America 1,265,996 0.53
9,162 Chevron Corp United States of America 869,940 0.36
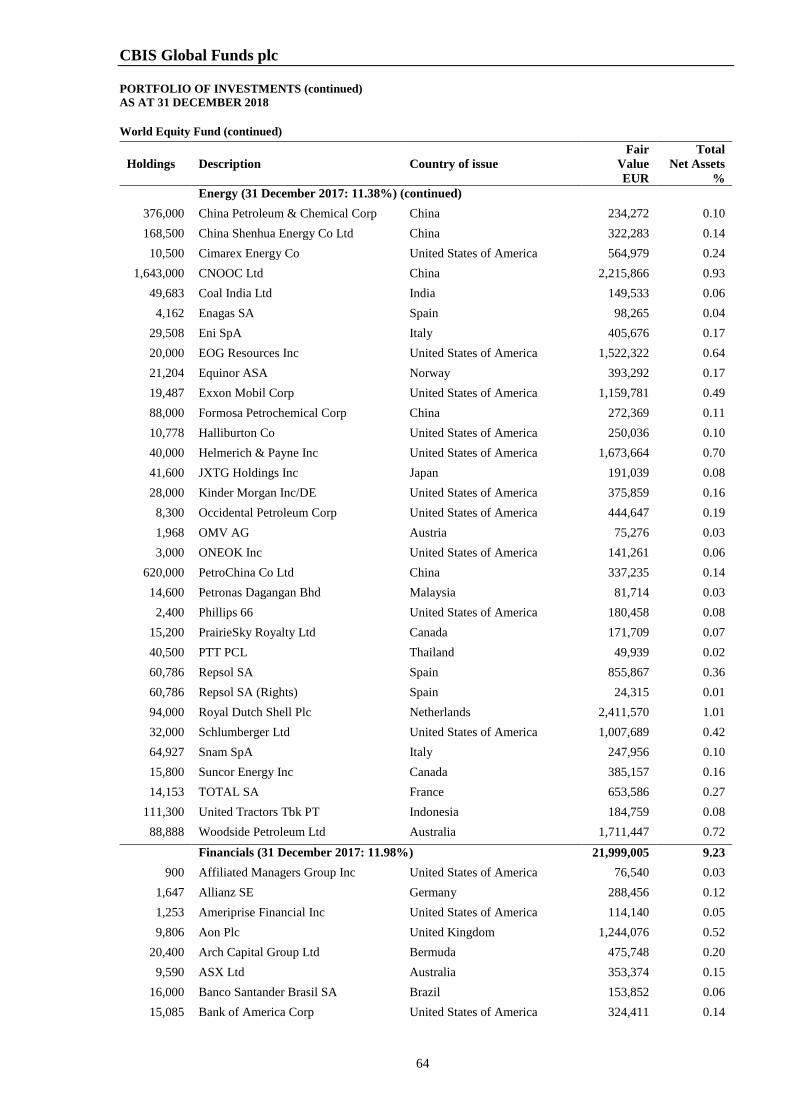
CBIS Global Funds plc PORTFOLIO OF INVESTMENTS (continued) AS AT 31 DECEMBER 2018
64
World Equity Fund (continued)
Holdings Description Country of issue Fair
Value EUR
Total Net Assets
% Energy (31 December 2017: 11.38%) (continued)
376,000 China Petroleum & Chemical Corp China 234,272 0.10 168,500 China Shenhua Energy Co Ltd China 322,283 0.14 10,500 Cimarex Energy Co United States of America 564,979 0.24
1,643,000 CNOOC Ltd China 2,215,866 0.93 49,683 Coal India Ltd India 149,533 0.06
4,162 Enagas SA Spain 98,265 0.04 29,508 Eni SpA Italy 405,676 0.17 20,000 EOG Resources Inc United States of America 1,522,322 0.64 21,204 Equinor ASA Norway 393,292 0.17 19,487 Exxon Mobil Corp United States of America 1,159,781 0.49 88,000 Formosa Petrochemical Corp China 272,369 0.11 10,778 Halliburton Co United States of America 250,036 0.10 40,000 Helmerich & Payne Inc United States of America 1,673,664 0.70 41,600 JXTG Holdings Inc Japan 191,039 0.08 28,000 Kinder Morgan Inc/DE United States of America 375,859 0.16
8,300 Occidental Petroleum Corp United States of America 444,647 0.19 1,968 OMV AG Austria 75,276 0.03 3,000 ONEOK Inc United States of America 141,261 0.06
620,000 PetroChina Co Ltd China 337,235 0.14 14,600 Petronas Dagangan Bhd Malaysia 81,714 0.03
2,400 Phillips 66 United States of America 180,458 0.08 15,200 PrairieSky Royalty Ltd Canada 171,709 0.07 40,500 PTT PCL Thailand 49,939 0.02 60,786 Repsol SA Spain 855,867 0.36 60,786 Repsol SA (Rights) Spain 24,315 0.01 94,000 Royal Dutch Shell Plc Netherlands 2,411,570 1.01 32,000 Schlumberger Ltd United States of America 1,007,689 0.42 64,927 Snam SpA Italy 247,956 0.10 15,800 Suncor Energy Inc Canada 385,157 0.16 14,153 TOTAL SA France 653,586 0.27
111,300 United Tractors Tbk PT Indonesia 184,759 0.08 88,888 Woodside Petroleum Ltd Australia 1,711,447 0.72
Financials (31 December 2017: 11.98%) 21,999,005 9.23 900 Affiliated Managers Group Inc United States of America 76,540 0.03
1,647 Allianz SE Germany 288,456 0.12 1,253 Ameriprise Financial Inc United States of America 114,140 0.05 9,806 Aon Plc United Kingdom 1,244,076 0.52
20,400 Arch Capital Group Ltd Bermuda 475,748 0.20 9,590 ASX Ltd Australia 353,374 0.15
16,000 Banco Santander Brasil SA Brazil 153,852 0.06 15,085 Bank of America Corp United States of America 324,411 0.14
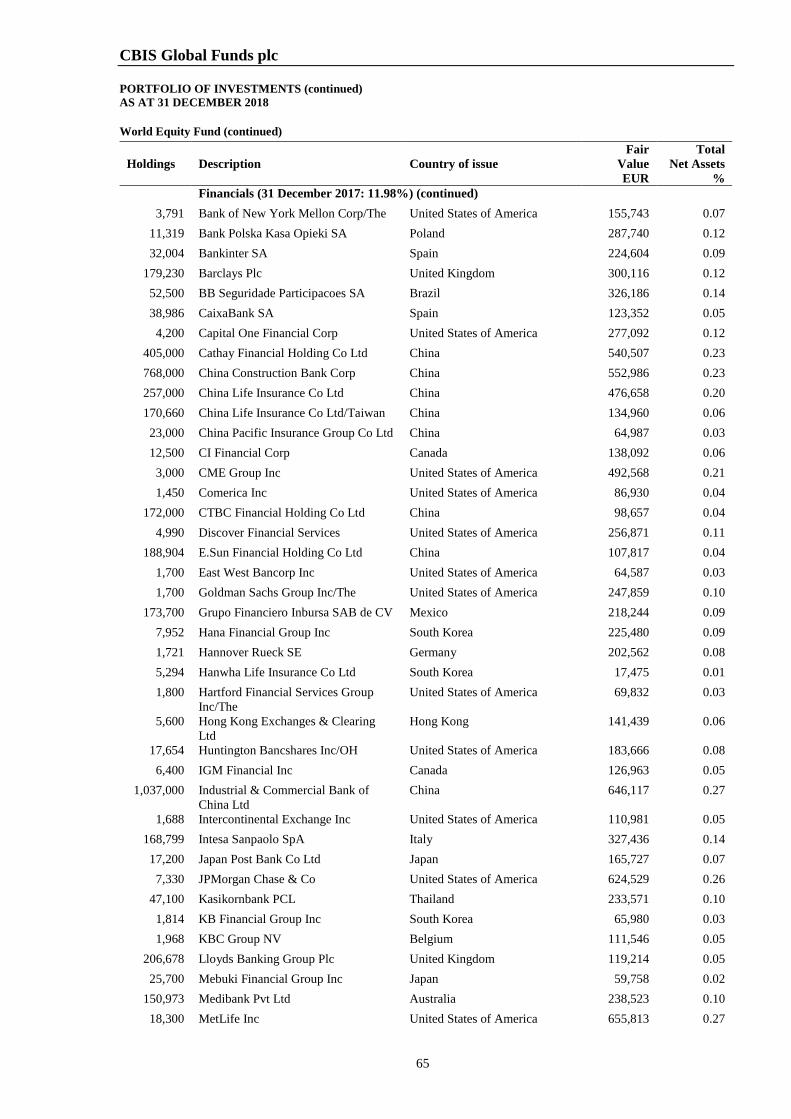
CBIS Global Funds plc PORTFOLIO OF INVESTMENTS (continued) AS AT 31 DECEMBER 2018
65
World Equity Fund (continued)
Holdings Description Country of issue Fair
Value EUR
Total Net Assets
% Financials (31 December 2017: 11.98%) (continued)
3,791 Bank of New York Mellon Corp/The United States of America 155,743 0.07 11,319 Bank Polska Kasa Opieki SA Poland 287,740 0.12 32,004 Bankinter SA Spain 224,604 0.09
179,230 Barclays Plc United Kingdom 300,116 0.12 52,500 BB Seguridade Participacoes SA Brazil 326,186 0.14 38,986 CaixaBank SA Spain 123,352 0.05
4,200 Capital One Financial Corp United States of America 277,092 0.12 405,000 Cathay Financial Holding Co Ltd China 540,507 0.23 768,000 China Construction Bank Corp China 552,986 0.23 257,000 China Life Insurance Co Ltd China 476,658 0.20 170,660 China Life Insurance Co Ltd/Taiwan China 134,960 0.06 23,000 China Pacific Insurance Group Co Ltd China 64,987 0.03 12,500 CI Financial Corp Canada 138,092 0.06
3,000 CME Group Inc United States of America 492,568 0.21 1,450 Comerica Inc United States of America 86,930 0.04
172,000 CTBC Financial Holding Co Ltd China 98,657 0.04 4,990 Discover Financial Services United States of America 256,871 0.11
188,904 E.Sun Financial Holding Co Ltd China 107,817 0.04 1,700 East West Bancorp Inc United States of America 64,587 0.03 1,700 Goldman Sachs Group Inc/The United States of America 247,859 0.10
173,700 Grupo Financiero Inbursa SAB de CV Mexico 218,244 0.09 7,952 Hana Financial Group Inc South Korea 225,480 0.09 1,721 Hannover Rueck SE Germany 202,562 0.08 5,294 Hanwha Life Insurance Co Ltd South Korea 17,475 0.01 1,800 Hartford Financial Services Group
Inc/The United States of America 69,832 0.03
5,600 Hong Kong Exchanges & Clearing Ltd
Hong Kong 141,439 0.06
17,654 Huntington Bancshares Inc/OH United States of America 183,666 0.08 6,400 IGM Financial Inc Canada 126,963 0.05
1,037,000 Industrial & Commercial Bank of China Ltd
China 646,117 0.27
1,688 Intercontinental Exchange Inc United States of America 110,981 0.05 168,799 Intesa Sanpaolo SpA Italy 327,436 0.14 17,200 Japan Post Bank Co Ltd Japan 165,727 0.07
7,330 JPMorgan Chase & Co United States of America 624,529 0.26 47,100 Kasikornbank PCL Thailand 233,571 0.10
1,814 KB Financial Group Inc South Korea 65,980 0.03 1,968 KBC Group NV Belgium 111,546 0.05
206,678 Lloyds Banking Group Plc United Kingdom 119,214 0.05 25,700 Mebuki Financial Group Inc Japan 59,758 0.02
150,973 Medibank Pvt Ltd Australia 238,523 0.10 18,300 MetLife Inc United States of America 655,813 0.27
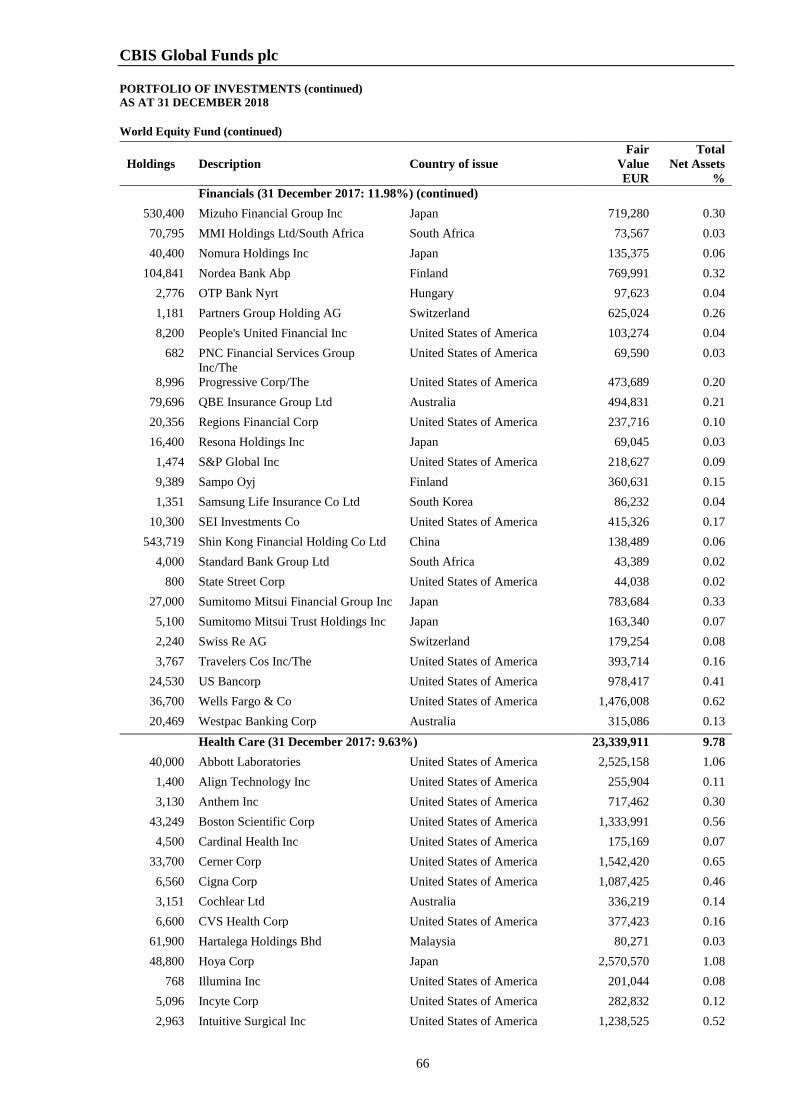
CBIS Global Funds plc PORTFOLIO OF INVESTMENTS (continued) AS AT 31 DECEMBER 2018
66
World Equity Fund (continued)
Holdings Description Country of issue Fair
Value EUR
Total Net Assets
% Financials (31 December 2017: 11.98%) (continued)
530,400 Mizuho Financial Group Inc Japan 719,280 0.30 70,795 MMI Holdings Ltd/South Africa South Africa 73,567 0.03 40,400 Nomura Holdings Inc Japan 135,375 0.06
104,841 Nordea Bank Abp Finland 769,991 0.32 2,776 OTP Bank Nyrt Hungary 97,623 0.04 1,181 Partners Group Holding AG Switzerland 625,024 0.26 8,200 People's United Financial Inc United States of America 103,274 0.04
682 PNC Financial Services Group Inc/The
United States of America 69,590 0.03
8,996 Progressive Corp/The United States of America 473,689 0.20 79,696 QBE Insurance Group Ltd Australia 494,831 0.21 20,356 Regions Financial Corp United States of America 237,716 0.10 16,400 Resona Holdings Inc Japan 69,045 0.03
1,474 S&P Global Inc United States of America 218,627 0.09 9,389 Sampo Oyj Finland 360,631 0.15 1,351 Samsung Life Insurance Co Ltd South Korea 86,232 0.04
10,300 SEI Investments Co United States of America 415,326 0.17 543,719 Shin Kong Financial Holding Co Ltd China 138,489 0.06
4,000 Standard Bank Group Ltd South Africa 43,389 0.02 800 State Street Corp United States of America 44,038 0.02
27,000 Sumitomo Mitsui Financial Group Inc Japan 783,684 0.33 5,100 Sumitomo Mitsui Trust Holdings Inc Japan 163,340 0.07 2,240 Swiss Re AG Switzerland 179,254 0.08 3,767 Travelers Cos Inc/The United States of America 393,714 0.16
24,530 US Bancorp United States of America 978,417 0.41 36,700 Wells Fargo & Co United States of America 1,476,008 0.62 20,469 Westpac Banking Corp Australia 315,086 0.13
Health Care (31 December 2017: 9.63%) 23,339,911 9.78 40,000 Abbott Laboratories United States of America 2,525,158 1.06
1,400 Align Technology Inc United States of America 255,904 0.11 3,130 Anthem Inc United States of America 717,462 0.30
43,249 Boston Scientific Corp United States of America 1,333,991 0.56 4,500 Cardinal Health Inc United States of America 175,169 0.07
33,700 Cerner Corp United States of America 1,542,420 0.65 6,560 Cigna Corp United States of America 1,087,425 0.46 3,151 Cochlear Ltd Australia 336,219 0.14 6,600 CVS Health Corp United States of America 377,423 0.16
61,900 Hartalega Holdings Bhd Malaysia 80,271 0.03 48,800 Hoya Corp Japan 2,570,570 1.08
768 Illumina Inc United States of America 201,044 0.08 5,096 Incyte Corp United States of America 282,832 0.12 2,963 Intuitive Surgical Inc United States of America 1,238,525 0.52
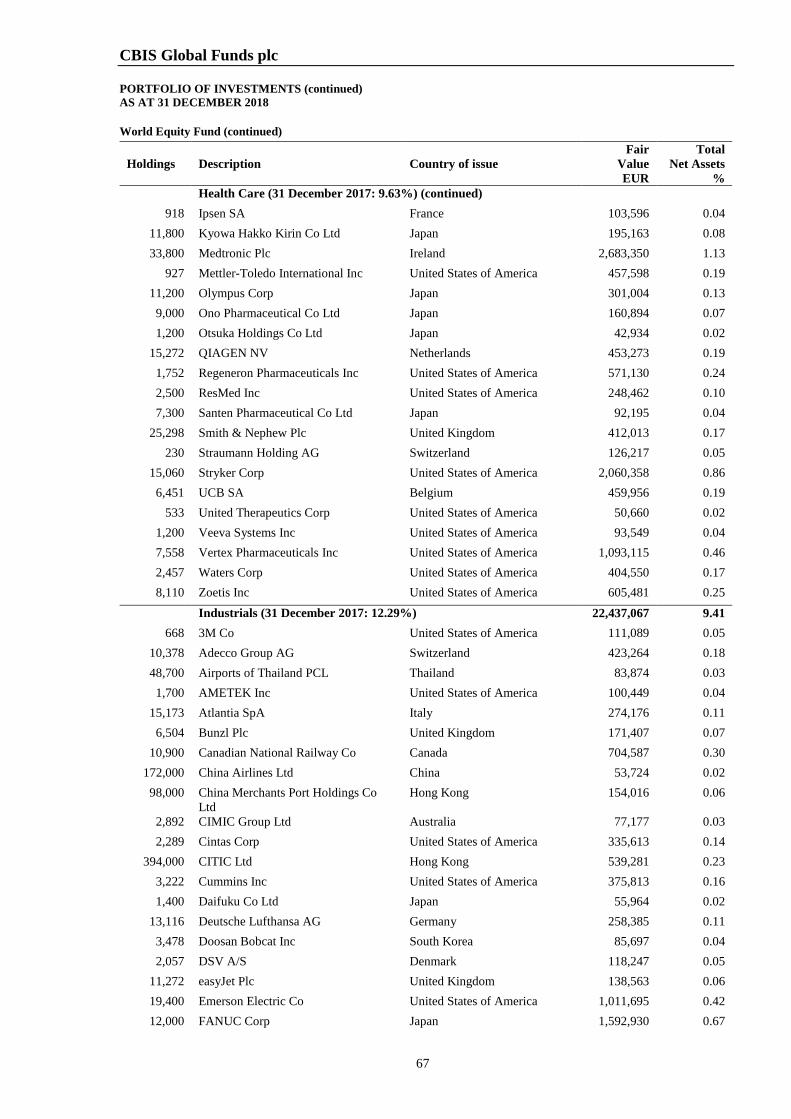
CBIS Global Funds plc PORTFOLIO OF INVESTMENTS (continued) AS AT 31 DECEMBER 2018
67
World Equity Fund (continued)
Holdings Description Country of issue Fair
Value EUR
Total Net Assets
% Health Care (31 December 2017: 9.63%) (continued)
918 Ipsen SA France 103,596 0.04 11,800 Kyowa Hakko Kirin Co Ltd Japan 195,163 0.08 33,800 Medtronic Plc Ireland 2,683,350 1.13
927 Mettler-Toledo International Inc United States of America 457,598 0.19 11,200 Olympus Corp Japan 301,004 0.13
9,000 Ono Pharmaceutical Co Ltd Japan 160,894 0.07 1,200 Otsuka Holdings Co Ltd Japan 42,934 0.02
15,272 QIAGEN NV Netherlands 453,273 0.19 1,752 Regeneron Pharmaceuticals Inc United States of America 571,130 0.24 2,500 ResMed Inc United States of America 248,462 0.10 7,300 Santen Pharmaceutical Co Ltd Japan 92,195 0.04
25,298 Smith & Nephew Plc United Kingdom 412,013 0.17 230 Straumann Holding AG Switzerland 126,217 0.05
15,060 Stryker Corp United States of America 2,060,358 0.86 6,451 UCB SA Belgium 459,956 0.19
533 United Therapeutics Corp United States of America 50,660 0.02 1,200 Veeva Systems Inc United States of America 93,549 0.04 7,558 Vertex Pharmaceuticals Inc United States of America 1,093,115 0.46 2,457 Waters Corp United States of America 404,550 0.17 8,110 Zoetis Inc United States of America 605,481 0.25
Industrials (31 December 2017: 12.29%) 22,437,067 9.41 668 3M Co United States of America 111,089 0.05
10,378 Adecco Group AG Switzerland 423,264 0.18 48,700 Airports of Thailand PCL Thailand 83,874 0.03
1,700 AMETEK Inc United States of America 100,449 0.04 15,173 Atlantia SpA Italy 274,176 0.11
6,504 Bunzl Plc United Kingdom 171,407 0.07 10,900 Canadian National Railway Co Canada 704,587 0.30
172,000 China Airlines Ltd China 53,724 0.02 98,000 China Merchants Port Holdings Co
Ltd Hong Kong 154,016 0.06
2,892 CIMIC Group Ltd Australia 77,177 0.03 2,289 Cintas Corp United States of America 335,613 0.14
394,000 CITIC Ltd Hong Kong 539,281 0.23 3,222 Cummins Inc United States of America 375,813 0.16 1,400 Daifuku Co Ltd Japan 55,964 0.02
13,116 Deutsche Lufthansa AG Germany 258,385 0.11 3,478 Doosan Bobcat Inc South Korea 85,697 0.04 2,057 DSV A/S Denmark 118,247 0.05
11,272 easyJet Plc United Kingdom 138,563 0.06 19,400 Emerson Electric Co United States of America 1,011,695 0.42 12,000 FANUC Corp Japan 1,592,930 0.67
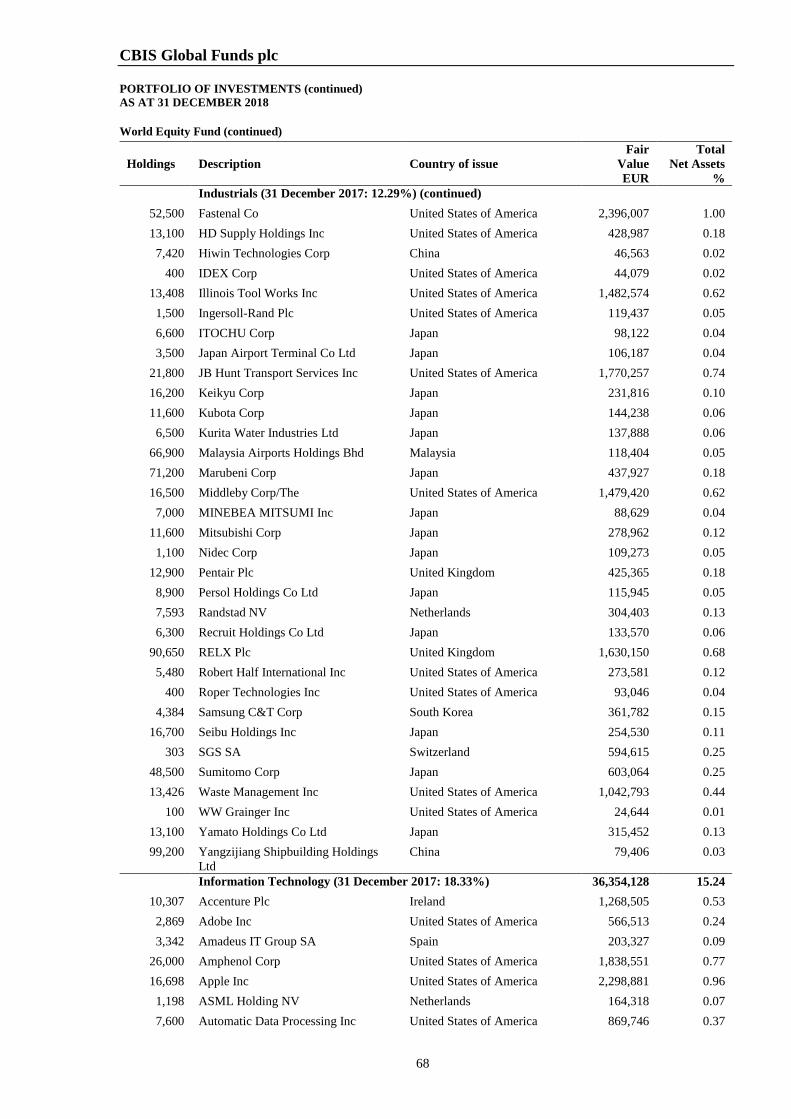
CBIS Global Funds plc PORTFOLIO OF INVESTMENTS (continued) AS AT 31 DECEMBER 2018
68
World Equity Fund (continued)
Holdings Description Country of issue Fair
Value EUR
Total Net Assets
% Industrials (31 December 2017: 12.29%) (continued)
52,500 Fastenal Co United States of America 2,396,007 1.00 13,100 HD Supply Holdings Inc United States of America 428,987 0.18
7,420 Hiwin Technologies Corp China 46,563 0.02 400 IDEX Corp United States of America 44,079 0.02
13,408 Illinois Tool Works Inc United States of America 1,482,574 0.62 1,500 Ingersoll-Rand Plc United States of America 119,437 0.05 6,600 ITOCHU Corp Japan 98,122 0.04 3,500 Japan Airport Terminal Co Ltd Japan 106,187 0.04
21,800 JB Hunt Transport Services Inc United States of America 1,770,257 0.74 16,200 Keikyu Corp Japan 231,816 0.10 11,600 Kubota Corp Japan 144,238 0.06
6,500 Kurita Water Industries Ltd Japan 137,888 0.06 66,900 Malaysia Airports Holdings Bhd Malaysia 118,404 0.05 71,200 Marubeni Corp Japan 437,927 0.18 16,500 Middleby Corp/The United States of America 1,479,420 0.62
7,000 MINEBEA MITSUMI Inc Japan 88,629 0.04 11,600 Mitsubishi Corp Japan 278,962 0.12
1,100 Nidec Corp Japan 109,273 0.05 12,900 Pentair Plc United Kingdom 425,365 0.18
8,900 Persol Holdings Co Ltd Japan 115,945 0.05 7,593 Randstad NV Netherlands 304,403 0.13 6,300 Recruit Holdings Co Ltd Japan 133,570 0.06
90,650 RELX Plc United Kingdom 1,630,150 0.68 5,480 Robert Half International Inc United States of America 273,581 0.12
400 Roper Technologies Inc United States of America 93,046 0.04 4,384 Samsung C&T Corp South Korea 361,782 0.15
16,700 Seibu Holdings Inc Japan 254,530 0.11 303 SGS SA Switzerland 594,615 0.25
48,500 Sumitomo Corp Japan 603,064 0.25 13,426 Waste Management Inc United States of America 1,042,793 0.44
100 WW Grainger Inc United States of America 24,644 0.01 13,100 Yamato Holdings Co Ltd Japan 315,452 0.13 99,200 Yangzijiang Shipbuilding Holdings
Ltd China 79,406 0.03
Information Technology (31 December 2017: 18.33%) 36,354,128 15.24 10,307 Accenture Plc Ireland 1,268,505 0.53
2,869 Adobe Inc United States of America 566,513 0.24 3,342 Amadeus IT Group SA Spain 203,327 0.09
26,000 Amphenol Corp United States of America 1,838,551 0.77 16,698 Apple Inc United States of America 2,298,881 0.96
1,198 ASML Holding NV Netherlands 164,318 0.07 7,600 Automatic Data Processing Inc United States of America 869,746 0.37
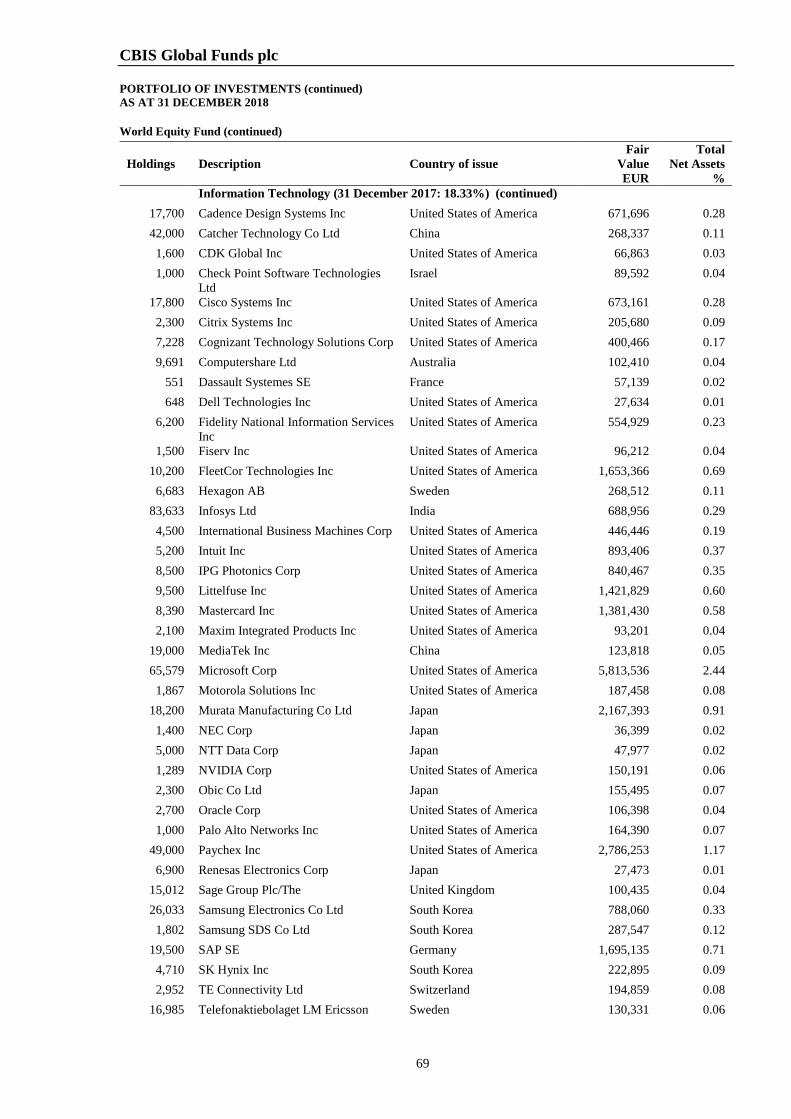
CBIS Global Funds plc PORTFOLIO OF INVESTMENTS (continued) AS AT 31 DECEMBER 2018
69
World Equity Fund (continued)
Holdings Description Country of issue Fair
Value EUR
Total Net Assets
% Information Technology (31 December 2017: 18.33%) (continued)
17,700 Cadence Design Systems Inc United States of America 671,696 0.28 42,000 Catcher Technology Co Ltd China 268,337 0.11
1,600 CDK Global Inc United States of America 66,863 0.03 1,000 Check Point Software Technologies
Ltd Israel 89,592 0.04
17,800 Cisco Systems Inc United States of America 673,161 0.28 2,300 Citrix Systems Inc United States of America 205,680 0.09 7,228 Cognizant Technology Solutions Corp United States of America 400,466 0.17 9,691 Computershare Ltd Australia 102,410 0.04
551 Dassault Systemes SE France 57,139 0.02 648 Dell Technologies Inc United States of America 27,634 0.01
6,200 Fidelity National Information Services Inc
United States of America 554,929 0.23
1,500 Fiserv Inc United States of America 96,212 0.04 10,200 FleetCor Technologies Inc United States of America 1,653,366 0.69
6,683 Hexagon AB Sweden 268,512 0.11 83,633 Infosys Ltd India 688,956 0.29
4,500 International Business Machines Corp United States of America 446,446 0.19 5,200 Intuit Inc United States of America 893,406 0.37 8,500 IPG Photonics Corp United States of America 840,467 0.35 9,500 Littelfuse Inc United States of America 1,421,829 0.60 8,390 Mastercard Inc United States of America 1,381,430 0.58 2,100 Maxim Integrated Products Inc United States of America 93,201 0.04
19,000 MediaTek Inc China 123,818 0.05 65,579 Microsoft Corp United States of America 5,813,536 2.44
1,867 Motorola Solutions Inc United States of America 187,458 0.08 18,200 Murata Manufacturing Co Ltd Japan 2,167,393 0.91
1,400 NEC Corp Japan 36,399 0.02 5,000 NTT Data Corp Japan 47,977 0.02 1,289 NVIDIA Corp United States of America 150,191 0.06 2,300 Obic Co Ltd Japan 155,495 0.07 2,700 Oracle Corp United States of America 106,398 0.04 1,000 Palo Alto Networks Inc United States of America 164,390 0.07
49,000 Paychex Inc United States of America 2,786,253 1.17 6,900 Renesas Electronics Corp Japan 27,473 0.01
15,012 Sage Group Plc/The United Kingdom 100,435 0.04 26,033 Samsung Electronics Co Ltd South Korea 788,060 0.33
1,802 Samsung SDS Co Ltd South Korea 287,547 0.12 19,500 SAP SE Germany 1,695,135 0.71
4,710 SK Hynix Inc South Korea 222,895 0.09 2,952 TE Connectivity Ltd Switzerland 194,859 0.08
16,985 Telefonaktiebolaget LM Ericsson Sweden 130,331 0.06
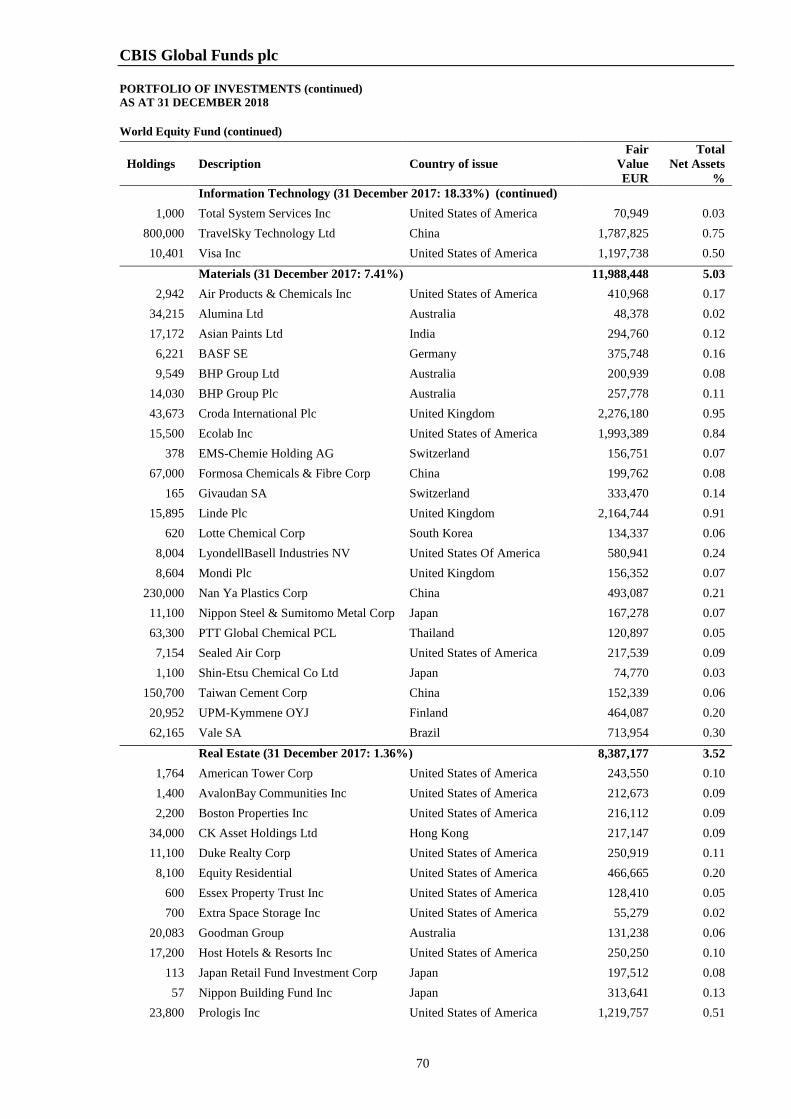
CBIS Global Funds plc PORTFOLIO OF INVESTMENTS (continued) AS AT 31 DECEMBER 2018
70
World Equity Fund (continued)
Holdings Description Country of issue Fair
Value EUR
Total Net Assets
% Information Technology (31 December 2017: 18.33%) (continued)
1,000 Total System Services Inc United States of America 70,949 0.03 800,000 TravelSky Technology Ltd China 1,787,825 0.75 10,401 Visa Inc United States of America 1,197,738 0.50
Materials (31 December 2017: 7.41%) 11,988,448 5.03 2,942 Air Products & Chemicals Inc United States of America 410,968 0.17
34,215 Alumina Ltd Australia 48,378 0.02 17,172 Asian Paints Ltd India 294,760 0.12
6,221 BASF SE Germany 375,748 0.16 9,549 BHP Group Ltd Australia 200,939 0.08
14,030 BHP Group Plc Australia 257,778 0.11 43,673 Croda International Plc United Kingdom 2,276,180 0.95 15,500 Ecolab Inc United States of America 1,993,389 0.84
378 EMS-Chemie Holding AG Switzerland 156,751 0.07 67,000 Formosa Chemicals & Fibre Corp China 199,762 0.08
165 Givaudan SA Switzerland 333,470 0.14 15,895 Linde Plc United Kingdom 2,164,744 0.91
620 Lotte Chemical Corp South Korea 134,337 0.06 8,004 LyondellBasell Industries NV United States Of America 580,941 0.24 8,604 Mondi Plc United Kingdom 156,352 0.07
230,000 Nan Ya Plastics Corp China 493,087 0.21 11,100 Nippon Steel & Sumitomo Metal Corp Japan 167,278 0.07 63,300 PTT Global Chemical PCL Thailand 120,897 0.05
7,154 Sealed Air Corp United States of America 217,539 0.09 1,100 Shin-Etsu Chemical Co Ltd Japan 74,770 0.03
150,700 Taiwan Cement Corp China 152,339 0.06 20,952 UPM-Kymmene OYJ Finland 464,087 0.20 62,165 Vale SA Brazil 713,954 0.30
Real Estate (31 December 2017: 1.36%) 8,387,177 3.52 1,764 American Tower Corp United States of America 243,550 0.10 1,400 AvalonBay Communities Inc United States of America 212,673 0.09 2,200 Boston Properties Inc United States of America 216,112 0.09
34,000 CK Asset Holdings Ltd Hong Kong 217,147 0.09 11,100 Duke Realty Corp United States of America 250,919 0.11
8,100 Equity Residential United States of America 466,665 0.20 600 Essex Property Trust Inc United States of America 128,410 0.05 700 Extra Space Storage Inc United States of America 55,279 0.02
20,083 Goodman Group Australia 131,238 0.06 17,200 Host Hotels & Resorts Inc United States of America 250,250 0.10
113 Japan Retail Fund Investment Corp Japan 197,512 0.08 57 Nippon Building Fund Inc Japan 313,641 0.13
23,800 Prologis Inc United States of America 1,219,757 0.51
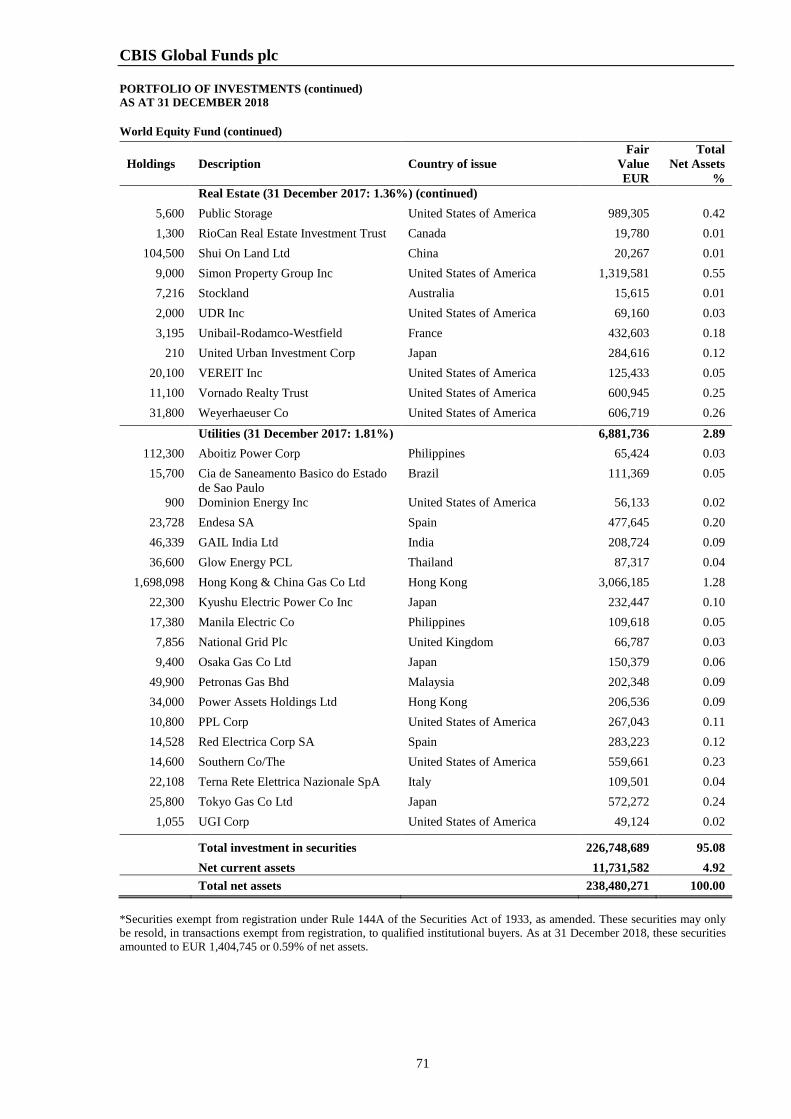
CBIS Global Funds plc PORTFOLIO OF INVESTMENTS (continued) AS AT 31 DECEMBER 2018
71
World Equity Fund (continued)
Holdings Description Country of issue Fair
Value EUR
Total Net Assets
% Real Estate (31 December 2017: 1.36%) (continued)
5,600 Public Storage United States of America 989,305 0.42 1,300 RioCan Real Estate Investment Trust Canada 19,780 0.01
104,500 Shui On Land Ltd China 20,267 0.01 9,000 Simon Property Group Inc United States of America 1,319,581 0.55 7,216 Stockland Australia 15,615 0.01 2,000 UDR Inc United States of America 69,160 0.03 3,195 Unibail-Rodamco-Westfield France 432,603 0.18
210 United Urban Investment Corp Japan 284,616 0.12 20,100 VEREIT Inc United States of America 125,433 0.05 11,100 Vornado Realty Trust United States of America 600,945 0.25 31,800 Weyerhaeuser Co United States of America 606,719 0.26
Utilities (31 December 2017: 1.81%) 6,881,736 2.89 112,300 Aboitiz Power Corp Philippines 65,424 0.03 15,700 Cia de Saneamento Basico do Estado
de Sao Paulo Brazil 111,369 0.05
900 Dominion Energy Inc United States of America 56,133 0.02 23,728 Endesa SA Spain 477,645 0.20 46,339 GAIL India Ltd India 208,724 0.09 36,600 Glow Energy PCL Thailand 87,317 0.04
1,698,098 Hong Kong & China Gas Co Ltd Hong Kong 3,066,185 1.28 22,300 Kyushu Electric Power Co Inc Japan 232,447 0.10 17,380 Manila Electric Co Philippines 109,618 0.05
7,856 National Grid Plc United Kingdom 66,787 0.03 9,400 Osaka Gas Co Ltd Japan 150,379 0.06
49,900 Petronas Gas Bhd Malaysia 202,348 0.09 34,000 Power Assets Holdings Ltd Hong Kong 206,536 0.09 10,800 PPL Corp United States of America 267,043 0.11 14,528 Red Electrica Corp SA Spain 283,223 0.12 14,600 Southern Co/The United States of America 559,661 0.23 22,108 Terna Rete Elettrica Nazionale SpA Italy 109,501 0.04 25,800 Tokyo Gas Co Ltd Japan 572,272 0.24
1,055 UGI Corp United States of America 49,124 0.02
Total investment in securities 226,748,689 95.08 Net current assets 11,731,582 4.92
Total net assets 238,480,271 100.00 *Securities exempt from registration under Rule 144A of the Securities Act of 1933, as amended. These securities may only be resold, in transactions exempt from registration, to qualified institutional buyers. As at 31 December 2018, these securities amounted to EUR 1,404,745 or 0.59% of net assets.
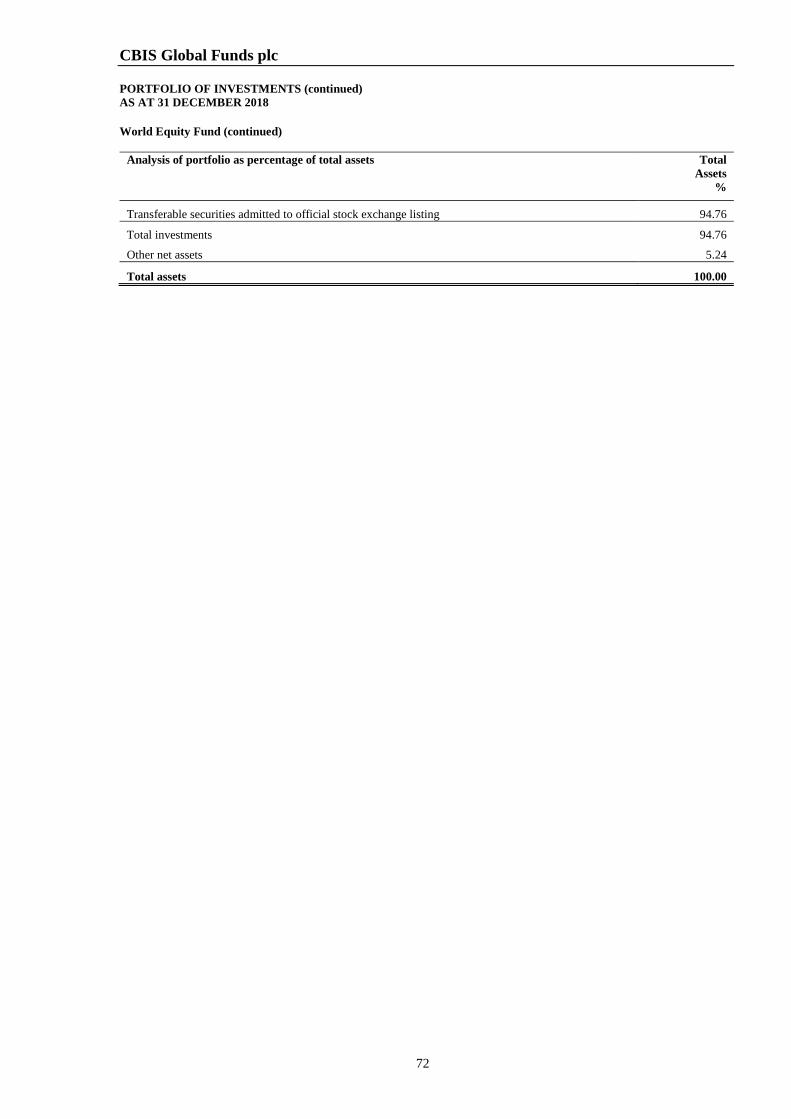
CBIS Global Funds plc PORTFOLIO OF INVESTMENTS (continued) AS AT 31 DECEMBER 2018
72
World Equity Fund (continued)
Analysis of portfolio as percentage of total assets Total Assets
%
Transferable securities admitted to official stock exchange listing 94.76
Total investments 94.76
Other net assets 5.24
Total assets 100.00
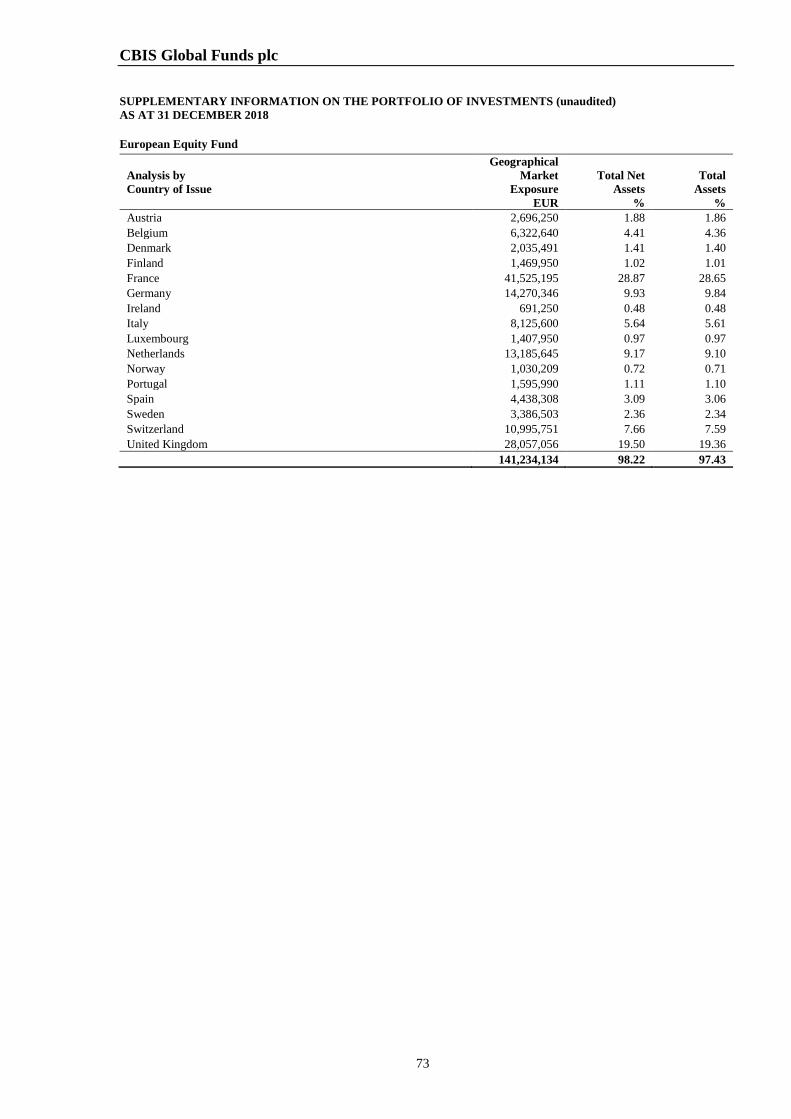
CBIS Global Funds plc
73
SUPPLEMENTARY INFORMATION ON THE PORTFOLIO OF INVESTMENTS (unaudited) AS AT 31 DECEMBER 2018 European Equity Fund
Analysis by Country of Issue
Geographical Market
Exposure EUR
Total Net Assets
%
Total Assets
% Austria 2,696,250 1.88 1.86 Belgium 6,322,640 4.41 4.36 Denmark 2,035,491 1.41 1.40 Finland 1,469,950 1.02 1.01 France 41,525,195 28.87 28.65 Germany 14,270,346 9.93 9.84 Ireland 691,250 0.48 0.48 Italy 8,125,600 5.64 5.61 Luxembourg 1,407,950 0.97 0.97 Netherlands 13,185,645 9.17 9.10 Norway 1,030,209 0.72 0.71 Portugal 1,595,990 1.11 1.10 Spain 4,438,308 3.09 3.06 Sweden 3,386,503 2.36 2.34 Switzerland 10,995,751 7.66 7.59 United Kingdom 28,057,056 19.50 19.36 141,234,134 98.22 97.43
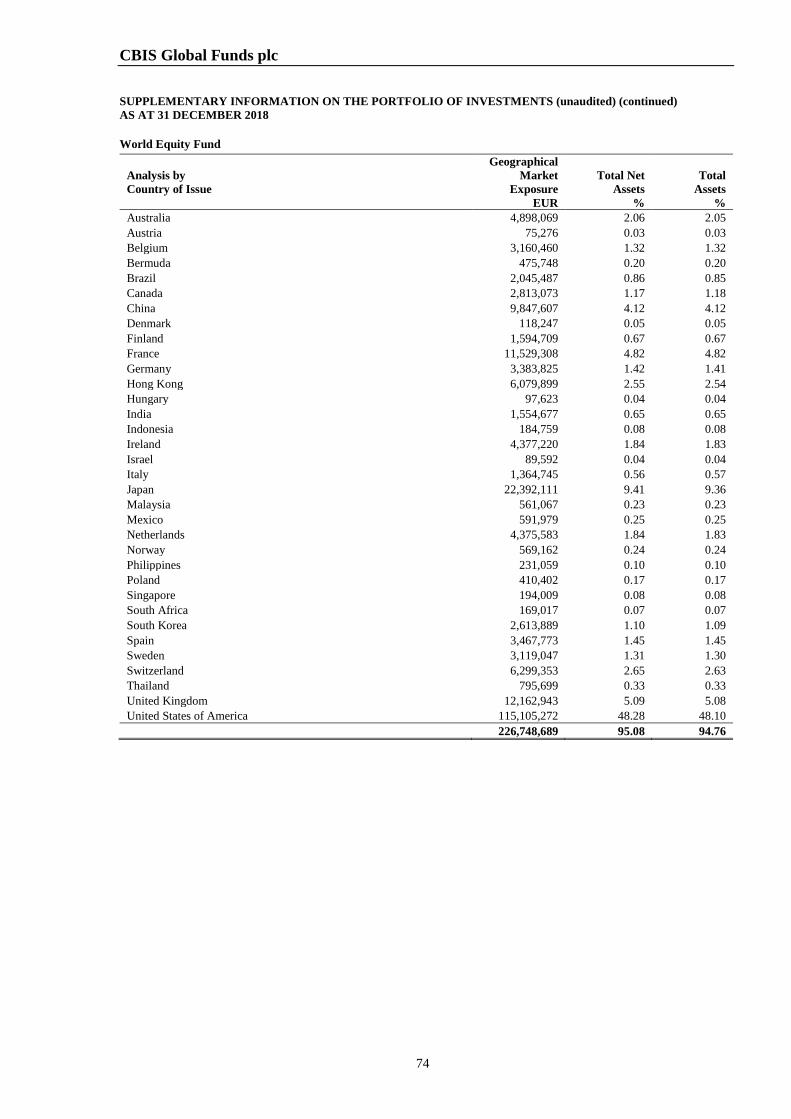
CBIS Global Funds plc
74
SUPPLEMENTARY INFORMATION ON THE PORTFOLIO OF INVESTMENTS (unaudited) (continued) AS AT 31 DECEMBER 2018 World Equity Fund
Analysis by Country of Issue
Geographical Market
Exposure EUR
Total Net Assets
%
Total Assets
% Australia 4,898,069 2.06 2.05 Austria 75,276 0.03 0.03 Belgium 3,160,460 1.32 1.32 Bermuda 475,748 0.20 0.20 Brazil 2,045,487 0.86 0.85 Canada 2,813,073 1.17 1.18 China 9,847,607 4.12 4.12 Denmark 118,247 0.05 0.05 Finland 1,594,709 0.67 0.67 France 11,529,308 4.82 4.82 Germany 3,383,825 1.42 1.41 Hong Kong 6,079,899 2.55 2.54 Hungary 97,623 0.04 0.04 India 1,554,677 0.65 0.65 Indonesia 184,759 0.08 0.08 Ireland 4,377,220 1.84 1.83 Israel 89,592 0.04 0.04 Italy 1,364,745 0.56 0.57 Japan 22,392,111 9.41 9.36 Malaysia 561,067 0.23 0.23 Mexico 591,979 0.25 0.25 Netherlands 4,375,583 1.84 1.83 Norway 569,162 0.24 0.24 Philippines 231,059 0.10 0.10 Poland 410,402 0.17 0.17 Singapore 194,009 0.08 0.08 South Africa 169,017 0.07 0.07 South Korea 2,613,889 1.10 1.09 Spain 3,467,773 1.45 1.45 Sweden 3,119,047 1.31 1.30 Switzerland 6,299,353 2.65 2.63 Thailand 795,699 0.33 0.33 United Kingdom 12,162,943 5.09 5.08 United States of America 115,105,272 48.28 48.10 226,748,689 95.08 94.76
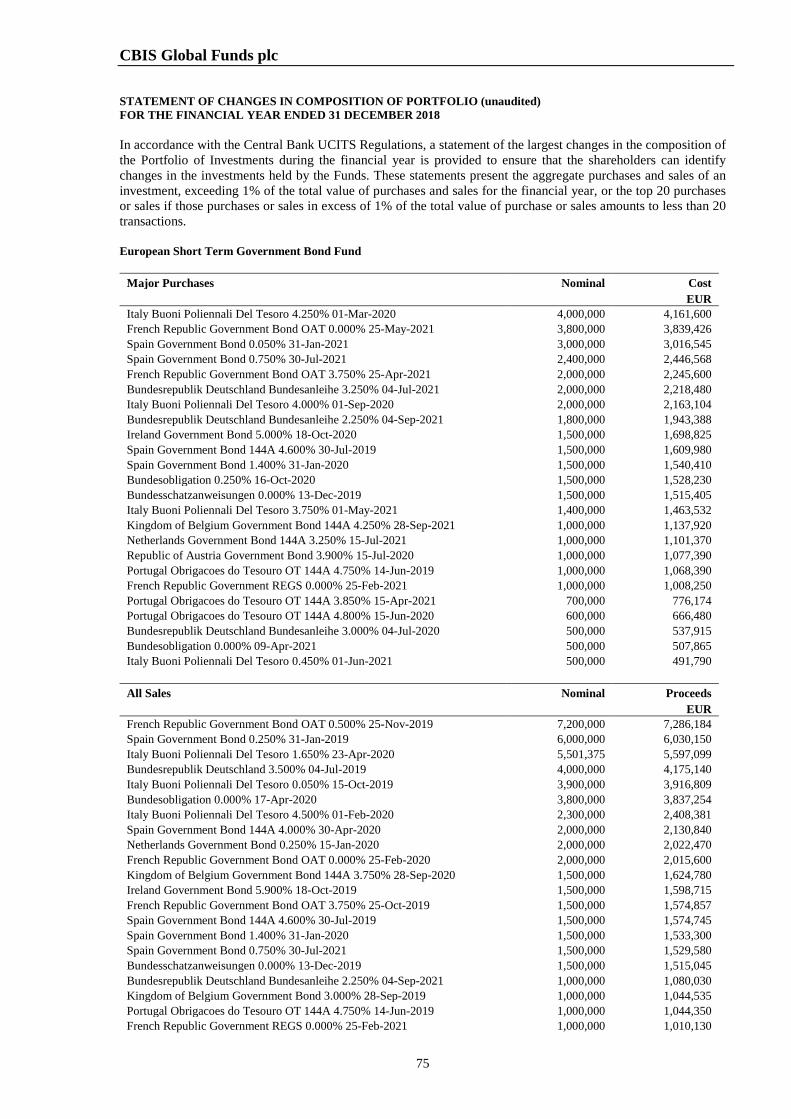
CBIS Global Funds plc
75
STATEMENT OF CHANGES IN COMPOSITION OF PORTFOLIO (unaudited) FOR THE FINANCIAL YEAR ENDED 31 DECEMBER 2018 In accordance with the Central Bank UCITS Regulations, a statement of the largest changes in the composition of the Portfolio of Investments during the financial year is provided to ensure that the shareholders can identify changes in the investments held by the Funds. These statements present the aggregate purchases and sales of an investment, exceeding 1% of the total value of purchases and sales for the financial year, or the top 20 purchases or sales if those purchases or sales in excess of 1% of the total value of purchase or sales amounts to less than 20 transactions. European Short Term Government Bond Fund
Major Purchases Nominal Cost EUR Italy Buoni Poliennali Del Tesoro 4.250% 01-Mar-2020 4,000,000 4,161,600 French Republic Government Bond OAT 0.000% 25-May-2021 3,800,000 3,839,426 Spain Government Bond 0.050% 31-Jan-2021 3,000,000 3,016,545 Spain Government Bond 0.750% 30-Jul-2021 2,400,000 2,446,568 French Republic Government Bond OAT 3.750% 25-Apr-2021 2,000,000 2,245,600 Bundesrepublik Deutschland Bundesanleihe 3.250% 04-Jul-2021 2,000,000 2,218,480 Italy Buoni Poliennali Del Tesoro 4.000% 01-Sep-2020 2,000,000 2,163,104 Bundesrepublik Deutschland Bundesanleihe 2.250% 04-Sep-2021 1,800,000 1,943,388 Ireland Government Bond 5.000% 18-Oct-2020 1,500,000 1,698,825 Spain Government Bond 144A 4.600% 30-Jul-2019 1,500,000 1,609,980 Spain Government Bond 1.400% 31-Jan-2020 1,500,000 1,540,410 Bundesobligation 0.250% 16-Oct-2020 1,500,000 1,528,230 Bundesschatzanweisungen 0.000% 13-Dec-2019 1,500,000 1,515,405 Italy Buoni Poliennali Del Tesoro 3.750% 01-May-2021 1,400,000 1,463,532 Kingdom of Belgium Government Bond 144A 4.250% 28-Sep-2021 1,000,000 1,137,920 Netherlands Government Bond 144A 3.250% 15-Jul-2021 1,000,000 1,101,370 Republic of Austria Government Bond 3.900% 15-Jul-2020 1,000,000 1,077,390 Portugal Obrigacoes do Tesouro OT 144A 4.750% 14-Jun-2019 1,000,000 1,068,390 French Republic Government REGS 0.000% 25-Feb-2021 1,000,000 1,008,250 Portugal Obrigacoes do Tesouro OT 144A 3.850% 15-Apr-2021 700,000 776,174 Portugal Obrigacoes do Tesouro OT 144A 4.800% 15-Jun-2020 600,000 666,480 Bundesrepublik Deutschland Bundesanleihe 3.000% 04-Jul-2020 500,000 537,915 Bundesobligation 0.000% 09-Apr-2021 500,000 507,865 Italy Buoni Poliennali Del Tesoro 0.450% 01-Jun-2021 500,000 491,790
All Sales Nominal Proceeds EUR French Republic Government Bond OAT 0.500% 25-Nov-2019 7,200,000 7,286,184 Spain Government Bond 0.250% 31-Jan-2019 6,000,000 6,030,150 Italy Buoni Poliennali Del Tesoro 1.650% 23-Apr-2020 5,501,375 5,597,099 Bundesrepublik Deutschland 3.500% 04-Jul-2019 4,000,000 4,175,140 Italy Buoni Poliennali Del Tesoro 0.050% 15-Oct-2019 3,900,000 3,916,809 Bundesobligation 0.000% 17-Apr-2020 3,800,000 3,837,254 Italy Buoni Poliennali Del Tesoro 4.500% 01-Feb-2020 2,300,000 2,408,381 Spain Government Bond 144A 4.000% 30-Apr-2020 2,000,000 2,130,840 Netherlands Government Bond 0.250% 15-Jan-2020 2,000,000 2,022,470 French Republic Government Bond OAT 0.000% 25-Feb-2020 2,000,000 2,015,600 Kingdom of Belgium Government Bond 144A 3.750% 28-Sep-2020 1,500,000 1,624,780 Ireland Government Bond 5.900% 18-Oct-2019 1,500,000 1,598,715 French Republic Government Bond OAT 3.750% 25-Oct-2019 1,500,000 1,574,857 Spain Government Bond 144A 4.600% 30-Jul-2019 1,500,000 1,574,745 Spain Government Bond 1.400% 31-Jan-2020 1,500,000 1,533,300 Spain Government Bond 0.750% 30-Jul-2021 1,500,000 1,529,580 Bundesschatzanweisungen 0.000% 13-Dec-2019 1,500,000 1,515,045 Bundesrepublik Deutschland Bundesanleihe 2.250% 04-Sep-2021 1,000,000 1,080,030 Kingdom of Belgium Government Bond 3.000% 28-Sep-2019 1,000,000 1,044,535 Portugal Obrigacoes do Tesouro OT 144A 4.750% 14-Jun-2019 1,000,000 1,044,350 French Republic Government REGS 0.000% 25-Feb-2021 1,000,000 1,010,130
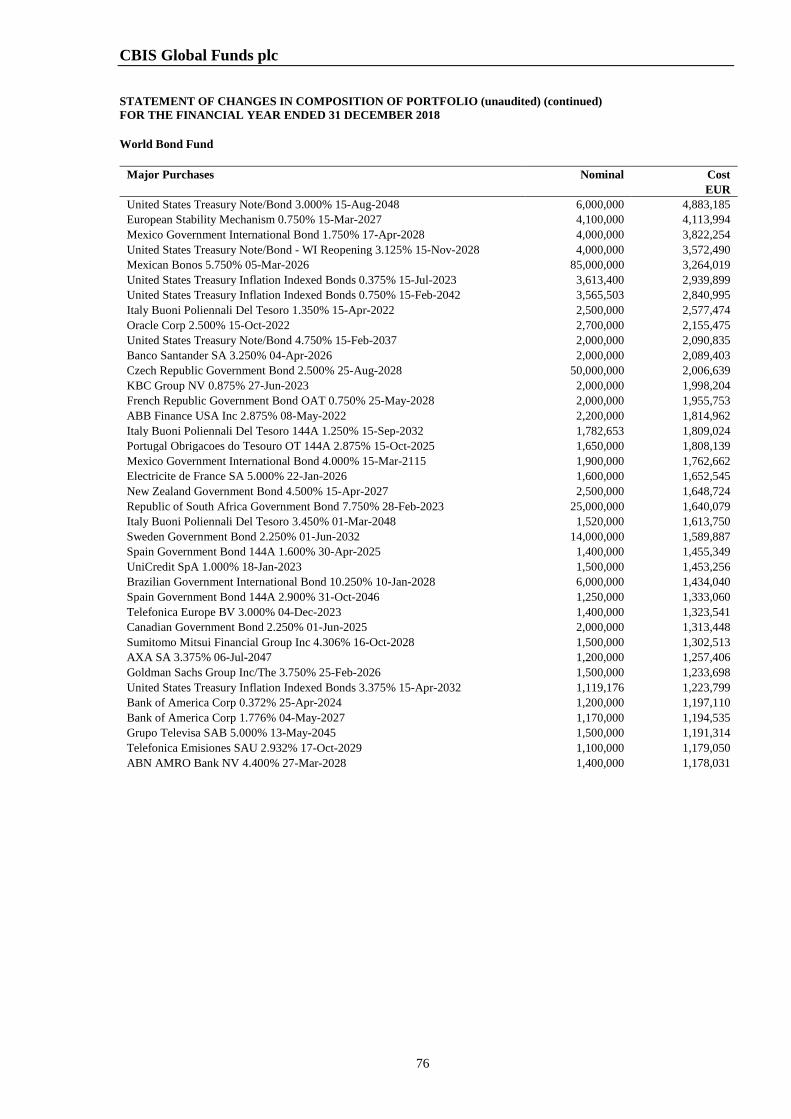
CBIS Global Funds plc
76
STATEMENT OF CHANGES IN COMPOSITION OF PORTFOLIO (unaudited) (continued) FOR THE FINANCIAL YEAR ENDED 31 DECEMBER 2018 World Bond Fund
Major Purchases Nominal Cost EUR United States Treasury Note/Bond 3.000% 15-Aug-2048 6,000,000 4,883,185 European Stability Mechanism 0.750% 15-Mar-2027 4,100,000 4,113,994 Mexico Government International Bond 1.750% 17-Apr-2028 4,000,000 3,822,254 United States Treasury Note/Bond - WI Reopening 3.125% 15-Nov-2028 4,000,000 3,572,490 Mexican Bonos 5.750% 05-Mar-2026 85,000,000 3,264,019 United States Treasury Inflation Indexed Bonds 0.375% 15-Jul-2023 3,613,400 2,939,899 United States Treasury Inflation Indexed Bonds 0.750% 15-Feb-2042 3,565,503 2,840,995 Italy Buoni Poliennali Del Tesoro 1.350% 15-Apr-2022 2,500,000 2,577,474 Oracle Corp 2.500% 15-Oct-2022 2,700,000 2,155,475 United States Treasury Note/Bond 4.750% 15-Feb-2037 2,000,000 2,090,835 Banco Santander SA 3.250% 04-Apr-2026 2,000,000 2,089,403 Czech Republic Government Bond 2.500% 25-Aug-2028 50,000,000 2,006,639 KBC Group NV 0.875% 27-Jun-2023 2,000,000 1,998,204 French Republic Government Bond OAT 0.750% 25-May-2028 2,000,000 1,955,753 ABB Finance USA Inc 2.875% 08-May-2022 2,200,000 1,814,962 Italy Buoni Poliennali Del Tesoro 144A 1.250% 15-Sep-2032 1,782,653 1,809,024 Portugal Obrigacoes do Tesouro OT 144A 2.875% 15-Oct-2025 1,650,000 1,808,139 Mexico Government International Bond 4.000% 15-Mar-2115 1,900,000 1,762,662 Electricite de France SA 5.000% 22-Jan-2026 1,600,000 1,652,545 New Zealand Government Bond 4.500% 15-Apr-2027 2,500,000 1,648,724 Republic of South Africa Government Bond 7.750% 28-Feb-2023 25,000,000 1,640,079 Italy Buoni Poliennali Del Tesoro 3.450% 01-Mar-2048 1,520,000 1,613,750 Sweden Government Bond 2.250% 01-Jun-2032 14,000,000 1,589,887 Spain Government Bond 144A 1.600% 30-Apr-2025 1,400,000 1,455,349 UniCredit SpA 1.000% 18-Jan-2023 1,500,000 1,453,256 Brazilian Government International Bond 10.250% 10-Jan-2028 6,000,000 1,434,040 Spain Government Bond 144A 2.900% 31-Oct-2046 1,250,000 1,333,060 Telefonica Europe BV 3.000% 04-Dec-2023 1,400,000 1,323,541 Canadian Government Bond 2.250% 01-Jun-2025 2,000,000 1,313,448 Sumitomo Mitsui Financial Group Inc 4.306% 16-Oct-2028 1,500,000 1,302,513 AXA SA 3.375% 06-Jul-2047 1,200,000 1,257,406 Goldman Sachs Group Inc/The 3.750% 25-Feb-2026 1,500,000 1,233,698 United States Treasury Inflation Indexed Bonds 3.375% 15-Apr-2032 1,119,176 1,223,799 Bank of America Corp 0.372% 25-Apr-2024 1,200,000 1,197,110 Bank of America Corp 1.776% 04-May-2027 1,170,000 1,194,535 Grupo Televisa SAB 5.000% 13-May-2045 1,500,000 1,191,314 Telefonica Emisiones SAU 2.932% 17-Oct-2029 1,100,000 1,179,050 ABN AMRO Bank NV 4.400% 27-Mar-2028 1,400,000 1,178,031
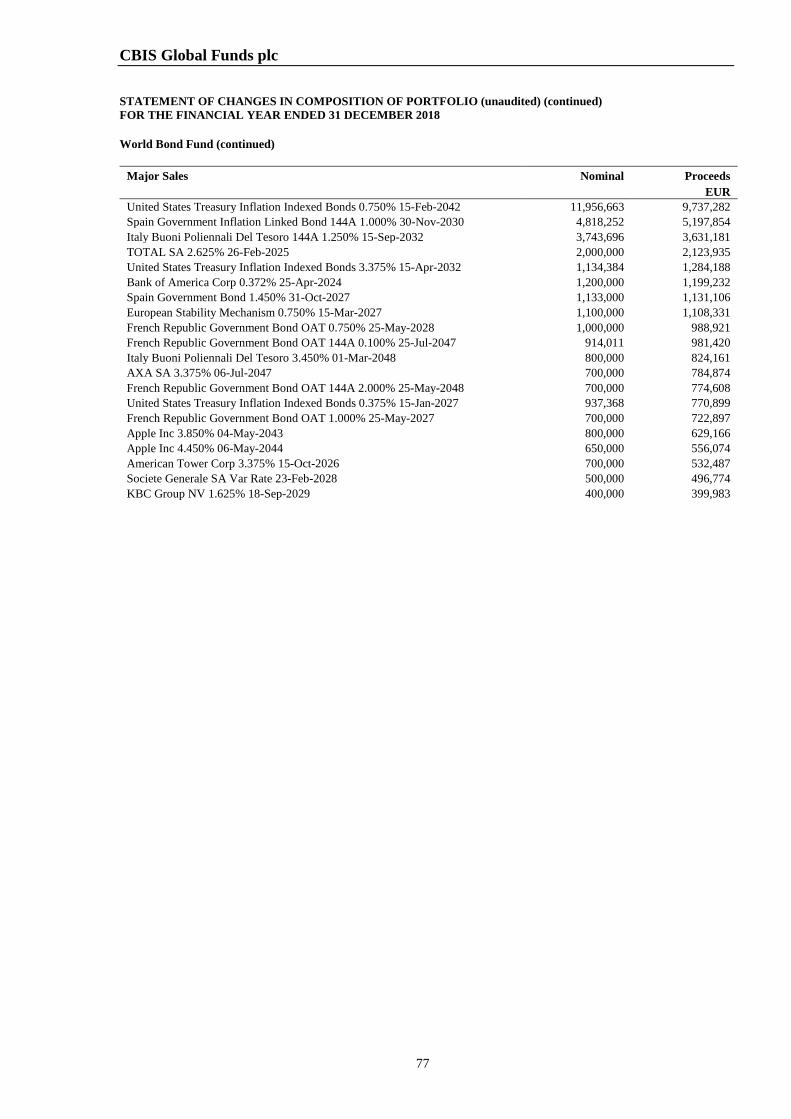
CBIS Global Funds plc
77
STATEMENT OF CHANGES IN COMPOSITION OF PORTFOLIO (unaudited) (continued) FOR THE FINANCIAL YEAR ENDED 31 DECEMBER 2018 World Bond Fund (continued)
Major Sales Nominal Proceeds EUR United States Treasury Inflation Indexed Bonds 0.750% 15-Feb-2042 11,956,663 9,737,282 Spain Government Inflation Linked Bond 144A 1.000% 30-Nov-2030 4,818,252 5,197,854 Italy Buoni Poliennali Del Tesoro 144A 1.250% 15-Sep-2032 3,743,696 3,631,181 TOTAL SA 2.625% 26-Feb-2025 2,000,000 2,123,935 United States Treasury Inflation Indexed Bonds 3.375% 15-Apr-2032 1,134,384 1,284,188 Bank of America Corp 0.372% 25-Apr-2024 1,200,000 1,199,232 Spain Government Bond 1.450% 31-Oct-2027 1,133,000 1,131,106 European Stability Mechanism 0.750% 15-Mar-2027 1,100,000 1,108,331 French Republic Government Bond OAT 0.750% 25-May-2028 1,000,000 988,921 French Republic Government Bond OAT 144A 0.100% 25-Jul-2047 914,011 981,420 Italy Buoni Poliennali Del Tesoro 3.450% 01-Mar-2048 800,000 824,161 AXA SA 3.375% 06-Jul-2047 700,000 784,874 French Republic Government Bond OAT 144A 2.000% 25-May-2048 700,000 774,608 United States Treasury Inflation Indexed Bonds 0.375% 15-Jan-2027 937,368 770,899 French Republic Government Bond OAT 1.000% 25-May-2027 700,000 722,897 Apple Inc 3.850% 04-May-2043 800,000 629,166 Apple Inc 4.450% 06-May-2044 650,000 556,074 American Tower Corp 3.375% 15-Oct-2026 700,000 532,487 Societe Generale SA Var Rate 23-Feb-2028 500,000 496,774 KBC Group NV 1.625% 18-Sep-2029 400,000 399,983
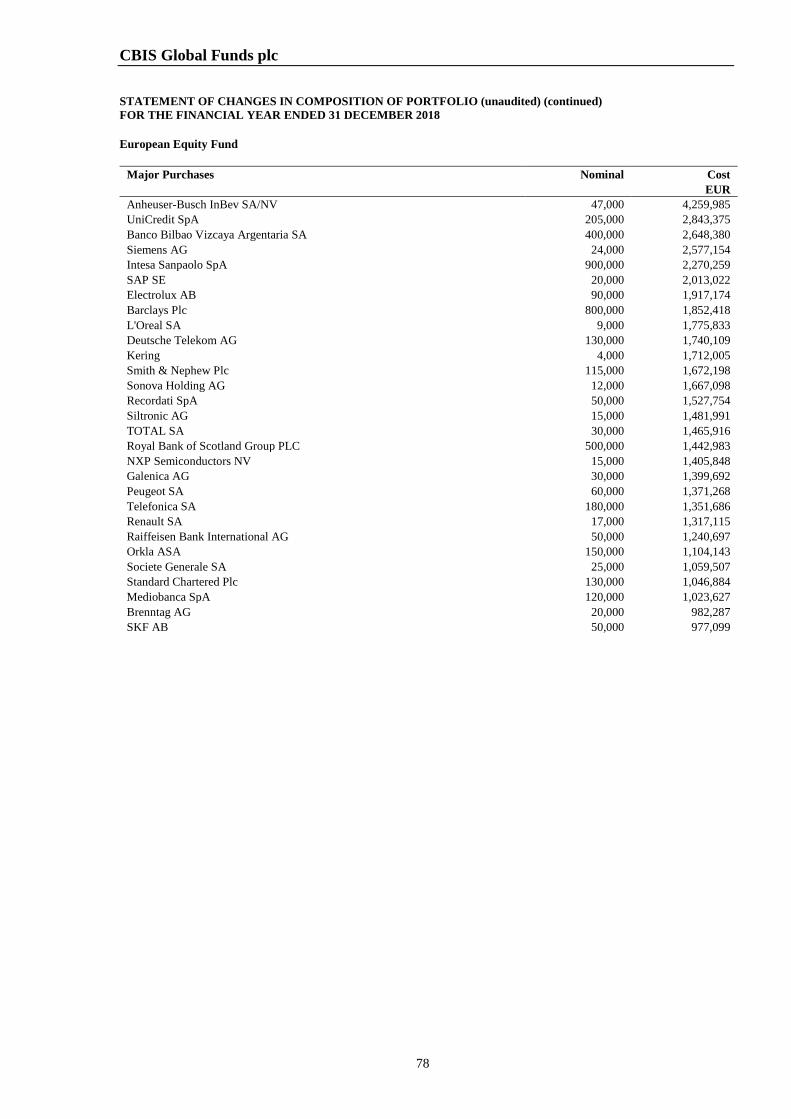
CBIS Global Funds plc
78
STATEMENT OF CHANGES IN COMPOSITION OF PORTFOLIO (unaudited) (continued) FOR THE FINANCIAL YEAR ENDED 31 DECEMBER 2018 European Equity Fund
Major Purchases Nominal Cost EUR Anheuser-Busch InBev SA/NV 47,000 4,259,985 UniCredit SpA 205,000 2,843,375 Banco Bilbao Vizcaya Argentaria SA 400,000 2,648,380 Siemens AG 24,000 2,577,154 Intesa Sanpaolo SpA 900,000 2,270,259 SAP SE 20,000 2,013,022 Electrolux AB 90,000 1,917,174 Barclays Plc 800,000 1,852,418 L'Oreal SA 9,000 1,775,833 Deutsche Telekom AG 130,000 1,740,109 Kering 4,000 1,712,005 Smith & Nephew Plc 115,000 1,672,198 Sonova Holding AG 12,000 1,667,098 Recordati SpA 50,000 1,527,754 Siltronic AG 15,000 1,481,991 TOTAL SA 30,000 1,465,916 Royal Bank of Scotland Group PLC 500,000 1,442,983 NXP Semiconductors NV 15,000 1,405,848 Galenica AG 30,000 1,399,692 Peugeot SA 60,000 1,371,268 Telefonica SA 180,000 1,351,686 Renault SA 17,000 1,317,115 Raiffeisen Bank International AG 50,000 1,240,697 Orkla ASA 150,000 1,104,143 Societe Generale SA 25,000 1,059,507 Standard Chartered Plc 130,000 1,046,884 Mediobanca SpA 120,000 1,023,627 Brenntag AG 20,000 982,287 SKF AB 50,000 977,099
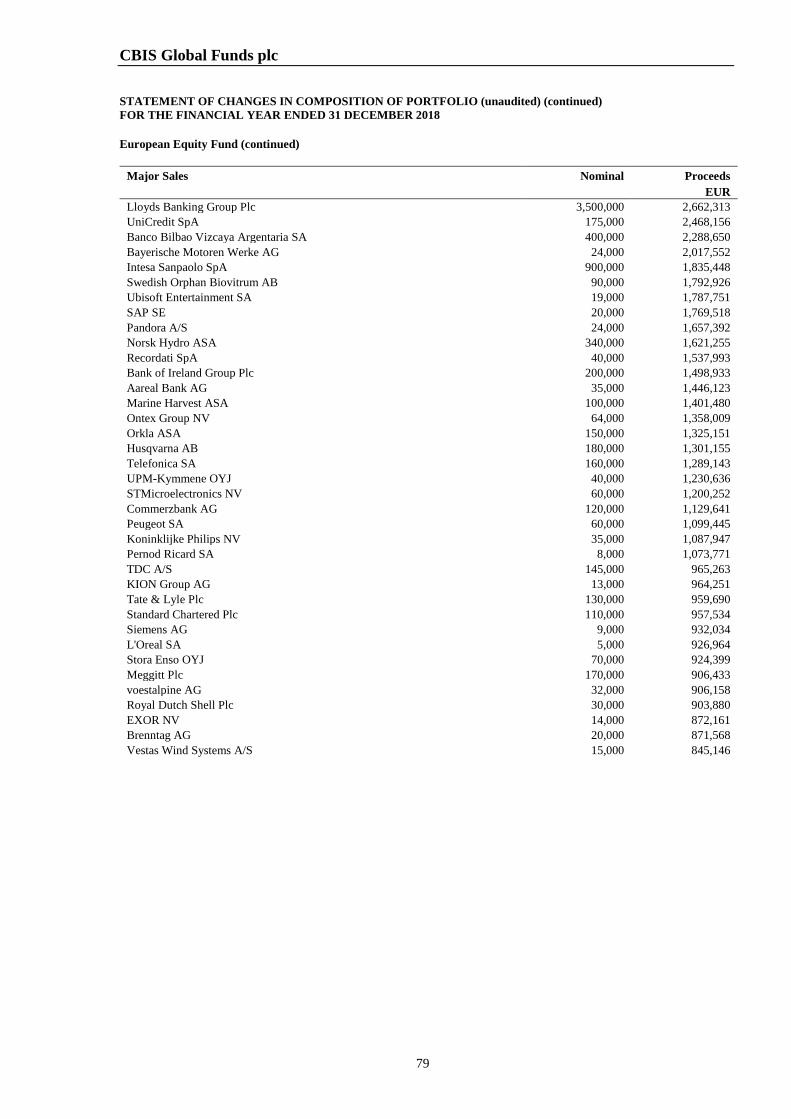
CBIS Global Funds plc
79
STATEMENT OF CHANGES IN COMPOSITION OF PORTFOLIO (unaudited) (continued) FOR THE FINANCIAL YEAR ENDED 31 DECEMBER 2018 European Equity Fund (continued)
Major Sales Nominal Proceeds EUR Lloyds Banking Group Plc 3,500,000 2,662,313 UniCredit SpA 175,000 2,468,156 Banco Bilbao Vizcaya Argentaria SA 400,000 2,288,650 Bayerische Motoren Werke AG 24,000 2,017,552 Intesa Sanpaolo SpA 900,000 1,835,448 Swedish Orphan Biovitrum AB 90,000 1,792,926 Ubisoft Entertainment SA 19,000 1,787,751 SAP SE 20,000 1,769,518 Pandora A/S 24,000 1,657,392 Norsk Hydro ASA 340,000 1,621,255 Recordati SpA 40,000 1,537,993 Bank of Ireland Group Plc 200,000 1,498,933 Aareal Bank AG 35,000 1,446,123 Marine Harvest ASA 100,000 1,401,480 Ontex Group NV 64,000 1,358,009 Orkla ASA 150,000 1,325,151 Husqvarna AB 180,000 1,301,155 Telefonica SA 160,000 1,289,143 UPM-Kymmene OYJ 40,000 1,230,636 STMicroelectronics NV 60,000 1,200,252 Commerzbank AG 120,000 1,129,641 Peugeot SA 60,000 1,099,445 Koninklijke Philips NV 35,000 1,087,947 Pernod Ricard SA 8,000 1,073,771 TDC A/S 145,000 965,263 KION Group AG 13,000 964,251 Tate & Lyle Plc 130,000 959,690 Standard Chartered Plc 110,000 957,534 Siemens AG 9,000 932,034 L'Oreal SA 5,000 926,964 Stora Enso OYJ 70,000 924,399 Meggitt Plc 170,000 906,433 voestalpine AG 32,000 906,158 Royal Dutch Shell Plc 30,000 903,880 EXOR NV 14,000 872,161 Brenntag AG 20,000 871,568 Vestas Wind Systems A/S 15,000 845,146
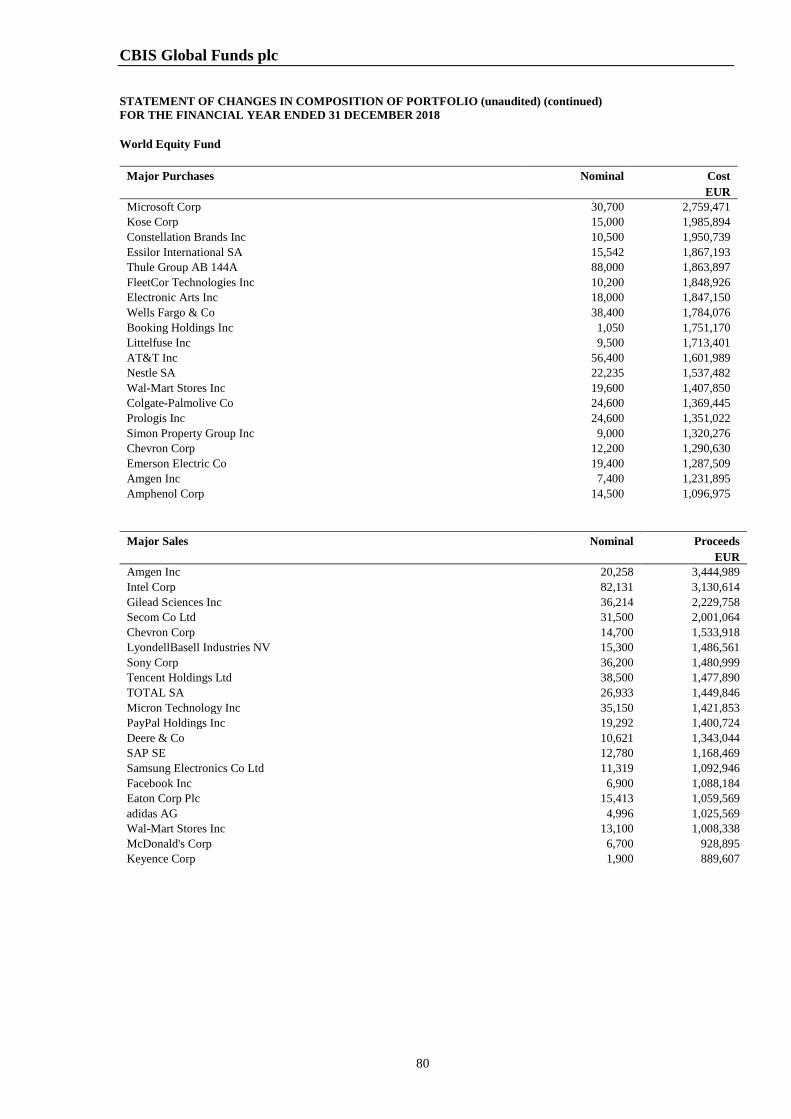
CBIS Global Funds plc
80
STATEMENT OF CHANGES IN COMPOSITION OF PORTFOLIO (unaudited) (continued) FOR THE FINANCIAL YEAR ENDED 31 DECEMBER 2018 World Equity Fund
Major Purchases Nominal Cost EUR Microsoft Corp 30,700 2,759,471 Kose Corp 15,000 1,985,894 Constellation Brands Inc 10,500 1,950,739 Essilor International SA 15,542 1,867,193 Thule Group AB 144A 88,000 1,863,897 FleetCor Technologies Inc 10,200 1,848,926 Electronic Arts Inc 18,000 1,847,150 Wells Fargo & Co 38,400 1,784,076 Booking Holdings Inc 1,050 1,751,170 Littelfuse Inc 9,500 1,713,401 AT&T Inc 56,400 1,601,989 Nestle SA 22,235 1,537,482 Wal-Mart Stores Inc 19,600 1,407,850 Colgate-Palmolive Co 24,600 1,369,445 Prologis Inc 24,600 1,351,022 Simon Property Group Inc 9,000 1,320,276 Chevron Corp 12,200 1,290,630 Emerson Electric Co 19,400 1,287,509 Amgen Inc 7,400 1,231,895 Amphenol Corp 14,500 1,096,975
Major Sales Nominal Proceeds EUR Amgen Inc 20,258 3,444,989 Intel Corp 82,131 3,130,614 Gilead Sciences Inc 36,214 2,229,758 Secom Co Ltd 31,500 2,001,064 Chevron Corp 14,700 1,533,918 LyondellBasell Industries NV 15,300 1,486,561 Sony Corp 36,200 1,480,999 Tencent Holdings Ltd 38,500 1,477,890 TOTAL SA 26,933 1,449,846 Micron Technology Inc 35,150 1,421,853 PayPal Holdings Inc 19,292 1,400,724 Deere & Co 10,621 1,343,044 SAP SE 12,780 1,168,469 Samsung Electronics Co Ltd 11,319 1,092,946 Facebook Inc 6,900 1,088,184 Eaton Corp Plc 15,413 1,059,569 adidas AG 4,996 1,025,569 Wal-Mart Stores Inc 13,100 1,008,338 McDonald's Corp 6,700 928,895 Keyence Corp 1,900 889,607
CBIS Global Funds plc
81
Appendix 1 - UCITS V Remuneration Disclosure (unaudited) In line with the requirements of the UCITS Regulations, the Company has adopted a remuneration policy which is consistent with the principles outlined in the European Securities and Markets Authority guidelines on sound remuneration policies under the UCITS Directive (the “Remuneration Guidelines”). The remuneration policy is reviewed annually and is appropriate to the Company’s size, internal organisation and the nature, scope and complexity of its activities. The Company’s remuneration policy applies to certain identified staff whose professional activities have a material impact on the risk profile of the Company. As at 31 December 2018, the Company did not have any employees and the Company’s remuneration policy applies only to members of the Company’s management body (i.e. the Directors). The Independent Directors are not affiliated with the Investment Manager and receive a fixed annual fee which is in line with the fees paid by other Irish funds and compensates these Directors for their duties, expertise and responsibilities. Directors that are employees of the Investment Manager (or an affiliate) and Directors who are not Independent Directors are not paid any fees for their services as Directors. The Company also pays to KB Associates a fixed fee for the provision of the designated persons to the Company, which was in the aggregate EUR 39,000 for the financial year ended 31 December 2018. For the financial year ended 31 December 2018, only the Independent Directors received a fixed fee from the Company in their role as Directors, which was in the aggregate EUR 45,502. None of the Directors are entitled to receive any variable remuneration from the Company. The remuneration policy was amended to take account of the Remuneration Guidelines in October 2016, and in particular the requirements in relation to delegated management functions, but no other material changes have been made to the remuneration policy since its adoption. The Company has delegated investment management to the Investment Manager. The Company has put in place contractual arrangements with the Investment Manager to receive and disclose information regarding the remuneration of the Investment Manager’s identified staff in accordance with the Remuneration Guidelines. No remuneration has been paid to staff of the Investment Manager by the Company. Instead, the Company pays a management fee to the Investment Manager as disclosed in Note 5 of the financial statements. The Investment Manager pays remuneration to its staff in accordance with the policies, procedures and processes applicable to it. Further information on the Company’s remuneration policy is available online on the Investment Manager’s website at http://cbisonline.com/eu/wp-content/uploads/sites/3/2016/07/CBIS-Global-Funds-plc-Remuneration-Policy.pdf.