Embed Size (px)
Citation preview
CBIS Global Funds plc an umbrella fund with segregated liability between sub-funds
Interim Report and Unaudited Condensed Financial Statements
For the financial period ended 30 June 2019
CBIS Global Funds plc
1
CONTENTS PAGE
DIRECTORS AND OTHER INFORMATION………………………………………………………... 2
BACKGROUND TO THE COMPANY………………………………………………………………. 4
INVESTMENT MANAGER’S REPORT……………………………………………………………... 6
HALF YEARLY MANAGEMENT REPORT……………………………….……….……………….. 11
STATEMENT OF FINANCIAL POSITION………………………………………………………….. 12
STATEMENT OF COMPREHENSIVE INCOME…………………………………………………… 14 STATEMENT OF CHANGES IN NET ASSETS ATTRIBUTABLE TO HOLDERS OF
REDEEMABLE PARTICIPATING SHARES………………………………………………………... 16
NOTES TO THE FINANCIAL STATEMENTS……………………………………………………… 18
PORTFOLIO OF INVESTMENTS……………………………………………………………………. 27
SUPPLEMENTARY INFORMATION ON THE PORTFOLIO OF INVESTMENTS …….….….…. 50
STATEMENT OF CHANGES IN COMPOSITION OF PORTFOLIO …………...…………………. 52
CBIS Global Funds plc
2
DIRECTORS AND OTHER INFORMATION
Board of Directors
Eimear Cowhey (Irish)*
Denise Kinsella (Irish)*
Jeffrey McCroy (American)†
David L. Skelding (American)
Registered Office of the Company
One Dockland Central, Guild Street
IFSC, Dublin 1
Ireland
Registered Number: 456305
Administrator, Registrar and Transfer Agent
BNY Mellon Fund Services (Ireland) Designated Activity
Company
One Dockland Central, Guild Street
IFSC, Dublin 1
Ireland
Depositary
BNY Mellon Trust Company (Ireland) Limited
One Dockland Central, Guild Street
IFSC, Dublin 1
Ireland
Legal Advisers in Ireland
Arthur Cox
10 Earlsfort Terrace
Dublin 2
Ireland
Company Secretary
Bradwell Limited
10 Earlsfort Terrace
Dublin 2
Ireland
Independent Auditors
PricewaterhouseCoopers
One Spencer Dock
North Wall Quay
Dublin 1
Ireland
Investment Manager and Distributor
Christian Brothers Investment Services, Inc.
777 Third Avenue, 29th Floor
New York, NY 10017-1401
USA
Global Distributor
AllFunds Bank S.A.
Estafeta 6, La Moraleja
Complejo Plaza de la Fuente
Alcobendas, Madrid
Spain
AllFunds Bank International S.A.
Le Dome, Espace Petrusse
Building C2
Avenue Charles de Gaulle
L-1653, Luxembourg
Italian Sub-Distributor and Paying Agent
Banca Popolare di Sondrio
Piazza Garibaldi, 16
23100 Sondrio
Italy
Belgian Sub-Distributor and Paying Agent
Bank Degroof S.A./N.V.
44 Rue de l’Industrie
B-1040 Brussels
Belgium
French Centralising Correspondent
Caceis Bank France
1/3 Place Valhubert
75013 Paris
France
Governance Support Provider
KB Associates
5 George’s Dock
IFSC, Dublin 1
Ireland
∗ Independent Directors. † Chairman of the Board of Directors
CBIS Global Funds plc
3
DIRECTORS AND OTHER INFORMATION (continued)
Sub-Investment Managers
European Short Term Government Bond Fund
ARCA Fondi SGR S.p.A.
Via Disciplini 3
20123 Milano
Italy
Degroof Petercam Asset Management
Rue Guimard 18
1040 Brussels
Belgium
World Bond Fund
Degroof Petercam Asset Management
Rue Guimard 18
1040 Brussels
Belgium
European Equity Fund
Degroof Petercam Asset Management
Rue Guimard 18
1040 Brussels
Belgium
ARCA Fondi SGR S.p.A.
Via Disciplini 3
20123 Milano
Italy
U.S. Core Equity Index Fund (not yet launched)
RhumbLine Advisers
265 Franklin Street
21st Floor
Boston, Massachusetts 02110
USA
World Equity Fund Scott Investment Partners LLP
The Old Rectory
17 Thameside
Henley-on-Thames
Oxon. RG9 1BH
England
RhumbLine Advisers
265 Franklin Street
21st Floor
Boston, Massachusetts 02110
USA
Los Angeles Capital Management and Equity Research Inc.
11150 Santa Monica Boulevard, Suite 200
Los Angeles, California 90025
USA
CBIS Global Funds plc
4
BACKGROUND TO THE COMPANY
The following information is derived from, and should be read in conjunction with, the full text and definitions
section of the Company’s prospectus (the “Prospectus”).
Structure
CBIS Global Funds plc (the “Company”) is an umbrella fund with segregated liability between sub-funds
established as an investment company with variable capital incorporated with limited liability in Ireland on 18
April 2008. The Company is regulated by the Central Bank of Ireland (the “Central Bank”) pursuant to the
European Communities (Undertakings for Collective Investment in Transferable Securities) Regulations, 2011,
as amended (the “UCITS Regulations”) and the Central Bank (Supervision and Enforcement) Act 2013
(Section 48(1)) (Undertakings for Collective Investment in Transferable Securities) (Amendment) Regulations
2019 (the “Central Bank UCITS Regulations”) and was authorised by the Central Bank on 16 June 2008. The
Company currently has the following sub-funds (each a “Fund” and collectively the “Funds”) as follows:
Date of approval
Fund Name by Central Bank Launch Date
European Short Term Government Bond Fund 17 April 2009 5 May 2009
European Equity Fund 16 June 2008 9 July 2010
World Bond Fund 16 June 2008 9 July 2010
World Equity Fund 19 June 2014 20 February 2015
U.S. Core Equity Index Fund 19 June 2014 Not yet launched
A Fund may consist of one or more classes of shares. A separate pool of assets will not be maintained for each
class within a Fund. Further classes of shares may be issued on advance notification to, and in accordance with
the requirements of, the Central Bank.
Investment objectives
Each Fund aims to achieve its investment objective, as set out below, while spreading investment risks through
investment in transferable securities and liquid financial assets in accordance with the UCITS Regulations.
The allocation of the assets of a Fund between the sub-investment managers of that Fund is at the sole
discretion of Christian Brothers Investment Services, Inc. (the “Investment Manager”) and the Investment
Manager may from time to time, at its discretion, determine not to allocate any of the assets of the Fund to a
sub-investment manager.
In pursuing its investment objectives, each Fund shall adhere to the principles of ethical and socially
responsible investing, as described in the Prospectus.
European Short Term Government Bond Fund
The investment objective of the European Short Term Government Bond Fund is to provide current income,
consistent with preservation of capital through investment primarily in a diversified portfolio of high quality,
Euro-denominated deposits and short term fixed-income securities, provided that not more than 50% of the net
asset value of the Fund may be invested in Euro-denominated deposits.
The sub-investment managers of the Fund are ARCA Fondi SGR S.p.A. and Degroof Petercam Asset
Management. Since the launch of the Fund, the Investment Manager has allocated investment management of
all of the assets of the Fund to ARCA Fondi SGR S.p.A. The functional currency of the Fund is Euro.
CBIS Global Funds plc
5
BACKGROUND TO THE COMPANY (continued)
Investment objectives (continued)
World Bond Fund
The investment objective of the World Bond Fund is to seek to achieve sustainable income and modest capital
appreciation through investment primarily in investment grade debt securities which may be sovereign,
supranational, corporate, mortgage or securitised debt securities.
The sub-investment manager of the Fund is Degroof Petercam Asset Management. The functional currency of
the Fund is Euro.
European Equity Fund
The investment objective of the European Equity Fund is to seek to achieve capital appreciation through
investment generally in the equity securities of European issuers with a market capitalisation greater than EUR
65 million. The investments of the Fund will be diversified with strict controls on the level of investment in any
particular industry to maximise the impact of individual stock selection.
The sub-investment managers of the Fund are ARCA Fondi SGR S.p.A. and Degroof Petercam Asset
Management SA. Since the launch of the Fund, the Investment Manager has allocated investment management
of all of the assets of the Fund to Degroof Petercam Asset Management SA. The functional currency of the
Fund is Euro.
World Equity Fund
The investment objective of the World Equity Fund is to seek to achieve capital appreciation and outperform its
primary benchmark index, the MSCI All Country World Index, by combining a number of different yet
complementary investment approaches employed by the sub-investment managers to invest in equity securities
of medium to large capitalisation issuers on a worldwide basis while minimising downside risk by focusing on
companies that exhibit a high internal rate of return and avoiding speculative investment. Generally,
investments will be in companies with a market capitalisation of greater than EUR 0.35 billion and the Fund
will be invested primarily in major developed markets.
The sub-investment managers of the Fund are Scott Investment Partners LLP, RhumbLine Advisers and Los
Angeles Capital Management and Equity Research Inc. Since the launch of the Fund, the Investment Manager
has allocated investment management of all of the assets of the Fund between Scott Investment Partners LLP
and Los Angeles Capital Management and Equity Research Inc. The functional currency of the Fund is Euro.
U.S. Core Equity Index Fund (not yet launched)
The investment objective of the U.S. Core Equity Index Fund is to seek to replicate the price and yield
performance of the S&P 500 Index, an index which emphasises large-capitalisation companies.
The sub-investment manager of the Fund is RhumbLine Advisers. The functional currency of the Fund is US
Dollar.

CBIS Global Funds plc
6
INVESTMENT MANAGER’S REPORT
European Short Term Government Bond Fund (the “Fund”)
Sub-Investment Managers: ARCA Fondi SGR S.p.A & Degroof Petercam Asset Management
6 Month 2019 Review
The Fund returned 0.36%, net of fees and expenses versus the 80% Bloomberg Barclays Euro Aggregate
Treasury Bond 1-3 Year Index/20% Bloomberg Barclays Euro Aggregate Corporate 1-3 Year Index return of
0.58%.
Performance
The Fund’s shorter relative duration (1.91 vs. 1.96) was the main detractor as interest rates declined during the
trailing six months. Additionally, the impact of sector allocation was negative due primarily to the Fund’s
exposure to financials and underperformance among French and German bonds. Although the exposure to
Italian bonds was positive, results could not offset the negative impact from other areas of the fund.
Portfolio Positioning and Outlook
In June, the Euro-coin indicator declined again to 0.14 from 0.20 at the end of March, reaching the lowest level
recorded since December 2014. The indicator reflects the decline in business confidence and weakening
international trade across Europe. At the end of the period, the indicator was held back by the slowdown in
international trade, the weak industrial cycle and related worsening in business confidence, which remains at
levels that are still low, especially in manufacturing. Furthermore, growth expectation for 2019 in the Euro area
have been revised downward at +1.1% from 1.3% at the end of March.
The Fund continues to hold significant exposure to Italian, French and German bonds, with Italian exposure
being the largest at 29%. Italy’s overweight is attributed to the fund’s exposure to corporate securities and the
positive yield available in 2-year Italian BTPs.
As short-term yields continue to decline across most European markets, the Sub-Investment Manager remains
cautious on portfolio positioning, particularly in adding to exposure in some of the smaller European markets.
Christian Brothers Investment Services, Inc.
July 2019
CBIS Global Funds plc
7
INVESTMENT MANAGER’S REPORT (continued)
World Bond Fund (the “Fund”)
Sub-Investment Manager: Degroof Petercam Asset Management
6 Month 2019 review
Over the first six months of 2019, the Fund returned 8.69% net of fees, 2.72% ahead of the Bloomberg Barclays
Global Aggregate (EUR) benchmark's (the "Benchmark index") return of 5.97%. The 2019 performance
follows the underperformance in the last three months of 2018 when the Fund’s net of fee return was 0.72% and
trailed the Benchmark index by more than 200 basis points.
Outperformance for the first half of 2019 was driven by duration positioning, sector allocation and security
selection. Yield curve positioning was relatively neutral to the overall Benchmark index. Currently at 6.3 years,
the Fund’s duration remains shorter than the Benchmark index (~7.1 years), but the gap tightened a bit in recent
months. Overweight positions in US Treasuries with durations ranging from 8 to 19 years were significant
contributors, as were long duration government obligations of Spain and shorter term issues of Mexico and
South Africa. Among Corporates, the Sub-Investment Manager continues adding value with financial
institutions bonds; the Fund has nearly 25% of its holdings in such companies compared to the index weight of
roughly 7%. Positive security selection was evident in Treasuries, Agencies, Industrials, and Utilities.
Portfolio Positioning and Outlook
The Fund has 130 securities as of June 30 2019. The Sub-Investment Manager manages a neutral exposure
level across rate, credit and foreign currency risk factors with a monthly VaR consumption of 2.25%. The
modified duration of the Fund sits modestly below 7.0%. This is the result of conviction curve positioning
across specific government/credit securities. The Sub-Investment Manager sees relative value in Spanish and
Portuguese government bonds against 10-year German Bunds.
They remain evenly distributed on rate exposure across the US Treasury curve (25% of AUM) as uncertainty
persists on the future yield curve sequences we will encounter (bull or bear flattening/steepening or parallel
shifts).
In credit, they look to combine low risk with value. Value selection in subordinated financial & non-financial
centers around 2023 up to 2026 calls. Low risk selection captures long end of bank curves. USD exposure is at
41% of AUM. Their conviction USD allocation stems from a secular view that the world turned the corner of
globalization and deregulation over the Great Financial Crisis 10 years ago and securing USD funding in this
environment will keep USD appreciation trend intact.
Mexico and South Africa remain the top picks on the back of credible monetary policy and promising recovery
plans for state owned utility companies. Over the first half of 2019, low yielding emerging markets (“EM”)
debt led performance rankings among emerging economies; they expect the demand for yield to render support
to the higher yielding EM countries over the second half of 2019 and 2020.
Christian Brothers Investment Services, Inc.
July 2019
CBIS Global Funds plc
8
INVESTMENT MANAGER’S REPORT (continued)
European Equity Fund (the “Fund”)
Sub-Investment Managers: ARCA Fondi SGR S.p.A & Degroof Petercam Asset Management
6 Month 2019 Review
During the first half of 2019, the Fund returned 14.46% net of fees, 244 basis points (bps) behind the MSCI
Europe Index (the “benchmark”) return of 16.90%.
Performance
Before management fees, the Fund’s return was 15.32% in the first six months of 2019. For the period, the
strongest returns were in the Information Technology and Utilities sectors, averaging 35.5% and 19.9%,
respectively. Conversely, holdings in Communication Services and Real Estate were the bottom performers
with average returns of -0.73% and 5.30%, respectively, for the first half of 2019.
Although sector allocations are managed to be nearly identical to those of the benchmark and relative
performance is driven exclusively by stock selection within the individual sectors, a minimal average allocation
to cash detracted in a strong equity market environment. The Sub-Investment Manager had the best results
within Information Technology, which, while only a 6% allocation in terms of the Fund’s market value, had the
highest positive contribution to relative returns with +41 basis points. The Information Technology stocks in
the portfolio outperformed the average 26.3% return gain in the benchmark by over 900 basis points during the
period. Other sectors with a positive impact on relative performance were holdings in Financials and Utilities.
Unfortunately, the negative stock selection impact in the other sectors more than offset the positive
contributions from those three sectors. The stocks in some of the more significant sectors in the portfolio –
Consumer Discretionary (-60 bps from relative returns), Industrials (-53 bps), Health Care (-27 bps), and
Consumer Staples (-29 bps) – were responsible for all of the underperformance in the first half of the year.
Digging a little deeper into results, the Sub-Investment Manager investment philosophy, which resulted in a
portfolio with distinct biases to small cap and value, was a significant reason for relative performance results. In
the first half of the year, the weakest performing segment of the market by capitalization was the smallest
quintile, which was at an overweight in the Fund (average weight of 23.6% for the Fund versus 4.8% for the
index). This large overweight resulted in more than half of the underperformance for the period. On top of that,
the Fund was underweight the largest quintile of market capitalization, which was also the best performing
segment (33.2% for the Fund versus 60.4% for the index), detracting over 20 bps from relative performance.
Using P/E as a proxy for the value factor, the Fund’s underweight to higher P/E stocks and overweight to low
P/E stocks also accounted for much of the relative underperformance in the first half of the year. The same
results were found when using P/B as the primary value factor. Given the Fund’s style and size biases, the
underperformance was not a surprise in this period.
Portfolio Positioning and Outlook
At the end of June 2019, the Fund held 135 securities, encompassing large, mid and small cap stocks. The
weighted average market cap of the portfolio about 50% of the benchmark. Historically, the Sub-Investment
Manager has added significant excess return through its small and mid-cap holdings and we can expect a
continued bias to smaller cap names in the Fund. The overall price-earnings and price-to-book ratios for the
Fund are also lower than the benchmark, indicating a value tilt, which is consistent with the Sub-Investment
Manager investment approach. Sector weights are nearly identical to the benchmark by design. The Sub-
Investment Manager targets excess return through a combination of quantitative analytical models and
fundamental research to select superior stocks within the individual sectors.
Nearly 30% of the holdings measured by market cap are in French domiciled companies; the index has 18.1%.
At 17.7%, the Fund’s investments in UK companies is underweight the index by 888 basis points. The
allocation to Italy is more than double its benchmark weight and the Germany position is underweight by about
500 basis points. The portfolio has an active share of 77.4%.
Christian Brothers Investment Services, Inc.
July 2019
CBIS Global Funds plc
9
INVESTMENT MANAGER’S REPORT (continued)
World Equity Fund (the “Fund”)
Sub-Investment Managers: Scott Investment Partners LLP, RhumbLine Advisers & Los Angeles Capital
Management and Equity Research Inc.
6 Month 2019 review
Over the first six months of 2019, the Fund returned 16.63% net of fees, 0.41% behind the MSCI All Country
World Index (ACWI) benchmark (the “Benchmark”)* return of 17.04%. Before management fees, the Fund’s
return was slightly higher than the benchmark for the first six months of the year. Both Sub-Investment
Managers, Scott Investment Partners LLP (“Scott”) & Los Angeles Capital Management and Equity Research
Inc. (“LA Capital”) performed similarly during the period with Scott registering a return of 17.7% (before fees)
and LA Capital 17.0%. The 2019 performance follows a sharp downturn in valuation during the last three
months of 2018 when the Fund’s net of fee return was -11.2% and brought the full year 2018 return down to -
3.8%
The Fund has some significant differences in sector allocations relative to the Benchmark; for example, with
8.5% of its assets invested in financial stocks, the Fund’s weight in that sector is roughly half that of the index.
Conversely, the Fund is nearly 6% overweight in its allocation to the Consumer Discretionary sector. Those
differences in sector weights did not have a meaningful impact on relative performance in the first half of 2019
as most sectors showed average valuation gains within close proximity to the broad market return of 17%. In
aggregate, the Fund shows a loss of 36 basis points (bps) in return relative to the Benchmark from sector
allocation, but all of that and more is explained by the 67 bps lost due to holding transactional cash in a strongly
upward moving market so far in 2019.
The specific stock selection results within sectors was also close to the index in most cases. The one positive
that stands out was 83 bps gained within the health care sector. The Fund’s Health Care holdings showed
returns averaging 18.5% for the six month period while the comparable number in the total index was 10.2%.
While the underweight to relatively weak performing Pharmaceutical companies was beneficial, the excess
return generated there was only 20 bps. Positive stock selection results of similar magnitude were generated in
Biotech and Health Care technology industries, as well as in Equipment and Supply company holdings.
For the trailing 12 month period, the Fund is 50 bps behind the Benchmark at 30 June 2019 with a return of
8.5%. Since inception (4+ years), the Fund has matched the Benchmark before management fees trails the
index net of fees.
Portfolio Positioning and Outlook
The Fund has 451 securities, the vast majority held exclusively by LA Capital utilizing a quantitative risk
controlled investment strategy. The high conviction portfolio managed by Scott continues to target 45 to 55
names. Scott currently believes, as they have since the Fund’s inception, that banks and most financial stocks
around the globe are fully or over-valued; thus, they have zero holdings in Financials. The allocation within the
Benchmark is currently 17%. They maintain significant overweights to Energy, Consumer Discretionary and
Health Care – consistent with the philosophy that global economic growth and wealth creation in the long term
will be driven by these groupings of industries and companies.
55.6% of the Fund holdings are US-domiciled, 0.2% above the Benchmark weight. There are no significant
regional or individual country allocation bets within the Fund relative to the overall universe of potential
investments in the Benchmark. The 1.8% underweight to Canada and 1.1% overweight in France are among the
largest differences for individual countries. As mentioned previously, the sector allocation bets can be
significant, driven primarily by the fundamental stock picking Sub-Investment Managers.
CBIS Global Funds plc
10
INVESTMENT MANAGER’S REPORT (continued)
World Equity Fund (the “Fund”) (continued)
Portfolio Positioning and Outlook (continued)
The Fund currently maintains underweights in Financials, Communications Services, Real Estate and Utilities–
with offsetting overweights in Energy Information Technology and Consumer Discretionary. Both Sub-
Investment Managers utilize value–oriented metrics for security selection but are committed to seeking above
average growth potential for their investments. The Fund’s composite 12 month trailing P/E ratio increased
recently to 21.7, and is above the average 17.4 ratio for the Benchmark. We remain confident in the Sub-
Investment Managers’ ability to post better than market returns over complete market cycles.
*References to benchmarks are for illustrative purposes only. There is no guarantee that the Fund will outperform this
benchmark.
Christian Brothers Investment Services, Inc.
July 2019
CBIS Global Funds plc
11
HALF YEARLY MANAGEMENT REPORT
Business review The results of operations are set out in the Statement of Comprehensive Income. The assets under management
are set out in the Statement of Financial Position.
Further information on risk management objectives and policies is detailed below.
Dividends
There were no dividend distributions in respect of the Funds during the financial period under review.
Accordingly, income and capital gains arising in respect of the Funds were reinvested in the Funds and are
reflected in the net asset value per share of the Funds.
Significant events during the financial period
Please refer to Note 14 for details of significant events during the financial period.
Risk management objectives and disclosures
The Company’s investment activities expose it to various types of risk, which are associated with the financial
instruments and markets in which it invests. Details of the risks inherent in investing in the Company are
disclosed in Note 4 to the financial statements.
Related party transactions and connected person transactions
Information on related party and connected person transactions and changes during the financial period is given
in Note 7 to the financial statements.
CBIS Global Funds plc
12
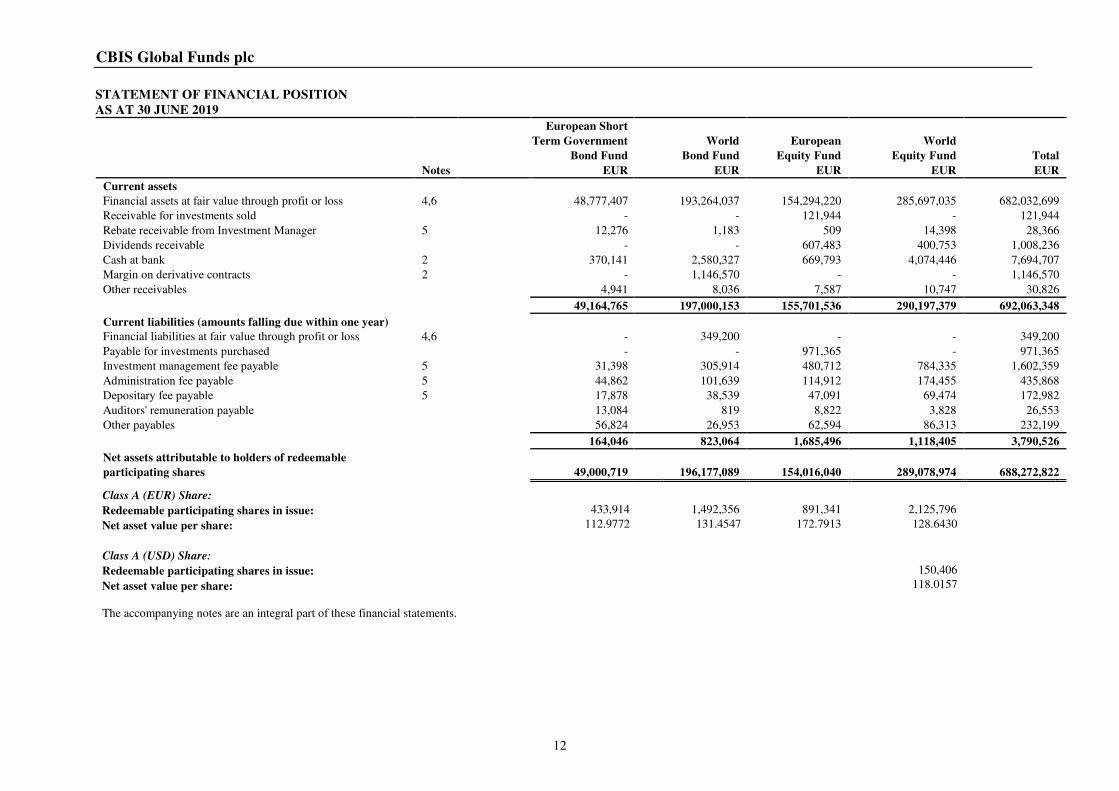
STATEMENT OF FINANCIAL POSITION
AS AT 30 JUNE 2019
European Short
Term Government World European World
Bond Fund Bond Fund Equity Fund Equity Fund Total
Notes EUR EUR EUR EUR EUR
Current assets
Financial assets at fair value through profit or loss 4,6 48,777,407 193,264,037 154,294,220 285,697,035 682,032,699
Receivable for investments sold
- - 121,944 - 121,944
Rebate receivable from Investment Manager 5 12,276 1,183 509 14,398 28,366
Dividends receivable
- - 607,483 400,753 1,008,236
Cash at bank 2 370,141 2,580,327 669,793 4,074,446 7,694,707
Margin on derivative contracts 2 - 1,146,570 - - 1,146,570
Other receivables 4,941 8,036 7,587 10,747 30,826
49,164,765 197,000,153 155,701,536 290,197,379 692,063,348
Current liabilities (amounts falling due within one year)
Financial liabilities at fair value through profit or loss 4,6 - 349,200 - - 349,200
Payable for investments purchased
- - 971,365 - 971,365
Investment management fee payable 5 31,398 305,914 480,712 784,335 1,602,359
Administration fee payable 5 44,862 101,639 114,912 174,455 435,868
Depositary fee payable 5 17,878 38,539 47,091 69,474 172,982
Auditors' remuneration payable
13,084 819 8,822 3,828 26,553
Other payables
56,824 26,953 62,594 86,313 232,199
164,046 823,064 1,685,496 1,118,405 3,790,526
Net assets attributable to holders of redeemable
participating shares 49,000,719 196,177,089 154,016,040 289,078,974 688,272,822
Class A (EUR) Share:
Redeemable participating shares in issue: 433,914 1,492,356 891,341 2,125,796
Net asset value per share: 112.9772 131.4547 172.7913 128.6430
Class A (USD) Share:
Redeemable participating shares in issue: 150,406
Net asset value per share: 118.0157
The accompanying notes are an integral part of these financial statements.
CBIS Global Funds plc
13
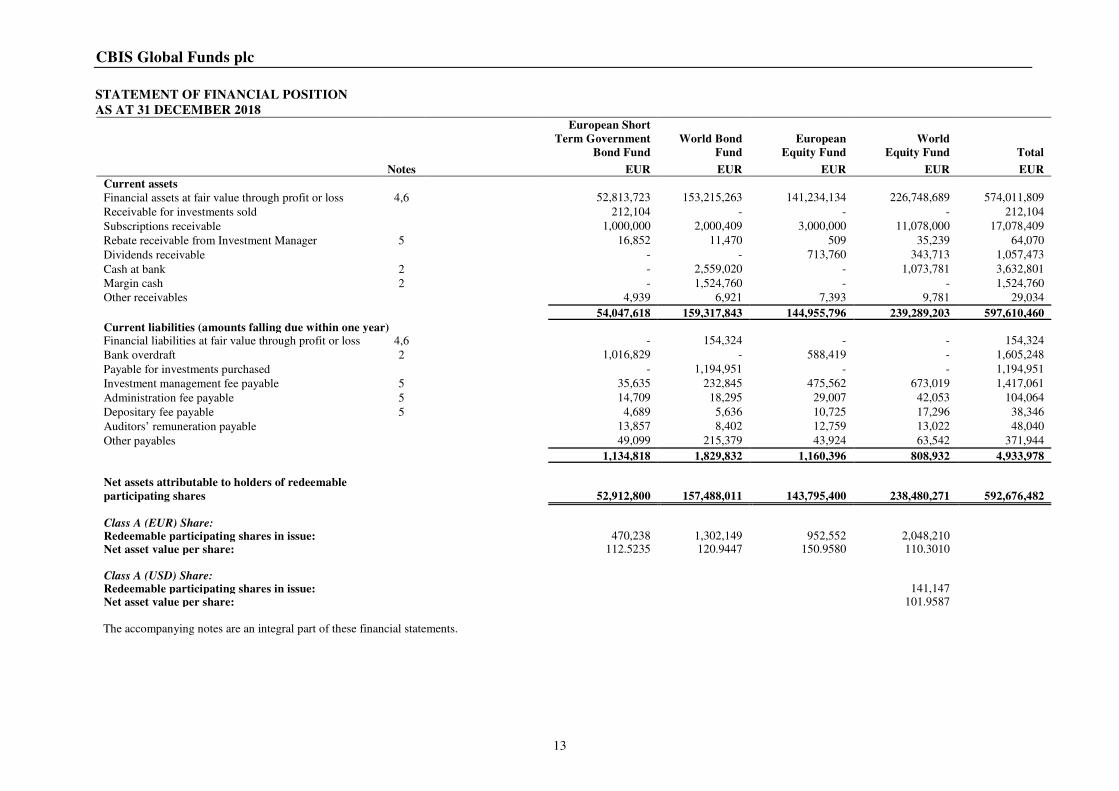
STATEMENT OF FINANCIAL POSITION
AS AT 31 DECEMBER 2018
European Short
Term Government
Bond Fund
World Bond
Fund
European
Equity Fund
World
Equity Fund
Total
Notes EUR EUR EUR EUR EUR
Current assets
Financial assets at fair value through profit or loss 4,6 52,813,723 153,215,263 141,234,134 226,748,689 574,011,809
Receivable for investments sold 212,104 - - - 212,104
Subscriptions receivable 1,000,000 2,000,409 3,000,000 11,078,000 17,078,409
Rebate receivable from Investment Manager 5 16,852 11,470 509 35,239 64,070
Dividends receivable - - 713,760 343,713 1,057,473
Cash at bank 2 - 2,559,020 - 1,073,781 3,632,801
Margin cash 2 - 1,524,760 - - 1,524,760
Other receivables 4,939 6,921 7,393 9,781 29,034
54,047,618 159,317,843 144,955,796 239,289,203 597,610,460
Current liabilities (amounts falling due within one year)
Financial liabilities at fair value through profit or loss 4,6 - 154,324 - - 154,324
Bank overdraft 2 1,016,829 - 588,419 - 1,605,248
Payable for investments purchased - 1,194,951 - - 1,194,951
Investment management fee payable 5 35,635 232,845 475,562 673,019 1,417,061
Administration fee payable 5 14,709 18,295 29,007 42,053 104,064
Depositary fee payable 5 4,689 5,636 10,725 17,296 38,346
Auditors’ remuneration payable 13,857 8,402 12,759 13,022 48,040
Other payables 49,099 215,379 43,924 63,542 371,944
1,134,818 1,829,832 1,160,396 808,932 4,933,978
Net assets attributable to holders of redeemable
participating shares
52,912,800 157,488,011 143,795,400 238,480,271 592,676,482
Class A (EUR) Share: Redeemable participating shares in issue: 470,238 1,302,149 952,552 2,048,210
Net asset value per share: 112.5235 120.9447 150.9580 110.3010
Class A (USD) Share: Redeemable participating shares in issue: 141,147
Net asset value per share: 101.9587
The accompanying notes are an integral part of these financial statements.
CBIS Global Funds plc
14
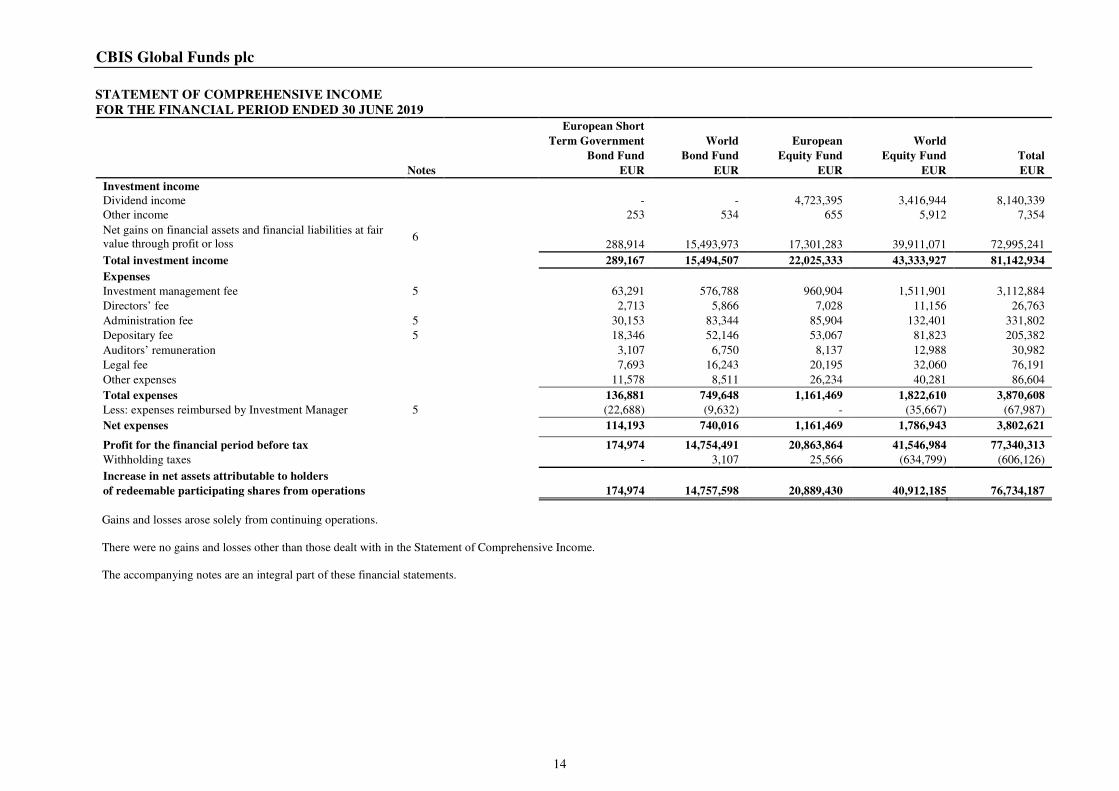
STATEMENT OF COMPREHENSIVE INCOME
FOR THE FINANCIAL PERIOD ENDED 30 JUNE 2019
European Short
Term Government World European World
Bond Fund Bond Fund Equity Fund Equity Fund Total
Notes EUR EUR EUR EUR EUR
Investment income
Dividend income
- - 4,723,395 3,416,944 8,140,339
Other income
253 534 655 5,912 7,354
Net gains on financial assets and financial liabilities at fair
value through profit or loss 6
288,914 15,493,973 17,301,283 39,911,071 72,995,241
Total investment income
289,167 15,494,507 22,025,333 43,333,927 81,142,934
Expenses
Investment management fee 5 63,291 576,788 960,904 1,511,901 3,112,884
Directors’ fee
2,713 5,866 7,028 11,156 26,763
Administration fee 5 30,153 83,344 85,904 132,401 331,802
Depositary fee 5 18,346 52,146 53,067 81,823 205,382
Auditors’ remuneration
3,107 6,750 8,137 12,988 30,982
Legal fee
7,693 16,243 20,195 32,060 76,191
Other expenses
11,578 8,511 26,234 40,281 86,604
Total expenses
136,881 749,648 1,161,469 1,822,610 3,870,608
Less: expenses reimbursed by Investment Manager 5 (22,688) (9,632) - (35,667) (67,987)
Net expenses
114,193 740,016 1,161,469 1,786,943 3,802,621
Profit for the financial period before tax
174,974 14,754,491 20,863,864 41,546,984 77,340,313
Withholding taxes
- 3,107 25,566 (634,799) (606,126)
Increase in net assets attributable to holders
of redeemable participating shares from operations 174,974 14,757,598 20,889,430 40,912,185 76,734,187
-
Gains and losses arose solely from continuing operations.
There were no gains and losses other than those dealt with in the Statement of Comprehensive Income.
The accompanying notes are an integral part of these financial statements.
CBIS Global Funds plc
15
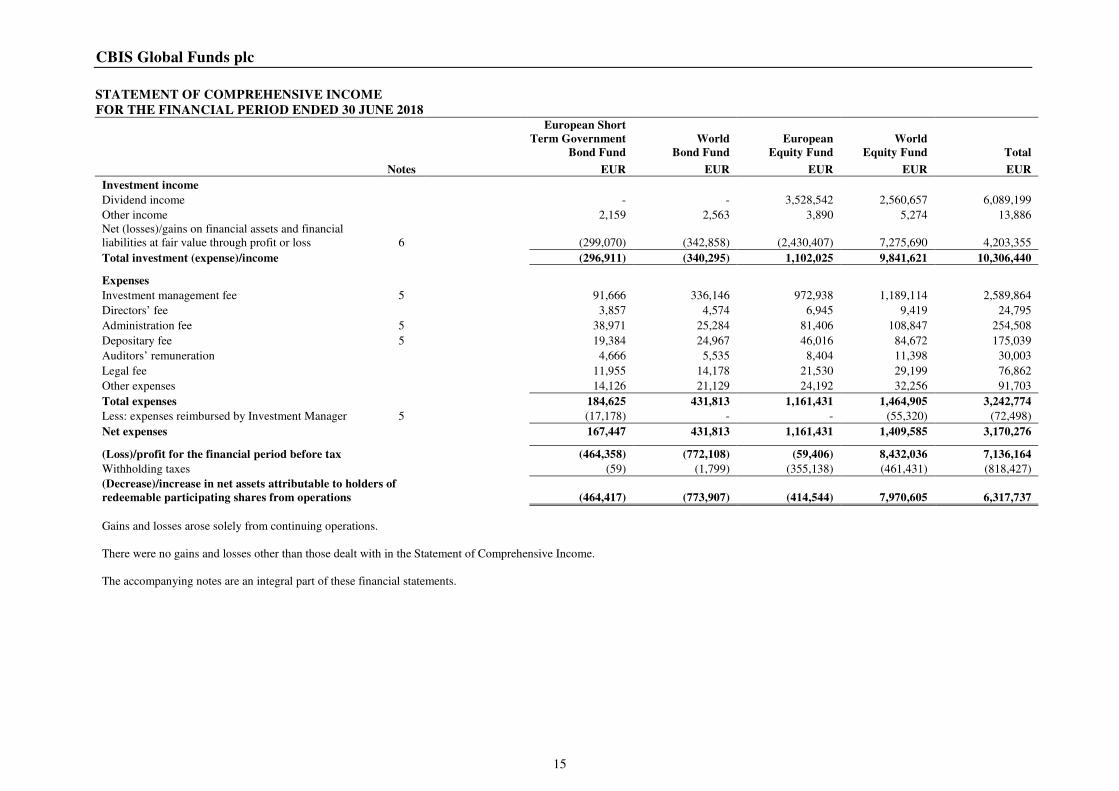
STATEMENT OF COMPREHENSIVE INCOME
FOR THE FINANCIAL PERIOD ENDED 30 JUNE 2018
European Short
Term Government
Bond Fund
World
Bond Fund
European
Equity Fund
World
Equity Fund Total
Notes EUR EUR EUR EUR EUR
Investment income
Dividend income - - 3,528,542 2,560,657 6,089,199
Other income 2,159 2,563 3,890 5,274 13,886
Net (losses)/gains on financial assets and financial
liabilities at fair value through profit or loss 6 (299,070) (342,858) (2,430,407) 7,275,690 4,203,355
Total investment (expense)/income (296,911) (340,295) 1,102,025 9,841,621 10,306,440
Expenses
Investment management fee 5 91,666 336,146 972,938 1,189,114 2,589,864
Directors’ fee 3,857 4,574 6,945 9,419 24,795
Administration fee 5 38,971 25,284 81,406 108,847 254,508
Depositary fee 5 19,384 24,967 46,016 84,672 175,039
Auditors’ remuneration 4,666 5,535 8,404 11,398 30,003
Legal fee 11,955 14,178 21,530 29,199 76,862
Other expenses 14,126 21,129 24,192 32,256 91,703
Total expenses 184,625 431,813 1,161,431 1,464,905 3,242,774
Less: expenses reimbursed by Investment Manager 5 (17,178) - - (55,320) (72,498)
Net expenses 167,447 431,813 1,161,431 1,409,585 3,170,276
(Loss)/profit for the financial period before tax (464,358) (772,108) (59,406) 8,432,036 7,136,164
Withholding taxes (59) (1,799) (355,138) (461,431) (818,427)
(Decrease)/increase in net assets attributable to holders of
redeemable participating shares from operations (464,417) (773,907) (414,544) 7,970,605 6,317,737
-
Gains and losses arose solely from continuing operations.
There were no gains and losses other than those dealt with in the Statement of Comprehensive Income.
The accompanying notes are an integral part of these financial statements.
CBIS Global Funds plc
16
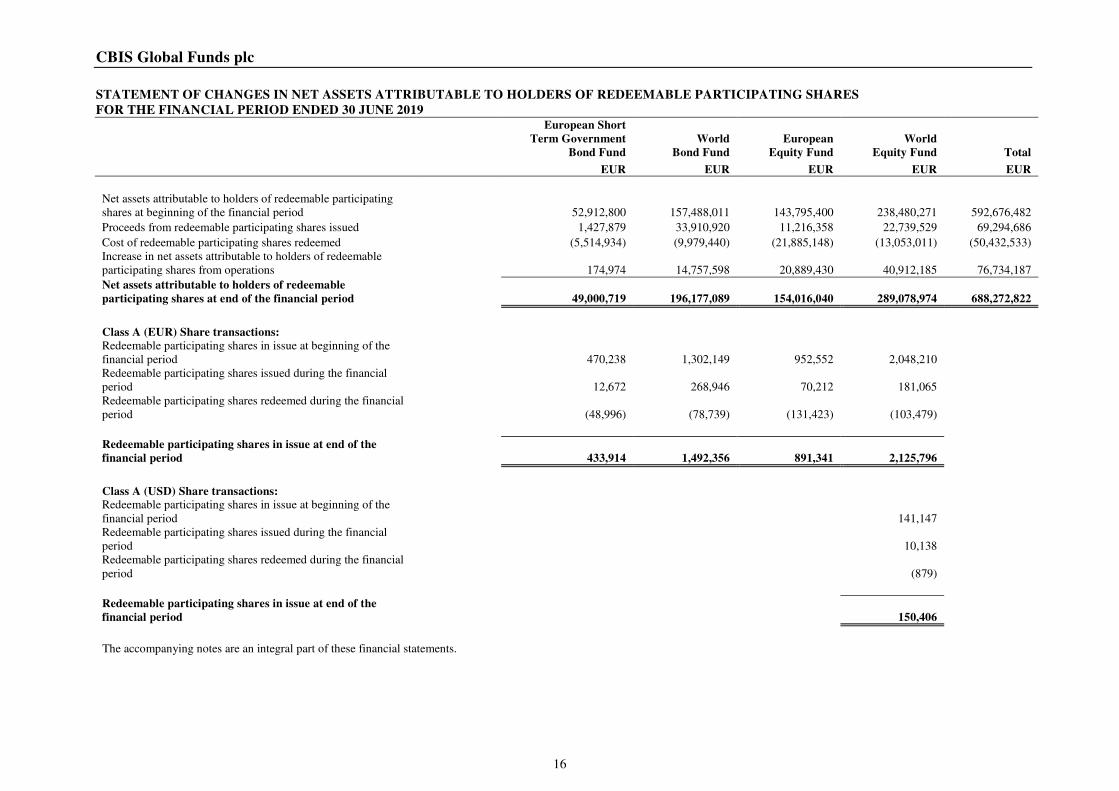
STATEMENT OF CHANGES IN NET ASSETS ATTRIBUTABLE TO HOLDERS OF REDEEMABLE PARTICIPATING SHARES
FOR THE FINANCIAL PERIOD ENDED 30 JUNE 2019
European Short
Term Government
Bond Fund
World
Bond Fund
European
Equity Fund
World
Equity Fund Total
EUR EUR EUR EUR EUR
Net assets attributable to holders of redeemable participating
shares at beginning of the financial period 52,912,800 157,488,011 143,795,400 238,480,271 592,676,482
Proceeds from redeemable participating shares issued 1,427,879 33,910,920 11,216,358 22,739,529 69,294,686
Cost of redeemable participating shares redeemed (5,514,934) (9,979,440) (21,885,148) (13,053,011) (50,432,533)
Increase in net assets attributable to holders of redeemable
participating shares from operations 174,974 14,757,598 20,889,430 40,912,185 76,734,187
Net assets attributable to holders of redeemable
participating shares at end of the financial period 49,000,719 196,177,089 154,016,040 289,078,974 688,272,822
Class A (EUR) Share transactions: Redeemable participating shares in issue at beginning of the
financial period 470,238 1,302,149 952,552 2,048,210 Redeemable participating shares issued during the financial
period 12,672 268,946 70,212 181,065 Redeemable participating shares redeemed during the financial
period (48,996) (78,739) (131,423) (103,479)
Redeemable participating shares in issue at end of the
financial period 433,914 1,492,356 891,341 2,125,796
Class A (USD) Share transactions:
Redeemable participating shares in issue at beginning of the
financial period 141,147
Redeemable participating shares issued during the financial
period 10,138
Redeemable participating shares redeemed during the financial
period (879)
Redeemable participating shares in issue at end of the
financial period 150,406
The accompanying notes are an integral part of these financial statements.
CBIS Global Funds plc
17
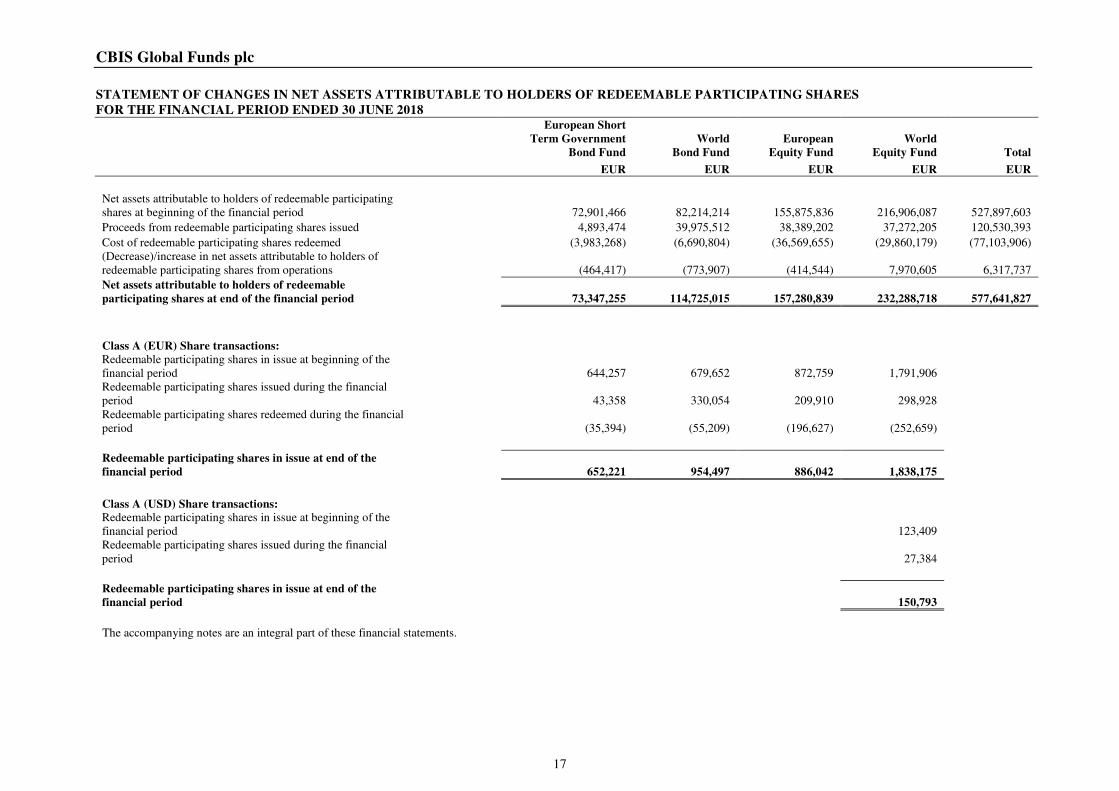
STATEMENT OF CHANGES IN NET ASSETS ATTRIBUTABLE TO HOLDERS OF REDEEMABLE PARTICIPATING SHARES
FOR THE FINANCIAL PERIOD ENDED 30 JUNE 2018
European Short
Term Government
Bond Fund
World
Bond Fund
European
Equity Fund
World
Equity Fund Total
EUR EUR EUR EUR EUR
Net assets attributable to holders of redeemable participating
shares at beginning of the financial period 72,901,466 82,214,214 155,875,836 216,906,087 527,897,603
Proceeds from redeemable participating shares issued 4,893,474 39,975,512 38,389,202 37,272,205 120,530,393
Cost of redeemable participating shares redeemed (3,983,268) (6,690,804) (36,569,655) (29,860,179) (77,103,906)
(Decrease)/increase in net assets attributable to holders of
redeemable participating shares from operations (464,417) (773,907) (414,544) 7,970,605 6,317,737
Net assets attributable to holders of redeemable
participating shares at end of the financial period 73,347,255 114,725,015 157,280,839 232,288,718 577,641,827
Class A (EUR) Share transactions:
Redeemable participating shares in issue at beginning of the
financial period 644,257 679,652 872,759 1,791,906
Redeemable participating shares issued during the financial
period 43,358 330,054 209,910 298,928
Redeemable participating shares redeemed during the financial
period (35,394) (55,209) (196,627) (252,659)
Redeemable participating shares in issue at end of the
financial period 652,221 954,497 886,042 1,838,175
Class A (USD) Share transactions:
Redeemable participating shares in issue at beginning of the
financial period 123,409
Redeemable participating shares issued during the financial
period 27,384
Redeemable participating shares in issue at end of the
financial period 150,793
The accompanying notes are an integral part of these financial statements.
CBIS Global Funds plc
NOTES TO THE FINANCIAL STATEMENTS
18
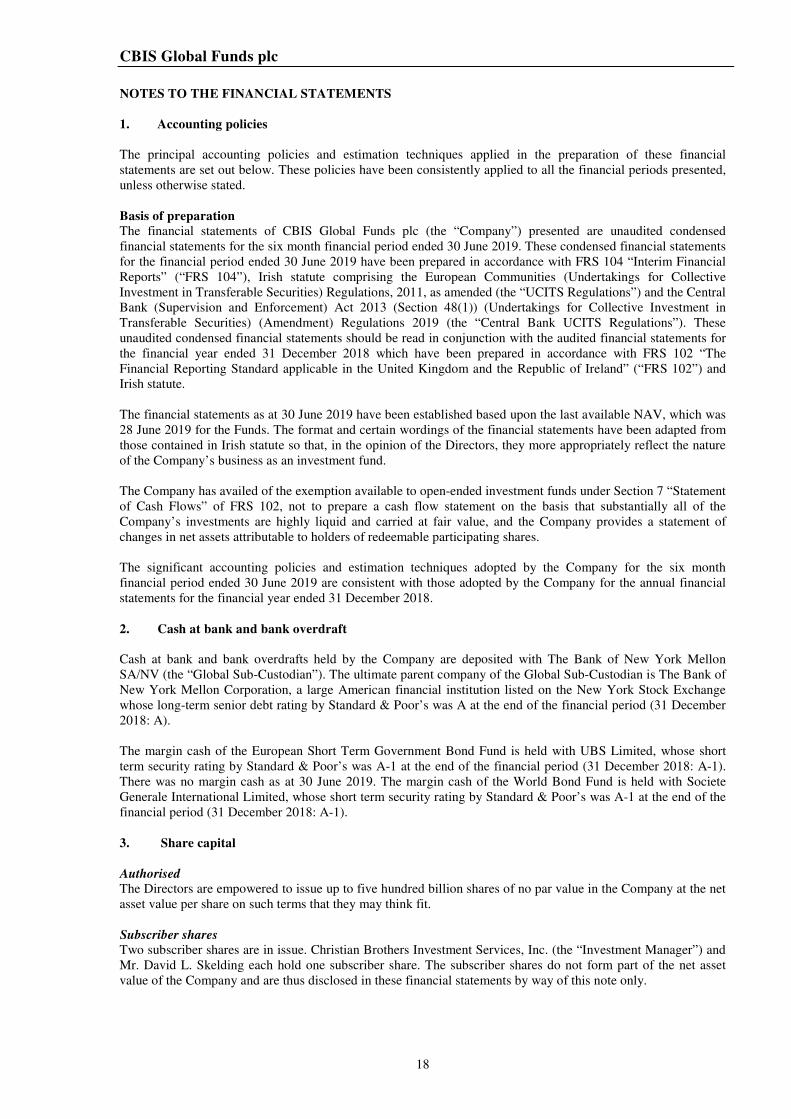
1. Accounting policies
The principal accounting policies and estimation techniques applied in the preparation of these financial
statements are set out below. These policies have been consistently applied to all the financial periods presented,
unless otherwise stated.
Basis of preparation
The financial statements of CBIS Global Funds plc (the “Company”) presented are unaudited condensed
financial statements for the six month financial period ended 30 June 2019. These condensed financial statements
for the financial period ended 30 June 2019 have been prepared in accordance with FRS 104 “Interim Financial
Reports” (“FRS 104”), Irish statute comprising the European Communities (Undertakings for Collective
Investment in Transferable Securities) Regulations, 2011, as amended (the “UCITS Regulations”) and the Central
Bank (Supervision and Enforcement) Act 2013 (Section 48(1)) (Undertakings for Collective Investment in
Transferable Securities) (Amendment) Regulations 2019 (the “Central Bank UCITS Regulations”). These
unaudited condensed financial statements should be read in conjunction with the audited financial statements for
the financial year ended 31 December 2018 which have been prepared in accordance with FRS 102 “The
Financial Reporting Standard applicable in the United Kingdom and the Republic of Ireland” (“FRS 102”) and
Irish statute.
The financial statements as at 30 June 2019 have been established based upon the last available NAV, which was
28 June 2019 for the Funds. The format and certain wordings of the financial statements have been adapted from
those contained in Irish statute so that, in the opinion of the Directors, they more appropriately reflect the nature
of the Company’s business as an investment fund.
The Company has availed of the exemption available to open-ended investment funds under Section 7 “Statement
of Cash Flows” of FRS 102, not to prepare a cash flow statement on the basis that substantially all of the
Company’s investments are highly liquid and carried at fair value, and the Company provides a statement of
changes in net assets attributable to holders of redeemable participating shares.
The significant accounting policies and estimation techniques adopted by the Company for the six month
financial period ended 30 June 2019 are consistent with those adopted by the Company for the annual financial
statements for the financial year ended 31 December 2018.
2. Cash at bank and bank overdraft
Cash at bank and bank overdrafts held by the Company are deposited with The Bank of New York Mellon
SA/NV (the “Global Sub-Custodian”). The ultimate parent company of the Global Sub-Custodian is The Bank of
New York Mellon Corporation, a large American financial institution listed on the New York Stock Exchange
whose long-term senior debt rating by Standard & Poor’s was A at the end of the financial period (31 December
2018: A).
The margin cash of the European Short Term Government Bond Fund is held with UBS Limited, whose short
term security rating by Standard & Poor’s was A-1 at the end of the financial period (31 December 2018: A-1).
There was no margin cash as at 30 June 2019. The margin cash of the World Bond Fund is held with Societe
Generale International Limited, whose short term security rating by Standard & Poor’s was A-1 at the end of the
financial period (31 December 2018: A-1).
3. Share capital
Authorised
The Directors are empowered to issue up to five hundred billion shares of no par value in the Company at the net
asset value per share on such terms that they may think fit.
Subscriber shares
Two subscriber shares are in issue. Christian Brothers Investment Services, Inc. (the “Investment Manager”) and
Mr. David L. Skelding each hold one subscriber share. The subscriber shares do not form part of the net asset
value of the Company and are thus disclosed in these financial statements by way of this note only.
CBIS Global Funds plc
NOTES TO THE FINANCIAL STATEMENTS (continued)
19
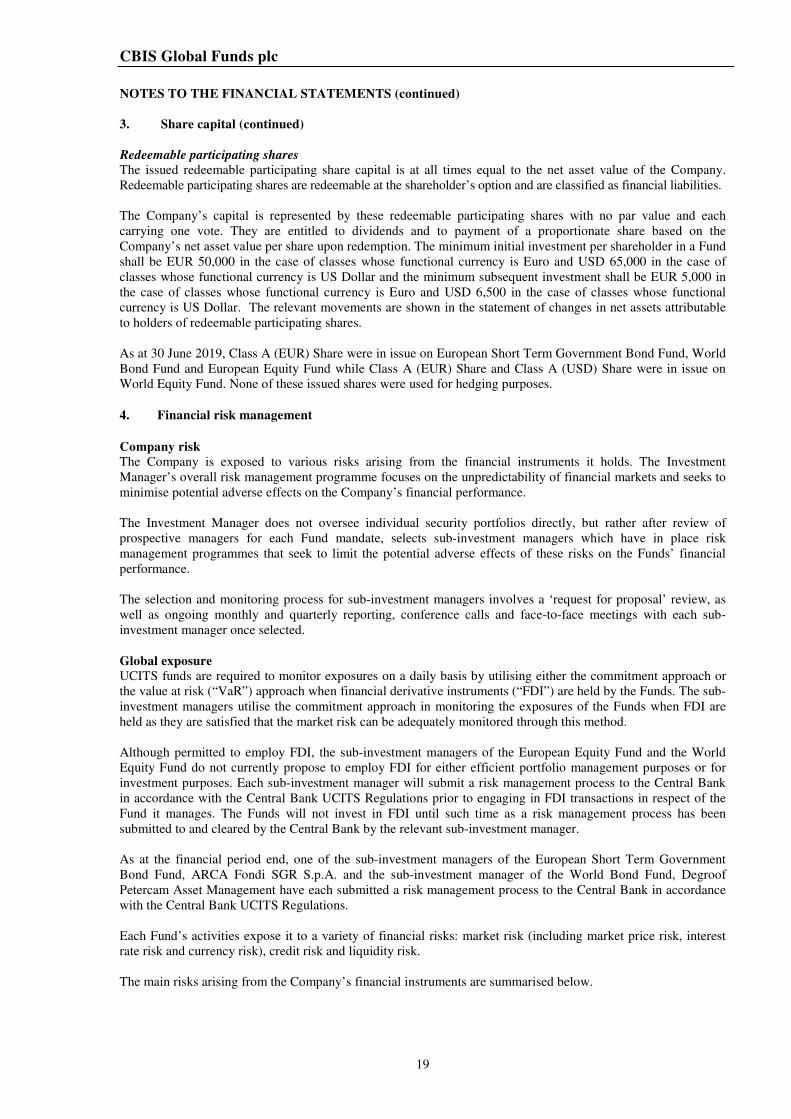
3. Share capital (continued)
Redeemable participating shares
The issued redeemable participating share capital is at all times equal to the net asset value of the Company.
Redeemable participating shares are redeemable at the shareholder’s option and are classified as financial liabilities.
The Company’s capital is represented by these redeemable participating shares with no par value and each
carrying one vote. They are entitled to dividends and to payment of a proportionate share based on the
Company’s net asset value per share upon redemption. The minimum initial investment per shareholder in a Fund
shall be EUR 50,000 in the case of classes whose functional currency is Euro and USD 65,000 in the case of
classes whose functional currency is US Dollar and the minimum subsequent investment shall be EUR 5,000 in
the case of classes whose functional currency is Euro and USD 6,500 in the case of classes whose functional
currency is US Dollar. The relevant movements are shown in the statement of changes in net assets attributable
to holders of redeemable participating shares.
As at 30 June 2019, Class A (EUR) Share were in issue on European Short Term Government Bond Fund, World
Bond Fund and European Equity Fund while Class A (EUR) Share and Class A (USD) Share were in issue on
World Equity Fund. None of these issued shares were used for hedging purposes.
4. Financial risk management
Company risk
The Company is exposed to various risks arising from the financial instruments it holds. The Investment
Manager’s overall risk management programme focuses on the unpredictability of financial markets and seeks to
minimise potential adverse effects on the Company’s financial performance.
The Investment Manager does not oversee individual security portfolios directly, but rather after review of
prospective managers for each Fund mandate, selects sub-investment managers which have in place risk
management programmes that seek to limit the potential adverse effects of these risks on the Funds’ financial
performance.
The selection and monitoring process for sub-investment managers involves a ‘request for proposal’ review, as
well as ongoing monthly and quarterly reporting, conference calls and face-to-face meetings with each sub-
investment manager once selected.
Global exposure
UCITS funds are required to monitor exposures on a daily basis by utilising either the commitment approach or
the value at risk (“VaR”) approach when financial derivative instruments (“FDI”) are held by the Funds. The sub-
investment managers utilise the commitment approach in monitoring the exposures of the Funds when FDI are
held as they are satisfied that the market risk can be adequately monitored through this method.
Although permitted to employ FDI, the sub-investment managers of the European Equity Fund and the World
Equity Fund do not currently propose to employ FDI for either efficient portfolio management purposes or for
investment purposes. Each sub-investment manager will submit a risk management process to the Central Bank
in accordance with the Central Bank UCITS Regulations prior to engaging in FDI transactions in respect of the
Fund it manages. The Funds will not invest in FDI until such time as a risk management process has been
submitted to and cleared by the Central Bank by the relevant sub-investment manager.
As at the financial period end, one of the sub-investment managers of the European Short Term Government
Bond Fund, ARCA Fondi SGR S.p.A. and the sub-investment manager of the World Bond Fund, Degroof
Petercam Asset Management have each submitted a risk management process to the Central Bank in accordance
with the Central Bank UCITS Regulations.
Each Fund’s activities expose it to a variety of financial risks: market risk (including market price risk, interest
rate risk and currency risk), credit risk and liquidity risk.
The main risks arising from the Company’s financial instruments are summarised below.
CBIS Global Funds plc
NOTES TO THE FINANCIAL STATEMENTS
20
4. Financial risk management (continued) Market risk
a) Market price risk
Market price risk is the risk that the fair value of a financial instrument will fluctuate because of changes in
market prices (other than those arising from interest rate risk and currency risk), whether those changes are
caused by factors specific to individual financial instruments or its issuer, or other factors affecting similar
financial instruments traded in the market. The Company seeks to mitigate market price risk through a variety of
techniques including diversification of holdings and investment limitation guidelines agreed with the
sub-investment managers.
b) Interest rate risk
Interest rate risk is comprised of fair value interest rate risk and cash flow interest rate risk. Fair value interest
rate risk is defined as the risk that the fair value of a financial instrument will fluctuate because of changes in
market interest rates. This risk arises in respect of financial instruments whose fair value is affected by changes in
interest rates. Cash flow interest rate risk is the yield risk arising from changes in interest rates i.e. change in
interest rates would have a direct impact on the yield generated by a Fund over the financial period.
c) Currency risk
Currency risk is the risk that the fair value of a financial instrument will fluctuate because of changes in foreign
exchange rates. The risk arises on financial instruments that are denominated in a currency other than the
functional currency in which they are measured. The sub-investment managers monitor the currency exposure
each dealing day in accordance with the Prospectus.
Credit risk
Credit risk is the risk that one party to a financial instrument will cause a financial loss for the other party by
failing to discharge an obligation. This includes counterparty risk and issuer risk. Financial assets, which
potentially expose the Company to credit risk, consist principally of interest bearing securities such as bonds,
derivative instruments and investments in cash balances and deposits with and receivable from brokers. The
extent of the Company’s exposure to credit risk in respect of these financial assets approximates their carrying
value as recorded in the Company’s Statement of Financial Position.
Liquidity risk
Liquidity risk is the risk that the Company may not be able to generate sufficient cash resources to settle its
obligations in full as they fall due or can only do so on terms that are materially disadvantageous.
The Company is exposed to daily cash redemptions of redeemable participating shares. The Company therefore
invests its assets in investments that are traded in an active market and can be readily disposed of. Listed
securities held by the Funds are considered readily realisable, as they are listed on a stock exchange or dealt on a
regulated market. To facilitate an orderly disposition of securities the Directors are empowered, pursuant to the
provisions in the Prospectus, to refuse to repurchase any shares in excess of one tenth of the shares in issue in a
Fund on any one dealing day.
Fair value estimation
Under FRS 102, the Company is required to classify fair value measurements using a fair value hierarchy that
reflects the significance of the inputs used in making the measurements.
The fair value hierarchy has the following levels:
• Level 1: The unadjusted quoted price in an active market for identical assets or liabilities that the entity can
access at the measurement date.
• Level 2: Inputs other than quoted prices included within Level 1 that are observable (i.e. developed using
market data) for the asset or liability, either directly or indirectly.
• Level 3: Inputs are unobservable (i.e. for which market data is unavailable) for the asset or liability.
CBIS Global Funds plc
NOTES TO THE FINANCIAL STATEMENTS (continued)
21
4. Financial risk management (continued)
Fair value estimation (continued)
The level in the fair value hierarchy within which the fair value measurement is categorised in its entirety is
determined on the basis of the lowest level input that is significant to the fair value measurement in its entirety.
For this purpose, the significance of an input is assessed against the fair value measurement in its entirety.
If a fair value measurement uses observable inputs that require significant adjustment based on unobservable
inputs, that measurement is a level 3 measurement. Assessing the significance of a particular input to the fair
value measurement in its entirety requires judgement, considering factors specific to the asset or liability. The
determination of what constitutes “observable” requires significant judgement by the Investment Manager. The
Investment Manager considers observable data to be those market data that are readily available, regularly
distributed or updated, reliable and verifiable, not proprietary, and provided by independent sources that are
actively involved in the relevant market.
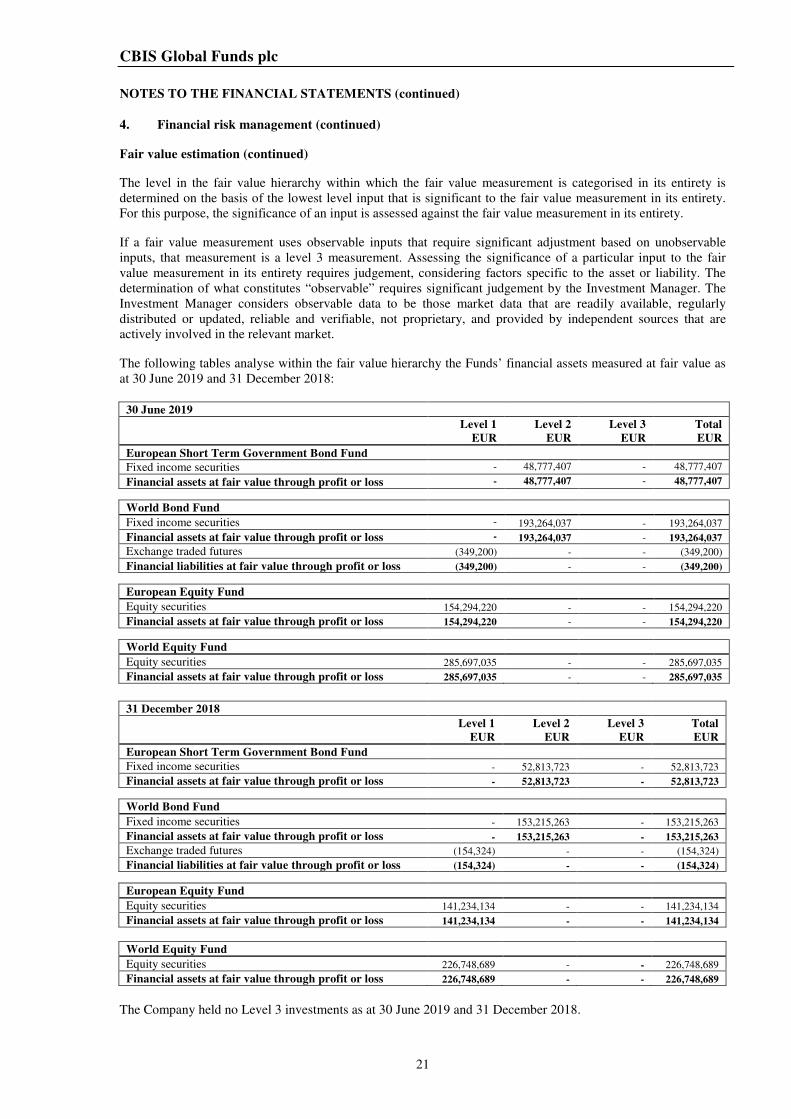
The following tables analyse within the fair value hierarchy the Funds’ financial assets measured at fair value as
at 30 June 2019 and 31 December 2018:
30 June 2019
Level 1 Level 2 Level 3 Total
EUR EUR EUR EUR
European Short Term Government Bond Fund
Fixed income securities - 48,777,407 - 48,777,407
Financial assets at fair value through profit or loss - 48,777,407 - 48,777,407
World Bond Fund
Fixed income securities - 193,264,037 - 193,264,037
Financial assets at fair value through profit or loss - 193,264,037 - 193,264,037
Exchange traded futures (349,200) - - (349,200)
Financial liabilities at fair value through profit or loss (349,200) - - (349,200)
European Equity Fund
Equity securities 154,294,220 - - 154,294,220
Financial assets at fair value through profit or loss 154,294,220 - - 154,294,220
World Equity Fund
Equity securities 285,697,035 - - 285,697,035
Financial assets at fair value through profit or loss 285,697,035 - - 285,697,035
31 December 2018
Level 1 Level 2 Level 3 Total
EUR EUR EUR EUR
European Short Term Government Bond Fund
Fixed income securities - 52,813,723 - 52,813,723
Financial assets at fair value through profit or loss - 52,813,723 - 52,813,723
World Bond Fund
Fixed income securities - 153,215,263 - 153,215,263
Financial assets at fair value through profit or loss - 153,215,263 - 153,215,263
Exchange traded futures (154,324) - - (154,324)
Financial liabilities at fair value through profit or loss (154,324) - - (154,324)
European Equity Fund
Equity securities 141,234,134 - - 141,234,134
Financial assets at fair value through profit or loss 141,234,134 - - 141,234,134
World Equity Fund
Equity securities 226,748,689 - - 226,748,689
Financial assets at fair value through profit or loss 226,748,689 - - 226,748,689
The Company held no Level 3 investments as at 30 June 2019 and 31 December 2018.
CBIS Global Funds plc
NOTES TO THE FINANCIAL STATEMENTS (continued)
22
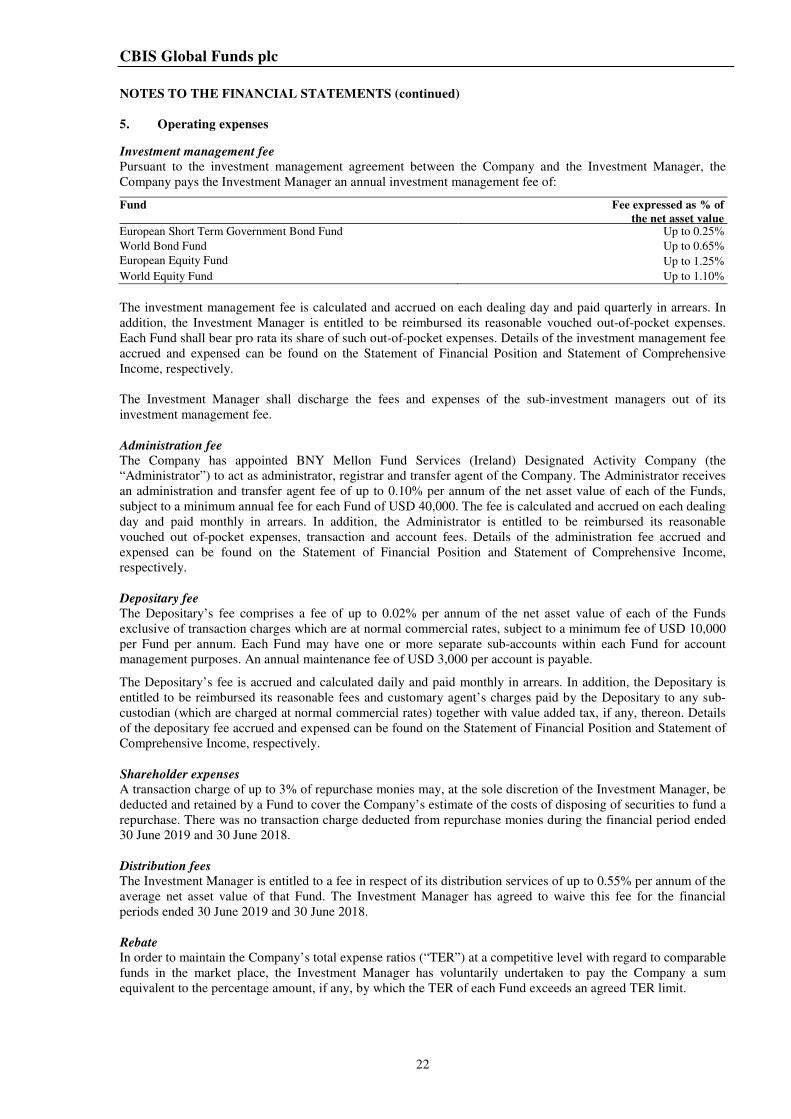
5. Operating expenses
Investment management fee
Pursuant to the investment management agreement between the Company and the Investment Manager, the
Company pays the Investment Manager an annual investment management fee of:
Fund
Fee expressed as % of
the net asset value European Short Term Government Bond Fund Up to 0.25%
World Bond Fund Up to 0.65%
European Equity Fund
Up to 1.25%
World Equity Fund Up to 1.10%
The investment management fee is calculated and accrued on each dealing day and paid quarterly in arrears. In
addition, the Investment Manager is entitled to be reimbursed its reasonable vouched out-of-pocket expenses.
Each Fund shall bear pro rata its share of such out-of-pocket expenses. Details of the investment management fee
accrued and expensed can be found on the Statement of Financial Position and Statement of Comprehensive
Income, respectively.
The Investment Manager shall discharge the fees and expenses of the sub-investment managers out of its
investment management fee.
Administration fee
The Company has appointed BNY Mellon Fund Services (Ireland) Designated Activity Company (the
“Administrator”) to act as administrator, registrar and transfer agent of the Company. The Administrator receives
an administration and transfer agent fee of up to 0.10% per annum of the net asset value of each of the Funds,
subject to a minimum annual fee for each Fund of USD 40,000. The fee is calculated and accrued on each dealing
day and paid monthly in arrears. In addition, the Administrator is entitled to be reimbursed its reasonable
vouched out of-pocket expenses, transaction and account fees. Details of the administration fee accrued and
expensed can be found on the Statement of Financial Position and Statement of Comprehensive Income,
respectively.
Depositary fee
The Depositary’s fee comprises a fee of up to 0.02% per annum of the net asset value of each of the Funds
exclusive of transaction charges which are at normal commercial rates, subject to a minimum fee of USD 10,000
per Fund per annum. Each Fund may have one or more separate sub-accounts within each Fund for account
management purposes. An annual maintenance fee of USD 3,000 per account is payable. The Depositary’s fee is accrued and calculated daily and paid monthly in arrears. In addition, the Depositary is
entitled to be reimbursed its reasonable fees and customary agent’s charges paid by the Depositary to any sub-
custodian (which are charged at normal commercial rates) together with value added tax, if any, thereon. Details
of the depositary fee accrued and expensed can be found on the Statement of Financial Position and Statement of
Comprehensive Income, respectively.
Shareholder expenses
A transaction charge of up to 3% of repurchase monies may, at the sole discretion of the Investment Manager, be
deducted and retained by a Fund to cover the Company’s estimate of the costs of disposing of securities to fund a
repurchase. There was no transaction charge deducted from repurchase monies during the financial period ended
30 June 2019 and 30 June 2018.
Distribution fees
The Investment Manager is entitled to a fee in respect of its distribution services of up to 0.55% per annum of the
average net asset value of that Fund. The Investment Manager has agreed to waive this fee for the financial
periods ended 30 June 2019 and 30 June 2018.
Rebate
In order to maintain the Company’s total expense ratios (“TER”) at a competitive level with regard to comparable
funds in the market place, the Investment Manager has voluntarily undertaken to pay the Company a sum
equivalent to the percentage amount, if any, by which the TER of each Fund exceeds an agreed TER limit.
CBIS Global Funds plc
NOTES TO THE FINANCIAL STATEMENTS (continued)
23
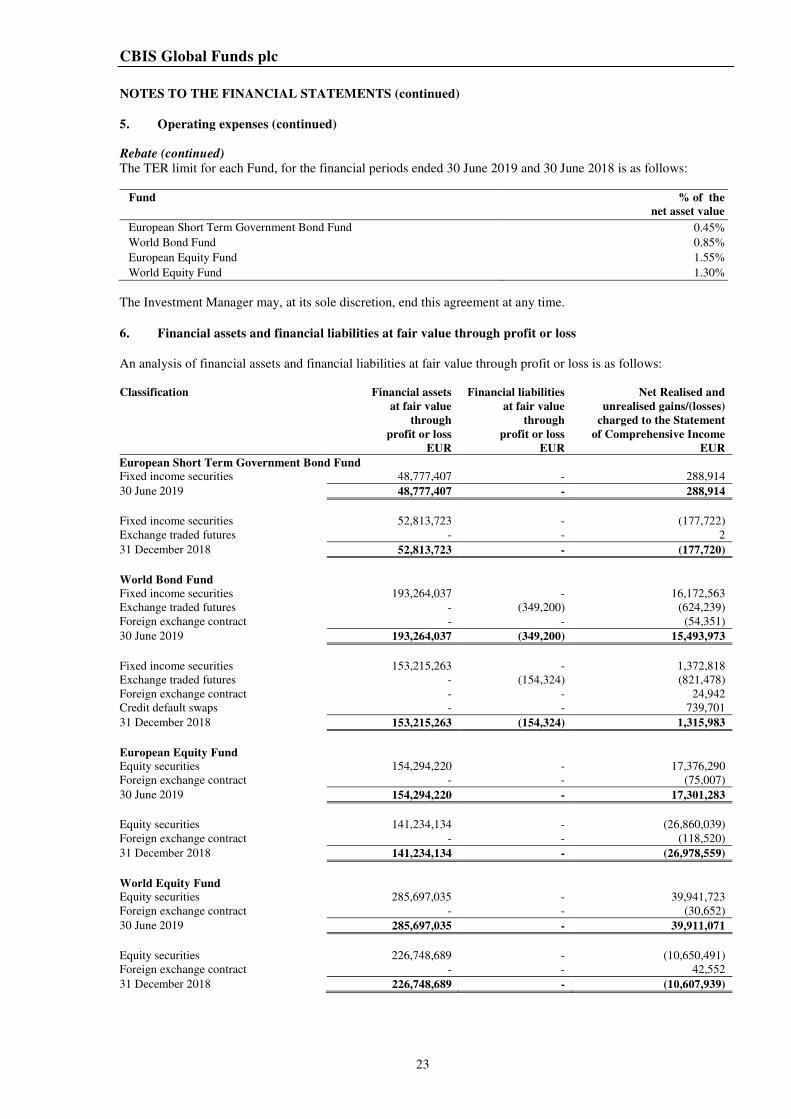
5. Operating expenses (continued)
Rebate (continued)
The TER limit for each Fund, for the financial periods ended 30 June 2019 and 30 June 2018 is as follows:
Fund % of the
net asset value
European Short Term Government Bond Fund
ment Bond Fund 0.45%
World Bond Fund 0.85%
European Equity Fund 1.55%
World Equity Fund 1.30%
The Investment Manager may, at its sole discretion, end this agreement at any time.
6. Financial assets and financial liabilities at fair value through profit or loss
An analysis of financial assets and financial liabilities at fair value through profit or loss is as follows:
Classification Financial assets Financial liabilities Net Realised and
at fair value at fair value unrealised gains/(losses)
through through charged to the Statement
profit or loss profit or loss of Comprehensive Income
EUR EUR EUR
European Short Term Government Bond Fund
Fixed income securities 48,777,407 - 288,914
30 June 2019 48,777,407 - 288,914
Fixed income securities 52,813,723 - (177,722)
Exchange traded futures - - 2
31 December 2018 52,813,723 - (177,720)
World Bond Fund
Fixed income securities 193,264,037 - 16,172,563
Exchange traded futures - (349,200) (624,239)
Foreign exchange contract - - (54,351)
30 June 2019 193,264,037 (349,200) 15,493,973
Fixed income securities 153,215,263 - 1,372,818
Exchange traded futures - (154,324) (821,478)
Foreign exchange contract - - 24,942
Credit default swaps - - 739,701
31 December 2018 153,215,263 (154,324) 1,315,983
European Equity Fund
Equity securities 154,294,220 - 17,376,290
Foreign exchange contract - - (75,007)
30 June 2019 154,294,220 - 17,301,283
Equity securities 141,234,134 - (26,860,039)
Foreign exchange contract - - (118,520)
31 December 2018 141,234,134 - (26,978,559)
World Equity Fund
Equity securities 285,697,035 - 39,941,723
Foreign exchange contract - - (30,652)
30 June 2019 285,697,035 - 39,911,071
Equity securities 226,748,689 - (10,650,491)
Foreign exchange contract - - 42,552
31 December 2018 226,748,689 - (10,607,939)
CBIS Global Funds plc
NOTES TO THE FINANCIAL STATEMENTS (continued)
24
7. Related party and connected person transactions
a) Related party transactions
Mr. Jeffrey A. McCroy is President and Chief Executive Officer of the Investment Manager and Chairman of the
Company. There were no Directors’ fees paid to him by the Company for the financial period ended 30 June
2019 (30 June 2018: Nil). Details of the Directors’ fees charged during the financial period and payable at
financial period end are detailed in the Statement of Comprehensive Income and Statement of Financial Position,
respectively.
Investment management fees charged during the financial period and payable at financial period end are detailed
in the Statement of Comprehensive Income and Statement of Financial Position, respectively. Expense
reimbursement by the Investment Manager and reimbursement receivable at financial period end are detailed in
the Statement of Comprehensive Income and Statement of Financial Position, respectively.
Other than those noted in Note 3 to the financial statements, the Directors had no interests in the shares of the
Company during the financial periods ended 30 June 2019 and 30 June 2018.
b) Connected person transactions
In accordance with the requirements of Chapter 10 of the Central Bank UCITS Regulations, all transactions
carried out with the Company by the Depositary and the delegate or sub-delegate of the Company or the
Depositary, and any associated or group company of the Company, the Depositary or such delegate or sub-
delegate (“connected persons”) must be conducted at arm’s length and be in the best interests of shareholders.
The Directors are satisfied that there are arrangements in place, evidenced by written procedures, to ensure that
these obligations are applied to all transactions with connected persons and transactions with connected persons
entered into during the financial period complied with these obligations.
During the financial period, companies related to the Depositary were selected by the Investment Manager to
execute investment trades and foreign exchange transactions and to accept deposits on behalf of the Funds.
8. Taxation
Under current law and practice the Company qualifies as an investment undertaking as defined in Section 739B
of the Taxes Consolidation Act, 1997, as amended. On that basis, it is not generally chargeable to Irish tax on its
income or gains. However, Irish tax may arise on the happening of a “chargeable event”. A chargeable event
includes any distribution payments to shareholders or any encashment, redemption, cancellation or transfer of
shares.
No Irish tax will arise on the Company in respect of chargeable events in respect of:
(a) a shareholder who is neither Irish resident nor ordinarily resident in Ireland for tax purposes, at the time of the
chargeable event, provided appropriate valid declarations in accordance with the provisions of the Taxes
Consolidation Act, 1997, as amended, are held by the Company; and
(b) certain exempted Irish tax resident shareholders who have provided the Company with the necessary signed
statutory declarations.
Dividends, interest and capital gains (if any) received on investments made by the Company may be subject to
withholding taxes imposed by the country from which the investment income/gains are received and such taxes
may not be recoverable by the Company or its shareholders.
9. Financial derivative instruments
Except where otherwise stated in the investment objectives and policies of a Fund in the Prospectus, the Funds
may invest in FDI for investment purposes and for efficient portfolio management purposes or to protect against
foreign exchange rate risks, subject to the conditions and within the limits laid down by the Central Bank.
Efficient portfolio management transactions relating to the assets of a Fund may be entered into with one of the
following aims: hedging, reducing risks or costs, or increasing capital or income returns.
CBIS Global Funds plc
NOTES TO THE FINANCIAL STATEMENTS (continued)
25
9. Financial derivative instruments (continued)
Details of the FDI in which the Funds have invested are disclosed in the relevant Portfolio of Investments.
The Funds classify FDI as financial assets or financial liabilities at fair value through profit or loss. Gains and
losses of the FDI are presented in the Statement of Comprehensive Income in the financial period in which they
arise.
During the financial periods ended 30 June 2019 and 30 June 2018, the Funds did not engage in the efficient
portfolio management techniques of stocklending, repurchase agreements and reverse repurchase agreements.
10. Soft commission arrangements
Los Angeles Capital Management and Equity Research Inc. (“Los Angeles Capital”), a sub-investment manager
of the World Equity Fund, entered into soft commission arrangements with third parties under which the third
party provides research and research products which are used to assist in the provision of investment services to
the Fund. Los Angeles Capital’s soft commission arrangements comply with the Chartered Financial Analyst
Institute Soft Dollar Standards and satisfy the safe harbour provisions under Section 28(e) of the Securities and
Exchange Act of 1934. Other than the above, neither the Investment Manager nor any of its sub-investment
managers entered into any other soft commission arrangements during the financial period.
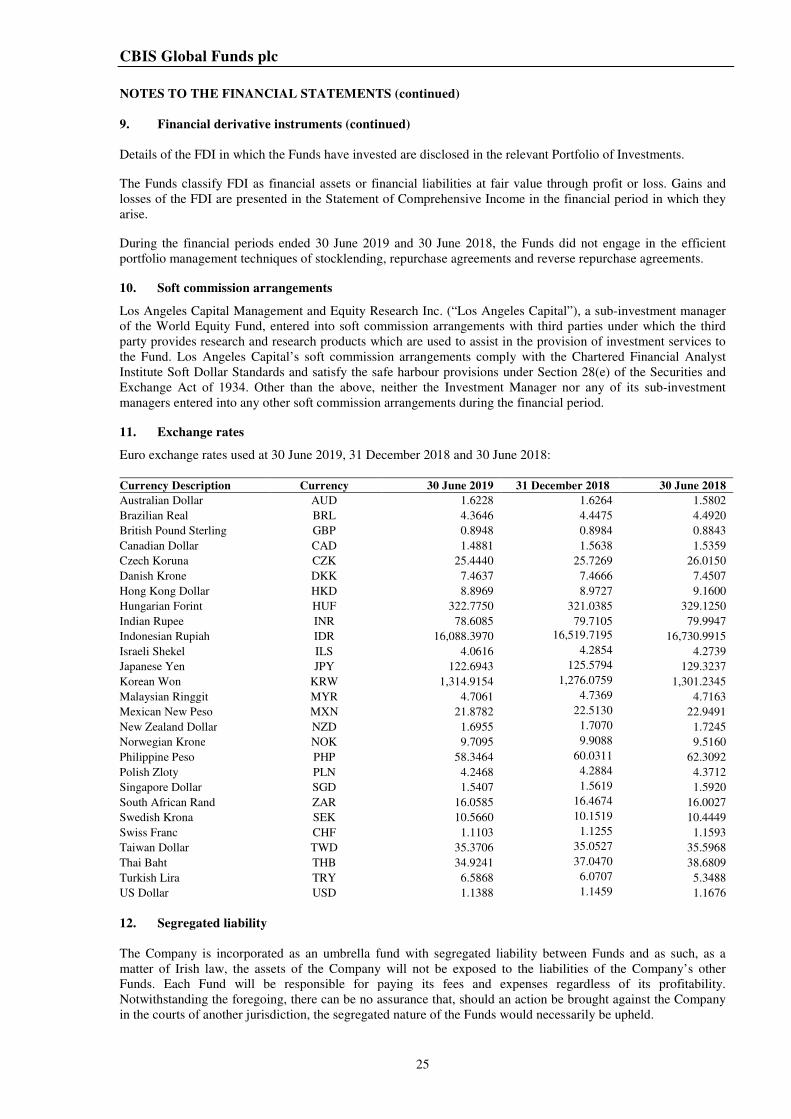
11. Exchange rates
Euro exchange rates used at 30 June 2019, 31 December 2018 and 30 June 2018:
Currency Description Currency 30 June 2019 31 December 2018 30 June 2018
Australian Dollar AUD 1.6228 1.6264 1.5802
Brazilian Real BRL 4.3646 4.4475 4.4920
British Pound Sterling GBP 0.8948 0.8984 0.8843
Canadian Dollar CAD 1.4881 1.5638 1.5359
Czech Koruna CZK 25.4440 25.7269 26.0150
Danish Krone DKK 7.4637 7.4666 7.4507
Hong Kong Dollar HKD 8.8969 8.9727 9.1600
Hungarian Forint HUF 322.7750 321.0385 329.1250
Indian Rupee INR 78.6085 79.7105 79.9947
Indonesian Rupiah IDR 16,088.3970 16,519.7195
16,730.9915
Israeli Shekel ILS 4.0616 4.2854
4.2739
Japanese Yen JPY 122.6943 125.5794
129.3237
Korean Won KRW 1,314.9154 1,276.0759
1,301.2345
Malaysian Ringgit MYR 4.7061 4.7369
4.7163
Mexican New Peso MXN 21.8782 22.5130
22.9491
New Zealand Dollar NZD 1.6955 1.7070
1.7245
Norwegian Krone NOK 9.7095 9.9088
9.5160
Philippine Peso PHP 58.3464 60.0311
62.3092
Polish Zloty PLN 4.2468 4.2884
4.3712
Singapore Dollar SGD 1.5407 1.5619
1.5920
South African Rand ZAR 16.0585 16.4674
16.0027
Swedish Krona SEK 10.5660 10.1519
10.4449
Swiss Franc CHF 1.1103 1.1255
1.1593
Taiwan Dollar TWD 35.3706 35.0527
35.5968
Thai Baht THB 34.9241 37.0470
38.6809
Turkish Lira TRY 6.5868 6.0707
5.3488
US Dollar USD 1.1388 1.1459
1.1676
12. Segregated liability
The Company is incorporated as an umbrella fund with segregated liability between Funds and as such, as a
matter of Irish law, the assets of the Company will not be exposed to the liabilities of the Company’s other
Funds. Each Fund will be responsible for paying its fees and expenses regardless of its profitability.
Notwithstanding the foregoing, there can be no assurance that, should an action be brought against the Company
in the courts of another jurisdiction, the segregated nature of the Funds would necessarily be upheld.
CBIS Global Funds plc
NOTES TO THE FINANCIAL STATEMENTS (continued)
26
13. Commitments and contingent liabilities
There were no significant commitments or contingent liabilities at the financial period end or at the previous
financial year end.
14. Significant events during the financial period
There were no significant events affecting the Company during the financial period.
15. Subsequent events
There were no significant subsequent events affecting the Company since the financial period end and up to the
date of approval of these financial statements, 21 August 2019.
16. Approval of financial statements
The financial statements were approved by the Directors on 21 August 2019.
CBIS Global Funds plc
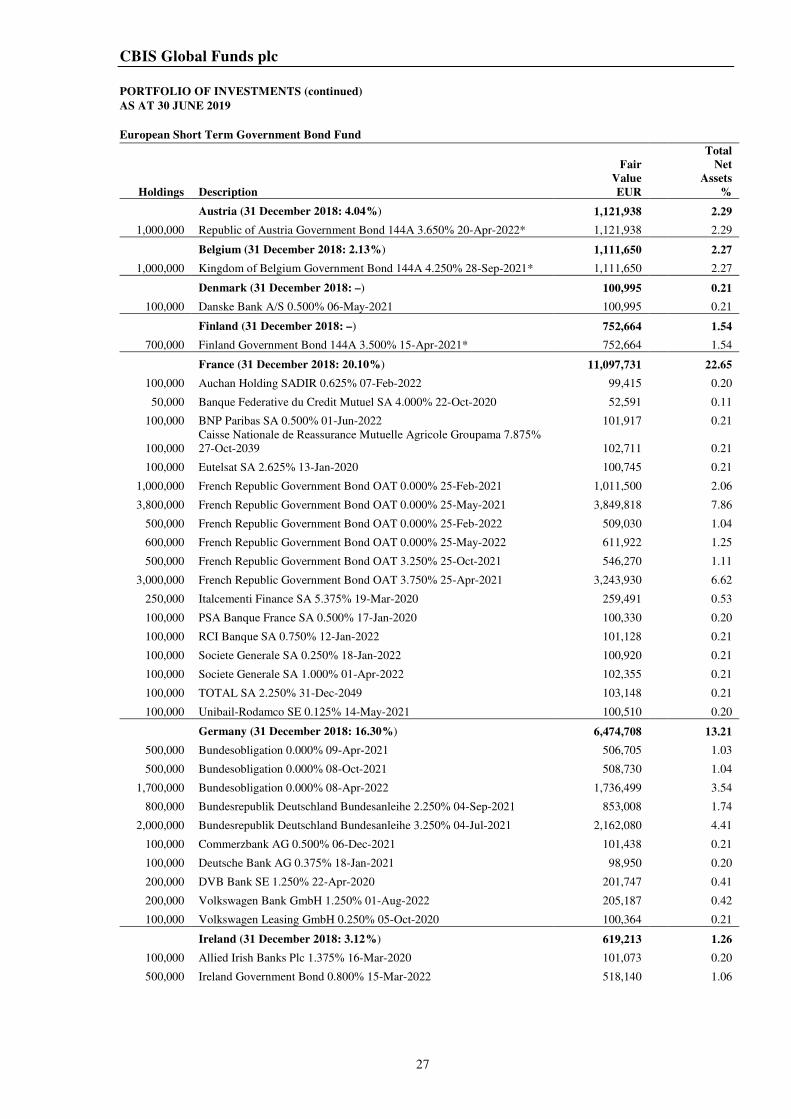
PORTFOLIO OF INVESTMENTS (continued)
AS AT 30 JUNE 2019
27
European Short Term Government Bond Fund
Holdings Description
Fair
Value
EUR
Total
Net
Assets
%
Austria (31 December 2018: 4.04%) 1,121,938 2.29
1,000,000 Republic of Austria Government Bond 144A 3.650% 20-Apr-2022* 1,121,938 2.29
Belgium (31 December 2018: 2.13%) 1,111,650 2.27
1,000,000 Kingdom of Belgium Government Bond 144A 4.250% 28-Sep-2021* 1,111,650 2.27
Denmark (31 December 2018: –) 100,995 0.21
100,000 Danske Bank A/S 0.500% 06-May-2021 100,995 0.21
Finland (31 December 2018: –) 752,664 1.54
700,000 Finland Government Bond 144A 3.500% 15-Apr-2021* 752,664 1.54
France (31 December 2018: 20.10%) 11,097,731 22.65
100,000 Auchan Holding SADIR 0.625% 07-Feb-2022 99,415 0.20
50,000 Banque Federative du Credit Mutuel SA 4.000% 22-Oct-2020 52,591 0.11
100,000 BNP Paribas SA 0.500% 01-Jun-2022 101,917 0.21
100,000
Caisse Nationale de Reassurance Mutuelle Agricole Groupama 7.875%
27-Oct-2039 102,711 0.21
100,000 Eutelsat SA 2.625% 13-Jan-2020 100,745 0.21
1,000,000 French Republic Government Bond OAT 0.000% 25-Feb-2021 1,011,500 2.06
3,800,000 French Republic Government Bond OAT 0.000% 25-May-2021 3,849,818 7.86
500,000 French Republic Government Bond OAT 0.000% 25-Feb-2022 509,030 1.04
600,000 French Republic Government Bond OAT 0.000% 25-May-2022 611,922 1.25
500,000 French Republic Government Bond OAT 3.250% 25-Oct-2021 546,270 1.11
3,000,000 French Republic Government Bond OAT 3.750% 25-Apr-2021 3,243,930 6.62
250,000 Italcementi Finance SA 5.375% 19-Mar-2020 259,491 0.53
100,000 PSA Banque France SA 0.500% 17-Jan-2020 100,330 0.20
100,000 RCI Banque SA 0.750% 12-Jan-2022 101,128 0.21
100,000 Societe Generale SA 0.250% 18-Jan-2022 100,920 0.21
100,000 Societe Generale SA 1.000% 01-Apr-2022 102,355 0.21
100,000 TOTAL SA 2.250% 31-Dec-2049 103,148 0.21
100,000 Unibail-Rodamco SE 0.125% 14-May-2021 100,510 0.20
Germany (31 December 2018: 16.30%) 6,474,708 13.21
500,000 Bundesobligation 0.000% 09-Apr-2021 506,705 1.03
500,000 Bundesobligation 0.000% 08-Oct-2021 508,730 1.04
1,700,000 Bundesobligation 0.000% 08-Apr-2022 1,736,499 3.54
800,000 Bundesrepublik Deutschland Bundesanleihe 2.250% 04-Sep-2021 853,008 1.74
2,000,000 Bundesrepublik Deutschland Bundesanleihe 3.250% 04-Jul-2021 2,162,080 4.41
100,000 Commerzbank AG 0.500% 06-Dec-2021 101,438 0.21
100,000 Deutsche Bank AG 0.375% 18-Jan-2021 98,950 0.20
200,000 DVB Bank SE 1.250% 22-Apr-2020 201,747 0.41
200,000 Volkswagen Bank GmbH 1.250% 01-Aug-2022 205,187 0.42
100,000 Volkswagen Leasing GmbH 0.250% 05-Oct-2020 100,364 0.21
Ireland (31 December 2018: 3.12%) 619,213 1.26
100,000 Allied Irish Banks Plc 1.375% 16-Mar-2020 101,073 0.20
500,000 Ireland Government Bond 0.800% 15-Mar-2022 518,140 1.06
CBIS Global Funds plc
PORTFOLIO OF INVESTMENTS (continued)
AS AT 30 JUNE 2019
28
European Short Term Government Bond Fund (continued)
Holdings Description
Fair
Value
EUR
Total
Net
Assets
%
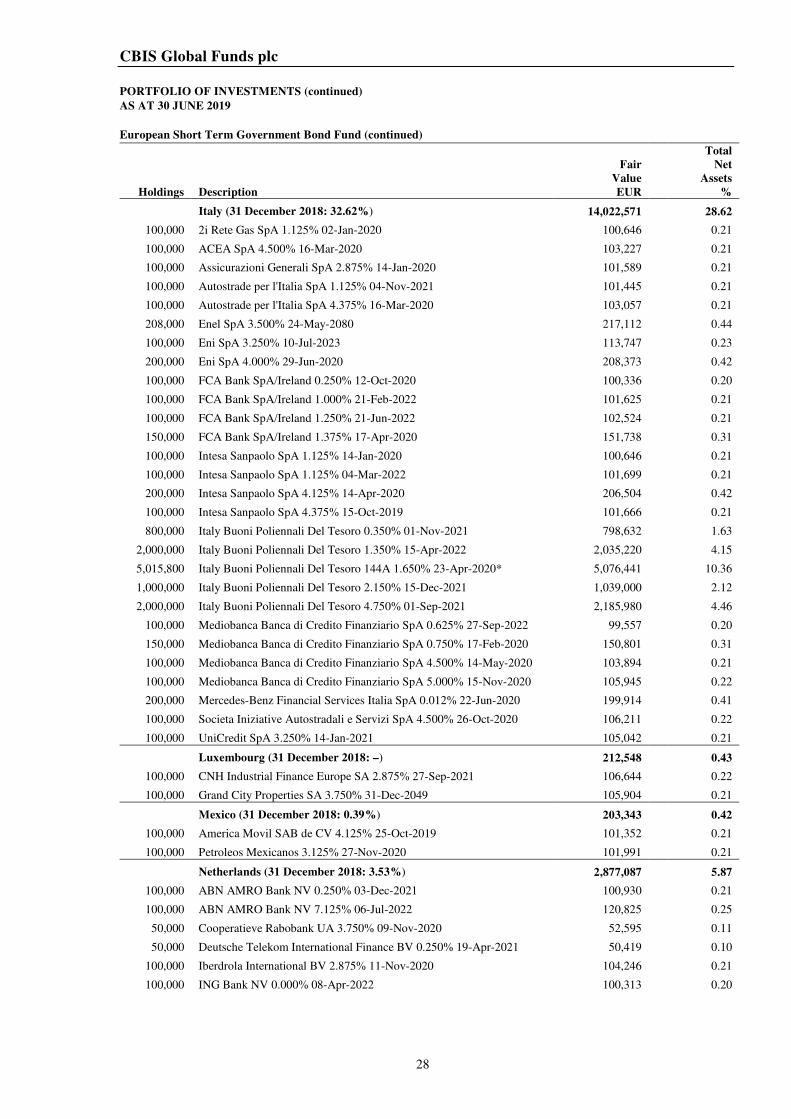
Italy (31 December 2018: 32.62%) 14,022,571 28.62
100,000 2i Rete Gas SpA 1.125% 02-Jan-2020 100,646 0.21
100,000 ACEA SpA 4.500% 16-Mar-2020 103,227 0.21
100,000 Assicurazioni Generali SpA 2.875% 14-Jan-2020 101,589 0.21
100,000 Autostrade per l'Italia SpA 1.125% 04-Nov-2021 101,445 0.21
100,000 Autostrade per l'Italia SpA 4.375% 16-Mar-2020 103,057 0.21
208,000 Enel SpA 3.500% 24-May-2080 217,112 0.44
100,000 Eni SpA 3.250% 10-Jul-2023 113,747 0.23
200,000 Eni SpA 4.000% 29-Jun-2020 208,373 0.42
100,000 FCA Bank SpA/Ireland 0.250% 12-Oct-2020 100,336 0.20
100,000 FCA Bank SpA/Ireland 1.000% 21-Feb-2022 101,625 0.21
100,000 FCA Bank SpA/Ireland 1.250% 21-Jun-2022 102,524 0.21
150,000 FCA Bank SpA/Ireland 1.375% 17-Apr-2020 151,738 0.31
100,000 Intesa Sanpaolo SpA 1.125% 14-Jan-2020 100,646 0.21
100,000 Intesa Sanpaolo SpA 1.125% 04-Mar-2022 101,699 0.21
200,000 Intesa Sanpaolo SpA 4.125% 14-Apr-2020 206,504 0.42
100,000 Intesa Sanpaolo SpA 4.375% 15-Oct-2019 101,666 0.21
800,000 Italy Buoni Poliennali Del Tesoro 0.350% 01-Nov-2021 798,632 1.63
2,000,000 Italy Buoni Poliennali Del Tesoro 1.350% 15-Apr-2022 2,035,220 4.15
5,015,800 Italy Buoni Poliennali Del Tesoro 144A 1.650% 23-Apr-2020* 5,076,441 10.36
1,000,000 Italy Buoni Poliennali Del Tesoro 2.150% 15-Dec-2021 1,039,000 2.12
2,000,000 Italy Buoni Poliennali Del Tesoro 4.750% 01-Sep-2021 2,185,980 4.46
100,000 Mediobanca Banca di Credito Finanziario SpA 0.625% 27-Sep-2022 99,557 0.20
150,000 Mediobanca Banca di Credito Finanziario SpA 0.750% 17-Feb-2020 150,801 0.31
100,000 Mediobanca Banca di Credito Finanziario SpA 4.500% 14-May-2020 103,894 0.21
100,000 Mediobanca Banca di Credito Finanziario SpA 5.000% 15-Nov-2020 105,945 0.22
200,000 Mercedes-Benz Financial Services Italia SpA 0.012% 22-Jun-2020 199,914 0.41
100,000 Societa Iniziative Autostradali e Servizi SpA 4.500% 26-Oct-2020 106,211 0.22
100,000 UniCredit SpA 3.250% 14-Jan-2021 105,042 0.21
Luxembourg (31 December 2018: –) 212,548 0.43
100,000 CNH Industrial Finance Europe SA 2.875% 27-Sep-2021 106,644 0.22
100,000 Grand City Properties SA 3.750% 31-Dec-2049 105,904 0.21
Mexico (31 December 2018: 0.39%) 203,343 0.42
100,000 America Movil SAB de CV 4.125% 25-Oct-2019 101,352 0.21
100,000 Petroleos Mexicanos 3.125% 27-Nov-2020 101,991 0.21
Netherlands (31 December 2018: 3.53%) 2,877,087 5.87
100,000 ABN AMRO Bank NV 0.250% 03-Dec-2021 100,930 0.21
100,000 ABN AMRO Bank NV 7.125% 06-Jul-2022 120,825 0.25
50,000 Cooperatieve Rabobank UA 3.750% 09-Nov-2020 52,595 0.11
50,000 Deutsche Telekom International Finance BV 0.250% 19-Apr-2021 50,419 0.10
100,000 Iberdrola International BV 2.875% 11-Nov-2020 104,246 0.21
100,000 ING Bank NV 0.000% 08-Apr-2022 100,313 0.20
CBIS Global Funds plc
PORTFOLIO OF INVESTMENTS (continued)
AS AT 30 JUNE 2019
29
European Short Term Government Bond Fund (continued)
Holdings Description
Fair
Value
EUR
Total
Net
Assets
%
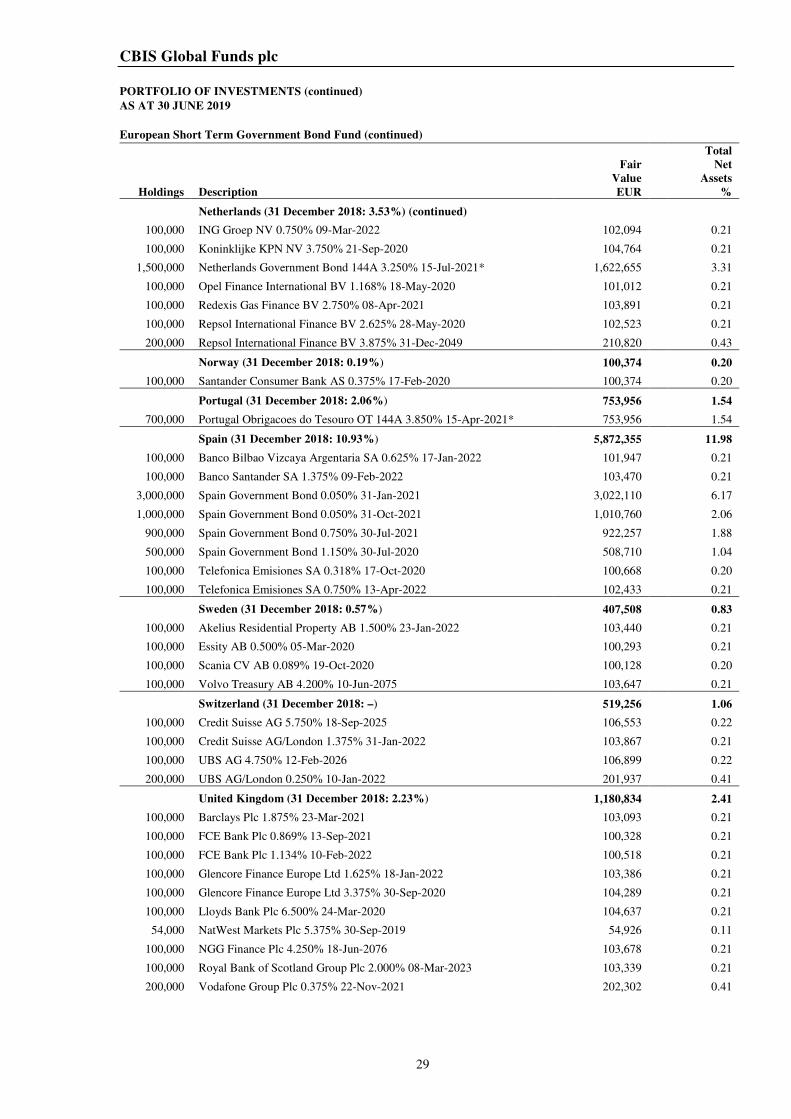
Netherlands (31 December 2018: 3.53%) (continued)
100,000 ING Groep NV 0.750% 09-Mar-2022 102,094 0.21
100,000 Koninklijke KPN NV 3.750% 21-Sep-2020 104,764 0.21
1,500,000 Netherlands Government Bond 144A 3.250% 15-Jul-2021* 1,622,655 3.31
100,000 Opel Finance International BV 1.168% 18-May-2020 101,012 0.21
100,000 Redexis Gas Finance BV 2.750% 08-Apr-2021 103,891 0.21
100,000 Repsol International Finance BV 2.625% 28-May-2020 102,523 0.21
200,000 Repsol International Finance BV 3.875% 31-Dec-2049 210,820 0.43
Norway (31 December 2018: 0.19%) 100,374 0.20
100,000 Santander Consumer Bank AS 0.375% 17-Feb-2020 100,374 0.20
Portugal (31 December 2018: 2.06%) 753,956 1.54
700,000 Portugal Obrigacoes do Tesouro OT 144A 3.850% 15-Apr-2021* 753,956 1.54
Spain (31 December 2018: 10.93%) 5,872,355 11.98
100,000 Banco Bilbao Vizcaya Argentaria SA 0.625% 17-Jan-2022 101,947 0.21
100,000 Banco Santander SA 1.375% 09-Feb-2022 103,470 0.21
3,000,000 Spain Government Bond 0.050% 31-Jan-2021 3,022,110 6.17
1,000,000 Spain Government Bond 0.050% 31-Oct-2021 1,010,760 2.06
900,000 Spain Government Bond 0.750% 30-Jul-2021 922,257 1.88
500,000 Spain Government Bond 1.150% 30-Jul-2020 508,710 1.04
100,000 Telefonica Emisiones SA 0.318% 17-Oct-2020 100,668 0.20
100,000 Telefonica Emisiones SA 0.750% 13-Apr-2022 102,433 0.21
Sweden (31 December 2018: 0.57%) 407,508 0.83
100,000 Akelius Residential Property AB 1.500% 23-Jan-2022 103,440 0.21
100,000 Essity AB 0.500% 05-Mar-2020 100,293 0.21
100,000 Scania CV AB 0.089% 19-Oct-2020 100,128 0.20
100,000 Volvo Treasury AB 4.200% 10-Jun-2075 103,647 0.21
Switzerland (31 December 2018: –) 519,256 1.06
100,000 Credit Suisse AG 5.750% 18-Sep-2025 106,553 0.22
100,000 Credit Suisse AG/London 1.375% 31-Jan-2022 103,867 0.21
100,000 UBS AG 4.750% 12-Feb-2026 106,899 0.22
200,000 UBS AG/London 0.250% 10-Jan-2022 201,937 0.41
United Kingdom (31 December 2018: 2.23%) 1,180,834 2.41
100,000 Barclays Plc 1.875% 23-Mar-2021 103,093 0.21
100,000 FCE Bank Plc 0.869% 13-Sep-2021 100,328 0.21
100,000 FCE Bank Plc 1.134% 10-Feb-2022 100,518 0.21
100,000 Glencore Finance Europe Ltd 1.625% 18-Jan-2022 103,386 0.21
100,000 Glencore Finance Europe Ltd 3.375% 30-Sep-2020 104,289 0.21
100,000 Lloyds Bank Plc 6.500% 24-Mar-2020 104,637 0.21
54,000 NatWest Markets Plc 5.375% 30-Sep-2019 54,926 0.11
100,000 NGG Finance Plc 4.250% 18-Jun-2076 103,678 0.21
100,000 Royal Bank of Scotland Group Plc 2.000% 08-Mar-2023 103,339 0.21
200,000 Vodafone Group Plc 0.375% 22-Nov-2021 202,302 0.41
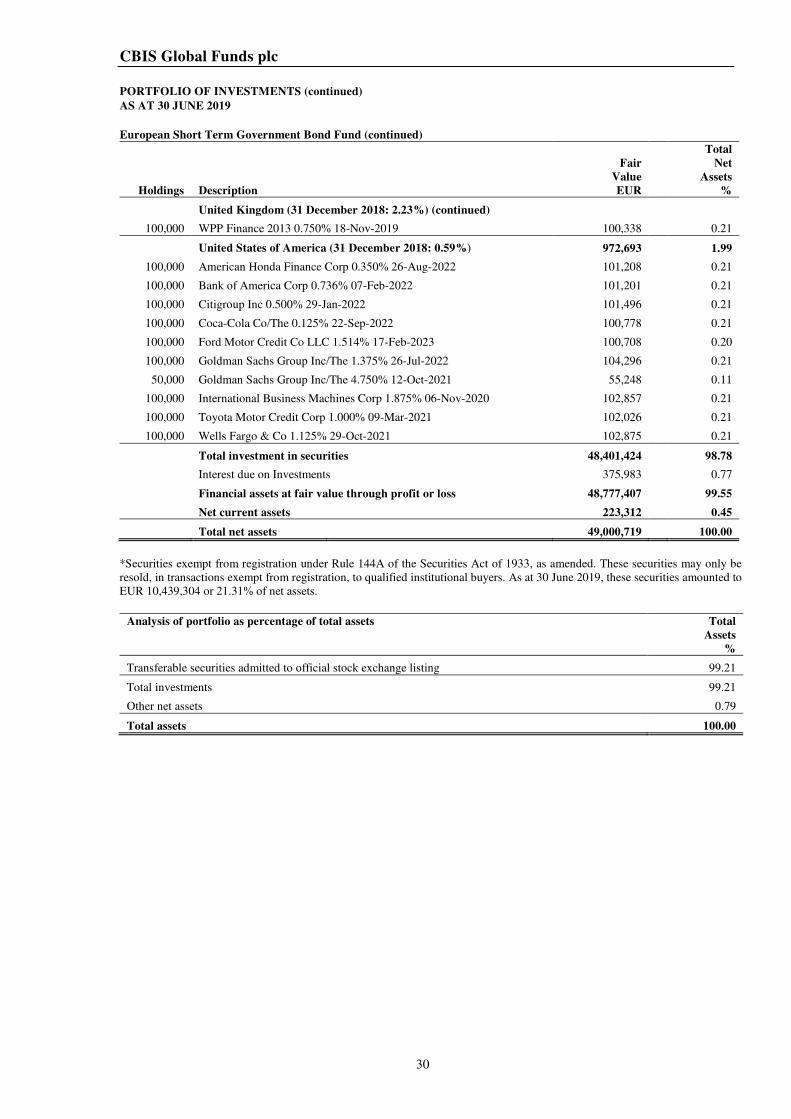
CBIS Global Funds plc
PORTFOLIO OF INVESTMENTS (continued)
AS AT 30 JUNE 2019
30
European Short Term Government Bond Fund (continued)
Holdings Description
Fair
Value
EUR
Total
Net
Assets
%
United Kingdom (31 December 2018: 2.23%) (continued)
100,000 WPP Finance 2013 0.750% 18-Nov-2019 100,338 0.21
United States of America (31 December 2018: 0.59%) 972,693 1.99
100,000 American Honda Finance Corp 0.350% 26-Aug-2022 101,208 0.21
100,000 Bank of America Corp 0.736% 07-Feb-2022 101,201 0.21
100,000 Citigroup Inc 0.500% 29-Jan-2022 101,496 0.21
100,000 Coca-Cola Co/The 0.125% 22-Sep-2022 100,778 0.21
100,000 Ford Motor Credit Co LLC 1.514% 17-Feb-2023 100,708 0.20
100,000 Goldman Sachs Group Inc/The 1.375% 26-Jul-2022 104,296 0.21
50,000 Goldman Sachs Group Inc/The 4.750% 12-Oct-2021 55,248 0.11
100,000 International Business Machines Corp 1.875% 06-Nov-2020 102,857 0.21
100,000 Toyota Motor Credit Corp 1.000% 09-Mar-2021 102,026 0.21
100,000 Wells Fargo & Co 1.125% 29-Oct-2021 102,875 0.21
Total investment in securities 48,401,424 98.78
Interest due on Investments 375,983 0.77
Financial assets at fair value through profit or loss 48,777,407 99.55
Net current assets 223,312 0.45
Total net assets 49,000,719 100.00
*Securities exempt from registration under Rule 144A of the Securities Act of 1933, as amended. These securities may only be
resold, in transactions exempt from registration, to qualified institutional buyers. As at 30 June 2019, these securities amounted to
EUR 10,439,304 or 21.31% of net assets.
Analysis of portfolio as percentage of total assets Total
Assets
%
Transferable securities admitted to official stock exchange listing 99.21
Total investments 99.21
Other net assets 0.79
Total assets 100.00
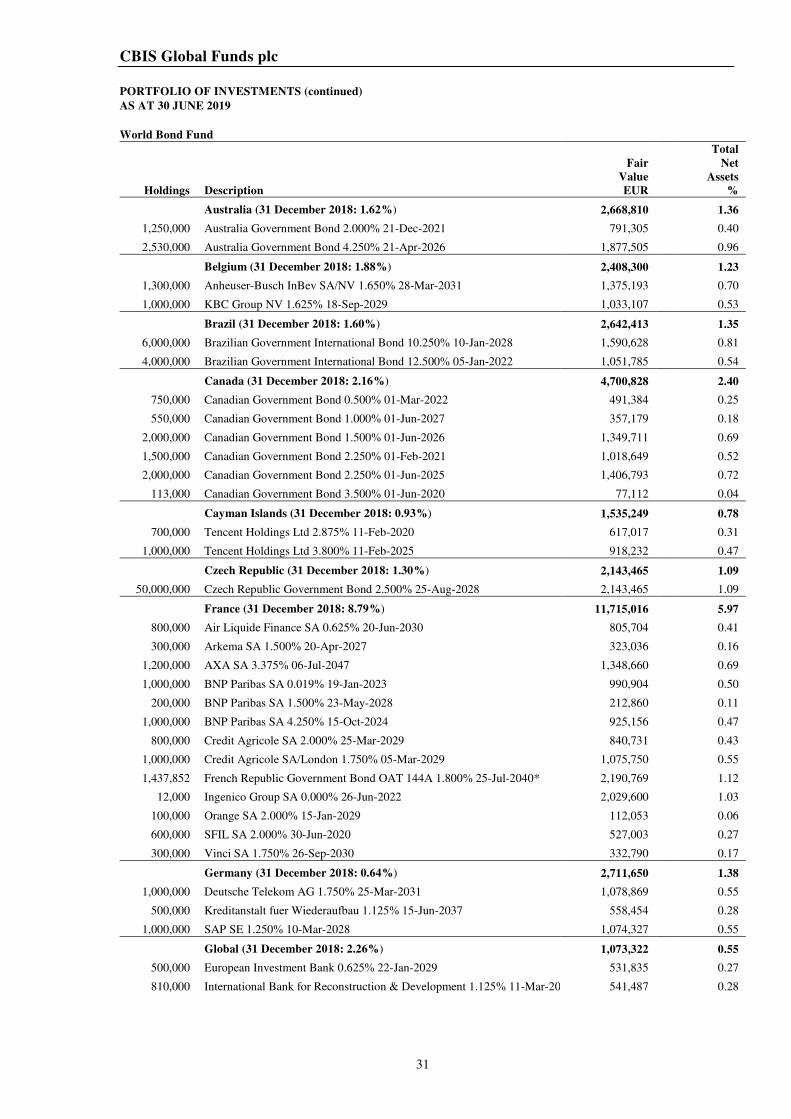
CBIS Global Funds plc
PORTFOLIO OF INVESTMENTS (continued)
AS AT 30 JUNE 2019
31
World Bond Fund
Holdings Description
Fair
Value
EUR
Total
Net
Assets
%
Australia (31 December 2018: 1.62%) 2,668,810 1.36
1,250,000 Australia Government Bond 2.000% 21-Dec-2021 791,305 0.40
2,530,000 Australia Government Bond 4.250% 21-Apr-2026 1,877,505 0.96
Belgium (31 December 2018: 1.88%) 2,408,300 1.23
1,300,000 Anheuser-Busch InBev SA/NV 1.650% 28-Mar-2031 1,375,193 0.70
1,000,000 KBC Group NV 1.625% 18-Sep-2029 1,033,107 0.53
Brazil (31 December 2018: 1.60%) 2,642,413 1.35
6,000,000 Brazilian Government International Bond 10.250% 10-Jan-2028 1,590,628 0.81
4,000,000 Brazilian Government International Bond 12.500% 05-Jan-2022 1,051,785 0.54
Canada (31 December 2018: 2.16%) 4,700,828 2.40
750,000 Canadian Government Bond 0.500% 01-Mar-2022 491,384 0.25
550,000 Canadian Government Bond 1.000% 01-Jun-2027 357,179 0.18
2,000,000 Canadian Government Bond 1.500% 01-Jun-2026 1,349,711 0.69
1,500,000 Canadian Government Bond 2.250% 01-Feb-2021 1,018,649 0.52
2,000,000 Canadian Government Bond 2.250% 01-Jun-2025 1,406,793 0.72
113,000 Canadian Government Bond 3.500% 01-Jun-2020 77,112 0.04
Cayman Islands (31 December 2018: 0.93%) 1,535,249 0.78
700,000 Tencent Holdings Ltd 2.875% 11-Feb-2020 617,017 0.31
1,000,000 Tencent Holdings Ltd 3.800% 11-Feb-2025 918,232 0.47
Czech Republic (31 December 2018: 1.30%) 2,143,465 1.09
50,000,000 Czech Republic Government Bond 2.500% 25-Aug-2028 2,143,465 1.09
France (31 December 2018: 8.79%) 11,715,016 5.97
800,000 Air Liquide Finance SA 0.625% 20-Jun-2030 805,704 0.41
300,000 Arkema SA 1.500% 20-Apr-2027 323,036 0.16
1,200,000 AXA SA 3.375% 06-Jul-2047 1,348,660 0.69
1,000,000 BNP Paribas SA 0.019% 19-Jan-2023 990,904 0.50
200,000 BNP Paribas SA 1.500% 23-May-2028 212,860 0.11
1,000,000 BNP Paribas SA 4.250% 15-Oct-2024 925,156 0.47
800,000 Credit Agricole SA 2.000% 25-Mar-2029 840,731 0.43
1,000,000 Credit Agricole SA/London 1.750% 05-Mar-2029 1,075,750 0.55
1,437,852 French Republic Government Bond OAT 144A 1.800% 25-Jul-2040* 2,190,769 1.12
12,000 Ingenico Group SA 0.000% 26-Jun-2022 2,029,600 1.03
100,000 Orange SA 2.000% 15-Jan-2029 112,053 0.06
600,000 SFIL SA 2.000% 30-Jun-2020 527,003 0.27
300,000 Vinci SA 1.750% 26-Sep-2030 332,790 0.17
Germany (31 December 2018: 0.64%) 2,711,650 1.38
1,000,000 Deutsche Telekom AG 1.750% 25-Mar-2031 1,078,869 0.55
500,000 Kreditanstalt fuer Wiederaufbau 1.125% 15-Jun-2037 558,454 0.28
1,000,000 SAP SE 1.250% 10-Mar-2028 1,074,327 0.55
Global (31 December 2018: 2.26%) 1,073,322 0.55
500,000 European Investment Bank 0.625% 22-Jan-2029 531,835 0.27
810,000 International Bank for Reconstruction & Development 1.125% 11-Mar-2020 541,487 0.28
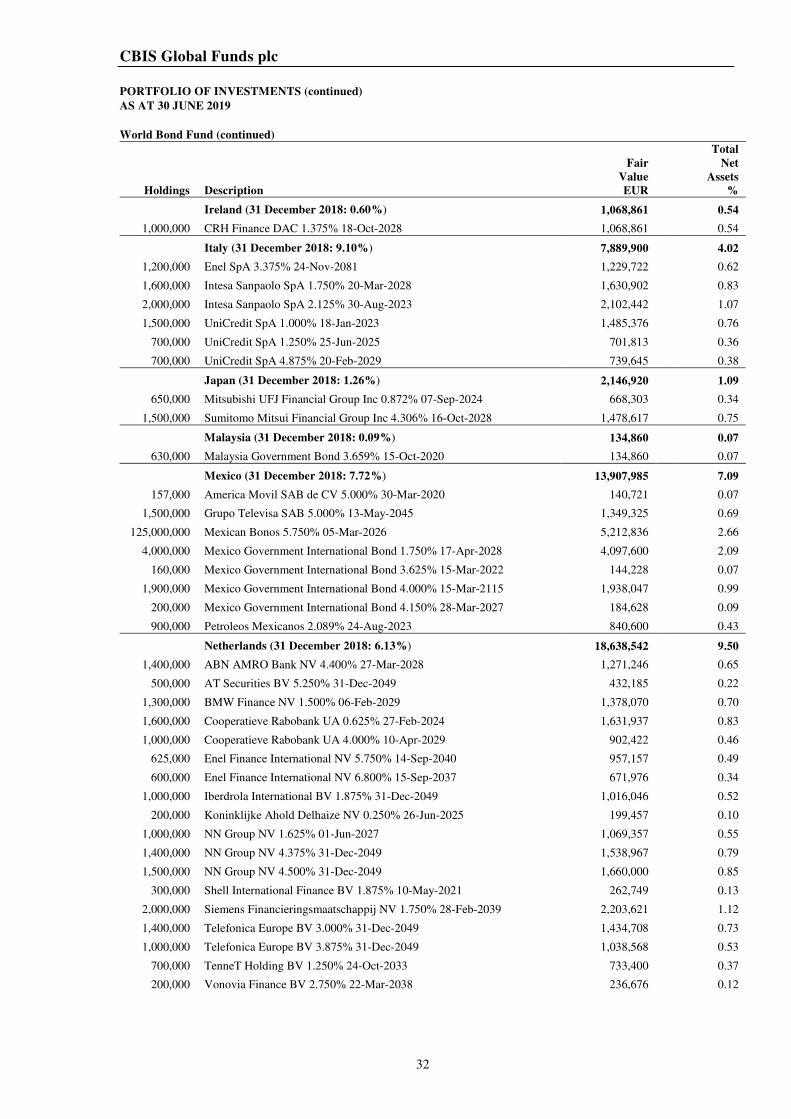
CBIS Global Funds plc
PORTFOLIO OF INVESTMENTS (continued)
AS AT 30 JUNE 2019
32
World Bond Fund (continued)
Holdings Description
Fair
Value
EUR
Total
Net
Assets
%
Ireland (31 December 2018: 0.60%) 1,068,861 0.54
1,000,000 CRH Finance DAC 1.375% 18-Oct-2028 1,068,861 0.54
Italy (31 December 2018: 9.10%) 7,889,900 4.02
1,200,000 Enel SpA 3.375% 24-Nov-2081 1,229,722 0.62
1,600,000 Intesa Sanpaolo SpA 1.750% 20-Mar-2028 1,630,902 0.83
2,000,000 Intesa Sanpaolo SpA 2.125% 30-Aug-2023 2,102,442 1.07
1,500,000 UniCredit SpA 1.000% 18-Jan-2023 1,485,376 0.76
700,000 UniCredit SpA 1.250% 25-Jun-2025 701,813 0.36
700,000 UniCredit SpA 4.875% 20-Feb-2029 739,645 0.38
Japan (31 December 2018: 1.26%) 2,146,920 1.09
650,000 Mitsubishi UFJ Financial Group Inc 0.872% 07-Sep-2024 668,303 0.34
1,500,000 Sumitomo Mitsui Financial Group Inc 4.306% 16-Oct-2028 1,478,617 0.75
Malaysia (31 December 2018: 0.09%) 134,860 0.07
630,000 Malaysia Government Bond 3.659% 15-Oct-2020 134,860 0.07
Mexico (31 December 2018: 7.72%) 13,907,985 7.09
157,000 America Movil SAB de CV 5.000% 30-Mar-2020 140,721 0.07
1,500,000 Grupo Televisa SAB 5.000% 13-May-2045 1,349,325 0.69
125,000,000 Mexican Bonos 5.750% 05-Mar-2026 5,212,836 2.66
4,000,000 Mexico Government International Bond 1.750% 17-Apr-2028 4,097,600 2.09
160,000 Mexico Government International Bond 3.625% 15-Mar-2022 144,228 0.07
1,900,000 Mexico Government International Bond 4.000% 15-Mar-2115 1,938,047 0.99
200,000 Mexico Government International Bond 4.150% 28-Mar-2027 184,628 0.09
900,000 Petroleos Mexicanos 2.089% 24-Aug-2023 840,600 0.43
Netherlands (31 December 2018: 6.13%) 18,638,542 9.50
1,400,000 ABN AMRO Bank NV 4.400% 27-Mar-2028 1,271,246 0.65
500,000 AT Securities BV 5.250% 31-Dec-2049 432,185 0.22
1,300,000 BMW Finance NV 1.500% 06-Feb-2029 1,378,070 0.70
1,600,000 Cooperatieve Rabobank UA 0.625% 27-Feb-2024 1,631,937 0.83
1,000,000 Cooperatieve Rabobank UA 4.000% 10-Apr-2029 902,422 0.46
625,000 Enel Finance International NV 5.750% 14-Sep-2040 957,157 0.49
600,000 Enel Finance International NV 6.800% 15-Sep-2037 671,976 0.34
1,000,000 Iberdrola International BV 1.875% 31-Dec-2049 1,016,046 0.52
200,000 Koninklijke Ahold Delhaize NV 0.250% 26-Jun-2025 199,457 0.10
1,000,000 NN Group NV 1.625% 01-Jun-2027 1,069,357 0.55
1,400,000 NN Group NV 4.375% 31-Dec-2049 1,538,967 0.79
1,500,000 NN Group NV 4.500% 31-Dec-2049 1,660,000 0.85
300,000 Shell International Finance BV 1.875% 10-May-2021 262,749 0.13
2,000,000 Siemens Financieringsmaatschappij NV 1.750% 28-Feb-2039 2,203,621 1.12
1,400,000 Telefonica Europe BV 3.000% 31-Dec-2049 1,434,708 0.73
1,000,000 Telefonica Europe BV 3.875% 31-Dec-2049 1,038,568 0.53
700,000 TenneT Holding BV 1.250% 24-Oct-2033 733,400 0.37
200,000 Vonovia Finance BV 2.750% 22-Mar-2038 236,676 0.12
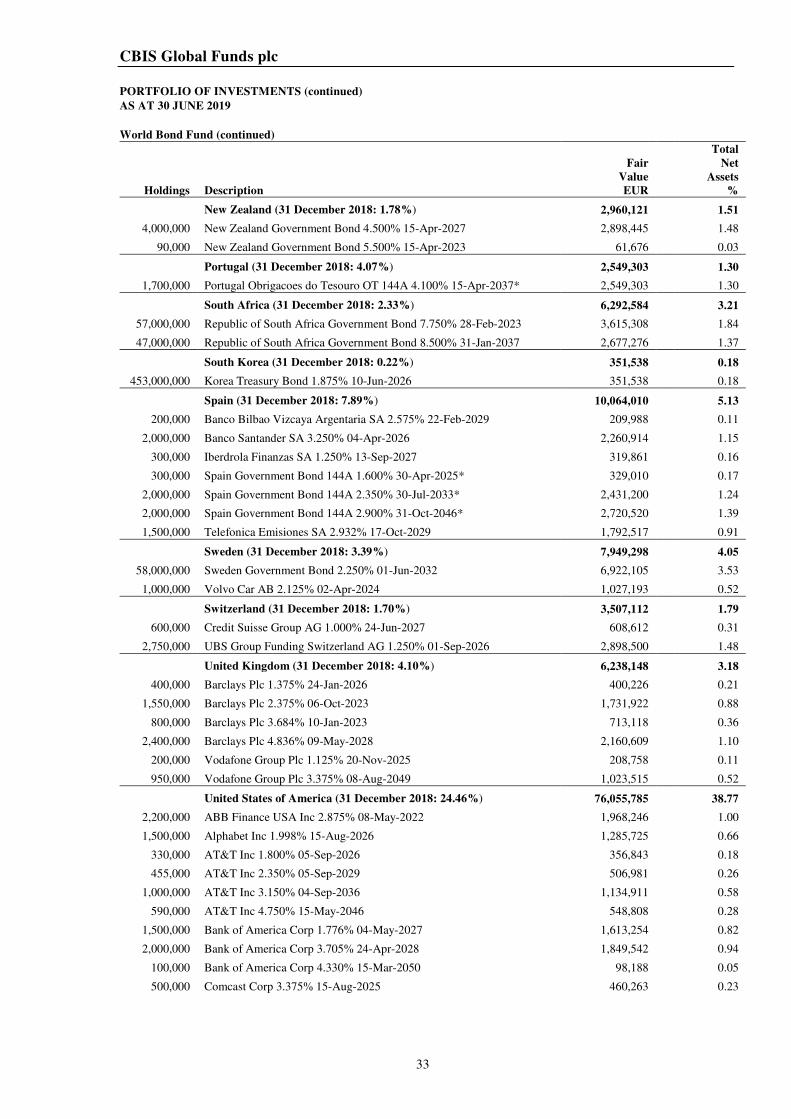
CBIS Global Funds plc
PORTFOLIO OF INVESTMENTS (continued)
AS AT 30 JUNE 2019
33
World Bond Fund (continued)
Holdings Description
Fair
Value
EUR
Total
Net
Assets
%
New Zealand (31 December 2018: 1.78%) 2,960,121 1.51
4,000,000 New Zealand Government Bond 4.500% 15-Apr-2027 2,898,445 1.48
90,000 New Zealand Government Bond 5.500% 15-Apr-2023 61,676 0.03
Portugal (31 December 2018: 4.07%) 2,549,303 1.30
1,700,000 Portugal Obrigacoes do Tesouro OT 144A 4.100% 15-Apr-2037* 2,549,303 1.30
South Africa (31 December 2018: 2.33%) 6,292,584 3.21
57,000,000 Republic of South Africa Government Bond 7.750% 28-Feb-2023 3,615,308 1.84
47,000,000 Republic of South Africa Government Bond 8.500% 31-Jan-2037 2,677,276 1.37
South Korea (31 December 2018: 0.22%) 351,538 0.18
453,000,000 Korea Treasury Bond 1.875% 10-Jun-2026 351,538 0.18
Spain (31 December 2018: 7.89%) 10,064,010 5.13
200,000 Banco Bilbao Vizcaya Argentaria SA 2.575% 22-Feb-2029 209,988 0.11
2,000,000 Banco Santander SA 3.250% 04-Apr-2026 2,260,914 1.15
300,000 Iberdrola Finanzas SA 1.250% 13-Sep-2027 319,861 0.16
300,000 Spain Government Bond 144A 1.600% 30-Apr-2025* 329,010 0.17
2,000,000 Spain Government Bond 144A 2.350% 30-Jul-2033* 2,431,200 1.24
2,000,000 Spain Government Bond 144A 2.900% 31-Oct-2046* 2,720,520 1.39
1,500,000 Telefonica Emisiones SA 2.932% 17-Oct-2029 1,792,517 0.91
Sweden (31 December 2018: 3.39%) 7,949,298 4.05
58,000,000 Sweden Government Bond 2.250% 01-Jun-2032 6,922,105 3.53
1,000,000 Volvo Car AB 2.125% 02-Apr-2024 1,027,193 0.52
Switzerland (31 December 2018: 1.70%) 3,507,112 1.79
600,000 Credit Suisse Group AG 1.000% 24-Jun-2027 608,612 0.31
2,750,000 UBS Group Funding Switzerland AG 1.250% 01-Sep-2026 2,898,500 1.48
United Kingdom (31 December 2018: 4.10%) 6,238,148 3.18
400,000 Barclays Plc 1.375% 24-Jan-2026 400,226 0.21
1,550,000 Barclays Plc 2.375% 06-Oct-2023 1,731,922 0.88
800,000 Barclays Plc 3.684% 10-Jan-2023 713,118 0.36
2,400,000 Barclays Plc 4.836% 09-May-2028 2,160,609 1.10
200,000 Vodafone Group Plc 1.125% 20-Nov-2025 208,758 0.11
950,000 Vodafone Group Plc 3.375% 08-Aug-2049 1,023,515 0.52
United States of America (31 December 2018: 24.46%) 76,055,785 38.77
2,200,000 ABB Finance USA Inc 2.875% 08-May-2022 1,968,246 1.00
1,500,000 Alphabet Inc 1.998% 15-Aug-2026 1,285,725 0.66
330,000 AT&T Inc 1.800% 05-Sep-2026 356,843 0.18
455,000 AT&T Inc 2.350% 05-Sep-2029 506,981 0.26
1,000,000 AT&T Inc 3.150% 04-Sep-2036 1,134,911 0.58
590,000 AT&T Inc 4.750% 15-May-2046 548,808 0.28
1,500,000 Bank of America Corp 1.776% 04-May-2027 1,613,254 0.82
2,000,000 Bank of America Corp 3.705% 24-Apr-2028 1,849,542 0.94
100,000 Bank of America Corp 4.330% 15-Mar-2050 98,188 0.05
500,000 Comcast Corp 3.375% 15-Aug-2025 460,263 0.23
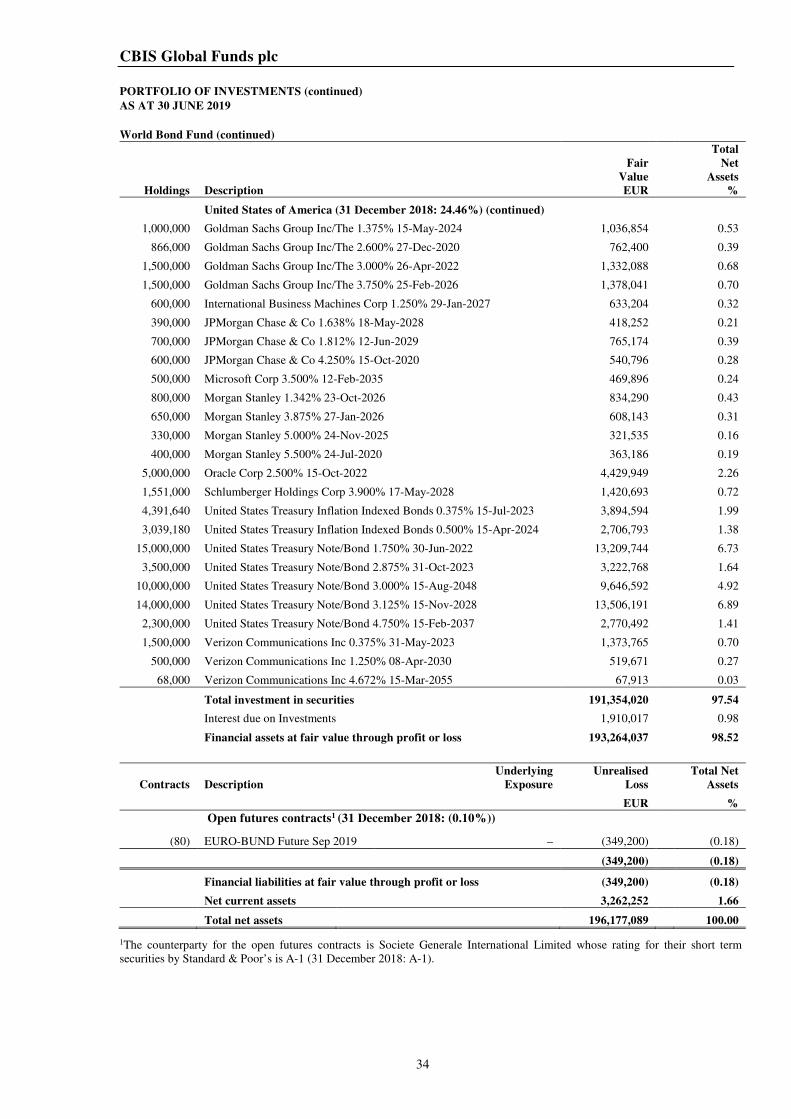
CBIS Global Funds plc
PORTFOLIO OF INVESTMENTS (continued)
AS AT 30 JUNE 2019
34
World Bond Fund (continued)
Holdings Description
Fair
Value
EUR
Total
Net
Assets
%
United States of America (31 December 2018: 24.46%) (continued)
1,000,000 Goldman Sachs Group Inc/The 1.375% 15-May-2024 1,036,854 0.53
866,000 Goldman Sachs Group Inc/The 2.600% 27-Dec-2020 762,400 0.39
1,500,000 Goldman Sachs Group Inc/The 3.000% 26-Apr-2022 1,332,088 0.68
1,500,000 Goldman Sachs Group Inc/The 3.750% 25-Feb-2026 1,378,041 0.70
600,000 International Business Machines Corp 1.250% 29-Jan-2027 633,204 0.32
390,000 JPMorgan Chase & Co 1.638% 18-May-2028 418,252 0.21
700,000 JPMorgan Chase & Co 1.812% 12-Jun-2029 765,174 0.39
600,000 JPMorgan Chase & Co 4.250% 15-Oct-2020 540,796 0.28
500,000 Microsoft Corp 3.500% 12-Feb-2035 469,896 0.24
800,000 Morgan Stanley 1.342% 23-Oct-2026 834,290 0.43
650,000 Morgan Stanley 3.875% 27-Jan-2026 608,143 0.31
330,000 Morgan Stanley 5.000% 24-Nov-2025 321,535 0.16
400,000 Morgan Stanley 5.500% 24-Jul-2020 363,186 0.19
5,000,000 Oracle Corp 2.500% 15-Oct-2022 4,429,949 2.26
1,551,000 Schlumberger Holdings Corp 3.900% 17-May-2028 1,420,693 0.72
4,391,640 United States Treasury Inflation Indexed Bonds 0.375% 15-Jul-2023 3,894,594 1.99
3,039,180 United States Treasury Inflation Indexed Bonds 0.500% 15-Apr-2024 2,706,793 1.38
15,000,000 United States Treasury Note/Bond 1.750% 30-Jun-2022 13,209,744 6.73
3,500,000 United States Treasury Note/Bond 2.875% 31-Oct-2023 3,222,768 1.64
10,000,000 United States Treasury Note/Bond 3.000% 15-Aug-2048 9,646,592 4.92
14,000,000 United States Treasury Note/Bond 3.125% 15-Nov-2028 13,506,191 6.89
2,300,000 United States Treasury Note/Bond 4.750% 15-Feb-2037 2,770,492 1.41
1,500,000 Verizon Communications Inc 0.375% 31-May-2023 1,373,765 0.70
500,000 Verizon Communications Inc 1.250% 08-Apr-2030 519,671 0.27
68,000 Verizon Communications Inc 4.672% 15-Mar-2055 67,913 0.03
Total investment in securities 191,354,020 97.54
Interest due on Investments 1,910,017 0.98
Financial assets at fair value through profit or loss 193,264,037 98.52
Contracts Description
Underlying
Exposure
Unrealised
Loss
Total Net
Assets
EUR %
Open futures contracts1 (31 December 2018: (0.10%))
(80) EURO-BUND Future Sep 2019 – (349,200) (0.18)
(349,200) (0.18)
Financial liabilities at fair value through profit or loss (349,200) (0.18)
Net current assets 3,262,252 1.66
Total net assets 196,177,089 100.00 1The counterparty for the open futures contracts is Societe Generale International Limited whose rating for their short term
securities by Standard & Poor’s is A-1 (31 December 2018: A-1).
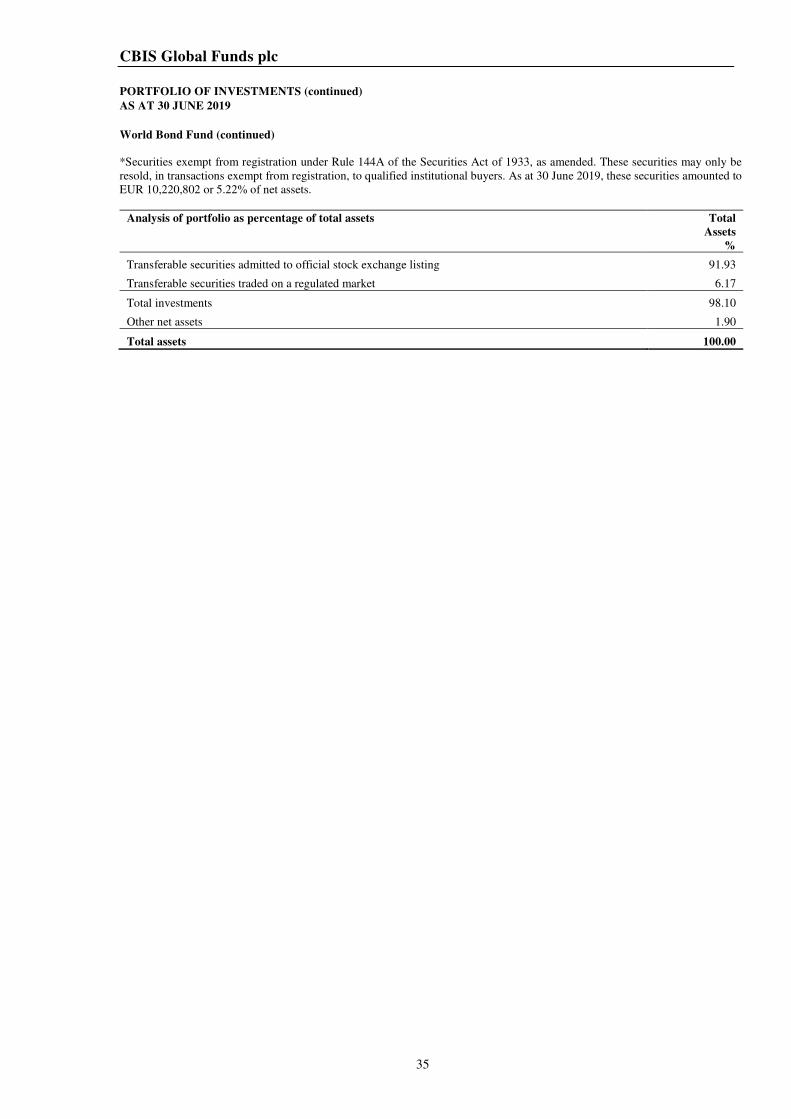
CBIS Global Funds plc
PORTFOLIO OF INVESTMENTS (continued)
AS AT 30 JUNE 2019
35
World Bond Fund (continued)
*Securities exempt from registration under Rule 144A of the Securities Act of 1933, as amended. These securities may only be
resold, in transactions exempt from registration, to qualified institutional buyers. As at 30 June 2019, these securities amounted to
EUR 10,220,802 or 5.22% of net assets.
Analysis of portfolio as percentage of total assets Total
Assets
%
Transferable securities admitted to official stock exchange listing 91.93
Transferable securities traded on a regulated market 6.17
Total investments 98.10
Other net assets 1.90
Total assets 100.00
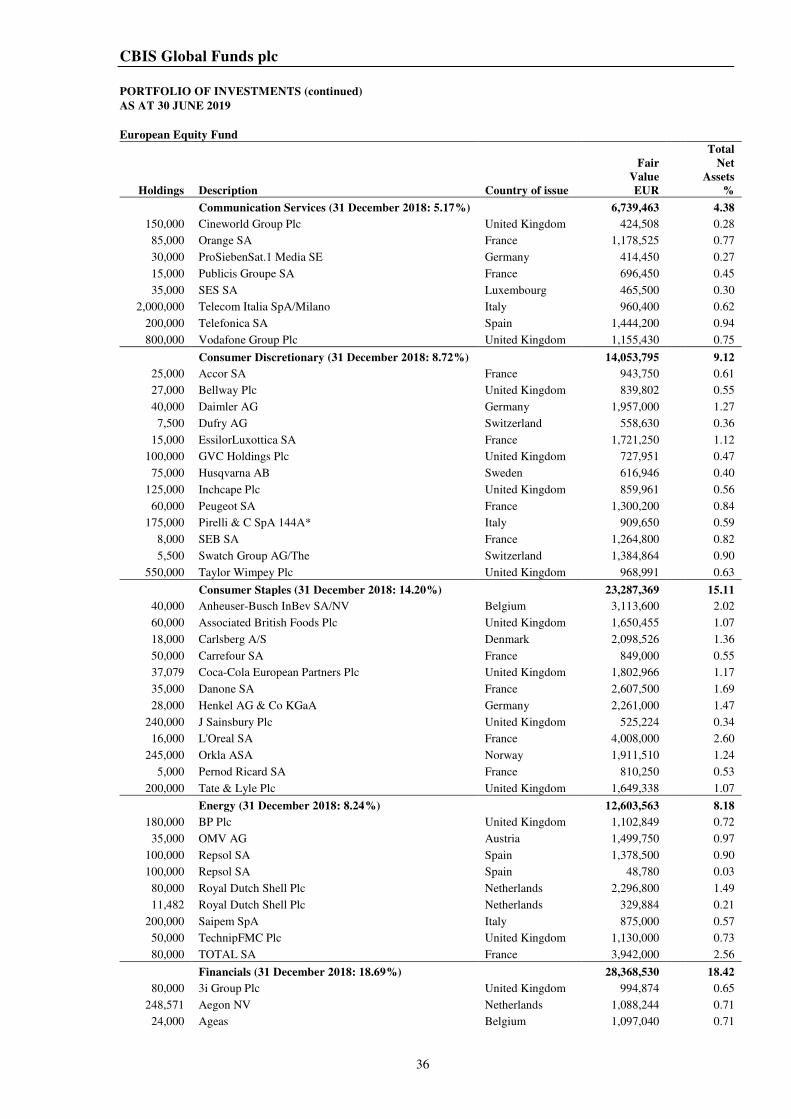
CBIS Global Funds plc
PORTFOLIO OF INVESTMENTS (continued)
AS AT 30 JUNE 2019
36
European Equity Fund
Holdings Description Country of issue
Fair
Value
EUR
Total
Net
Assets
%
Communication Services (31 December 2018: 5.17%) 6,739,463 4.38
150,000 Cineworld Group Plc United Kingdom 424,508 0.28
85,000 Orange SA France 1,178,525 0.77
30,000 ProSiebenSat.1 Media SE Germany 414,450 0.27
15,000 Publicis Groupe SA France 696,450 0.45
35,000 SES SA Luxembourg 465,500 0.30
2,000,000 Telecom Italia SpA/Milano Italy 960,400 0.62
200,000 Telefonica SA Spain 1,444,200 0.94
800,000 Vodafone Group Plc United Kingdom 1,155,430 0.75
Consumer Discretionary (31 December 2018: 8.72%) 14,053,795 9.12
25,000 Accor SA France 943,750 0.61
27,000 Bellway Plc United Kingdom 839,802 0.55
40,000 Daimler AG Germany 1,957,000 1.27
7,500 Dufry AG Switzerland 558,630 0.36
15,000 EssilorLuxottica SA France 1,721,250 1.12
100,000 GVC Holdings Plc United Kingdom 727,951 0.47
75,000 Husqvarna AB Sweden 616,946 0.40
125,000 Inchcape Plc United Kingdom 859,961 0.56
60,000 Peugeot SA France 1,300,200 0.84
175,000 Pirelli & C SpA 144A* Italy 909,650 0.59
8,000 SEB SA France 1,264,800 0.82
5,500 Swatch Group AG/The Switzerland 1,384,864 0.90
550,000 Taylor Wimpey Plc United Kingdom 968,991 0.63
Consumer Staples (31 December 2018: 14.20%) 23,287,369 15.11
40,000 Anheuser-Busch InBev SA/NV Belgium 3,113,600 2.02
60,000 Associated British Foods Plc United Kingdom 1,650,455 1.07
18,000 Carlsberg A/S Denmark 2,098,526 1.36
50,000 Carrefour SA France 849,000 0.55
37,079 Coca-Cola European Partners Plc United Kingdom 1,802,966 1.17
35,000 Danone SA France 2,607,500 1.69
28,000 Henkel AG & Co KGaA Germany 2,261,000 1.47
240,000 J Sainsbury Plc United Kingdom 525,224 0.34
16,000 L'Oreal SA France 4,008,000 2.60
245,000 Orkla ASA Norway 1,911,510 1.24
5,000 Pernod Ricard SA France 810,250 0.53
200,000 Tate & Lyle Plc United Kingdom 1,649,338 1.07
Energy (31 December 2018: 8.24%) 12,603,563 8.18
180,000 BP Plc United Kingdom 1,102,849 0.72
35,000 OMV AG Austria 1,499,750 0.97
100,000 Repsol SA Spain 1,378,500 0.90
100,000 Repsol SA Spain 48,780 0.03
80,000 Royal Dutch Shell Plc Netherlands 2,296,800 1.49
11,482 Royal Dutch Shell Plc Netherlands 329,884 0.21
200,000 Saipem SpA Italy 875,000 0.57
50,000 TechnipFMC Plc United Kingdom 1,130,000 0.73
80,000 TOTAL SA France 3,942,000 2.56
Financials (31 December 2018: 18.69%) 28,368,530 18.42
80,000 3i Group Plc United Kingdom 994,874 0.65
248,571 Aegon NV Netherlands 1,088,244 0.71
24,000 Ageas Belgium 1,097,040 0.71
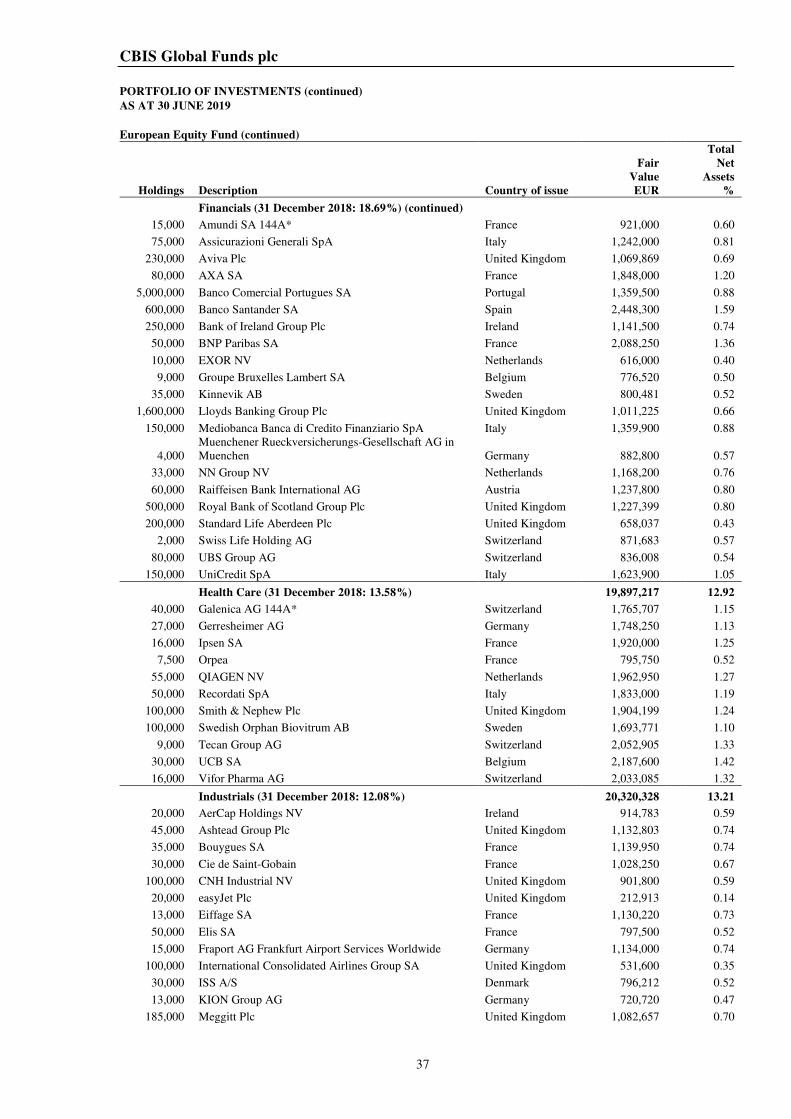
CBIS Global Funds plc
PORTFOLIO OF INVESTMENTS (continued)
AS AT 30 JUNE 2019
37
European Equity Fund (continued)
Holdings Description Country of issue
Fair
Value
EUR
Total
Net
Assets
%
Financials (31 December 2018: 18.69%) (continued)
15,000 Amundi SA 144A* France 921,000 0.60
75,000 Assicurazioni Generali SpA Italy 1,242,000 0.81
230,000 Aviva Plc United Kingdom 1,069,869 0.69
80,000 AXA SA France 1,848,000 1.20
5,000,000 Banco Comercial Portugues SA Portugal 1,359,500 0.88
600,000 Banco Santander SA Spain 2,448,300 1.59
250,000 Bank of Ireland Group Plc Ireland 1,141,500 0.74
50,000 BNP Paribas SA France 2,088,250 1.36
10,000 EXOR NV Netherlands 616,000 0.40
9,000 Groupe Bruxelles Lambert SA Belgium 776,520 0.50
35,000 Kinnevik AB Sweden 800,481 0.52
1,600,000 Lloyds Banking Group Plc United Kingdom 1,011,225 0.66
150,000 Mediobanca Banca di Credito Finanziario SpA Italy 1,359,900 0.88
4,000
Muenchener Rueckversicherungs-Gesellschaft AG in
Muenchen Germany 882,800 0.57
33,000 NN Group NV Netherlands 1,168,200 0.76
60,000 Raiffeisen Bank International AG Austria 1,237,800 0.80
500,000 Royal Bank of Scotland Group Plc United Kingdom 1,227,399 0.80
200,000 Standard Life Aberdeen Plc United Kingdom 658,037 0.43
2,000 Swiss Life Holding AG Switzerland 871,683 0.57
80,000 UBS Group AG Switzerland 836,008 0.54
150,000 UniCredit SpA Italy 1,623,900 1.05
Health Care (31 December 2018: 13.58%) 19,897,217 12.92
40,000 Galenica AG 144A* Switzerland 1,765,707 1.15
27,000 Gerresheimer AG Germany 1,748,250 1.13
16,000 Ipsen SA France 1,920,000 1.25
7,500 Orpea France 795,750 0.52
55,000 QIAGEN NV Netherlands 1,962,950 1.27
50,000 Recordati SpA Italy 1,833,000 1.19
100,000 Smith & Nephew Plc United Kingdom 1,904,199 1.24
100,000 Swedish Orphan Biovitrum AB Sweden 1,693,771 1.10
9,000 Tecan Group AG Switzerland 2,052,905 1.33
30,000 UCB SA Belgium 2,187,600 1.42
16,000 Vifor Pharma AG Switzerland 2,033,085 1.32
Industrials (31 December 2018: 12.08%) 20,320,328 13.21
20,000 AerCap Holdings NV Ireland 914,783 0.59
45,000 Ashtead Group Plc United Kingdom 1,132,803 0.74
35,000 Bouygues SA France 1,139,950 0.74
30,000 Cie de Saint-Gobain France 1,028,250 0.67
100,000 CNH Industrial NV United Kingdom 901,800 0.59
20,000 easyJet Plc United Kingdom 212,913 0.14
13,000 Eiffage SA France 1,130,220 0.73
50,000 Elis SA France 797,500 0.52
15,000 Fraport AG Frankfurt Airport Services Worldwide Germany 1,134,000 0.74
100,000 International Consolidated Airlines Group SA United Kingdom 531,600 0.35
30,000 ISS A/S Denmark 796,212 0.52
13,000 KION Group AG Germany 720,720 0.47
185,000 Meggitt Plc United Kingdom 1,082,657 0.70
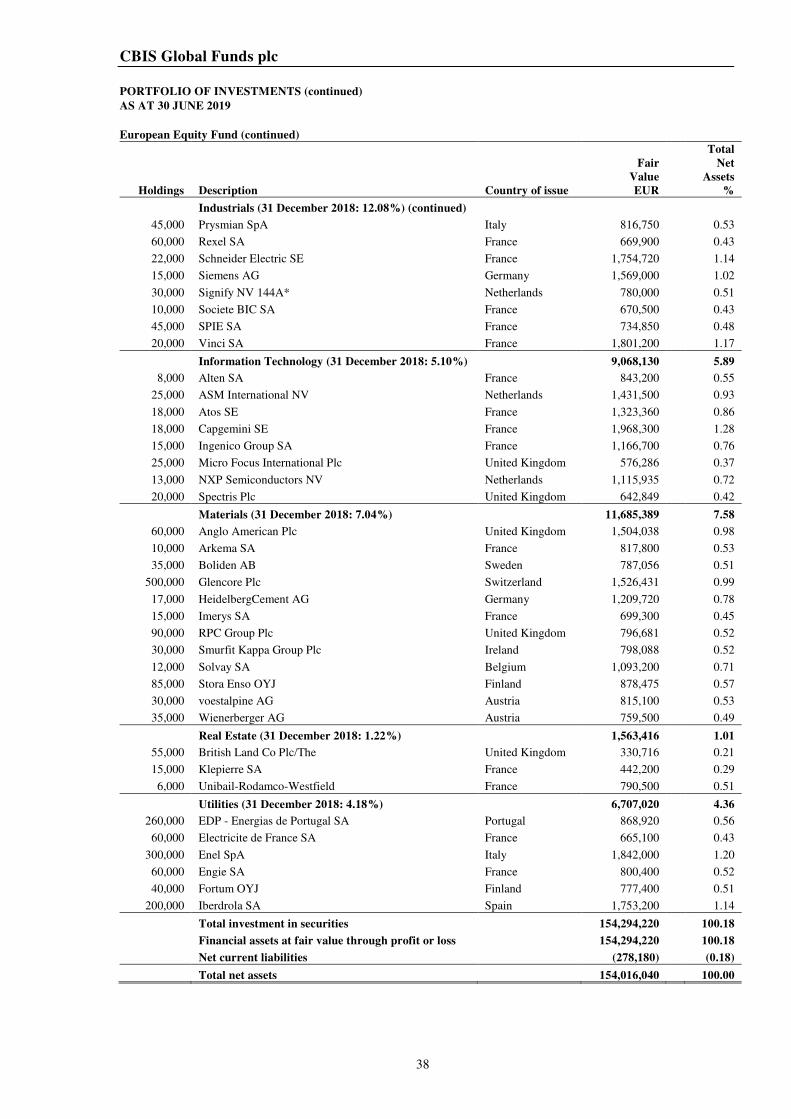
CBIS Global Funds plc
PORTFOLIO OF INVESTMENTS (continued)
AS AT 30 JUNE 2019
38
European Equity Fund (continued)
Holdings Description Country of issue
Fair
Value
EUR
Total
Net
Assets
%
Industrials (31 December 2018: 12.08%) (continued)
45,000 Prysmian SpA Italy 816,750 0.53
60,000 Rexel SA France 669,900 0.43
22,000 Schneider Electric SE France 1,754,720 1.14
15,000 Siemens AG Germany 1,569,000 1.02
30,000 Signify NV 144A* Netherlands 780,000 0.51
10,000 Societe BIC SA France 670,500 0.43
45,000 SPIE SA France 734,850 0.48
20,000 Vinci SA France 1,801,200 1.17
Information Technology (31 December 2018: 5.10%) 9,068,130 5.89
8,000 Alten SA France 843,200 0.55
25,000 ASM International NV Netherlands 1,431,500 0.93
18,000 Atos SE France 1,323,360 0.86
18,000 Capgemini SE France 1,968,300 1.28
15,000 Ingenico Group SA France 1,166,700 0.76
25,000 Micro Focus International Plc United Kingdom 576,286 0.37
13,000 NXP Semiconductors NV Netherlands 1,115,935 0.72
20,000 Spectris Plc United Kingdom 642,849 0.42
Materials (31 December 2018: 7.04%) 11,685,389 7.58
60,000 Anglo American Plc United Kingdom 1,504,038 0.98
10,000 Arkema SA France 817,800 0.53
35,000 Boliden AB Sweden 787,056 0.51
500,000 Glencore Plc Switzerland 1,526,431 0.99
17,000 HeidelbergCement AG Germany 1,209,720 0.78
15,000 Imerys SA France 699,300 0.45
90,000 RPC Group Plc United Kingdom 796,681 0.52
30,000 Smurfit Kappa Group Plc Ireland 798,088 0.52
12,000 Solvay SA Belgium 1,093,200 0.71
85,000 Stora Enso OYJ Finland 878,475 0.57
30,000 voestalpine AG Austria 815,100 0.53
35,000 Wienerberger AG Austria 759,500 0.49
Real Estate (31 December 2018: 1.22%) 1,563,416 1.01
55,000 British Land Co Plc/The United Kingdom 330,716 0.21
15,000 Klepierre SA France 442,200 0.29
6,000 Unibail-Rodamco-Westfield France 790,500 0.51
Utilities (31 December 2018: 4.18%) 6,707,020 4.36
260,000 EDP - Energias de Portugal SA Portugal 868,920 0.56
60,000 Electricite de France SA France 665,100 0.43
300,000 Enel SpA Italy 1,842,000 1.20
60,000 Engie SA France 800,400 0.52
40,000 Fortum OYJ Finland 777,400 0.51
200,000 Iberdrola SA Spain 1,753,200 1.14
Total investment in securities 154,294,220 100.18
Financial assets at fair value through profit or loss 154,294,220 100.18
Net current liabilities (278,180) (0.18)
Total net assets 154,016,040 100.00

CBIS Global Funds plc
PORTFOLIO OF INVESTMENTS (continued)
AS AT 30 JUNE 2019
39
European Equity Fund (continued)
*Securities exempt from registration under Rule 144A of the Securities Act of 1933, as amended. These securities may only be
resold, in transactions exempt from registration, to qualified institutional buyers. As at 30 June 2019, these securities amounted to
EUR 4,376,357 or 2.85% of net assets.
Analysis of portfolio as percentage of total assets Total
Assets
%
Transferable securities admitted to official stock exchange listing 98.56
Transferable securities traded on a regulated market 0.54
Total investments 99.10
Other net assets 0.90
Total assets 100.00
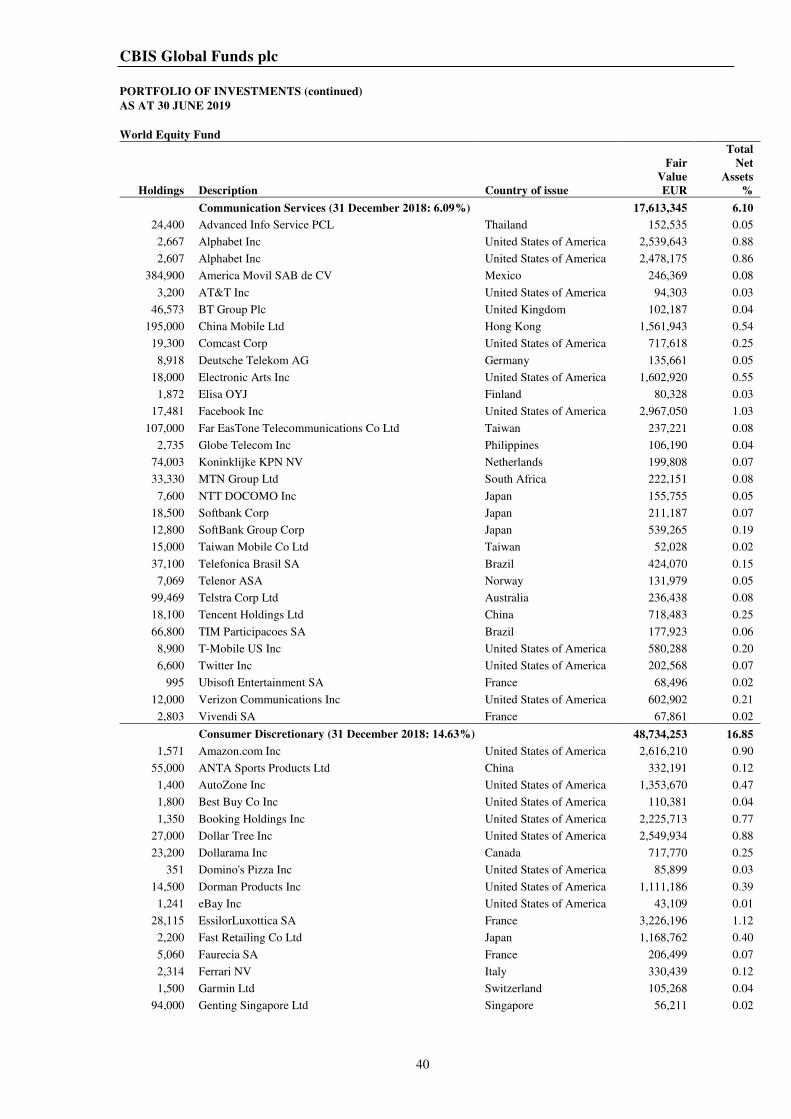
CBIS Global Funds plc
PORTFOLIO OF INVESTMENTS (continued)
AS AT 30 JUNE 2019
40
World Equity Fund
Holdings Description Country of issue
Fair
Value
EUR
Total
Net
Assets
%
Communication Services (31 December 2018: 6.09%) 17,613,345 6.10
24,400 Advanced Info Service PCL Thailand 152,535 0.05
2,667 Alphabet Inc United States of America 2,539,643 0.88
2,607 Alphabet Inc United States of America 2,478,175 0.86
384,900 America Movil SAB de CV Mexico 246,369 0.08
3,200 AT&T Inc United States of America 94,303 0.03
46,573 BT Group Plc United Kingdom 102,187 0.04
195,000 China Mobile Ltd Hong Kong 1,561,943 0.54
19,300 Comcast Corp United States of America 717,618 0.25
8,918 Deutsche Telekom AG Germany 135,661 0.05
18,000 Electronic Arts Inc United States of America 1,602,920 0.55
1,872 Elisa OYJ Finland 80,328 0.03
17,481 Facebook Inc United States of America 2,967,050 1.03
107,000 Far EasTone Telecommunications Co Ltd Taiwan 237,221 0.08
2,735 Globe Telecom Inc Philippines 106,190 0.04
74,003 Koninklijke KPN NV Netherlands 199,808 0.07
33,330 MTN Group Ltd South Africa 222,151 0.08
7,600 NTT DOCOMO Inc Japan 155,755 0.05
18,500 Softbank Corp Japan 211,187 0.07
12,800 SoftBank Group Corp Japan 539,265 0.19
15,000 Taiwan Mobile Co Ltd Taiwan 52,028 0.02
37,100 Telefonica Brasil SA Brazil 424,070 0.15
7,069 Telenor ASA Norway 131,979 0.05
99,469 Telstra Corp Ltd Australia 236,438 0.08
18,100 Tencent Holdings Ltd China 718,483 0.25
66,800 TIM Participacoes SA Brazil 177,923 0.06
8,900 T-Mobile US Inc United States of America 580,288 0.20
6,600 Twitter Inc United States of America 202,568 0.07
995 Ubisoft Entertainment SA France 68,496 0.02
12,000 Verizon Communications Inc United States of America 602,902 0.21
2,803 Vivendi SA France 67,861 0.02
Consumer Discretionary (31 December 2018: 14.63%) 48,734,253 16.85
1,571 Amazon.com Inc United States of America 2,616,210 0.90
55,000 ANTA Sports Products Ltd China 332,191 0.12
1,400 AutoZone Inc United States of America 1,353,670 0.47
1,800 Best Buy Co Inc United States of America 110,381 0.04
1,350 Booking Holdings Inc United States of America 2,225,713 0.77
27,000 Dollar Tree Inc United States of America 2,549,934 0.88
23,200 Dollarama Inc Canada 717,770 0.25
351 Domino's Pizza Inc United States of America 85,899 0.03
14,500 Dorman Products Inc United States of America 1,111,186 0.39
1,241 eBay Inc United States of America 43,109 0.01
28,115 EssilorLuxottica SA France 3,226,196 1.12
2,200 Fast Retailing Co Ltd Japan 1,168,762 0.40
5,060 Faurecia SA France 206,499 0.07
2,314 Ferrari NV Italy 330,439 0.12
1,500 Garmin Ltd Switzerland 105,268 0.04
94,000 Genting Singapore Ltd Singapore 56,211 0.02
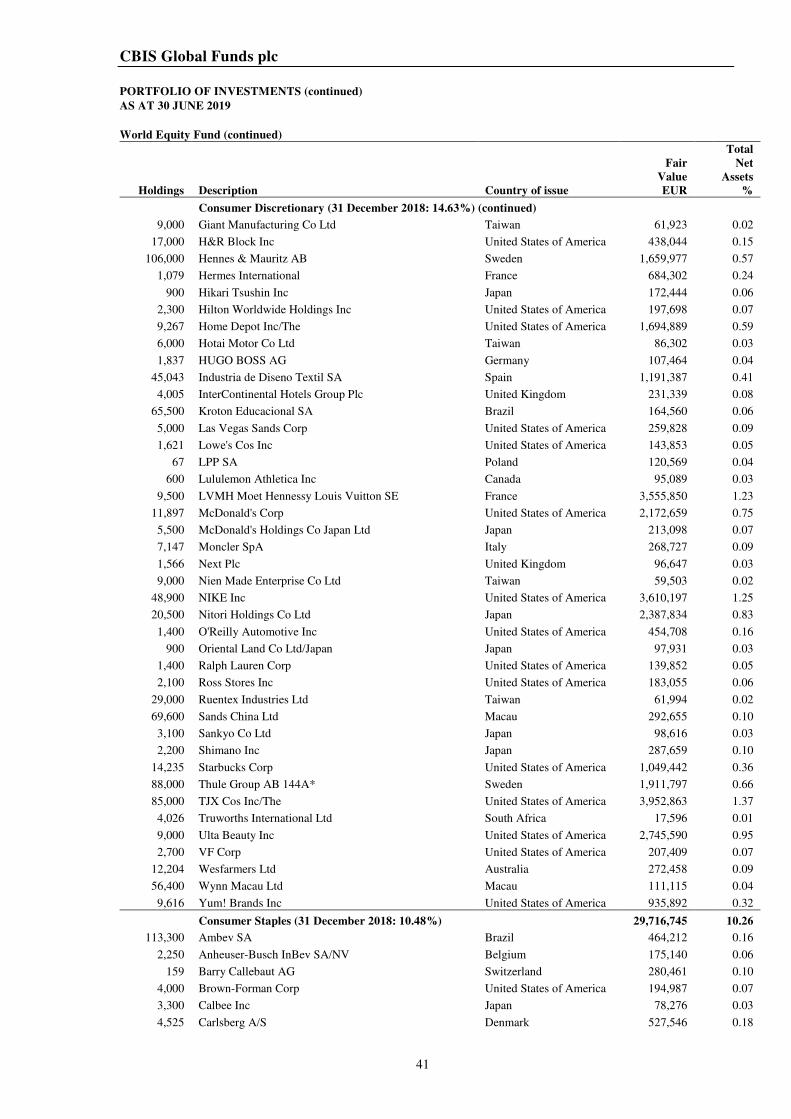
CBIS Global Funds plc
PORTFOLIO OF INVESTMENTS (continued)
AS AT 30 JUNE 2019
41
World Equity Fund (continued)
Holdings Description Country of issue
Fair
Value
EUR
Total
Net
Assets
%
Consumer Discretionary (31 December 2018: 14.63%) (continued)
9,000 Giant Manufacturing Co Ltd Taiwan 61,923 0.02
17,000 H&R Block Inc United States of America 438,044 0.15
106,000 Hennes & Mauritz AB Sweden 1,659,977 0.57
1,079 Hermes International France 684,302 0.24
900 Hikari Tsushin Inc Japan 172,444 0.06
2,300 Hilton Worldwide Holdings Inc United States of America 197,698 0.07
9,267 Home Depot Inc/The United States of America 1,694,889 0.59
6,000 Hotai Motor Co Ltd Taiwan 86,302 0.03
1,837 HUGO BOSS AG Germany 107,464 0.04
45,043 Industria de Diseno Textil SA Spain 1,191,387 0.41
4,005 InterContinental Hotels Group Plc United Kingdom 231,339 0.08
65,500 Kroton Educacional SA Brazil 164,560 0.06
5,000 Las Vegas Sands Corp United States of America 259,828 0.09
1,621 Lowe's Cos Inc United States of America 143,853 0.05
67 LPP SA Poland 120,569 0.04
600 Lululemon Athletica Inc Canada 95,089 0.03
9,500 LVMH Moet Hennessy Louis Vuitton SE France 3,555,850 1.23
11,897 McDonald's Corp United States of America 2,172,659 0.75
5,500 McDonald's Holdings Co Japan Ltd Japan 213,098 0.07
7,147 Moncler SpA Italy 268,727 0.09
1,566 Next Plc United Kingdom 96,647 0.03
9,000 Nien Made Enterprise Co Ltd Taiwan 59,503 0.02
48,900 NIKE Inc United States of America 3,610,197 1.25
20,500 Nitori Holdings Co Ltd Japan 2,387,834 0.83
1,400 O'Reilly Automotive Inc United States of America 454,708 0.16
900 Oriental Land Co Ltd/Japan Japan 97,931 0.03
1,400 Ralph Lauren Corp United States of America 139,852 0.05
2,100 Ross Stores Inc United States of America 183,055 0.06
29,000 Ruentex Industries Ltd Taiwan 61,994 0.02
69,600 Sands China Ltd Macau 292,655 0.10
3,100 Sankyo Co Ltd Japan 98,616 0.03
2,200 Shimano Inc Japan 287,659 0.10
14,235 Starbucks Corp United States of America 1,049,442 0.36
88,000 Thule Group AB 144A* Sweden 1,911,797 0.66
85,000 TJX Cos Inc/The United States of America 3,952,863 1.37
4,026 Truworths International Ltd South Africa 17,596 0.01
9,000 Ulta Beauty Inc United States of America 2,745,590 0.95
2,700 VF Corp United States of America 207,409 0.07
12,204 Wesfarmers Ltd Australia 272,458 0.09
56,400 Wynn Macau Ltd Macau 111,115 0.04
9,616 Yum! Brands Inc United States of America 935,892 0.32
Consumer Staples (31 December 2018: 10.48%) 29,716,745 10.26
113,300 Ambev SA Brazil 464,212 0.16
2,250 Anheuser-Busch InBev SA/NV Belgium 175,140 0.06
159 Barry Callebaut AG Switzerland 280,461 0.10
4,000 Brown-Forman Corp United States of America 194,987 0.07
3,300 Calbee Inc Japan 78,276 0.03
4,525 Carlsberg A/S Denmark 527,546 0.18
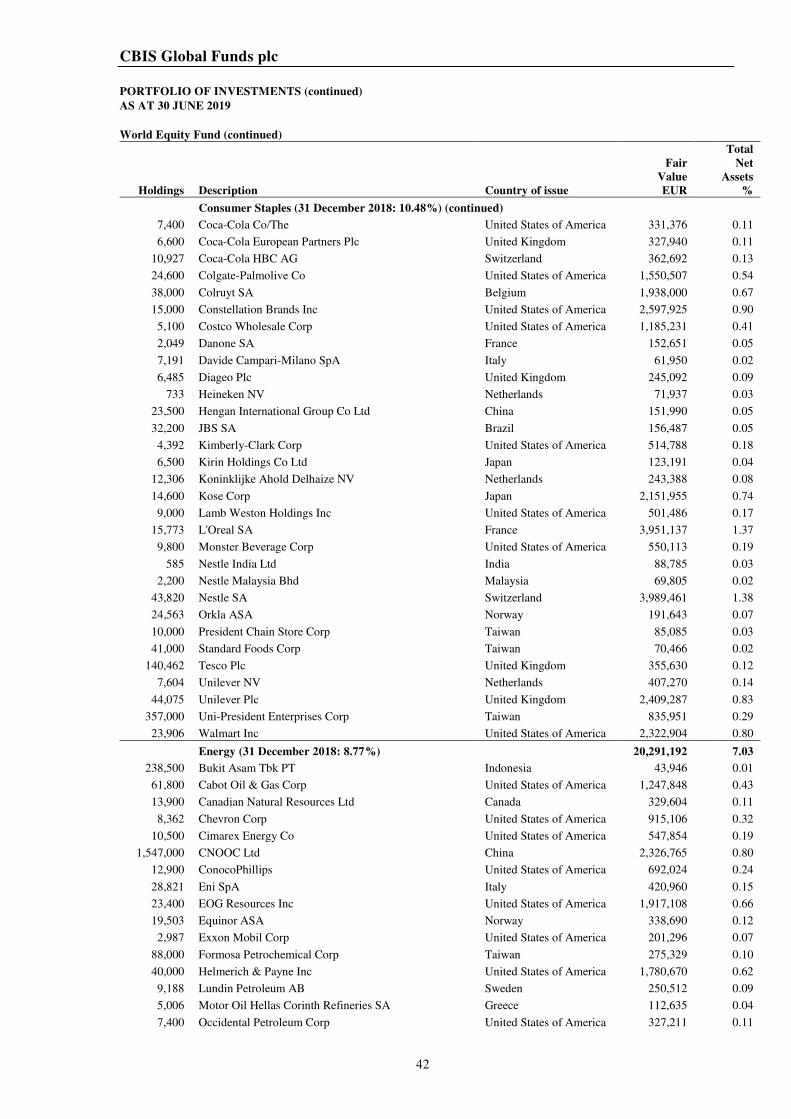
CBIS Global Funds plc
PORTFOLIO OF INVESTMENTS (continued)
AS AT 30 JUNE 2019
42
World Equity Fund (continued)
Holdings Description Country of issue
Fair
Value
EUR
Total
Net
Assets
%
Consumer Staples (31 December 2018: 10.48%) (continued)
7,400 Coca-Cola Co/The United States of America 331,376 0.11
6,600 Coca-Cola European Partners Plc United Kingdom 327,940 0.11
10,927 Coca-Cola HBC AG Switzerland 362,692 0.13
24,600 Colgate-Palmolive Co United States of America 1,550,507 0.54
38,000 Colruyt SA Belgium 1,938,000 0.67
15,000 Constellation Brands Inc United States of America 2,597,925 0.90
5,100 Costco Wholesale Corp United States of America 1,185,231 0.41
2,049 Danone SA France 152,651 0.05
7,191 Davide Campari-Milano SpA Italy 61,950 0.02
6,485 Diageo Plc United Kingdom 245,092 0.09
733 Heineken NV Netherlands 71,937 0.03
23,500 Hengan International Group Co Ltd China 151,990 0.05
32,200 JBS SA Brazil 156,487 0.05
4,392 Kimberly-Clark Corp United States of America 514,788 0.18
6,500 Kirin Holdings Co Ltd Japan 123,191 0.04
12,306 Koninklijke Ahold Delhaize NV Netherlands 243,388 0.08
14,600 Kose Corp Japan 2,151,955 0.74
9,000 Lamb Weston Holdings Inc United States of America 501,486 0.17
15,773 L'Oreal SA France 3,951,137 1.37
9,800 Monster Beverage Corp United States of America 550,113 0.19
585 Nestle India Ltd India 88,785 0.03
2,200 Nestle Malaysia Bhd Malaysia 69,805 0.02
43,820 Nestle SA Switzerland 3,989,461 1.38
24,563 Orkla ASA Norway 191,643 0.07
10,000 President Chain Store Corp Taiwan 85,085 0.03
41,000 Standard Foods Corp Taiwan 70,466 0.02
140,462 Tesco Plc United Kingdom 355,630 0.12
7,604 Unilever NV Netherlands 407,270 0.14
44,075 Unilever Plc United Kingdom 2,409,287 0.83
357,000 Uni-President Enterprises Corp Taiwan 835,951 0.29
23,906 Walmart Inc United States of America 2,322,904 0.80
Energy (31 December 2018: 8.77%) 20,291,192 7.03
238,500 Bukit Asam Tbk PT Indonesia 43,946 0.01
61,800 Cabot Oil & Gas Corp United States of America 1,247,848 0.43
13,900 Canadian Natural Resources Ltd Canada 329,604 0.11
8,362 Chevron Corp United States of America 915,106 0.32
10,500 Cimarex Energy Co United States of America 547,854 0.19
1,547,000 CNOOC Ltd China 2,326,765 0.80
12,900 ConocoPhillips United States of America 692,024 0.24
28,821 Eni SpA Italy 420,960 0.15
23,400 EOG Resources Inc United States of America 1,917,108 0.66
19,503 Equinor ASA Norway 338,690 0.12
2,987 Exxon Mobil Corp United States of America 201,296 0.07
88,000 Formosa Petrochemical Corp Taiwan 275,329 0.10
40,000 Helmerich & Payne Inc United States of America 1,780,670 0.62
9,188 Lundin Petroleum AB Sweden 250,512 0.09
5,006 Motor Oil Hellas Corinth Refineries SA Greece 112,635 0.04
7,400 Occidental Petroleum Corp United States of America 327,211 0.11
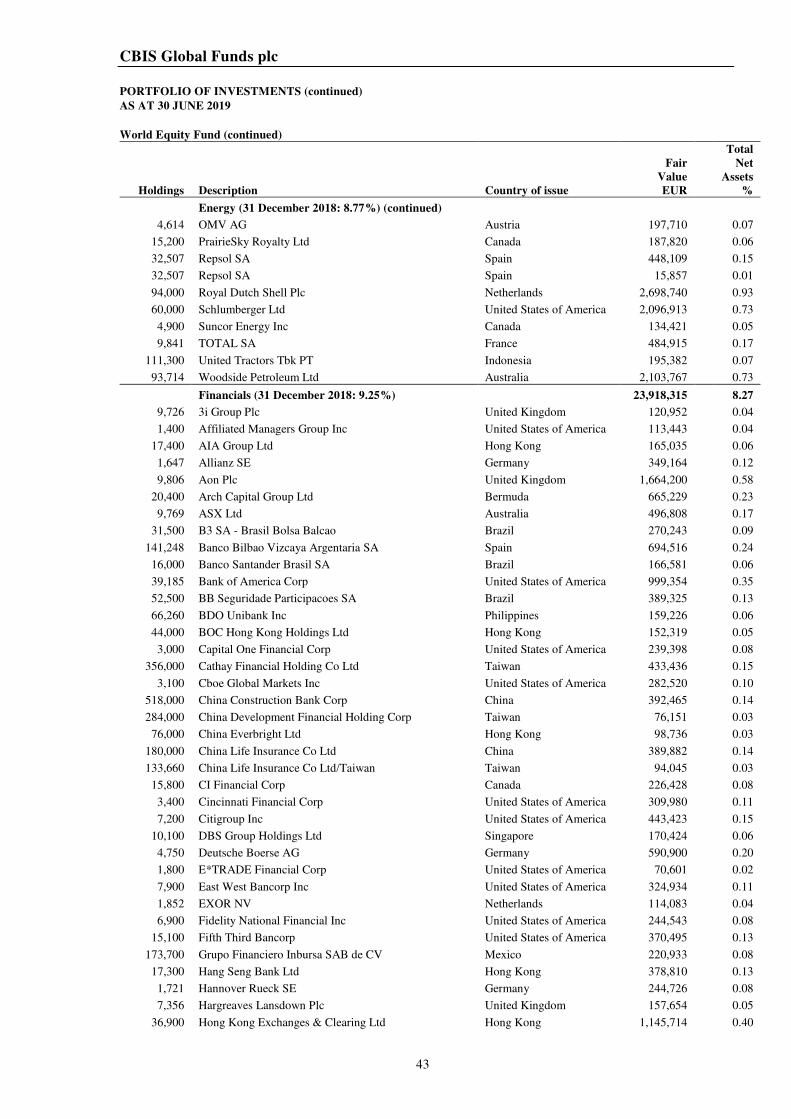
CBIS Global Funds plc
PORTFOLIO OF INVESTMENTS (continued)
AS AT 30 JUNE 2019
43
World Equity Fund (continued)
Holdings Description Country of issue
Fair
Value
EUR
Total
Net
Assets
%
Energy (31 December 2018: 8.77%) (continued)
4,614 OMV AG Austria 197,710 0.07
15,200 PrairieSky Royalty Ltd Canada 187,820 0.06
32,507 Repsol SA Spain 448,109 0.15
32,507 Repsol SA Spain 15,857 0.01
94,000 Royal Dutch Shell Plc Netherlands 2,698,740 0.93
60,000 Schlumberger Ltd United States of America 2,096,913 0.73
4,900 Suncor Energy Inc Canada 134,421 0.05
9,841 TOTAL SA France 484,915 0.17
111,300 United Tractors Tbk PT Indonesia 195,382 0.07
93,714 Woodside Petroleum Ltd Australia 2,103,767 0.73
Financials (31 December 2018: 9.25%) 23,918,315 8.27
9,726 3i Group Plc United Kingdom 120,952 0.04
1,400 Affiliated Managers Group Inc United States of America 113,443 0.04
17,400 AIA Group Ltd Hong Kong 165,035 0.06
1,647 Allianz SE Germany 349,164 0.12
9,806 Aon Plc United Kingdom 1,664,200 0.58
20,400 Arch Capital Group Ltd Bermuda 665,229 0.23
9,769 ASX Ltd Australia 496,808 0.17
31,500 B3 SA - Brasil Bolsa Balcao Brazil 270,243 0.09
141,248 Banco Bilbao Vizcaya Argentaria SA Spain 694,516 0.24
16,000 Banco Santander Brasil SA Brazil 166,581 0.06
39,185 Bank of America Corp United States of America 999,354 0.35
52,500 BB Seguridade Participacoes SA Brazil 389,325 0.13
66,260 BDO Unibank Inc Philippines 159,226 0.06
44,000 BOC Hong Kong Holdings Ltd Hong Kong 152,319 0.05
3,000 Capital One Financial Corp United States of America 239,398 0.08
356,000 Cathay Financial Holding Co Ltd Taiwan 433,436 0.15
3,100 Cboe Global Markets Inc United States of America 282,520 0.10
518,000 China Construction Bank Corp China 392,465 0.14
284,000 China Development Financial Holding Corp Taiwan 76,151 0.03
76,000 China Everbright Ltd Hong Kong 98,736 0.03
180,000 China Life Insurance Co Ltd China 389,882 0.14
133,660 China Life Insurance Co Ltd/Taiwan Taiwan 94,045 0.03
15,800 CI Financial Corp Canada 226,428 0.08
3,400 Cincinnati Financial Corp United States of America 309,980 0.11
7,200 Citigroup Inc United States of America 443,423 0.15
10,100 DBS Group Holdings Ltd Singapore 170,424 0.06
4,750 Deutsche Boerse AG Germany 590,900 0.20
1,800 E*TRADE Financial Corp United States of America 70,601 0.02
7,900 East West Bancorp Inc United States of America 324,934 0.11
1,852 EXOR NV Netherlands 114,083 0.04
6,900 Fidelity National Financial Inc United States of America 244,543 0.08
15,100 Fifth Third Bancorp United States of America 370,495 0.13
173,700 Grupo Financiero Inbursa SAB de CV Mexico 220,933 0.08
17,300 Hang Seng Bank Ltd Hong Kong 378,810 0.13
1,721 Hannover Rueck SE Germany 244,726 0.08
7,356 Hargreaves Lansdown Plc United Kingdom 157,654 0.05
36,900 Hong Kong Exchanges & Clearing Ltd Hong Kong 1,145,714 0.40
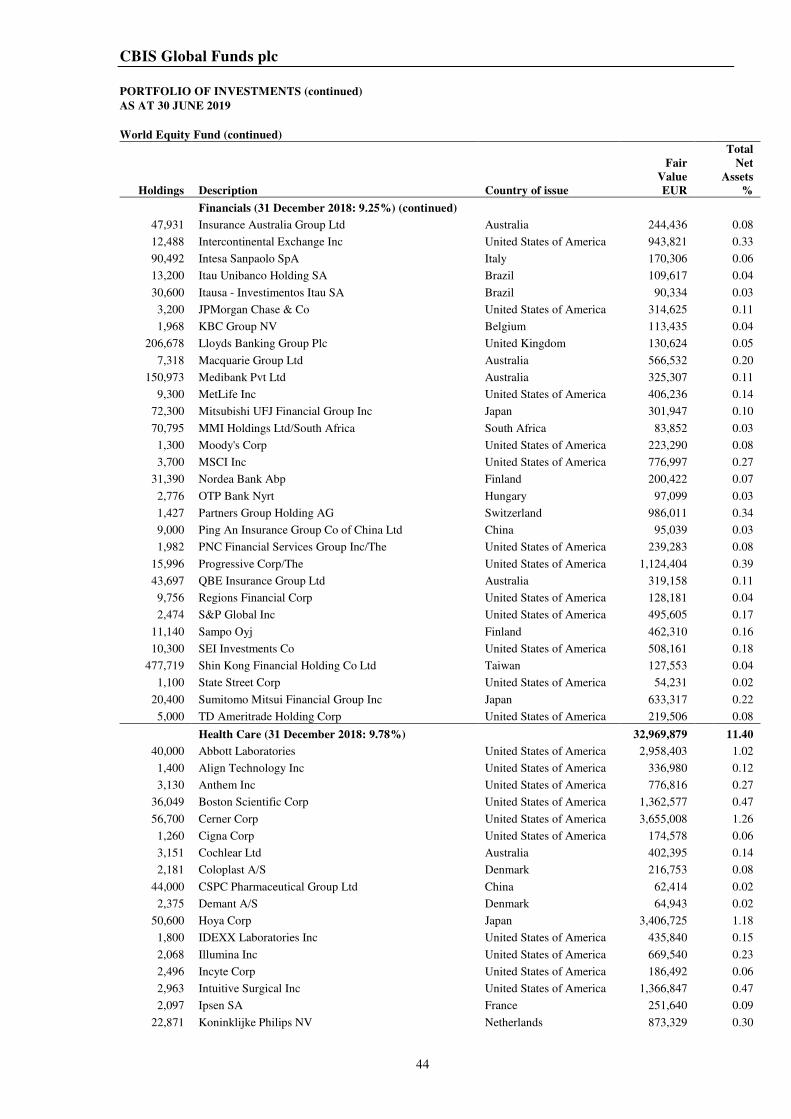
CBIS Global Funds plc
PORTFOLIO OF INVESTMENTS (continued)
AS AT 30 JUNE 2019
44
World Equity Fund (continued)
Holdings Description Country of issue
Fair
Value
EUR
Total
Net
Assets
%
Financials (31 December 2018: 9.25%) (continued)
47,931 Insurance Australia Group Ltd Australia 244,436 0.08
12,488 Intercontinental Exchange Inc United States of America 943,821 0.33
90,492 Intesa Sanpaolo SpA Italy 170,306 0.06
13,200 Itau Unibanco Holding SA Brazil 109,617 0.04
30,600 Itausa - Investimentos Itau SA Brazil 90,334 0.03
3,200 JPMorgan Chase & Co United States of America 314,625 0.11
1,968 KBC Group NV Belgium 113,435 0.04
206,678 Lloyds Banking Group Plc United Kingdom 130,624 0.05
7,318 Macquarie Group Ltd Australia 566,532 0.20
150,973 Medibank Pvt Ltd Australia 325,307 0.11
9,300 MetLife Inc United States of America 406,236 0.14
72,300 Mitsubishi UFJ Financial Group Inc Japan 301,947 0.10
70,795 MMI Holdings Ltd/South Africa South Africa 83,852 0.03
1,300 Moody's Corp United States of America 223,290 0.08
3,700 MSCI Inc United States of America 776,997 0.27
31,390 Nordea Bank Abp Finland 200,422 0.07
2,776 OTP Bank Nyrt Hungary 97,099 0.03
1,427 Partners Group Holding AG Switzerland 986,011 0.34
9,000 Ping An Insurance Group Co of China Ltd China 95,039 0.03
1,982 PNC Financial Services Group Inc/The United States of America 239,283 0.08
15,996 Progressive Corp/The United States of America 1,124,404 0.39
43,697 QBE Insurance Group Ltd Australia 319,158 0.11
9,756 Regions Financial Corp United States of America 128,181 0.04
2,474 S&P Global Inc United States of America 495,605 0.17
11,140 Sampo Oyj Finland 462,310 0.16
10,300 SEI Investments Co United States of America 508,161 0.18
477,719 Shin Kong Financial Holding Co Ltd Taiwan 127,553 0.04
1,100 State Street Corp United States of America 54,231 0.02
20,400 Sumitomo Mitsui Financial Group Inc Japan 633,317 0.22
5,000 TD Ameritrade Holding Corp United States of America 219,506 0.08
Health Care (31 December 2018: 9.78%) 32,969,879 11.40
40,000 Abbott Laboratories United States of America 2,958,403 1.02
1,400 Align Technology Inc United States of America 336,980 0.12
3,130 Anthem Inc United States of America 776,816 0.27
36,049 Boston Scientific Corp United States of America 1,362,577 0.47
56,700 Cerner Corp United States of America 3,655,008 1.26
1,260 Cigna Corp United States of America 174,578 0.06
3,151 Cochlear Ltd Australia 402,395 0.14
2,181 Coloplast A/S Denmark 216,753 0.08
44,000 CSPC Pharmaceutical Group Ltd China 62,414 0.02
2,375 Demant A/S Denmark 64,943 0.02
50,600 Hoya Corp Japan 3,406,725 1.18
1,800 IDEXX Laboratories Inc United States of America 435,840 0.15
2,068 Illumina Inc United States of America 669,540 0.23
2,496 Incyte Corp United States of America 186,492 0.06
2,963 Intuitive Surgical Inc United States of America 1,366,847 0.47
2,097 Ipsen SA France 251,640 0.09
22,871 Koninklijke Philips NV Netherlands 873,329 0.30
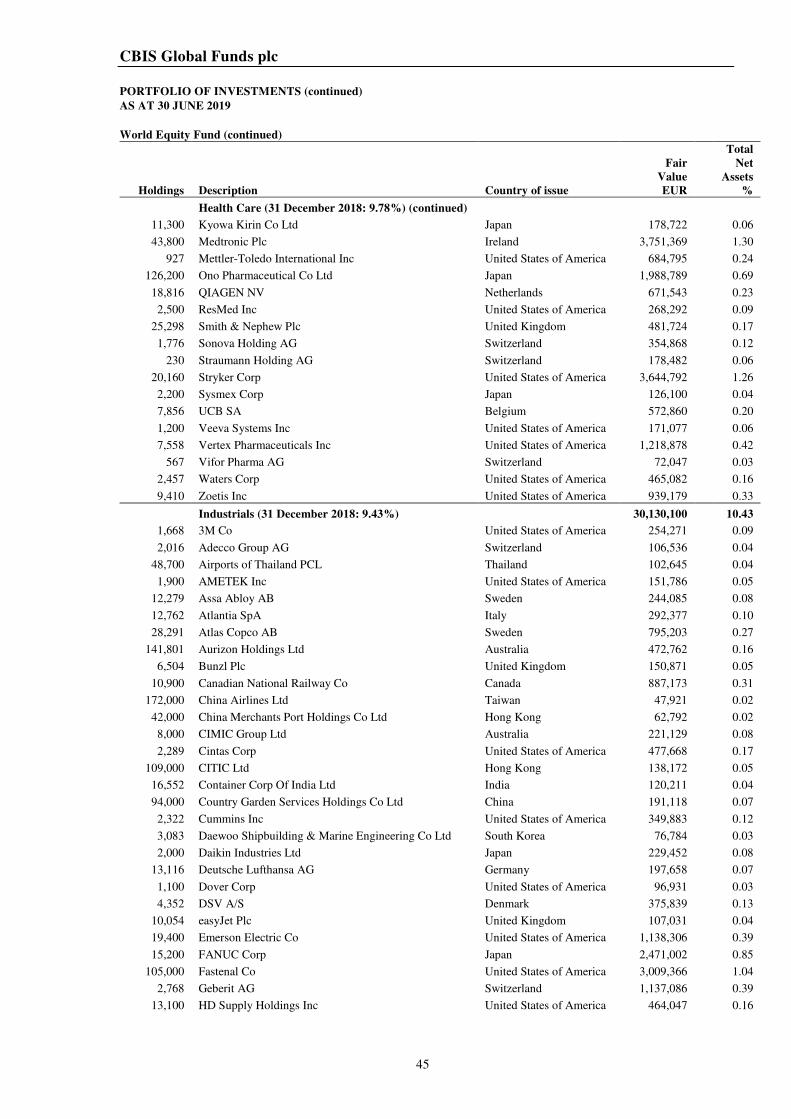
CBIS Global Funds plc
PORTFOLIO OF INVESTMENTS (continued)
AS AT 30 JUNE 2019
45
World Equity Fund (continued)
Holdings Description Country of issue
Fair
Value
EUR
Total
Net
Assets
%
Health Care (31 December 2018: 9.78%) (continued)
11,300 Kyowa Kirin Co Ltd Japan 178,722 0.06
43,800 Medtronic Plc Ireland 3,751,369 1.30
927 Mettler-Toledo International Inc United States of America 684,795 0.24
126,200 Ono Pharmaceutical Co Ltd Japan 1,988,789 0.69
18,816 QIAGEN NV Netherlands 671,543 0.23
2,500 ResMed Inc United States of America 268,292 0.09
25,298 Smith & Nephew Plc United Kingdom 481,724 0.17
1,776 Sonova Holding AG Switzerland 354,868 0.12
230 Straumann Holding AG Switzerland 178,482 0.06
20,160 Stryker Corp United States of America 3,644,792 1.26
2,200 Sysmex Corp Japan 126,100 0.04
7,856 UCB SA Belgium 572,860 0.20
1,200 Veeva Systems Inc United States of America 171,077 0.06
7,558 Vertex Pharmaceuticals Inc United States of America 1,218,878 0.42
567 Vifor Pharma AG Switzerland 72,047 0.03
2,457 Waters Corp United States of America 465,082 0.16
9,410 Zoetis Inc United States of America 939,179 0.33
Industrials (31 December 2018: 9.43%) 30,130,100 10.43
1,668 3M Co United States of America 254,271 0.09
2,016 Adecco Group AG Switzerland 106,536 0.04
48,700 Airports of Thailand PCL Thailand 102,645 0.04
1,900 AMETEK Inc United States of America 151,786 0.05
12,279 Assa Abloy AB Sweden 244,085 0.08
12,762 Atlantia SpA Italy 292,377 0.10
28,291 Atlas Copco AB Sweden 795,203 0.27
141,801 Aurizon Holdings Ltd Australia 472,762 0.16
6,504 Bunzl Plc United Kingdom 150,871 0.05
10,900 Canadian National Railway Co Canada 887,173 0.31
172,000 China Airlines Ltd Taiwan 47,921 0.02
42,000 China Merchants Port Holdings Co Ltd Hong Kong 62,792 0.02
8,000 CIMIC Group Ltd Australia 221,129 0.08
2,289 Cintas Corp United States of America 477,668 0.17
109,000 CITIC Ltd Hong Kong 138,172 0.05
16,552 Container Corp Of India Ltd India 120,211 0.04
94,000 Country Garden Services Holdings Co Ltd China 191,118 0.07
2,322 Cummins Inc United States of America 349,883 0.12
3,083 Daewoo Shipbuilding & Marine Engineering Co Ltd South Korea 76,784 0.03
2,000 Daikin Industries Ltd Japan 229,452 0.08
13,116 Deutsche Lufthansa AG Germany 197,658 0.07
1,100 Dover Corp United States of America 96,931 0.03
4,352 DSV A/S Denmark 375,839 0.13
10,054 easyJet Plc United Kingdom 107,031 0.04
19,400 Emerson Electric Co United States of America 1,138,306 0.39
15,200 FANUC Corp Japan 2,471,002 0.85
105,000 Fastenal Co United States of America 3,009,366 1.04
2,768 Geberit AG Switzerland 1,137,086 0.39
13,100 HD Supply Holdings Inc United States of America 464,047 0.16
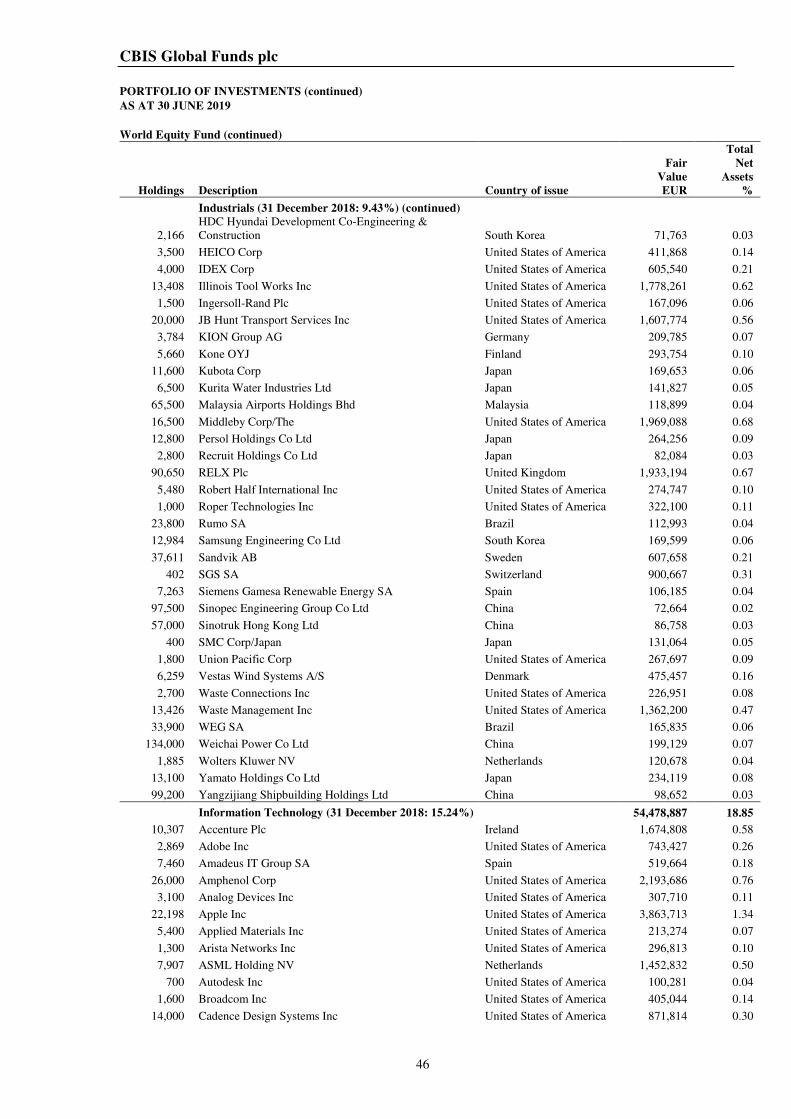
CBIS Global Funds plc
PORTFOLIO OF INVESTMENTS (continued)
AS AT 30 JUNE 2019
46
World Equity Fund (continued)
Holdings Description Country of issue
Fair
Value
EUR
Total
Net
Assets
%
Industrials (31 December 2018: 9.43%) (continued)
2,166
HDC Hyundai Development Co-Engineering &
Construction South Korea 71,763 0.03
3,500 HEICO Corp United States of America 411,868 0.14
4,000 IDEX Corp United States of America 605,540 0.21
13,408 Illinois Tool Works Inc United States of America 1,778,261 0.62
1,500 Ingersoll-Rand Plc United States of America 167,096 0.06
20,000 JB Hunt Transport Services Inc United States of America 1,607,774 0.56
3,784 KION Group AG Germany 209,785 0.07
5,660 Kone OYJ Finland 293,754 0.10
11,600 Kubota Corp Japan 169,653 0.06
6,500 Kurita Water Industries Ltd Japan 141,827 0.05
65,500 Malaysia Airports Holdings Bhd Malaysia 118,899 0.04
16,500 Middleby Corp/The United States of America 1,969,088 0.68
12,800 Persol Holdings Co Ltd Japan 264,256 0.09
2,800 Recruit Holdings Co Ltd Japan 82,084 0.03
90,650 RELX Plc United Kingdom 1,933,194 0.67
5,480 Robert Half International Inc United States of America 274,747 0.10
1,000 Roper Technologies Inc United States of America 322,100 0.11
23,800 Rumo SA Brazil 112,993 0.04
12,984 Samsung Engineering Co Ltd South Korea 169,599 0.06
37,611 Sandvik AB Sweden 607,658 0.21
402 SGS SA Switzerland 900,667 0.31
7,263 Siemens Gamesa Renewable Energy SA Spain 106,185 0.04
97,500 Sinopec Engineering Group Co Ltd China 72,664 0.02
57,000 Sinotruk Hong Kong Ltd China 86,758 0.03
400 SMC Corp/Japan Japan 131,064 0.05
1,800 Union Pacific Corp United States of America 267,697 0.09
6,259 Vestas Wind Systems A/S Denmark 475,457 0.16
2,700 Waste Connections Inc United States of America 226,951 0.08
13,426 Waste Management Inc United States of America 1,362,200 0.47
33,900 WEG SA Brazil 165,835 0.06
134,000 Weichai Power Co Ltd China 199,129 0.07
1,885 Wolters Kluwer NV Netherlands 120,678 0.04
13,100 Yamato Holdings Co Ltd Japan 234,119 0.08
99,200 Yangzijiang Shipbuilding Holdings Ltd China 98,652 0.03
Information Technology (31 December 2018: 15.24%) 54,478,887 18.85
10,307 Accenture Plc Ireland 1,674,808 0.58
2,869 Adobe Inc United States of America 743,427 0.26
7,460 Amadeus IT Group SA Spain 519,664 0.18
26,000 Amphenol Corp United States of America 2,193,686 0.76
3,100 Analog Devices Inc United States of America 307,710 0.11
22,198 Apple Inc United States of America 3,863,713 1.34
5,400 Applied Materials Inc United States of America 213,274 0.07
1,300 Arista Networks Inc United States of America 296,813 0.10
7,907 ASML Holding NV Netherlands 1,452,832 0.50
700 Autodesk Inc United States of America 100,281 0.04
1,600 Broadcom Inc United States of America 405,044 0.14
14,000 Cadence Design Systems Inc United States of America 871,814 0.30
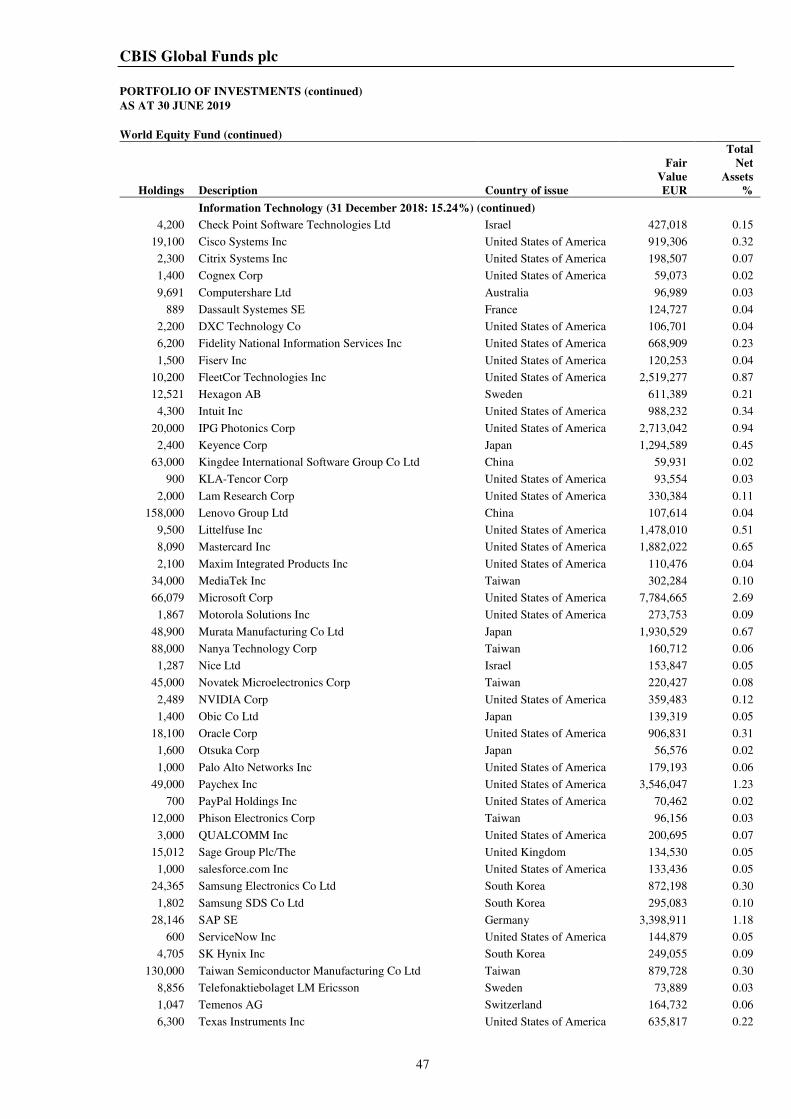
CBIS Global Funds plc
PORTFOLIO OF INVESTMENTS (continued)
AS AT 30 JUNE 2019
47
World Equity Fund (continued)
Holdings Description Country of issue
Fair
Value
EUR
Total
Net
Assets
%
Information Technology (31 December 2018: 15.24%) (continued)
4,200 Check Point Software Technologies Ltd Israel 427,018 0.15
19,100 Cisco Systems Inc United States of America 919,306 0.32
2,300 Citrix Systems Inc United States of America 198,507 0.07
1,400 Cognex Corp United States of America 59,073 0.02
9,691 Computershare Ltd Australia 96,989 0.03
889 Dassault Systemes SE France 124,727 0.04
2,200 DXC Technology Co United States of America 106,701 0.04
6,200 Fidelity National Information Services Inc United States of America 668,909 0.23
1,500 Fiserv Inc United States of America 120,253 0.04
10,200 FleetCor Technologies Inc United States of America 2,519,277 0.87
12,521 Hexagon AB Sweden 611,389 0.21
4,300 Intuit Inc United States of America 988,232 0.34
20,000 IPG Photonics Corp United States of America 2,713,042 0.94
2,400 Keyence Corp Japan 1,294,589 0.45
63,000 Kingdee International Software Group Co Ltd China 59,931 0.02
900 KLA-Tencor Corp United States of America 93,554 0.03
2,000 Lam Research Corp United States of America 330,384 0.11
158,000 Lenovo Group Ltd China 107,614 0.04
9,500 Littelfuse Inc United States of America 1,478,010 0.51
8,090 Mastercard Inc United States of America 1,882,022 0.65
2,100 Maxim Integrated Products Inc United States of America 110,476 0.04
34,000 MediaTek Inc Taiwan 302,284 0.10
66,079 Microsoft Corp United States of America 7,784,665 2.69
1,867 Motorola Solutions Inc United States of America 273,753 0.09
48,900 Murata Manufacturing Co Ltd Japan 1,930,529 0.67
88,000 Nanya Technology Corp Taiwan 160,712 0.06
1,287 Nice Ltd Israel 153,847 0.05
45,000 Novatek Microelectronics Corp Taiwan 220,427 0.08
2,489 NVIDIA Corp United States of America 359,483 0.12
1,400 Obic Co Ltd Japan 139,319 0.05
18,100 Oracle Corp United States of America 906,831 0.31
1,600 Otsuka Corp Japan 56,576 0.02
1,000 Palo Alto Networks Inc United States of America 179,193 0.06
49,000 Paychex Inc United States of America 3,546,047 1.23
700 PayPal Holdings Inc United States of America 70,462 0.02
12,000 Phison Electronics Corp Taiwan 96,156 0.03
3,000 QUALCOMM Inc United States of America 200,695 0.07
15,012 Sage Group Plc/The United Kingdom 134,530 0.05
1,000 salesforce.com Inc United States of America 133,436 0.05
24,365 Samsung Electronics Co Ltd South Korea 872,198 0.30
1,802 Samsung SDS Co Ltd South Korea 295,083 0.10
28,146 SAP SE Germany 3,398,911 1.18
600 ServiceNow Inc United States of America 144,879 0.05
4,705 SK Hynix Inc South Korea 249,055 0.09
130,000 Taiwan Semiconductor Manufacturing Co Ltd Taiwan 879,728 0.30
8,856 Telefonaktiebolaget LM Ericsson Sweden 73,889 0.03
1,047 Temenos AG Switzerland 164,732 0.06
6,300 Texas Instruments Inc United States of America 635,817 0.22
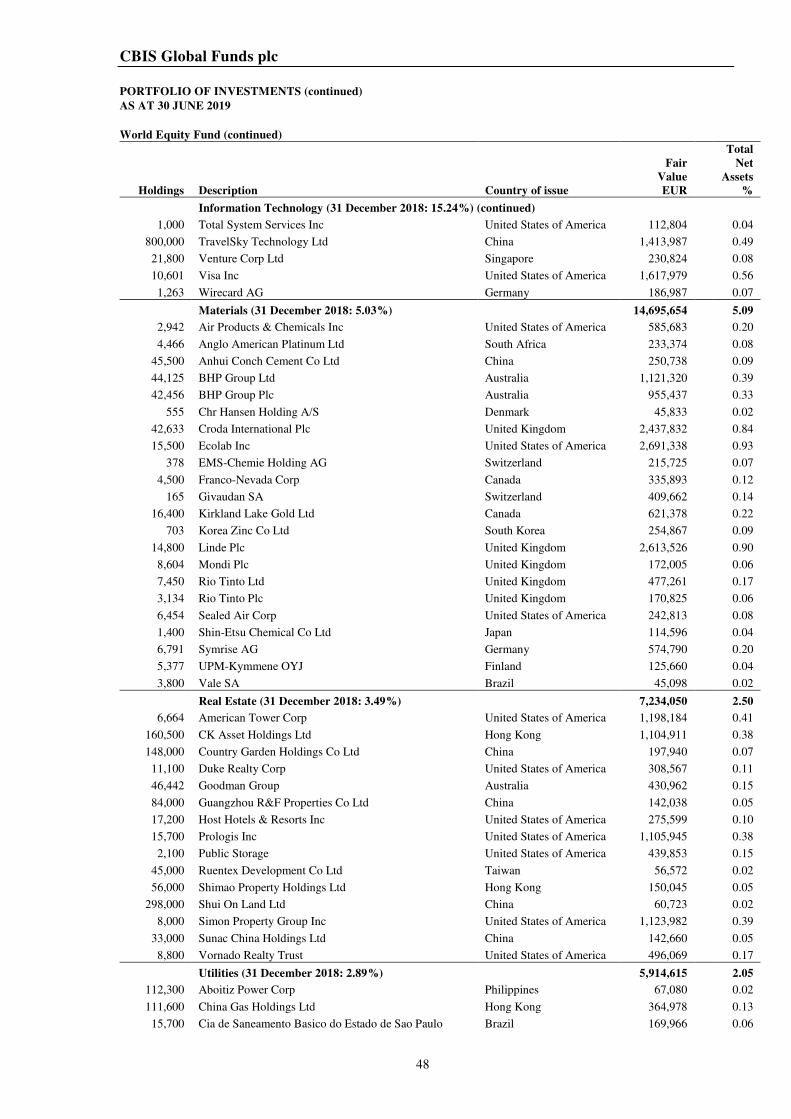
CBIS Global Funds plc
PORTFOLIO OF INVESTMENTS (continued)
AS AT 30 JUNE 2019
48
World Equity Fund (continued)
Holdings Description Country of issue
Fair
Value
EUR
Total
Net
Assets
%
Information Technology (31 December 2018: 15.24%) (continued)
1,000 Total System Services Inc United States of America 112,804 0.04
800,000 TravelSky Technology Ltd China 1,413,987 0.49
21,800 Venture Corp Ltd Singapore 230,824 0.08
10,601 Visa Inc United States of America 1,617,979 0.56
1,263 Wirecard AG Germany 186,987 0.07
Materials (31 December 2018: 5.03%) 14,695,654 5.09
2,942 Air Products & Chemicals Inc United States of America 585,683 0.20
4,466 Anglo American Platinum Ltd South Africa 233,374 0.08
45,500 Anhui Conch Cement Co Ltd China 250,738 0.09
44,125 BHP Group Ltd Australia 1,121,320 0.39
42,456 BHP Group Plc Australia 955,437 0.33
555 Chr Hansen Holding A/S Denmark 45,833 0.02
42,633 Croda International Plc United Kingdom 2,437,832 0.84
15,500 Ecolab Inc United States of America 2,691,338 0.93
378 EMS-Chemie Holding AG Switzerland 215,725 0.07
4,500 Franco-Nevada Corp Canada 335,893 0.12
165 Givaudan SA Switzerland 409,662 0.14
16,400 Kirkland Lake Gold Ltd Canada 621,378 0.22
703 Korea Zinc Co Ltd South Korea 254,867 0.09
14,800 Linde Plc United Kingdom 2,613,526 0.90
8,604 Mondi Plc United Kingdom 172,005 0.06
7,450 Rio Tinto Ltd United Kingdom 477,261 0.17
3,134 Rio Tinto Plc United Kingdom 170,825 0.06
6,454 Sealed Air Corp United States of America 242,813 0.08
1,400 Shin-Etsu Chemical Co Ltd Japan 114,596 0.04
6,791 Symrise AG Germany 574,790 0.20
5,377 UPM-Kymmene OYJ Finland 125,660 0.04
3,800 Vale SA Brazil 45,098 0.02
Real Estate (31 December 2018: 3.49%) 7,234,050 2.50
6,664 American Tower Corp United States of America 1,198,184 0.41
160,500 CK Asset Holdings Ltd Hong Kong 1,104,911 0.38
148,000 Country Garden Holdings Co Ltd China 197,940 0.07
11,100 Duke Realty Corp United States of America 308,567 0.11
46,442 Goodman Group Australia 430,962 0.15
84,000 Guangzhou R&F Properties Co Ltd China 142,038 0.05
17,200 Host Hotels & Resorts Inc United States of America 275,599 0.10
15,700 Prologis Inc United States of America 1,105,945 0.38
2,100 Public Storage United States of America 439,853 0.15
45,000 Ruentex Development Co Ltd Taiwan 56,572 0.02
56,000 Shimao Property Holdings Ltd Hong Kong 150,045 0.05
298,000 Shui On Land Ltd China 60,723 0.02
8,000 Simon Property Group Inc United States of America 1,123,982 0.39
33,000 Sunac China Holdings Ltd China 142,660 0.05
8,800 Vornado Realty Trust United States of America 496,069 0.17
Utilities (31 December 2018: 2.89%) 5,914,615 2.05
112,300 Aboitiz Power Corp Philippines 67,080 0.02
111,600 China Gas Holdings Ltd Hong Kong 364,978 0.13
15,700 Cia de Saneamento Basico do Estado de Sao Paulo Brazil 169,966 0.06
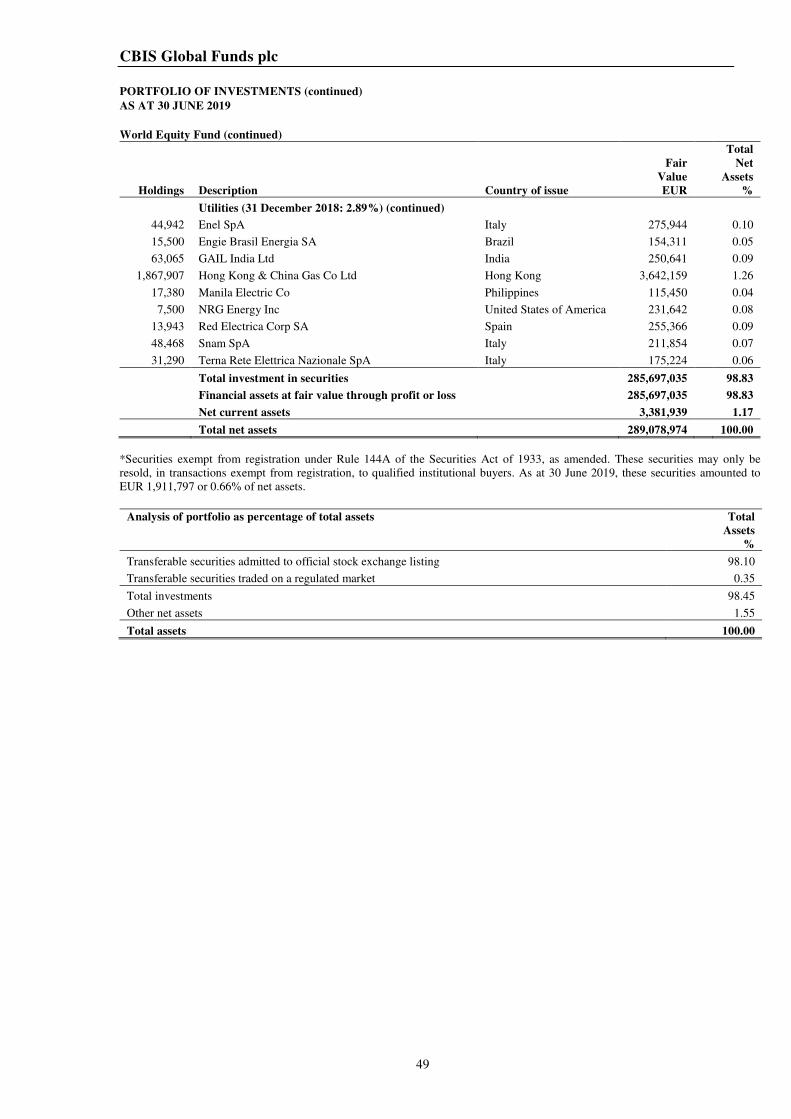
CBIS Global Funds plc
PORTFOLIO OF INVESTMENTS (continued)
AS AT 30 JUNE 2019
49
World Equity Fund (continued)
Holdings Description Country of issue
Fair
Value
EUR
Total
Net
Assets
%
Utilities (31 December 2018: 2.89%) (continued)
44,942 Enel SpA Italy 275,944 0.10
15,500 Engie Brasil Energia SA Brazil 154,311 0.05
63,065 GAIL India Ltd India 250,641 0.09
1,867,907 Hong Kong & China Gas Co Ltd Hong Kong 3,642,159 1.26
17,380 Manila Electric Co Philippines 115,450 0.04
7,500 NRG Energy Inc United States of America 231,642 0.08
13,943 Red Electrica Corp SA Spain 255,366 0.09
48,468 Snam SpA Italy 211,854 0.07
31,290 Terna Rete Elettrica Nazionale SpA Italy 175,224 0.06
Total investment in securities 285,697,035 98.83
Financial assets at fair value through profit or loss 285,697,035 98.83
Net current assets 3,381,939 1.17
Total net assets 289,078,974 100.00
*Securities exempt from registration under Rule 144A of the Securities Act of 1933, as amended. These securities may only be
resold, in transactions exempt from registration, to qualified institutional buyers. As at 30 June 2019, these securities amounted to
EUR 1,911,797 or 0.66% of net assets.
Analysis of portfolio as percentage of total assets Total
Assets
%
Transferable securities admitted to official stock exchange listing 98.10
Transferable securities traded on a regulated market 0.35
Total investments 98.45
Other net assets 1.55
Total assets 100.00
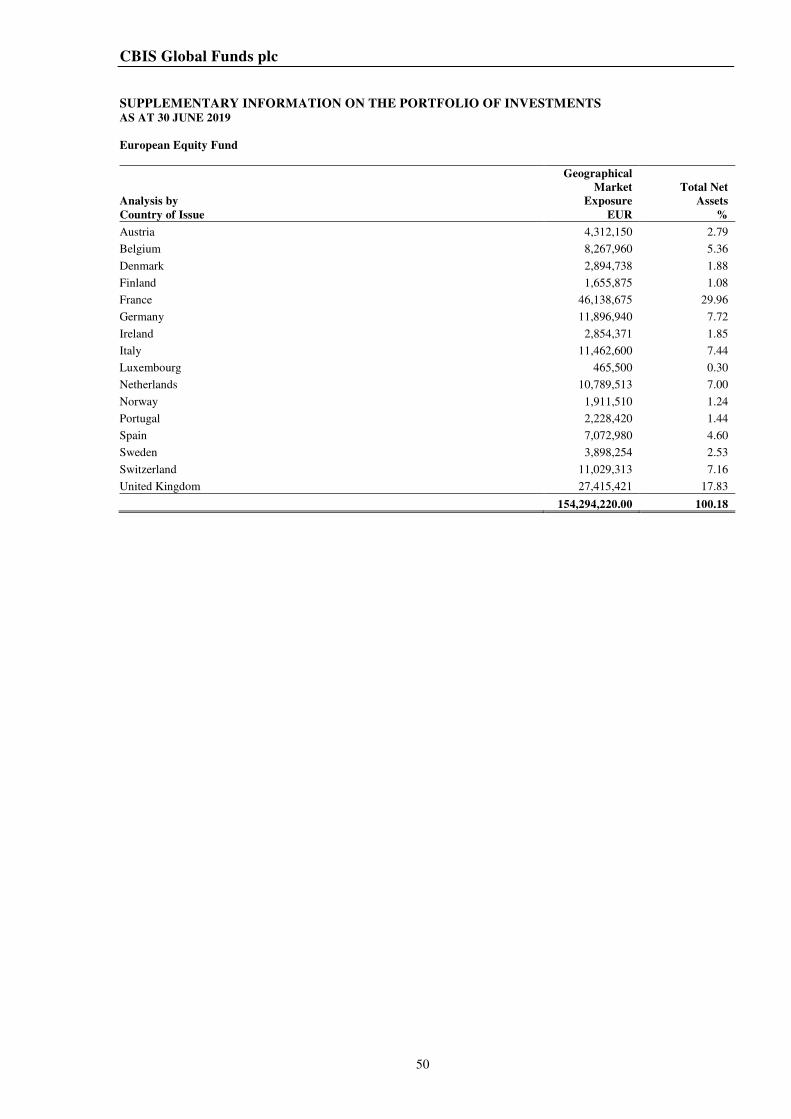
CBIS Global Funds plc
50
SUPPLEMENTARY INFORMATION ON THE PORTFOLIO OF INVESTMENTS AS AT 30 JUNE 2019
European Equity Fund
Analysis by
Country of Issue
Geographical
Market
Exposure
EUR
Total Net
Assets
%
Austria 4,312,150 2.79
Belgium 8,267,960 5.36
Denmark 2,894,738 1.88
Finland 1,655,875 1.08
France 46,138,675 29.96
Germany 11,896,940 7.72
Ireland 2,854,371 1.85
Italy 11,462,600 7.44
Luxembourg 465,500 0.30
Netherlands 10,789,513 7.00
Norway 1,911,510 1.24
Portugal 2,228,420 1.44
Spain 7,072,980 4.60
Sweden 3,898,254 2.53
Switzerland 11,029,313 7.16
United Kingdom 27,415,421 17.83
154,294,220.00 100.18
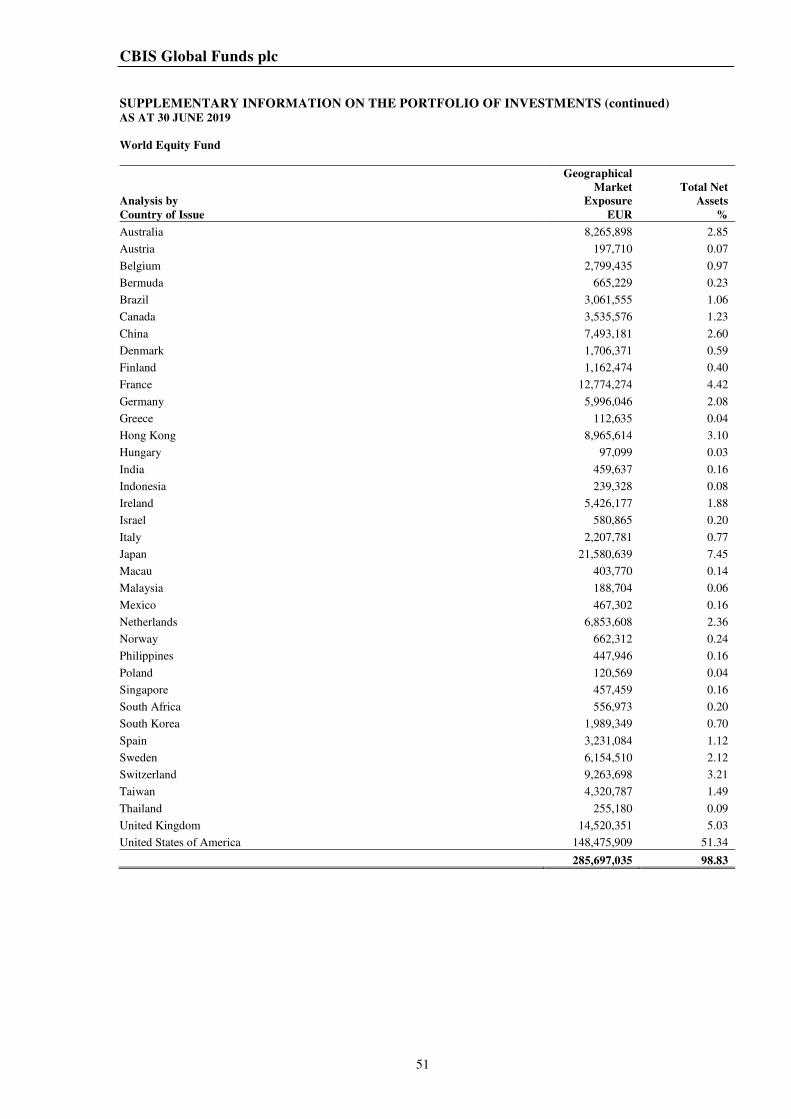
CBIS Global Funds plc
51
SUPPLEMENTARY INFORMATION ON THE PORTFOLIO OF INVESTMENTS (continued) AS AT 30 JUNE 2019
World Equity Fund
Analysis by
Country of Issue
Geographical
Market
Exposure
EUR
Total Net
Assets
%
Australia 8,265,898 2.85
Austria 197,710 0.07
Belgium 2,799,435 0.97
Bermuda 665,229 0.23
Brazil 3,061,555 1.06
Canada 3,535,576 1.23
China 7,493,181 2.60
Denmark 1,706,371 0.59
Finland 1,162,474 0.40
France 12,774,274 4.42
Germany 5,996,046 2.08
Greece 112,635 0.04
Hong Kong 8,965,614 3.10
Hungary 97,099 0.03
India 459,637 0.16
Indonesia 239,328 0.08
Ireland 5,426,177 1.88
Israel 580,865 0.20
Italy 2,207,781 0.77
Japan 21,580,639 7.45
Macau 403,770 0.14
Malaysia 188,704 0.06
Mexico 467,302 0.16
Netherlands 6,853,608 2.36
Norway 662,312 0.24
Philippines 447,946 0.16
Poland 120,569 0.04
Singapore 457,459 0.16
South Africa 556,973 0.20
South Korea 1,989,349 0.70
Spain 3,231,084 1.12
Sweden 6,154,510 2.12
Switzerland 9,263,698 3.21
Taiwan 4,320,787 1.49
Thailand 255,180 0.09
United Kingdom 14,520,351 5.03
United States of America 148,475,909 51.34
285,697,035 98.83
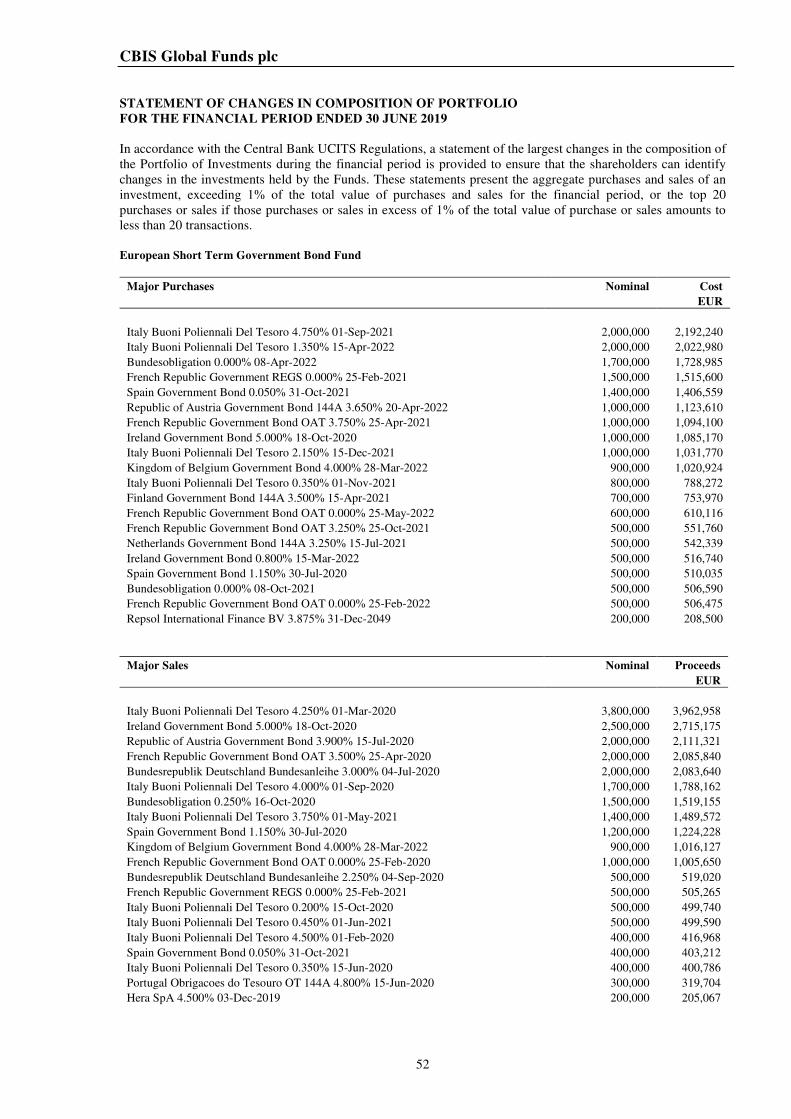
CBIS Global Funds plc
52
STATEMENT OF CHANGES IN COMPOSITION OF PORTFOLIO
FOR THE FINANCIAL PERIOD ENDED 30 JUNE 2019
In accordance with the Central Bank UCITS Regulations, a statement of the largest changes in the composition of
the Portfolio of Investments during the financial period is provided to ensure that the shareholders can identify
changes in the investments held by the Funds. These statements present the aggregate purchases and sales of an
investment, exceeding 1% of the total value of purchases and sales for the financial period, or the top 20
purchases or sales if those purchases or sales in excess of 1% of the total value of purchase or sales amounts to
less than 20 transactions.
European Short Term Government Bond Fund
Major Purchases Nominal Cost
EUR
Italy Buoni Poliennali Del Tesoro 4.750% 01-Sep-2021 2,000,000 2,192,240
Italy Buoni Poliennali Del Tesoro 1.350% 15-Apr-2022 2,000,000 2,022,980
Bundesobligation 0.000% 08-Apr-2022 1,700,000 1,728,985
French Republic Government REGS 0.000% 25-Feb-2021 1,500,000 1,515,600
Spain Government Bond 0.050% 31-Oct-2021 1,400,000 1,406,559
Republic of Austria Government Bond 144A 3.650% 20-Apr-2022 1,000,000 1,123,610
French Republic Government Bond OAT 3.750% 25-Apr-2021 1,000,000 1,094,100
Ireland Government Bond 5.000% 18-Oct-2020 1,000,000 1,085,170
Italy Buoni Poliennali Del Tesoro 2.150% 15-Dec-2021 1,000,000 1,031,770
Kingdom of Belgium Government Bond 4.000% 28-Mar-2022 900,000 1,020,924
Italy Buoni Poliennali Del Tesoro 0.350% 01-Nov-2021 800,000 788,272
Finland Government Bond 144A 3.500% 15-Apr-2021 700,000 753,970
French Republic Government Bond OAT 0.000% 25-May-2022 600,000 610,116
French Republic Government Bond OAT 3.250% 25-Oct-2021 500,000 551,760
Netherlands Government Bond 144A 3.250% 15-Jul-2021 500,000 542,339
Ireland Government Bond 0.800% 15-Mar-2022 500,000 516,740
Spain Government Bond 1.150% 30-Jul-2020 500,000 510,035
Bundesobligation 0.000% 08-Oct-2021 500,000 506,590
French Republic Government Bond OAT 0.000% 25-Feb-2022 500,000 506,475
Repsol International Finance BV 3.875% 31-Dec-2049 200,000 208,500
Major Sales Nominal Proceeds
EUR
Italy Buoni Poliennali Del Tesoro 4.250% 01-Mar-2020 3,800,000 3,962,958
Ireland Government Bond 5.000% 18-Oct-2020 2,500,000 2,715,175
Republic of Austria Government Bond 3.900% 15-Jul-2020 2,000,000 2,111,321
French Republic Government Bond OAT 3.500% 25-Apr-2020 2,000,000 2,085,840
Bundesrepublik Deutschland Bundesanleihe 3.000% 04-Jul-2020 2,000,000 2,083,640
Italy Buoni Poliennali Del Tesoro 4.000% 01-Sep-2020 1,700,000 1,788,162
Bundesobligation 0.250% 16-Oct-2020 1,500,000 1,519,155
Italy Buoni Poliennali Del Tesoro 3.750% 01-May-2021 1,400,000 1,489,572
Spain Government Bond 1.150% 30-Jul-2020 1,200,000 1,224,228
Kingdom of Belgium Government Bond 4.000% 28-Mar-2022 900,000 1,016,127
French Republic Government Bond OAT 0.000% 25-Feb-2020 1,000,000 1,005,650
Bundesrepublik Deutschland Bundesanleihe 2.250% 04-Sep-2020 500,000 519,020
French Republic Government REGS 0.000% 25-Feb-2021 500,000 505,265
Italy Buoni Poliennali Del Tesoro 0.200% 15-Oct-2020 500,000 499,740
Italy Buoni Poliennali Del Tesoro 0.450% 01-Jun-2021 500,000 499,590
Italy Buoni Poliennali Del Tesoro 4.500% 01-Feb-2020 400,000 416,968
Spain Government Bond 0.050% 31-Oct-2021 400,000 403,212
Italy Buoni Poliennali Del Tesoro 0.350% 15-Jun-2020 400,000 400,786
Portugal Obrigacoes do Tesouro OT 144A 4.800% 15-Jun-2020 300,000 319,704
Hera SpA 4.500% 03-Dec-2019 200,000 205,067
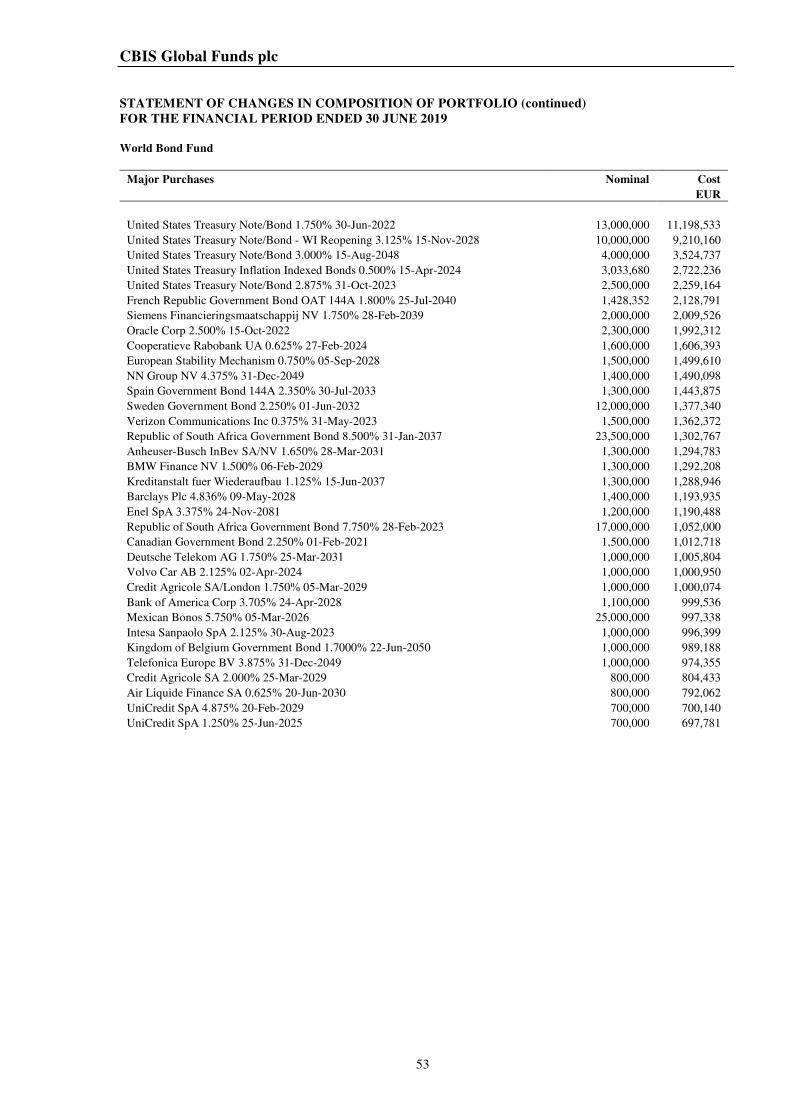
CBIS Global Funds plc
53
STATEMENT OF CHANGES IN COMPOSITION OF PORTFOLIO (continued)
FOR THE FINANCIAL PERIOD ENDED 30 JUNE 2019
World Bond Fund
Major Purchases Nominal Cost
EUR
United States Treasury Note/Bond 1.750% 30-Jun-2022 13,000,000 11,198,533
United States Treasury Note/Bond - WI Reopening 3.125% 15-Nov-2028 10,000,000 9,210,160
United States Treasury Note/Bond 3.000% 15-Aug-2048 4,000,000 3,524,737
United States Treasury Inflation Indexed Bonds 0.500% 15-Apr-2024 3,033,680 2,722,236
United States Treasury Note/Bond 2.875% 31-Oct-2023 2,500,000 2,259,164
French Republic Government Bond OAT 144A 1.800% 25-Jul-2040 1,428,352 2,128,791
Siemens Financieringsmaatschappij NV 1.750% 28-Feb-2039 2,000,000 2,009,526
Oracle Corp 2.500% 15-Oct-2022 2,300,000 1,992,312
Cooperatieve Rabobank UA 0.625% 27-Feb-2024 1,600,000 1,606,393
European Stability Mechanism 0.750% 05-Sep-2028 1,500,000 1,499,610
NN Group NV 4.375% 31-Dec-2049 1,400,000 1,490,098
Spain Government Bond 144A 2.350% 30-Jul-2033 1,300,000 1,443,875
Sweden Government Bond 2.250% 01-Jun-2032 12,000,000 1,377,340
Verizon Communications Inc 0.375% 31-May-2023 1,500,000 1,362,372
Republic of South Africa Government Bond 8.500% 31-Jan-2037 23,500,000 1,302,767
Anheuser-Busch InBev SA/NV 1.650% 28-Mar-2031 1,300,000 1,294,783
BMW Finance NV 1.500% 06-Feb-2029 1,300,000 1,292,208
Kreditanstalt fuer Wiederaufbau 1.125% 15-Jun-2037 1,300,000 1,288,946
Barclays Plc 4.836% 09-May-2028 1,400,000 1,193,935
Enel SpA 3.375% 24-Nov-2081 1,200,000 1,190,488
Republic of South Africa Government Bond 7.750% 28-Feb-2023 17,000,000 1,052,000
Canadian Government Bond 2.250% 01-Feb-2021 1,500,000 1,012,718
Deutsche Telekom AG 1.750% 25-Mar-2031 1,000,000 1,005,804
Volvo Car AB 2.125% 02-Apr-2024 1,000,000 1,000,950
Credit Agricole SA/London 1.750% 05-Mar-2029 1,000,000 1,000,074
Bank of America Corp 3.705% 24-Apr-2028 1,100,000 999,536
Mexican Bonos 5.750% 05-Mar-2026 25,000,000 997,338
Intesa Sanpaolo SpA 2.125% 30-Aug-2023 1,000,000 996,399
Kingdom of Belgium Government Bond 1.7000% 22-Jun-2050 1,000,000 989,188
Telefonica Europe BV 3.875% 31-Dec-2049 1,000,000 974,355
Credit Agricole SA 2.000% 25-Mar-2029 800,000 804,433
Air Liquide Finance SA 0.625% 20-Jun-2030 800,000 792,062
UniCredit SpA 4.875% 20-Feb-2029 700,000 700,140
UniCredit SpA 1.250% 25-Jun-2025 700,000 697,781
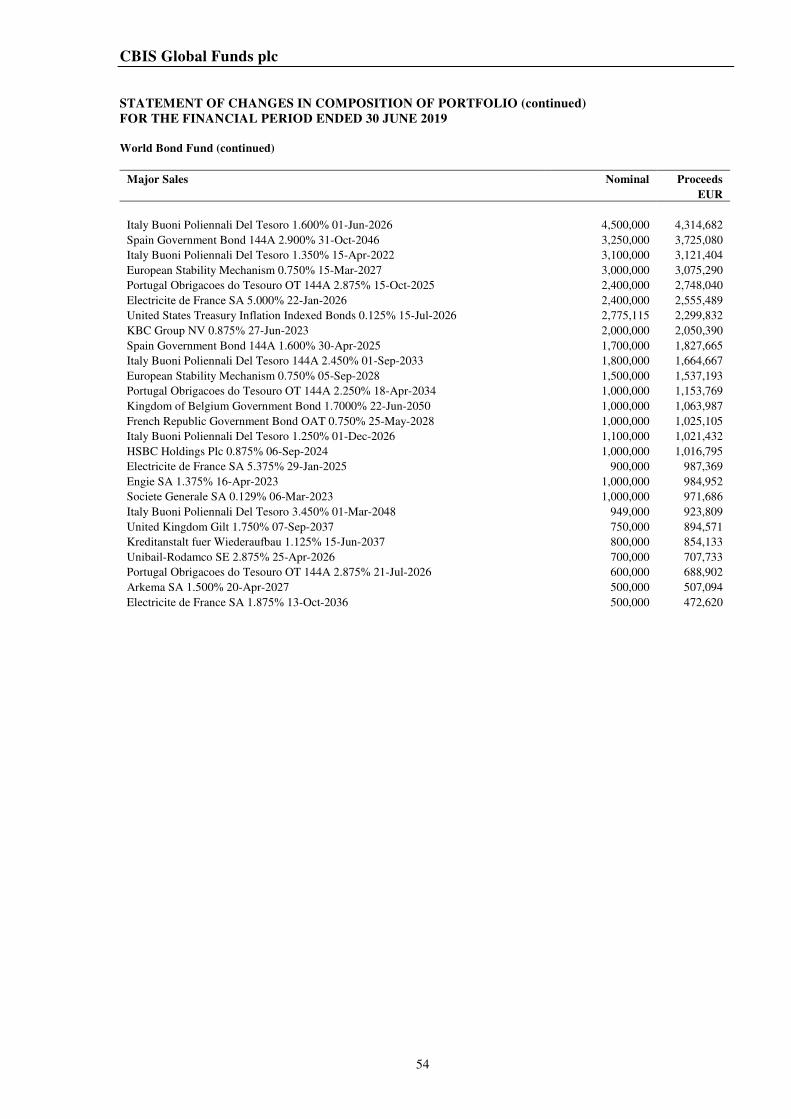
CBIS Global Funds plc
54
STATEMENT OF CHANGES IN COMPOSITION OF PORTFOLIO (continued)
FOR THE FINANCIAL PERIOD ENDED 30 JUNE 2019
World Bond Fund (continued)
Major Sales Nominal Proceeds
EUR
Italy Buoni Poliennali Del Tesoro 1.600% 01-Jun-2026 4,500,000 4,314,682
Spain Government Bond 144A 2.900% 31-Oct-2046 3,250,000 3,725,080
Italy Buoni Poliennali Del Tesoro 1.350% 15-Apr-2022 3,100,000 3,121,404
European Stability Mechanism 0.750% 15-Mar-2027 3,000,000 3,075,290
Portugal Obrigacoes do Tesouro OT 144A 2.875% 15-Oct-2025 2,400,000 2,748,040
Electricite de France SA 5.000% 22-Jan-2026 2,400,000 2,555,489
United States Treasury Inflation Indexed Bonds 0.125% 15-Jul-2026 2,775,115 2,299,832
KBC Group NV 0.875% 27-Jun-2023 2,000,000 2,050,390
Spain Government Bond 144A 1.600% 30-Apr-2025 1,700,000 1,827,665
Italy Buoni Poliennali Del Tesoro 144A 2.450% 01-Sep-2033 1,800,000 1,664,667
European Stability Mechanism 0.750% 05-Sep-2028 1,500,000 1,537,193
Portugal Obrigacoes do Tesouro OT 144A 2.250% 18-Apr-2034 1,000,000 1,153,769
Kingdom of Belgium Government Bond 1.7000% 22-Jun-2050 1,000,000 1,063,987
French Republic Government Bond OAT 0.750% 25-May-2028 1,000,000 1,025,105
Italy Buoni Poliennali Del Tesoro 1.250% 01-Dec-2026 1,100,000 1,021,432
HSBC Holdings Plc 0.875% 06-Sep-2024 1,000,000 1,016,795
Electricite de France SA 5.375% 29-Jan-2025 900,000 987,369
Engie SA 1.375% 16-Apr-2023 1,000,000 984,952
Societe Generale SA 0.129% 06-Mar-2023 1,000,000 971,686
Italy Buoni Poliennali Del Tesoro 3.450% 01-Mar-2048 949,000 923,809
United Kingdom Gilt 1.750% 07-Sep-2037 750,000 894,571
Kreditanstalt fuer Wiederaufbau 1.125% 15-Jun-2037 800,000 854,133
Unibail-Rodamco SE 2.875% 25-Apr-2026 700,000 707,733
Portugal Obrigacoes do Tesouro OT 144A 2.875% 21-Jul-2026 600,000 688,902
Arkema SA 1.500% 20-Apr-2027 500,000 507,094
Electricite de France SA 1.875% 13-Oct-2036 500,000 472,620
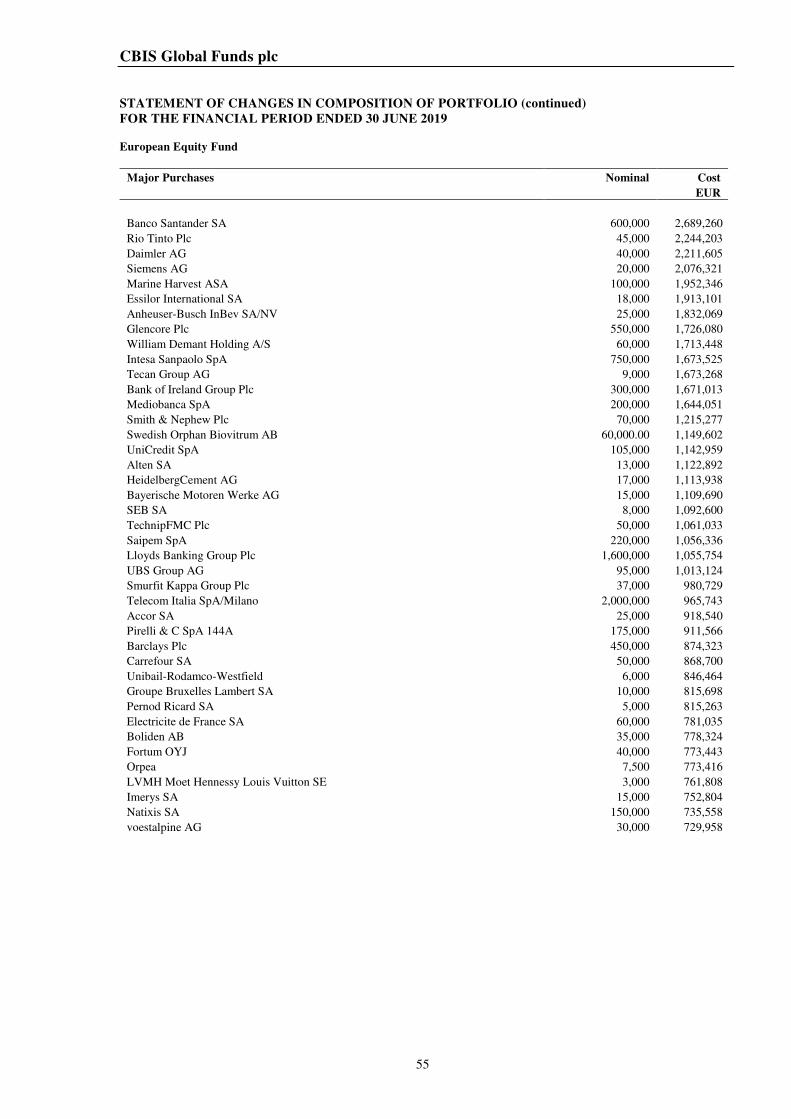
CBIS Global Funds plc
55
STATEMENT OF CHANGES IN COMPOSITION OF PORTFOLIO (continued)
FOR THE FINANCIAL PERIOD ENDED 30 JUNE 2019
European Equity Fund
Major Purchases Nominal Cost
EUR
Banco Santander SA 600,000 2,689,260
Rio Tinto Plc 45,000 2,244,203
Daimler AG 40,000 2,211,605
Siemens AG 20,000 2,076,321
Marine Harvest ASA 100,000 1,952,346
Essilor International SA 18,000 1,913,101
Anheuser-Busch InBev SA/NV 25,000 1,832,069
Glencore Plc 550,000 1,726,080
William Demant Holding A/S 60,000 1,713,448
Intesa Sanpaolo SpA 750,000 1,673,525
Tecan Group AG 9,000 1,673,268
Bank of Ireland Group Plc 300,000 1,671,013
Mediobanca SpA 200,000 1,644,051
Smith & Nephew Plc 70,000 1,215,277
Swedish Orphan Biovitrum AB 60,000.00 1,149,602
UniCredit SpA 105,000 1,142,959
Alten SA 13,000 1,122,892
HeidelbergCement AG 17,000 1,113,938
Bayerische Motoren Werke AG 15,000 1,109,690
SEB SA 8,000 1,092,600
TechnipFMC Plc 50,000 1,061,033
Saipem SpA 220,000 1,056,336
Lloyds Banking Group Plc 1,600,000 1,055,754
UBS Group AG 95,000 1,013,124
Smurfit Kappa Group Plc 37,000 980,729
Telecom Italia SpA/Milano 2,000,000 965,743
Accor SA 25,000 918,540
Pirelli & C SpA 144A 175,000 911,566
Barclays Plc 450,000 874,323
Carrefour SA 50,000 868,700
Unibail-Rodamco-Westfield 6,000 846,464
Groupe Bruxelles Lambert SA 10,000 815,698
Pernod Ricard SA 5,000 815,263
Electricite de France SA 60,000 781,035
Boliden AB 35,000 778,324
Fortum OYJ 40,000 773,443
Orpea 7,500 773,416
LVMH Moet Hennessy Louis Vuitton SE 3,000 761,808
Imerys SA 15,000 752,804
Natixis SA 150,000 735,558
voestalpine AG 30,000 729,958
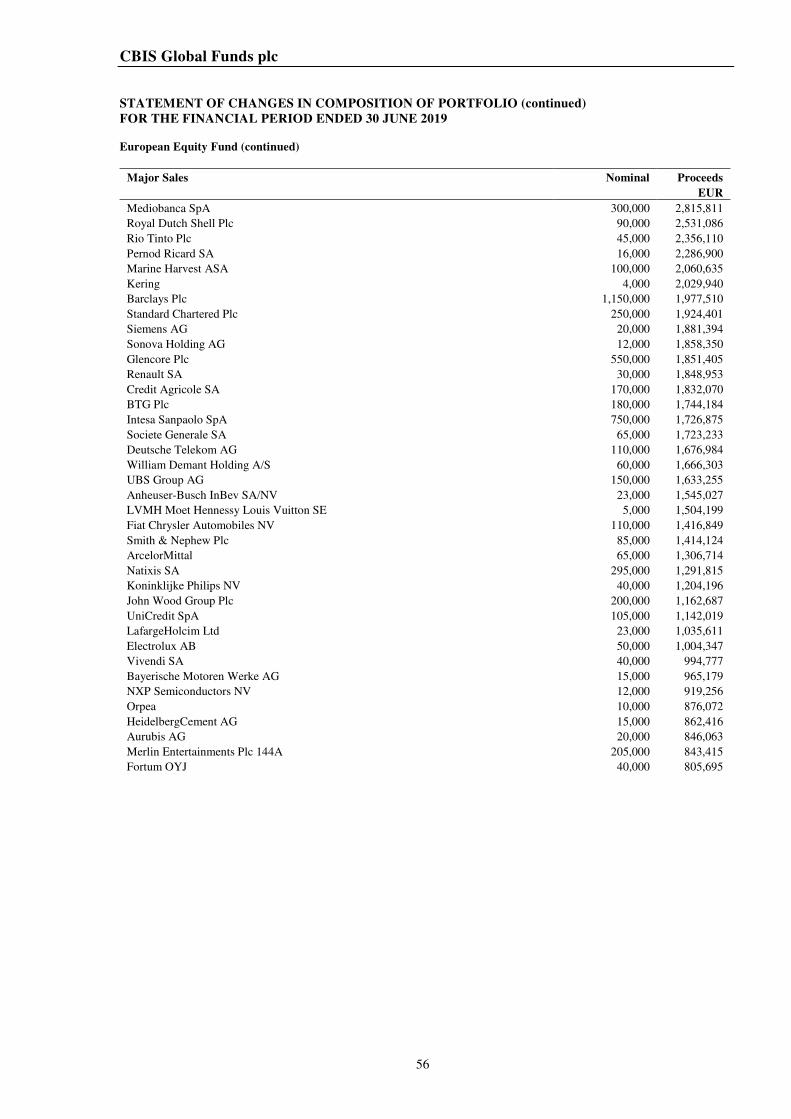
CBIS Global Funds plc
56
STATEMENT OF CHANGES IN COMPOSITION OF PORTFOLIO (continued)
FOR THE FINANCIAL PERIOD ENDED 30 JUNE 2019
European Equity Fund (continued)
Major Sales Nominal Proceeds
EUR
Mediobanca SpA 300,000 2,815,811
Royal Dutch Shell Plc 90,000 2,531,086
Rio Tinto Plc 45,000 2,356,110
Pernod Ricard SA 16,000 2,286,900
Marine Harvest ASA 100,000 2,060,635
Kering 4,000 2,029,940
Barclays Plc 1,150,000 1,977,510
Standard Chartered Plc 250,000 1,924,401
Siemens AG 20,000 1,881,394
Sonova Holding AG 12,000 1,858,350
Glencore Plc 550,000 1,851,405
Renault SA 30,000 1,848,953
Credit Agricole SA 170,000 1,832,070
BTG Plc 180,000 1,744,184
Intesa Sanpaolo SpA 750,000 1,726,875
Societe Generale SA 65,000 1,723,233
Deutsche Telekom AG 110,000 1,676,984
William Demant Holding A/S 60,000 1,666,303
UBS Group AG 150,000 1,633,255
Anheuser-Busch InBev SA/NV 23,000 1,545,027
LVMH Moet Hennessy Louis Vuitton SE 5,000 1,504,199
Fiat Chrysler Automobiles NV 110,000 1,416,849
Smith & Nephew Plc 85,000 1,414,124
ArcelorMittal 65,000 1,306,714
Natixis SA 295,000 1,291,815
Koninklijke Philips NV 40,000 1,204,196
John Wood Group Plc 200,000 1,162,687
UniCredit SpA 105,000 1,142,019
LafargeHolcim Ltd 23,000 1,035,611
Electrolux AB 50,000 1,004,347
Vivendi SA 40,000 994,777
Bayerische Motoren Werke AG 15,000 965,179
NXP Semiconductors NV 12,000 919,256
Orpea 10,000 876,072
HeidelbergCement AG 15,000 862,416
Aurubis AG 20,000 846,063
Merlin Entertainments Plc 144A 205,000 843,415
Fortum OYJ 40,000 805,695
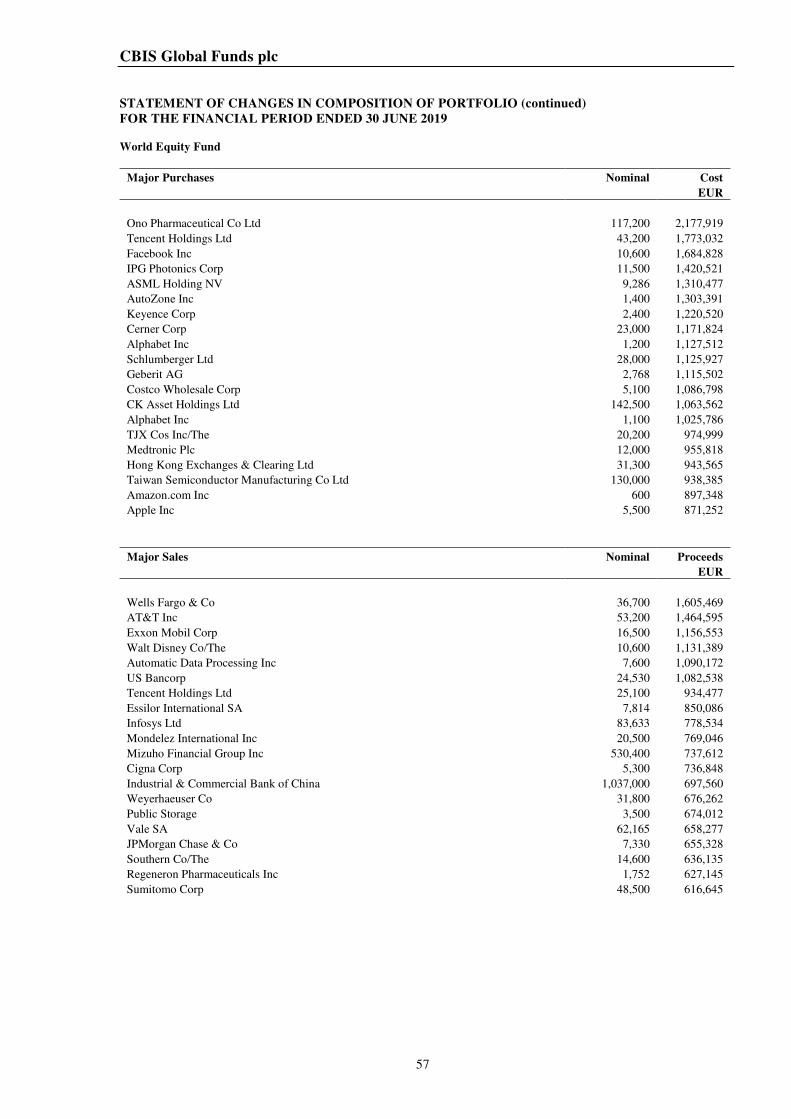
CBIS Global Funds plc
57
STATEMENT OF CHANGES IN COMPOSITION OF PORTFOLIO (continued)
FOR THE FINANCIAL PERIOD ENDED 30 JUNE 2019
World Equity Fund
Major Purchases Nominal Cost
EUR
Ono Pharmaceutical Co Ltd 117,200 2,177,919
Tencent Holdings Ltd 43,200 1,773,032
Facebook Inc 10,600 1,684,828
IPG Photonics Corp 11,500 1,420,521
ASML Holding NV 9,286 1,310,477
AutoZone Inc 1,400 1,303,391
Keyence Corp 2,400 1,220,520
Cerner Corp 23,000 1,171,824
Alphabet Inc 1,200 1,127,512
Schlumberger Ltd 28,000 1,125,927
Geberit AG 2,768 1,115,502
Costco Wholesale Corp 5,100 1,086,798
CK Asset Holdings Ltd 142,500 1,063,562
Alphabet Inc 1,100 1,025,786
TJX Cos Inc/The 20,200 974,999
Medtronic Plc 12,000 955,818
Hong Kong Exchanges & Clearing Ltd 31,300 943,565
Taiwan Semiconductor Manufacturing Co Ltd 130,000 938,385
Amazon.com Inc 600 897,348
Apple Inc 5,500 871,252
Major Sales Nominal Proceeds
EUR
Wells Fargo & Co 36,700 1,605,469
AT&T Inc 53,200 1,464,595
Exxon Mobil Corp 16,500 1,156,553
Walt Disney Co/The 10,600 1,131,389
Automatic Data Processing Inc 7,600 1,090,172
US Bancorp 24,530 1,082,538
Tencent Holdings Ltd 25,100 934,477
Essilor International SA 7,814 850,086
Infosys Ltd 83,633 778,534
Mondelez International Inc 20,500 769,046
Mizuho Financial Group Inc 530,400 737,612
Cigna Corp 5,300 736,848
Industrial & Commercial Bank of China 1,037,000 697,560
Weyerhaeuser Co 31,800 676,262
Public Storage 3,500 674,012
Vale SA 62,165 658,277
JPMorgan Chase & Co 7,330 655,328
Southern Co/The 14,600 636,135
Regeneron Pharmaceuticals Inc 1,752 627,145
Sumitomo Corp 48,500 616,645