Embed Size (px)
Citation preview

The New England Common Assessment Program
Guide to Using the 2015 NECAP Science Reports
Guide to Using the 2015 NECAP Science Reports 1
Contact Information
If you have questions after reviewing this guide, please contact the Department of Education or Agency of Education for your state. New Hampshire Department of Education: Keith R. Burke, Assessment Consultant, 603-271-3846, [email protected], 101 Pleasant Street, Concord, NH 03301, www.education.nh.gov Rhode Island Department of Elementary and Secondary Education: Dr. Kevon Tucker-Seeley, Office of Instruction, Assessment and Curriculum, 401-222-8494, [email protected], 255 Westminster Street, Providence, RI 02903, www.ride.ri.gov Vermont Agency of Education: Michael Hock, Director of Assessment, 802-479-1288, [email protected], 219 North Main Street, Barre, VT 05641, education.vermont.gov

Guide to Using the 2015 NECAP Science Reports 2
Table of Contents Introduction ........................................................................................................................ ..4 NECAP Background .................................................................................................................. ..4 Document Purpose .................................................................................................................... ..4 Accessing Reports .................................................................................................................... ..5 General Guidelines for the Use of NECAP Reports .......................................................... ..6 Alignment of Curriculum and the NECAP Tests ........................................................................ ..6 Use of NECAP Student-Level Results ...................................................................................... ..6 Multiple Data Points Needed for Trend Analysis ....................................................................... ..6 Regulations Regarding Confidentiality of Student Records ....................................................... ..6 NCME Code of Professional Responsibilities in Educational Measurement ............................. ..6 Understanding the NECAP Student Report ....................................................................... ..7 Student’s Achievement Level and Score ................................................................................... ..7 Student’s Achievement Level Compared to Other Students by School, District, and State ...... ..7 Student’s Performance in Science Domains ............................................................................. ..7 Description of the Inquiry Task .................................................................................................. ..8 Sample Grade 11 NECAP Student Report ................................................................................ ..9 Understanding the Item Analysis Report ........................................................................... 11 Sample Grade 4 NECAP Item Analysis Report ......................................................................... 13 Understanding the School and District Results Reports .................................................... 14 Overview ................................................................................................................................... 14 Identification ........................................................................................................................... 14 Basis for Results .................................................................................................................... 14 Minimum Number of Students Needed to Generate Reports ................................................. 14 Making Comparisons Among Students, Schools, and Districts ................................................. 14 Comparisons of School- and District-Level Scores ................................................................ 15 Scaled Scores ........................................................................................................................ 15 Achievement Levels ............................................................................................................... 16 Science Domain Subscores ................................................................................................... 17 Achievement Level Cut Scores .............................................................................................. 18 Grade Level Summary Report ................................................................................................... 19 Participation in NECAP ............................................................................................................. 19 Students enrolled on or after May 4 ....................................................................................... 19 Students tested ...................................................................................................................... 19 Students tested with an approved accommodation ................................................................ 19 Current LEP students ............................................................................................................. 19 Current LEP student tested with an approved accommodation ............................................. 19 IEP students ........................................................................................................................... 19 IEP students tested with an approved accommodation .......................................................... 19 Students not tested in NECAP ............................................................................................... 19 NECAP Results ......................................................................................................................... 20 Sample Grade 8 NECAP School Results Report (Grade Level Summary Report) ................... 21 Science Results ......................................................................................................................... 22 Sample Grade 8 NECAP School Results Report (Science Results) ......................................... 23
Guide to Using the 2015 NECAP Science Reports 3
Disaggregated Science Results ................................................................................................ 24 Sample Grade 8 NECAP School Results Report (Disaggregated Science Results) ................. 25 Understanding the District Summary Report ..................................................................... 26 Overview ................................................................................................................................... 26 Sample NECAP District Summary Report ................................................................................. 27 District and School Student-Level Data Files .................................................................... 28 Analysis and Reporting System .................................................................................................. 29 Overview ................................................................................................................................... 29 Interactive Reports ................................................................................................................... 29 Item Analysis Reports ................................................................................................... 29 Achievement Level Summary ........................................................................................ 29 Released Items Summary Data ...................................................................................... 29 Longitudinal Data Report ............................................................................................... 30 Account Management .............................................................................................................. 30 Appendix A: Overview of Assessment Instruments and Procedures ................................ 31 Appendix B: Code of Professional Responsibilities in Educational Measurement ............. 37 Appendix C: NECAP Achievement Level Descriptions ...................................................... 45 Appendix D: Reference Materials ...................................................................................... 46

Guide to Using the 2015 NECAP Science Reports 4
Introduction NECAP Background New England Common Assessment Program (NECAP) was originally the result of collaboration among New Hampshire, Rhode Island, and Vermont to build a set of assessments for grades 3 through 8 & 11 to meet the requirements of the No Child Left Behind Act (NCLB). The three states decided to work together for three important reasons:
Working together brings together a team of assessment and content specialists with experience and expertise greater than any individual state.
Working together provides the capacity necessary for the three states to develop quality, customized assessments consistent with the overall goal of improving education.
Working together allows the sharing of costs in the development of a customized assessment program of a quality that would not be feasible for any individual state.
Document Purpose The primary purpose of this document is to support local educators’ use of test data from the May 2015 administration of the New England Common Assessment Program (NECAP) science tests. This document describes and explains the information included in the following types of NECAP reports shown below.
NECAP Tests of Spring 2015: NECAP Student Report NECAP Tests of Spring 2015: NECAP Item Analysis Report NECAP Tests of Spring 2015: NECAP District/School Results Report NECAP Tests of Spring 2015: NECAP District Summary Report NECAP Tests of Spring 2015: NECAP District/School Student-Level Data Files
These reports and data files contain information valuable to schools and districts in their efforts to better serve the academic needs of individual students and to evaluate and improve curriculum and instruction. In addition, this document can help school and district personnel communicate with their communities about the NECAP science test results. It is important to note that these reports contain results from the student assessment program, and not individual state accountability systems. Please note that the appendices contain important information about NECAP assessment instruments and procedures.
Guide to Using the 2015 NECAP Science Reports 5
Accessing Reports NH
School-, district-, and state-level NECAP reports can be accessed through the NHDOE website homepage: (http://www.education.nh.gov). Click on Accountability/Assessment, and then click on Reports to get to the Assessment and AYP Public Reporting website. NECAP Item Analysis Reports and student-level data files can be accessed using the following URL: http://iservices.measuredprogress.org. Principals and superintendents are able to access the confidential reports and files by selecting New England Common Assessment Program (NECAP) from the drop-down menu, clicking on the NECAP Reporting link, selecting the map of the state of NH, and entering their secure username and password.
RI
All NECAP reports and data files (confidential and non-confidential) can be accessed using the following URL: http://iservices.measuredprogress.org Principals and superintendents are able to access the reports and files by selecting New England Common Assessment Program (NECAP) from the drop-down menu, clicking on the NECAP Reporting link, selecting the map of the state of RI, and entering their secure username and password. School-, district-, and state-level NECAP reports can also be accessed through the RI public reporting website: http://reporting.measuredprogress.org/NECAPpublicRI/
VT
State- and school-level NECAP results, as well as results from other assessments, can be accessed on the VT AOE website using the following URL: (http://education.vermont.gov/new/html/pgm_assessment/data.html). Principals and superintendents are able to access all NECAP reports and data files by using the following URL: http://iservices.measuredprogress.org, selecting New England Common Assessment Program (NECAP) from the drop-down menu, clicking on the NECAP Reporting link, selecting the map of the state of VT, and entering their secure username and password.
Guide to Using the 2015 NECAP Science Reports 6
General Guidelines for the Use of NECAP Reports Alignment of Curriculum and the NECAP Tests All test items appearing on the NECAP science tests are designed to measure specific NECAP Science Assessment Targets and Inquiry Constructs. As schools align their curriculum and instructional programs with these standards, test results should reflect student progress towards these standards. Use of NECAP Student-Level Results NECAP science results are intended to evaluate how well students and schools are achieving the learning targets contained in the NECAP Science Assessment Targets and Inquiry Constructs. NECAP was designed primarily to provide detailed school-level results and accurate summary information about individual students. NECAP was not designed to provide, in isolation, detailed student-level diagnostic information for formulating individual instructional plans. However, NECAP results can be used, along with other measures, to identify students’ strengths and weaknesses. NECAP is only one indicator of student performance and should not be used for referring students to special education or for making promotion and/or graduation decisions. Multiple Data Points Needed for Trend Analysis A single year’s test results provide limited information about a school or district. As with any evaluation, school and district test results are most meaningful when compared with other indicators and when examined over several years for long-term trends in student performance. This is especially true in small schools where changes in student cohorts from year to year can have a noticeable influence on school results for any given year. Regulations Regarding Confidentiality of Student Records The Family Educational Rights and Privacy Act (FERPA) requires that access to individual student results, including those provided in the NECAP Item Analysis Report and the NECAP Student Report, be restricted to the student, the student’s parents/guardians, and authorized school personnel. Superintendents and principals are responsible for maintaining the privacy and security of all student records. In accordance with this federal regulation, authorized school personnel shall have access to the records of students to whom they are providing services when such access is required in the performance of their official duties. For more information about FERPA please visit the following website: http://www.ed.gov/policy/gen/guid/fpco/ferpa/index.html National Council on Measurement in Education (NCME) Code of Professional Responsibilities in Educational Measurement The Departments of Education in NH and RI, the Agency of Education in VT, and Measured Progress adhere to the NCME code. Local educators also have responsibilities under this code. The entire document can be found in Appendix B. More information about NCME can be found at www.ncme.org.
Guide to Using the 2015 NECAP Science Reports 7
Understanding the NECAP Student Report
The section below discusses the NECAP Student Report, which provides schools and parents/guardians with information about individual student performance. Schools will receive two copies of the NECAP Student Report. The colored copy of the report is for distribution to parents/guardians and the black and white copy of the report is for school files. The NECAP Student Report is confidential and should be kept secure within the school and district. Remember, the Family Educational Rights and Privacy Act (FERPA) requires that access to individual student results be restricted to the student, the student’s parents/guardians, and authorized school personnel. Details about the NECAP science tests and achievement levels are provided on the cover of the NECAP Student Report. Details about the student’s performance on the NECAP science tests are included on the inside of the report, which is explained in detail below. Parents/guardians are encouraged to contact the student’s school for more information on their child’s overall achievement after reviewing the NECAP Student Report. The NECAP Student Report is divided into four sections. Student’s Achievement Level and Score This section of the report shows the achievement level attained for science. Achievement Level Descriptions can be found in Appendix C and are provided on the reverse side of the report. The NECAP Student Report for grades 4, 8, and 11 shows the scaled score earned for science. The scaled score is reported with a score band that indicates the standard error of measurement surrounding the score. The standard error of measurement indicates how much a student’s score could vary if the student was examined repeatedly with the same test (assuming that no learning occurs between test administrations). Student’s Achievement Level Compared to Other Students by School, District, and State This section of the report lists the four achievement levels—Proficient with Distinction, Proficient, Partially Proficient, and Substantially Below Proficient—for science. This student’s performance is noted with a check mark in the appropriate box. The percentage of students at each achievement level is listed for the student’s school, district, and state. Student’s Performance in Science Domains This section of the report shows the student’s performance compared to school, district, and statewide performance in a variety of areas. The science areas assessed by NECAP are reported by domains: Physical Science, Earth Space Science, Life Science, and Scientific Inquiry. Student performance in the science domains is presented as a table including possible points, points earned by this student, and average points earned for the school, district, and state. The table also shows the performance in each science domain of students who performed near the beginning of the Proficient achievement level on the overall test. The range of scores shown represents one standard error above and below the average points earned by those students. Students’ performance in a science domain that falls within the range shown performed similarly to those students.
Guide to Using the 2015 NECAP Science Reports 8
Description of the Inquiry Task This section of the report includes text that describes inquiry as it relates to the performance task that is included as a part of the NECAP science test. The following paragraph is included on this section of the report: There are many interesting and essential facts, formulas, and processes that students should know across the three content domains of science. But science is more than content. Inquiry skills are skills that all students should have in addition to the content. Inquiry skills are the ability to formulate questions and hypothesize, plan investigations and experiments, conduct investigations and experiments, and evaluate results. These are the broad areas that constitute scientific inquiry. Content from Physical Science, Earth Space Science, and Life Science forms the basis of each NECAP Science Inquiry Task. Instead of measuring student knowledge of content, inquiry tasks measure the student’s ability to make connections, express ideas, and provide evidence of scientific thinking. A grade specific paragraph is also included describing the inquiry task that students completed for that grade. The following two pages contain a sample grade 11 NECAP Student Report.
Guide to Using the 2015 NECAP Science Reports 9
NECAP Student Report - Spring 2015
This report contains results from the Spring 2015 New England Common Assessment Program (NECAP) science tests. The NECAP tests are administered to students in New Hampshire, Rhode Island, and Vermont as part of each state’s statewide assessment program. The NECAP tests are designed to measure student performance on standards developed and adopted by the three states. Specifically, the tests are designed to measure the content and skills that students are expected to have at the end of the K–4, 5–8, and 9–11 grade spans.
NECAP science test results are used primarily for program evaluation, school improvement, and public reporting. Detailed school and district results are used by schools to help improve curriculum and
instruction. Individual student results are used to support information gathered through classroom instruction and assessments. Contact the school for more information on this student’s overall achievement.
Achievement Levels and Corresponding Score Ranges Student performance on the NECAP tests is classified into one of four achievement levels describing students’ level of proficiency on the content and skills required through the end of the tested grade. Performance at Proficient or Proficient with Distinction indicates that the student has a level of proficiency necessary to begin working successfully on higher grade content and skills. Performance below Proficient suggests that additional instruction and student work may be needed as the student is introduced to new content and skills at the next grade. Refer to the Achievement Level Descriptions contained in this report for a more detailed description of the achievement levels. There is a wide range of student proficiency within each achievement level. NECAP test results are also reported as scaled scores to provide additional information about the location of student performance within each achievement level. NECAP scores are reported as three-digit scores in which the first digit represents the grade level. The remaining digits range from 00 to 80. Scores of 40 and higher indicate a level of proficiency at or above the Proficient level. Scores below 40 indicate proficiency below the Proficient level. For example, scores of 440 at grade 4, 840 at grade 8, and 1140 at grade 11 each indicate Proficient performance at that grade level.
Comparisons to Other End of Grade Span Students The tables in the middle section of the report provide the percentage of students performing at each achievement level in the student’s school, district, and state. Note that one or two students can have a large impact on percentages in small schools and districts. Results are not reported for schools or districts with nine (9) or fewer students.
Performance in Science Domains This section of the report provides information about student performance on sets of items measuring four science domains within the test. These results can provide a general idea of relative strengths and weaknesses in comparison to other students. However, results in this section are based on fewer test items and should be interpreted cautiously.
Students at Beginning of ProficientThis column shows the average performance on these items of students who performed at the beginning of the Proficient achievement level on the overall test. Students whose performance in a category falls within the range shown performed similarly to those students. This comparison can provide some information about the level of performance needed to perform at the Proficient level.
Achievement Level DescriptionsProfi cient with Distinction (Level 4) - Students performing at this level demonstrate the knowledge and skills as described in the content
standards for this grade span. Errors made by these students are few and minor and do not reflect gaps in knowledge and skills.
Profi cient (Level 3) - Students performing at this level demonstrate the knowledge and skills as described in the content standards for this grade span with only minor gaps. It is likely that any gaps in knowledge and skills demonstrated by these students can be addressed by the classroom teacher during the course of classroom instruction.
Partially Profi cient (Level 2) - Students performing at this level demonstrate gaps in knowledge and skills as described in the content standards for this grade span. Additional instructional support may be necessary for these students to achieve proficiency on the content standards.
Substantially Below Profi cient (Level 1) - Students performing at this level demonstrate extensive and significant gaps in knowledge and skills as described in the content standards for this grade span. Additional instructional support is necessary for these students to achieve proficiency on the content standards.

Guide to Using the 2015 NECAP Science Reports 10
Student Grade DistrictSchool StateAce B Elkins 11 Demonstration School 1 Demonstration District A NH
Spring 2015 - Grade 11 NECAP Science Test Results
ScaledScore
This Student’s Achievement Level and Scaled ScoreAchievement Level
Proficient
1141
Below Partial Proficient Distinction
11801130 1140 11521100
This Student’s Performancein Science Domains
Interpretation of Graphic Display
The line (I) represents the student’s score. The bar ( ) surrounding the score represents the probable range of scores for the student if he or she were to be tested many
times. This statistic is called the standard error of measurement. See the reverse side for the achievement level descriptions.
This Student's Achievement Level Comparedto Other End of Grade 11 Students
by School, District, and State
District StateSchoolStudent
Proficient
with Distinction
Proficient
Partially
Proficient
Substantially
Below Proficient
2% 1%
ü
Students atBeginning of
Proficient
Average Points Earned
StudentPossiblePoints
Inquiry
Life Science
Earth Space Science
Physical Science
School District State
Description of the Inquiry Task
There are many interesting and essential facts, formulas, and processes that students should know across the three content domains of science. But science is more than content. Inquiry skills are skills that all students should have in addition to the content. Inquiry skills are the ability to formulate questions and hypothesize, plan investigations and experiments, conduct investigations and experiments, and evaluate results. These are the broad areas that constitute scientific inquiry. Content from Physical Science, Earth Space Science, and Life Science forms the basis of each NECAP Science Inquiry Task. Instead of measuring student knowledge of content, inquiry tasks measure the student’s ability to make connections, express ideas, and provide evidence of scientific thinking.
38% 32%
5%
33%
33%
29%
15 13
9
10
4 6.0
7.3
7.1
9.2 9.1
7.3
7.7
6.6 5.8
7.2
7.2
8.9 8.4-11.6
6.6-10.2
6.9-10.6
6.0-9.718
15
15
38% 43%
21% 23%
The grade 11 inquiry task, The Aleutian Islands Kelp Mystery, required students to read a story and analyze data about an ocean ecosystem in order to graph the data, describe relationships among organisms, and make predictions regarding impacts of biotic and abiotic changes within the system. Students traced cause-and-effect relationships through the system to explain shifts in energy flow and redistribution of matter in the ecosystem. Students analyzed relationship claims and constructed arguments to support or refute the claims. Students worked independently during this task.
Guide to Using the 2015 NECAP Science Reports 11
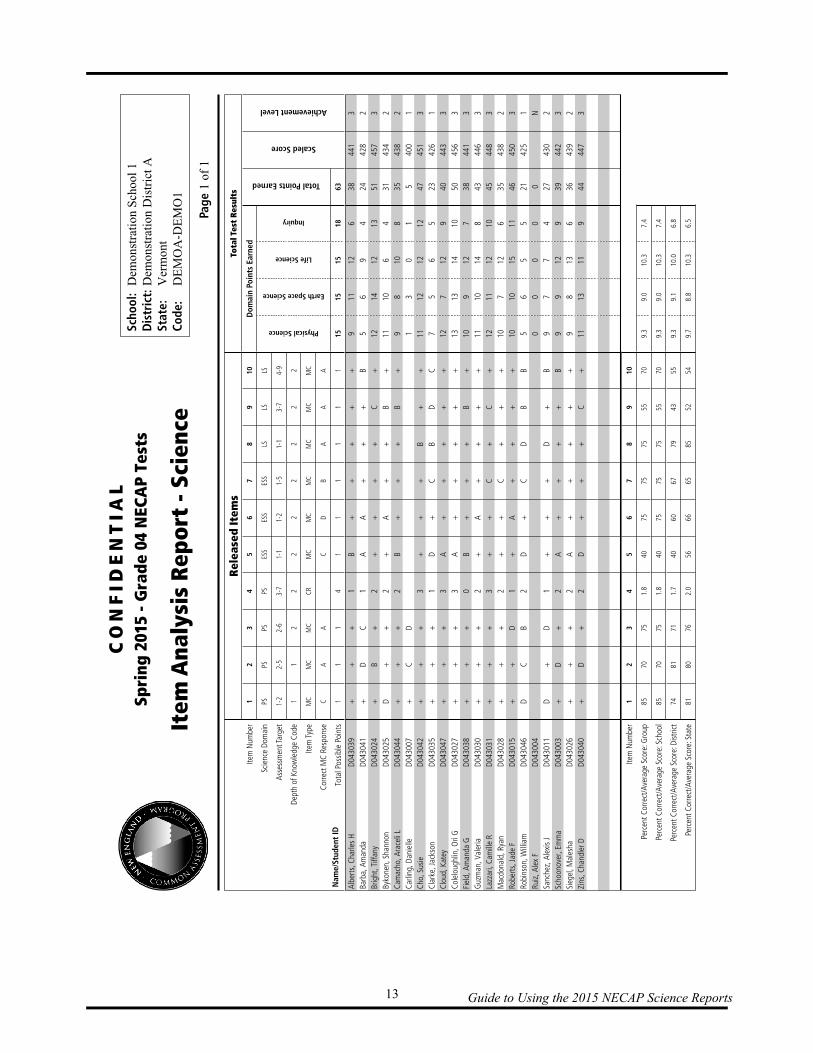
Understanding the Item Analysis Report The NECAP Item Analysis Report provides schools and districts with information on the released items. It also includes summary information on the scaled score and achievement level for each student in the school in science. In addition to showing raw data for students, it provides additional information for each released item. Using this report, together with the actual released items, one can easily identify test items on which groups of students did well or poorly. There is a legend after the last page of data that defines the terms used. The data used for the NECAP Item Analysis Report are the results of the spring 2015 administration of the NECAP science tests. The NECAP science tests are based on the NECAP Science Assessment Targets from three grades spans (K–4, 5–8, and 9–11). For example, the Grade 8 NECAP science test, administered in the spring of eighth grade, is based on the grades 5–8 NECAP Science Assessment Targets. Every student who participated in the NECAP science tests will be represented in a “testing year” school report, because NECAP science testing takes place near the end of the school year. There are no “teaching year” school reports for science. The state Departments and Agency of Education release the inquiry tasks as stand-alone documents so schools can more easily conduct the tasks in the classroom throughout the year. The availability of interactive reporting for science resulted in the NECAP Item Analysis Report being split into two separate reports to reflect both the Released Items and the Released Inquiry Task. The top portion of the NECAP Item Analysis Report contains six or seven rows of information, depending on the report.
The first row lists the Item Number (For the Released Items, this is not the position of the item in the actual student test booklet, but for the Released Inquiry Task, it is.)
The second row lists the Science Domain for the item. The third row lists the Assessment Target (for Released Items) or Inquiry Construct (for
the Released Inquiry Task) for the item. The fourth row lists the Depth of Knowledge Code for the item. The fifth row lists the Item Type. The sixth row lists the Correct Response letter for each multiple-choice item. This is not
applicable to the Released Inquiry Task. The final row lists the Total Possible Points for each item.
When reviewing the multiple-choice section of the Released Items report please keep in mind that a (+) indicates a correct response, a letter indicates the incorrect response selected, and a blank indicates that no response was selected. In the columns for the short-answer and constructed-response results, the numbers indicate the points awarded per item and a blank indicates that the item was not answered. All responses to released items are reported in the NECAP Item Analysis Report, regardless of the student’s participation status. The first column of this report lists each student alphabetically by last name followed by each student’s state assigned student ID number. The column after the released items shows Total Test Results, broken into several categories. Domain Points Earned columns report the points the student
Guide to Using the 2015 NECAP Science Reports 12
earned in each science domain. The Total Points Earned column is a summary of all of the points earned on the science test. The last two columns show the Scaled Score and Achievement Level for each student. For students who are reported as Not Tested, a code appears in the Achievement Level column to indicate the reason the student did not test. The descriptions of these codes can be found on the legend, after the last page of data on the NECAP Item Analysis Report. It is important to note that not all items used to compute student scores are included in this report. Only those items that have been released are included. The Percent Correct/Average Score for the school, district, and state are listed at the end of each report after the student data. The NECAP Item Analysis Reports are confidential and should be kept secure within the school and district. Remember, the Family Educational Rights and Privacy Act (FERPA) requires that access to individual student results be restricted to the student, the student’s parents/guardians, and authorized school personnel. The following page is a sample NECAP Item Analysis Report for grade 4.
Guide to Using the 2015 NECAP Science Reports 13
Scho
ol:
Dem
onst
rati
on S
choo
l 1D
istr
ict:
Dem
onst
rati
on D
istr
ict A
Stat
e:
Ver
mon
tCo
de:
DE
MO
A-D
EM
O1
CO
NF
IDE
NT
IAL
Spri
ng 2
015
- Gra
de 0
4 N
ECA
P Te
sts
Item
Ana
lysi
s R
epor
t - S
cien
cePa
ge 1
of
1
Rel
ease
d It
ems
Tota
l Tes
t R
esul
ts
Item
Num
ber
12
34
56
78
910
Dom
ain
Poin
ts E
arne
d
Total Points Earned
Scaled Score
Achievement Level
Scie
nce
Dom
ain
PSPS
PSPS
ESS
ESS
ESS
LSLS
LS
Physical Science
Earth Space Science
Life Science
Inquiry
Asse
ssm
ent T
arge
t1-
22-
52-
63-
71-
11-
21-
51-
13-
74-
9
Dept
h of
Kno
wle
dge
Code
11
22
22
22
22
Item
Type
MC
MC
MC
CRM
CM
CM
CM
CM
CM
C
Corre
ct M
C Re
spon
seC
AA
CD
BA
AA
Tota
l Pos
sible
Poi
nts
11
14
11
11
11
1515
1518
63
Albe
rts, C
harle
s H
Barb
a, A
man
daBr
ight
, Tiff
any
Byko
nen,
Sha
nnon
Cam
acho
, Ara
celi
LCa
rling
, Dan
ielle
Cho,
Sus
ieCl
arke
, Jac
kson
Clou
d, K
atey
Cole
loug
hlin
, Ori
GFi
eld,
Am
anda
GG
uzm
an, V
aler
iaLa
zzar
i, Ca
mill
e R
Mac
dona
ld, R
yan
Robe
rts, J
ade
FRo
bins
on, W
illia
mRu
iz, A
lex
FSa
nche
z, A
lexi
s J
Scho
onov
er, E
mm
aSi
egel
, Mal
esha
Zins
, Cha
ndle
r D
D0
4303
9D0
4304
1D0
4302
4D0
4302
5D0
4304
4D0
4300
7D0
4304
2D0
4303
5D0
4304
7D0
4302
7D0
4303
8D0
4303
0D0
4303
1D0
4302
8D0
4301
5D0
4304
6D0
4300
4D0
4301
1D0
4300
3D0
4302
6D0
4304
0
+ + + D + + + + + + + + + + + D D + + +
+ D B + + C + + + + + + + + + C + D + D
+ C + + + D + + + + + + + + D B D + + +
1 1 2 2 2 3 1 3 3 0 2 3 2 1 2 1 2 2 2
B A + + B + D A A B + + + + D + A A D
+ A + A + + + + + + A + + A + + + + +
+ + + + + + C + + + + C C + C + + + +
+ + + + + B B + + + + + + + D D + + +
+ + C B B + D + + B + C + + B + + + C
+ B + + + + C + + + + + + + B B B + +
9 5 12 11 9 1 11 7 12 13 10 11 12 10 10 5 0 9 9 9 11
11 6 14 10 8 3 12 5 7 13 9 10 11 7 10 6 0 7 9 8 13
12 9 12 6 10 0 12 6 12 14 12 14 12 12 15 5 0 7 12 13 11
6 4 13 4 8 1 12 5 9 10 7 8 10 6 11 5 0 4 9 6 9
38 24 51 31 35 5 47 23 40 50 38 43 45 35 46 21 0 27 39 36 44
441
428
457
434
438
400
451
426
443
456
441
446
448
438
450
425
430
442
439
447
3 2 3 2 2 1 3 1 3 3 3 3 3 2 3 1 N 2 3 2 3
Item
Num
ber
12
34
56
78
910
Perc
ent C
orre
ct/A
vera
ge S
core
: Gro
up85
7075
1.8
4075
7575
5570
9.3
9.0
10.3
7.4
Perc
ent C
orre
ct/A
vera
ge S
core
: Sch
ool
8570
751.
840
7575
7555
709.
39.
010
.37.
4
Perc
ent C
orre
ct/A
vera
ge S
core
: Dist
rict
7481
711.
740
6067
7943
559.
39.
110
.06.
8
Perc
ent C
orre
ct/A
vera
ge S
core
: Sta
te81
8076
2.0
5666
6585
5254
9.7
8.8
10.3
6.5
Nam
e/St
uden
t ID
Guide to Using the 2015 NECAP Science Reports 14
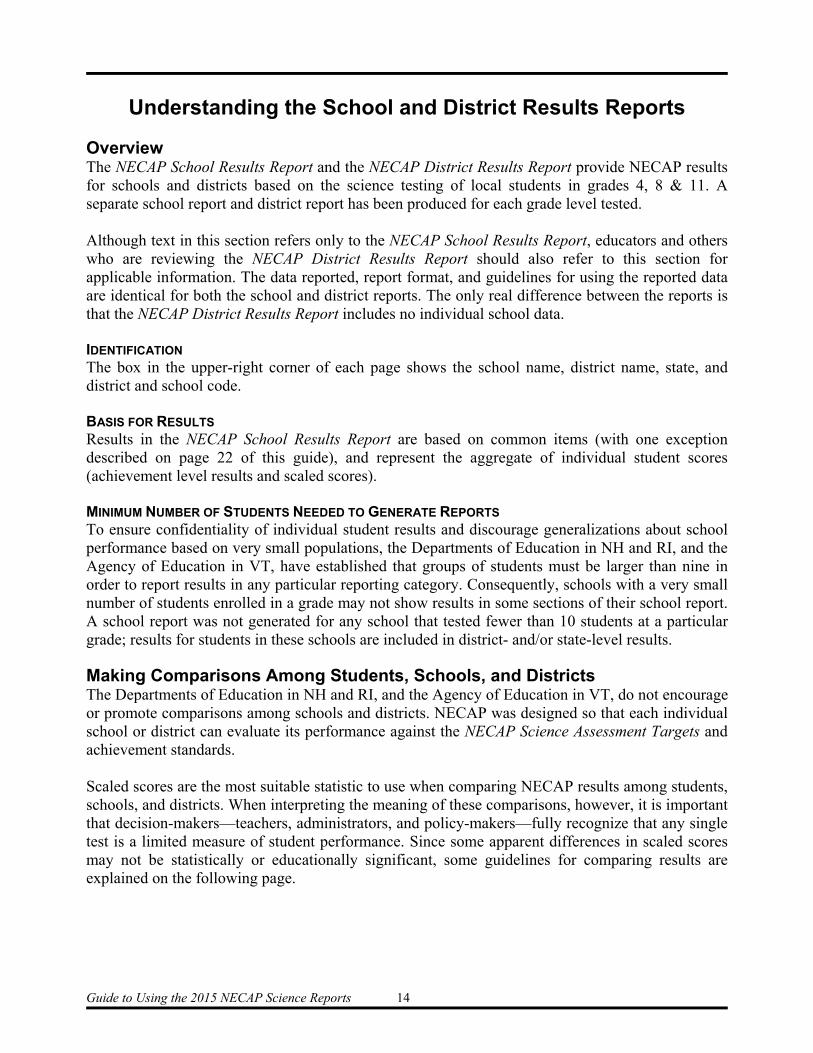
Understanding the School and District Results Reports Overview The NECAP School Results Report and the NECAP District Results Report provide NECAP results for schools and districts based on the science testing of local students in grades 4, 8 & 11. A separate school report and district report has been produced for each grade level tested. Although text in this section refers only to the NECAP School Results Report, educators and others who are reviewing the NECAP District Results Report should also refer to this section for applicable information. The data reported, report format, and guidelines for using the reported data are identical for both the school and district reports. The only real difference between the reports is that the NECAP District Results Report includes no individual school data. IDENTIFICATION The box in the upper-right corner of each page shows the school name, district name, state, and district and school code. BASIS FOR RESULTS Results in the NECAP School Results Report are based on common items (with one exception described on page 22 of this guide), and represent the aggregate of individual student scores (achievement level results and scaled scores). MINIMUM NUMBER OF STUDENTS NEEDED TO GENERATE REPORTS To ensure confidentiality of individual student results and discourage generalizations about school performance based on very small populations, the Departments of Education in NH and RI, and the Agency of Education in VT, have established that groups of students must be larger than nine in order to report results in any particular reporting category. Consequently, schools with a very small number of students enrolled in a grade may not show results in some sections of their school report. A school report was not generated for any school that tested fewer than 10 students at a particular grade; results for students in these schools are included in district- and/or state-level results. Making Comparisons Among Students, Schools, and Districts The Departments of Education in NH and RI, and the Agency of Education in VT, do not encourage or promote comparisons among schools and districts. NECAP was designed so that each individual school or district can evaluate its performance against the NECAP Science Assessment Targets and achievement standards. Scaled scores are the most suitable statistic to use when comparing NECAP results among students, schools, and districts. When interpreting the meaning of these comparisons, however, it is important that decision-makers—teachers, administrators, and policy-makers—fully recognize that any single test is a limited measure of student performance. Since some apparent differences in scaled scores may not be statistically or educationally significant, some guidelines for comparing results are explained on the following page.

Guide to Using the 2015 NECAP Science Reports 15
COMPARISONS OF SCHOOL- AND DISTRICT-LEVEL SCORES The statistical significance of these comparisons is based on variability of the scores and on the number of students tested. The tables on the following pages can be used to assist in the following ways:
comparing sub-populations of students within a school or district, comparing the scores of two or more schools or districts, comparing the scores of a school to the district and/or state, and comparing the scores of a district to the state.
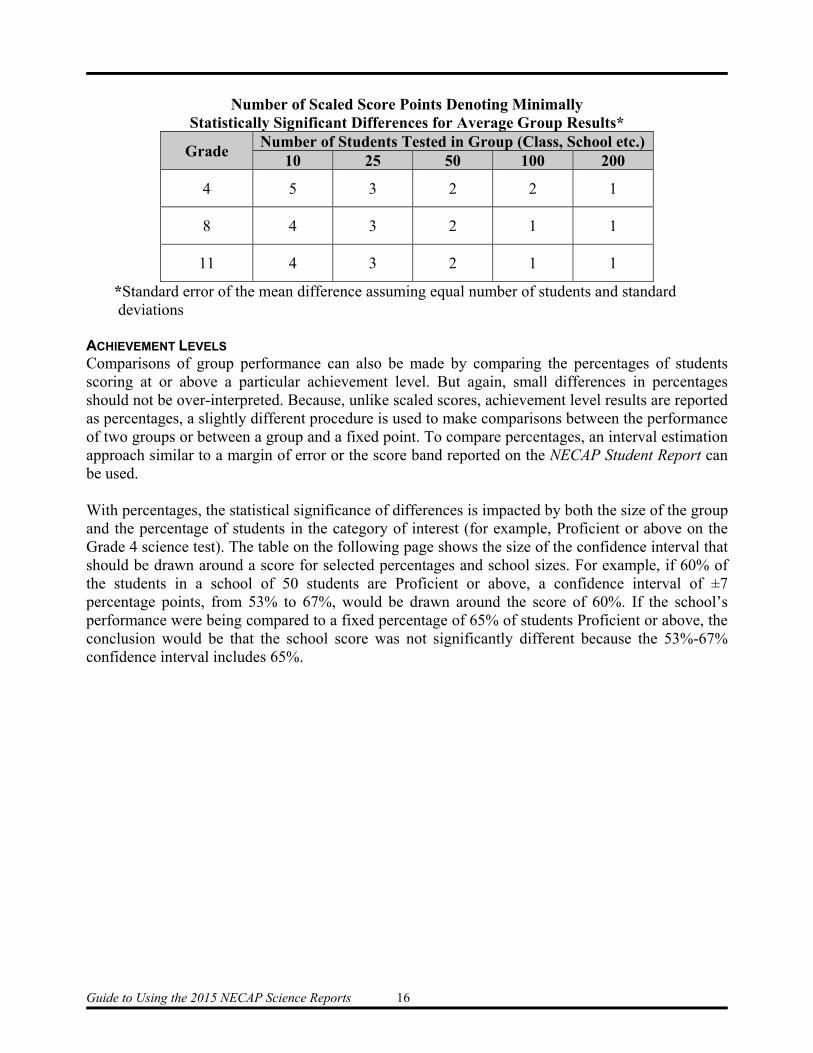
These tables provide figures that can be used to make approximate comparisons between scores. Similar to the score band provided in the NECAP Student Report, the figures in the tables are estimates of one standard error around the score or difference between scores. For those interested in making more exact comparisons or learning more about the statistical methods used to make comparisons, a list of references is provided in Appendix D Reference Materials on page 46 of this guide. Caution should be used when making any of the comparisons listed above because even if scores are different they may not be statistically significantly different. It is very unlikely that any two groups will have exactly the same score. To avoid misinterpretation or over-interpretation of small differences between scores, statistical tests can be conducted to determine the likelihood that the observed difference in scores occurred by chance and that the two groups might actually have the same score. SCALED SCORES NECAP scaled scores are represented by a 3-digit number, with the first digit representing the grade level tested; the remaining digits range from 00–80. NECAP scaled scores for grade 11 are represented by a 4-digit number, with the first two digits representing the grade; the remaining digits also range from 00-80. The table on the following page shows the smallest differences in scaled scores that represent a statistically significant difference in performance based on the number of students tested in the school and/or district. When comparing the scores of two groups of different sizes, one should use a difference that is approximately the average of the minimally statistically significant difference of each group. For example, when comparing the average grade 8 science scaled scores of a school with 25 students and a school with 100 students one should use two points as the minimally statistically significant difference. Two points is the average of the values in the table for a school of 25 students (3 points) and a school of 100 students (1 point). If the difference in scaled scores between the two groups is at least two points, then the difference is statistically significant. If the difference in scaled scores between the two groups is fewer than two points, the difference is not statistically significant.
Guide to Using the 2015 NECAP Science Reports 16
Number of Scaled Score Points Denoting Minimally
Statistically Significant Differences for Average Group Results*
Grade Number of Students Tested in Group (Class, School etc.)
10 25 50 100 200
4 5 3 2 2 1
8 4 3 2 1 1
11 4 3 2 1 1
*Standard error of the mean difference assuming equal number of students and standard deviations
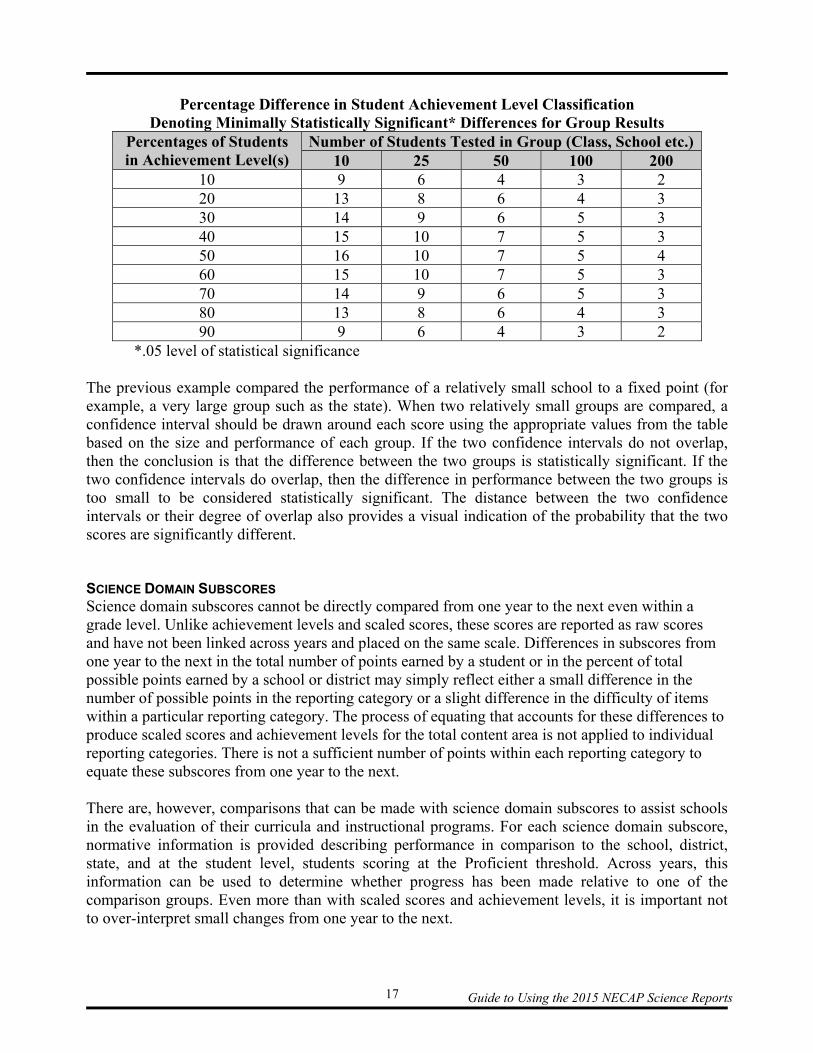
ACHIEVEMENT LEVELS Comparisons of group performance can also be made by comparing the percentages of students scoring at or above a particular achievement level. But again, small differences in percentages should not be over-interpreted. Because, unlike scaled scores, achievement level results are reported as percentages, a slightly different procedure is used to make comparisons between the performance of two groups or between a group and a fixed point. To compare percentages, an interval estimation approach similar to a margin of error or the score band reported on the NECAP Student Report can be used. With percentages, the statistical significance of differences is impacted by both the size of the group and the percentage of students in the category of interest (for example, Proficient or above on the Grade 4 science test). The table on the following page shows the size of the confidence interval that should be drawn around a score for selected percentages and school sizes. For example, if 60% of the students in a school of 50 students are Proficient or above, a confidence interval of ±7 percentage points, from 53% to 67%, would be drawn around the score of 60%. If the school’s performance were being compared to a fixed percentage of 65% of students Proficient or above, the conclusion would be that the school score was not significantly different because the 53%-67% confidence interval includes 65%.
Guide to Using the 2015 NECAP Science Reports 17
Percentage Difference in Student Achievement Level Classification
Denoting Minimally Statistically Significant* Differences for Group Results Percentages of Students in Achievement Level(s)
Number of Students Tested in Group (Class, School etc.)10 25 50 100 200
10 9 6 4 3 2 20 13 8 6 4 3 30 14 9 6 5 3 40 15 10 7 5 3 50 16 10 7 5 4 60 15 10 7 5 3 70 14 9 6 5 3 80 13 8 6 4 3 90 9 6 4 3 2
*.05 level of statistical significance The previous example compared the performance of a relatively small school to a fixed point (for example, a very large group such as the state). When two relatively small groups are compared, a confidence interval should be drawn around each score using the appropriate values from the table based on the size and performance of each group. If the two confidence intervals do not overlap, then the conclusion is that the difference between the two groups is statistically significant. If the two confidence intervals do overlap, then the difference in performance between the two groups is too small to be considered statistically significant. The distance between the two confidence intervals or their degree of overlap also provides a visual indication of the probability that the two scores are significantly different. SCIENCE DOMAIN SUBSCORES Science domain subscores cannot be directly compared from one year to the next even within a grade level. Unlike achievement levels and scaled scores, these scores are reported as raw scores and have not been linked across years and placed on the same scale. Differences in subscores from one year to the next in the total number of points earned by a student or in the percent of total possible points earned by a school or district may simply reflect either a small difference in the number of possible points in the reporting category or a slight difference in the difficulty of items within a particular reporting category. The process of equating that accounts for these differences to produce scaled scores and achievement levels for the total content area is not applied to individual reporting categories. There is not a sufficient number of points within each reporting category to equate these subscores from one year to the next. There are, however, comparisons that can be made with science domain subscores to assist schools in the evaluation of their curricula and instructional programs. For each science domain subscore, normative information is provided describing performance in comparison to the school, district, state, and at the student level, students scoring at the Proficient threshold. Across years, this information can be used to determine whether progress has been made relative to one of the comparison groups. Even more than with scaled scores and achievement levels, it is important not to over-interpret small changes from one year to the next.
Guide to Using the 2015 NECAP Science Reports 18
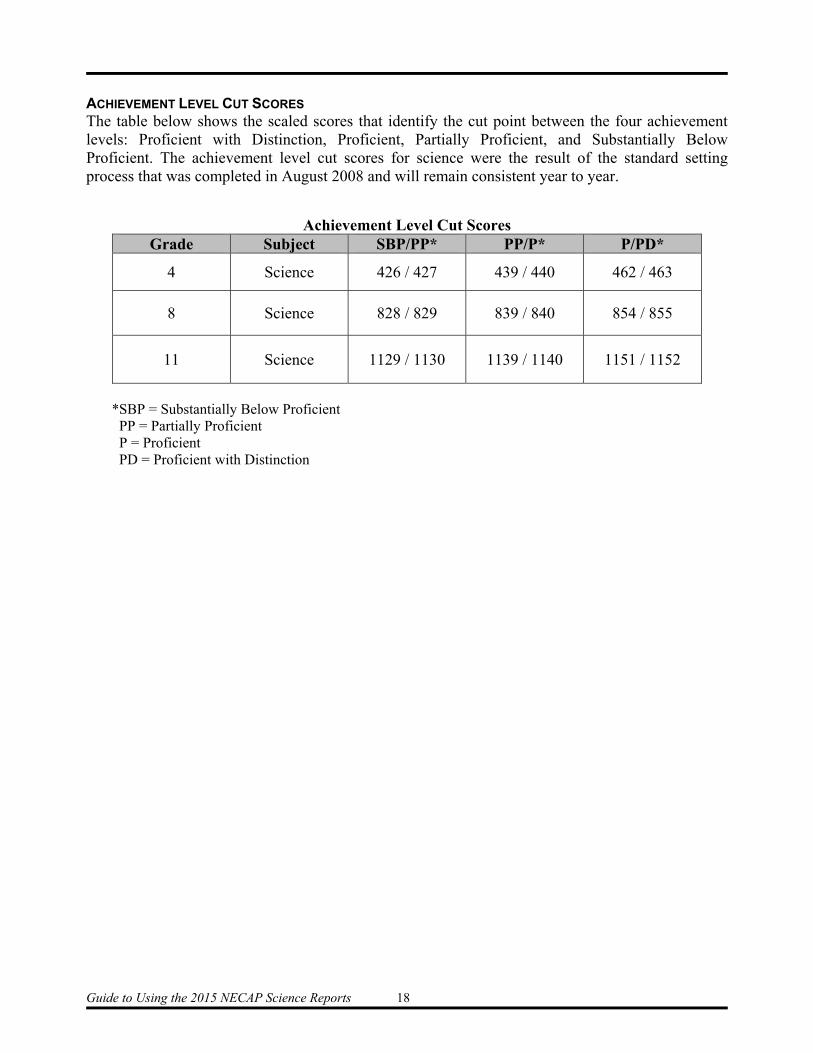
ACHIEVEMENT LEVEL CUT SCORES The table below shows the scaled scores that identify the cut point between the four achievement levels: Proficient with Distinction, Proficient, Partially Proficient, and Substantially Below Proficient. The achievement level cut scores for science were the result of the standard setting process that was completed in August 2008 and will remain consistent year to year.
Achievement Level Cut Scores Grade Subject SBP/PP* PP/P* P/PD*
4 Science 426 / 427 439 / 440 462 / 463
8 Science 828 / 829 839 / 840 854 / 855
11 Science 1129 / 1130 1139 / 1140 1151 / 1152
*SBP = Substantially Below Proficient PP = Partially Proficient P = Proficient PD = Proficient with Distinction
Guide to Using the 2015 NECAP Science Reports 19
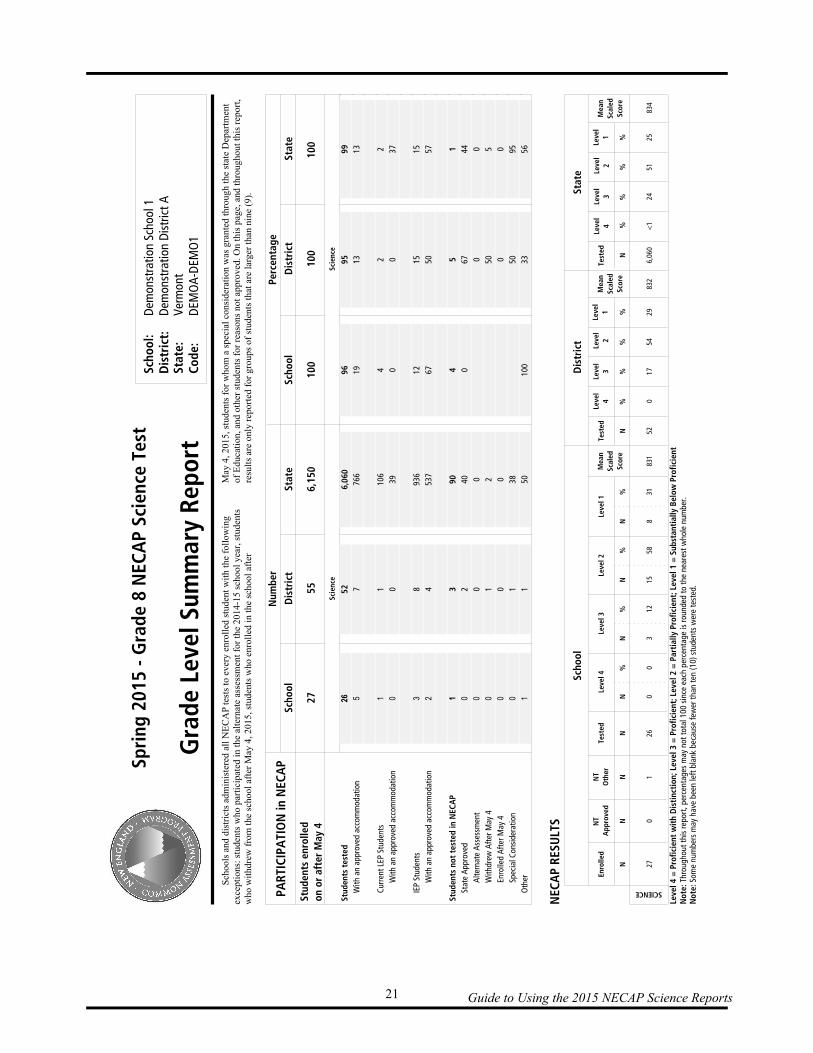
Grade Level Summary Report (Page 2 of the NECAP School Results Report) The second page of the NECAP School Results Report, titled “Grade Level Summary Report,” provides a summary of participation in NECAP and a summary of NECAP results. This page shows the number and percentage of students who were enrolled, tested, and not tested as part of the NECAP science tests in spring 2015. Students enrolled in a school on or after May 4, 2015 were expected to complete the NECAP science tests at that school. Participation in NECAP STUDENTS ENROLLED ON OR AFTER MAY 4 The first table in the “Grade Level Summary Report” shows the number of students enrolled in the tested grade. The total number of students reported as enrolled is defined as the number of students tested added to the numbers of students who were not tested. STUDENTS TESTED This row on the report shows the number of students tested in science for the school, district, and state. The number of students is shown two ways—as a number and as a percent. STUDENTS TESTED WITH AN APPROVED ACCOMMODATION This row on the report shows the number and percent of students who were tested using an approved accommodation in science for the school, district and state. CURRENT LEP STUDENTS This row on the report shows the number and percent of students who were current LEP students and were tested in science for the school, district and state. CURRENT LEP STUDENTS TESTED WITH AN APPROVED ACCOMMODATION This row on the report shows the number and percent of students who were current LEP students and were tested using an approved accommodation in science for the school, district and state. IEP STUDENTS This row on the report shows the number and percent of students with an IEP who were tested in science for the school, district and state. IEP STUDENTS TESTED WITH AN APPROVED ACCOMMODATION This row on the report shows the number and percent of students with an IEP who were tested using an approved accommodation in science for the school, district and state. STUDENTS NOT TESTED IN NECAP Since students who were not tested did not participate in the NECAP science test, average school scores are not affected by not tested students. These students are included in the calculation of the percent that participated, but are not included in the calculation of scores.
Guide to Using the 2015 NECAP Science Reports 20
For students who participated in some but not all sessions of the NECAP science test, their actual score was reported. These reporting decisions were made to support the requirement that all students must participate in the NECAP testing program. Data is provided for the following groups of students who may not have completed the entire NECAP science test.
Withdrew After May 4—Students withdrawing from a school after May 4, 2015 may have taken some sessions of the NECAP science test prior to their withdrawal from the school.
Enrolled After May 4—Students enrolling in a school after May 4, 2015 may not have had adequate time to fully participate in all sessions of the NECAP science test.
Special Consideration—Schools received state approval for special consideration for an exemption for all or part of the NECAP science test for any student whose circumstances are not described by the previous categories, but for whom the school determined that taking the NECAP science test would not be possible.
Other—Occasionally students will not have completed the NECAP science test for reasons other than those listed above. These “other” categories are considered “not state approved.”
Note: First Year LEP students who were new to the U.S. after October 1, 2014 were required to take the NECAP science test. NECAP Results The results portion of the page indicates the number and percentage of students performing at each achievement level in science tested by NECAP. In addition, a mean scaled score is provided for science in grades 4, 8, and 11 at the school, district, and state levels. The following page contains a sample of a grade 8 “Grade Level Summary Report” from a NECAP School Results Report.
Guide to Using the 2015 NECAP Science Reports 21
Spri
ng
2015 -
Gra
de
8 N
EC
AP S
cien
ce T
est
Gra
de
Leve
l Su
mm
ary
Rep
ort
Dis
tric
t:D
emon
stra
tion
Dis
tric
t A
Stat
e:
Ver
mon
t
Scho
ol:
Dem
onst
rati
on S
choo
l 1
Co
de:
DEM
OA
-DEM
O1
Sch
ools
and
dis
tric
ts a
dmin
iste
red
all
NE
CA
P t
ests
to
ever
y en
roll
ed s
tude
nt w
ith
the
foll
owin
gex
cept
ions
: st
uden
ts w
ho p
arti
cipa
ted
in t
he a
lter
nate
ass
essm
ent
for
the
2014-
15 s
chool
yea
r, s
tuden
ts
who
wit
hdre
w f
rom
the
sch
ool
afte
r M
ay 4
, 201
5, s
tude
nts
who
enr
olle
d in
the
sch
ool
aft
er
May
4, 2
015
, stu
dent
s fo
r w
hom
a s
peci
al c
onsi
der
atio
n w
as g
rante
d t
hro
ugh
the
stat
e D
epar
tmen
t of
Edu
cati
on,
and
oth
er s
tude
nts
for
rea
sons
not
appr
oved
. O
n t
his
page,
and
thro
ugh
out
this
rep
ort
, re
sult
s ar
e on
ly r
epor
ted
for
group
s of
stud
ents
tha
t ar
e la
rger
than
nin
e (9
).
Num
ber
Per
centa
ge
PA
RTI
CIP
ATI
ON
in N
EC
AP
Stud
ents
enro
lled
on o
r af
ter
May
4
Scho
ol
Dis
tric
tSt
ate
Scho
ol
Dis
tric
tSt
ate
27
55
6,1
50
100
100
100
Scie
nce
Sci
ence
Stud
ents
test
ed26
52
6,0
60
96
95
99
W
ith
an a
ppro
ved
acco
mm
odat
ion
57
766
1913
13
C
urre
nt L
EP S
tude
nts
11
106
42
2
W
ith
an a
ppro
ved
acco
mm
odat
ion
00
390
037
IE
P St
uden
ts3
893
612
1515
W
ith
an a
ppro
ved
acco
mm
odat
ion
24
537
6750
57
Stud
ents
no
t te
sted
in N
ECA
P1
390
45
1
S
tate
App
rove
d0
240
067
44
A
lter
nate
Ass
essm
ent
00
00
0
W
ithd
rew
Aft
er M
ay 4
01
250
5
En
rolle
d A
fter
May
40
00
00
Sp
ecia
l Con
side
rati
on0
138
5095
O
ther
11
5010
033
56
NEC
AP R
ESU
LTS
Scho
ol
Dis
tric
tSta
te
Enro
lled
NT
Ap
pro
ved
NT
Oth
erTe
sted
Leve
l 4
Leve
l 3
Leve
l 2
Leve
l 1
Mea
n
Scal
ed
Sco
reN
NN
NN
NN
N%
%%
%
Test
edLe
vel
4
Leve
l
3
Leve
l
2
Leve
l
1Te
sted
Leve
l
1Le
vel
2
Leve
l
3
Leve
l
4
N%
%%
%%
%%
%N
Mea
n
Sca
led
Sco
re
Mean
Scal
ed
Sco
re
SCIENCE
270
126
00
312
1558
831
831
520
1754
2983
26,
060
<1
2451
2583
4
Leve
l 4 =
Pro
fici
ent
wit
h D
isti
nct
ion; Le
vel 3 =
Pro
fici
ent;
Lev
el 2
= P
arti
ally
Pro
fici
ent;
Lev
el 1
= S
ub
stan
tial
ly B
elo
w P
rofi
cien
tN
ote
: Th
roug
hout
thi
s re
port
, per
cent
ages
may
not
tot
al 1
00 s
ince
eac
h pe
rcen
tage
is r
ound
ed t
o th
e ne
ares
t w
hole
num
ber.
No
te:
Som
e nu
mbe
rs m
ay h
ave
been
left
bla
nk b
ecau
se f
ewer
tha
n te
n (1
0) s
tude
nts
wer
e te
sted
.
Guide to Using the 2015 NECAP Science Reports 22
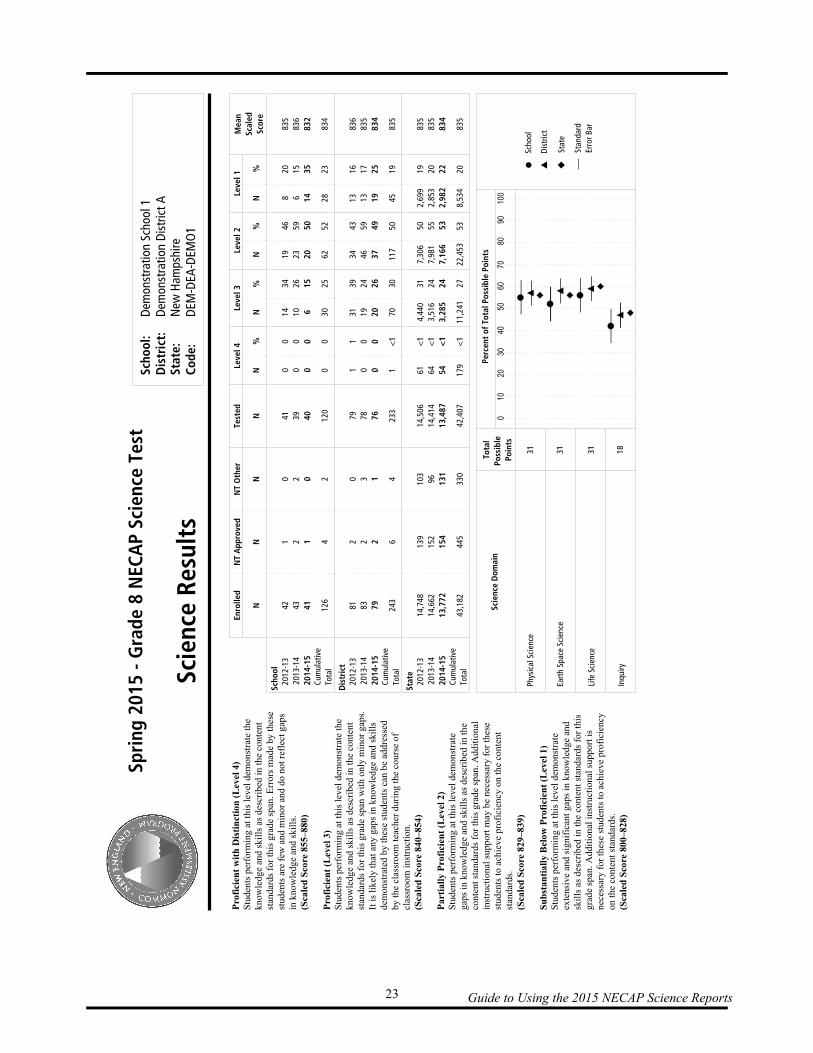
Science Results (Page 3 of the NECAP School Results Report) The science results page of the report provides information on performance in specific domains of science (for example, Earth Space Science). The purpose of this section is to help schools determine the extent to which their curricula are effective in helping students achieve the particular standards and benchmarks contained in the NECAP Science Assessment Targets. Information about science for school, district, and state includes:
the total number of students Enrolled, NT Approved (not tested for a state-approved reason), NT Other (not tested for other reasons), and Tested;
the total number and percent of students at each achievement level (based on the number in the Tested column); and
the Mean Scaled Score. The information listed above is provided for both the current testing year (2014–15) in bold as well as the previous two testing years (2013–14 and 2012–13). This information is only included for each year where the number of students tested at a grade level was at least 10. For schools and districts that have at least 10 tested students in the current year and two previous years, three-year cumulative totals are provided. Enrolled, Not Tested Approved, Not Tested Other, and Tested counts for each year are summed into a “Cumulative Total” row when the tested number in each year is at least 10. For the achievement levels, the three years of counts in the “N” columns are summed, while the percentages of students are calculated by dividing the cumulative total of the number of students in the achievement level by the cumulative total of the number of students tested. The Mean Scaled Score is calculated by summing the product of the mean scaled score and tested N for each year where the number of students is at least 10, and dividing the sum by the tested N from the cumulative total row (weighted average). Information about each science domain includes:
The Total Possible Points for that domain. In order to provide as much information
as possible for each domain, the total number of points includes both the common items used to calculate scores as well as additional items in each domain used for equating the test from year to year.
A graphic display of the Percent of Total Possible Points for the school, district, and state. In this graphic display, there are symbols representing school, district, and state performance. In addition, there is a line representing the standard error of measurement. This statistic indicates how much a student’s score could vary if the student was examined repeatedly with the same test (assuming that no learning occurs between test administrations).
The following page contains a sample grade 8 “Science Results” page from a NECAP School Results Report.
Guide to Using the 2015 NECAP Science Reports 23
Spri
ng
20
15
- G
rad
e 8
NEC
AP S
cien
ce T
est
Scie
nce
Res
ult
sD
istr
ict:
Dem
onst
rati
on D
istr
ict
ASt
ate:
New
Ham
pshi
re
Scho
ol:
Dem
onst
rati
on S
choo
l 1
Co
de:
DEM
-DEA
-DEM
O1
Scie
nce
Do
mai
nTo
tal
Po
ssib
le
Po
ints
Perc
ent
of
Tota
l Po
ssib
le P
oin
ts
Phys
ical
Sci
ence
Eart
h Sp
ace
Scie
nce
Life
Sci
ence
Inqu
iry
Pro
fici
ent
wit
h D
isti
nct
ion
(L
evel
4)
Stu
dent
s pe
rfor
min
g at
thi
s le
vel
dem
ons
trat
e th
ekn
owle
dge
and
sk
ills
as
desc
ribe
d in
th
e co
nten
tst
anda
rds
for
this
gra
de
span
. E
rror
s m
ade
by t
hese
stu
den
ts a
re f
ew a
nd
min
or a
nd
do n
ot r
efle
ct g
aps
in k
now
ledg
e an
d sk
ills
.(S
cale
d S
core
855
–88
0)
Pro
fici
ent
(Lev
el 3
)S
tude
nts
perf
orm
ing
at t
his
leve
l d
emo
nstr
ate
the
know
led
ge a
nd s
kil
ls a
s de
scri
bed
in t
he
cont
ent
stan
dard
s fo
r th
is g
rad
e sp
an w
ith
only
min
or
gap
s.It
is
like
ly t
hat
any
gaps
in
kno
wle
dge
and
ski
lls
dem
onst
rate
d by
th
ese
stud
ents
can
be
addr
esse
dby
th
e cl
assr
oom
tea
cher
du
ring
th
e co
urs
e of
clas
sroo
m i
nst
ruct
ion
.(S
cale
d S
core
840
–85
4)
Pa
rtia
lly
Pro
fici
ent
(Lev
el 2
)S
tude
nts
perf
orm
ing
at t
his
leve
l d
emo
nstr
ate
gaps
in
kno
wle
dge
and
skil
ls a
s de
scri
bed
in
the
cont
ent
stan
dard
s fo
r th
is g
rad
e sp
an. A
ddi
tion
alin
stru
ctio
nal
supp
ort
may
be
nec
essa
ry f
or t
hese
stu
den
ts t
o ac
hie
ve p
rofi
cien
cy o
n th
e co
nten
tst
anda
rds.
(Sca
led
Sco
re 8
29–
839)
Su
bst
anti
ally
Bel
ow P
rofi
cien
t (L
evel
1)
Stu
dent
s pe
rfor
min
g at
thi
s le
vel
dem
ons
trat
eex
ten
siv
e an
d s
ign
ific
ant
gap
s in
kn
owle
dge
an
dsk
ills
as
desc
ribe
d in
the
con
tent
sta
ndar
ds f
or
this
grad
e sp
an. A
ddi
tion
al i
nstr
uct
iona
l su
ppo
rt i
sne
cess
ary
for
thes
e st
uden
ts t
o ac
hiev
e p
rofi
cien
cyon
th
e co
nte
nt s
tand
ards
.(S
cale
d S
core
800
–82
8)
31 31 31 18
0
10
2
0
30
40
50
60 7
0
80
90
1
00
up
Stat
e
Stan
dard
Erro
r B
ar
lSc
hool
Dis
tric
t
Enro
lled
NT
Ap
pro
ved
NT
Oth
erTe
sted
NN
NN
N%
N%
N%
N%
Leve
l 4
Leve
l 3
Leve
l 2
Leve
l 1
Mea
n
Scal
ed
Sco
re
Scho
ol
2012
-13
2013
-14
20
14
-15
Cum
ulat
ive
Tota
l
421
041
00
1434
1946
820
835
432
239
00
1026
2359
615
836
41
10
40
00
61
52
05
01
43
58
32
126
42
120
00
3025
6252
2823
834
Dis
tric
t20
12-1
3
2013
-14
20
14
-15
Cum
ulat
ive
Tota
l
812
079
11
3139
3443
1316
836
832
378
00
1924
4659
1317
835
79
21
76
00
20
26
37
49
19
25
83
4
243
64
233
1<
170
3011
750
4519
835
Stat
e20
12-1
3
2013
-14
20
14
-15
Cum
ulat
ive
Tota
l
14,7
4813
910
314
,506
61<
14,
440
317,
306
502,
699
1983
5
14,6
6215
296
14,4
1464
<1
3,51
624
7,98
155
2,85
320
835
13
,77
21
54
13
11
3,4
87
54
<1
3,2
85
24
7,1
66
53
2,9
82
22
83
4
43,1
8244
533
042
,407
179
<1
11,2
4127
22,4
5353
8,53
420
835
Guide to Using the 2015 NECAP Science Reports 24
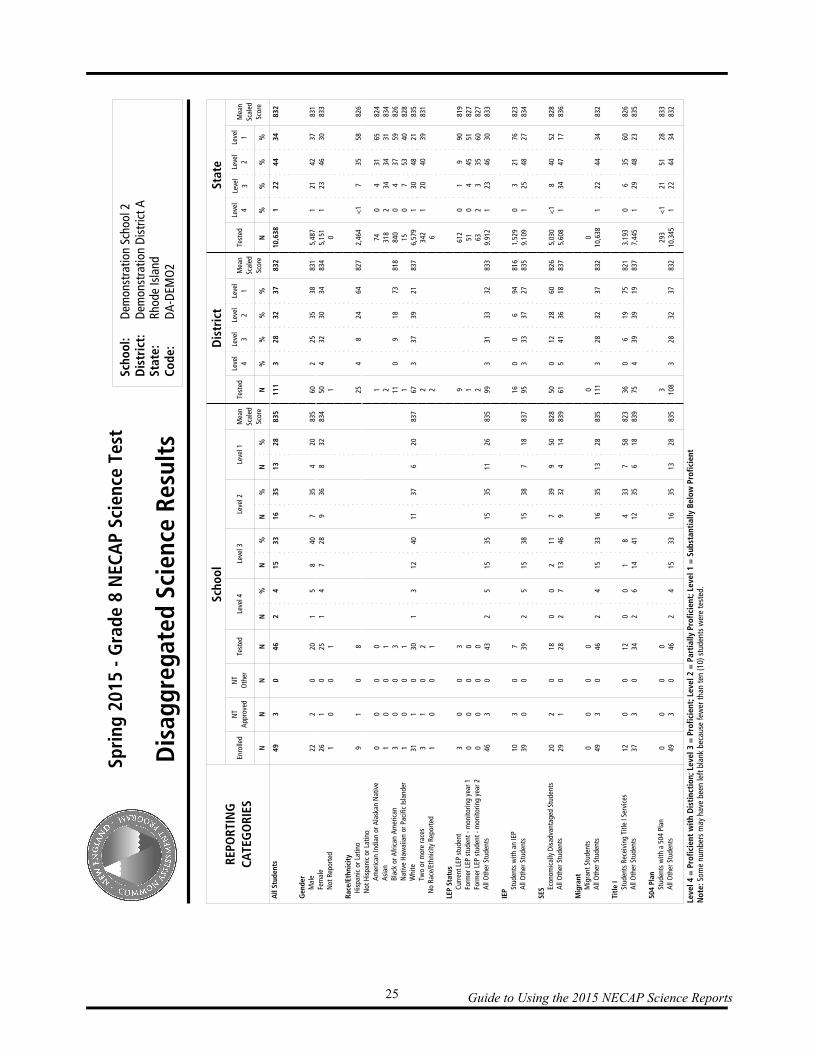
Disaggregated Science Results (Page 4 of the NECAP School Results Report) Students can be grouped according to many characteristics—gender, ethnicity, school programs, etc. The scores provide information on achievement for different groups in a school—males and females, for example. The performance of subgroups is included on the disaggregated science results page of the NECAP School Results Report. This section presents the relationship between the variables reported and performance in science at the school, district, and state levels. The table shows the number of students categorized as Enrolled, NT Approved (not tested for a state-approved reason), NT Other (not tested for other reasons), and Tested. The table also provides the number and percentage of students within the subgroup at each of the four achievement levels, as well as the Mean Scaled Score. The data for achievement levels and mean scaled score is based on the number shown in the Tested column. The data for the reporting categories was provided by the state Departments and Agency of Education. Because performance is being reported by categories that can contain relatively low numbers of students, school personnel are advised, under FERPA guidelines, to treat these pages confidentially. Please note that for NH and VT no data appears for 504 Plan or Title I. The following page contains a sample grade 8 “Disaggregated Science Results” page from a NECAP School Results Report.
Guide to Using the 2015 NECAP Science Reports 25
Spri
ng
20
15
- G
rad
e 8
NEC
AP S
cience
Test
Dis
agg
reg
ate
d S
cien
ce R
esu
lts
Dis
tric
t:D
emon
stra
tion
Dis
tric
t A
Sta
te:
Rho
de Is
land
Sch
oo
l:D
emon
stra
tion
Sch
ool 2
Co
de:
DA
-DEM
O2
Scho
ol
Dis
tric
tSt
ate
REP
OR
TIN
G
CA
TEG
OR
IES
Enro
lled
NT
App
rove
d
NT
Oth
erTe
sted
Leve
l 4Le
vel 3
Leve
l 2Le
vel 1
Mea
n
Scal
ed
Scor
e
Test
edLe
vel
4
Leve
l
3
Leve
l
2
Leve
l
1
Leve
l
1
Leve
l
2Le
vel
3
Leve
l
4Te
sted
NN
NN
NN
NN
%%
%%
%%
%%
%%
%%
NN
Mea
n
Scal
ed
Scor
e
Mea
n
Scal
ed
Scor
e
All
Stu
den
ts4
93
04
62
41
53
31
63
51
32
88
35
11
13
28
32
37
83
21
0,6
38
12
24
43
48
32
Gen
der
M
ale
222
020
15
840
735
420
835
602
2535
3883
15,
487
121
4237
831
F
emal
e26
10
251
47
289
368
3283
450
432
3034
834
5,15
11
2346
3083
3
Not
Rep
orte
d1
00
11
0
Rac
e/Et
hnic
ity
H
ispa
nic
or L
atin
o9
10
825
48
2464
827
2,46
4<
17
3558
826
N
ot H
ispa
nic
or L
atin
o
Am
eric
an In
dian
or
Ala
skan
Nat
ive
00
00
174
04
3165
824
A
sian
10
01
231
82
3434
3183
4
Bla
ck o
r A
fric
an A
mer
ican
30
03
110
918
7381
884
00
437
5982
6
Nat
ive
Haw
aiia
n or
Pac
ific
Isla
nder
10
01
115
07
5340
828
W
hite
311
030
13
1240
1137
620
837
673
3739
2183
76,
579
130
4821
835
T
wo
or m
ore
race
s3
10
22
342
120
4039
831
N
o R
ace/
Ethn
icit
y R
epor
ted
10
01
26
LEP S
tatu
s
Cur
rent
LEP
stu
dent
30
03
961
20
19
9081
9
For
mer
LEP
stu
dent
- m
onit
orin
g ye
ar 1
00
00
151
04
4551
827
F
orm
er L
EP s
tude
nt -
mon
itor
ing
year
20
00
02
632
335
6082
7
All
Oth
er S
tude
nts
463
043
25
1535
1535
1126
835
993
3133
3283
39,
912
123
4630
833
IEP
S
tude
nts
wit
h an
IEP
103
07
160
06
9481
61,
529
03
2176
823
A
ll O
ther
Stu
dent
s39
00
392
515
3815
387
1883
795
333
3727
835
9,10
91
2548
2783
4
SES
E
cono
mic
ally
Dis
adva
ntag
ed S
tude
nts
202
018
00
211
739
950
828
500
1228
6082
65,
030
<1
840
5282
8
All
Oth
er S
tude
nts
291
028
27
1346
932
414
839
615
4136
1883
75,
608
134
4717
836
Mig
rant
M
igra
nt S
tude
nts
00
00
00
A
ll O
ther
Stu
dent
s49
30
462
415
3316
3513
2883
511
13
2832
3783
210
,638
122
4434
832
Titl
e I
S
tude
nts
Rec
eivi
ng T
itle
I Se
rvic
es12
00
120
01
84
337
5882
336
06
1975
821
3,19
30
635
6082
6
All
Oth
er S
tude
nts
373
034
26
1441
1235
618
839
754
3939
1983
77,
445
129
4823
835
50
4 P
lan
S
tude
nts
wit
h a
504
Plan
00
00
329
3<
121
5128
833
A
ll O
ther
Stu
dent
s49
30
462
415
3316
3513
2883
510
83
2832
3783
210
,345
122
4434
832
Leve
l 4 =
Pro
fici
ent
wit
h D
isti
nct
ion; Le
vel 3 =
Pro
fici
ent;
Lev
el 2
= P
arti
ally
Pro
fici
ent;
Lev
el 1
= S
ub
stan
tial
ly B
elo
w P
rofi
cien
tN
ote
: So
me
num
bers
may
hav
e be
en le
ft b
lank
bec
ause
few
er t
han
ten
(10)
stu
dent
s w
ere
test
ed.
Guide to Using the 2015 NECAP Science Reports 26
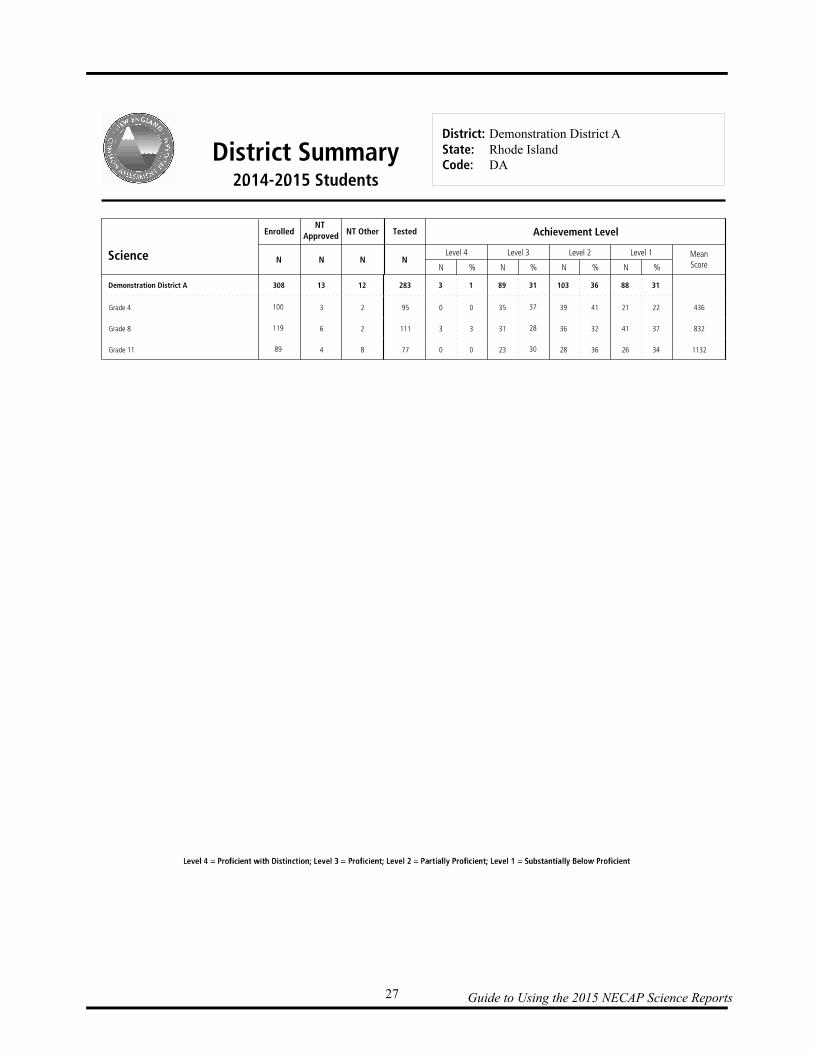
Understanding the District Summary Report
Overview The NECAP District Summary Report provides NECAP results for districts based on the testing of local students in grades 4, 8, and 11. The NECAP District Summary Report provides details, broken down by content area, about student performance for all grade levels of NECAP that were tested in the district. Please note that the NECAP District Summary Report includes no individual school data. The purpose of this summary is to help districts determine the extent to which their students achieve the particular standards and benchmarks contained in the NECAP Science Assessment Targets. Information about each content area and grade level for district and state includes:
the total number of students Enrolled, NT Approved (not tested for a state-approved reason), NT Other (not tested for other reasons), and Tested;
the total number and percent of students at each achievement level (based on the number in the Tested column); and
the Mean Scaled Score. The following page contains a sample NECAP District Summary Report.
Guide to Using the 2015 NECAP Science Reports 27
District Summary2014-2015 Students
State:District:
Code:
Demonstration District ARhode IslandDA
Science
EnrolledNT
ApprovedNT Other Tested Achievement Level
Level 4 Level 3 Level 2 Level 1 MeanScore
N N N NN N% % N % N %
Demonstration District A 308 13 12 283 3 1 89 31 103 36 88 31
Grade 4 100 3 2 95 0 0 35 37 39 41 21 22 436
Grade 8 119 6 2 111 3 3 31 28 36 32 41 37 832
Grade 11 89 4 8 77 0 0 23 30 28 36 26 34 1132

Guide to Using the 2015 NECAP Science Reports 28
District and School Student-Level Data Files In addition to all of the reports, districts and schools are also able to access and download student-level data files from the NECAP reporting website for each grade of students tested within their district or school. The student-level data files list students alphabetically within each school and contain all of the demographic information that was provided by the state for each student. Student records contain the scaled score, achievement level, and subscores earned by the student for science. In addition, the student records contain each student’s actual performance on each of the released items as well as the student’s responses to the student questionnaire. The data collected from the optional reports field, if it was coded by schools on page two of the student answer booklets, are also available for each student in the student-level data file. The optional reports field was provided to allow schools the option of grouping individual students into additional categories (for example, by class or by previous year’s teacher). This allows schools to make comparisons between subgroups that are not already listed on the disaggregated results pages of the school and district results reports. The file layout of the student-level data files that lists all of the field names, variable information, and valid values for each field is also available to districts and schools on the NECAP reporting website.
Guide to Using the 2015 NECAP Science Reports 29
Analysis and Reporting System Overview NECAP Science results are accessible online via the NECAP Analysis and Reporting System (NARS). In addition to downloadable static reports and data files, the system includes interactive capabilities that allow school and district users to sort and filter item and subgroup data and create custom reports. Interactive Reports There are four interactive reports that are available from the Analysis and Reporting System: Item Analysis Report, Achievement Level Summary, Released Items Summary Data, and Longitudinal Data. To access these four reports, the user needs to hover their mouse over the interactive tab on the home page of the system and click on the desired report from the drop-down menu. Next, the user will need to apply basic filtering options such as the name of the district or school and the grade level/content area test to open the report. At this point, the user will have the option of printing the report for the entire grade level or applying advanced filtering options to select a subgroup of students for which to analyze their results. Advanced filtering options include gender, ethnicity, LEP, IEP, and SES. (Please note that for New Hampshire results, the SES advanced filtering option is not available.) All interactive reports, with the exception of the Longitudinal Data Report, allow the user to provide a custom title for the report. Item Analysis Reports For NECAP Science this is two reports, which provide individual student performance data on the Released Items and Released Inquiry Task as well as total test results for a selected grade. A more detailed description of the information included on this report can be found on page 11 of this document. Please note that when advanced filtering criteria are applied, the School and District Percent Correct/Average Score rows at the bottom of the report will be blanked out and only the Group row and the State row for the group selected will contain data. This report can be saved, printed, or exported as a pdf. Achievement Level Summary This report provides a visual display of the percentages of students in each achievement level for a selected grade/content area. The four achievement levels (Proficient with Distinction, Proficient, Partially Proficient, and Substantially Below Proficient) are represented by various colors in a pie chart. A separate table is also included below the chart that shows the number and percentage of students in each achievement level. This report can be saved, printed or exported as a pdf or jpg file. Released Items Summary Data This school-level report provides a summary of student responses to the released items for a selected grade/content area. The report is divided into two sections by item type (multiple choice and open response.) For multiple-choice items, the domain and assessment target linked to the item are included as well as the total number/percent of students who answered the item correctly and the number of students who chose each incorrect option or provided an invalid response. An invalid response on a multiple-choice item is defined as the item was left blank or the student selected more than one option for the item. For open-response items, the domain and assessment target linked to the item are included as well as the point value and average score for the item. Users are also able to
Guide to Using the 2015 NECAP Science Reports 30
view the actual released items within this report. If a user clicks on a particular magnifying glass icon next to the released item number, a pop-up box will open displaying the released item. Longitudinal Data Report This confidential student-level report provides individual student performance data for multiple test administrations. Spring 2015 scores and achievement levels are provided for each tested student in science. In addition, scores and achievement levels are included for fall 2013, 2012, 2011, 2010, and 2009 NECAP reading, mathematics, and writing as well as spring 2014, 2013, 2012, 2011, 2010, and 2009 NECAP science for students in Rhode Island and Vermont. New Hampshire changed its student testing ID assignment process in 2015, so historical NECAP results (beyond the current administration) are no longer available for New Hampshire students. This report can be saved, printed, or exported as a pdf. Account Management In the NECAP Analysis and Reporting System, principals have the ability to create unique teacher accounts by assigning specific usernames and passwords to teachers. Once the accounts have been created, individual students may be assigned to each teacher account. After teachers have received their username and password, they will be able to login to their account and access the interactive reports, which will be populated only with the subgroup of students assigned to them. For more information about the interactive reports and setting up teacher accounts please refer to the NECAP Analysis and Reporting System User and Training Manual that is available for download on the Analysis and Reporting System.
Guide to Using the 2015 NECAP Science Reports 31
Appendix A Overview of Assessment Instruments and Procedures
NECAP Tests of 2015 Local Educator Involvement in Test Development Local educators in all three NECAP states were actively involved in each aspect of the NECAP science test development from the beginning of the collaboration among the three states. Educators have been involved in development of Assessment Targets, review of all inquiry tasks and items for bias and sensitivity issues, review of all items for purposes of alignment, Depth of Knowledge, age appropriateness, and accuracy of content. Local educators were also involved in standard setting and the Technical Advisory Committee. NECAP Science Assessment Target Development The NH, RI, and VT Departments of Education have developed a common set of content standards, known as the New England Common Assessment Program Science Assessment Targets, and test specifications in science. These targets were developed in response to the requirements of the federally mandated No Child Left Behind Act of 2001 to test all students, beginning in the 2007–2008 academic year, in at least one grade each in the K–4, 5–8, and 9–11 grade spans in science. Although these sets of targets were developed for this purpose, the partner states were committed to building coherent sets of expectations that would focus, not narrow, the curricula; would support good instruction; and would be aligned with each state’s standards. Throughout the development process, each of the NECAP partners has relied upon the expertise of educators in their states. These educators have helped guide the development of these documents and have made numerous insightful contributions in an effort to help support meaningful instruction in science. Item Review Committee During the item review process, a committee of local educators is convened to review all of the items developed for NECAP. Committee member comments are solicited for each item. Each item is evaluated on the following criteria:
alignment with the NECAP Science Assessment Target being measured; accurate Depth of Knowledge coding; adherence to Universal Design; appropriateness for grade-level; and content accuracy.
Bias and Sensitivity Committee A committee of local educators also meets to review all inquiry tasks and individual test items. Committee members determine if the tasks and items are likely to place a particular group of students at an advantage or disadvantage for non-educational reasons; and if so, whether the task or item should be revised or removed.

Guide to Using the 2015 NECAP Science Reports 32
Technical Advisory Committee A committee of nationally recognized test and measurement experts and local educators has been established and meets regularly to ensure the technical integrity of all NECAP tests. Test Design TYPES OF ITEMS ON NECAP SCIENCE In order to provide a valid assessment of students’ attainment of the NECAP Science Assessment Targets and Inquiry Constructs, a variety of item types needed to be used. Therefore, multiple-choice items, short-answer items, and constructed-response items were used as follows. Multiple choice (one point) Multiple-choice items are efficient for testing a broad array of content in a relatively short time span. Short answer (two points) These open-ended items ask students to write a short answer in response to a question on the inquiry task. Constructed response (three and four points) This item type is used to measure a students’ ability to solve a complex, multi-step problem. This item type is used to measure a student’s ability to apply science content to a unique situation or scientific inquiry skills on the inquiry task. COMMON AND MATRIX-SAMPLED ITEMS There are multiple versions, or forms, of the NECAP tests; for science, four forms were created for each grade level tested. The majority of the items in each of the NECAP test forms were the same in every form, or were “common” to all forms of the test. All individual student results (achievement levels, scaled scores, content area subscores) and school results are based on common items only. The other half of the items in each form were matrix sampled. Matrix sampling means distributing a large number of items among the different forms of the test. This approach allows for field testing of new items for subsequent years’ tests and also allows some items to be administered in successive years for purposes of equating the tests from year to year. All students at grades 4, 8, and 11 take the same common inquiry task for their grade level. A portion of common items is publicly released following each year’s test administration to inform local curriculum and instruction. Released common items are replaced each year with some of the items from the previous year’s matrix-sampled section. The inquiry tasks for grades 4, 8, and 11 are also released each year.
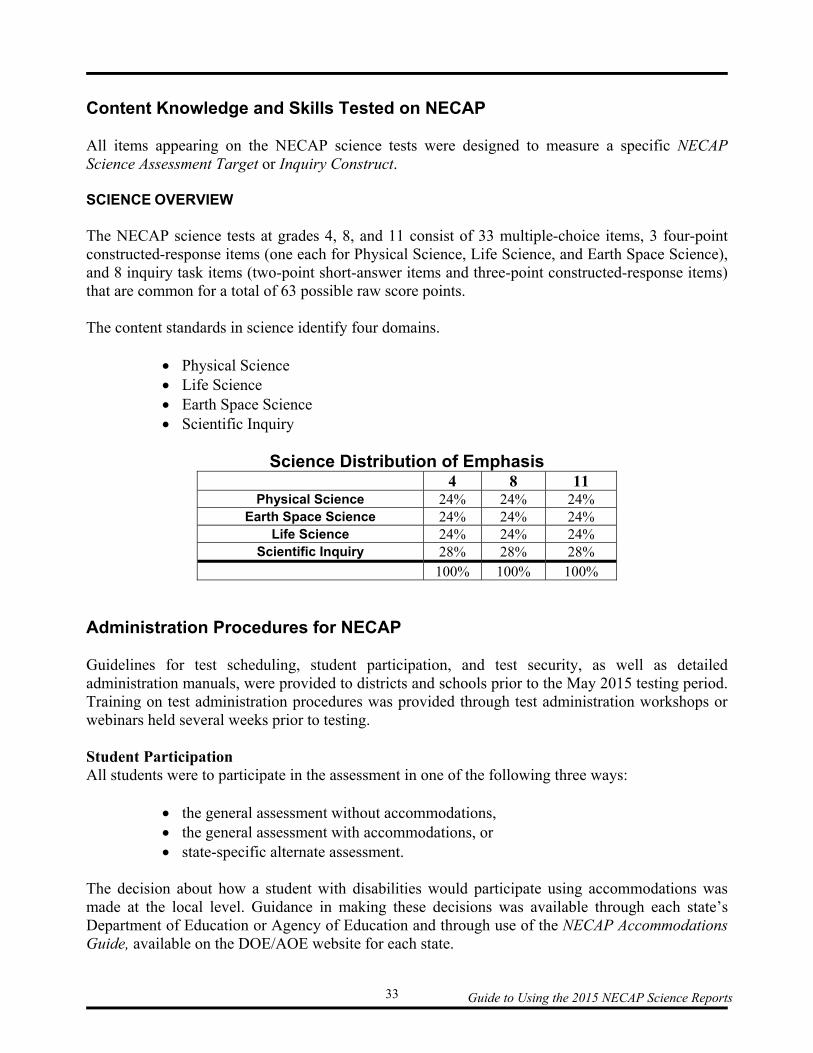
Guide to Using the 2015 NECAP Science Reports 33
Content Knowledge and Skills Tested on NECAP All items appearing on the NECAP science tests were designed to measure a specific NECAP Science Assessment Target or Inquiry Construct. SCIENCE OVERVIEW The NECAP science tests at grades 4, 8, and 11 consist of 33 multiple-choice items, 3 four-point constructed-response items (one each for Physical Science, Life Science, and Earth Space Science), and 8 inquiry task items (two-point short-answer items and three-point constructed-response items) that are common for a total of 63 possible raw score points. The content standards in science identify four domains.
Physical Science Life Science Earth Space Science Scientific Inquiry
Science Distribution of Emphasis
4 8 11 Physical Science 24% 24% 24%
Earth Space Science 24% 24% 24% Life Science 24% 24% 24%
Scientific Inquiry 28% 28% 28% 100% 100% 100%
Administration Procedures for NECAP Guidelines for test scheduling, student participation, and test security, as well as detailed administration manuals, were provided to districts and schools prior to the May 2015 testing period. Training on test administration procedures was provided through test administration workshops or webinars held several weeks prior to testing. Student Participation All students were to participate in the assessment in one of the following three ways:
the general assessment without accommodations, the general assessment with accommodations, or state-specific alternate assessment.
The decision about how a student with disabilities would participate using accommodations was made at the local level. Guidance in making these decisions was available through each state’s Department of Education or Agency of Education and through use of the NECAP Accommodations Guide, available on the DOE/AOE website for each state.
Guide to Using the 2015 NECAP Science Reports 34
Test Scheduling The NECAP science tests for grades 4, 8, and 11 were designed to be administered in three separate sessions. The guidelines for scheduling test sessions were based on an estimate that sessions 1 and 2 would require approximately 45 minutes and all students were allowed up to 90 minutes for those sessions. Session 3 varied by grade. Grade 4 and grade 8 required approximately 90 minutes to complete the session, but all students were allowed up to 120 minutes due to the hands-on nature of the inquiry task. Grade 11 students performed a paper-and-pencil inquiry task analysis for session 3 and required approximately 60 minutes to complete the task. Administrators were instructed to allow extra time for any students who required test accommodations that could not be made during the regular test sessions. For scheduling purposes, each session was treated as an intact unit. That is, once students started a session of the test they had to finish it within the time allotted; also, under no circumstances were they allowed to go back to an earlier session once they had moved on to another session. Scoring In July 2015, nearly 5.8 million NECAP student responses were processed and scored at Measured Progress. The scoring activities that were used to produce the results for the NECAP reports are described below. Scoring was separated into the following three major tasks:
scoring of responses to multiple-choice items, scoring of responses to short-answer items, and scoring of responses to constructed-response items
SCORING OF MULTIPLE-CHOICE ITEMS Multiple-choice items were machine-scored using digital scanning equipment. Correct responses were assigned a score of one point each; incorrect or blank responses were assigned a score of zero points each. SCORING OF SHORT-ANSWER AND CONSTRUCTED-RESPONSE ITEMS Short-answer and constructed-response items were scored by scorers employed by Measured Progress, the testing contractor. Short-answer items were given a score from zero to two. Constructed-response items were given a score from zero to three or zero to four. Zeros are employed when a student produces some work, but the work is totally wrong or irrelevant or if he or she leaves the item blank. For purposes of aggregating item results, blanks and zeros both count as zero points towards a student’s score.
Guide to Using the 2015 NECAP Science Reports 35
The work in preparation for scoring student responses included:
development of scoring guides (rubrics) by content specialists from the NH and RI Departments of Education, the VT Agency of Education, and Measured Progress’s test developers, and
selection of “benchmark” responses—examples of student work at different score points for each item—that were used in training and continuous monitoring of scorer accuracy.
Scorer training consisted of:
review of each item and its related content and performance standard, review and discussion of the scoring guide and multiple sets of benchmark responses
for each score point, and qualifying rounds of scoring in which scorers needed to demonstrate a prescribed
level of accuracy. Setting Standards for Performance on the NECAP Tests Standard setting is the process of determining the minimum or “threshold” score for each achievement level, grade, and content area for which results are reported. The multi-step process of setting standards for the NECAP tests began with creation of achievement level descriptions. In August 2008, the state Departments of Education in NH, RI, and VT convened panels of educators to participate in the standard-setting process for NECAP science grades 4, 8, and 11. For more detailed information on standard setting, see the NECAP Science Standard Setting Report, which is available on the DOE/AOE website of each state. Reporting The NECAP tests were designed to measure student performance against the learning goals described in the NECAP Science Assessment Targets and Inquiry Constructs. Consistent with this purpose, primary results on the NECAP science tests are reported in terms of achievement levels that describe student performance in relation to these established state standards. There are four achievement levels: Proficient with Distinction, Proficient, Partially Proficient, and Substantially Below Proficient. Students receive a separate achievement level classification (based on total scaled score) in each content area in which they complete a test. Each of the four achievement levels encompasses a range of student performance. A student whose test performance is just above Substantially Below Proficient and a student whose level of performance is slightly below Proficient are both classified as Partially Proficient. There is no overall classification of student performance across content areas. School- and district-level results are reported as the number and percentage of students attaining each achievement level at each grade level tested. In addition to achievement levels, NECAP science results for grades 4, 8, and 11 are also reported as scaled scores.
Guide to Using the 2015 NECAP Science Reports 36
TRANSLATING RAW SCORES TO SCALED SCORES AND ACHIEVEMENT LEVELS NECAP scores in each content area are reported on a scale that ranges from 00 to 80. Scaled scores supplement the NECAP achievement level results by providing information about the position of a student’s results within an achievement level. School- and district-level scaled scores are calculated by computing the average of student-level scaled scores. Students’ raw scores, or total number of points, on the NECAP tests are translated to scaled scores using a data analysis process called scaling. Scaling simply converts raw points from one scale to another. In the same way that the same temperature can be expressed on either the Fahrenheit or Celsius scales and the same distance can be expressed either in miles or kilometers, student scores on the NECAP tests could be expressed as raw scores or scaled scores. It is important to note that converting from raw scores to scaled scores does not change the students’ achievement level classifications. Given the relative simplicity of raw scores, it is fair to question why scaled scores are used in NECAP reports instead of raw scores. Foremost, scaled scores offer the advantage of simplifying the reporting of results across content areas, grade levels, and subsequent years. Because the standard-setting process typically results in different cut scores across content areas on a raw score basis, it is useful to transform these raw cut scores to a scale that is more easily interpretable and consistent. For NECAP, a score of 40 is the cut score between the Partially Proficient and Proficient achievement levels. This is true regardless of the content area, grade, or year with which one may be concerned. If one were to use raw scores, the raw cut score between Substantially Below Proficient and Partially Proficient might, for example, be 35 in science at grade 4, but 33 in science at grade 8, or 36 in mathematics at grade 8. Using scaled scores greatly simplifies the task of understanding how a student performed.
Guide to Using the 2015 NECAP Science Reports 37
Appendix B
CCOODDEE OOFF PPRROOFFEESSSSIIOONNAALL RREESSPPOONNSSIIBBIILLIITTIIEESS IINN EEDDUUCCAATTIIOONNAALL MMEEAASSUURREEMMEENNTT
Prepared by the NCME Ad Hoc Committee on the Development of a Code of Ethics: Cynthia B. Schmeiser, ACT – Chair
Kurt F. Geisinger, State University of New York Sharon Johnson-Lewis, Detroit Public Schools
Edward D. Roeber, Council of Chief State School Officers William D. Schafer, University of Maryland
©1995 National Council on Measurement in Education
Any portion of this Code may be reproduced and disseminated for educational purposes
Educating Others
Evaluation and Research
Interpretation and Use
Scoring
Development
Marketing and Selling
Selection
Administration
Guide to Using the 2015 NECAP Science Reports 38
CCOODDEE OOFF PPRROOFFEESSSSIIOONNAALL RREESSPPOONNSSIIBBIILLIITTIIEESS IINN EEDDUUCCAATTIIOONNAALL MMEEAASSUURREEMMEENNTT
As an organization dedicated to the improvement of measurement and evaluation practice in education, the National Council on Measurement in Education (NCME) has adopted this Code to promote professionally responsible practice in conduct that arises from either the professional standards of the field, general ethical principles, or both. The purpose of the Code of Professional Responsibilities in Educational Measurement, hereinafter referred to as the Code, is to guide the conduct of NCME members who are involved in any type of assessment activity in education. NCME is also providing this Code as a public service for all individuals who are engaged in educational assessment activities in the hope that these activities will be conducted in a professionally responsible manner. Persons who engage in these activities include local educators such as classroom teachers, principals, and superintendents; professionals such as school psychologists and counselors; state and national technical, legislative, and policy staff in education; staff of research, evaluation, and testing organizations; providers of test preparation services; college and university faculty and administrators; and professionals in business and industry who design and implement educational and training programs. This Code applies to any type of assessment that occurs as part of the educational process, including formal and informal, traditional and alternative techniques for gathering information used in making educational decisions at all levels. These techniques include, but are not limited to, large-scale assessments at the school, district, state, national, and international levels; standardized tests; observational measures; teacher-conducted assessments; assessment support materials; and other achievement, aptitude, interest, and personality measures used in and for education. Although NCME is promulgating this Code for its members, it strongly encourages other organizations and individuals who engage in educational assessment activities to endorse and abide by the responsibilities relevant to their professions. Because the Code
pertains only to uses of assessment in education, it isrecognized that uses of assessments outside of educationalcontexts, such as for employment, certification, orlicensure, may involve additional professionalresponsibilities beyond those detailed in this Code. The Code enumerates professional responsibilities ineight major areas of assessment activity. Specifically, theCode presents the professional responsibilities of thosewho:
1) Develop Assessments 2) Market and Sell Assessments
3) Select Assessments
4) Administer Assessments 5) Score Assessments
6) Interpret Use, and Communicate
Assessment Results 7) Educate About Assessment
8) Evaluate Programs and Conduct Research
on Assessments. Although the organization of the Code is based on thedifferentiation of these activities, they are viewed ashighly interrelated, and those who use this Code are urgedto consider the Code in its entirety. The index followingthis Code provides a listing of some of the critical interesttopics within educational measurement that focus on oneor more of the assessment activities.
PREAMBLE AND GENERAL RESPONSIBILITIES
Guide to Using the 2015 NECAP Science Reports 39
The professional responsibilities promulgated in this Code in eight major areas of assessment activity are based on expectations that NCME members involved in educational assessment will:
1) protect the health and safety of all examinees; 2) be knowledgeable about, and behave in compliance with,
state and federal laws relevant to the conduct of professional activities;
3) maintain and improve their professional competence in
educational assessment; 4) provide assessment services only in areas of their
competence and experience, affording full disclosure of their professional qualifications;
5) promote the understanding of sound assessment practices in
education; 6) adhere to the highest standards of conduct and promote
professionally responsible conduct within educational institutions and agencies that provide educational services; and
7) perform all professional responsibilities with honesty,
integrity, due care, and fairness. 1.1 ensure that assessment products and services are developed
to meet applicable professional, technical, and legal standards.
1.2 develop assessment products and services that are as free as
possible from bias due to characteristics irrelevant to the construct being measured, such as gender, ethnicity, race, socioeconomic status, disability, religion, age, or national origin.
1.3 plan accommodations for groups of test takers with
disabilities and other special needs when developing assessments.
1.4 disclose to appropriate parties any actual or potential
conflicts of interest that might influence the developers’ judgment or performance.
1.5 use copyrighted materials in assessment products and
services in accordance with state and federal law. 1.6 make information available to appropriate persons
about the steps taken to develop and score the
Responsible professional practice includes being informed about and acting in accordance with the Code of Fair Testing Practices in Education (joint Committee on Testing Practices,1988), the Standards for Educational and Psychological Testing(American Educational Research Association, American Psychological Association, NCME, 1985), or subsequent revisions as well as all applicable state and federal laws that may govern the development, administration, and use of assessment. Both the Standards for Educational and Psychological Testing and the Code of Fair Testing Practices in Education are intended to establish criteria for judging the technical adequacy of tests and the appropriate uses of tests and test results. The purpose of this Code is to describe the professional responsibilities of those individuals who are engaged in assessment activities. As would be expected, there is a strong relationship between professionally responsible practice and sound educational assessments, and this Code is intended to be consistent with the relevant parts of both of these documents. It is not the intention of NCME to enforce the professional responsibilities stated in the Code or to investigate allegations of violations to the Code. Since the Code provides a frame of reference for the evaluation of the appropriateness of behavior, NCME recognizes that the Code may be used in legal or other similar proceedings
assessment, including up-to-date information used to support the reliability, validity, scoring and reporting processes, and other relevant characteristics of the assessment.
1.7 protect the rights to privacy of those who are assessed as
part of the assessment development process. 1.8 caution users, in clear and prominent language, against the
most likely misinterpretations and misuses of data that arise out of the assessment development process.
1.9 avoid false or unsubstantiated claims in test preparation and
program support materials and services about an assessment or its use and interpretation.
1.10 correct any substantive inaccuracies in assessments or their
support materials as soon as feasible. 1.11 develop score reports and support materials that promote
the understanding of assessment results.
Responsibilities of Those Who Develop Assessment Products and Services
Those who develop assessment products and services, such as classroom teachers and other assessment specialists, have a professional responsibility to strive to produce assessments that are of the highest quality. Persons who develop assessments have a professional responsibility to:
SECTION 1
Guide to Using the 2015 NECAP Science Reports 40
2.1 provide accurate information to potential purchasers
about assessment products and services and their recommended uses and limitations.
2.2 not knowingly withhold relevant information about
assessment products and services that might affect an appropriate selection decision.
2.3 base all claims about assessment products and services
on valid interpretations of publicly available information.
2.4 allow qualified users equal opportunity to purchase
assessment products and services. 2.5 establish reasonable fees for assessment products and
services. 2.6 communicate to potential users, in advance of any
purchase or use, all applicable fees associated with assessment products and services.
2.7 strive to ensure that no individuals are denied access to
opportunities because of their inability to pay the fees for assessment products and services.
3.1 conduct a thorough review and evaluation of available
assessment strategies and instruments that might be valid for the intended uses.
3.2 recommend and/or select assessments based on publicly
available documented evidence of their technical quality and utility rather than on unsubstantiated claims or statements.
3.3 disclose any associations or affiliations that they have with
the authors, test publishers or others involved with the assessments under consideration for purchase and refrain from participation if such associations might affect the objectivity of the selection process.
3.4 inform decision makers and prospective users of the
appropriateness of the assessment for the intended uses, likely consequences of use, protection of examinee rights, relative costs, materials, and services needed to conduct or use the assessment, and known limitations of the
3.5
2.8 establish criteria for the sale of assessment products and
services, such as limiting the sale of assessment products and services to those individuals who are qualified for recommended uses and from whom proper uses and interpretations are anticipated.
2.9 inform potential users of known inappropriate uses of
assessment products and services and provide recommendations about how to avoid such misuses.
2.10 maintain a current understanding about assessment
products and services and their appropriate uses in education.
2.11 release information implying endorsement by users of
assessment products and services only with the users’ permission.
2.12 avoid making claims that assessment products and
services have been endorsed by another organization unless an official endorsement has been obtained.
2.13 avoid marketing test preparation products and services
that may cause individuals to receive scores that misrepresent their actual levels of attainment.
assessment, including potential misuses and misinterpretations of assessment information.
3.5 recommend against the use of any prospective assessment
that is likely to be administered, scored, and used in an invalid manner for members of various groups in our society for reasons of race, ethnicity, gender, age, disability, language background, socioeconomic status, religion, or national origin.
3.6 comply with all security precautions that may accompany
assessments being reviewed. 3.7 immediately disclose any attempts by others to exert undue
influence on the assessment selection process. 3.8 avoid recommending, purchasing, or using test preparation
products and services that may cause individuals to receive scores that misrepresent their actual levels of attainment.
Responsibilities of Those Who Market and Sell Assessment Products and Services
Responsibilities of Those Who Select Assessment Products and Services
The marketing of assessment products and services, such as tests and other instruments, scoring services test preparation services, consulting, and test interpretive services, should be based on information that is accurate, complete, and relevant to those considering their use. Persons who market and see assessment products and services have a professional responsibility to:
Those who select assessment products and services for use in educational settings, or help others do so, have important professional responsibilities to make sure that the assessments are appropriate for their intended use. Persons who select assessment products and services have a professional responsibility to:
SECTION 2
SECTION 3
Guide to Using the 2015 NECAP Science Reports 41
4.1 inform the examinees about the assessment prior to its
administration, including its purposes, uses; and consequences; how the assessment information will be judged or scored; how the results will be kept on file; who will have access to the results; how the results will be distributed; and examinees rights before, during, and after the assessment.
4.2 administer only those assessments for which they are
qualified by education, training, licensure, or certification. 4.3 take appropriate security precautions before, during, and
after the administration of the assessment. 4.4 understand the procedures needed to administer the
assessment prior to administration. 4.5 administer standardized assessments according to
prescribed procedures and conditions and notify appropriate persons if any nonstandard or delimiting conditions occur.
5.1 provide complete and accurate information to users about
how the assessment is scored, such as the reporting schedule, scoring process to be used, rationale for the scoring approach, technical characteristics, quality control procedures, reporting formats, and the fees, if any, for these services.
5.2 ensure the accuracy of the assessment results by conducting
reasonable quality control procedures before, during, and after scoring.
5.3 minimize the effect on scoring of factors irrelevant to the
purposes of the assessment. 5.4 inform users promptly of any deviation in the planned
scoring and reporting service or schedule and negotiate a solution with users.
4.6 not exclude any eligible student from the assessment. 4.7 avoid any conditions in the conduct of the assessment that
might invalidate the results. 4.8 provide for and document all reasonable and allowable
accommodations for the administration of the assessment to persons with disabilities or special needs.
4.9 provide reasonable opportunities for individuals to ask
questions about the assessment procedures or directions prior to and at prescribed times during the administration of the assessment.
4.10 protect the rights to privacy and due process of those who
are assessed. 4.11 avoid actions or conditions that would permit or encourage
individuals or groups to receive scores that misrepresent their actual levels of attainment.
5.5 provide corrected score results to the examinee or the client
as quickly as practicable should errors be found that may affect the inferences made on the basis of the scores.
5.6 protect the confidentiality of information that identifies
individuals as prescribed by state and federal law. 5.7 release summary results of the assessment only to those
persons entitled to such information by state or federal law or those who are designated by the party contracting for the scoring services.
5.8 establish, where feasible, a fair and reasonable process for
appeal and rescoring the assessment.
Those who prepare individuals to take assessments and those who are directly or indirectly involved in the administration of assessments as part of the educational process, including teachers, administrators, and assessment personnel, have an important role in making sure that the assessments are administered in a fair and accurate manner. Persons who prepare others for and those who administer, assessments have a professional responsibility to:
Responsibilities of Those Who Score Assessments
The scoring of educational assessments should be conducted properly and efficiently so that the results are reported accurately and in a timely manner. Persons who score and prepare reports of assessments have a professional responsibility to:
Responsibilities of Those Who Administer Assessments
SECTION 4
SECTION 5

Guide to Using the 2015 NECAP Science Reports 42
6.1 conduct these activities in an informed objective, and fair
manner within the context of the assessment’s limitations and with an understanding of the potential consequences of use.
6.2 provide to those who receive assessment results
information about the assessment, its purposes, its limitations, and its uses necessary for the proper interpretation of the results.
6.3 provide to those who receive score reports an
understandable written description of all reported scores, including proper interpretations and likely misinterpretations.
6.4 communicate to appropriate audiences the results of the
assessment in an understandable and timely manner, including proper interpretations and likely misinterpretations.
6.5 evaluate and communicate the adequacy and
appropriateness of any norms or standards used in the interpretation of assessment results.
7.1 remain competent and current in the areas in which they
teach and reflect that in their instruction. 7.2 provide fair and balanced perspectives when teaching about
assessment. 7.3 differentiate clearly between expressions of opinion and
substantiated knowledge when educating others about any specific assessment method, product, or service.
7.4 disclose any financial interests that might be perceived to
influence the evaluation of a particular assessment product or service that is the subject of instruction.
7.5 avoid administering any assessment that is not part of the
evaluation of student performance in a course if the
6.6 inform parties involved in the assessment process how
assessment results may affect them. 6.7 use multiple sources and types of relevant information
about persons or programs whenever possible in making educational decisions.
6.8 avoid making, and actively discourage others from making,
inaccurate reports, unsubstantiated claims, inappropriate interpretations, or otherwise false and misleading statements about assessment results.
6.9 disclose to examinees and others whether and how long the
results of the assessment will be kept on file, procedures for appeal and rescoring, rights examinees and others have to the assessment information, and how those rights may be exercised.
6.10 report any apparent misuses of assessment information to
those responsible for the assessment process. 6.11 protect the rights to privacy of individuals and institutions
involved in the assessment process.
administration of that assessment is likely to harm any student.
7.6 avoid using or reporting the results of any assessment that
is not part of the evaluation of student performance in a course if the use or reporting of results is likely to harm any student.
7.7 protect all secure assessments and materials used in the
instructional process. 7.8 model responsible assessment practice and help those
receiving instruction to learn about their professional responsibilities in educational measurement.
7.9 provide fair and balanced perspectives on assessment
issues being discussed by policymakers, parents and other citizens.
The interpretation, use, and communication of assessment results should promote valid inferences and minimize invalid ones. Persons who interpret, use, and communicate assessment results have a professional responsibility to:
Responsibilities of Those Who Educate Others about Assessment
SECTION 7
The process of educating others about educational assessment, whether as part of higher education, professional development, public policy discussions, or job training, should prepare individuals to understand and engage in sound measurement practice and to become discerning users of tests and test results. Persons who educate or inform others about assessment have a professional responsibility to:
Responsibilities of Those Who Interpret, Use, and Communicate Assessment Results
SECTION 6
Guide to Using the 2015 NECAP Science Reports 43
8.1 conduct evaluation and research activities in an informed,
objective, and fair manner. 8.2 disclose any associations that they have with authors, test
publishers, or others involved with the assessment and refrain from participation if such associations might affect the objectivity of the research or evaluation.
8.3 preserve the security of all assessments throughout the
research process as appropriate. 8.4 take appropriate steps to minimize potential sources of
invalidity in the research and disclose known factors that may bias the results of the study.
8.5 present the results of research, both intended and
As stated at the outset, the purpose of the Code of Professional Responsibilities in Educational Measurement is to serve as a guide to the conduct of NCME members who are engaged in any type of assessment activity in education. Given the broad scope of the field of educational assessment as well as the variety of activities in which professionals may engage, it is unlikely that any code will cover the professional responsibilities involved in every situation or activity in which assessment is used in education. Ultimately, it is hoped that this Code will serve as the basis for ongoing discussions about what constitutes professionally responsible practice. Moreover, these discussions will undoubtedly identify areas of practice
unintended, in a fair, complete, and objective manner.
8.6 attribute completely and appropriately the work and ideas of others.
8.7 qualify the conclusions of the research within the
limitations of the study. 8.8 use multiple sources of relevant information in conducting
evaluation and research activities whenever possible. 8.9 comply with applicable standards for protecting the rights
of participants in an evaluation or research study, including the rights to privacy and informed consent.
that need further analysis and clarification in subsequent editions of the Code. To the extent that these discussions occur, the Code will have served its purpose. To assist in the ongoing refinement of the Code, comments on this document are most welcome. Please send your comments and inquiries to:
Dr. William J. Russell Executive Officer
National Council on Measurement in Education
1230 Seventeenth Street, NW Washington, DC 20036-3078
Conducting research on or about assessments or educational programs is a key activity in helping to improve the understanding and use of assessments and educational programs. Persons who engage in the evaluation of educational programs or conduct research on assessments have a professional responsibility to:
Afterword
Responsibilities of Those Who Evaluate Educational Programs & Conduct Research on Assessments
SECTION 8
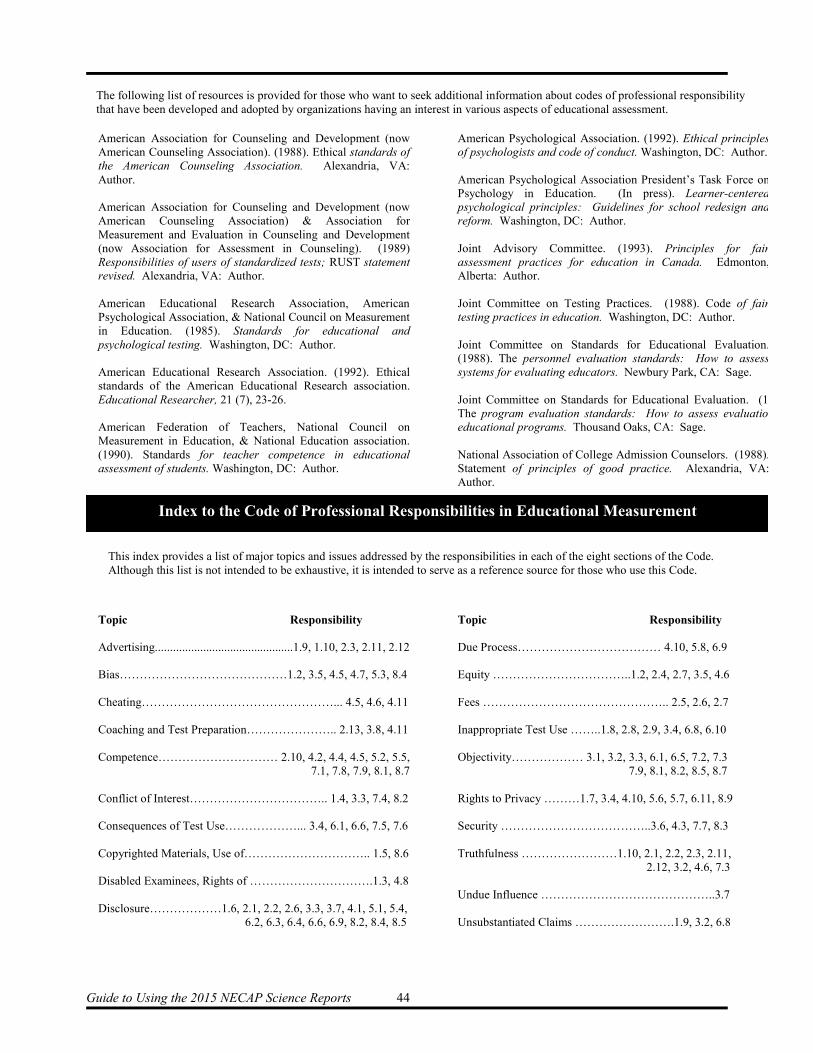
Guide to Using the 2015 NECAP Science Reports 44
American Association for Counseling and Development (now American Counseling Association). (1988). Ethical standards of the American Counseling Association. Alexandria, VA: Author. American Association for Counseling and Development (now American Counseling Association) & Association for Measurement and Evaluation in Counseling and Development (now Association for Assessment in Counseling). (1989) Responsibilities of users of standardized tests; RUST statement revised. Alexandria, VA: Author. American Educational Research Association, American Psychological Association, & National Council on Measurement in Education. (1985). Standards for educational and psychological testing. Washington, DC: Author. American Educational Research Association. (1992). Ethical standards of the American Educational Research association. Educational Researcher, 21 (7), 23-26. American Federation of Teachers, National Council on Measurement in Education, & National Education association. (1990). Standards for teacher competence in educational assessment of students. Washington, DC: Author. Topic Responsibility Advertising..............................................1.9, 1.10, 2.3, 2.11, 2.12 Bias……………………………………1.2, 3.5, 4.5, 4.7, 5.3, 8.4 Cheating…………………………………………... 4.5, 4.6, 4.11 Coaching and Test Preparation………………….. 2.13, 3.8, 4.11 Competence………………………… 2.10, 4.2, 4.4, 4.5, 5.2, 5.5, 7.1, 7.8, 7.9, 8.1, 8.7 Conflict of Interest…………………………….. 1.4, 3.3, 7.4, 8.2 Consequences of Test Use………………... 3.4, 6.1, 6.6, 7.5, 7.6 Copyrighted Materials, Use of………………………….. 1.5, 8.6 Disabled Examinees, Rights of ………………………….1.3, 4.8 Disclosure………………1.6, 2.1, 2.2, 2.6, 3.3, 3.7, 4.1, 5.1, 5.4, 6.2, 6.3, 6.4, 6.6, 6.9, 8.2, 8.4, 8.5
American Psychological Association. (1992). Ethical principlesof psychologists and code of conduct. Washington, DC: Author. American Psychological Association President’s Task Force onPsychology in Education. (In press). Learner-centeredpsychological principles: Guidelines for school redesign andreform. Washington, DC: Author. Joint Advisory Committee. (1993). Principles for fairassessment practices for education in Canada. Edmonton,Alberta: Author. Joint Committee on Testing Practices. (1988). Code of fairtesting practices in education. Washington, DC: Author. Joint Committee on Standards for Educational Evaluation.(1988). The personnel evaluation standards: How to assesssystems for evaluating educators. Newbury Park, CA: Sage. Joint Committee on Standards for Educational Evaluation. (1The program evaluation standards: How to assess evaluationeducational programs. Thousand Oaks, CA: Sage. National Association of College Admission Counselors. (1988).Statement of principles of good practice. Alexandria, VA:Author. Topic Responsibility Due Process……………………………… 4.10, 5.8, 6.9 Equity ……………………………..1.2, 2.4, 2.7, 3.5, 4.6 Fees ……………………………………….. 2.5, 2.6, 2.7 Inappropriate Test Use ……..1.8, 2.8, 2.9, 3.4, 6.8, 6.10 Objectivity……………… 3.1, 3.2, 3.3, 6.1, 6.5, 7.2, 7.3 7.9, 8.1, 8.2, 8.5, 8.7 Rights to Privacy ………1.7, 3.4, 4.10, 5.6, 5.7, 6.11, 8.9 Security ………………………………..3.6, 4.3, 7.7, 8.3 Truthfulness ……………………1.10, 2.1, 2.2, 2.3, 2.11, 2.12, 3.2, 4.6, 7.3 Undue Influence ……………………………………..3.7 Unsubstantiated Claims …………………….1.9, 3.2, 6.8
The following list of resources is provided for those who want to seek additional information about codes of professional responsibility that have been developed and adopted by organizations having an interest in various aspects of educational assessment.
Index to the Code of Professional Responsibilities in Educational Measurement
This index provides a list of major topics and issues addressed by the responsibilities in each of the eight sections of the Code. Although this list is not intended to be exhaustive, it is intended to serve as a reference source for those who use this Code.

Guide to Using the 2015 NECAP Science Reports 45
Appendix C NECAP Achievement Level Descriptions
General Achievement Level Descriptions
Proficient with Distinction (Level 4)
Students performing at this level demonstrate the knowledge and skills as described in the content standards for this grade span. Errors made by these students are few and minor and do not reflect gaps in knowledge and skills.
Proficient (Level 3)
Students performing at this level demonstrate the knowledge and skills as described in the content standards for this grade span with only minor gaps. It is likely that any gaps in knowledge and skills demonstrated by these students can be addressed by the classroom teacher during the course of classroom instruction.
Partially Proficient (Level 2)
Students performing at this level demonstrate gaps in knowledge and skills as described in the content standards for this grade span. Additional instructional support may be necessary for these students to achieve proficiency on the content standards.
Substantially Below Proficient (Level 1)
Students performing at this level demonstrate extensive and significant gaps in knowledge and skills as described in the content standards for this grade span. Additional instructional support is necessary for these students to achieve proficiency on the content standards.
Guide to Using the 2015 NECAP Science Reports 46
Appendix D
Reference Materials
Coladarci, T, Cobb, C.D., Minimum, E.W., & Clarke, R.C. (2004). Fundamentals of statistical reasoning in education. Hoboken, NJ: John Wiley & Sons, Inc. (ISBN: 0471069728) Glass, G.V. & Hopkins, K.D. (1996). Statistical methods in education and psychology (3rd edition). Boston: Allyn & Bacon. (ISBN: 0205142125) Shavelson, R.J. (1996). Statistical reasoning for the behavioral sciences (3rd edition). Boston: Allyn & Bacon. (ISBN: 020518460X)


![[Sprin co] tm vision_strategies_mos_initiatives](https://img.pdfslide.us/doc/110x75/549a66eeb47959654d8b590d/sprin-co-tm-visionstrategiesmosinitiatives.jpg)