Embed Size (px)
Citation preview
The New England Common Assessment Program
Guide to Using the 2012
NECAP Reports
Guide to Using the 2012 NECAP Reports 1
Contact Information
If you have questions after reviewing this guide, please contact the Department of Education for your state. Maine Department of Education: Susan Fossett, MEA/NECAP Coordinator, 207-624-6775, [email protected], 23 State House Station, Augusta, ME 04333, http://www.maine.gov/doe New Hampshire Department of Education: Keith R. Burke, Assessment Consultant, 603-271-3846, [email protected], 101 Pleasant Street, Concord, NH 03301, http://www.education.nh.gov Rhode Island Department of Elementary and Secondary Education: Dr. Kevon Tucker-Seeley, Office of Instruction, Assessment and Curriculum, 401-222-8494, [email protected], 255 Westminster Street, Providence, RI 02903, http://www.ride.ri.gov Vermont Agency of Education: Michael Hock, Director of Assessment, 802-828-3115, [email protected], 120 State Street, Montpelier, VT 05620, http://education.vermont.gov
Guide to Using the 2012 NECAP Reports 2
Table of Contents Introduction ........................................................................................................................ ..4 NECAP Background .................................................................................................................. ..4 Maine Joins NECAP .................................................................................................................. ..4 Document Purpose .................................................................................................................... ..4 Accessing Reports .................................................................................................................... ..5 General Guidelines for the Use of NECAP Reports .......................................................... ..6 Alignment of Curriculum and the NECAP Tests ........................................................................ ..6 Use of NECAP Student-Level Results ...................................................................................... ..6 Multiple Data Points Needed for Trend Analysis ....................................................................... ..6 Regulations Regarding Confidentiality of Student Records ....................................................... ..6 NCME Code of Professional Responsibilities in Educational Measurement ............................. ..6 Understanding the NECAP Student Report ....................................................................... ..7 Student’s Achievement Level and Score ................................................................................... ..7 Student’s Achievement Level Compared to Other Students by School, District, and State ...... ..7 Student’s Performance in Content Area Subcategories ............................................................ ..7 Sample NECAP Grade 5 Student Report .................................................................................. ..9 Sample NECAP Grade 11 Student Report ................................................................................ 11 Understanding the NECAP Item Analysis Report .............................................................. 13 Sample NECAP Grade 3 Mathematics Item Analysis Report .................................................. 15 Sample NECAP Grade 11 Writing Item Analysis Report ......................................................... 17 Understanding the NECAP School and District Results Reports ....................................... 18 Overview ................................................................................................................................... 18 Identification ............................................................................................................................ 18 Basis for Results ..................................................................................................................... 18 Minimum Number of Students Needed to Generate Reports .................................................. 18 Making Comparisons among Students, Schools, and Districts ................................................. 18 Comparisons of School- and District-Level Scores ................................................................. 19 Scaled Scores ......................................................................................................................... 19 Achievement Levels ................................................................................................................ 20 Comparisons of NECAP Scores across Years .......................................................................... 21 School- and District-Level Scaled Scores and Achievement Levels ....................................... 21 Student-Level Scaled Scores and Achievement Levels .......................................................... 22 Content Area Subscores ......................................................................................................... 23 Achievement Level Cut Scores ............................................................................................... 23 Teaching Year vs. Testing Year .............................................................................................. 24 Sample NECAP School Results Report (cover pages) ............................................................. 25 Grade Level Summary Report (page 2 of the NECAP School Results Report) ............................... 26 Participation in NECAP ............................................................................................................ 26 Students Enrolled on or after October 1 .................................................................................. 26 Students Tested ...................................................................................................................... 26 Students Tested with an approved accommodation ................................................................ 26 Current LEP Students ............................................................................................................. 26 Current LEP Students Tested with an approved accommodation ........................................... 26
Guide to Using the 2012 NECAP Reports 3
IEP Students ........................................................................................................................... 26 IEP Students Tested with an approved accommodation ......................................................... 26 Students Not Tested in NECAP .............................................................................................. 26 Students Not Tested in NECAP .............................................................................................. 26 NECAP Results ......................................................................................................................... 27 Sample Grade 5 NECAP Grade Level Summary Report Page ................................................. 28 Sample Grade 11 NECAP Grade Level Summary Report Page ............................................... 29 Content Area Results (pages 3, 5, and 7 of the NECAP School Results Report) ............................. 30 Grade 11 Writing Results report pages ..................................................................................... 31 Average Score Comparison by Type of Writing (page 8 of the NECAP School Results Report) .... 31 Score Distribution and Scoring Rubric (page 9 of the NECAP School Results Report) .................. 31 Sample Grade 5 NECAP Reading Results Page ...................................................................... 32 Sample Grade 11 NECAP Writing Results Pages ..................................................................... 33 Disaggregated Content Area Results (pages 4, 6, and 8 of the NECAP School Results Report) .... 36 Sample Grade 5 NECAP Disaggregated Mathematics Results Page ....................................... 37 Understanding the School and District Summary Reports ................................................ 38 Overview ................................................................................................................................... 38 Sample NECAP School Summary Report ................................................................................. 39 District and School Student-Level Data Files .................................................................... 40 Analysis and Reporting System .................................................................................................. 41 Overview ................................................................................................................................... 41 Interactive Reports ................................................................................................................... 41 Item Analysis Report ..................................................................................................... 41 Achievement Level Summary ........................................................................................ 41 Released Items Summary Data ...................................................................................... 41 Longitudinal Data .......................................................................................................... 42 Account Management .............................................................................................................. 42 Appendix A: Overview of Assessment Instruments and Procedures ................................ 43 Appendix B: Code of Professional Responsibilities in Educational Measurement ............. 54 Appendix C: NECAP Achievement Level Descriptions ...................................................... 62 Appendix D: Reference Materials ...................................................................................... 67
Guide to Using the 2012 NECAP Reports 4
Introduction NECAP Background New England Common Assessment Program (NECAP) was originally the result of collaboration among New Hampshire, Rhode Island and Vermont to build a set of assessments for grades 3 through 8 & 11 to meet the requirements of the No Child Left Behind Act (NCLB). The three states decided to work together for three important reasons:
Working together brings together a team of assessment and content specialists with experience and expertise greater than any individual state.
Working together provides the capacity necessary for the three states to develop quality, customized assessments consistent with the overall goal of improving education.
Working together allows the sharing of costs in the development of a customized assessment program of a quality that would not be feasible for any individual state.
Maine Joins NECAP Maine had been involved in the early discussions with the NECAP states, but the decision was made to continue with their testing program, which had been in effect since 1985. However, a few years later, Maine reviewed the many benefits of joining NECAP, requested admission, and became a member in January 2009. Maine administers the NECAP assessment in reading, mathematics, and writing at grades 3-8, while maintaining their own assessment programs in science and at the high school level. Document Purpose The primary purpose of this document is to support local educators’ use of test data from the October 2012 administration of the New England Common Assessment Program (NECAP) tests. This document describes and explains the information included in the following types of NECAP reports shown below.
NECAP Tests of Fall 2012: NECAP Student Report NECAP Tests of Fall 2012: NECAP Item Analysis Report NECAP Tests of Fall 2012: NECAP District/School Results Report NECAP Tests of Fall 2012: NECAP District/School Summary Report NECAP Tests of Fall 2012: NECAP District/School Student-Level Data Files
These reports and data files contain information valuable to schools and districts in their efforts to better serve the academic needs of individual students and to evaluate and improve curriculum and instruction. In addition, this document can help school and district personnel communicate with their communities about the NECAP test results. It is important to note that these reports contain results from the student assessment program, and not individual state accountability systems. Please note that the appendices contain important information about NECAP assessment instruments and procedures.
Guide to Using the 2012 NECAP Reports 5
Accessing Reports
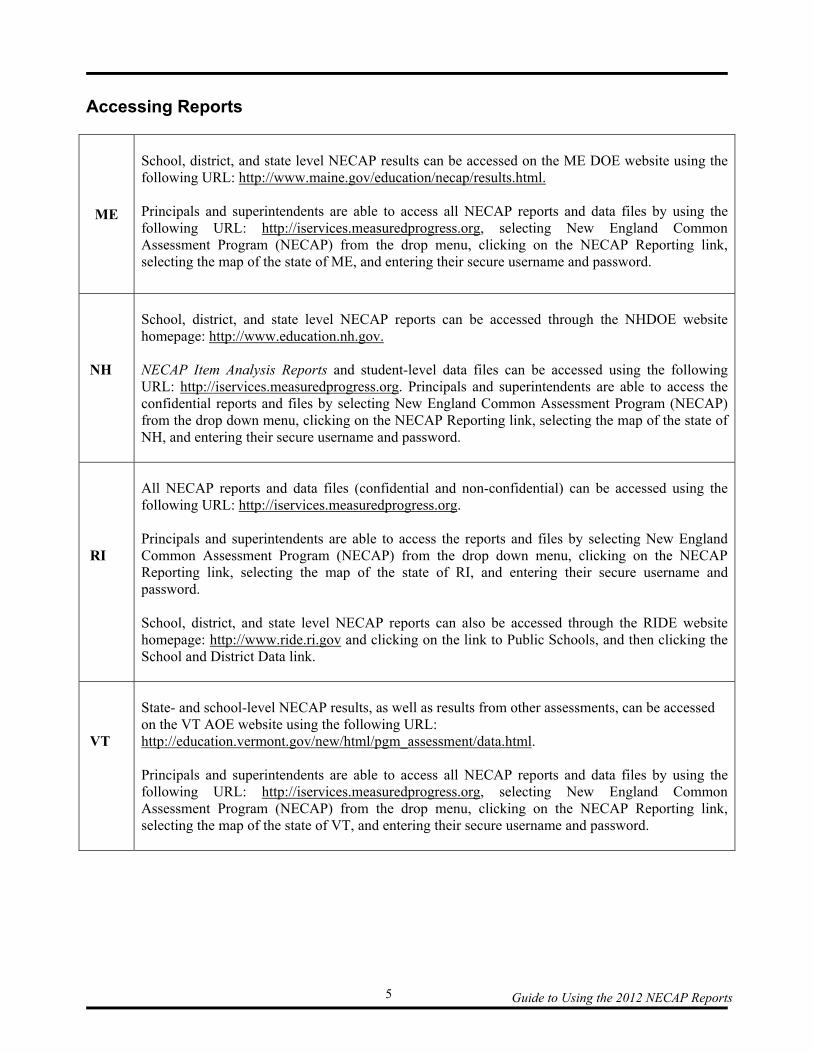
ME
School, district, and state level NECAP results can be accessed on the ME DOE website using the following URL: http://www.maine.gov/education/necap/results.html. Principals and superintendents are able to access all NECAP reports and data files by using the following URL: http://iservices.measuredprogress.org, selecting New England Common Assessment Program (NECAP) from the drop menu, clicking on the NECAP Reporting link, selecting the map of the state of ME, and entering their secure username and password.
NH
School, district, and state level NECAP reports can be accessed through the NHDOE website homepage: http://www.education.nh.gov. NECAP Item Analysis Reports and student-level data files can be accessed using the following URL: http://iservices.measuredprogress.org. Principals and superintendents are able to access the confidential reports and files by selecting New England Common Assessment Program (NECAP) from the drop down menu, clicking on the NECAP Reporting link, selecting the map of the state of NH, and entering their secure username and password.
RI
All NECAP reports and data files (confidential and non-confidential) can be accessed using the following URL: http://iservices.measuredprogress.org. Principals and superintendents are able to access the reports and files by selecting New England Common Assessment Program (NECAP) from the drop down menu, clicking on the NECAP Reporting link, selecting the map of the state of RI, and entering their secure username and password. School, district, and state level NECAP reports can also be accessed through the RIDE website homepage: http://www.ride.ri.gov and clicking on the link to Public Schools, and then clicking the School and District Data link.
VT
State- and school-level NECAP results, as well as results from other assessments, can be accessed on the VT AOE website using the following URL: http://education.vermont.gov/new/html/pgm_assessment/data.html. Principals and superintendents are able to access all NECAP reports and data files by using the following URL: http://iservices.measuredprogress.org, selecting New England Common Assessment Program (NECAP) from the drop menu, clicking on the NECAP Reporting link, selecting the map of the state of VT, and entering their secure username and password.
Guide to Using the 2012 NECAP Reports 6
General Guidelines for the Use of NECAP Reports Alignment of Curriculum and the NECAP Tests All test items appearing on the NECAP grades 3 through 8 tests are designed to measure specific NECAP Grade Level Expectations. All test items appearing on the NECAP grade 11 tests are designed to measure specific NECAP Grade Span Expectations for high school. As schools align their curriculum and instructional programs with these standards, test results should reflect student progress towards these standards. Use of NECAP Student-Level Results NECAP results are intended to evaluate how well students and schools are achieving the learning targets contained in the Grade Level and Grade Span Expectations. NECAP was designed primarily to provide detailed school-level results and accurate summary information about individual students. NECAP was not designed to provide, in isolation, detailed student-level diagnostic information for formulating individual instructional plans. However, NECAP results can be used, along with other measures, to identify students’ strengths and weaknesses. NECAP is only one indicator of student performance and results of a single NECAP test administration should not be used for referring students to special education or for making promotion and/or graduation decisions. Multiple Data Points Needed for Trend Analysis A single year’s test results provide limited information about a school or district. As with any evaluation, school and district test results are most meaningful when compared with other indicators, and when examined over several years for long-term trends in student performance. This is especially true in small schools where changes in student cohorts from year to year can have a noticeable influence on school results for any given year. Regulations Regarding Confidentiality of Student Records The Family Educational Rights and Privacy Act (FERPA) requires that access to individual student results, including those provided in the NECAP Item Analysis Report and the NECAP Student Report, be restricted to the student, the student’s parents/guardians, and authorized school personnel. Superintendents and principals are responsible for maintaining the privacy and security of all student records. In accordance with this federal regulation, authorized school personnel shall have access to the records of students to whom they are providing services when such access is required in the performance of their official duties. For more information about FERPA please visit the following website: http://www.ed.gov/policy/gen/guid/fpco/ferpa/index.html. National Council on Measurement in Education (NCME) Code of Professional Responsibilities in Educational Measurement The Departments of Education in ME, NH, RI, the Agency of Education in VT, and Measured Progress adhere to the NCME code. Local educators also have responsibilities under this code. The entire document can be found in Appendix B. More information about NCME can be found at www.ncme.org.
Guide to Using the 2012 NECAP Reports 7
Understanding the NECAP Student Report
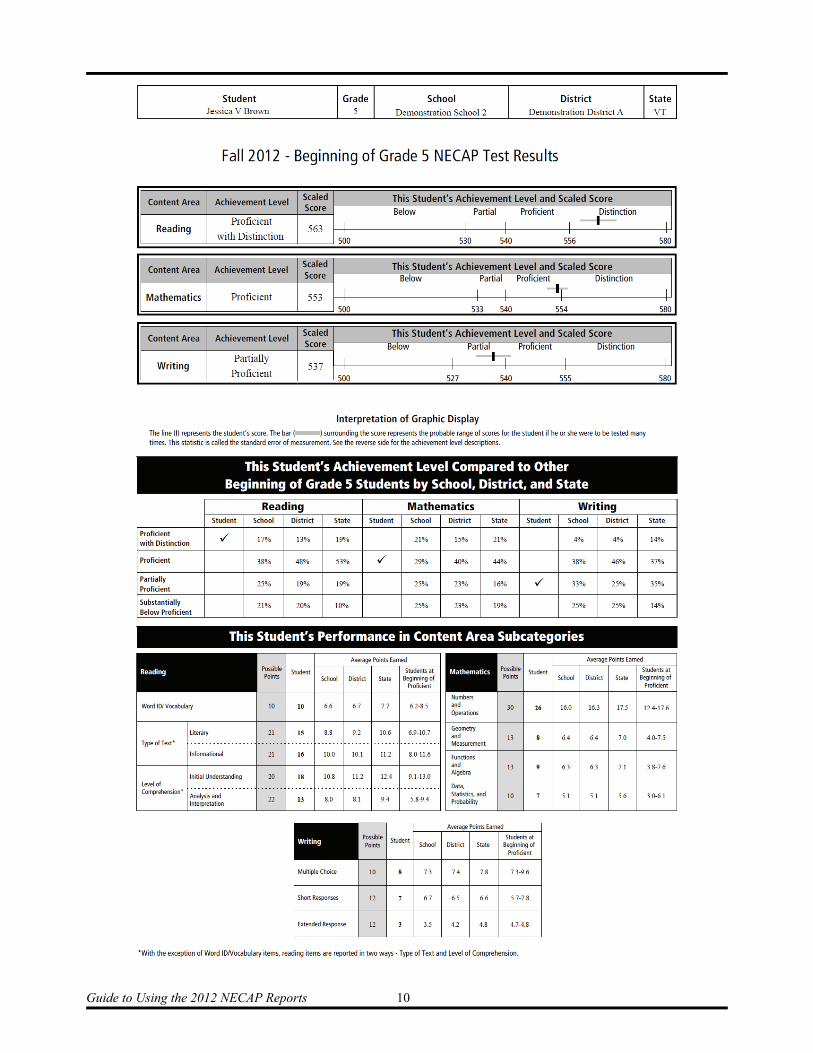
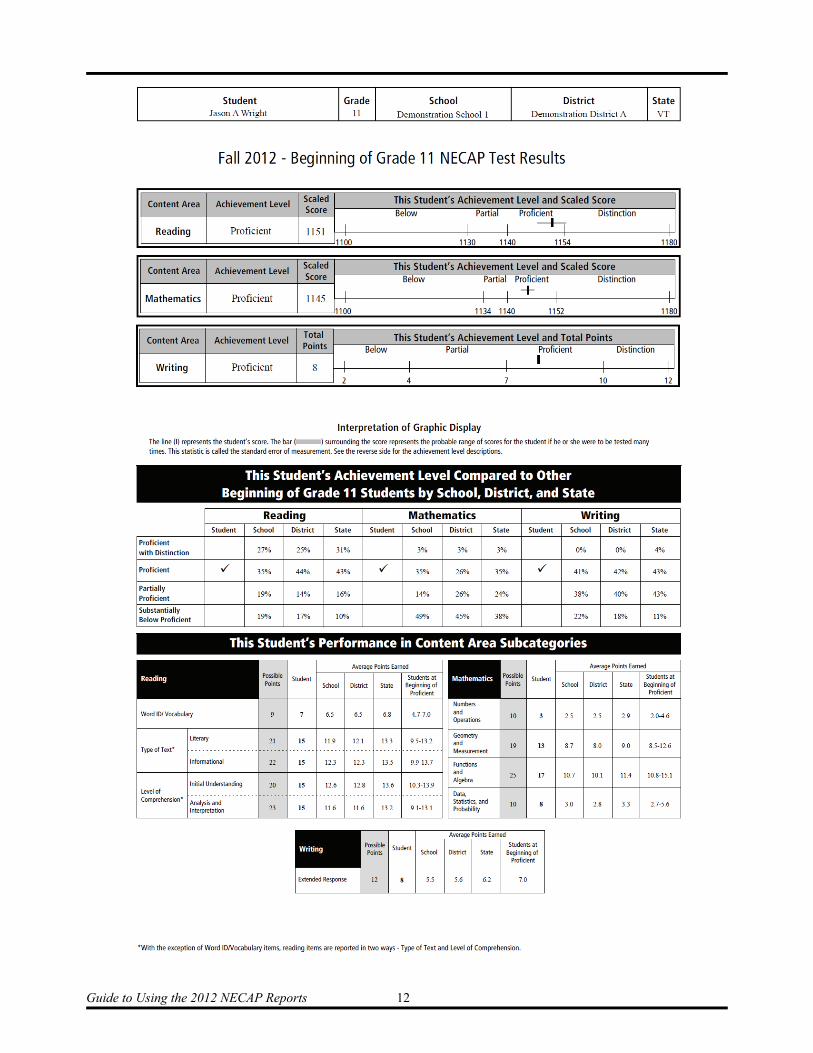
The section below discusses the NECAP Student Report, which provides schools and parents/guardians with information about individual student performance. Schools will receive two copies of the NECAP Student Report. The colored copy of the report is for distribution to parents/guardians and the black and white copy of the report is for school files. The NECAP Student Report is confidential and should be kept secure within the school and district. Remember, the Family Educational Rights and Privacy Act (FERPA) requires that access to individual student results be restricted to the student, the student’s parents/guardians, and authorized school personnel. Details about the NECAP tests and achievement levels are provided on the cover of the NECAP Student Report. Details about the student’s performance on the NECAP tests are included on the inside of the report, which is explained in detail below. Parents/guardians are encouraged to contact the student’s school for more information on their child’s overall achievement after reviewing the NECAP Student Report. The NECAP Student Report is divided into three sections. Student’s Achievement Level and Score This section of the report shows the achievement level attained for each content area. Achievement Level Descriptions can be found in Appendix C of this guide and are provided on the reverse side of the report. The NECAP Student Report for grades 3 through 8 shows the scaled score earned for each content area. The NECAP Student Report for grade 11 shows the scaled score earned for reading and mathematics and the raw score earned for writing. Each scaled score is reported with a score band that indicates the standard error of measurement surrounding each score. The standard error of measurement indicates how much a student’s score could vary if the student was examined repeatedly with the same test (assuming that no learning occurs between test administrations). Student’s Achievement Level Compared to Other Students by School, District, and State This section of the report lists the four achievement levels—Proficient with Distinction, Proficient, Partially Proficient, and Substantially Below Proficient—for each content area. This student’s performance is noted with a check mark in the appropriate box. The percentage of students at each achievement level is listed for the student’s school, district, and state. Student’s Performance in Content Area Subcategories This section of the report shows the student’s performance on subcategories within each content area compared to a variety of groups. These results can provide a general idea of relative strengths and weaknesses in comparison to other students. However, because results in this section are based on small numbers of test items they should be interpreted cautiously. Each of the content areas assessed by NECAP is reported by subcategories. For reading, with the exception of Word ID/Vocabulary items, each item is reported in two ways – Type of Text and Level of Comprehension. The two types of text are Literary and Informational. The two levels of comprehension are Initial Understanding and Analysis and Interpretation. For mathematics, Numbers and Operations, Geometry and Measurement, Functions and Algebra, and Data, Statistics,
Guide to Using the 2012 NECAP Reports 8
and Probability are the subcategories reported. For writing, there are three content area subcategories reported at grades 5 & 8 representing the type of items included on the test rather than a subcategory of a content area: Multiple Choice, Short Response, and Extended Response. Multiple Choice items are stand-alone items that assess structures of language and writing conventions. Please note that structures of language and writing conventions are also displayed in the student’s writing on all items on the test not only on the Multiple Choice items. Because student scores on the grade 11 writing test are based on a single prompt, the only subcategory at grades 11 is the Extended Response item. Student performance in all content area subcategories is presented as a table including possible points, points earned by this student, average points earned for the school, district, and state. The table also shows the performance in each subcategory of students who performed near the beginning of the Proficient achievement level on the overall test. The range of scores shown represents one standard error above and below the average points earned by those students. Students’ performance in a category that falls within the range shown performed similarly to those students. The following four pages contain sample grade 5 and grade 11 NECAP Student Reports.
Guide to Using the 2012 NECAP Reports 9
Guide to Using the 2012 NECAP Reports 10
Guide to Using the 2012 NECAP Reports 11
Guide to Using the 2012 NECAP Reports 12
Guide to Using the 2012 NECAP Reports 13
Understanding the Item Analysis Report A NECAP Item Analysis Report is produced for each tested grade level and content area in a school. The report provides schools and districts with information on the released items as well as summary information (scaled score and achievement level) for each tested student in grades 3 through 8 and 11 in the school in reading and mathematics and grades 5 and 8 in writing. The NECAP Item Analysis Report for grade 11 writing provides the raw score and achievement level for each tested student. Using this report, together with the actual released items, one can easily identify test items on which groups of students did well or poorly. A legend that defines the terms used in this report is available for download as a pdf for each content area. (Please refer to page 42 in this document for further information about this report.) The data used for the NECAP Item Analysis Report are the results of the fall 2012 administration of the NECAP tests. The NECAP tests are based on the Grade Level Expectations (GLE) from the prior year in grades 3 through 8 and on the Grade Span Expectations (GSE) from the prior years in grade 11. For example, the Grade 7 NECAP test, administered in the fall of seventh grade, is based on the grade 6 GLEs. Therefore, many students receive the instruction they need for this fall test at a different school from where they are currently enrolled. The state Departments of Education determined that it would be valuable for both the school where the student tested and the school where the student received instruction to have access to information that can help improve curriculum. To achieve this goal, separate NECAP Item Analysis Reports have been created for the “testing” school and the “teaching” school. Every student who participated in the NECAP tests will be represented in a “testing” school report, and most students will also be represented in a “teaching” school report. In some instances, such as when the student has recently moved into the state, it is not possible to provide information about a student in the “teaching” school report. For more information on teaching and testing year reports see page 24 of this guide. When reviewing the NECAP Item Analysis Reports it is important to note that the subtitle on the report indicates if the report is based on “teaching” or “testing” year. For example, on a grade 4 report, the subtitle “Grade 4 Students in 2012-2013” indicates that the report shows the item analysis for the school where the students were enrolled at the time of testing. The subtitle “Grade 3 Students in 2011-2012” indicates that this report shows the item analysis for the school where the students learned the grade 3 material they are tested on by the grade 4 NECAP test. The top portion of the NECAP Item Analysis Report contains seven rows of information.
The first row lists the released item number (not the position of the item in the actual student test booklet).
The second row lists the content strand for the item. The third row lists the GLE or GSE code for the item. The fourth row lists the Depth of Knowledge code for the item. (For more information
see www.pdesas.org/main/fileview/instruction_depth_of_knowledge.pdf) The fifth row lists the item type. The sixth row lists the correct response letter for each multiple choice item. The final row lists the total possible points for each item.
Guide to Using the 2012 NECAP Reports 14
When reviewing the multiple-choice section of this report please keep in mind that a (+) indicates a correct response, a letter indicates the incorrect response selected, and a blank indicates that no response was selected. In the columns for the short-answer, constructed-response, and extended response results (only for grades 5 and 8 writing), the numbers indicate the points awarded per item and a blank indicates that the item was not answered. All responses to released items are reported in the NECAP Item Analysis Report, regardless of the student’s participation status. The first column of this report lists each student alphabetically by last name followed by each student’s state assigned student ID number. The column after the released items shows Total Test Results, broken into several categories. Subcategory Points Earned columns report the points the student earned in each content strand. The Total Points Earned column is a summary of all of the points earned in each of the content areas. The last two columns show the Scaled Score and Achievement Level for each student. For students who are reported as Not Tested, a code appears in the Achievement Level column to indicate the reason the student did not test. The descriptions of these codes can be found on the legend. It is important to note that not all items used to compute student scores are included in this report. Only those items that have been released are included. The Percent Correct/Average Score for the school, district, and state are listed at the end of each report after the student data. The NECAP Item Analysis Reports are confidential and should be kept secure within the school and district. Remember, the Family Educational Rights and Privacy Act (FERPA) requires that access to individual student results be restricted to the student, the student’s parents/guardians, and authorized school personnel. The following page is a sample NECAP Item Analysis Report for grade 3 mathematics.

Guide to Using the 2012 NECAP Reports 15
Guide to Using the 2012 NECAP Reports 16
The top portion of the NECAP Item Analysis Report for grade 11 writing consists of a single row of information.
The content strand for the item. The GSE codes for the item. The Depth of Knowledge code for the item. The item type – extended response. The total possible points for the item
The students’ names are listed in a dual-column format, alphabetically by last name followed by the students’ state assigned student ID number. The Total Test Results section to the right includes the Total Points Earned and Achievement Level for each student. For students who are reported as Not Tested, a code appears in the Achievement Level column to indicate the reason the student did not test. The descriptions of these codes can be found on the legend. The Average Points earned by the school, district, and state are listed at the end of each report after the student data. The NECAP Item Analysis Reports are confidential and should be kept secure within the school and district. Remember, the Family Educational Rights and Privacy Act (FERPA) requires that access to individual student results be restricted to the student, the student’s parents/guardians, and authorized school personnel. The following page is a sample NECAP Item Analysis Report for grade 11 writing.

Guide to Using the 2012 NECAP Reports 17
Guide to Using the 2012 NECAP Reports 18
Understanding the School and District Results Reports Overview The NECAP School Results Report and the NECAP District Results Report provide NECAP results for schools and districts based on the testing of local students in grades 3 through 8 & 11. A separate school report and district report has been produced for each grade level tested. Although text in this section refers only to the NECAP School Results Report, educators and others who are reviewing the NECAP District Results Report should also refer to this section for applicable information. The data reported, report format, and guidelines for using the reported data are identical for both the school and district reports. The only real difference between the reports is that the NECAP District Results Report includes no individual school data. IDENTIFICATION The box in the upper-right corner of each page shows the school name, district name, state, and district and school code. BASIS FOR RESULTS Results in the NECAP School Results Report are based on common items (with one exception described on the top of page 31 of this guide), and represent the aggregate of individual student scores (achievement level results and scaled scores). MINIMUM NUMBER OF STUDENTS NEEDED TO GENERATE REPORTS To ensure confidentiality of individual student results and discourage generalizations about school performance based on very small populations, the Departments of Education in ME, NH, RI and VT have established that groups of students must be larger than nine in order to report results in any particular reporting category. Consequently, schools with a very small number of students enrolled in a grade may not show results in some sections of their school report. A school report was not generated for any school that tested fewer than ten students at a particular grade; results for students in these schools are included in district- and/or state-level results. Making Comparisons among Students, Schools, and Districts The Departments of Education in ME, NH, RI and VT do not encourage or promote comparisons among schools and districts. NECAP was designed so that each individual school or district can evaluate its performance against a set of Grade Level or Grade Span Expectations and achievement standards. Scaled scores are the most suitable statistic to use when comparing NECAP results among students, schools, and districts. When interpreting the meaning of these comparisons, however, it is important that decision-makers—teachers, administrators, and policy-makers—fully recognize that any single test is a limited measure of student performance. Since some apparent differences in scaled scores may not be statistically or educationally significant, some guidelines for comparing results are explained on the following page.
Guide to Using the 2012 NECAP Reports 19
COMPARISONS OF SCHOOL- AND DISTRICT-LEVEL SCORES The statistical significance of these comparisons is based on variability of the scores and on the number of students tested. The tables on the following pages can be used to assist in the following ways:
comparing sub-populations of students within a school or district, comparing the scores of two or more schools or districts, comparing the scores of a school to the district and/or state, and comparing the scores of a district to the state.
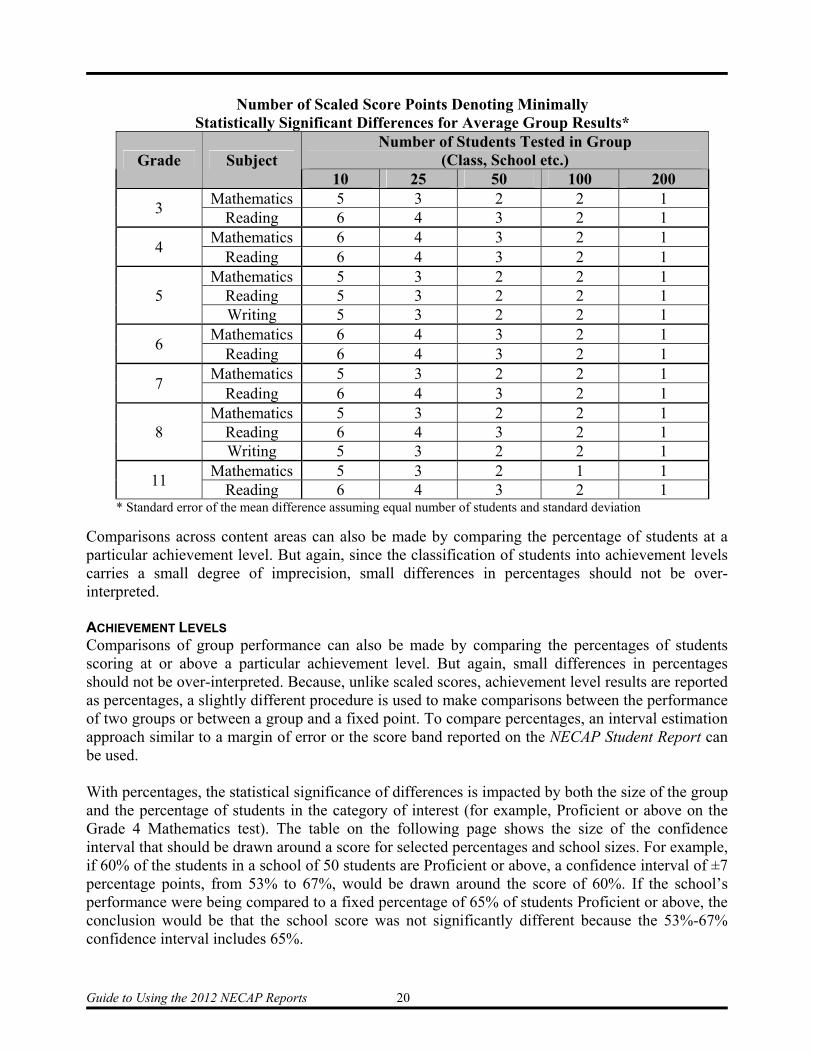
These tables provide figures that can be used to make approximate comparisons between scores. Similar to the score band provided in the NECAP Student Report, the figures in the tables are estimates of one standard error around the score or difference between scores. For those interested in making more exact comparisons or learning more about the statistical methods used to make comparisons, a list of references is provided in Appendix D Reference Materials on page 67 of this guide. Caution should be used when making any of the comparisons listed above because even if scores are different they may not be statistically significantly different. It is very unlikely that any two groups will have exactly the same score. To avoid misinterpretation or over-interpretation of small differences between scores, statistical tests can be conducted to determine the likelihood that the observed difference in scores occurred by chance and that the two groups might actually have the same score. SCALED SCORES NECAP scaled scores for grades 3 through 8 are represented by a 3 digit number, with the first digit representing the grade level tested; the remaining digits range from 00–80. NECAP scaled scores for grade 11 is represented by a 4 digit number, with the first two digits representing the grade; the remaining digits also range from 00-80. Although this same scale is used for reading and mathematics, one cannot accurately compare a school’s or district’s scaled scores across two content areas since the scaled scores in each content area were determined by separate standard-setting processes. The table on the following page shows the smallest differences in scaled scores that represent a statistically significant difference in performance based on the number of students tested in the school and/or district. When comparing the scores of two groups of different sizes, one should use a difference that is approximately the average of the minimally statistically significant difference of each group. For example, when comparing the average grade 7 reading scaled scores of a school with 25 students and a school with 100 students one should use three points as the minimally statistically significant difference. Three points is the average of the values in the table for a school of 25 students (4 points) and a school of 100 students (2 points). If the difference in scaled scores between the two groups is at least three points, then the difference is statistically significant. If the difference in scaled scores between the two groups is fewer than three points, the difference is not statistically significant.
Guide to Using the 2012 NECAP Reports 20
Number of Scaled Score Points Denoting Minimally
Statistically Significant Differences for Average Group Results*
Grade Subject Number of Students Tested in Group
(Class, School etc.) 10 25 50 100 200
3 Mathematics 5 3 2 2 1
Reading 6 4 3 2 1
4 Mathematics 6 4 3 2 1
Reading 6 4 3 2 1
5 Mathematics 5 3 2 2 1
Reading 5 3 2 2 1 Writing 5 3 2 2 1
6 Mathematics 6 4 3 2 1
Reading 6 4 3 2 1
7 Mathematics 5 3 2 2 1
Reading 6 4 3 2 1
8 Mathematics 5 3 2 2 1
Reading 6 4 3 2 1 Writing 5 3 2 2 1
11 Mathematics 5 3 2 1 1
Reading 6 4 3 2 1 * Standard error of the mean difference assuming equal number of students and standard deviation
Comparisons across content areas can also be made by comparing the percentage of students at a particular achievement level. But again, since the classification of students into achievement levels carries a small degree of imprecision, small differences in percentages should not be over-interpreted. ACHIEVEMENT LEVELS Comparisons of group performance can also be made by comparing the percentages of students scoring at or above a particular achievement level. But again, small differences in percentages should not be over-interpreted. Because, unlike scaled scores, achievement level results are reported as percentages, a slightly different procedure is used to make comparisons between the performance of two groups or between a group and a fixed point. To compare percentages, an interval estimation approach similar to a margin of error or the score band reported on the NECAP Student Report can be used. With percentages, the statistical significance of differences is impacted by both the size of the group and the percentage of students in the category of interest (for example, Proficient or above on the Grade 4 Mathematics test). The table on the following page shows the size of the confidence interval that should be drawn around a score for selected percentages and school sizes. For example, if 60% of the students in a school of 50 students are Proficient or above, a confidence interval of ±7 percentage points, from 53% to 67%, would be drawn around the score of 60%. If the school’s performance were being compared to a fixed percentage of 65% of students Proficient or above, the conclusion would be that the school score was not significantly different because the 53%-67% confidence interval includes 65%.

Guide to Using the 2012 NECAP Reports 21
Percentage Difference in Student Achievement Level Classification
Denoting Minimally Statistically Significant Differences for Group Results* Percentages of
Students in Category Number of Students Tested in Group (Class, School, etc.)
10 25 50 100 200 10 9 6 4 3 2 20 13 8 6 4 3 30 14 9 6 5 3 40 15 10 7 5 3 50 16 10 7 5 4 60 15 10 7 5 3 70 14 9 6 5 3 80 13 8 6 4 3 90 9 6 4 3 2
*Standard error of a percentage The previous example compared the performance of a relatively small school to a fixed point (for example, a very large group such as the state). When two relatively small groups are compared, a confidence interval should be drawn around each score using the appropriate values from the table based on the size and performance of each group. If the two confidence intervals do not overlap, then the conclusion is that the difference between the two groups is statistically significant. If the two confidence intervals do overlap, then the difference in performance between the two groups is too small to be considered statistically significant. The distance between the two confidence intervals or their degree of overlap also provides a visual indication of the probability that the two scores are significantly different. Comparisons of NECAP Scores across Years The comparison of scores across years requires consideration and caution in addition to those described in the previous section. In general, the evaluation of any score differences should always be interpreted within the larger context of what occurred to impact the performance of the school, district, or other group between the two test administrations being compared. SCHOOL- AND DISTRICT-LEVEL SCALED SCORES AND ACHIEVEMENT LEVELS The comparison of school- and district-level scaled scores and achievement levels across years is essentially the same as the comparison of similar scores within years. The procedures and cautions described in the previous section can be applied to scores from different years. As stated above, however, the interpretation of differences between scores should include consideration of any intervening factors between test administrations. Also note that when interpreting changes in performance across years, it can be beneficial to consider scaled scores and achievement levels jointly. Interpreting scaled scores or achievement levels alone may lead to misinterpretation or over-interpretation of results. Consider the examples on the following page:
Guide to Using the 2012 NECAP Reports 22
It is not unusual for large numbers of students to earn the same scaled score – particularly
in the middle of the distribution near the Partially Proficient/Proficient cut score. Consequently, school results may show a very small change in mean scaled score near the Proficient cut score, but show a shift of 4-6 percentage points in the percentage of students performing at the Proficient level or above.
Conversely, a significant change in mean scaled score in the middle of an achievement level may not be reflected in improvement in the achievement level results.
STUDENT-LEVEL SCALED SCORES AND ACHIEVEMENT LEVELS With NECAP testing at grades 3 through 8, most students will have multiple years of NECAP test scores. A logical question to ask is how the student’s performance this year compares to performance in previous years. The most direct comparison can be made between a student’s achievement level from one year to the next within a content area. The NECAP tests are designed specifically to measure the grade level expectations for each grade. Students meeting or exceeding those expectations at their grade level should score at the Proficient or Proficient with Distinction level each year. Of course, scores from a single test such as the NECAP tests should always be interpreted with caution. The question of whether student performance is Proficient at a particular grade level is critical, but we may also wish to examine progress toward proficiency within an achievement level. Achievement levels and scaled scores can be used together to examine, at a slightly finer level, whether a student is making progress toward proficiency from one year to the next. Scaled scores provide information about student performance within each achievement level. NECAP scores are reported on separate 80-point scales corresponding to each grade level (300-380, 400-480, …, 1100-1180). Each individual grade-level scale has been developed so that at every grade a score of 40 represents Proficient performance at that grade level. Although the tests and scales are different at each grade level, in general, for students performing below the Proficient level, progress toward proficiency can be shown by earning a score that is closer to the Proficient score of 40. For students scoring at the Substantially Below Proficient level, progress can be shown by earning a scaled score the next year that is closer to or within the Partially Proficient level. Similarly, students scoring above Proficient can progress toward the Proficient with Distinction level. Of course, small differences in scores of 2-4 points on the 80-point scale should not be over-interpreted. As indicated by the score band on the NECAP Student Report, an individual score should be interpreted as a probable range of scores within which student performance might fall. For example, if a student earns a score of 438 in the fourth grade and 541 in the fifth grade, it is likely that the score bands for both grades will cross the Proficient scores of 440 and 540, respectively. Therefore, the scores of 438 and 541 should not be considered significantly different from each other in relation to the Proficient standard for these two grade levels. It is important to remember, however, that maintaining Proficiency from one grade level to the next demonstrates a year of growth in that content area.
Guide to Using the 2012 NECAP Reports 23
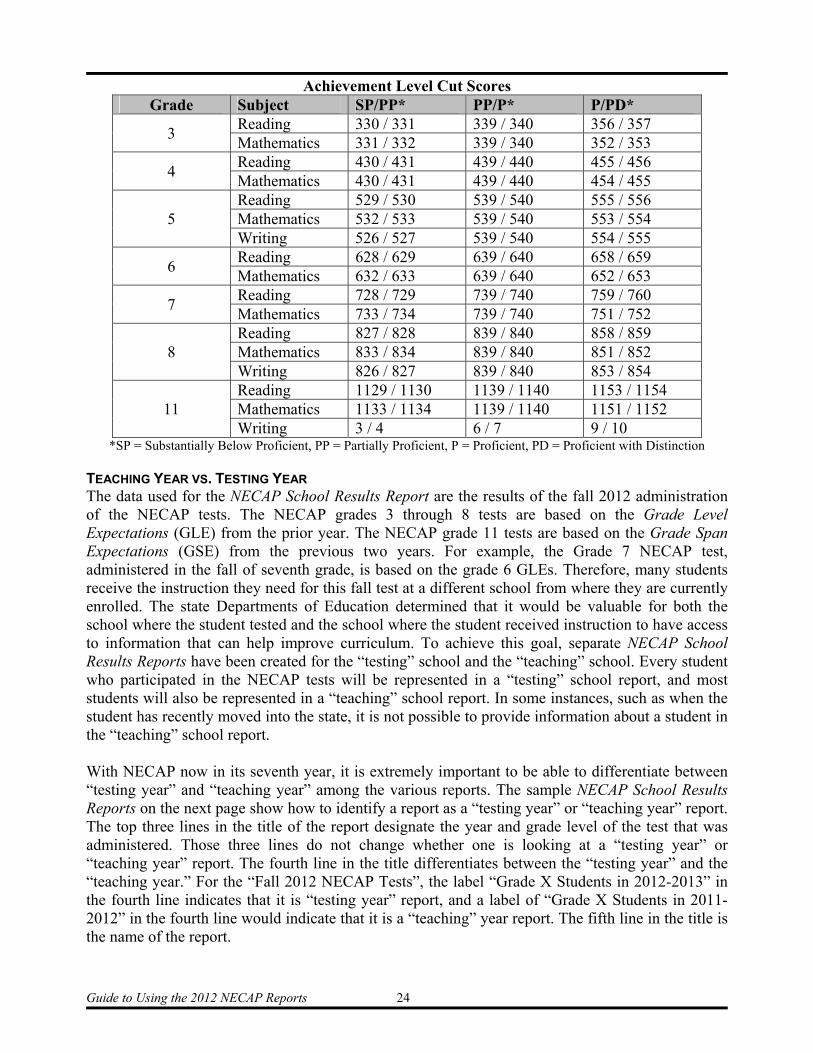
CONTENT AREA SUBSCORES Content area subscores cannot be directly compared from one year to the next even within a grade level. Unlike achievement levels and scaled scores, these scores are reported as raw scores and have not been linked across years and placed on the same scale. Differences in subscores from one year to the next in the total number of points earned by a student or in the percent of total possible points earned by a school or district may simply reflect either a small difference in the number of possible points in the reporting category or a slight difference in the difficulty of items within a particular reporting category. The process of equating that accounts for these differences to produce scaled scores and achievement levels for the total content area is not applied to individual reporting categories. There are not a sufficient number of points within each reporting category to equate these subscores from one year to the next. There are, however, comparisons that can be made with content area subscores to assist schools in the evaluation of their curricula and instructional programs. For each content area subscore, normative information is provided describing performance in comparison to the school, district, state, and at the student level, students scoring at the Proficient threshold. Across years, this information can be used to determine whether progress has been made relative to one of the comparison groups. Even more than with scaled scores and achievement levels, it is important not to over-interpret small changes from one year to the next. It is also possible to pool content area subscores across years to compute a cumulative total. Consistent with the cumulative achievement level and scaled score information reported for the total content area, results based on a larger pool of students and/or test items can provide a more stable picture of school or district performance over longer periods of time. Of course, intervening factors such as program or curricular changes may impact local decisions on the appropriateness of pooling data across years. ACHIEVEMENT LEVEL CUT SCORES The table on the following page shows the scaled scores (and raw scores for grade 11 writing) that identify the cut point between the four achievement levels - Proficient with Distinction, Proficient, Partially Proficient, and Substantially Below Proficient. The achievement level cut scores for reading and mathematics for grades 3 through 8 were the result of the standard setting process that was completed in January 2006. The achievement level cut scores for reading, mathematics, and writing for grade 11 were the result of the standard setting process that was completed in January 2008. Lastly, the achievement level cut scores for writing for grades 5 & 8 were the result of the standard setting process that was completed in December 2010. All of the cut scores remain consistent year to year.
Guide to Using the 2012 NECAP Reports 24
Achievement Level Cut Scores Grade Subject SP/PP* PP/P* P/PD*
3 Reading 330 / 331 339 / 340 356 / 357 Mathematics 331 / 332 339 / 340 352 / 353
4 Reading 430 / 431 439 / 440 455 / 456 Mathematics 430 / 431 439 / 440 454 / 455
5 Reading 529 / 530 539 / 540 555 / 556 Mathematics 532 / 533 539 / 540 553 / 554 Writing 526 / 527 539 / 540 554 / 555
6 Reading 628 / 629 639 / 640 658 / 659 Mathematics 632 / 633 639 / 640 652 / 653
7 Reading 728 / 729 739 / 740 759 / 760 Mathematics 733 / 734 739 / 740 751 / 752
8 Reading 827 / 828 839 / 840 858 / 859 Mathematics 833 / 834 839 / 840 851 / 852 Writing 826 / 827 839 / 840 853 / 854
11 Reading 1129 / 1130 1139 / 1140 1153 / 1154 Mathematics 1133 / 1134 1139 / 1140 1151 / 1152 Writing 3 / 4 6 / 7 9 / 10
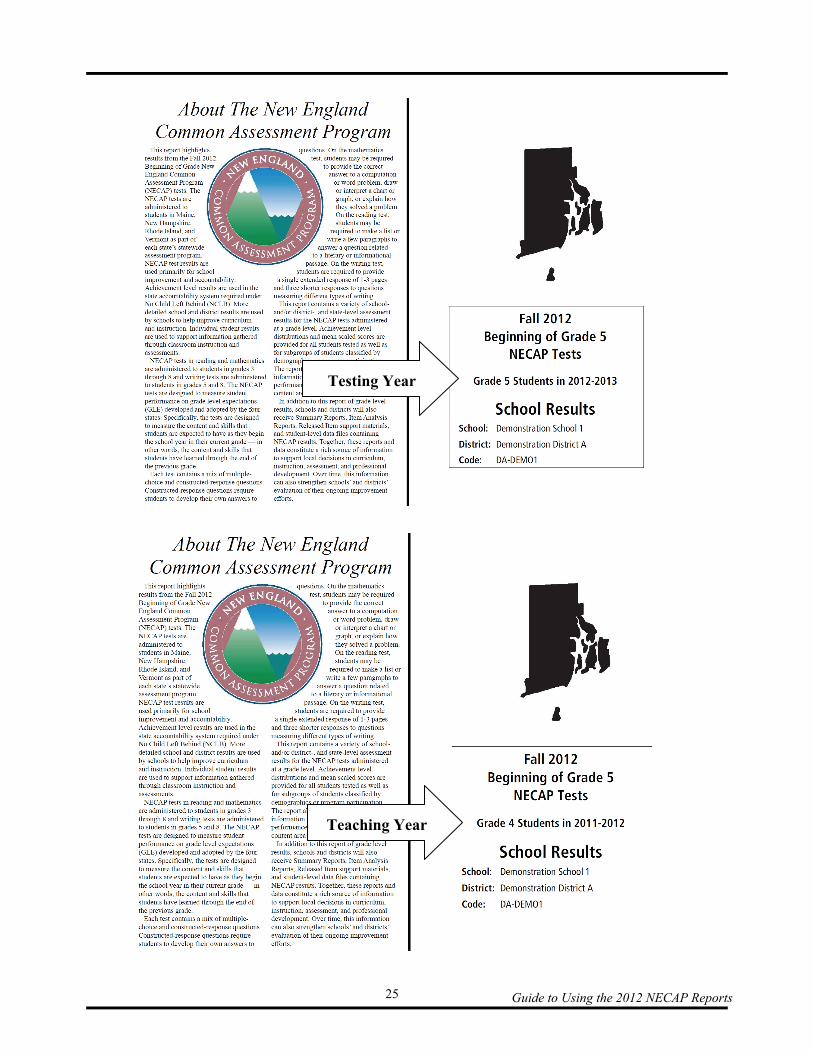
*SP = Substantially Below Proficient, PP = Partially Proficient, P = Proficient, PD = Proficient with Distinction TEACHING YEAR VS. TESTING YEAR The data used for the NECAP School Results Report are the results of the fall 2012 administration of the NECAP tests. The NECAP grades 3 through 8 tests are based on the Grade Level Expectations (GLE) from the prior year. The NECAP grade 11 tests are based on the Grade Span Expectations (GSE) from the previous two years. For example, the Grade 7 NECAP test, administered in the fall of seventh grade, is based on the grade 6 GLEs. Therefore, many students receive the instruction they need for this fall test at a different school from where they are currently enrolled. The state Departments of Education determined that it would be valuable for both the school where the student tested and the school where the student received instruction to have access to information that can help improve curriculum. To achieve this goal, separate NECAP School Results Reports have been created for the “testing” school and the “teaching” school. Every student who participated in the NECAP tests will be represented in a “testing” school report, and most students will also be represented in a “teaching” school report. In some instances, such as when the student has recently moved into the state, it is not possible to provide information about a student in the “teaching” school report. With NECAP now in its seventh year, it is extremely important to be able to differentiate between “testing year” and “teaching year” among the various reports. The sample NECAP School Results Reports on the next page show how to identify a report as a “testing year” or “teaching year” report. The top three lines in the title of the report designate the year and grade level of the test that was administered. Those three lines do not change whether one is looking at a “testing year” or “teaching year” report. The fourth line in the title differentiates between the “testing year” and the “teaching year.” For the “Fall 2012 NECAP Tests”, the label “Grade X Students in 2012-2013” in the fourth line indicates that it is “testing year” report, and a label of “Grade X Students in 2011-2012” in the fourth line would indicate that it is a “teaching” year report. The fifth line in the title is the name of the report.
Guide to Using the 2012 NECAP Reports 25
Testing Year
Teaching Year
Guide to Using the 2012 NECAP Reports 26
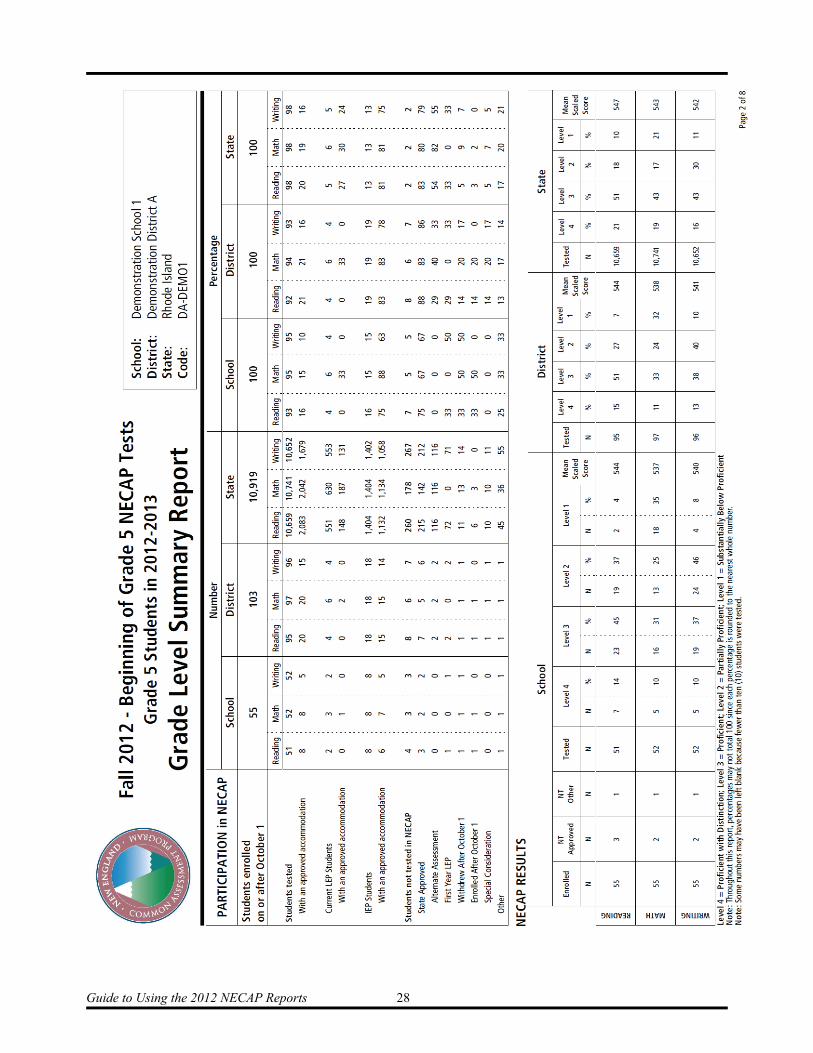
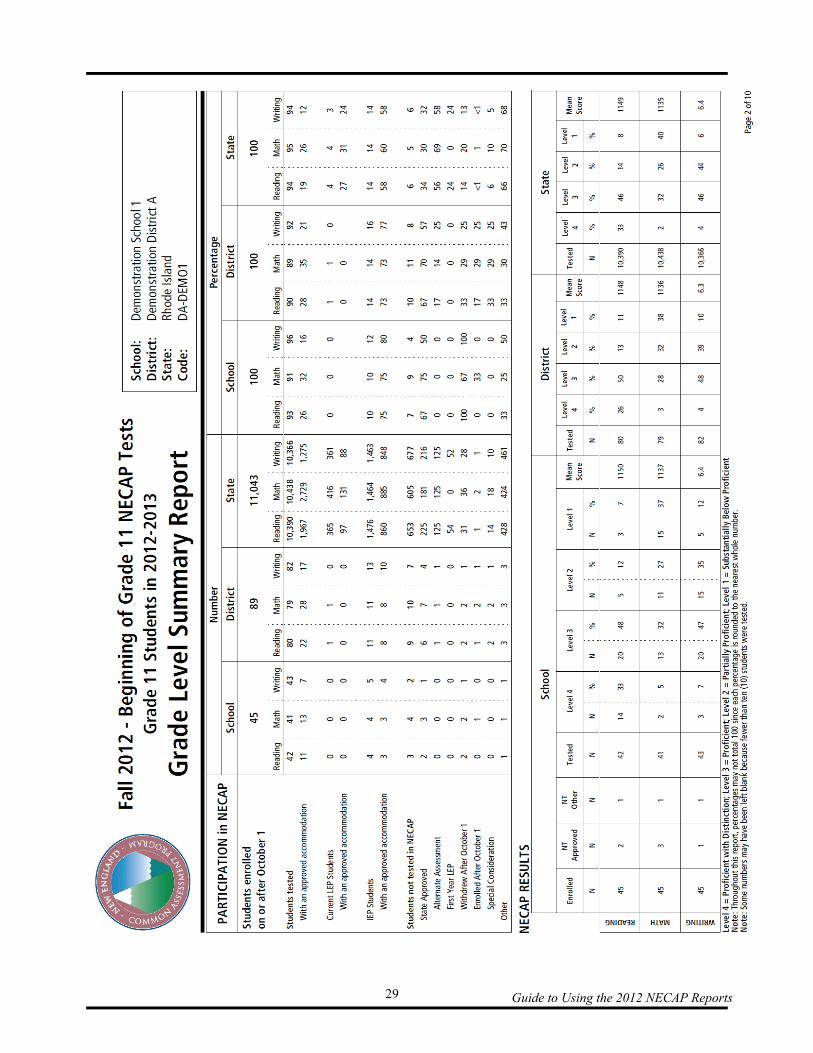
Grade Level Summary Report Page (page 2 of the NECAP School Results Report) (Pages 28 and 29 of this document contain a sample grade 5 and grade 11 “Grade Level Summary Report” page from a NECAP School Results Report.) The second page of the NECAP School Results Report, (titled “Grade Level Summary Report”) provides a summary of participation in NECAP and a summary of NECAP results. This page shows the number and percentage of students who were enrolled, tested, and not tested as part of the NECAP tests in fall 2012. Students enrolled in a school on or after October 1, 2012 were expected to complete the NECAP tests at that school. Participation in NECAP STUDENTS ENROLLED ON OR AFTER OCTOBER 1 The first table in the “Grade Level Summary Report” shows the number of students enrolled in the tested grade. The total number of students reported as enrolled is defined as the number of students tested added to the numbers of students who were not tested. STUDENTS TESTED This row on the report shows the number and percent of students that were tested in reading, mathematics, and writing for the school, district and state. STUDENTS TESTED WITH AN APPROVED ACCOMMODATION This row on the report shows the number and percent of students that were tested using an approved accommodation in reading, mathematics, and writing for the school, district and state. CURRENT LEP STUDENTS This row on the report shows the number and percent of students that were current LEP students and were tested in reading, mathematics, and writing for the school, district and state. CURRENT LEP STUDENTS TESTED WITH AN APPROVED ACCOMMODATION This row on the report shows the number and percent of students that were current LEP students and were tested using an approved accommodation in reading, mathematics, and writing for the school, district and state. IEP STUDENTS This row on the report shows the number and percent of students with an IEP that were tested in reading, mathematics, and writing for the school, district and state. IEP STUDENTS TESTED WITH AN APPROVED ACCOMMODATION This row on the report shows the number and percent of students with an IEP that were tested using an approved accommodation in reading, mathematics, and writing for the school, district and state. STUDENTS NOT TESTED IN NECAP Since students who were not tested did not participate in the NECAP tests, average school scores are not affected by not tested students. These students are included in the calculation of the percent that participated, but are not included in the calculation of scores.
Guide to Using the 2012 NECAP Reports 27
For students who participated in some but not all parts of the NECAP tests, their actual score was reported for each content area in which they participated. These reporting decisions were made to support the requirement that all students must participate in the NECAP testing program. Data is provided for the following groups of students who may not have completed the entire battery of NECAP tests.
Alternate Assessment—Students in this category completed an alternate assessment for the 2011-2012 school year.
First Year LEP—Students in this category are defined as being new to the US after October 1, 2011 and were not required to take the NECAP tests in reading and writing. Students in this category were expected to take the mathematics portion of the NECAP.
Withdrew After October 1—Students withdrawing from a school after October 1, 2012 may have taken some sessions of the NECAP tests prior to their withdrawal from the school.
Enrolled After October 1—Students enrolling in a school after October 1, 2012 may not have had adequate time to fully participate in all sessions of the NECAP tests.
Special Consideration—Schools received state approval for special consideration for an exemption for all or part of the NECAP tests for any student whose circumstances are not described by the previous categories, but for whom the school determined that taking the NECAP tests would not be possible.
Other—Occasionally, students will not have completed the NECAP tests for reasons other than those listed above. These “other” categories are considered “not state approved.”
NECAP Results The results portion of the page indicates the number and percentage of students performing at each achievement level in each of the three content areas tested by NECAP. In addition, a mean scaled score is provided for reading and mathematics in grades 3 through 8 and 11 at the school, district, and state levels. For writing, a mean scaled score is provided for grades 5 and 8 and a mean raw score is provided for grade 11 at the school, district, and state levels.
Guide to Using the 2012 NECAP Reports 28
Guide to Using the 2012 NECAP Reports 29
Guide to Using the 2012 NECAP Reports 30
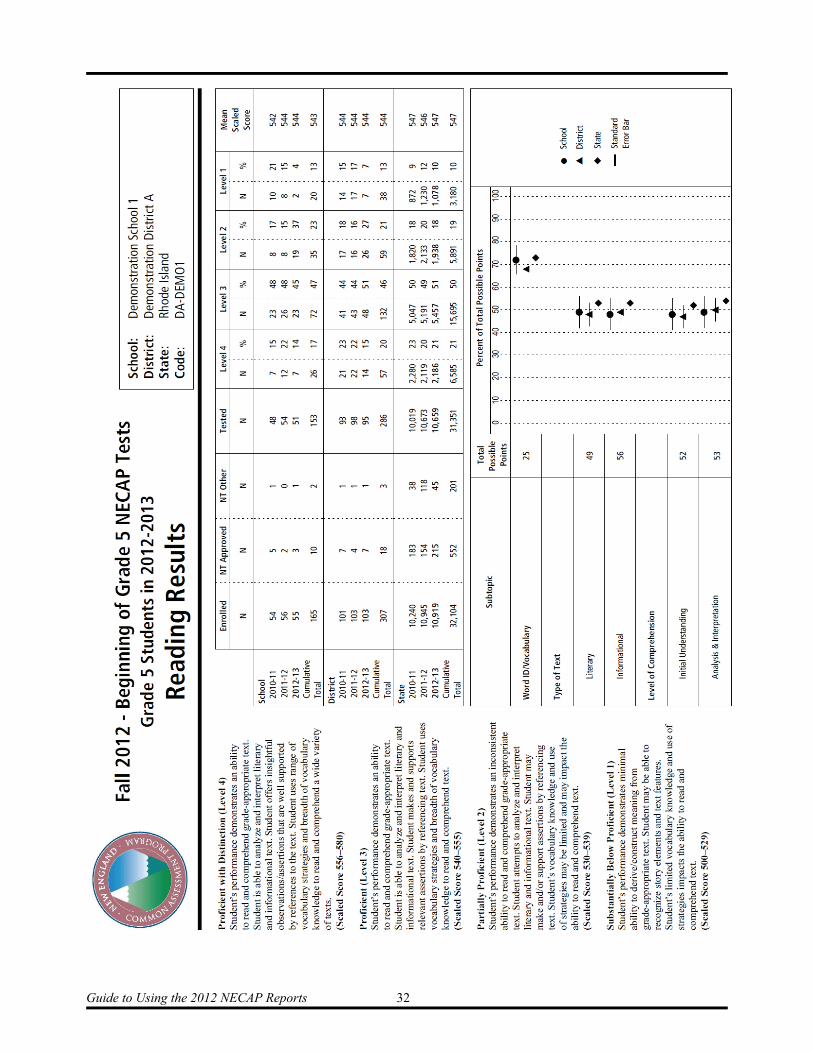
Content Area Results (Pages 3, 5, and 7 of the NECAP School Results Report) (Pages 32 through 35 of this document contain a sample grade 5 “Reading Results” page and the grade 11 “Writing Results” pages from a NECAP School Results Report.) The purpose of these sections is to help schools determine the extent to which their curricula are effective in helping students achieve the particular standards and benchmarks contained in the Grade Level and Grade Span Expectations. The content area results pages of the report provide cumulative data across three years, as well as information on performance in specific subtopics of the tested content areas (for example, geometry and measurement within mathematics). Content area results are provided on the following pages of the Results Report:
page 3—reading, page 5—mathematics, page 7—writing for grades 5 and 8 and, pages 7, 8, and 9—writing for grade 11.
Information about each content area (reading, mathematics and writing) for school, district and state includes:
the total number of students Enrolled, NT Approved (not tested for a state-approved reason), NT Other (not tested for other reasons), and Tested;
the total number and percent of students at each achievement level (based on the number in the Tested column); and
the Mean Scaled Score (mean raw score for Grade 11 writing). The information listed above is provided in bold for the current testing year (2012-13) for all grade levels. In addition, information is also provided for grades 3 through 8 & 11 for the previous two testing years (2010-2011 and 2011-2012). This information is only included for each year where the number of students tested at a grade level was at least 10. For schools and districts that have at least 10 tested students in the current year and two previous years, three-year cumulative totals are provided. Enrolled, Not Tested Approved, Not Tested Other, and Tested counts for each year are summed into a “Cumulative Total” row when the tested number in each year is at least 10. For the achievement levels, the three years of counts in the “N” columns are summed, while the percentages of students are calculated by dividing the cumulative total of the number of students in the achievement level by the cumulative total of the number of students tested. The Mean Scaled Score is calculated by summing the product of the mean scaled score and tested N for each year where the number of students is at least 10, and dividing the sum by the tested N from the cumulative total row (weighted average). Information about each content area subtopic for reading, mathematics and writing (grades 5 and 8 only) located in the bottom half of the report page includes:
Guide to Using the 2012 NECAP Reports 31
The Total Possible Points for that category. In order to provide as much information
as possible for each category, the total number of points includes both the common items used to calculate scores as well as additional items in each category used for equating the test from year to year. (Note: The grades 5 and 8 writing tests are made up entirely of common items.)
A graphic display of the Percent of Total Possible Points for the school, district, and state. In this graphic display, there are symbols representing school, district and state performance. In addition, there is a line representing the standard error of measurement. This statistic indicates how much a student’s score could vary if the student was examined repeatedly with the same test (assuming that no learning occurs between test administrations).
For grade 11 only, instead of a graphic display, a table is included that lists the type of writing reported for each of the last three years. The type of writing (genre) and a description of that type is included for each of the years.
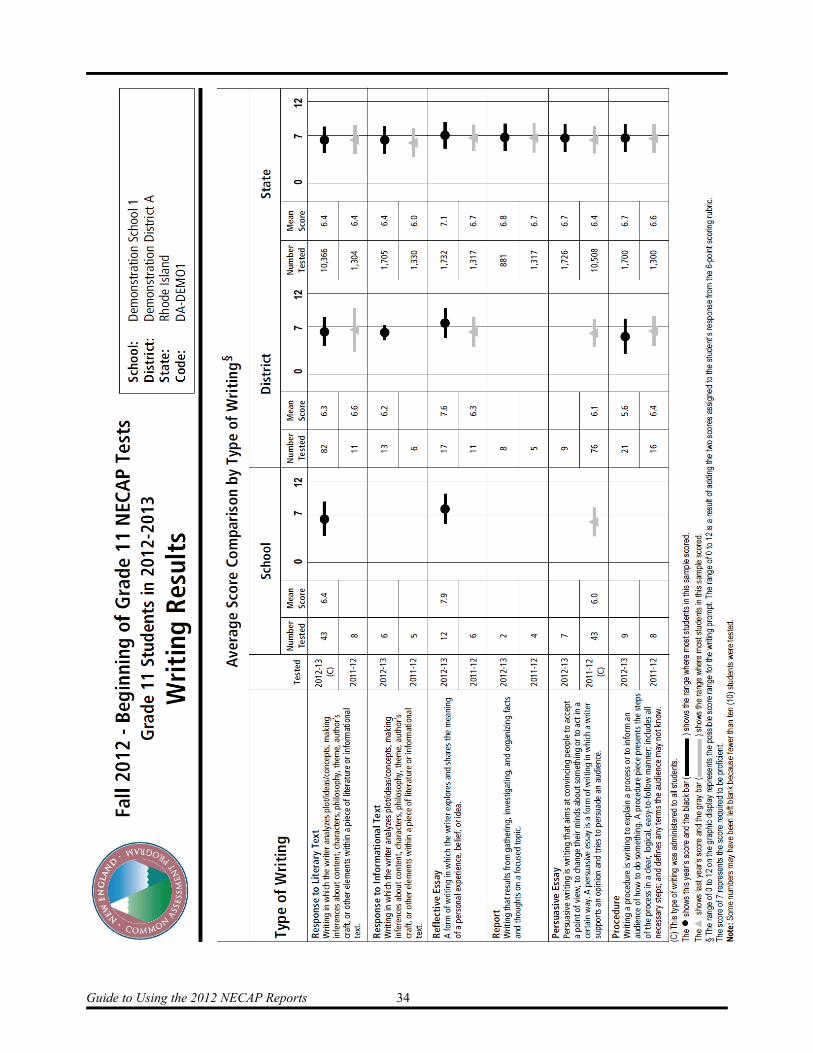
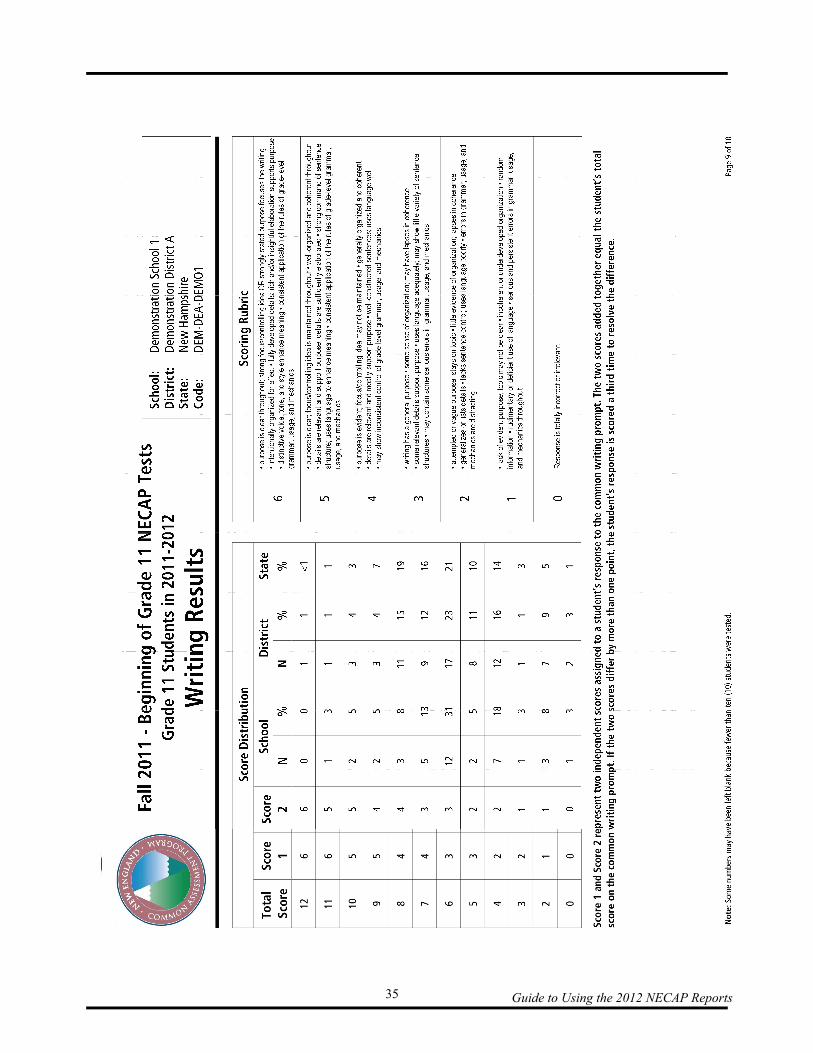
Grade 11 Writing Results report pages In an effort to provide more information on all of the types of writing that are assessed by NECAP, two writing results report pages are included in the NECAP Grade 11 School Results Report. AVERAGE SCORE COMPARISON BY TYPE OF WRITING (page 8 of the NECAP Grade 11 School Results Report) This page of the report lists the types of writing that are assessed in the grade 11 writing test. The types of writing are made up of both a common prompt (prompt that is administered to all students) and matrix prompts (prompts that vary across the eight different forms of the test). The first column on this page provides the name and a description of each type of writing. The second column provides a separate row for current year (2012-13) and previous year (2011-12) that each type of writing was assessed. The symbol (C) indicates the type of writing that was common and administered to all students in the fall 2012 test. The number tested and the mean raw score are provided for the school, district, and state. A graphic display is also provided for each year and type of writing that shows the average score attained on the 0 to 12 scale for the school, district, and state. The range of 0 to 12 on the graphic display represents the possible score range for the writing prompt. The 0 to 12 range is a result of adding the two scores assigned to the student’s response from the 6-point scoring rubric. The score of 7 depicted on the scale represents the score needed to be proficient. SCORE DISTRIBUTION AND SCORING RUBRIC (page 9 of the NECAP Grade 11 School Results Report) This page of the report presents information on the distribution of scores across the 0 to 12 score range. The first column of the table lists the possible scores from 12 down to 0. The next two columns (Score 1 and Score 2) represent two independent scores assigned to a student’s response to the common writing prompt. The two scores added together equal the student’s total score on the common writing prompt. The next four columns list the total number of students (N) and the percent of students (%) for each score on the 0 to 12 scale for the school and district. The last column provides the percent (%) of students for each score on the 0 to 12 scale for the state. The 6-point scoring rubric that is used to score student responses to the common writing prompt is also included on the page of the report.
Guide to Using the 2012 NECAP Reports 32

Guide to Using the 2012 NECAP Reports 33
Guide to Using the 2012 NECAP Reports 34
Guide to Using the 2012 NECAP Reports 35
Guide to Using the 2012 NECAP Reports 36
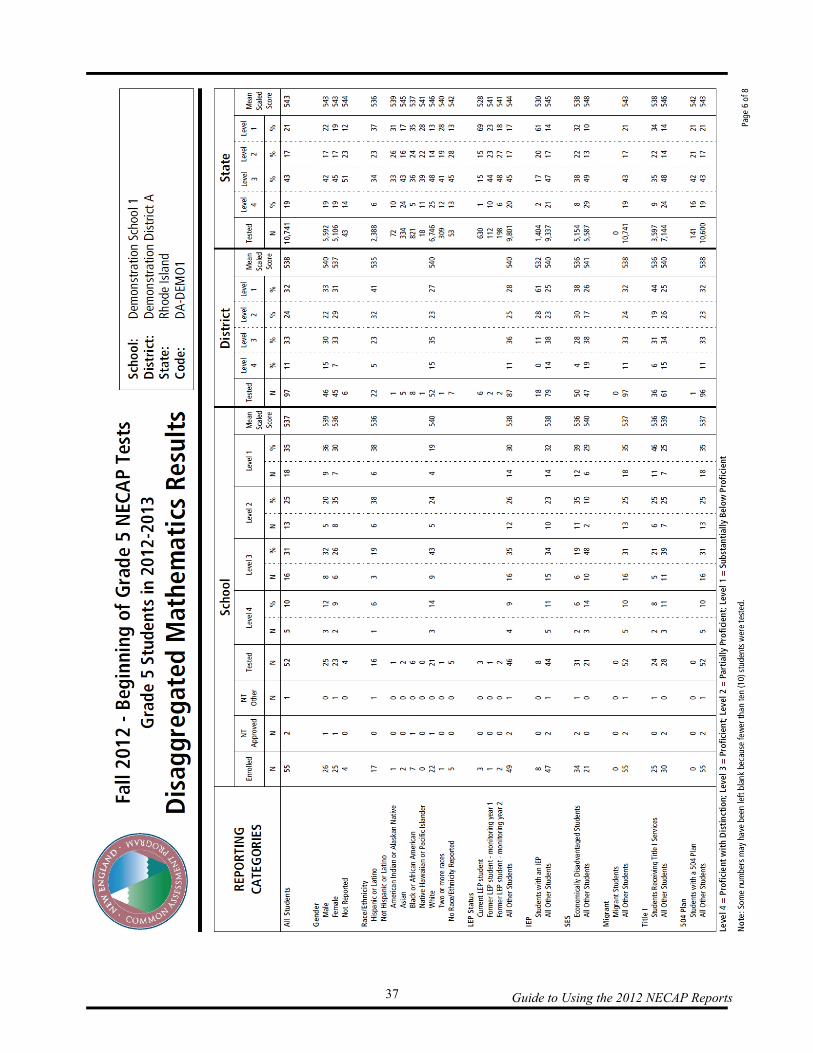
Disaggregated Content Area Results (Pages 4, 6, and 8 of the NECAP School Results Report) (The following page contains a sample grade 5 “Disaggregated Mathematics Results” page from a NECAP School Results Report.)
page 4—reading, page 6—mathematics, page 8—writing for grades 5 and 8 writing, and Page 10—writing for grade 11
Students can be grouped according to many characteristics—gender, ethnicity, school programs, etc. The scores provide information on achievement for different groups in a school, males and females for example. The performance of subgroups is included on the disaggregated content area results pages of the NECAP School Results Report for reading, mathematics, and writing. These sections present the relationship between the variables reported and performance in each content area at the school, district, and state levels. The tables show the number of students categorized as Enrolled, NT Approved (not tested for a state-approved reason), NT Other (not tested for other reasons), and Tested. The tables also provide the number and percentage of students within the subgroup at each of the four achievement levels, as well as the Mean Scaled Score (mean raw score for Grade 11 writing). The data for achievement levels and mean scaled score is based on the number shown in the Tested column. The data for the reporting categories was provided by information coded on the students’ answer booklets and/or data linked to the student label by the states. Because performance is being reported by categories that can contain relatively low numbers of students, school personnel are advised, under FERPA guidelines, to treat these pages confidentially. Please note: no data appears for 504 Plan in any of the content areas for New Hampshire or Vermont as this data was not collected by the states. In addition, no data appears for Title I in any of the content areas for Vermont.
Guide to Using the 2012 NECAP Reports 37
Guide to Using the 2012 NECAP Reports 38
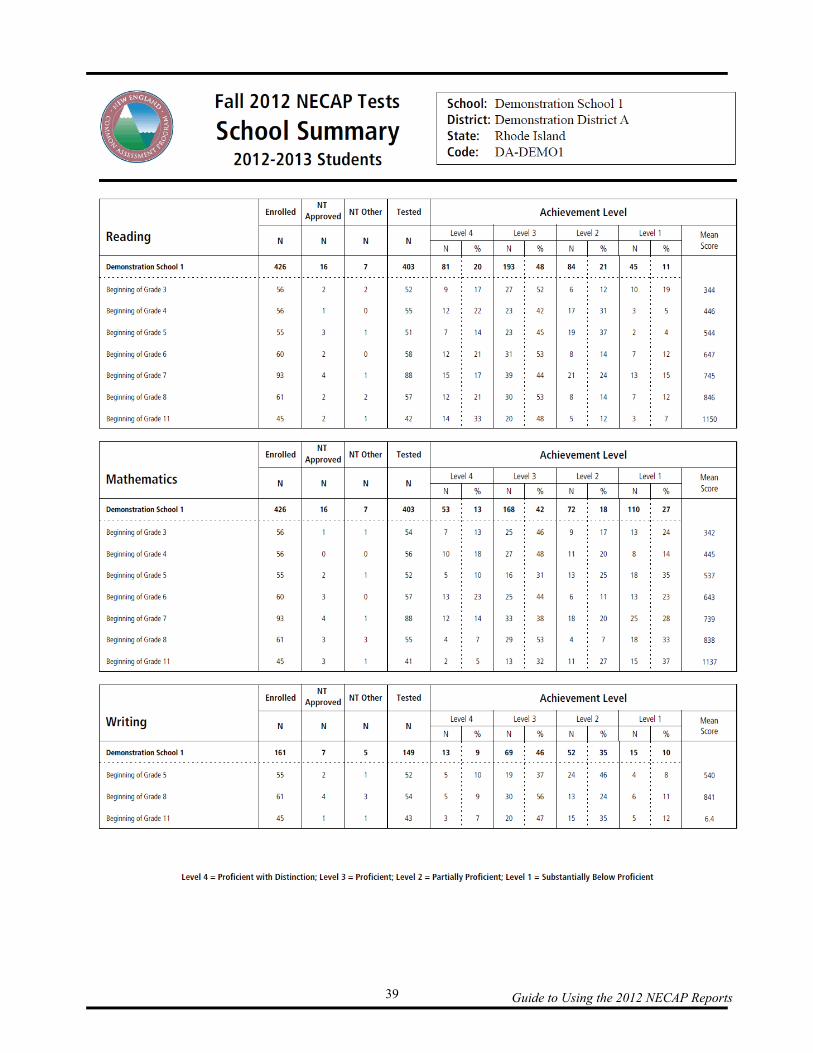
Understanding the School and District Summary Reports Overview The NECAP School Summary Report and the NECAP District Summary Report provide NECAP results for schools and districts based on the testing of local students in grades 3 through 8 and 11. Although text in this section refers only to the NECAP School Summary Report, educators and others who are reviewing the NECAP District Summary Report should also refer to this section for applicable information because the data reported, report format, and guidelines for using the reported data are identical for both the school and district reports. The only real difference between the reports is that the NECAP District Summary Report includes no individual school data. The NECAP School Summary Report provides details, broken down by content area, about student performance for all grade levels of NECAP that were tested in the school. The purpose of this summary is to help schools determine the extent to which their students achieve the particular standards and benchmarks contained in the Grade Level or Grade Span Expectations. Information about each content area and grade level for school, district, and state includes:
the total number of students Enrolled, NT Approved (not tested for a state-approved reason), NT Other (not tested for other reasons), and Tested;
the total number and percent of students at each achievement level (based on the number in the Tested column); and
the Mean Scaled Score (mean raw score for grade 11 writing). As mentioned earlier in this guide for the School and District Results Reports, it also is extremely important to be able to differentiate between “testing year” and “teaching year” summary reports for each year. The following page contains a sample “testing year” NECAP School Summary Report. The top line in the title of the report designates the year the test was administered. That line does not change whether one is looking at a “testing year” or “teaching year” report. The second line in the title is the name of the report. The third line in the title differentiates between the “teaching year” and the “testing year.” For the “Fall 2012 NECAP Tests,” the label “2012-2013 Students” in the third line indicates that it is a “testing year” report, and a label of “2011-2012 Students” in the third line would indicate that it is a “teaching” year report. The name of the tests within the report (for example, “Beginning of Grade 3”) also does not change whether one is looking at a “testing year” or “teaching year” report.
Guide to Using the 2012 NECAP Reports 39
Guide to Using the 2012 NECAP Reports 40
District and School Student-Level Data Files In addition to all of the reports, districts and schools are also able to access and download student-level data files from the NECAP reporting website for each grade of students tested within their district or school. Student-level data files are available for both “testing year” and “teaching year.” The student-level data files list students alphabetically within each school and contain all of the demographic information that was provided by the state for each student. Student records contain the scaled score, achievement level, and subscores earned by the student for each content area tested. In addition, the student records contain each student’s actual performance on each of the released items for each content area tested as well as the student’s responses to the student questionnaire. The data collected from the optional reports field, if it was coded by schools on page two of the student answer booklets, are also available for each student in the student-level data file. The optional reports field was provided to allow schools the option of grouping individual students into additional categories (for example, by class or by previous year’s teacher). This allows schools to make comparisons between subgroups that are not already listed on the disaggregated results pages of the school and district results reports. The file layout of the student-level data files that lists all of the field names, variable information, and valid values for each field is also available to districts and schools via the NECAP Analysis and Reporting System.
Guide to Using the 2012 NECAP Reports 41
Analysis and Reporting System Overview NECAP results are accessible online via the new Analysis and Reporting System. In addition to accessing and downloading reports and data files in the same manner as in years past, this system also includes interactive capabilities, allowing school and district users to sort and filter item and subgroup data and create custom reports. Interactive Reports There are four interactive reports that are available from the Analysis and Reporting System: Item Analysis Report, Achievement Level Summary, Released Items Summary Data, and Longitudinal Data. To access these four reports, the user needs to click the interactive tab on the home page of the system and select the report desired from the drop down menu. Next, the user will need to apply basic filtering options such as the name of the district or school and the grade level/content area test to open the report. At this point, the user will have the option of printing the report for the entire grade level or applying advanced filtering options to select a subgroup of students for which to analyze their results. (Advanced filtering options include gender, ethnicity, LEP, IEP, and SES.) (Note: The SES advanced filter is not available to districts and schools in New Hampshire.) Users also need to select either the “Testing” or “Teaching” cohort of students using the Filter by Group drop down menu. All interactive reports, with the exception of the Longitudinal Data Report, allow the user to provide a custom title for the report. Item Analysis Report This report provides individual student performance data on the released items and total test results for a selected grade/content area. A more detailed description of the information included on this report can be found on page 13 of this document. Please note that when advanced filtering criteria are applied, the School and District Percent Correct/Average Score rows at the bottom of the report will be blanked out and only the Group row and the State row for the group selected will contain data. This report can be saved, printed or exported as a pdf. Achievement Level Summary This report provides a visual display of the percentages of students in each achievement level for a selected grade/content area. The four achievement levels (Proficient with Distinction, Proficient, Partially Proficient, and Substantially Below Proficient) are represented by various colors in a pie chart. A separate table is also included next to the chart that shows the number and percentage of students in each achievement level. This report can be saved, printed or exported as a pdf or jpg file. Released Items Summary Data This school level report provides a summary of student responses to the released items for a selected grade/content area. The report is divided into two sections by item type (multiple choice and open response.) For multiple choice items, the content strand and GE code linked to the item are included as well as the total number/percent of students who answered the item correctly and the number of students who chose each incorrect option or provided an invalid response. An invalid response on a multiple choice item is defined as the item was left blank or the student selected more than one option for the item. For open response items, the content strand and GE code linked to the item are included as well as the point value and average score for the item. Users are also able to
Guide to Using the 2012 NECAP Reports 42
view the actual released items within this report. If a user clicks on a particular magnifying glass icon next to the released item number, a pop-up box will open displaying the released item. Longitudinal Data Report This confidential student-level report provides individual student performance data for multiple test administrations. Fall 2012 NECAP scores and achievement levels are provided for each tested student in reading, mathematics, and writing. In addition, fall NECAP 2009, 2010, and 2011 reading, mathematics, and writings scores and achievement levels are included for students in New Hampshire, Rhode Island, and Vermont. (Note: There are no writing scores available in grades 5 and 8 for 2009 as that year was a Pilot and no scores were reported.) Four years (2009, 2010, 2011, and 2012) of NECAP science scores and achievement levels are also included for students in New Hampshire, Rhode Island, and Vermont. For Maine students in grades 3 through 8, scores and achievement levels in reading, mathematics, writing, and science are provided for all assessments (NECAP, MEA, etc.) from 2006 on. Student performance on future test administrations will be included on this report over time. This report can be saved, printed or exported as a pdf file. Account Management In the Analysis and Reporting System, principals have the ability to create unique teacher accounts by assigning specific usernames and passwords to teachers. Once the accounts have been created, individual students may be assigned to each teacher account. After teachers have received their username and password, they will be able to login to their account and access the interactive reports which will be populated only with the subgroup of students assigned to them. For more information about the interactive reports and setting up teacher accounts, please refer to the Analysis and Reporting System User Manual that is available for download on the Analysis and Reporting System.
Guide to Using the 2012 NECAP Reports 43
Appendix A Overview of Assessment Instruments and Procedures
NECAP Tests of 2012 Local Educator Involvement in Test Development Local educators in the original three NECAP states were actively involved in each aspect of the NECAP test development from the beginning of the collaboration among the states. Educators have been involved in development of Grade Level and Grade Span Expectations, review of all passages and items for bias and sensitivity issues, and review of all items for purposes of alignment, Depth of Knowledge, age appropriateness, and accuracy of content. Local educators were also involved in standard setting and the Technical Advisory Committee. Since Maine joined NECAP in January of 2009, all four states now send teachers and other education professionals to represent the four-state consortium at the annual Item Review Committee and Bias and Sensitivity Review Committee meetings. At these meetings, committee members provide recommendations for field test items. Grade Level and Grade Span Expectation Development The Departments of Education of the NECAP states have developed a common set of grade level and grade span expectations, known as the New England Common Assessment Program Grade Level Expectations (GLE) and Grade Span Expectations (GSE), and test specifications in mathematics, reading, and writing. These expectations were developed in response to the requirements of the federally mandated No Child Left Behind Act of 2001 to test all students, beginning in the 2005-2006 academic year, in each of grades 3 through 8 in mathematics and reading/language arts and in the 2007-08 academic year in grade 11 in mathematics and reading/language arts. Although these sets of GLE and GSE were developed for this purpose, the partner states were committed to building coherent sets of expectations that would focus, not narrow, the curricula; would support good instruction; and would be aligned with each state’s standards. Throughout the development process, each of the NECAP partners has relied upon the expertise of educators in their states. These educators have helped guide the development of these documents and have made numerous insightful contributions in an effort to help support meaningful instruction in mathematics and reading/language arts. Maine adopted these grade level expectations as their official state standards for accountability purposes when they joined NECAP in January of 2009. Item Review Committee During the item review process, a committee of local educators is convened to review all of the items developed for NECAP. Committee member comments are solicited for each item. Each item is evaluated on the following four criteria:
content accuracy, accessibility/Universal Design (UD), alignment with the GLE or GSE being measured, and text complexity – Depth of Knowledge coding.
Guide to Using the 2012 NECAP Reports 44
Bias and Sensitivity Committee A committee of local educators also meets to review all reading passages and individual test items. Committee members determine if the passages and items are likely to place a particular group of students at an advantage or disadvantage for non-educational reasons; and if so, whether the passage or item should be revised or removed. Technical Advisory Committee A committee of nationally recognized test and measurement experts and local educators has been established and meets regularly to ensure the technical integrity of NECAP tests. Test Design TYPES OF ITEMS ON NECAP In order to provide a valid assessment of students’ attainment of the Grade Level and Grade Span Expectations, a variety of item types needed to be used. Therefore, multiple-choice items, short-answer items, constructed-response items, and extended-response writing prompts were used as follows. Multiple choice (one point) Multiple-choice items are efficient for testing a broad array of content in a relatively short time span. Short answer (one point and two point) These open-ended mathematics items ask students to generate a short response to a question. Constructed response (four points) This is a more complex item type that requires students to give a longer response to items related to a reading passage or solve multi-step mathematics problems. Extended-response writing prompts (twelve points) These are topics or questions designed to prompt students to respond in writing. Students compose a response to the writing prompt. COMMON AND MATRIX-SAMPLED ITEMS There are multiple versions, or forms, of the NECAP tests; for grades 3 through 8, nine forms were created for each grade level tested in reading and mathematics. Eight forms of the test were created for grade 11. The majority of the items in each of the NECAP test forms were the same in every form, or were “common” to all forms of the test. All individual student results (achievement levels, scaled scores, content area subscores) and school results are based on only common items. The other half of the items in each form were matrix sampled. Matrix sampling means distributing a large number of items among the different forms of the test. This approach allows for field testing of new items for subsequent years’ tests and also allows some items to be administered in successive years for purposes of equating the tests from year to year.

Guide to Using the 2012 NECAP Reports 45
All students at grades 5 and 8 take the same common writing test for their grade level. The writing test for grade 11 is made up of one common writing prompt that appears in all eight forms and one matrix writing prompt that is different in each form. A portion of common items is publicly released following each year’s test administration to inform local curriculum and instruction. Released common items are replaced each year with some of the items from the previous year’s matrix-sampled section.
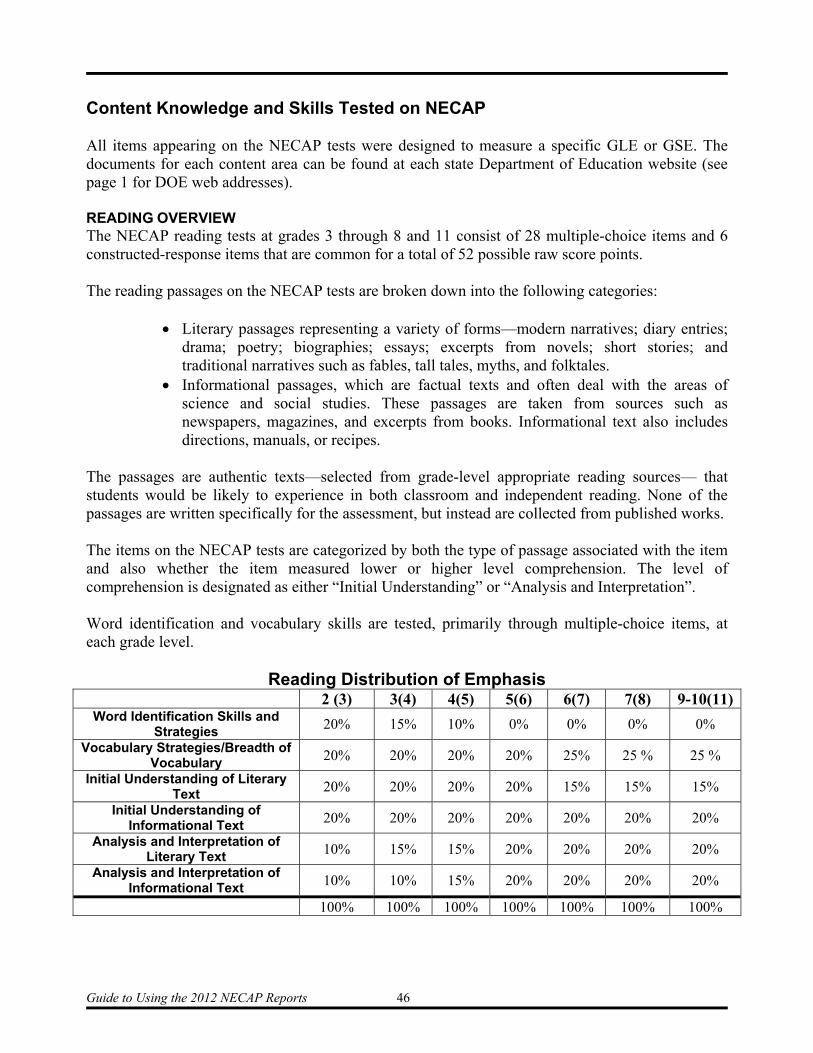
Guide to Using the 2012 NECAP Reports 46
Content Knowledge and Skills Tested on NECAP All items appearing on the NECAP tests were designed to measure a specific GLE or GSE. The documents for each content area can be found at each state Department of Education website (see page 1 for DOE web addresses). READING OVERVIEW The NECAP reading tests at grades 3 through 8 and 11 consist of 28 multiple-choice items and 6 constructed-response items that are common for a total of 52 possible raw score points. The reading passages on the NECAP tests are broken down into the following categories:
Literary passages representing a variety of forms—modern narratives; diary entries; drama; poetry; biographies; essays; excerpts from novels; short stories; and traditional narratives such as fables, tall tales, myths, and folktales.
Informational passages, which are factual texts and often deal with the areas of science and social studies. These passages are taken from sources such as newspapers, magazines, and excerpts from books. Informational text also includes directions, manuals, or recipes.
The passages are authentic texts—selected from grade-level appropriate reading sources— that students would be likely to experience in both classroom and independent reading. None of the passages are written specifically for the assessment, but instead are collected from published works. The items on the NECAP tests are categorized by both the type of passage associated with the item and also whether the item measured lower or higher level comprehension. The level of comprehension is designated as either “Initial Understanding” or “Analysis and Interpretation”. Word identification and vocabulary skills are tested, primarily through multiple-choice items, at each grade level.
Reading Distribution of Emphasis 2 (3) 3(4) 4(5) 5(6) 6(7) 7(8) 9-10(11)
Word Identification Skills and Strategies 20% 15% 10% 0% 0% 0% 0%
Vocabulary Strategies/Breadth of Vocabulary 20% 20% 20% 20% 25% 25 % 25 %
Initial Understanding of Literary Text 20% 20% 20% 20% 15% 15% 15%
Initial Understanding of Informational Text 20% 20% 20% 20% 20% 20% 20%
Analysis and Interpretation of Literary Text 10% 15% 15% 20% 20% 20% 20%
Analysis and Interpretation of Informational Text 10% 10% 15% 20% 20% 20% 20%
100% 100% 100% 100% 100% 100% 100%
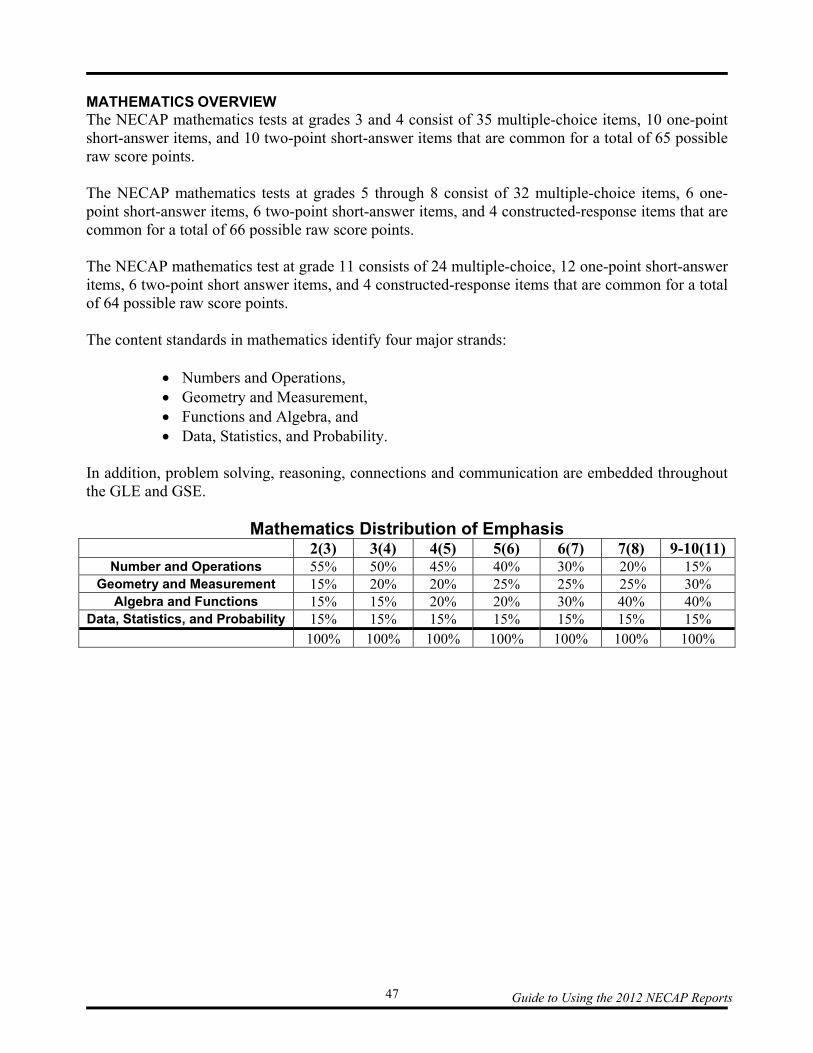
Guide to Using the 2012 NECAP Reports 47
MATHEMATICS OVERVIEW The NECAP mathematics tests at grades 3 and 4 consist of 35 multiple-choice items, 10 one-point short-answer items, and 10 two-point short-answer items that are common for a total of 65 possible raw score points. The NECAP mathematics tests at grades 5 through 8 consist of 32 multiple-choice items, 6 one-point short-answer items, 6 two-point short-answer items, and 4 constructed-response items that are common for a total of 66 possible raw score points. The NECAP mathematics test at grade 11 consists of 24 multiple-choice, 12 one-point short-answer items, 6 two-point short answer items, and 4 constructed-response items that are common for a total of 64 possible raw score points. The content standards in mathematics identify four major strands:
Numbers and Operations, Geometry and Measurement, Functions and Algebra, and Data, Statistics, and Probability.
In addition, problem solving, reasoning, connections and communication are embedded throughout the GLE and GSE.
Mathematics Distribution of Emphasis 2(3) 3(4) 4(5) 5(6) 6(7) 7(8) 9-10(11)
Number and Operations 55% 50% 45% 40% 30% 20% 15% Geometry and Measurement 15% 20% 20% 25% 25% 25% 30%
Algebra and Functions 15% 15% 20% 20% 30% 40% 40% Data, Statistics, and Probability 15% 15% 15% 15% 15% 15% 15% 100% 100% 100% 100% 100% 100% 100%
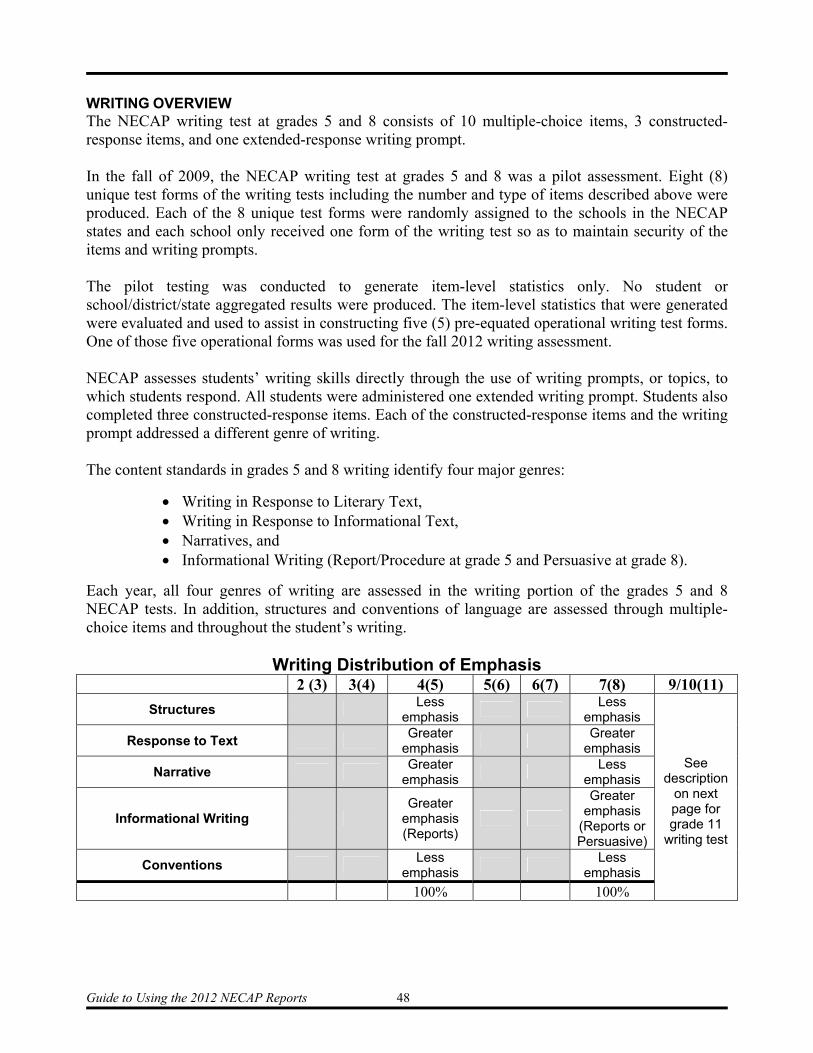
Guide to Using the 2012 NECAP Reports 48
WRITING OVERVIEW The NECAP writing test at grades 5 and 8 consists of 10 multiple-choice items, 3 constructed- response items, and one extended-response writing prompt. In the fall of 2009, the NECAP writing test at grades 5 and 8 was a pilot assessment. Eight (8) unique test forms of the writing tests including the number and type of items described above were produced. Each of the 8 unique test forms were randomly assigned to the schools in the NECAP states and each school only received one form of the writing test so as to maintain security of the items and writing prompts. The pilot testing was conducted to generate item-level statistics only. No student or school/district/state aggregated results were produced. The item-level statistics that were generated were evaluated and used to assist in constructing five (5) pre-equated operational writing test forms. One of those five operational forms was used for the fall 2012 writing assessment. NECAP assesses students’ writing skills directly through the use of writing prompts, or topics, to which students respond. All students were administered one extended writing prompt. Students also completed three constructed-response items. Each of the constructed-response items and the writing prompt addressed a different genre of writing. The content standards in grades 5 and 8 writing identify four major genres:
Writing in Response to Literary Text, Writing in Response to Informational Text, Narratives, and Informational Writing (Report/Procedure at grade 5 and Persuasive at grade 8).
Each year, all four genres of writing are assessed in the writing portion of the grades 5 and 8 NECAP tests. In addition, structures and conventions of language are assessed through multiple-choice items and throughout the student’s writing.
Writing Distribution of Emphasis 2 (3) 3(4) 4(5) 5(6) 6(7) 7(8) 9/10(11)
Structures Less emphasis
Less
emphasis
See description
on next page for grade 11
writing test
Response to Text Greater emphasis
Greater
emphasis
Narrative Greater
emphasis
Less emphasis
Informational Writing Greater
emphasis (Reports)
Greater emphasis
(Reports or Persuasive)
Conventions Less emphasis
Less
emphasis 100% 100%
Guide to Using the 2012 NECAP Reports 49
The NECAP writing test at grade 11 consists of two extended-response writing prompts. A common prompt, used to produce individual student scores, is administered to all students and is double scored using a six trait holistic scoring rubric for a total of 12 possible raw score points. In addition, each student is administered a second prompt which is matrix sampled across forms. Each year, the three genres listed below are assessed:
Writing in Response to Text (Literary and Informational), Informational Writing (Report, Procedure, Persuasive), and Expressive Writing (Reflective).
This second prompt is also double scored and the results are aggregated across all students in the school/district to provide information on pages 7, 8, and 9 of the NECAP Grade 11 School/District Results Reports.
Guide to Using the 2012 NECAP Reports 50
Administration Procedures for NECAP Guidelines for test scheduling, student participation, and test security, as well as detailed administration manuals, were provided to districts and schools prior to the October 2012 testing period. Training on test administration procedures was provided through five or more Test Administration Workshops held in each of the four states three weeks prior to testing. Student Participation All students were to participate in an assessment in one of the following three ways:
the general assessment without accommodations, the general assessment with accommodations, or State-specific alternate assessment.
The decision about how a student with disabilities would participate using accommodations was made at the local level. Guidance in making these decisions was available through each state’s Department of Education and through use of the NECAP Accommodations Guide, available on the DOE website for each state. Test Scheduling The NECAP Reading and Mathematics tests for grades 3 through 8 were designed to be administered in six separate sessions. For students in grades 5 and 8, two additional writing sessions were administered. The guidelines for scheduling test sessions were based on an estimate that each session would require approximately forty-five minutes and all students were allowed up to ninety minutes per session. The NECAP Writing, Reading, and Mathematics tests for grade 11 were designed to be administered in six separate sessions. The guidelines for scheduling test sessions were based on an estimate that each session would require approximately sixty minutes and all students were allowed up to ninety minutes per session. Administrators were instructed to allow extra time for any students who required test accommodations that could not be made during the regular test sessions. For scheduling purposes, each session was treated as an intact unit. That is, once students started a session of the test they had to finish it within the time allotted; also, under no circumstances were they allowed to go back to an earlier session once they had moved on to another session.
Guide to Using the 2012 NECAP Reports 51
Scoring The scoring activities that were used to produce the results for the NECAP reports are described below. Scoring was separated into the following four major tasks:
scoring of responses to multiple-choice items, scoring of responses to short-answer items, scoring of responses to constructed-response items, and scoring of extended-response writing prompts.
SCORING OF MULTIPLE-CHOICE ITEMS Multiple-choice items were machine-scored using digital scanning equipment. Correct responses were assigned a score of one point each; incorrect or blank responses were assigned a score of zero points each. SCORING OF SHORT-ANSWER AND CONSTRUCTED-RESPONSE ITEMS Short-answer and constructed-response items were scored by scorers employed by Measured Progress, the testing contractor. Short-answer items were given a score from zero to one or zero to two. Constructed-response items were given a score from zero to four. Zeros are employed when a student produces some work, but the work is totally wrong or irrelevant or if he or she leaves the item blank. For purposes of aggregating item results, blanks and zeros both count as zero points towards a student’s score. The work in preparation for scoring student responses included:
development of scoring guides (rubrics) by content specialists from the ME, NH, RI and VT Departments of Education and Measured Progress’s test developers, and
selection of “benchmark” responses—examples of student work at different score points for each item—that were used in training and continuous monitoring of scorer accuracy.
Scorer training consisted of:
review of each item and its related content and performance standard, review and discussion of the scoring guide and multiple sets of benchmark responses
for each score point, and qualifying rounds of scoring in which scorers needed to demonstrate a prescribed
level of accuracy.

Guide to Using the 2012 NECAP Reports 52
SCORING OF EXTENDED RESPONSES Extended-response writing prompts were given a score from zero to six. Zeros are employed when a student produces some work, but the work is totally wrong or unrelated to the prompt or if he or she leaves the item blank. For purposes of aggregating item results, blanks and zeros both count as zero points towards a student’s score. All NECAP extended-response writing prompts are 100% double-blind scored. Double-blind scoring refers to the method of scoring whereby two scorers score the same response and neither scorer has any indication as to what score the other person has given. If there is a difference in scores that is greater than 1 score point, then the response goes into an arbitration queue. Senior scoring staff members score all arbitration responses without knowing the scores given by the two previous scorers. The state Departments of Education defined how resolution should be reached if discrepant scores arise. Preparation for scoring extended-response writing prompts included the selection of benchmark responses that mirrored the work described on the previous page for scoring short-answer and constructed-response items. Scorers were trained by grade level in large sessions by senior scoring staff for that grade. Setting Standards for Performance on the NECAP Tests Standard setting is the process of determining the minimum or “threshold” score for each achievement level, grade, and content area for which results are reported. The multi-step process of setting standards for the NECAP tests began with creation of achievement level descriptions. In January 2006, the state Departments of Education in NH, RI, and VT convened panels of educators to participate in the standard-setting process for NECAP grades 3 through 8 in reading, mathematics, and writing. For more detailed information on standard setting see the 2005 NECAP Standard Setting Report located on the Department of Education website of each state. In January 2008, the state Departments of Education in NH, RI, and VT convened panels of educators to participate in the standard setting process for NECAP grade 11. The 2007 NECAP Standard Setting Report – Grade 11 is available on the Department of Education website for each of the original NECAP states. In January 2010, the state Departments of Education in ME, NH, RI, and VT convened panels of educators to participate in the standard-setting process for NECAP grades 5 and 8 writing that was necessary as a result of administering the first new writing assessment that was created based on the pilot tests that were administered in the fall of 2009. During this meeting, the panelists reviewed student work and made recommendations for where the scaled score cut scores should be set to classify students in each of the four achievement levels (Proficient with Distinction, Proficient, Partially Proficient, and Substantially below proficient. For more detailed information on standard setting, the 2010 NECAP Standard Setting Report – Grades 5 and 8 Writing is available on the Department of Education website of each state.

Guide to Using the 2012 NECAP Reports 53
Reporting The NECAP tests were designed to measure student performance against the learning goals described in the Grade Level and Grade Span Expectations. Consistent with this purpose, primary results on the NECAP tests are reported in terms of achievement levels that describe student performance in relation to these established state standards. There are four achievement levels: Proficient with Distinction, Proficient, Partially Proficient, and Substantially Below Proficient. Students receive a separate achievement-level classification (based on total scaled score) in each content area in which they complete a test. Each of the four achievement levels encompasses a range of student performance. A student whose test performance is just above Substantially Below Proficient and a student whose level of performance is slightly below Proficient are both classified as Partially Proficient. There is no overall classification of student performance across content areas. School- and district-level results are reported as the number and percentage of students attaining each achievement level at each grade level tested. In addition to achievement levels, NECAP results for grades 3 through 8 and 11 in reading and mathematics and for grades 5 and 8 writing are also reported as scaled scores. The grade 11 writing score is reported as the total points earned on the NECAP scoring rubric for writing. This rubric describes the most important features expected in student writing. TRANSLATING RAW SCORES TO SCALED SCORES AND ACHIEVEMENT LEVELS NECAP scores in each content area are reported on a scale that ranges from 00 to 80. Scaled scores supplement the NECAP achievement-level results by providing information about the position of a student’s results within an achievement level. School- and district-level scaled scores are calculated by computing the average of student-level scaled scores. Students’ raw scores, or total number of points, on the NECAP tests are translated to scaled scores using a data analysis process called scaling. Scaling simply converts raw points from one scale to another. In the same way that the same temperature can be expressed on either the Fahrenheit or Celsius scales and the same distance can be expressed either in miles or kilometers, student scores on the NECAP tests could be expressed as raw scores (i.e., number right) or scaled scores. It is important to note that converting from raw scores to scaled scores does not change the students’ achievement-level classifications. Given the relative simplicity of raw scores, it is fair to question why scaled scores are used in NECAP reports instead of raw scores. Foremost, scaled scores offer the advantage of simplifying the reporting of results across content areas, grade levels, and subsequent years. Because the standard-setting process typically results in different cut scores across content areas on a raw score basis, it is useful to transform these raw cut scores to a scale that is more easily interpretable and consistent. For NECAP, a score of 40 is the cut score between the Partially Proficient and Proficient achievement levels. This is true regardless of the content area, grade, or year with which one may be concerned. If one were to use raw scores, the raw cut score between Substantially Below Proficient and Partially Proficient might, for example, be 35 in mathematics at grade 3, but 33 in mathematics at grade 7, or 36 in writing at grade 8. Using scaled scores greatly simplifies the task of understanding how a student performed.
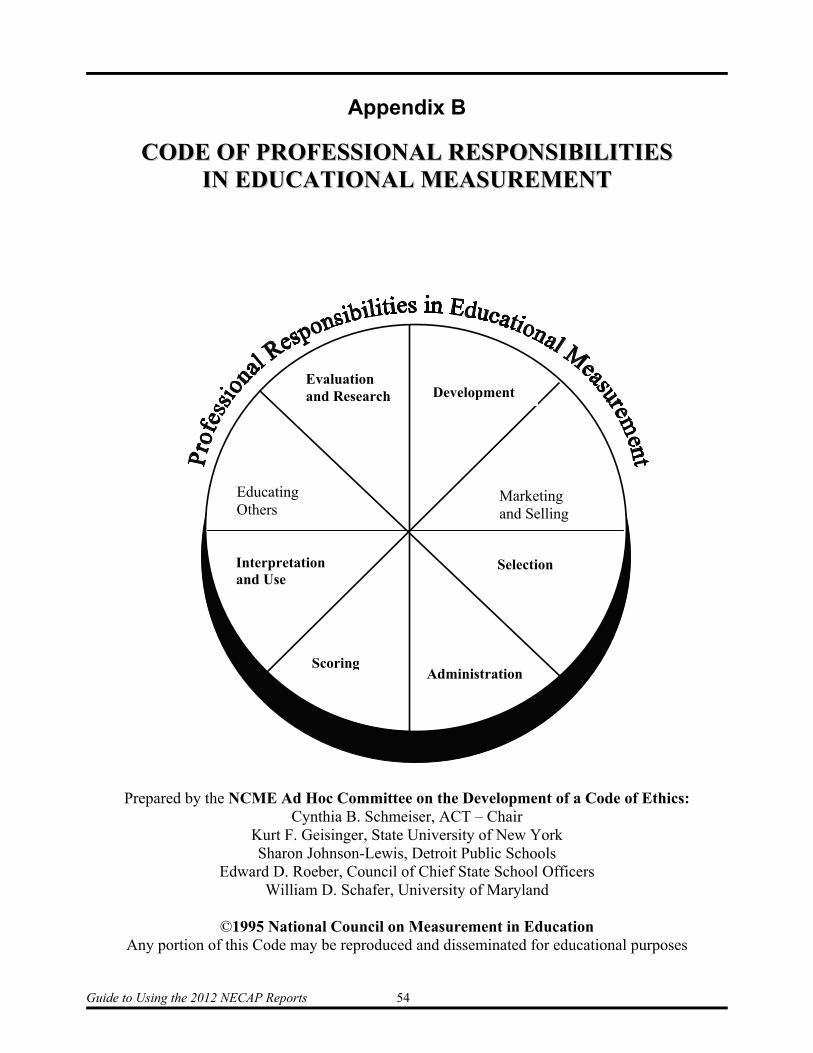
Guide to Using the 2012 NECAP Reports 54
Appendix B
CCOODDEE OOFF PPRROOFFEESSSSIIOONNAALL RREESSPPOONNSSIIBBIILLIITTIIEESS IINN EEDDUUCCAATTIIOONNAALL MMEEAASSUURREEMMEENNTT
Prepared by the NCME Ad Hoc Committee on the Development of a Code of Ethics: Cynthia B. Schmeiser, ACT – Chair
Kurt F. Geisinger, State University of New York Sharon Johnson-Lewis, Detroit Public Schools
Edward D. Roeber, Council of Chief State School Officers William D. Schafer, University of Maryland
©1995 National Council on Measurement in Education
Any portion of this Code may be reproduced and disseminated for educational purposes
Educating Others
Evaluation and Research
Interpretation and Use
Scoring
Development
Marketing and Selling
Selection
Administration
Guide to Using the 2012 NECAP Reports 55
CCOODDEE OOFF PPRROOFFEESSSSIIOONNAALL RREESSPPOONNSSIIBBIILLIITTIIEESS IINN EEDDUUCCAATTIIOONNAALL MMEEAASSUURREEMMEENNTT
As an organization dedicated to the improvement of measurement and evaluation practice in education, the National Council on Measurement in Education (NCME) has adopted this Code to promote professionally responsible practice in conduct that arises from either the professional standards of the field, general ethical principles, or both. The purpose of the Code of Professional Responsibilities in Educational Measurement, hereinafter referred to as the Code, is to guide the conduct of NCME members who are involved in any type of assessment activity in education. NCME is also providing this Code as a public service for all individuals who are engaged in educational assessment activities in the hope that these activities will be conducted in a professionally responsible manner. Persons who engage in these activities include local educators such as classroom teachers, principals, and superintendents; professionals such as school psychologists and counselors; state and national technical, legislative, and policy staff in education; staff of research, evaluation, and testing organizations; providers of test preparation services; college and university faculty and administrators; and professionals in business and industry who design and implement educational and training programs. This Code applies to any type of assessment that occurs as part of the educational process, including formal and informal, traditional and alternative techniques for gathering information used in making educational decisions at all levels. These techniques include, but are not limited to, large-scale assessments at the school, district, state, national, and international levels; standardized tests; observational measures; teacher-conducted assessments; assessment support materials; and other achievement, aptitude, interest, and personality measures used in and for education. Although NCME is promulgating this Code for its members, it strongly encourages other organizations and individuals who engage in educational assessment activities to endorse and abide by the responsibilities relevant to their professions. Because the Code
pertains only to uses of assessment in education, it isrecognized that uses of assessments outside of educationalcontexts, such as for employment, certification, orlicensure, may involve additional professionalresponsibilities beyond those detailed in this Code. The Code enumerates professional responsibilities ineight major areas of assessment activity. Specifically, theCode presents the professional responsibilities of thosewho:
1) Develop Assessments 2) Market and Sell Assessments
3) Select Assessments
4) Administer Assessments 5) Score Assessments
6) Interpret Use, and Communicate
Assessment Results 7) Educate About Assessment
8) Evaluate Programs and Conduct Research
on Assessments. Although the organization of the Code is based on thedifferentiation of these activities, they are viewed ashighly interrelated, and those who use this Code are urgedto consider the Code in its entirety. The index followingthis Code provides a listing of some of the critical interesttopics within educational measurement that focus on oneor more of the assessment activities.
PREAMBLE AND GENERAL RESPONSIBILITIES
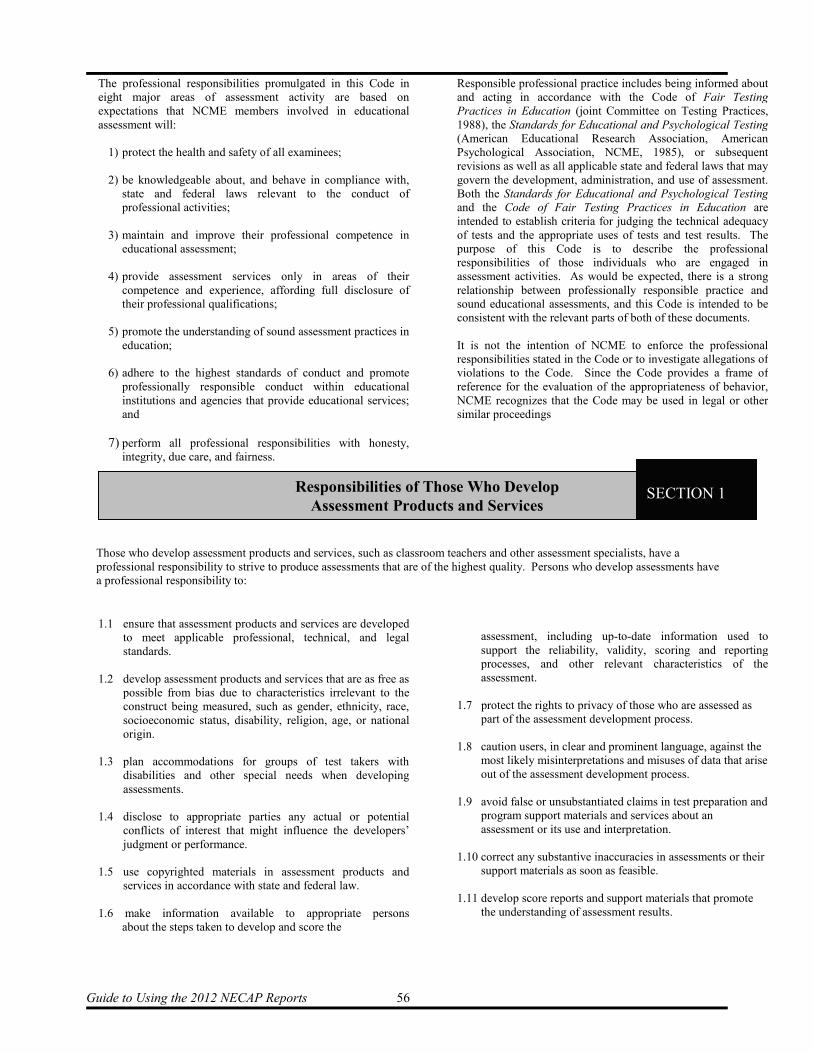
Guide to Using the 2012 NECAP Reports 56
The professional responsibilities promulgated in this Code in eight major areas of assessment activity are based on expectations that NCME members involved in educational assessment will:
1) protect the health and safety of all examinees; 2) be knowledgeable about, and behave in compliance with,
state and federal laws relevant to the conduct of professional activities;
3) maintain and improve their professional competence in
educational assessment; 4) provide assessment services only in areas of their
competence and experience, affording full disclosure of their professional qualifications;
5) promote the understanding of sound assessment practices in
education; 6) adhere to the highest standards of conduct and promote
professionally responsible conduct within educational institutions and agencies that provide educational services; and
7) perform all professional responsibilities with honesty,
integrity, due care, and fairness. 1.1 ensure that assessment products and services are developed
to meet applicable professional, technical, and legal standards.
1.2 develop assessment products and services that are as free as
possible from bias due to characteristics irrelevant to the construct being measured, such as gender, ethnicity, race, socioeconomic status, disability, religion, age, or national origin.
1.3 plan accommodations for groups of test takers with
disabilities and other special needs when developing assessments.
1.4 disclose to appropriate parties any actual or potential
conflicts of interest that might influence the developers’ judgment or performance.
1.5 use copyrighted materials in assessment products and
services in accordance with state and federal law. 1.6 make information available to appropriate persons
about the steps taken to develop and score the
Responsible professional practice includes being informed about and acting in accordance with the Code of Fair Testing Practices in Education (joint Committee on Testing Practices,1988), the Standards for Educational and Psychological Testing(American Educational Research Association, American Psychological Association, NCME, 1985), or subsequent revisions as well as all applicable state and federal laws that may govern the development, administration, and use of assessment. Both the Standards for Educational and Psychological Testing and the Code of Fair Testing Practices in Education are intended to establish criteria for judging the technical adequacy of tests and the appropriate uses of tests and test results. The purpose of this Code is to describe the professional responsibilities of those individuals who are engaged in assessment activities. As would be expected, there is a strong relationship between professionally responsible practice and sound educational assessments, and this Code is intended to be consistent with the relevant parts of both of these documents. It is not the intention of NCME to enforce the professional responsibilities stated in the Code or to investigate allegations of violations to the Code. Since the Code provides a frame of reference for the evaluation of the appropriateness of behavior, NCME recognizes that the Code may be used in legal or other similar proceedings
assessment, including up-to-date information used to support the reliability, validity, scoring and reporting processes, and other relevant characteristics of the assessment.
1.7 protect the rights to privacy of those who are assessed as
part of the assessment development process. 1.8 caution users, in clear and prominent language, against the
most likely misinterpretations and misuses of data that arise out of the assessment development process.
1.9 avoid false or unsubstantiated claims in test preparation and
program support materials and services about an assessment or its use and interpretation.
1.10 correct any substantive inaccuracies in assessments or their
support materials as soon as feasible. 1.11 develop score reports and support materials that promote
the understanding of assessment results.
Responsibilities of Those Who Develop Assessment Products and Services
Those who develop assessment products and services, such as classroom teachers and other assessment specialists, have a professional responsibility to strive to produce assessments that are of the highest quality. Persons who develop assessments have a professional responsibility to:
SECTION 1
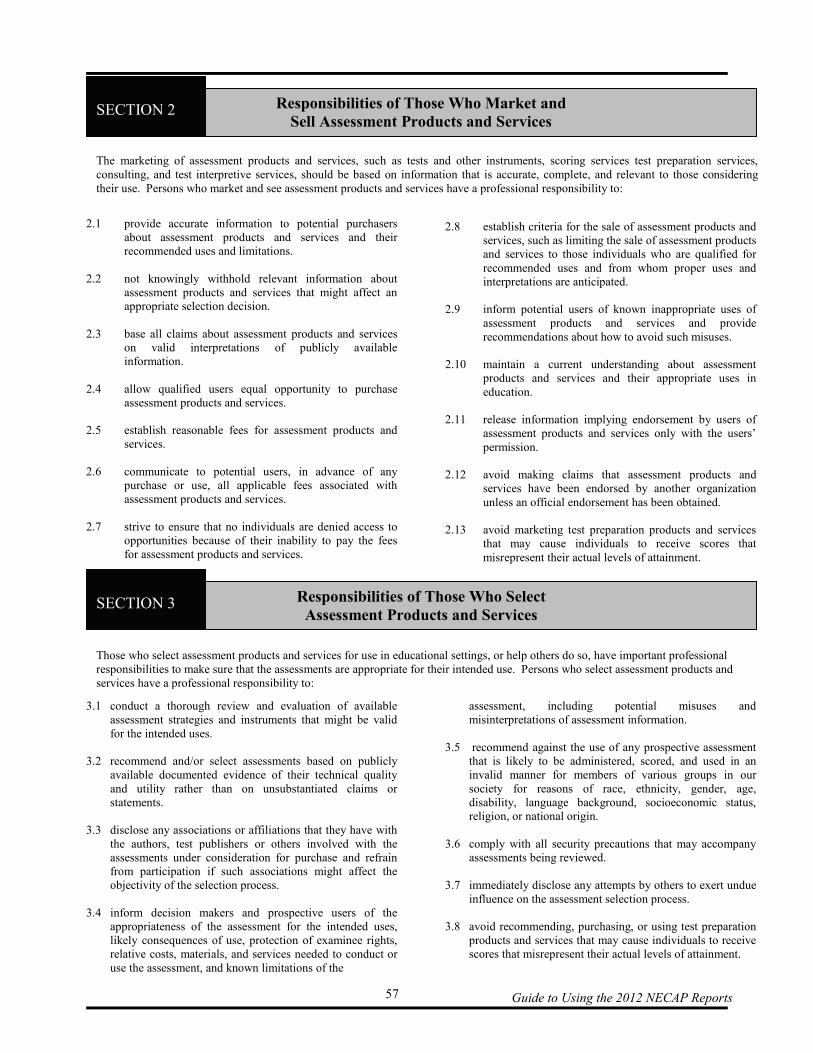
Guide to Using the 2012 NECAP Reports 57
2.1 provide accurate information to potential purchasers
about assessment products and services and their recommended uses and limitations.
2.2 not knowingly withhold relevant information about
assessment products and services that might affect an appropriate selection decision.
2.3 base all claims about assessment products and services
on valid interpretations of publicly available information.
2.4 allow qualified users equal opportunity to purchase
assessment products and services. 2.5 establish reasonable fees for assessment products and
services. 2.6 communicate to potential users, in advance of any
purchase or use, all applicable fees associated with assessment products and services.
2.7 strive to ensure that no individuals are denied access to
opportunities because of their inability to pay the fees for assessment products and services.
3.1 conduct a thorough review and evaluation of available
assessment strategies and instruments that might be valid for the intended uses.
3.2 recommend and/or select assessments based on publicly
available documented evidence of their technical quality and utility rather than on unsubstantiated claims or statements.
3.3 disclose any associations or affiliations that they have with
the authors, test publishers or others involved with the assessments under consideration for purchase and refrain from participation if such associations might affect the objectivity of the selection process.
3.4 inform decision makers and prospective users of the
appropriateness of the assessment for the intended uses, likely consequences of use, protection of examinee rights, relative costs, materials, and services needed to conduct or use the assessment, and known limitations of the
3.5
2.8 establish criteria for the sale of assessment products and
services, such as limiting the sale of assessment products and services to those individuals who are qualified for recommended uses and from whom proper uses and interpretations are anticipated.
2.9 inform potential users of known inappropriate uses of
assessment products and services and provide recommendations about how to avoid such misuses.
2.10 maintain a current understanding about assessment
products and services and their appropriate uses in education.
2.11 release information implying endorsement by users of
assessment products and services only with the users’ permission.
2.12 avoid making claims that assessment products and
services have been endorsed by another organization unless an official endorsement has been obtained.
2.13 avoid marketing test preparation products and services
that may cause individuals to receive scores that misrepresent their actual levels of attainment.
assessment, including potential misuses and misinterpretations of assessment information.
3.5 recommend against the use of any prospective assessment
that is likely to be administered, scored, and used in an invalid manner for members of various groups in our society for reasons of race, ethnicity, gender, age, disability, language background, socioeconomic status, religion, or national origin.
3.6 comply with all security precautions that may accompany
assessments being reviewed. 3.7 immediately disclose any attempts by others to exert undue
influence on the assessment selection process. 3.8 avoid recommending, purchasing, or using test preparation
products and services that may cause individuals to receive scores that misrepresent their actual levels of attainment.
Responsibilities of Those Who Market and Sell Assessment Products and Services
Responsibilities of Those Who Select Assessment Products and Services
The marketing of assessment products and services, such as tests and other instruments, scoring services test preparation services, consulting, and test interpretive services, should be based on information that is accurate, complete, and relevant to those considering their use. Persons who market and see assessment products and services have a professional responsibility to:
Those who select assessment products and services for use in educational settings, or help others do so, have important professional responsibilities to make sure that the assessments are appropriate for their intended use. Persons who select assessment products and services have a professional responsibility to:
SECTION 2
SECTION 3
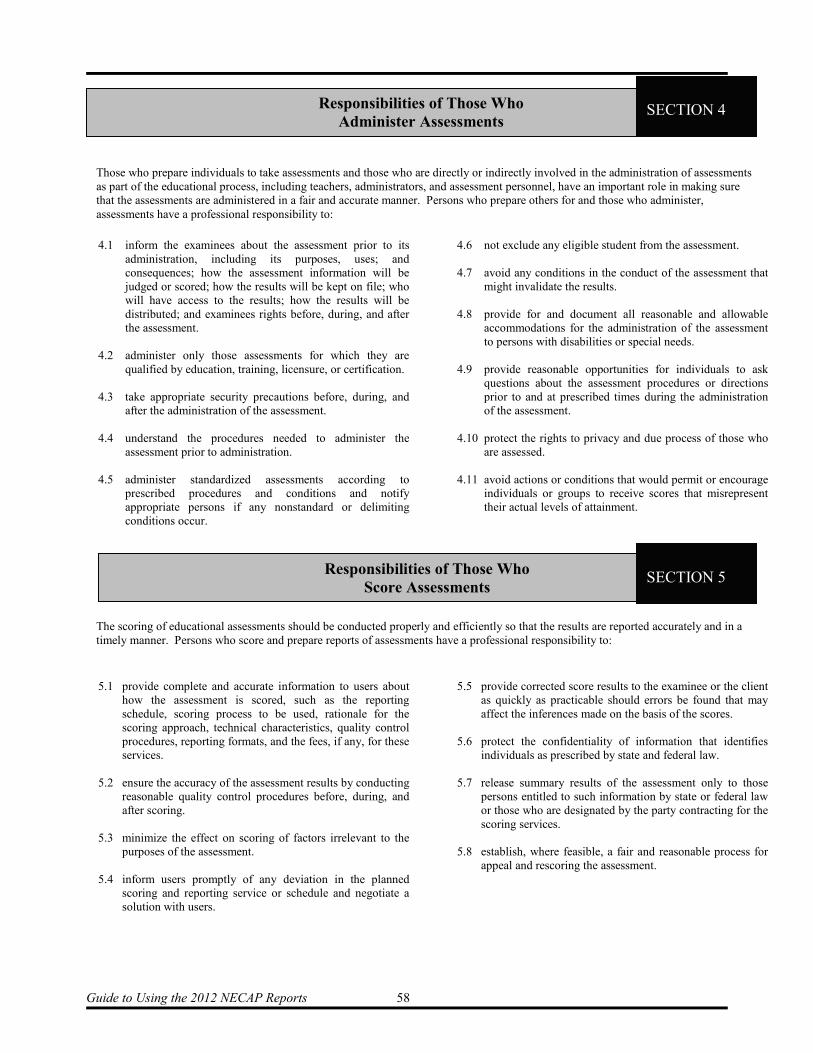
Guide to Using the 2012 NECAP Reports 58
4.1 inform the examinees about the assessment prior to its
administration, including its purposes, uses; and consequences; how the assessment information will be judged or scored; how the results will be kept on file; who will have access to the results; how the results will be distributed; and examinees rights before, during, and after the assessment.
4.2 administer only those assessments for which they are
qualified by education, training, licensure, or certification. 4.3 take appropriate security precautions before, during, and
after the administration of the assessment. 4.4 understand the procedures needed to administer the
assessment prior to administration. 4.5 administer standardized assessments according to
prescribed procedures and conditions and notify appropriate persons if any nonstandard or delimiting conditions occur.
5.1 provide complete and accurate information to users about
how the assessment is scored, such as the reporting schedule, scoring process to be used, rationale for the scoring approach, technical characteristics, quality control procedures, reporting formats, and the fees, if any, for these services.
5.2 ensure the accuracy of the assessment results by conducting
reasonable quality control procedures before, during, and after scoring.
5.3 minimize the effect on scoring of factors irrelevant to the
purposes of the assessment. 5.4 inform users promptly of any deviation in the planned
scoring and reporting service or schedule and negotiate a solution with users.
4.6 not exclude any eligible student from the assessment. 4.7 avoid any conditions in the conduct of the assessment that
might invalidate the results. 4.8 provide for and document all reasonable and allowable
accommodations for the administration of the assessment to persons with disabilities or special needs.
4.9 provide reasonable opportunities for individuals to ask
questions about the assessment procedures or directions prior to and at prescribed times during the administration of the assessment.
4.10 protect the rights to privacy and due process of those who
are assessed. 4.11 avoid actions or conditions that would permit or encourage
individuals or groups to receive scores that misrepresent their actual levels of attainment.
5.5 provide corrected score results to the examinee or the client
as quickly as practicable should errors be found that may affect the inferences made on the basis of the scores.
5.6 protect the confidentiality of information that identifies
individuals as prescribed by state and federal law. 5.7 release summary results of the assessment only to those
persons entitled to such information by state or federal law or those who are designated by the party contracting for the scoring services.
5.8 establish, where feasible, a fair and reasonable process for
appeal and rescoring the assessment.
Those who prepare individuals to take assessments and those who are directly or indirectly involved in the administration of assessments as part of the educational process, including teachers, administrators, and assessment personnel, have an important role in making sure that the assessments are administered in a fair and accurate manner. Persons who prepare others for and those who administer, assessments have a professional responsibility to:
Responsibilities of Those Who Score Assessments
The scoring of educational assessments should be conducted properly and efficiently so that the results are reported accurately and in a timely manner. Persons who score and prepare reports of assessments have a professional responsibility to:
Responsibilities of Those Who Administer Assessments
SECTION 4
SECTION 5
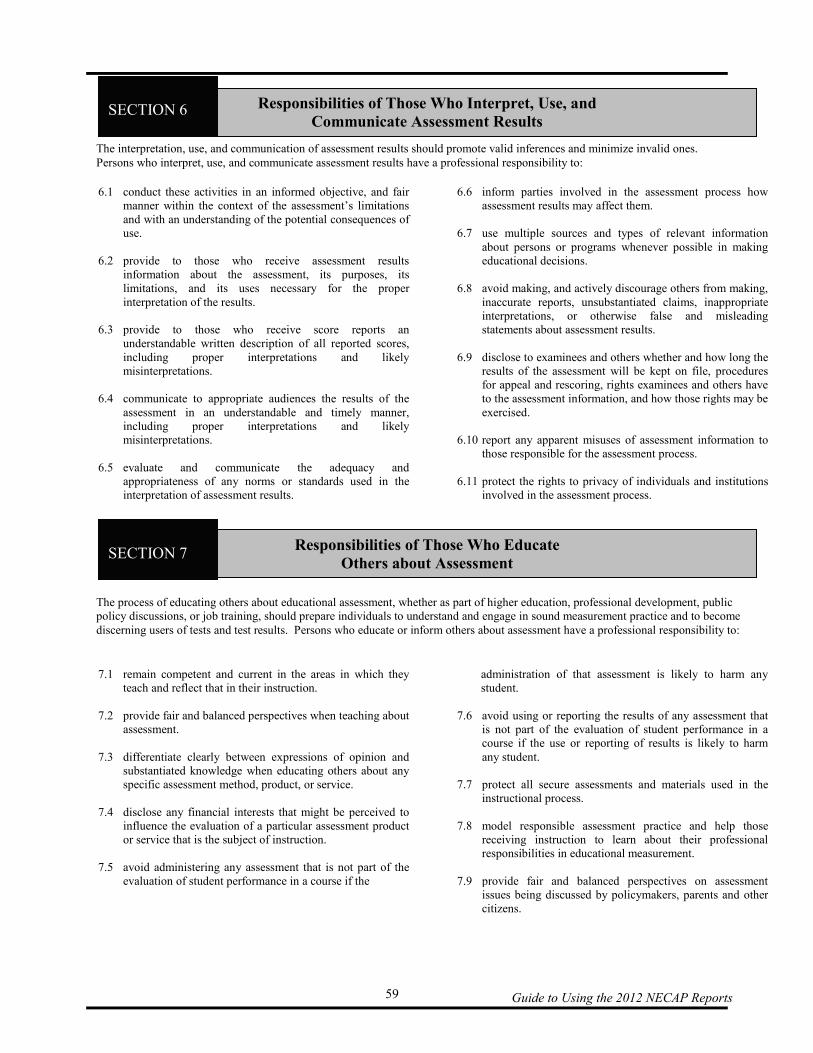
Guide to Using the 2012 NECAP Reports 59
6.1 conduct these activities in an informed objective, and fair
manner within the context of the assessment’s limitations and with an understanding of the potential consequences of use.
6.2 provide to those who receive assessment results
information about the assessment, its purposes, its limitations, and its uses necessary for the proper interpretation of the results.
6.3 provide to those who receive score reports an
understandable written description of all reported scores, including proper interpretations and likely misinterpretations.
6.4 communicate to appropriate audiences the results of the
assessment in an understandable and timely manner, including proper interpretations and likely misinterpretations.
6.5 evaluate and communicate the adequacy and
appropriateness of any norms or standards used in the interpretation of assessment results.
7.1 remain competent and current in the areas in which they
teach and reflect that in their instruction. 7.2 provide fair and balanced perspectives when teaching about
assessment. 7.3 differentiate clearly between expressions of opinion and
substantiated knowledge when educating others about any specific assessment method, product, or service.
7.4 disclose any financial interests that might be perceived to
influence the evaluation of a particular assessment product or service that is the subject of instruction.
7.5 avoid administering any assessment that is not part of the
evaluation of student performance in a course if the
6.6 inform parties involved in the assessment process how
assessment results may affect them. 6.7 use multiple sources and types of relevant information
about persons or programs whenever possible in making educational decisions.
6.8 avoid making, and actively discourage others from making,
inaccurate reports, unsubstantiated claims, inappropriate interpretations, or otherwise false and misleading statements about assessment results.
6.9 disclose to examinees and others whether and how long the
results of the assessment will be kept on file, procedures for appeal and rescoring, rights examinees and others have to the assessment information, and how those rights may be exercised.
6.10 report any apparent misuses of assessment information to
those responsible for the assessment process. 6.11 protect the rights to privacy of individuals and institutions
involved in the assessment process.
administration of that assessment is likely to harm any student.
7.6 avoid using or reporting the results of any assessment that
is not part of the evaluation of student performance in a course if the use or reporting of results is likely to harm any student.
7.7 protect all secure assessments and materials used in the
instructional process. 7.8 model responsible assessment practice and help those
receiving instruction to learn about their professional responsibilities in educational measurement.
7.9 provide fair and balanced perspectives on assessment
issues being discussed by policymakers, parents and other citizens.
The interpretation, use, and communication of assessment results should promote valid inferences and minimize invalid ones. Persons who interpret, use, and communicate assessment results have a professional responsibility to:
Responsibilities of Those Who Educate Others about Assessment
SECTION 7
The process of educating others about educational assessment, whether as part of higher education, professional development, public policy discussions, or job training, should prepare individuals to understand and engage in sound measurement practice and to become discerning users of tests and test results. Persons who educate or inform others about assessment have a professional responsibility to:
Responsibilities of Those Who Interpret, Use, and Communicate Assessment Results
SECTION 6
Guide to Using the 2012 NECAP Reports 60
8.1 conduct evaluation and research activities in an informed,
objective, and fair manner. 8.2 disclose any associations that they have with authors, test
publishers, or others involved with the assessment and refrain from participation if such associations might affect the objectivity of the research or evaluation.
8.3 preserve the security of all assessments throughout the
research process as appropriate. 8.4 take appropriate steps to minimize potential sources of
invalidity in the research and disclose known factors that may bias the results of the study.
8.5 present the results of research, both intended and
As stated at the outset, the purpose of the Code of Professional Responsibilities in Educational Measurement is to serve as a guide to the conduct of NCME members who are engaged in any type of assessment activity in education. Given the broad scope of the field of educational assessment as well as the variety of activities in which professionals may engage, it is unlikely that any code will cover the professional responsibilities involved in every situation or activity in which assessment is used in education. Ultimately, it is hoped that this Code will serve as the basis for ongoing discussions about what constitutes professionally responsible practice. Moreover, these discussions will undoubtedly identify areas of practice
unintended, in a fair, complete, and objective manner.
8.6 attribute completely and appropriately the work and ideas of others.
8.7 qualify the conclusions of the research within the
limitations of the study. 8.8 use multiple sources of relevant information in conducting
evaluation and research activities whenever possible. 8.9 comply with applicable standards for protecting the rights
of participants in an evaluation or research study, including the rights to privacy and informed consent.
that need further analysis and clarification in subsequent editions of the Code. To the extent that these discussions occur, the Code will have served its purpose. To assist in the ongoing refinement of the Code, comments on this document are most welcome. Please send your comments and inquiries to:
Dr. William J. Russell Executive Officer
National Council on Measurement in Education
1230 Seventeenth Street, NW Washington, DC 20036-3078
Conducting research on or about assessments or educational programs is a key activity in helping to improve the understanding and use of assessments and educational programs. Persons who engage in the evaluation of educational programs or conduct research on assessments have a professional responsibility to:
Afterword
Responsibilities of Those Who Evaluate Educational Programs & Conduct Research on Assessments
SECTION 8

Guide to Using the 2012 NECAP Reports 61
American Association for Counseling and Development (now American Counseling Association). (1988). Ethical standards of the American Counseling Association. Alexandria, VA: Author. American Association for Counseling and Development (now American Counseling Association) & Association for Measurement and Evaluation in Counseling and Development (now Association for Assessment in Counseling). (1989) Responsibilities of users of standardized tests; RUST statement revised. Alexandria, VA: Author. American Educational Research Association, American Psychological Association, & National Council on Measurement in Education. (1985). Standards for educational and psychological testing. Washington, DC: Author. American Educational Research Association. (1992). Ethical standards of the American Educational Research association. Educational Researcher, 21 (7), 23-26. American Federation of Teachers, National Council on Measurement in Education, & National Education association. (1990). Standards for teacher competence in educational assessment of students. Washington, DC: Author. Topic Responsibility Advertising..............................................1.9, 1.10, 2.3, 2.11, 2.12 Bias……………………………………1.2, 3.5, 4.5, 4.7, 5.3, 8.4 Cheating…………………………………………... 4.5, 4.6, 4.11 Coaching and Test Preparation………………….. 2.13, 3.8, 4.11 Competence………………………… 2.10, 4.2, 4.4, 4.5, 5.2, 5.5, 7.1, 7.8, 7.9, 8.1, 8.7 Conflict of Interest…………………………….. 1.4, 3.3, 7.4, 8.2 Consequences of Test Use………………... 3.4, 6.1, 6.6, 7.5, 7.6 Copyrighted Materials, Use of………………………….. 1.5, 8.6 Disabled Examinees, Rights of ………………………….1.3, 4.8 Disclosure………………1.6, 2.1, 2.2, 2.6, 3.3, 3.7, 4.1, 5.1, 5.4, 6.2, 6.3, 6.4, 6.6, 6.9, 8.2, 8.4, 8.5
American Psychological Association. (1992). Ethical principlesof psychologists and code of conduct. Washington, DC: Author. American Psychological Association President’s Task Force onPsychology in Education. (In press). Learner-centeredpsychological principles: Guidelines for school redesign andreform. Washington, DC: Author. Joint Advisory Committee. (1993). Principles for fairassessment practices for education in Canada. Edmonton,Alberta: Author. Joint Committee on Testing Practices. (1988). Code of fairtesting practices in education. Washington, DC: Author. Joint Committee on Standards for Educational Evaluation.(1988). The personnel evaluation standards: How to assesssystems for evaluating educators. Newbury Park, CA: Sage. Joint Committee on Standards for Educational Evaluation. (1The program evaluation standards: How to assess evaluationeducational programs. Thousand Oaks, CA: Sage. National Association of College Admission Counselors. (1988).Statement of principles of good practice. Alexandria, VA:Author. Topic Responsibility Due Process……………………………… 4.10, 5.8, 6.9 Equity ……………………………..1.2, 2.4, 2.7, 3.5, 4.6 Fees ……………………………………….. 2.5, 2.6, 2.7 Inappropriate Test Use ……..1.8, 2.8, 2.9, 3.4, 6.8, 6.10 Objectivity……………… 3.1, 3.2, 3.3, 6.1, 6.5, 7.2, 7.3 7.9, 8.1, 8.2, 8.5, 8.7 Rights to Privacy ………1.7, 3.4, 4.10, 5.6, 5.7, 6.11, 8.9 Security ………………………………..3.6, 4.3, 7.7, 8.3 Truthfulness ……………………1.10, 2.1, 2.2, 2.3, 2.11, 2.12, 3.2, 4.6, 7.3 Undue Influence ……………………………………..3.7 Unsubstantiated Claims …………………….1.9, 3.2, 6.8
The following list of resources is provided for those who want to seek additional information about codes of professional responsibility that have been developed and adopted by organizations having an interest in various aspects of educational assessment.
Index to the Code of Professional Responsibilities in Educational Measurement
This index provides a list of major topics and issues addressed by the responsibilities in each of the eight sections of the Code. Although this list is not intended to be exhaustive, it is intended to serve as a reference source for those who use this Code.
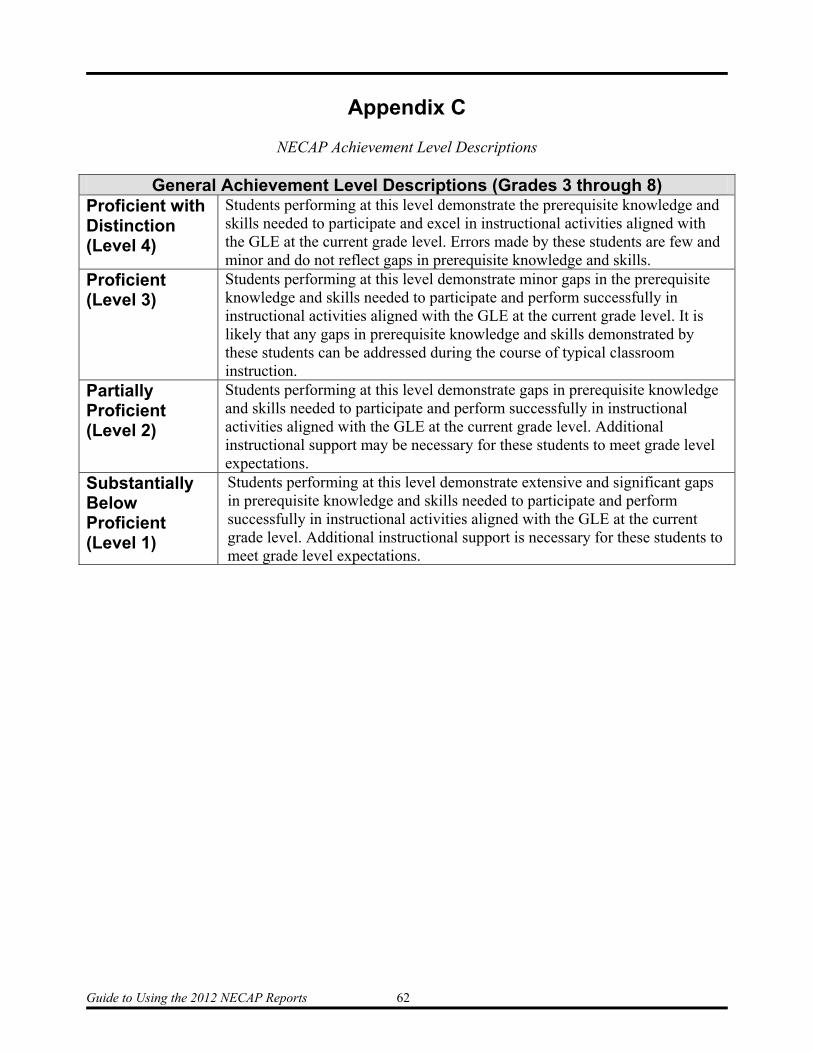
Guide to Using the 2012 NECAP Reports 62
Appendix C
NECAP Achievement Level Descriptions
General Achievement Level Descriptions (Grades 3 through 8) Proficient with Distinction (Level 4)
Students performing at this level demonstrate the prerequisite knowledge and skills needed to participate and excel in instructional activities aligned with the GLE at the current grade level. Errors made by these students are few and minor and do not reflect gaps in prerequisite knowledge and skills.
Proficient (Level 3)
Students performing at this level demonstrate minor gaps in the prerequisite knowledge and skills needed to participate and perform successfully in instructional activities aligned with the GLE at the current grade level. It is likely that any gaps in prerequisite knowledge and skills demonstrated by these students can be addressed during the course of typical classroom instruction.
Partially Proficient (Level 2)
Students performing at this level demonstrate gaps in prerequisite knowledge and skills needed to participate and perform successfully in instructional activities aligned with the GLE at the current grade level. Additional instructional support may be necessary for these students to meet grade level expectations.
Substantially Below Proficient (Level 1)
Students performing at this level demonstrate extensive and significant gaps in prerequisite knowledge and skills needed to participate and perform successfully in instructional activities aligned with the GLE at the current grade level. Additional instructional support is necessary for these students to meet grade level expectations.
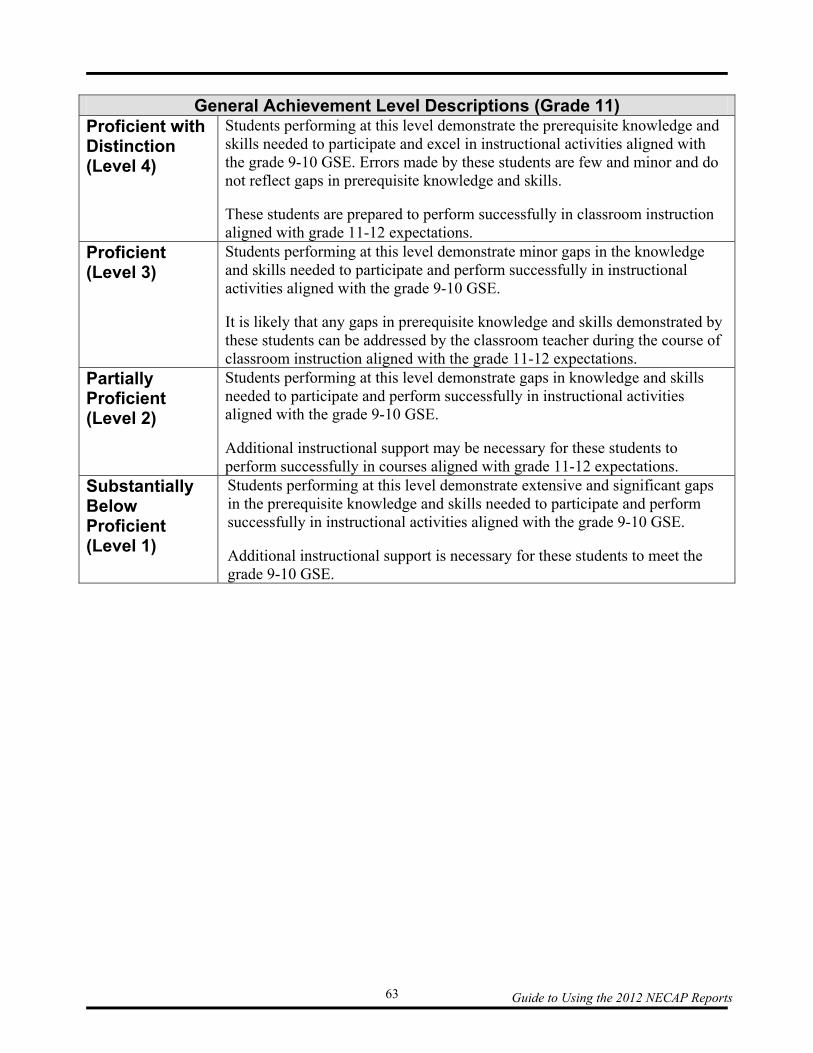
Guide to Using the 2012 NECAP Reports 63
General Achievement Level Descriptions (Grade 11)
Proficient with Distinction (Level 4)
Students performing at this level demonstrate the prerequisite knowledge and skills needed to participate and excel in instructional activities aligned with the grade 9-10 GSE. Errors made by these students are few and minor and do not reflect gaps in prerequisite knowledge and skills. These students are prepared to perform successfully in classroom instruction aligned with grade 11-12 expectations.
Proficient (Level 3)
Students performing at this level demonstrate minor gaps in the knowledge and skills needed to participate and perform successfully in instructional activities aligned with the grade 9-10 GSE. It is likely that any gaps in prerequisite knowledge and skills demonstrated by these students can be addressed by the classroom teacher during the course of classroom instruction aligned with the grade 11-12 expectations.
Partially Proficient (Level 2)
Students performing at this level demonstrate gaps in knowledge and skills needed to participate and perform successfully in instructional activities aligned with the grade 9-10 GSE. Additional instructional support may be necessary for these students to perform successfully in courses aligned with grade 11-12 expectations.
Substantially Below Proficient (Level 1)
Students performing at this level demonstrate extensive and significant gaps in the prerequisite knowledge and skills needed to participate and perform successfully in instructional activities aligned with the grade 9-10 GSE. Additional instructional support is necessary for these students to meet the grade 9-10 GSE.
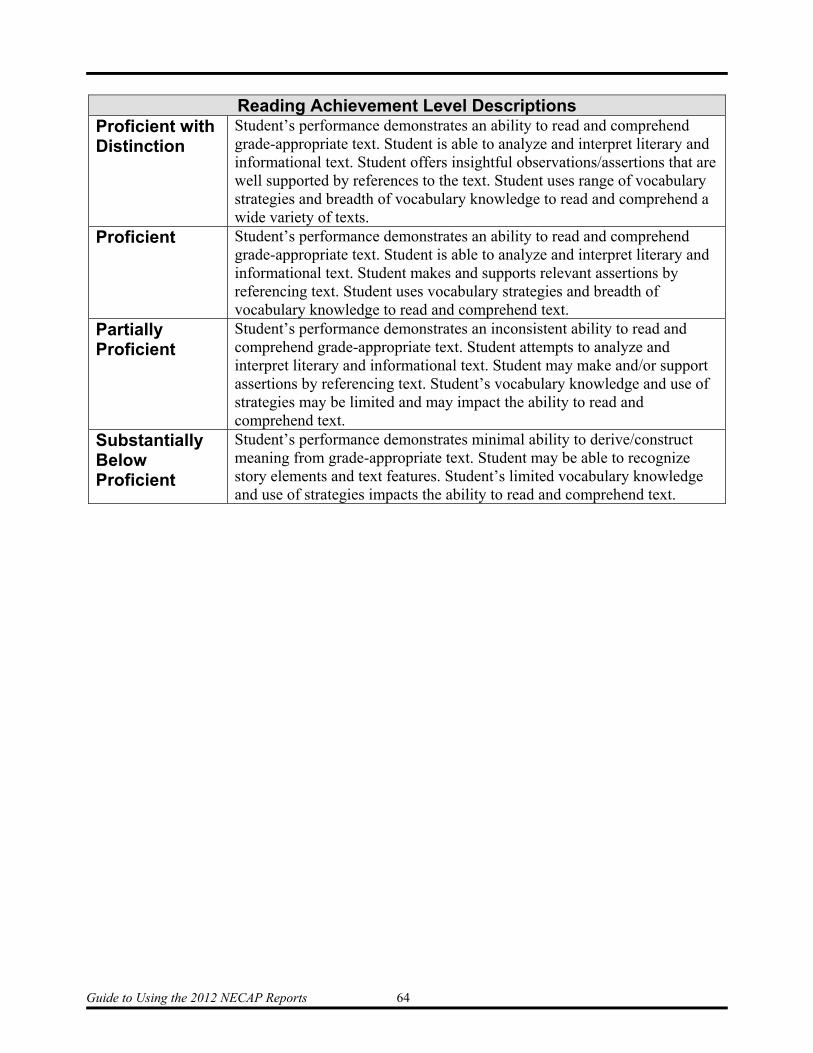
Guide to Using the 2012 NECAP Reports 64
Reading Achievement Level Descriptions
Proficient with Distinction
Student’s performance demonstrates an ability to read and comprehend grade-appropriate text. Student is able to analyze and interpret literary and informational text. Student offers insightful observations/assertions that are well supported by references to the text. Student uses range of vocabulary strategies and breadth of vocabulary knowledge to read and comprehend a wide variety of texts.
Proficient Student’s performance demonstrates an ability to read and comprehend grade-appropriate text. Student is able to analyze and interpret literary and informational text. Student makes and supports relevant assertions by referencing text. Student uses vocabulary strategies and breadth of vocabulary knowledge to read and comprehend text.
Partially Proficient
Student’s performance demonstrates an inconsistent ability to read and comprehend grade-appropriate text. Student attempts to analyze and interpret literary and informational text. Student may make and/or support assertions by referencing text. Student’s vocabulary knowledge and use of strategies may be limited and may impact the ability to read and comprehend text.
Substantially Below Proficient
Student’s performance demonstrates minimal ability to derive/construct meaning from grade-appropriate text. Student may be able to recognize story elements and text features. Student’s limited vocabulary knowledge and use of strategies impacts the ability to read and comprehend text.
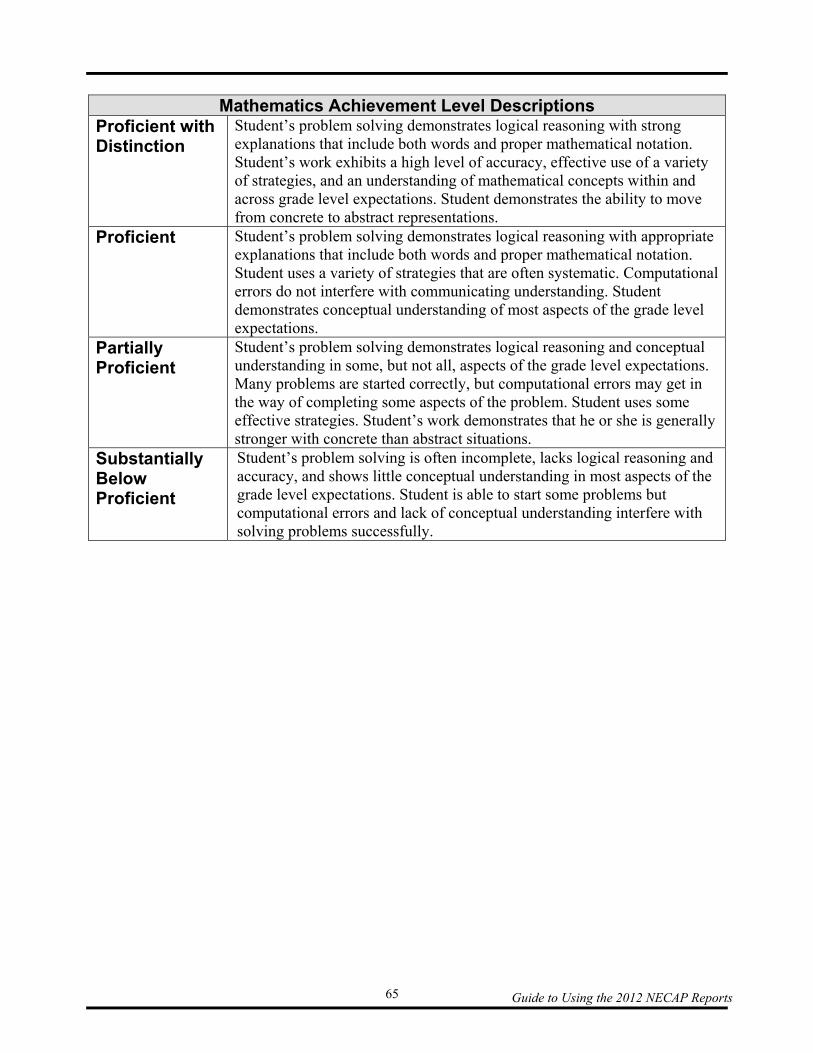
Guide to Using the 2012 NECAP Reports 65
Mathematics Achievement Level Descriptions
Proficient with Distinction
Student’s problem solving demonstrates logical reasoning with strong explanations that include both words and proper mathematical notation. Student’s work exhibits a high level of accuracy, effective use of a variety of strategies, and an understanding of mathematical concepts within and across grade level expectations. Student demonstrates the ability to move from concrete to abstract representations.
Proficient Student’s problem solving demonstrates logical reasoning with appropriate explanations that include both words and proper mathematical notation. Student uses a variety of strategies that are often systematic. Computational errors do not interfere with communicating understanding. Student demonstrates conceptual understanding of most aspects of the grade level expectations.
Partially Proficient
Student’s problem solving demonstrates logical reasoning and conceptual understanding in some, but not all, aspects of the grade level expectations. Many problems are started correctly, but computational errors may get in the way of completing some aspects of the problem. Student uses some effective strategies. Student’s work demonstrates that he or she is generally stronger with concrete than abstract situations.
Substantially Below Proficient
Student’s problem solving is often incomplete, lacks logical reasoning and accuracy, and shows little conceptual understanding in most aspects of the grade level expectations. Student is able to start some problems but computational errors and lack of conceptual understanding interfere with solving problems successfully.
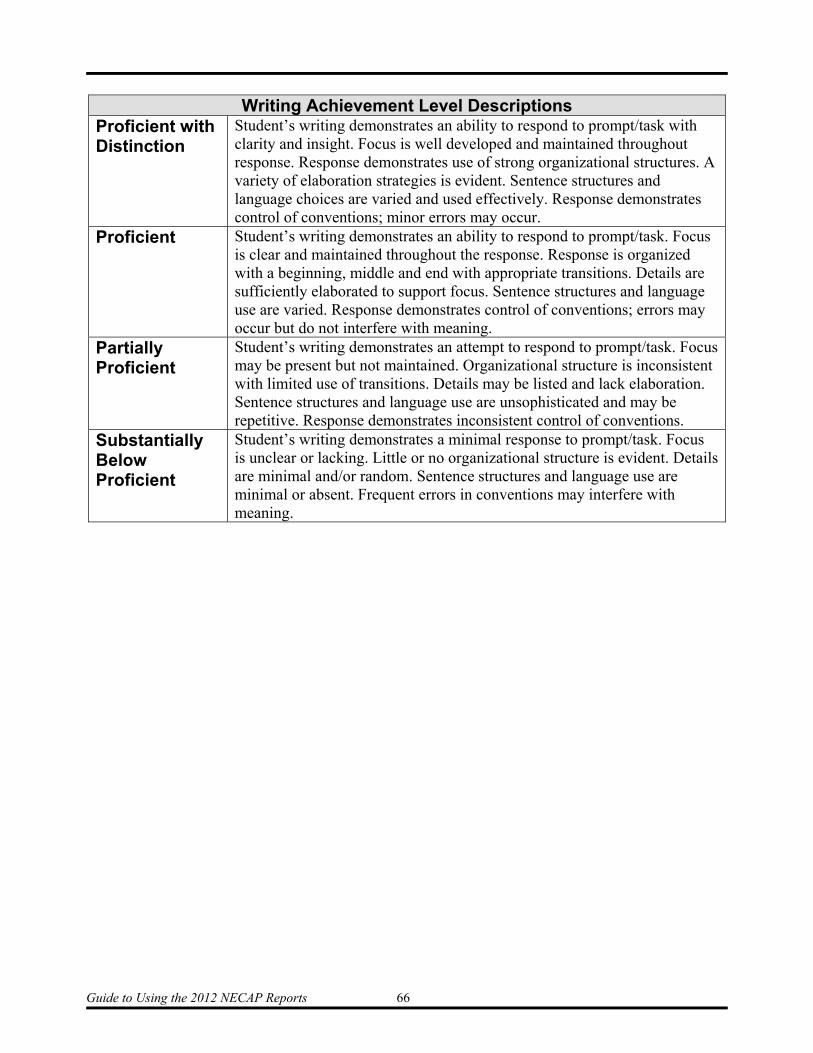
Guide to Using the 2012 NECAP Reports 66
Writing Achievement Level Descriptions
Proficient with Distinction
Student’s writing demonstrates an ability to respond to prompt/task with clarity and insight. Focus is well developed and maintained throughout response. Response demonstrates use of strong organizational structures. A variety of elaboration strategies is evident. Sentence structures and language choices are varied and used effectively. Response demonstrates control of conventions; minor errors may occur.
Proficient Student’s writing demonstrates an ability to respond to prompt/task. Focus is clear and maintained throughout the response. Response is organized with a beginning, middle and end with appropriate transitions. Details are sufficiently elaborated to support focus. Sentence structures and language use are varied. Response demonstrates control of conventions; errors may occur but do not interfere with meaning.
Partially Proficient
Student’s writing demonstrates an attempt to respond to prompt/task. Focus may be present but not maintained. Organizational structure is inconsistent with limited use of transitions. Details may be listed and lack elaboration. Sentence structures and language use are unsophisticated and may be repetitive. Response demonstrates inconsistent control of conventions.
Substantially Below Proficient
Student’s writing demonstrates a minimal response to prompt/task. Focus is unclear or lacking. Little or no organizational structure is evident. Details are minimal and/or random. Sentence structures and language use are minimal or absent. Frequent errors in conventions may interfere with meaning.
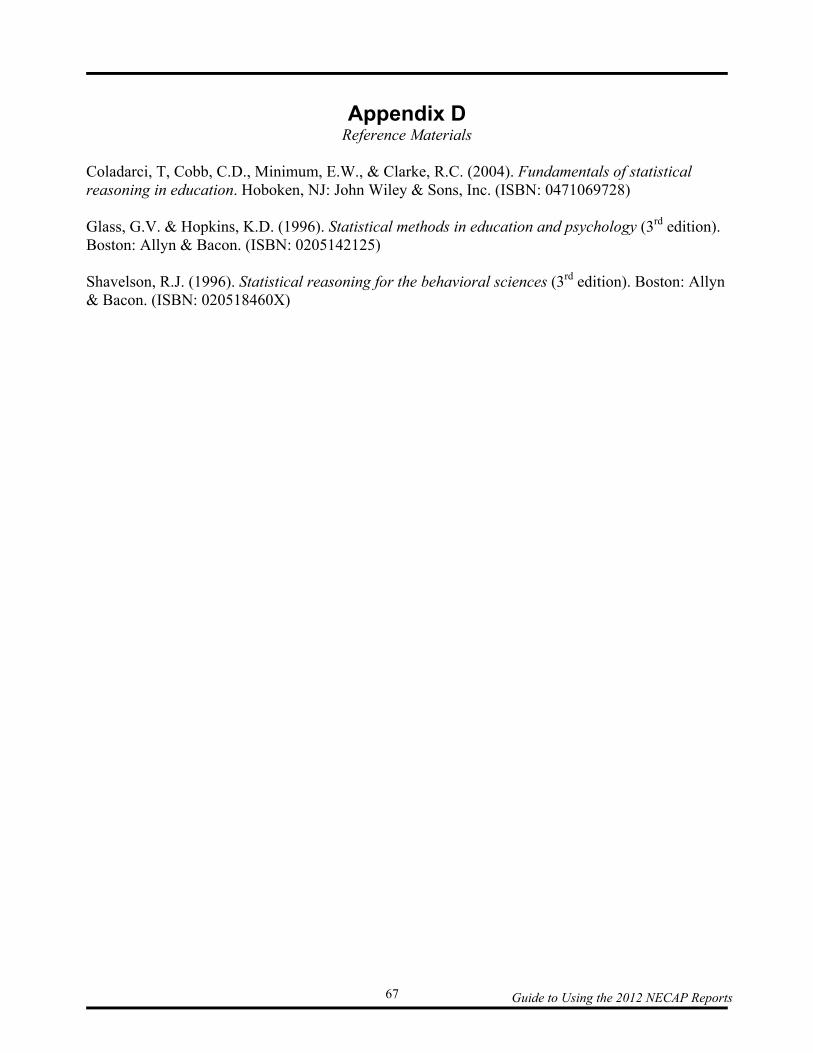
Guide to Using the 2012 NECAP Reports 67
Appendix D
Reference Materials
Coladarci, T, Cobb, C.D., Minimum, E.W., & Clarke, R.C. (2004). Fundamentals of statistical reasoning in education. Hoboken, NJ: John Wiley & Sons, Inc. (ISBN: 0471069728) Glass, G.V. & Hopkins, K.D. (1996). Statistical methods in education and psychology (3rd edition). Boston: Allyn & Bacon. (ISBN: 0205142125) Shavelson, R.J. (1996). Statistical reasoning for the behavioral sciences (3rd edition). Boston: Allyn & Bacon. (ISBN: 020518460X)