Embed Size (px)
Citation preview
Using the 2007 NECAP Reports
February, 2008
New England Common Assessment Program
2
Mary Ann Snider
Director of Assessment & Accountability
RI Department of Education
Welcome and Introductions
3
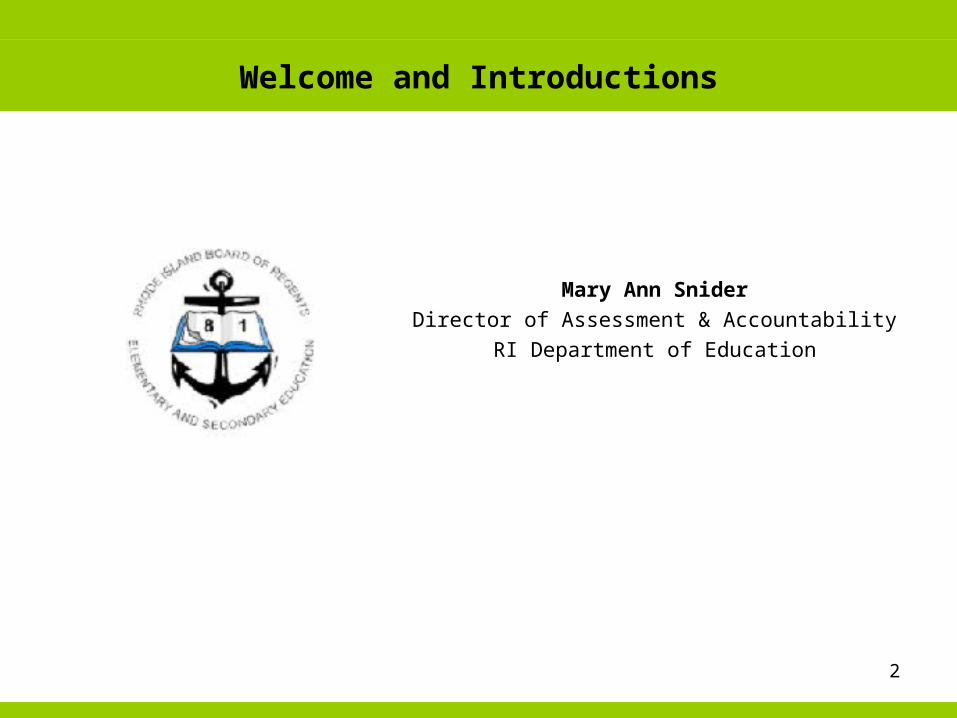
NECAP Service Center: 1-877-632-7774
Tim Crockett
Assistant Vice-President
1-800-431-8901 x2106
Harold Stephens
NECAP Program Director
1-800-431-8901 x2235
Amanda Smith
NECAP Program Manager
1-800-431-8901 x2259
Elliot Scharff
NECAP Program Manager – Science
1-800-431-8901 x2126
Josh Evans
NECAP Program Manager
1-800-431-8901 x2244
Tina Haley
NECAP Program Assistant
1-800-431-8901 x2427
Jennifer Varney
NECAP Program Assistant
1-800-431-8901 x2115
Mellicent Friddell
NECAP Program Assistant
1-800-431-8901 x2355
Welcome and Introductions
4
Guide to Using the 2007 NECAP Reports
5
Purpose of the Workshop
• Review the different types of NECAP reports
• Discuss effective ways to analyze and interpret results data
• Provide schools and districts an opportunity to share how they have analyzed results data
6
Involvement of Local Educators
• Development of Grade Level Expectations• Test item review committees• Bias and sensitivity review committees• Classroom teacher judgment data• Standard setting panelists• Technical Advisory Committee
7
FERPA
• The Family Educational Rights and Privacy Act (FERPA)
• Access to individual student results is restricted to:o the studento the student’s parents/guardianso authorized school personnel
• Superintendents and principals are responsible for maintaining the privacy and security of all student records.
• Authorized school personnel shall have access to the records of students to whom they are providing services when such access is required in the performance of their official duties.
• FERPA website: http://www.ed.gov/policy/gen/guid/fpco/ferpa/index.html
8
Types of NECAP Reports
• Student Report
• Item Analysis Report
• Results Report
• Summary Report
• Student Level Data Files
9
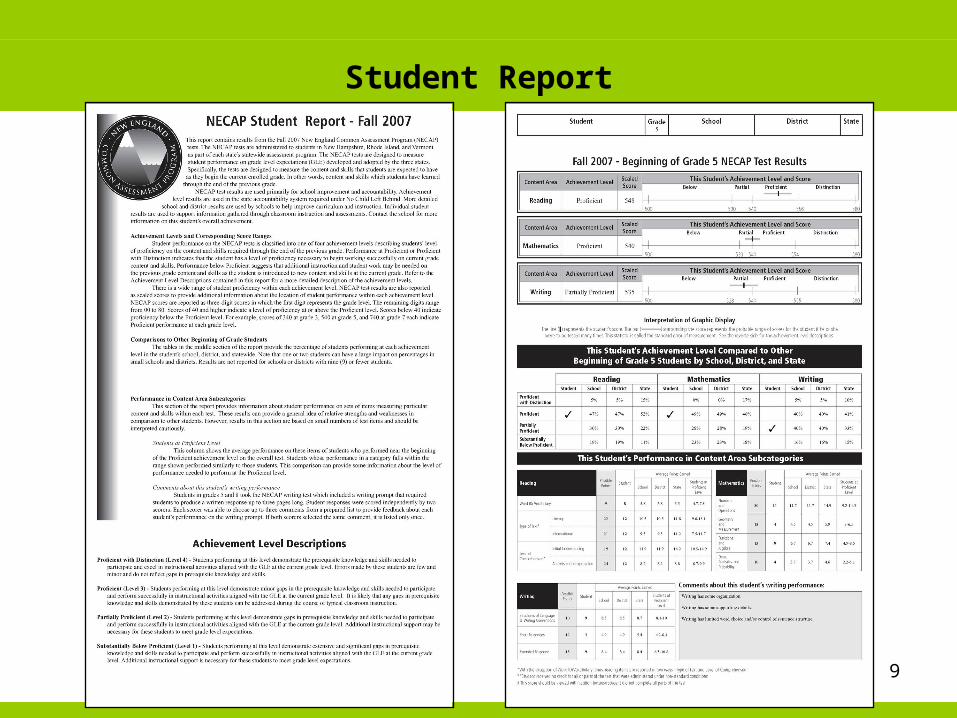
Student Report
10
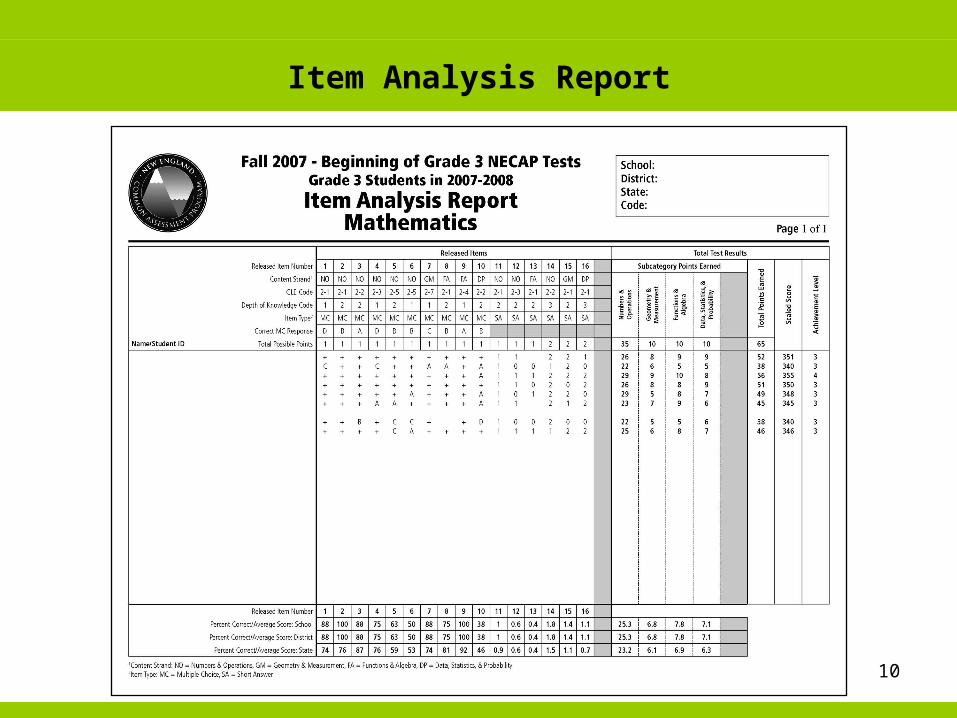
Item Analysis Report
11
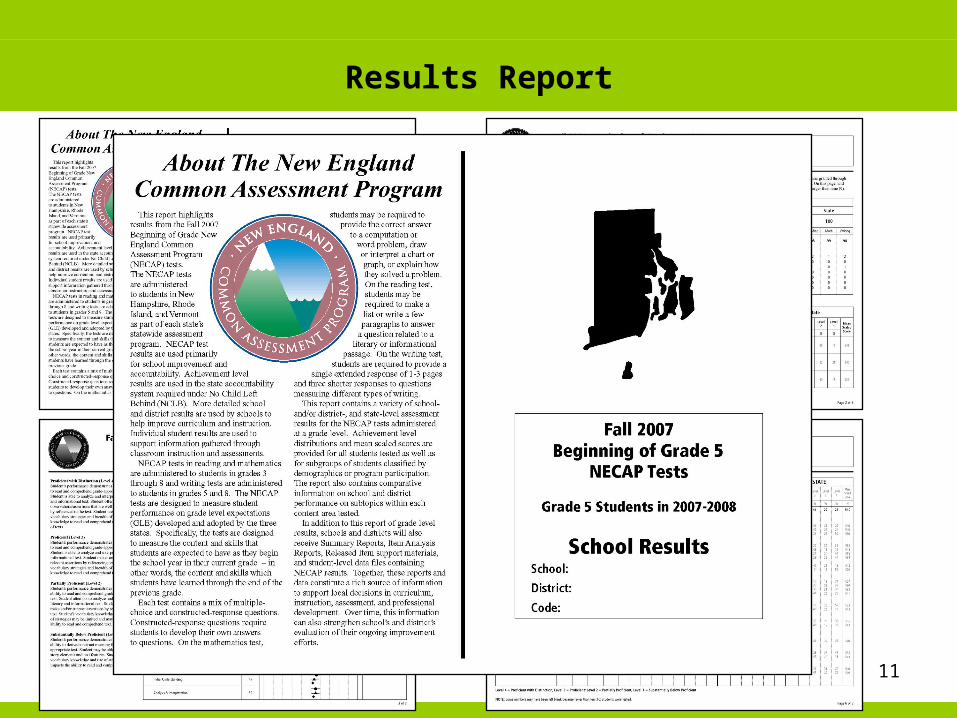
Results Report
12
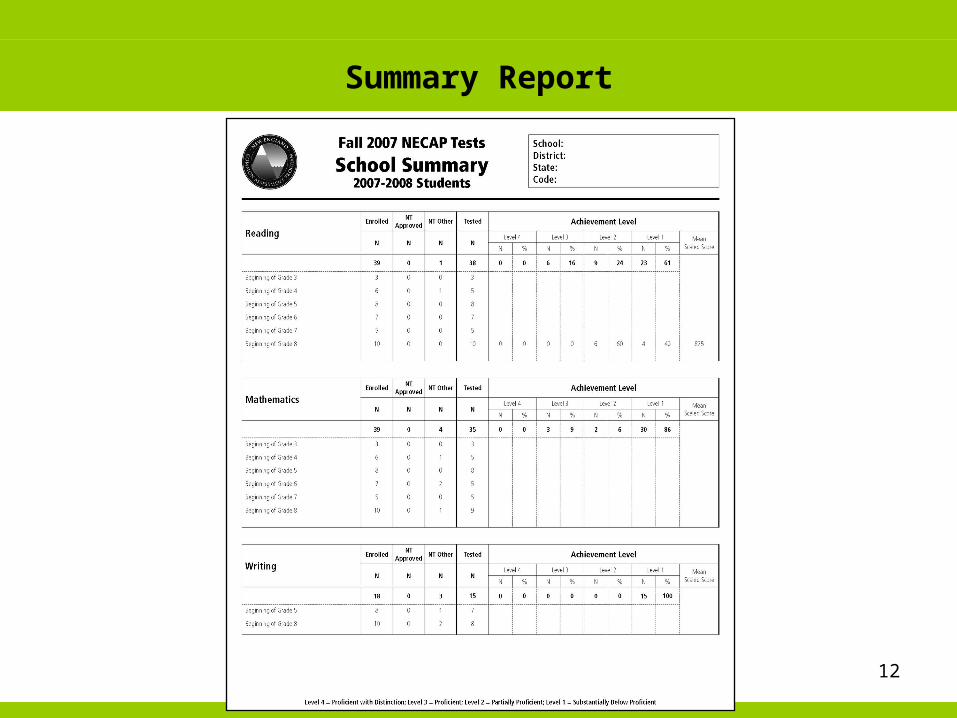
Summary Report
13
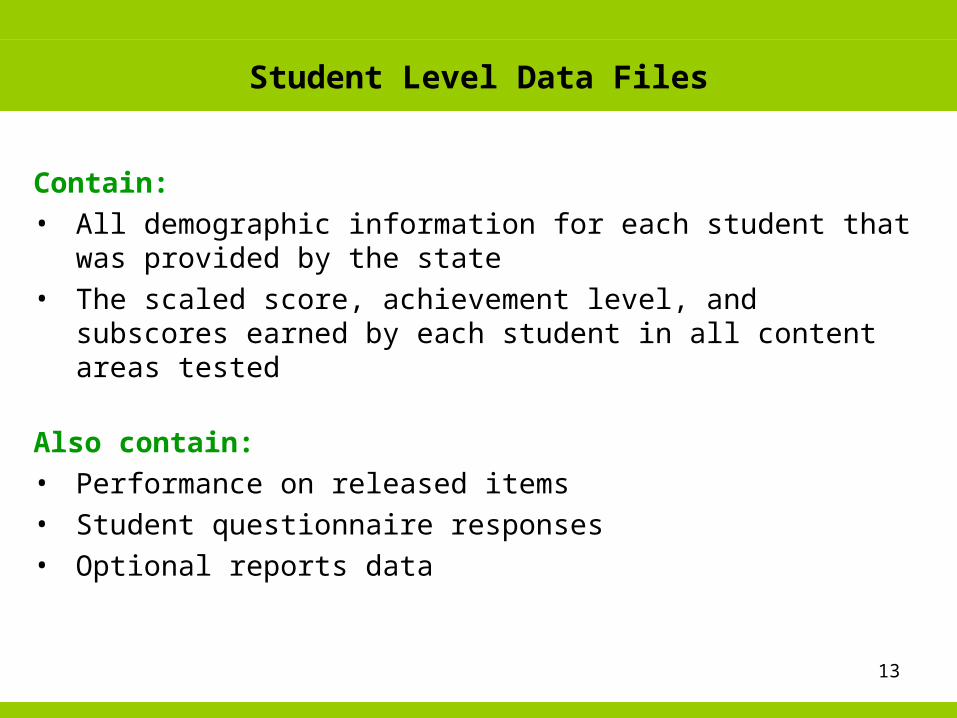
Student Level Data Files
Contain:• All demographic information for each student that was
provided by the state• The scaled score, achievement level, and subscores
earned by each student in all content areas tested
Also contain:• Performance on released items• Student questionnaire responses• Optional reports data
14
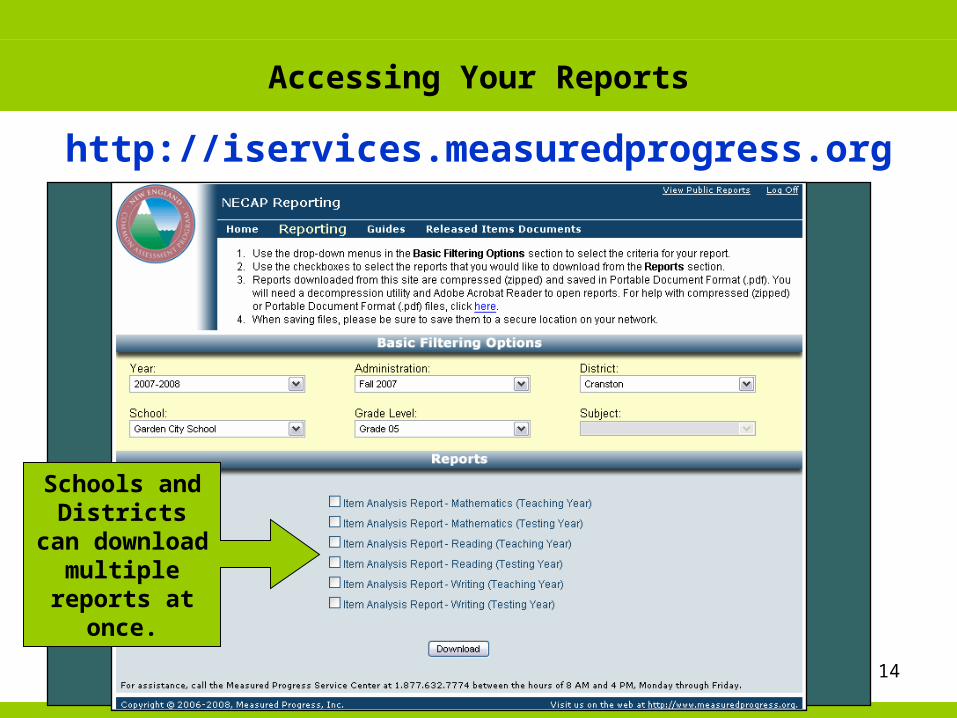
Accessing Your Reports
http://iservices.measuredprogress.org
Schools and Districts can
download multiple
reports at once.
15
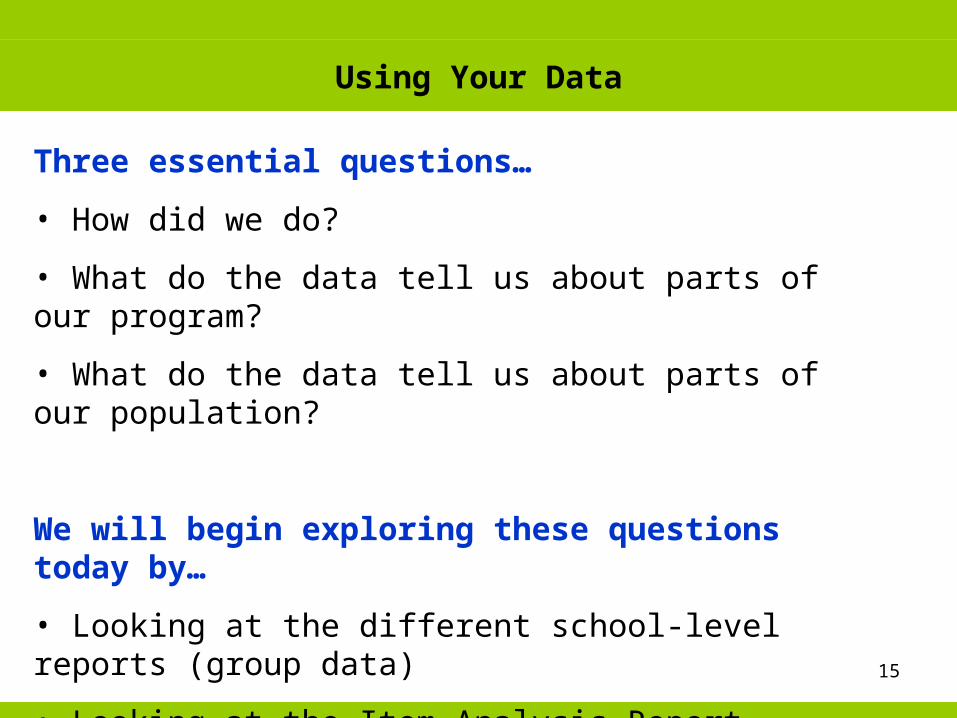
Using Your Data
Three essential questions…
• How did we do?
• What do the data tell us about parts of our program?
• What do the data tell us about parts of our population?
We will begin exploring these questions today by…
• Looking at the different school-level reports (group data)
• Looking at the Item Analysis Report (primarily individual student data)
16
Essential Question #1 for Interpreting School Status
How did we do?
…compared to the district
…compared to the state
…compared to our own history (both total school and grade/cohort group)
…compared to what we would have predicted knowing our school’s programs and students
Question #1
17
Essential Question #2 for Interpreting School Status
What do the data tell us about parts of our program
How did we perform across the content areas?
How did we perform in the various sub-content areas?
What does the Item Analysis Report tell us about sub-content areas?
How did our sub-content area and item-level performance compare to the district and state?
Question #2
18
Essential Question #3 for Interpreting School Status
What do the data tell us about parts of our population?
How did the various sub-groups perform relative to:a. the district?b. the state?c. the same sub-groups last year?d. what we would have predicted knowing the population?
How do the percentages of students in the various sub-groups compare to the district and state?
What does the questionnaire data tell us about the sub-populations?
Question #3
19
Before You Go Any Further…
What questions will you answer and for what audiences?
• Based on what you know about your school’s programs and students, and how they have changed, what do you expect to see? (For example, how would a specific year’s 5th graders perform relative to 5th graders from previous years?)
• What processes will you use to look at your reports?
• Will you look at teaching year or testing year reports?
• Who should participate in the discussions?
• How should you group the participants?
20
Looking at the data
There are many ways to look at reports…
In order to simplify this presentation, we will only show one of the processes you might use.
21
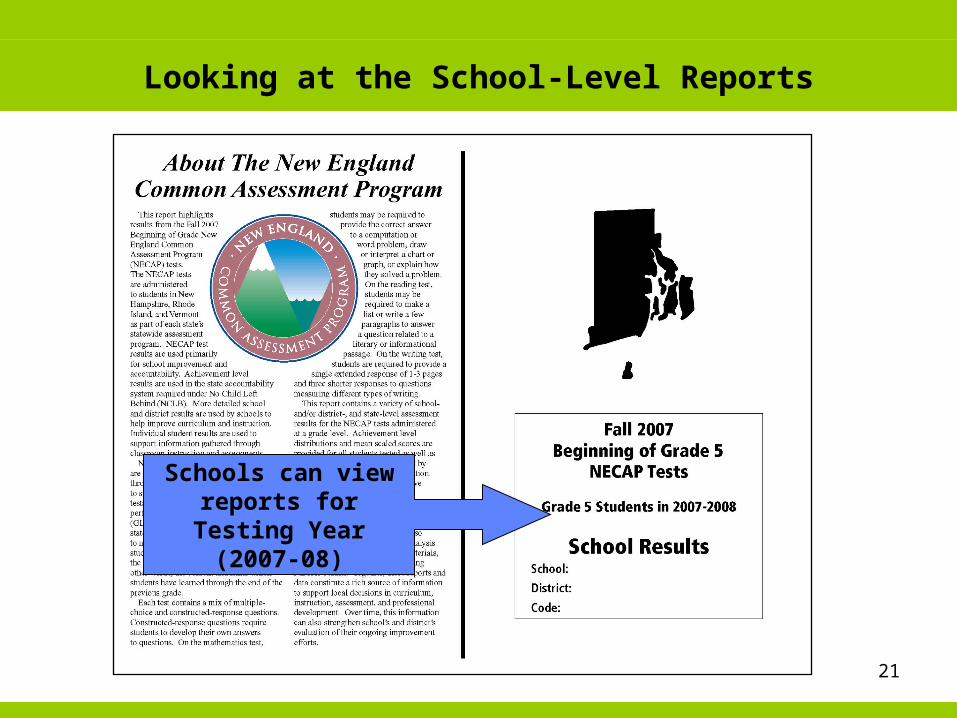
Looking at the School-Level Reports
Schools can view reports for Testing
Year (2007-08)
22
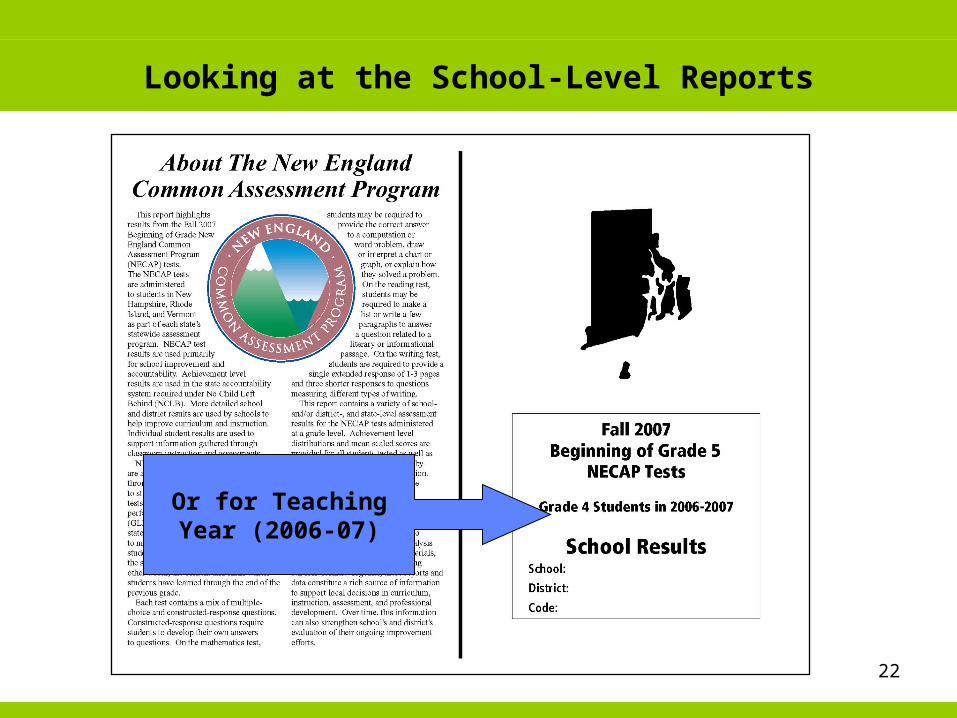
Looking at the School-Level Reports
Or for Teaching Year (2006-07)
23
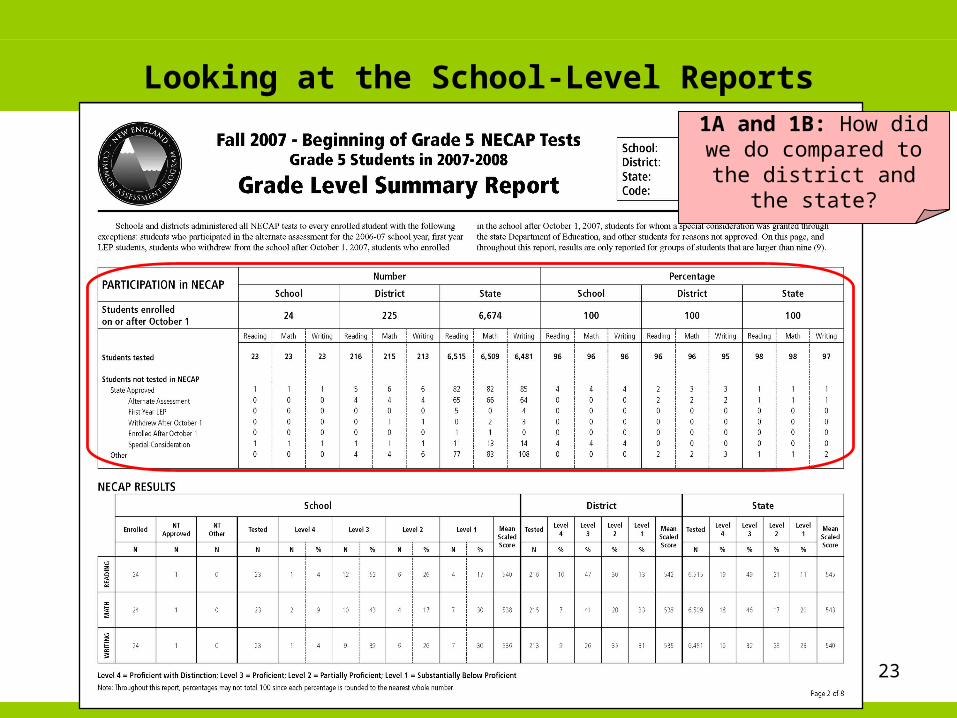
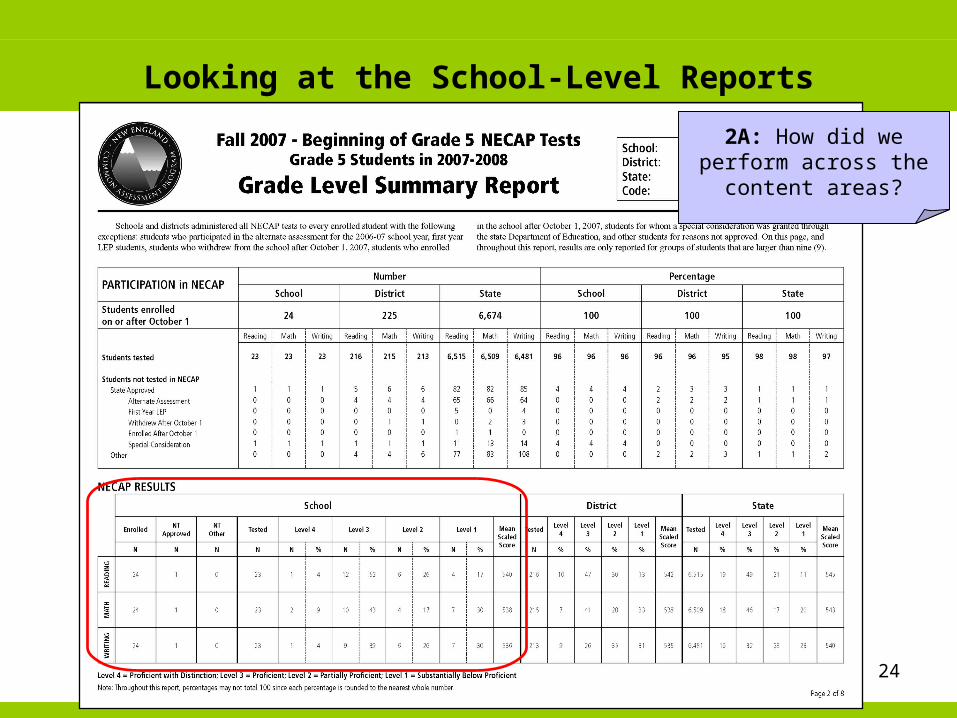
Looking at the School-Level Reports
1A and 1B: How did we do compared to the district
and the state?
24
Looking at the School-Level Reports
2A: How did we perform across the content areas?
25
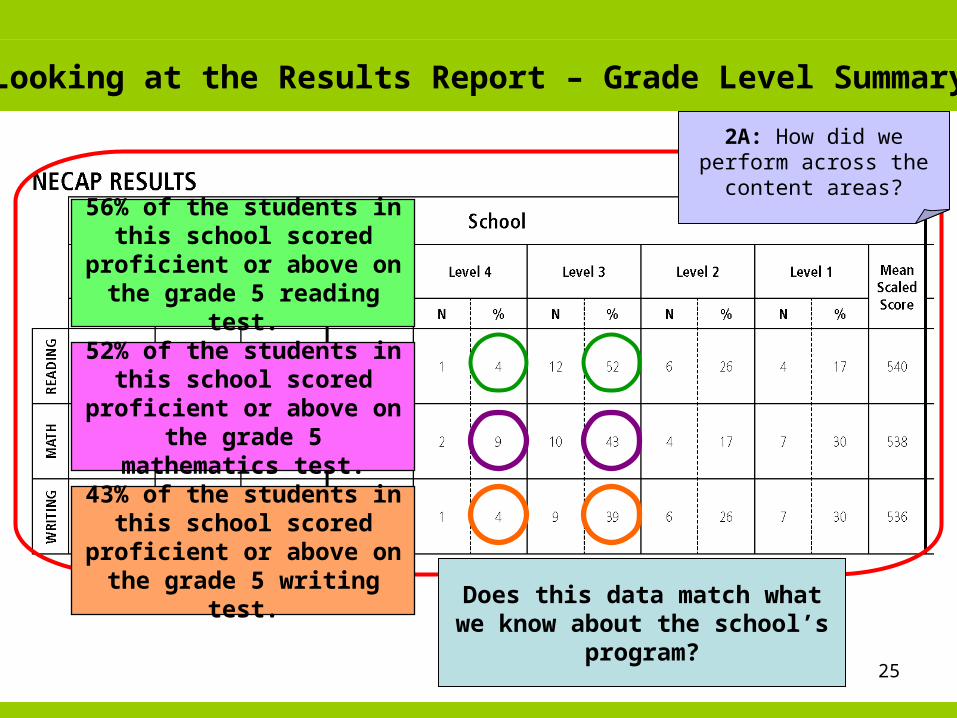
Looking at the Results Report – Grade Level Summary
56% of the students in this school scored proficient or
above on the grade 5 reading test.
52% of the students in this school scored proficient or
above on the grade 5 mathematics test.
43% of the students in this school scored proficient or
above on the grade 5 writing test. Does this data match what we
know about the school’s program?
2A: How did we perform across the content areas?
26
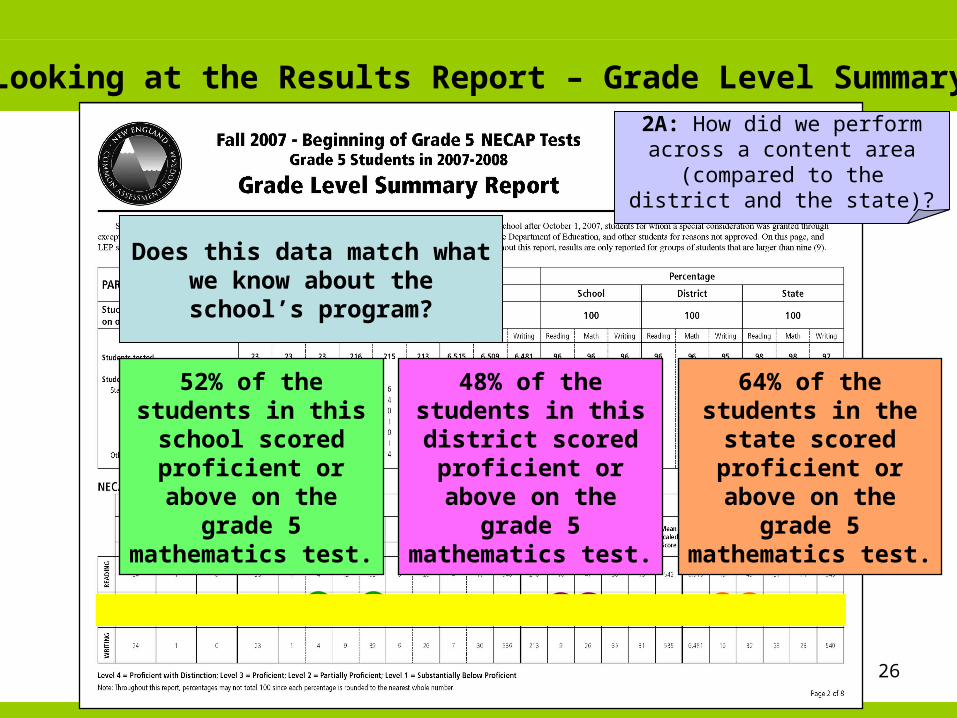
Looking at the Results Report – Grade Level Summary
52% of the students in this school scored proficient or above
on the grade 5 mathematics test.
48% of the students in this district scored
proficient or above on the grade 5
mathematics test.
64% of the students in the state scored proficient or above
on the grade 5 mathematics test.
Does this data match what we know about the school’s
program?
2A: How did we perform across a content area (compared to the
district and the state)?
27
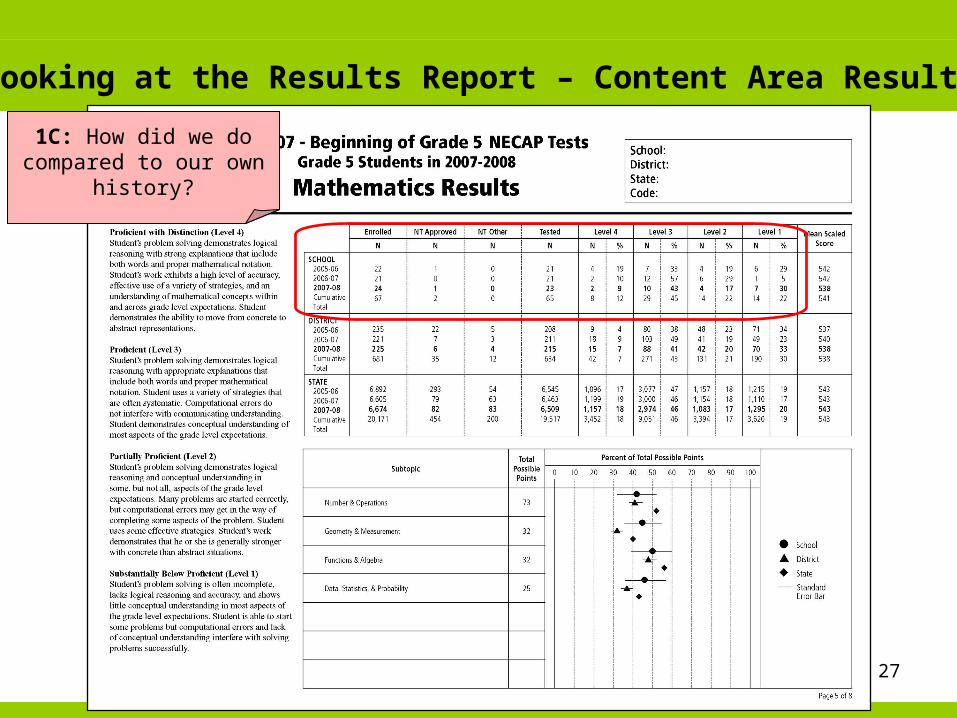
Looking at the Results Report – Content Area Results
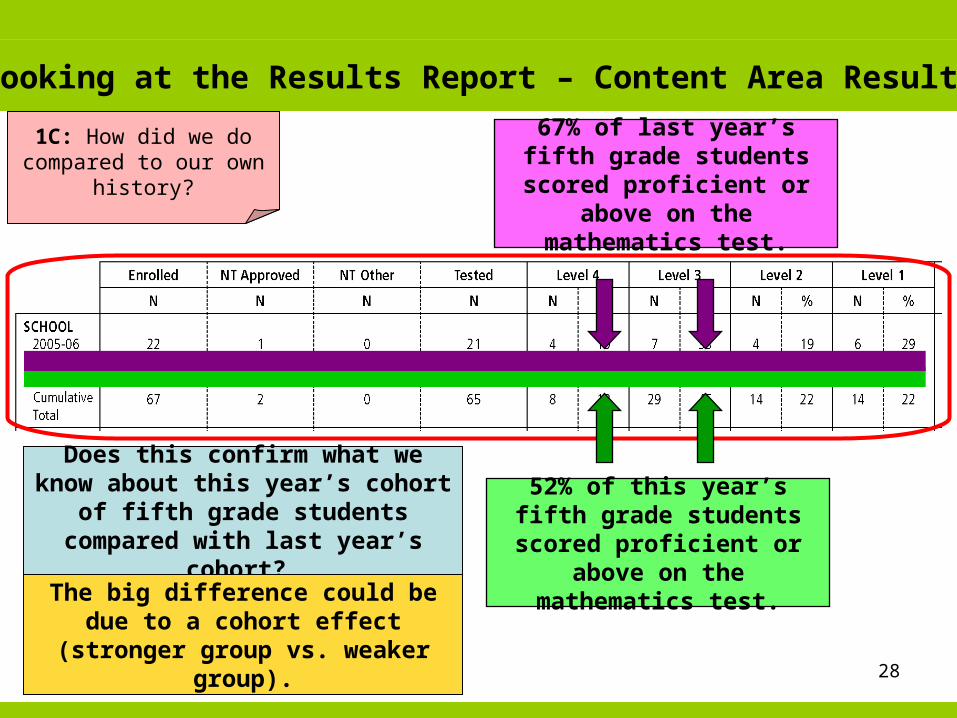
1C: How did we do compared to our own
history?
28
Looking at the Results Report – Content Area Results
52% of this year’s fifth grade students scored
proficient or above on the mathematics test.
Does this confirm what we know about this year’s cohort of fifth
grade students compared with last year’s cohort?
The big difference could be due to a cohort effect (stronger group vs.
weaker group).
67% of last year’s fifth grade students scored
proficient or above on the mathematics test.
1C: How did we do compared to our own
history?
29
Looking at the Results Report – Content Area Results
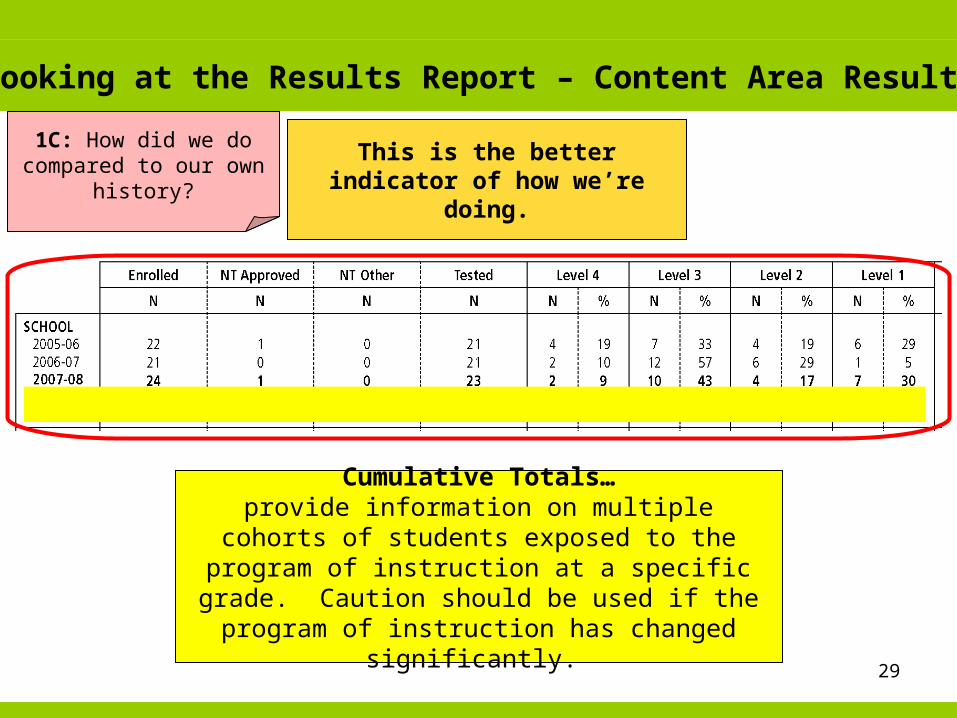
Cumulative Totals…provide information on multiple cohorts of students exposed to the program of instruction at a specific grade. Caution should be used if the program of
instruction has changed significantly.
This is the better indicator of how we’re doing.
1C: How did we do compared to our own
history?
30
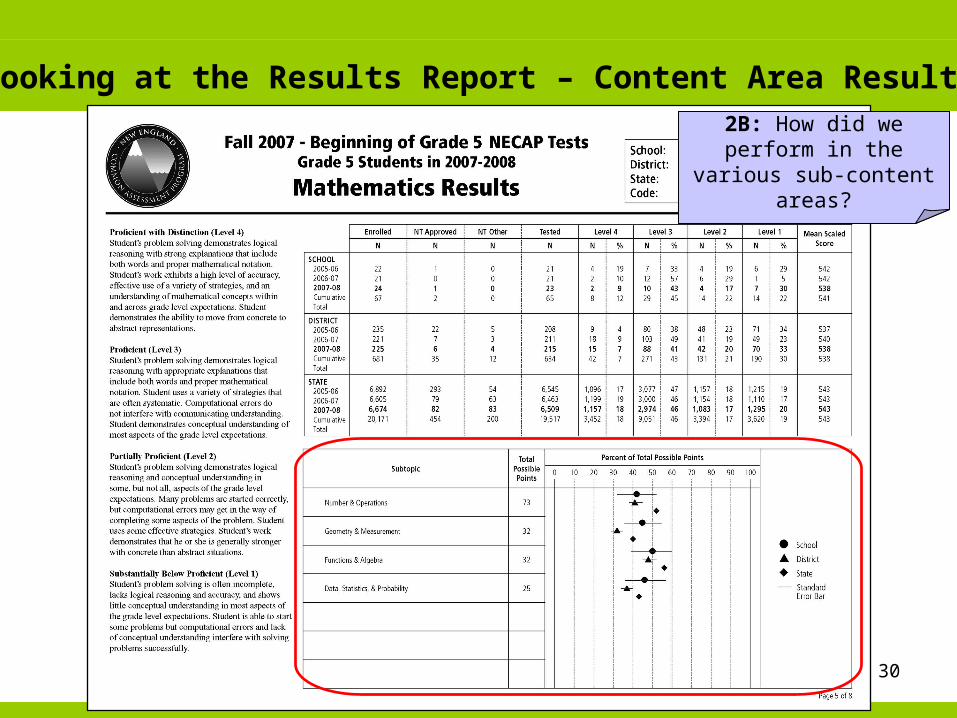
Looking at the Results Report – Content Area Results
2B: How did we perform in the various sub-content
areas?
31
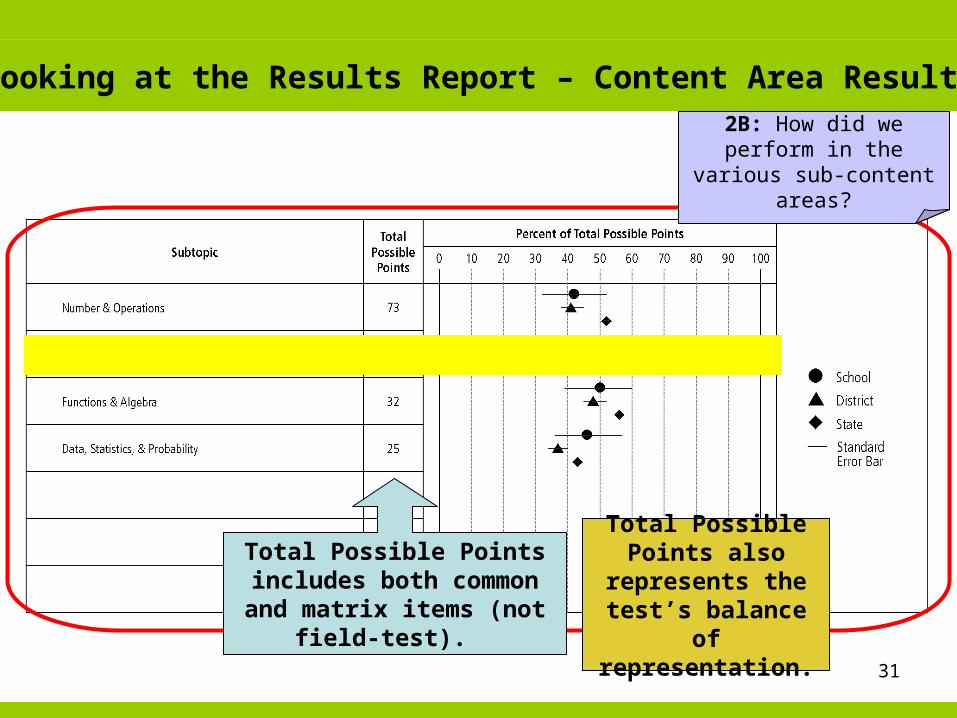
Looking at the Results Report – Content Area Results
Total Possible Points includes both common and matrix items (not field-test).
2B: How did we perform in the various sub-content
areas?
Total Possible Points also
represents the test’s balance of representation.
32
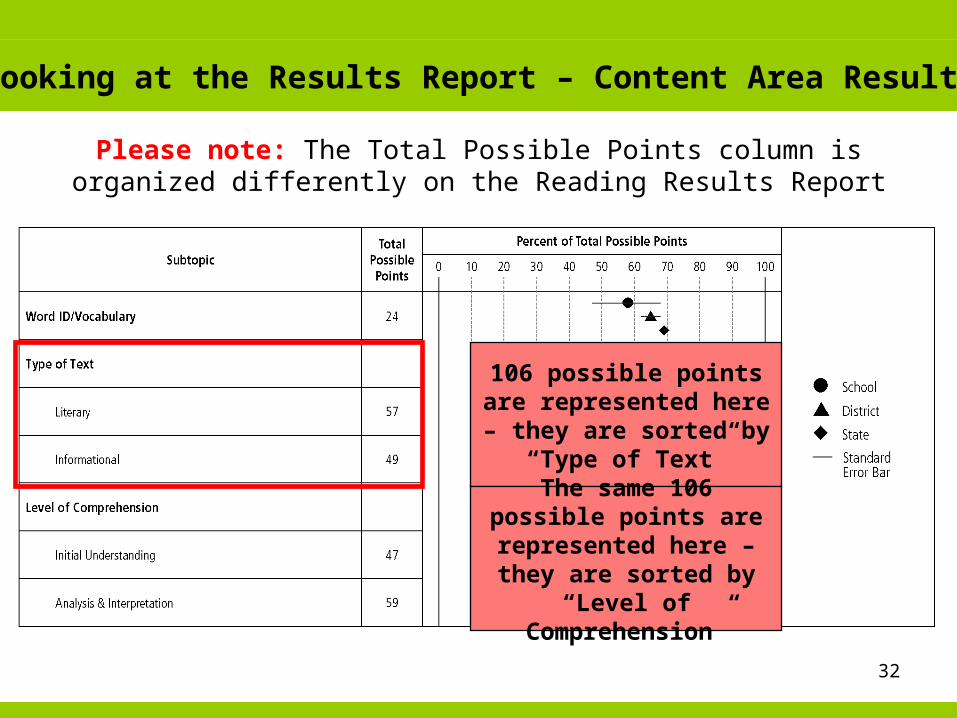
Looking at the Results Report – Content Area Results
Please note: The Total Possible Points column is organized differently on the Reading Results Report
106 possible points are represented here – they are sorted by “Type of
Text”
The same 106 possible points are represented
here – they are sorted by “Level of
Comprehension”
33
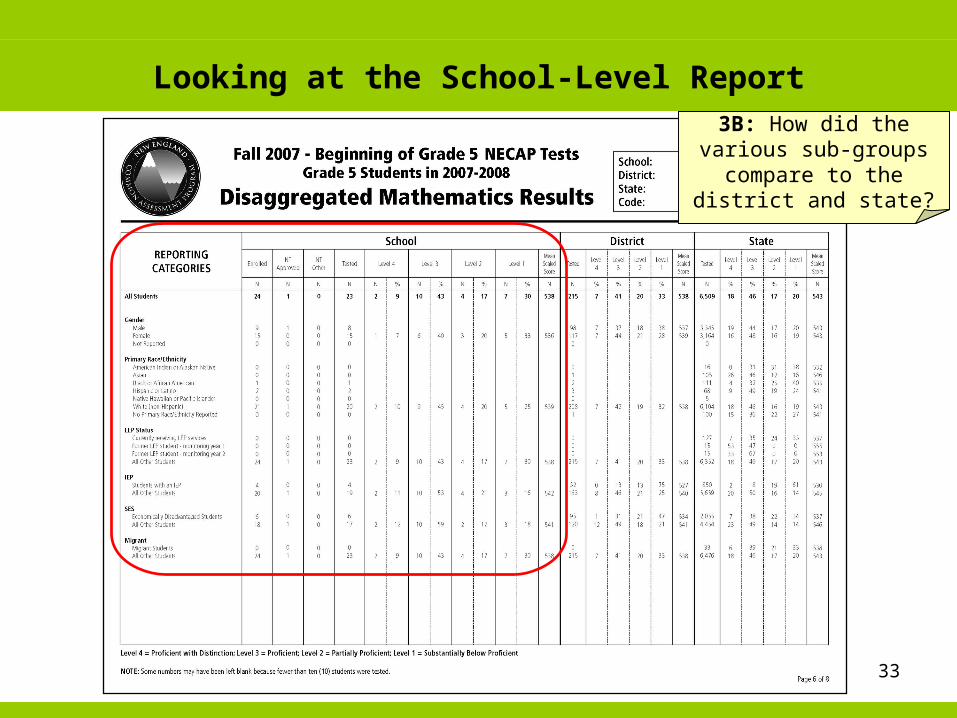
Looking at the School-Level Report
3B: How did the various sub-groups compare to the district and state?
34
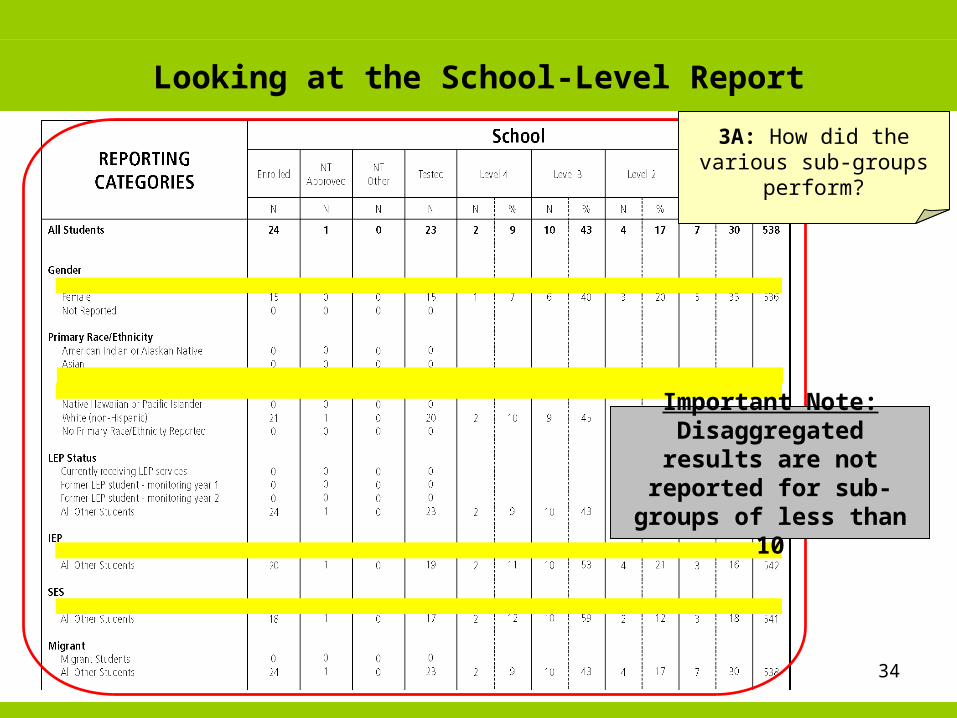
Looking at the School-Level Report
3A: How did the various sub-groups perform?
Important Note: Disaggregated results are
not reported for sub-groups of less than 10
35
Because this is a small school, and
so many of the sub-groups are smaller than 10, this part of the report is not as
useful.
But we can still look at district and state disaggregated results.
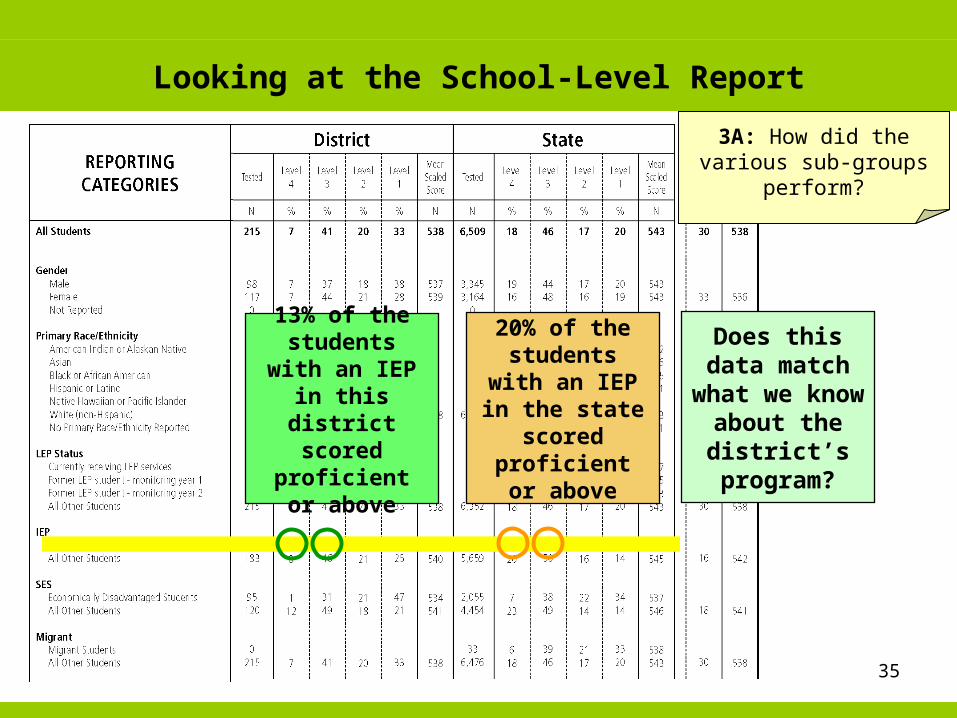
Looking at the School-Level Report
3A: How did the various sub-groups perform?
13% of the students with an IEP in this
district scored proficient or
above
20% of the students with an IEP in the state scored proficient or
above
Does this data match what we
know about the district’s
program?
36
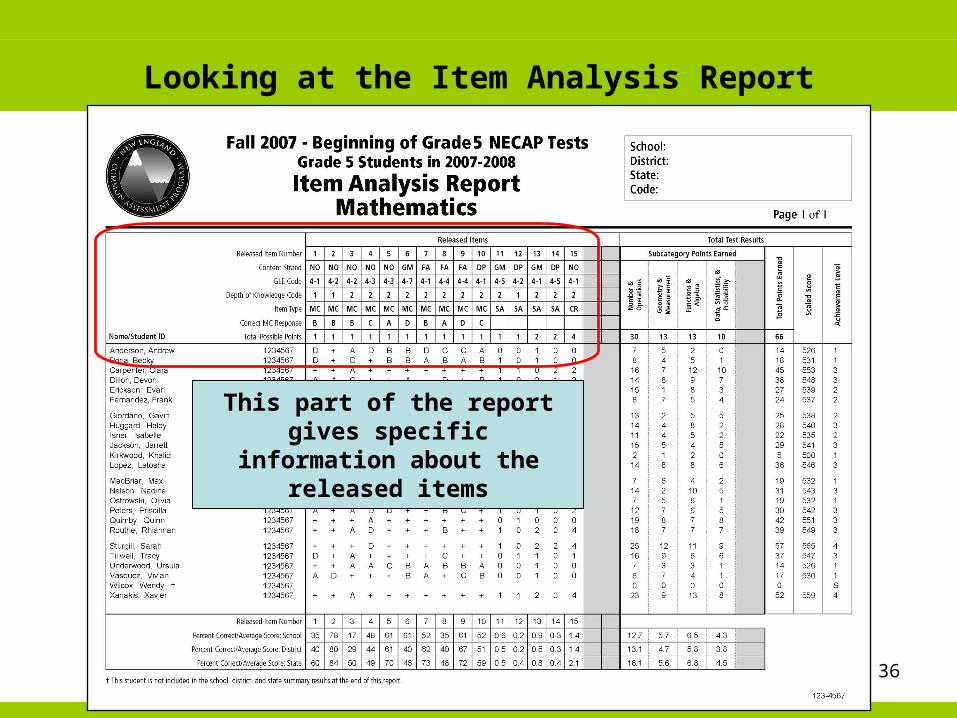
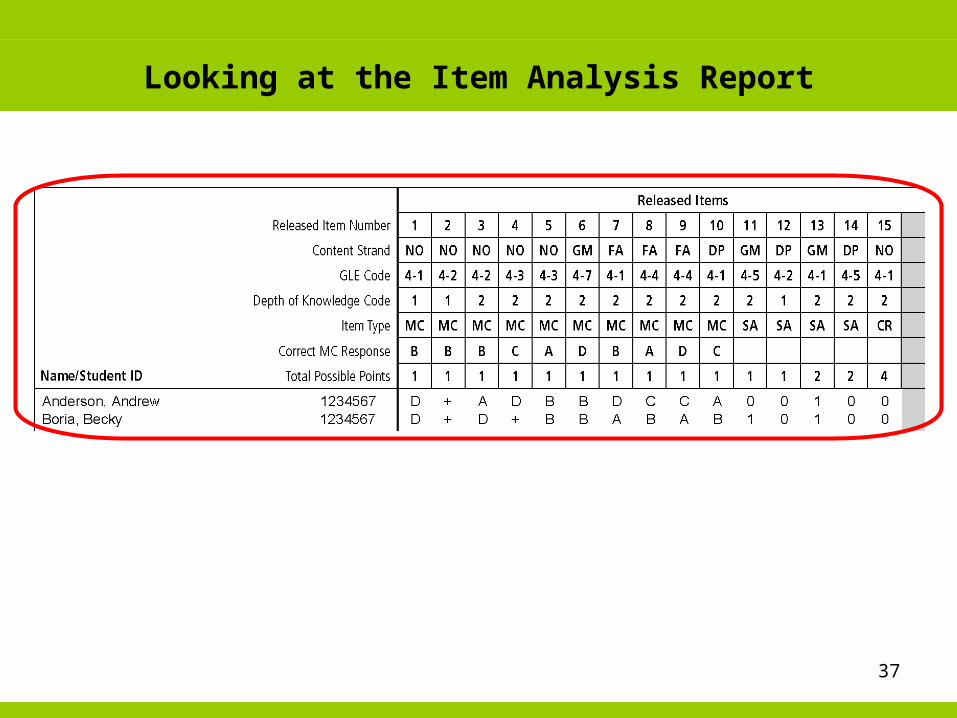
Looking at the Item Analysis Report
This part of the report gives specific information about the
released items
37
Looking at the Item Analysis Report
38
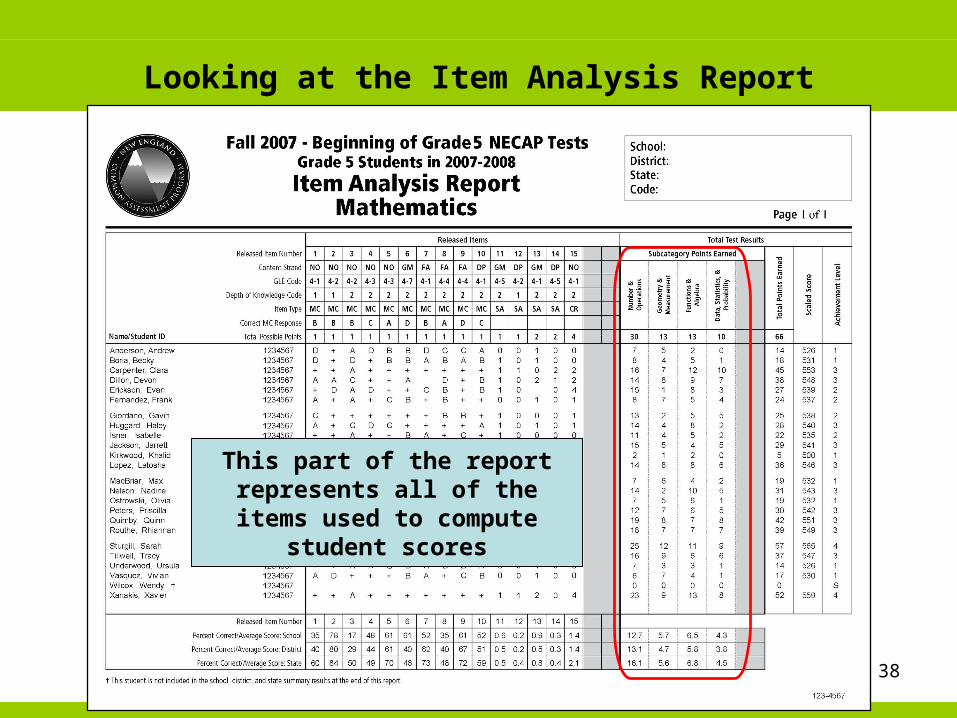
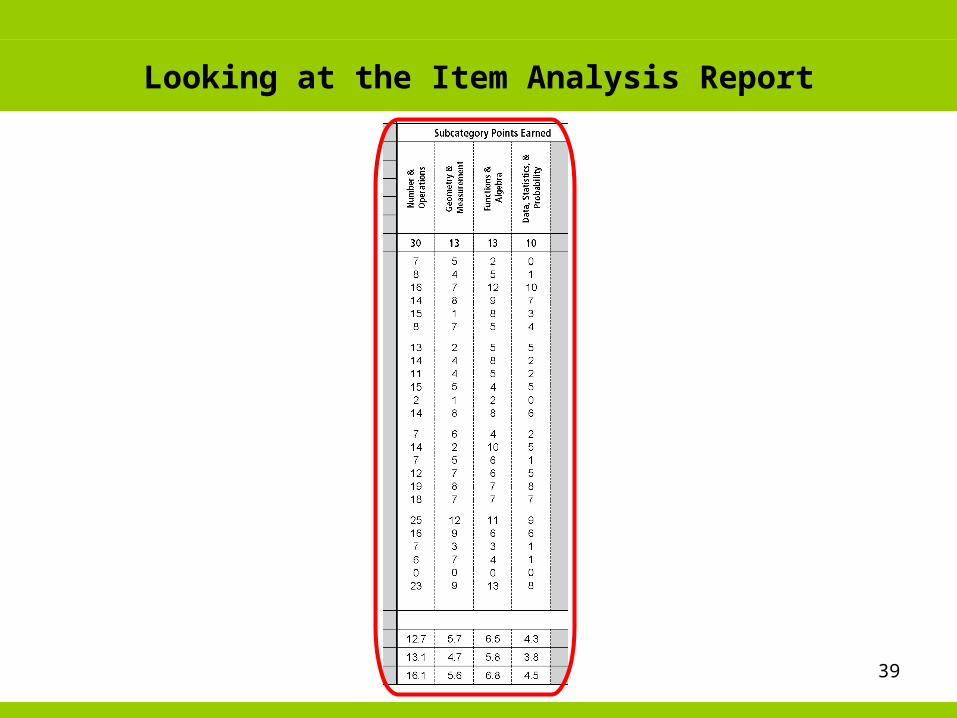
Looking at the Item Analysis Report
This part of the report represents all of the items used
to compute student scores
39
Looking at the Item Analysis Report
40
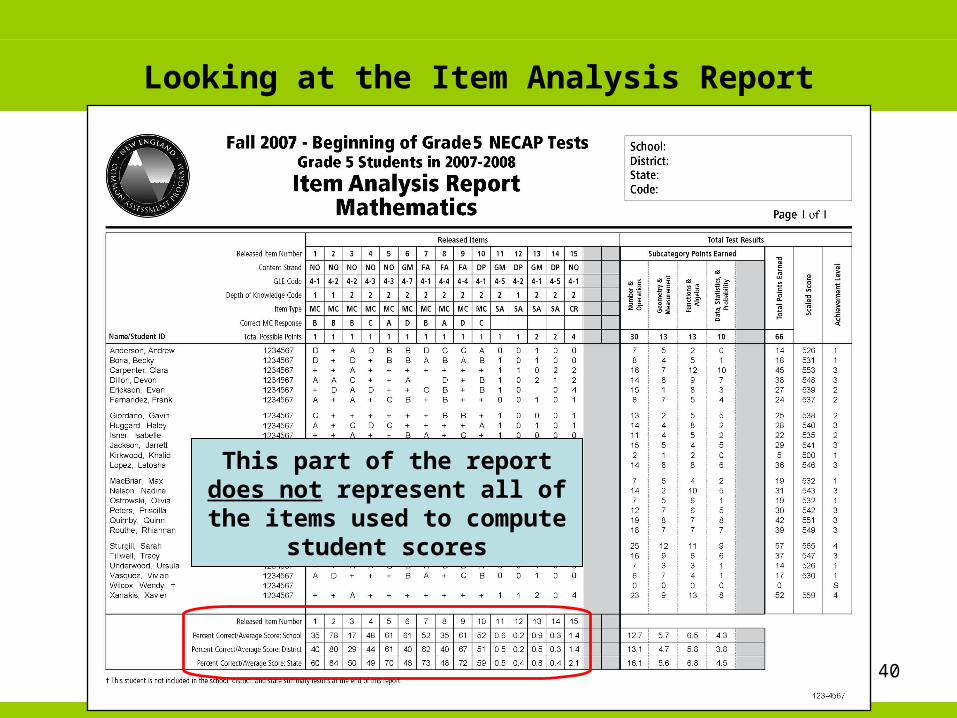
Looking at the Item Analysis Report
This part of the report does not represent all of the items used
to compute student scores
41
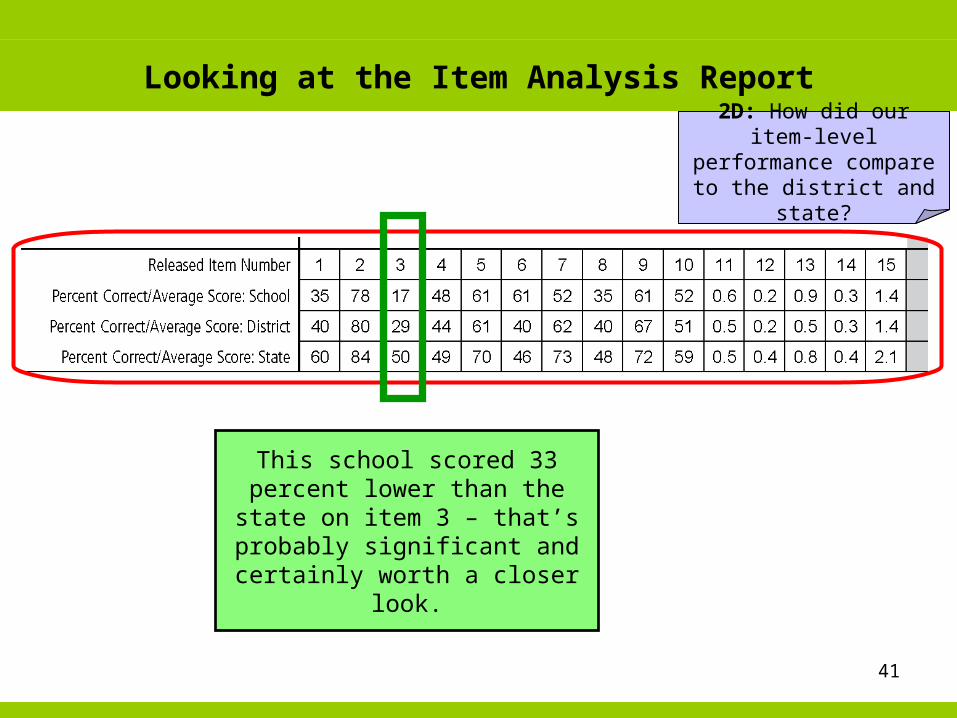
Looking at the Item Analysis Report
This school scored 33 percent lower than the state on item 3 – that’s probably significant and certainly worth a closer
look.
2D: How did our item-level performance compare to
the district and state?
42
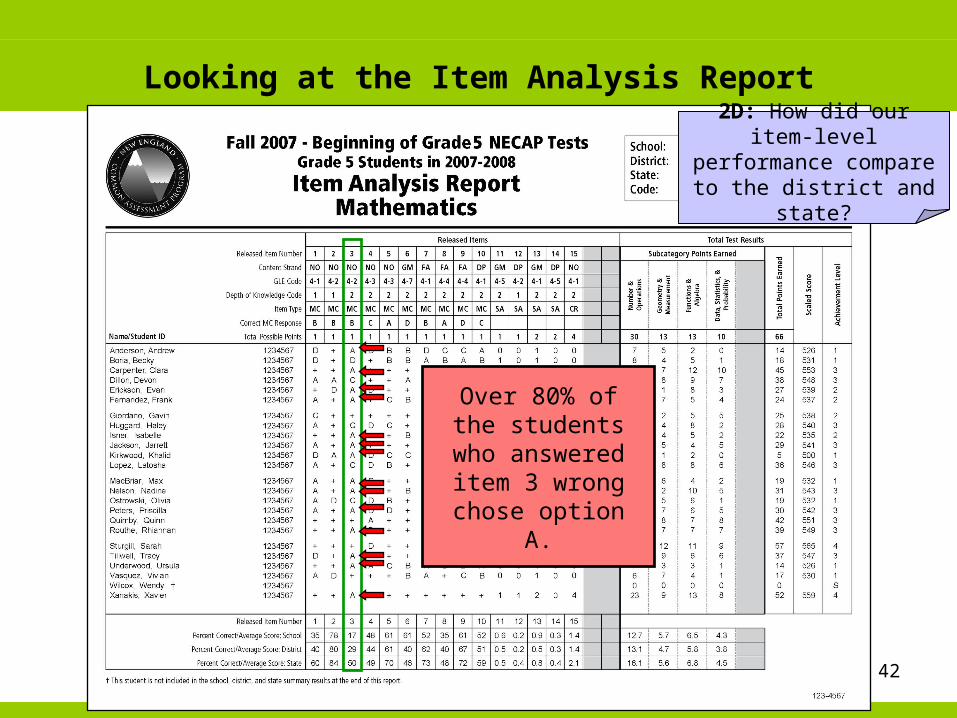
Looking at the Item Analysis Report
Over 80% of the students who
answered item 3 wrong chose
option A.
2D: How did our item-level performance compare to
the district and state?
43
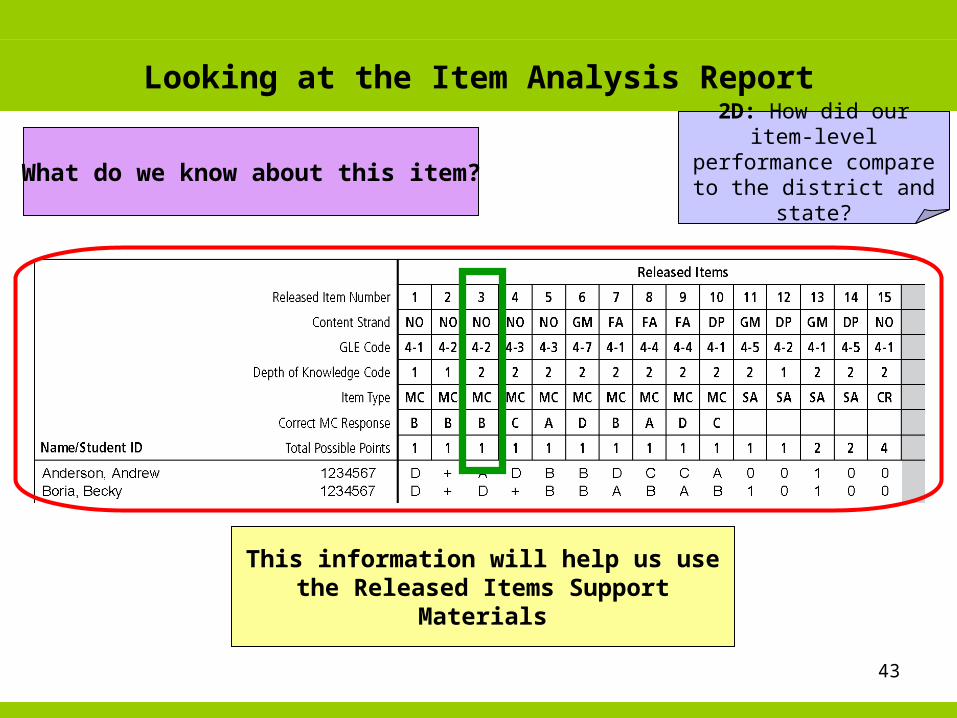
Looking at the Item Analysis Report
2D: How did our item-level performance compare to
the district and state?What do we know about this item?
This information will help us use the Released Items Support Materials
44
Released Items Documents
45
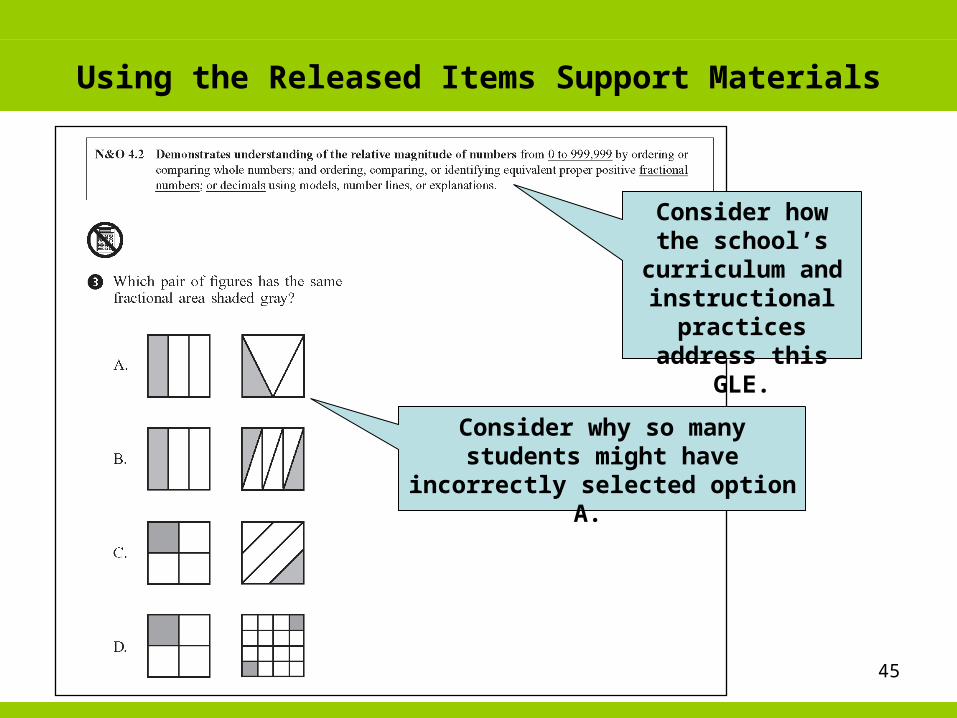
Using the Released Items Support Materials
Consider how the school’s
curriculum and instructional
practices address this GLE.
Consider why so many students might have incorrectly selected
option A.
46
Looking at the Item Analysis Report
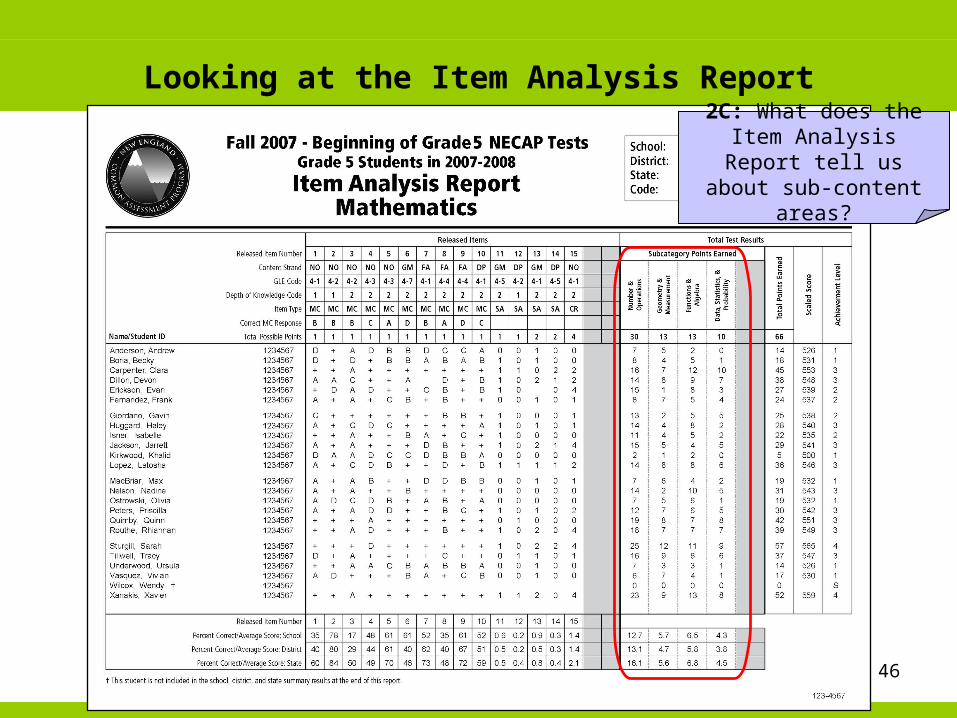
2C: What does the Item Analysis Report tell us
about sub-content areas?
47
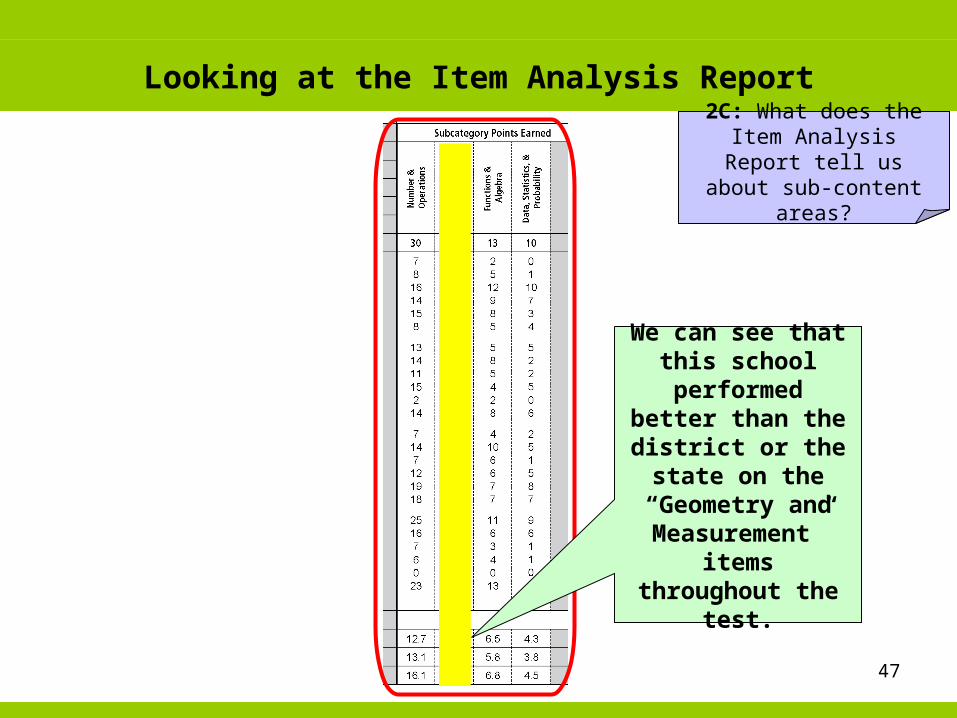
Looking at the Item Analysis Report
We can see that this school
performed better than the district or
the state on the “Geometry and Measurement”
items throughout the test.
2C: What does the Item Analysis Report tell us
about sub-content areas?
48
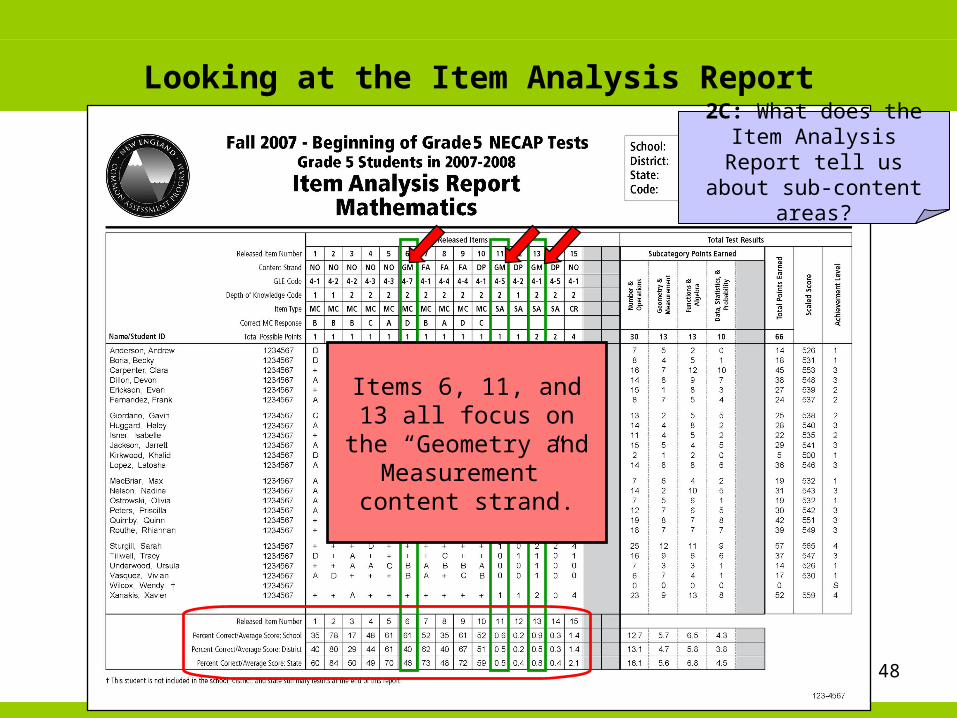
Looking at the Item Analysis Report
Items 6, 11, and 13 all focus on the “Geometry and Measurement” content strand.
2C: What does the Item Analysis Report tell us
about sub-content areas?
49
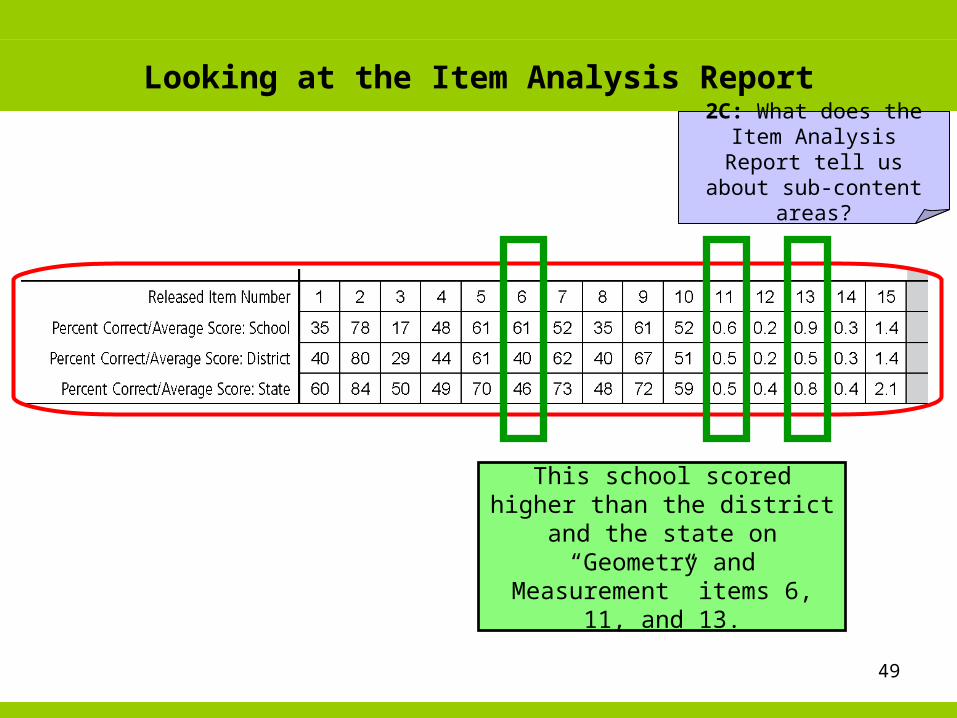
Looking at the Item Analysis Report
This school scored higher than the district and the state on “Geometry and
Measurement” items 6, 11, and 13.
2C: What does the Item Analysis Report tell us
about sub-content areas?
50
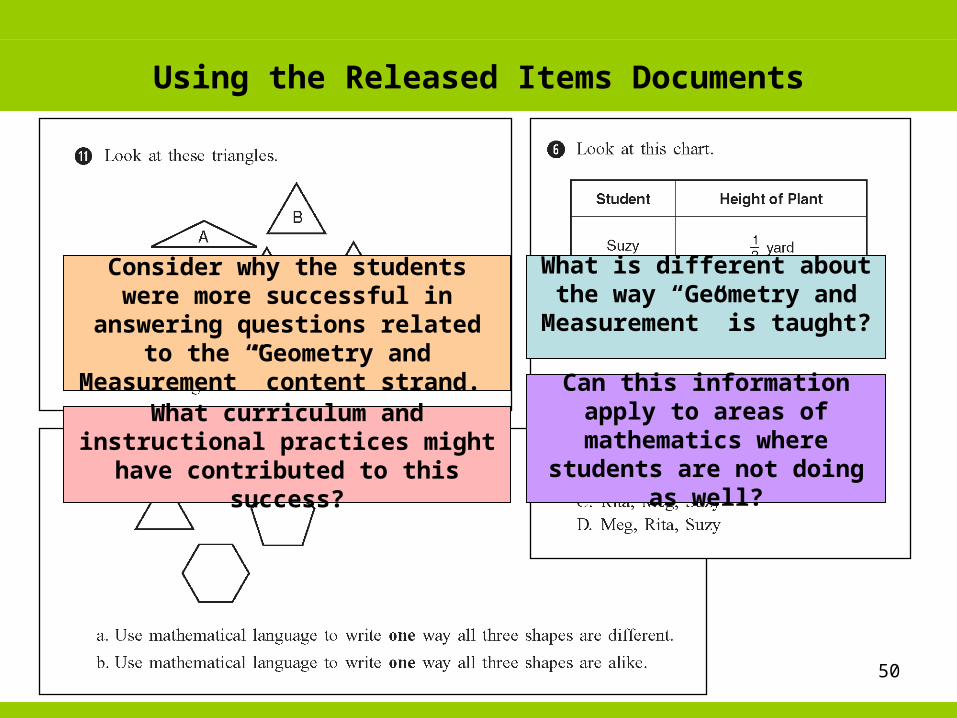
Using the Released Items Documents
Consider why the students were more successful in answering
questions related to the “Geometry and Measurement” content strand.
What is different about the way “Geometry and
Measurement” is taught?
Can this information apply to areas of mathematics where
students are not doing as well?
What curriculum and instructional practices might have contributed to
this success?
51
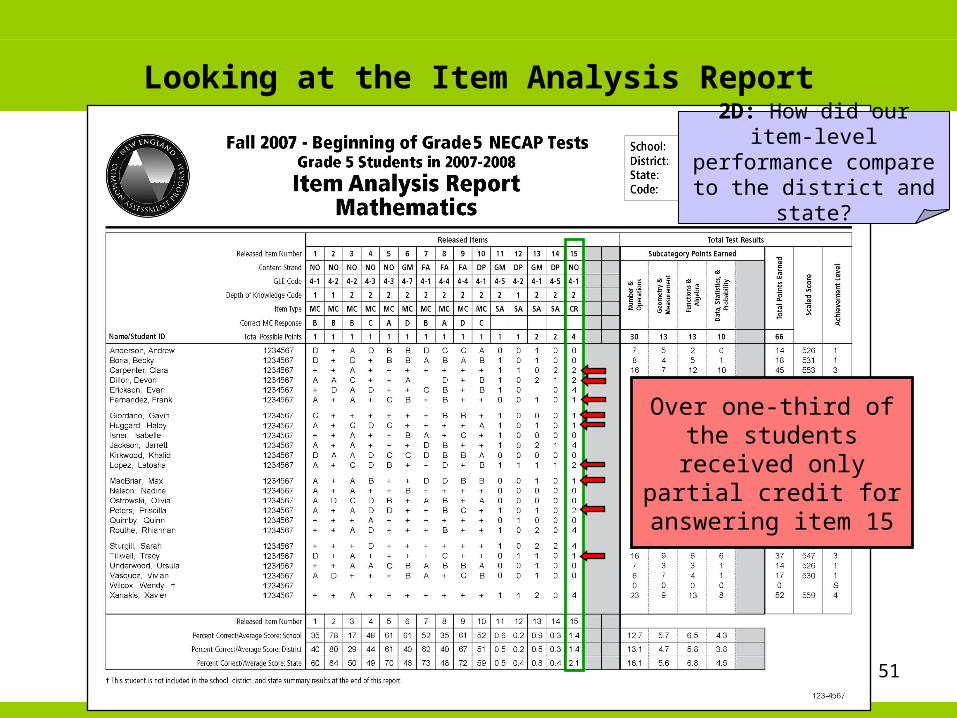
Looking at the Item Analysis Report
2D: How did our item-level performance compare to
the district and state?
Over one-third of the students received
only partial credit for answering item 15
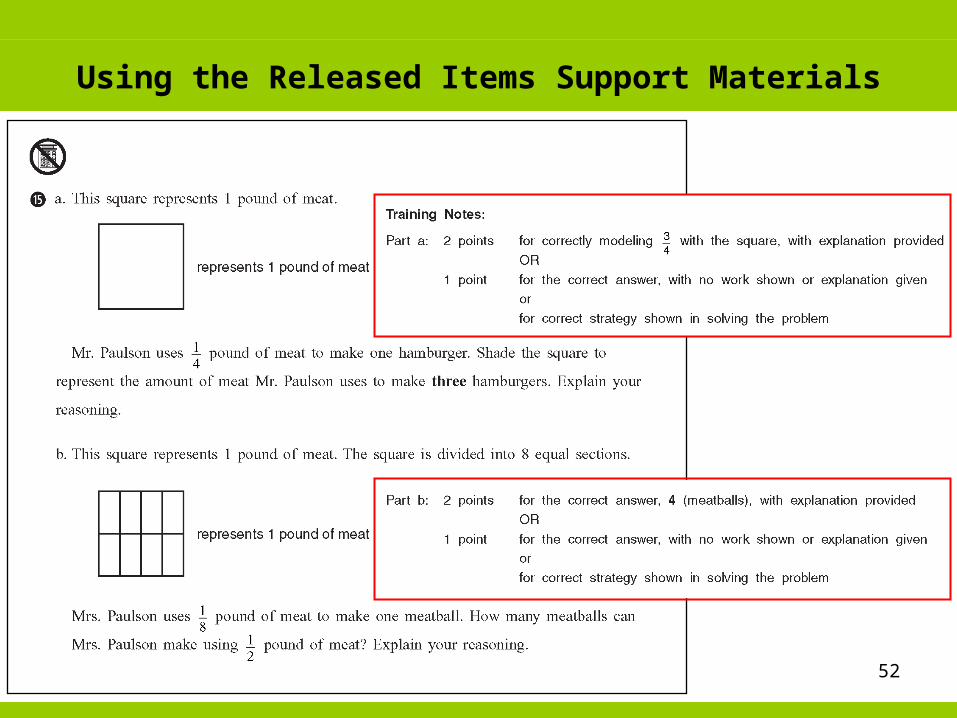
52
Using the Released Items Support Materials
53
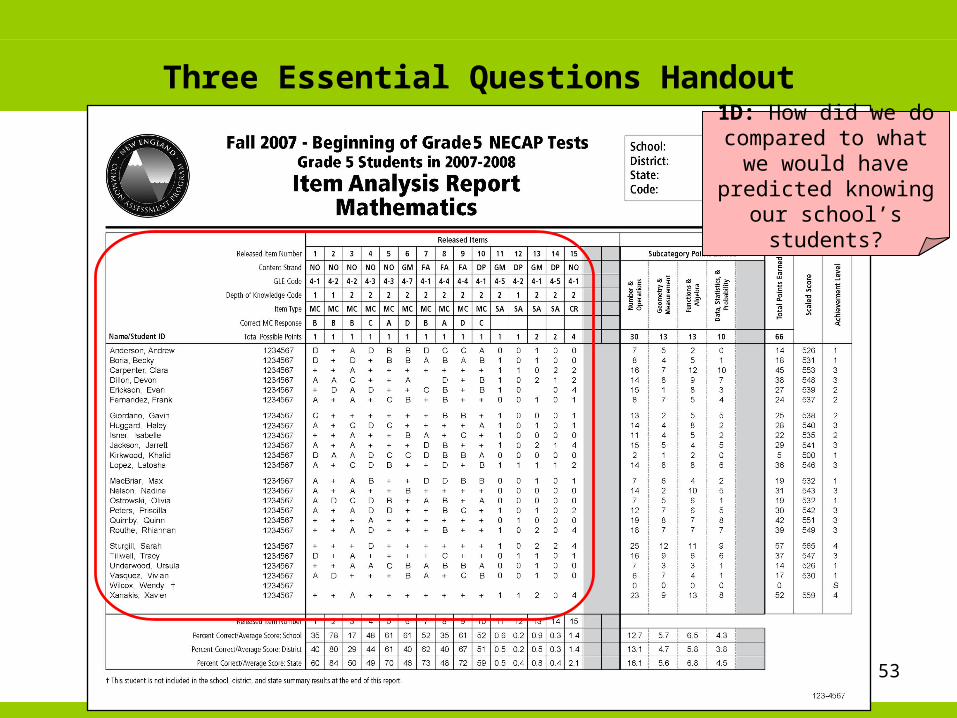
Three Essential Questions Handout1D: How did we do
compared to what we would have predicted knowing our school’s
students?
54
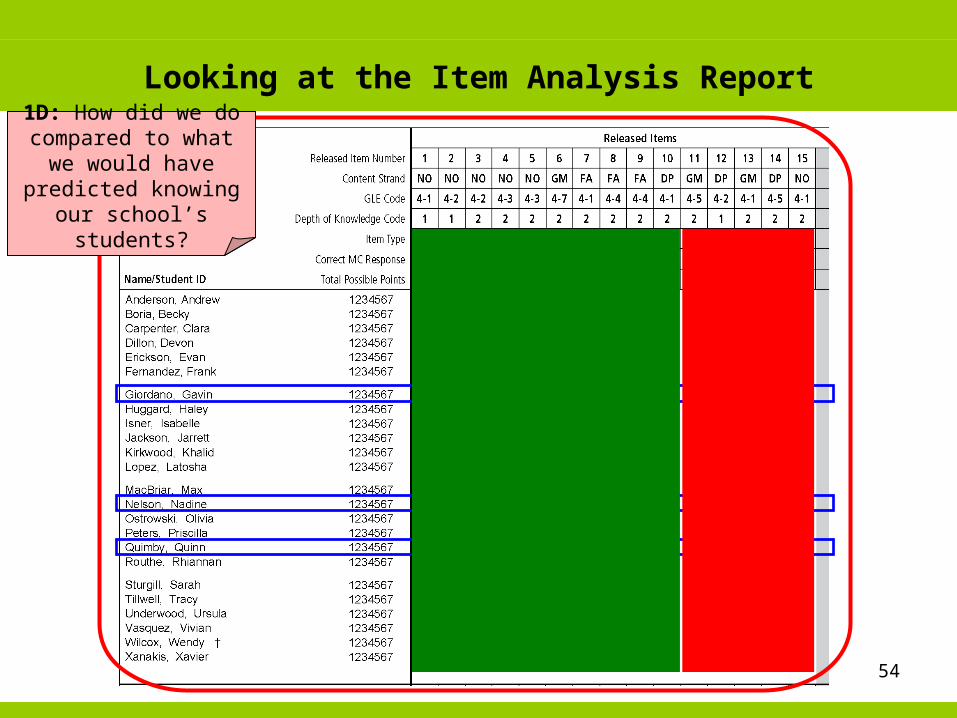
Looking at the Item Analysis Report1D: How did we do
compared to what we would have predicted knowing our school’s
students?
55
Small Group Activity
1. Select at least one of the three essential questions
2. Select your target audience
3. Begin to answer the question by examining your data
4. Note key findings or conclusions
5. Begin to discuss strategies for improvement
6. Be prepared to share your findings with the large group
56
Supporting Materials
• Guide to Using the 2007 NECAP Reports • Companion PowerPoint presentation• Three Essential Questions handout• Grade Level Expectations• Test Specifications documents• Released Items documents• Preparing Students for NECAP: Tips for Teachers
to Share with Students• Technical Report
57
Conclusion
“Not everything that can be counted counts, and not
everything that counts can be counted.”
~ Albert Einstein