Embed Size (px)
Citation preview

11
New Hampshire Statewide Assessment
Using the 2008 NECAP Science and NH Alternate
Reports
December 8 & 11, 2008

2
Welcome and Introductions
Tim KurtzDirector of Curriculum & Assessment
Jan McLaughlinScience Curriculum and Assessment
33
Welcome and Introductions
Tim KurtzDirector of Curriculum and AssessmentPhone: (603) 271-3846E-Mail: [email protected]
Gaye Fedorchak Supervisor of NH Alternate & ACCESSPhone: (603) 271-7383E-Mail: [email protected]
David GebhardtNAEP CoordinatorPhone: (603) 271-2298E Mail: [email protected]
Susan Morgan ACCESS for ELLs® & NH-AltProgram SpecialistPhone: (603) 271-3719E-Mail: [email protected]
Visit us on the Web:www.ed.state.nh.us/assessment
NH DOE Assessment Staff

4
Welcome and Introductions
ELA Supervisor – Open PositionPhone: (603) 271- [email protected]
Christine Downing, Mathematics CoachPhone: (603) 271- [email protected]
Jan McLaughlin, Science SupervisorPhone: (603) 271- [email protected]
Ken Relihan, Social Studies SupervisorPhone: (603) 271- [email protected]
Jiffi Rainie, Math/Science Partnership Program Specialist
Phone: (603) [email protected]
Gail Taylor, Math/Science Program Asst.Phone: (603) 271- [email protected]
NH DOE Curriculum Staff

5
Welcome and Introductions
Tim CrockettVice President1-800-431-8901 [email protected]
Harold StephensNECAP Program Director1-800-431-8901 [email protected]
Shannan DouglasNH Program Manager1-800-431-8901 [email protected]
Amanda SmithNECAP Program Manager1-800-431-8901 [email protected]
Carole SouleNECAP Program Manager1-800-431-8901 [email protected]
Amanda BreitmaierNH-Alt Program Manager1-800-431-8901 [email protected]
Elliot ScharffNECAP Program Manager – Science1-800-431-8901 [email protected]
Tina HaleyNECAP Program Assistant1-800-431-8901 [email protected]
Kellie BeaulieuNECAP Program Assistant1-800-431-8901 [email protected]
Mellicent FriddellNECAP Program Assistant1-800-431-8901 [email protected]
NECAP Service Center: 1-877-632-7774

66
Guides to Using the 2008 NECAP Science and NH-Alt Reports

7
Purpose of the Workshop
• Review the different types of NECAP Science and NH Alternate Assessment reports (briefly)
• Discuss effective ways to analyze and interpret results data
• Provide schools and districts an opportunity to share how they have analyzed results data
8
Involvement of Local Educators
• Development of Assessment Targets (NECAP Science)
• Development of Alternate Achievement Standards Linked to Grade Span Expectations (NH-Alt)
• Test Item Review Committees (NECAP)
• Bias and Sensitivity Review Committees (NECAP)
• Classroom Teacher Judgment Data (NECAP)
• Standard Setting Panelists (NECAP and NH-Alt)
• Technical Advisory Committee (NECAP and NH-Alt)
• NH-Alt Advisory Task Force (NH-Alt)

9
The Family Educational Rights and Privacy Act (FERPA)
• Access to individual student results is restricted to: the student the student’s parents/guardians authorized school personnel
• Superintendents and principals are responsible for maintaining the privacy and security of all student records.
• Authorized school personnel shall have access to the records of students to whom they are providing services when such access is required in the performance of their official duties.
• FERPA website: http://www.ed.gov/policy/gen/guid/fpco/ferpa/index.html

10
Types of NECAP Science Reports
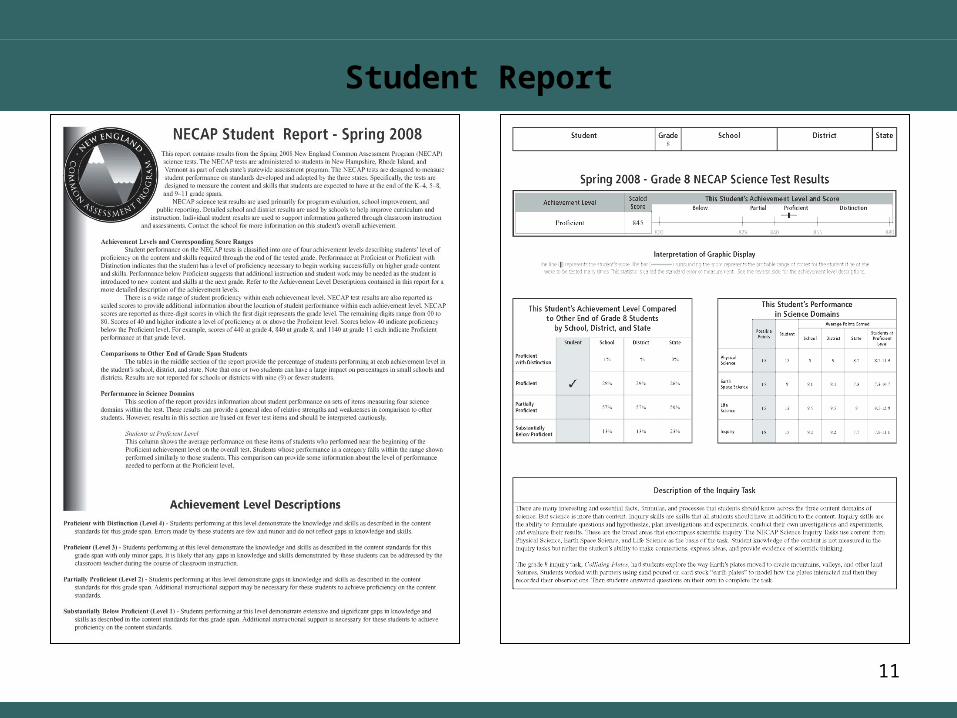
Student Report (Confidential)with Information for Parents and Report Interpretation Guide
Item Analysis Report (Confidential)School level by student
Results Report (Public) School and District level
Summary Report (Public) District level
Student Level Data Files (Confidential)Excel/CSV files by grade on district confidential site
11
Student Report

12
Item Analysis Report

13
Results Report

14
District Summary Report
15
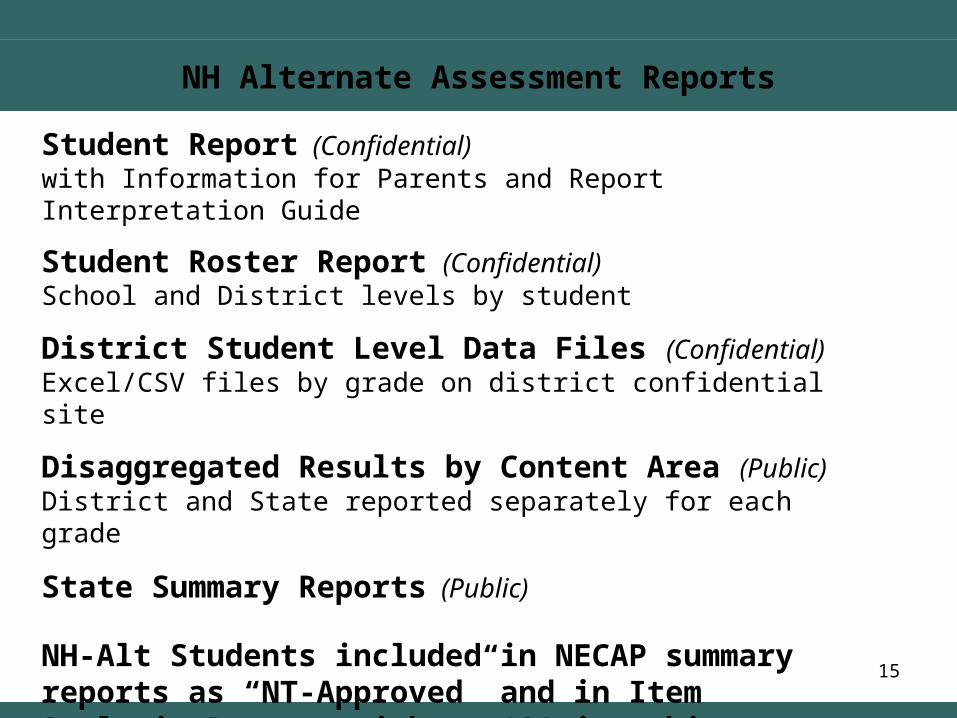
NH Alternate Assessment Reports
Student Report (Confidential)with Information for Parents and Report Interpretation Guide
Student Roster Report (Confidential)School and District levels by student
District Student Level Data Files (Confidential)Excel/CSV files by grade on district confidential site
Disaggregated Results by Content Area (Public)District and State reported separately for each grade
State Summary Reports (Public)
NH-Alt Students included in NECAP summary reports as “NT-Approved” and in Item Analysis Reports with an ‘A’ in achievement level column

16
NECAP and NH-Alt Student Level Data Files
Contain:• All demographic information for each student that was
provided by the districts to the state• The scaled score (or raw score for NH-Alt), achievement
level, domain scores (science), and subscores (NH-Alt) earned by each student in all content areas tested
NECAP files also contain:• Performance on released items• Student questionnaire responses• Optional reports data

17
Accessing Your Confidential Reports
http://iservices.measuredprogress.org
This menu lets you choose
between viewing NECAP or NH-Alt
ReportsSchools and Districts can
download multiple reports
at once.

18
Go to…
How Do I Find Public Assessment Reports?

19
Click Here

20
Choose Test Year&
Reporting level…..
Then take a look

21

22

23
Using Your Data
Three essential questions…• How did we do?• What do the data tell us about parts of our program?• What do the data tell us about parts of our population?
We will begin exploring these questions today by…• Looking at the different school-level reports (group data)• Looking at the Item Analysis Report (primarily individual
student data)

24
Essential Question #1 for Interpreting School Performance
How did we do?
…compared to the district
…compared to the state
…compared to our own history (Since this is the first year of NECAP Science and NH-Alt Science, there is no history to compare to.)
…compared to what we would have predicted knowing our school’s programs and students
Question #1

25
Essential Question #2 for Interpreting School Performance
What do the data tell us about parts of our program
How did we perform in this content area?
How did we perform in the various science domains?
What does the Item Analysis Report tell us about science domains?
How did our science domain and item-level performance compare to the district and state?
Question #2

26
Essential Question #3 for Interpreting School Performance
What do the data tell us about parts of our population?
How did the various sub-groups perform relative to:a. the district?b. the state?c. what we would have predicted
knowing the population?
How do the percentages of students in the various sub-groups compare to the district and state?
What does the questionnaire data tell us about the sub-populations?
Question #3
27
Before You Go Any Further
What questions will you answer and for what audiences?
• Based on what you know about your school’s programs and students, what do you expect to see? (For example: have you been working on curricula in one grade span vs. another?)
•What processes will you use to look at your reports?
• Who should participate in the discussions?
• How should you group the participants?

28
Looking at the Data
There are many ways to look at reports…
In order to simplify this presentation, we will only show some of the processes you might use.

29
Looking at School-Level Reports
NECAP Science reports cover Testing
Year (2007-08)

30
Looking at the School-Level Reports
1A and 1B: How did we do compared to the district
and the state?

31
Looking at the School-Level Reports
2A: How did we perform in this content area?

32
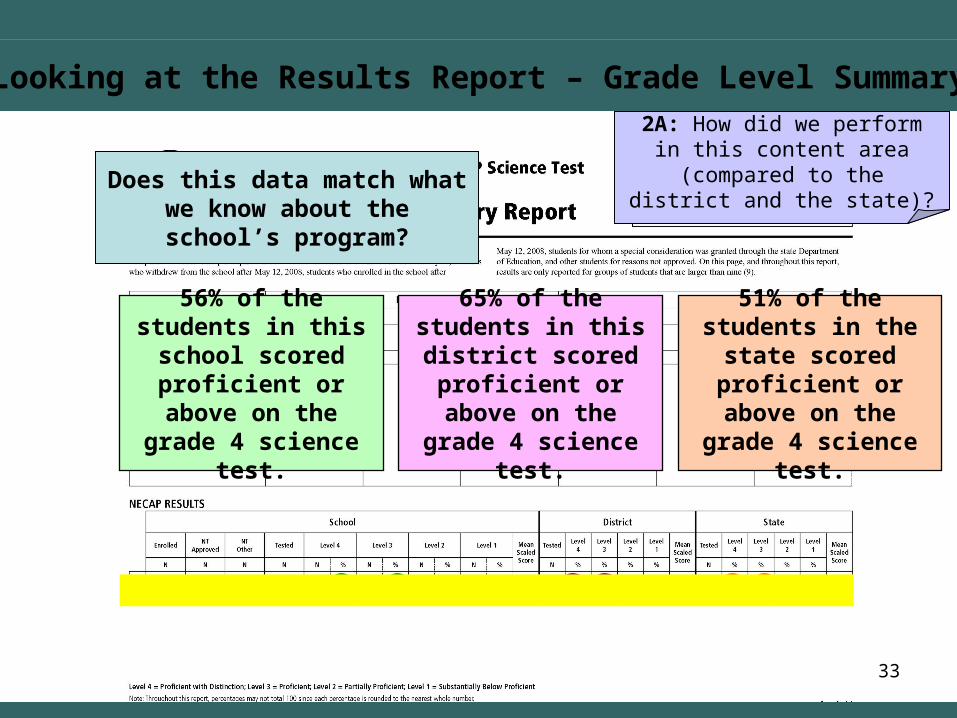
Looking at the Results Report – Grade Level Summary
56% of the students in this school scored proficient or
above on the grade 4 science test.
Does this data match what we know about the school’s
program?
2A: How did we perform in this content area?
33
Looking at the Results Report – Grade Level Summary
56% of the students in this school scored proficient or above
on the grade 4 science test.
65% of the students in this district scored
proficient or above on the grade 4 science test.
51% of the students in the state scored proficient or above
on the grade 4 science test.
Does this data match what we know about the school’s
program?
2A: How did we perform in this content area (compared to the
district and the state)?

3434
Achievement Level Cut Scores
Grade Subject SBP/PP PP/P P/PD
4 Science 426/427 439/440 462/463
8 Science 828/829 839/840 854/855
11 Science 1129/1130 1139/1140 1151/1152
How did our mean scaled score (at school or district level) compare to
the cut scores for the various achievement levels?
Page 18 in Guide to Using the 2008 NECAP Science Reports
35
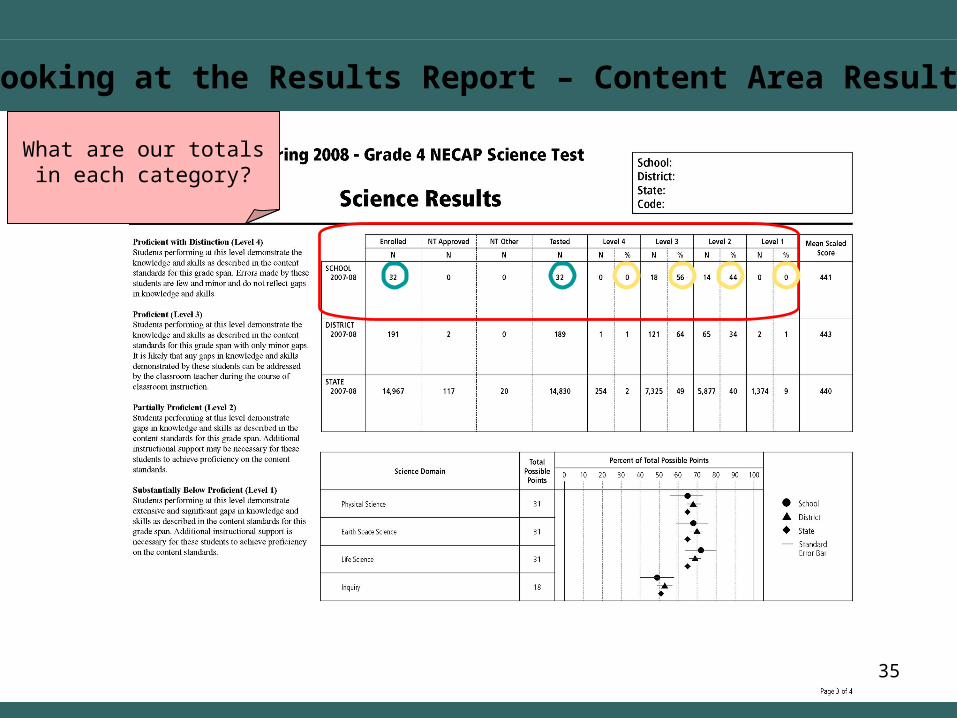
Looking at the Results Report – Content Area Results
What are our totals in each category?

36
Looking at the Results Report – Content Area Results
2B: How did we perform in the various science
domains?
37
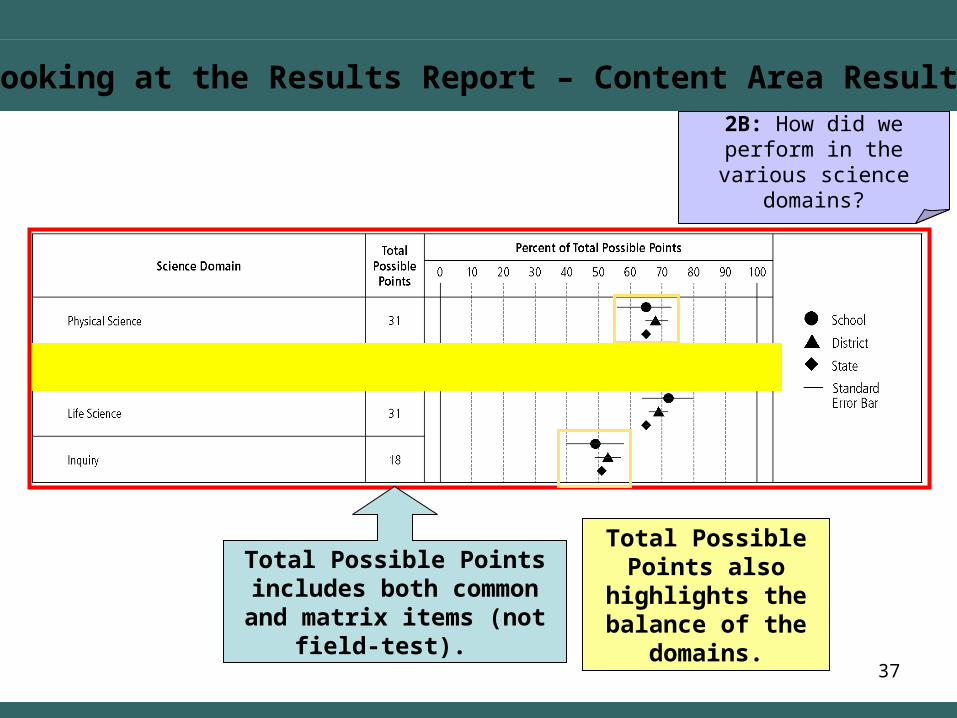
Looking at the Results Report – Content Area Results
Total Possible Points includes both common and matrix items (not field-test).
2B: How did we perform in the various science
domains?
Total Possible Points also
highlights the balance of the
domains.

38
Looking at the School-Level Report
3B: How did the various sub-groups compare to the district and state?

39
Looking at the School-Level Report
3A: How did the various sub-groups perform?
Important Note: Disaggregated results are
not reported for sub-groups of less than 10

40
Looking at the School-Level Report
Because this is a small school, and
so many of the sub-groups are smaller than 10, this part of the report is not as
useful.
But we can still look at district and state disaggregated results.
3A: How did the various sub-groups perform?
25% of the students with an IEP in the state scored proficient or
above
Does this data match what we
know about the district’s
program?
53% of the students with an IEP in this
district scored proficient or
above

41
Looking at the Item Analysis Report
This part of the report gives specific information about the
released items

42
Looking at the Item Analysis Report
Sessions 1 and 2 Inquiry Task

43
Looking at the Item Analysis Report
Read the Target code down the column
PS 3-7
Inquiry codes are a bit more challenging: INQ 3-8 means
Inquiry Broad Area 3 and Construct 8

44
For more information on the Inquiry Task Codes
NH NECAP Crosswalk for Inquiry Task Constructs and Science Process Skills (SPS)
Or the GDITs Document Guidelines for Developing Inquiry Tasks (GDITs) found on the NH Department of Education website

45
Looking at the Item Analysis Report
This part of the report represents all of the items used
to compute student scores

46
Looking at the Item Analysis Report
47
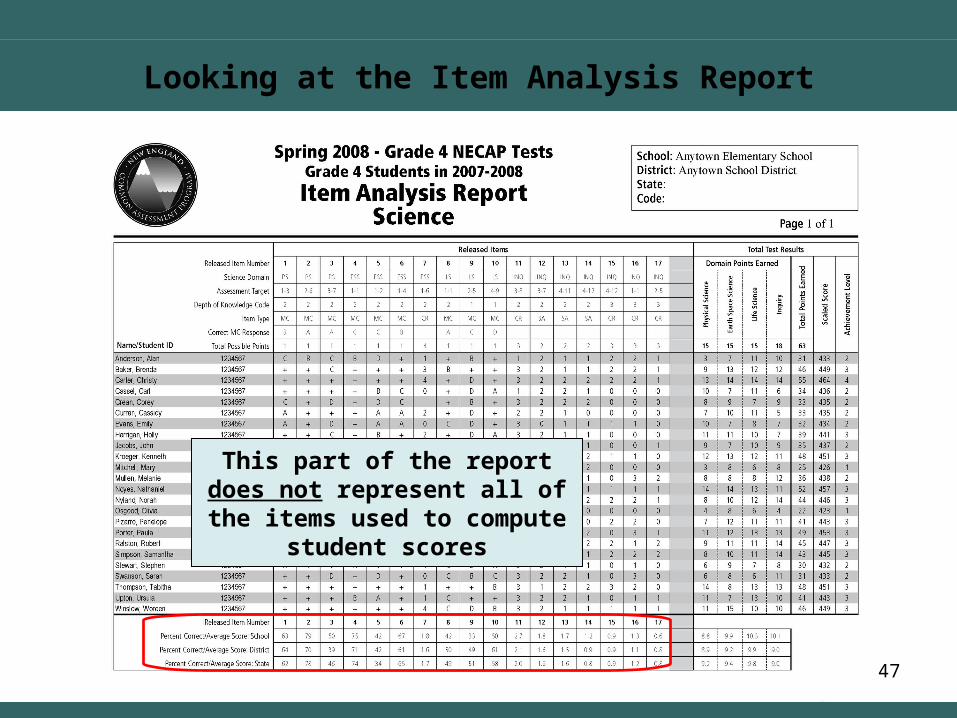
Looking at the Item Analysis Report
This part of the report does not represent all of the items used
to compute student scores

48
This school scored 18 percentage points lower than the state on item 9 – that’s
probably significant and certainly worth a closer look.
2D: How did our item-level performance compare to
the district and state?
Looking at the Item Analysis Report

49
Almost 70% of the students who answered item 9
wrong chose option D.
2D: How did our item-level performance compare to
the district and state?
Looking at the Item Analysis Report
50
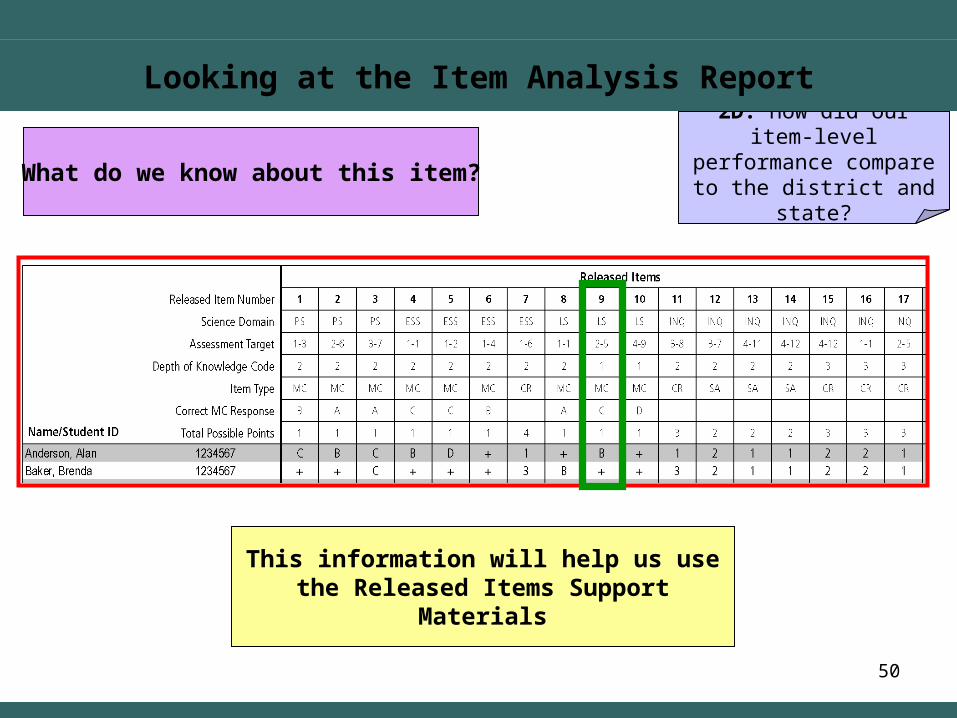
2D: How did our item-level performance compare to
the district and state?What do we know about this item?
This information will help us use the Released Items Support Materials
Looking at the Item Analysis Report

51
Released Items Documents

52
Consider how the school’s
curriculum and instructional
practices address this assessment
target.
Consider why so many students might have incorrectly selected
option D.
Using the Released Items Support Materials
Full NECAP Code for this target is: LS2(K-4)SAE-5
NH Frameworks code is : S:LS2:4:2.2
53
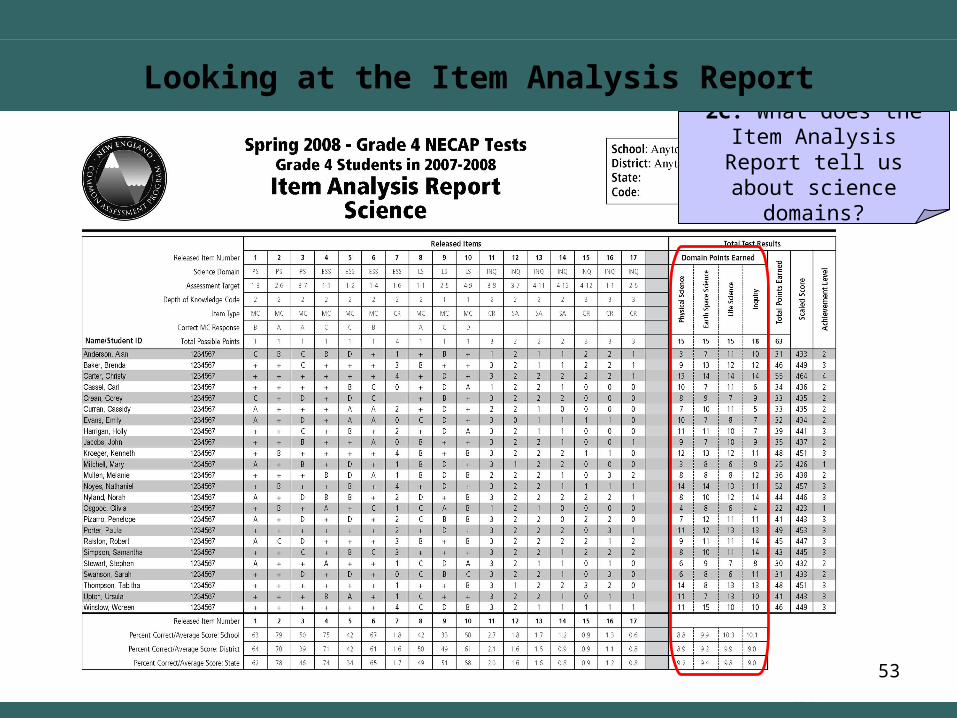
2C: What does the Item Analysis Report tell us
about science domains?
Looking at the Item Analysis Report

54
We can see that this school performed
about the same as the district and slightly
below the state on the “Physical Science”
items throughout the test.
2C: What does the Item Analysis Report tell us
about science domains?
Looking at the Item Analysis Report
55
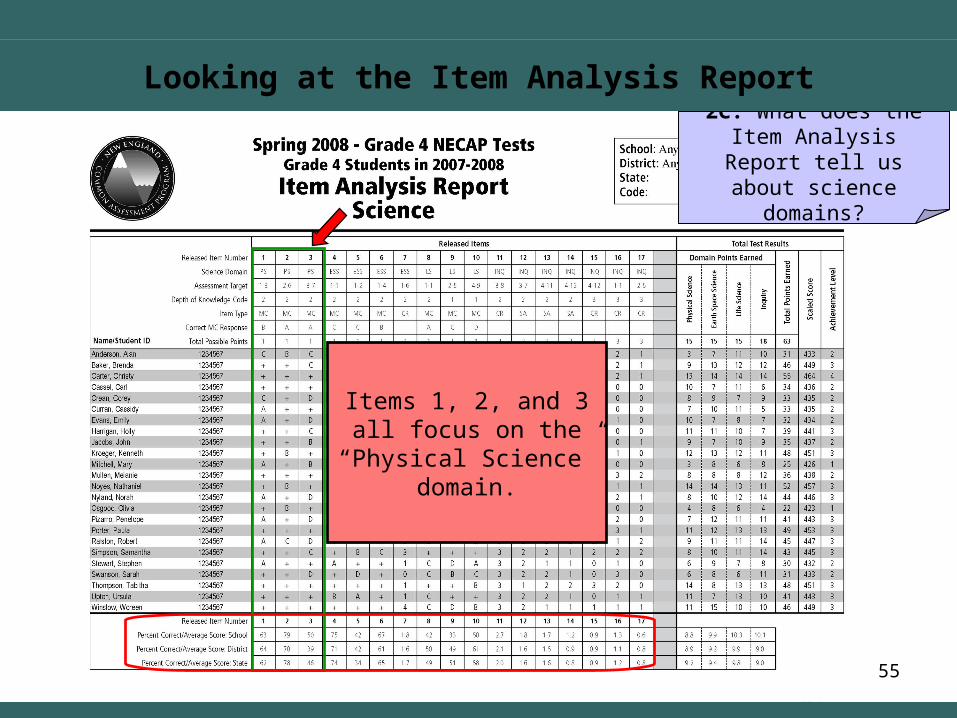
Items 1, 2, and 3 all focus on the
“Physical Science” domain.
2C: What does the Item Analysis Report tell us
about science domains?
Looking at the Item Analysis Report

56
This school did well on these “Physical Science”
items as compared with the district and state.
2C: What does the Item Analysis Report tell us
about science domains?
Looking at the Item Analysis Report

57
Consider why the students were more successful in answering
questions related to the “Physical Science” domain.
What is different about the way “Physical Science” is
taught?
Can this information apply to a domain of science where students are not doing as
well?
What curriculum and instructional practices might have contributed to
this success?
Using the Released Items Documents

58
2D: How did our item-level performance compare to
the district and state?
Nearly 80% of the students received partial credit for answering item 7
Looking at the Item Analysis Report

59
Using the Released Items Support Materials

60
1D: How did we do compared to what we would have predicted knowing our school’s
students?
Three Essential Questions Handout

61
1D: How did we do compared to what we would have predicted knowing our school’s
students?
Looking at the Item Analysis Report

62
Small Group Activity
1. Select at least one of the three essential questions
2. Select your target audience
3. Begin to answer the question by examining your data
4. Note key findings or conclusions
5. Begin to discuss strategies for improvement
6. Be prepared to share your findings with the large group
7. What will you do next? How will you share your findings?

63
• Guides to Using the 2008 NECAP Science & NH-Alt Reports
• Companion PowerPoint presentation• Three Essential Questions handout• Assessment Targets
(within NH Curriculum Frameworks documents)• Accommodations, Guidelines, and Procedures:
Administrator Training Guide• Released Items documents• Preparing Students for NECAP: Tips for Teachers to Share
with Students• Practice Tests for each subject at every grade level• Performance Tracker
www.ed.state.nh.us/assessment
Supporting Materials and Resources
64
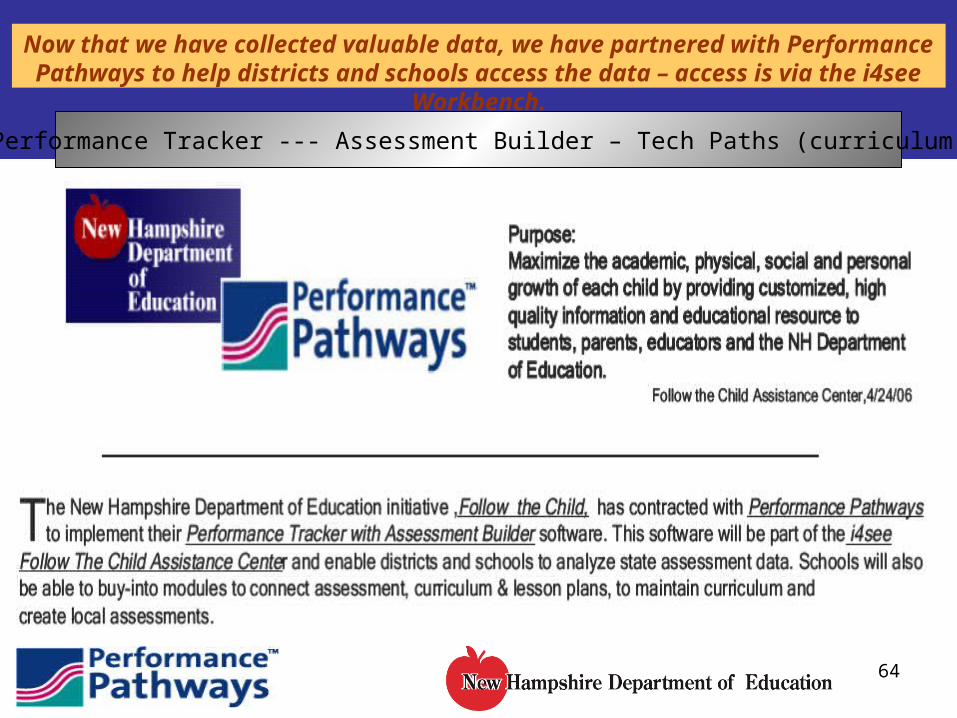
Now that we have collected valuable data, we have partnered with Performance Pathways to help districts and schools access the data – access is via the i4see Workbench.
Performance Tracker --- Assessment Builder – Tech Paths (curriculum)

65
So how do I get access…Visit www.ed.state.nh.us/i4see
1. PD centers are providing hands-on training.2. TIP 16 on the i4see home page will describe how to request a user id.3. Under Recent Highlights you will find a link to a timeline identifying
monthly i4see training sessions.

66
Performance Pathways Provides Access to Assessment Information…

67
So how should we be using Performance Tracker…
Yes You Should…
• Use Performance Tracker to learn more about your student performance in relation to the GLEs, GSEs & Assessment Targets
• Look for trends over time rather than one time snap-shots.
• Look at item level results and specific test items to better understand test terminology and student thinking
• Define student groups to understand the success of specific programs
• Compare across student groups and subgroups within your schools and within your district to understand curriculum and instructional strengths, weaknesses & needs
Please Be Cautious…
• Performance Tracker is not meant to recreate AYP results
• Not all correlations are statistically significant
• Watch out for percentages -- keep an eye on the number of students represented by the reporting results– don’t jump to conclusions if 75% only represents three students
• Remember NECAP is only one indicator

68
Conclusion
“Not everything that can be counted counts, and not
everything that counts can be counted.”
~ Albert Einstein