Embed Size (px)
Citation preview

STATISTIK PERDAGANGAN
TRADE STATISTICSISSN : 0852 - 9078SETJEN/ BSP/ 36/ 10/ 2017
OKTOBER / OCTOBER 2017
Pusat Data dan Sistem Informasi
Sekretariat Jenderal
Kementerian Perdagangan http://www.kemendag.go.id/
STATISTIK PERDAGANGAN
TRADE STATISTICS
Unduh/Download: http://www.kemendag.go.id/id/economic-profile/publikasi-statistik/bsp
KEMENTERIAN PERDAGANGAN REPUBLIK INDONESIA
MINISTRY OF TRADE, REPUBLIC OF INDONESIA
ISSN : 0852 - 9078 NO. 08.10.148
OKTOBER - OCTOBER 2017


iii Statistik Perdagangan No. 08.10.148
KATA PENGANTAR
Penerbitan STATISTIK PERDAGANGAN bertujuan untuk menyajikan
berbagai macam data statistik perdagangan dalam satu buku sehingga
memudahkan bagi pengguna data untuk memperoleh informasi yang
dibutuhkan
Data yang disajikan bersumber dari Badan Pusat Statistik, The World
Bank, dan unit-unit di lingkungan Kementerian Perdagangan. Meskipun
sebagian besar data statistik yang disajikan merupakan data sekunder,
tetapi penyajiannya diupayakan sedemikian rupa agar dapat dipakai
secara langsung untuk kepentingan analisa, perencanaan dan
penyusunan kebijaksanaan. Penyusunan buku ini diharapkan dapat
bermanfaat bagi seluruh pejabat di lingkungan Kementerian
Perdagangan, instansi-instansi lain, dunia usaha, akademisi dan
masyarakat umum.
Penghargaan dan terima kasih disampaikan kepada instansi-instansi yang
telah membantu dalam penyediaan data dan dokumen dasar untuk
penyusunan statistik perdagangan yang memungkinkan penyusunan buku
ini.
Kepada para pengguna data, kami mengharapkan saran dan kritik yang
konstruktif demi penyempurnaan penerbitan STATISTIK PERDAGANGAN.
PUSAT DATA DAN SISTEM INFORMASI
KEMENTERIAN PERDAGANGAN
PREFACE
TRADE STATISTICS is a bulletin for dissemination of various statistical
data on trade in one publication to support users in gaining information
which are needed.
Data have been drawn from Statistics Indonesia, The World Bank and
various sources within the Ministry of Trade. Although much of these
data are secondary data, it is intended for anaytical use or planning and
policy making. This bulletin is directed to be beneficial for officials within
the Ministry of Trade, other goverment institutions, business and
intelectual circles including R & D and educational institution, as well as
general public.
Acknowledgement and appreciation is expressed to instituions which
have rendered valuable assistances in providing data and basic
documents to create this trade statistics and allow the publication of this
bulletin
Comments and brief notes about this bulletin are welcome and highly
appreciated for the development of this publication
CENTER OF DATA AND INFORMATION SYSTEM
THE MINISTRY OF TRADE

iv Statistik Perdagangan No. 08.10.148
DAFTAR ISI
Kata Pengantar iii
Daftar Isi iv
Tabel:
INDEKS, HARGA dan NERACA
1 Indeks Harga Konsumen di 82 Kota di Indonesia dan
Perubahannya (%) 1
2 Angka Indeks Harga Perdagangan Besar Barang Ekspor
Indonesia 2
3 Angka Indeks Harga Perdagangan Besar Barang Impor
Indonesia 5
4 Harga Beberapa Barang di Pasar Dunia 8
5 Perkembangan Harga Rata Rata Barang Kebutuhan Pokok
dan Barang Jenis Lainnya Secara Nasional 9
6 Neraca Perdagangan Indonesia 10
7 Neraca Perdagangan Indonesia dengan Negara-Negara Lain
(Termasuk Minyak Bumi & Hasil-Hasilnya dan Gas) 11
EKSPOR
8 Ringkasan Perkembangan Ekspor Indonesia 14
9 Ringkasan Perkembangan Nilai Ekspor Bahan Mentah
Indonesia 15
10 Ringkasan Perkembangan Nilai Ekspor Hasil Industri
Indonesia 16
11 Nilai Ekspor Indonesia Menurut Negara Tujuan (Termasuk
Minyak Bumi & Hasil-Hasilnya dan Gas) 17
12 Nilai Ekspor Indonesia Menurut Negara Tujuan (Diluar
Minyak Bumi & Hasil-Hasilnya dan Gas) 20
CONTENTS
Preface Iii
Contents iv
Tables:
INDEX, PRICE and BALANCE
1 Consumer Price Index of 82 Cities in Indonesia and Its Change
(%) 1
2 Index of Wholesale Price of Indonesian Export Commodities
2
3 Index of Wholesale Price of Indonesian Import Commodities
5
4 World Market Prices of Selected Commodities 8
5 Development of The National Average Price of Necessary
Goods and Other Type Goods 9
6 The Indonesian Balance of Trade 10
7 Balance of Indonesian Trade with Other Countries (Including Oil
& Oil Products & Natural Gas) 11
EXPORT
8 Summary of Indonesian Export Development 14
9 Summary of Indonesian Export Value Development of Crude
Materials 15
10 Summary of Export Value Development of Industrial Products
16
11 Indonesian Export Value by Country of Destination (Including
Oil & Oil Products & Natural Gas) 17
12 Indonesian Export Value by Country of Destination (Excluding
Oil & Oil Products & Natural Gas) 20

v Statistik Perdagangan No. 08.10.148
13 Perkembangan Nilai 100 Jenis Barang Ekspor Utama Indonesia
23
13.1 Perkembangan Volume 100 Jenis Barang Ekspor Utama
Indonesia 27
14 Nilai Ekspor 100 Jenis Barang Menurut Negara Tujuan Utama
31
14.1 Volume Ekspor 100 Jenis Barang Menurut Negara Tujuan
Utama 51
15 Export Volume of 100 Commodities by Main Country of
Destination 71
15.1 Volume Ekspor 100 Jenis Barang Menurut Pelabuhan Muat
Utama 91
IMPOR :
16 Ringkasan Perkembangan Nilai Impor Menurut Golongan
Barang 111
16.1 Ringkasan Perkembangan Volume Impor Menurut Golongan
Barang Ekonomi 112
17 Nilai Impor Indonesia Menurut Negara Asal (Termasuk Minyak
Bumi & Hasil-Hasilnya Dan Gas) 113
18 Nilai Impor Indonesia Menurut Negara Asal (Diluar Minyak
Bumi & Hasil-Hasilnya Dan Gas) 116
19 Perkembangan Nilai 190 Jenis Barang Impor Utama Indonesia
119
19.1 Perkembangan Volume 190 Jenis Barang Impor Utama
Indonesia 128
20 Nilai Impor 190 Jenis Barang Menurut Negara Asal Utama 137
20.1 Volume Impor 190 Jenis Barang Menurut Negara Asal Utama 175
13 Development of Indonesian Export Value at 100 Major
Commodities 23
13.1 Development of Indonesian Export Volume at 100 Major
Commodities 27
14 Export Value of 100 Commodities by Main Country of
Destination 31
14.1 Export Volume of 100 Commodities by Main Country of
Destination 51
15 Export Value of 100 Commodities by Main Port of
Embarkation 71
15.1 Export Volume of 100 Commodities by Main Port of
Embarkation 91
IMPORT :
16 Summary of Import Value Development by Economy
Categories 111
16.1 Summary of Import Value Development by Economy
Categories 112
17 Indonesian Import Value by Country of Origin (Including Oil
& Oil Products & Natural Gas) 113
18 Indonesian Import Value by Country of Origin (Excluding Oil
& Oil Products & Natural Gas) 116
19 Development of Indonesian Import Value of 190 Major
Commodities 119
19.1 Development of Indonesian Import Quantity of 190 Major
Commodities 128
20 Import Value of 190 Commodities by Main Country of Origin 137
20.1 Import Volume of 190 Commodities by Main Country of
Origin 175

vi Statistik Perdagangan No. 08.10.148

No. 08.05.148
2010 Januari/January 129,66 1,73 126,35 1,93 115,48 0,34 118,77 -0,20 113,55 0,15 114,22 0,10 103,49 0,16 118,01 0,84
Desember/December 147,39 2,81 132,59 0,37 119,79 0,21 126,76 1,08 115,86 0,16 117,86 0,07 106,10 0,25 125,17 0,92
2011 Januari/January 150,64 2,21 133,24 0,49 120,37 0,48 126,95 0,15 116,41 0,47 118,36 0,42 106,43 0,31 126,29 0,89
Desember/December 152,76 1,62 138,57 0,50 123,95 0,28 136,35 0,20 120,79 0,17 123,94 0,07 108,14 0,14 129,91 0,57
2012 Januari/January 155,59 1,85 139,47 0,65 124,62 0,54 136,24 -0,08 121,40 0,51 124,12 0,15 108,39 0,23 130,90 0,76
Desember/December 161,44 1,59 147,04 0,29 128,10 0,17 142,72 0,24 124,30 0,18 129,16 0,05 110,52 0,26 135,49 0,54
2013 Januari/January 166,91 3,39 147,71 0,46 128,82 0,56 143,07 0,25 124,66 0,29 129,22 0,05 110,21 -0,28 136,88 1,03
Desember/December 179,77 0,79 157,99 0,73 136,07 0,44 143,46 0,17 128,90 0,16 134,21 0,06 127,50 0,56 146,84 0,55
2014 Januari/January *) 117,81 2,77 110,71 0,72 108,72 1,01 103,88 0,55 105,76 0,72 105,98 0,28 113,72 0,20 110,99 1,07
Desember/December 126,76 3,22 118,84 1,96 115,50 1,45 106,49 0,64 111,00 0,74 110,37 0,36 127,27 5,55 119,00 2,46
2015 Januari/January 127,52 0,60 119,61 0,65 116,48 0,80 107,39 0,85 111,73 0,66 110,66 0,26 122,31 -4,04 118,71 -0,24
Desember/December 133,01 3,20 126,47 0,50 119,41 0,40 110,14 0,09 116,90 0,24 114,75 0,06 125,32 0,45 122,99 0,96
2016 Januari/January 135,93 2,20 127,11 0,51 120,04 0,53 110,43 0,26 117,32 0,36 114,92 0,15 123,93 -1,11 123,62 0,51
Pebruari/February 135,14 -0,58 127,91 0,63 119,50 -0,45 111,14 0,64 117,63 0,26 114,99 0,06 123,74 -0,15 123,51 -0,09
Maret/March 136,07 0,69 128,37 0,36 119,42 -0,07 111,75 0,55 117,98 0,30 115,02 0,03 123,47 -0,22 123,75 0,19
April/April 134,79 -0,94 128,82 0,35 119,26 -0,13 112,00 0,22 118,35 0,31 115,05 0,03 121,50 -1,60 123,19 -0,45
Mei/May 135,19 0,30 129,57 0,58 119,28 0,02 112,49 0,44 118,67 0,27 115,08 0,03 121,76 0,21 123,48 0,24
Juni/June 137,38 1,62 130,32 0,58 119,46 0,15 113,28 0,70 119,07 0,34 115,12 0,03 122,53 0,63 124,29 0,66
Juli/July 138,92 1,12 131,03 0,54 119,75 0,24 113,78 0,44 119,51 0,37 115,71 0,51 124,03 1,22 125,15 0,69
Agustus/August 137,98 -0,68 131,57 0,41 120,24 0,41 114,24 0,40 119,98 0,39 117,07 1,18 122,76 -1,02 125,13 -0,02
September/September 137,88 -0,75 132,02 0,76 120,59 0,70 114,39 0,54 120,38 0,73 117,68 1,70 122,99 -0,84 125,41 0,21
Oktober/October 137,59 -0,96 132,34 1,00 121,26 1,26 114,04 0,23 120,73 1,02 117,80 1,81 122,95 -0,87 125,59 0,35
November/November 139,88 0,69 132,67 1,25 121,46 1,43 114,03 0,22 121,09 1,32 117,82 1,82 123,04 -0,80 126,18 0,82
Desember/December 140,58 1,88 133,27 1,29 121,68 1,20 113,50 -0,65 121,48 1,25 117,88 0,69 124,42 1,35 126,71 1,26
2017 Januari/January 141,51 0,66 133,89 0,47 123,01 1,09 113,87 0,33 122,09 0,50 118,02 0,12 127,35 2,35 127,94 0,97
Pebruari/February 141,07 -0,31 134,41 0,39 123,93 0,75 114,46 0,52 122,41 0,26 118,12 0,08 127,54 0,15 128,24 0,23
Maret/March 140,14 -0,66 134,82 0,31 124,30 0,30 114,67 0,18 122,67 0,21 118,22 0,08 127,37 -0,13 128,22 -0,02
April/April 138,56 -1,13 134,98 0,12 125,45 0,93 115,23 0,49 122,77 0,08 118,26 0,03 127,72 0,27 128,33 0,09
Mei/May 139,75 0,86 135,49 0,38 125,89 0,35 115,50 0,23 123,23 0,37 118,30 0,03 128,01 0,23 128,83 0,39
Juni/June 140,72 0,69 136,02 0,39 126,84 0,75 116,40 0,78 123,65 0,34 118,38 0,07 129,64 1,27 129,72 0,69
Juli/July 141,01 0,21 136,80 0,57 126,92 0,06 116,47 0,06 123,84 0,15 119,11 0,62 129,54 -0,08 130,00 0,22
Sumber/Source : Badan Pusat Statistik/Central Board of Statistics
*) Sebelum tahun 2014 : Memakai Tahun Dasar 2007
1
% %
Bahan
Makanan/
Foods Stuff
Makanan
Jadi/Prepared
Food
Perumahan/
Housing
Sandang/
Clothing
Pendidikan/
Education
Transpor/
Transpor-
tation
% %
TABEL 1 : INDEKS HARGA KONSUMEN DI 82 KOTA DI INDONESIA DAN PERUBAHANNYA (%)
( 2012 = 100)
TABLE CONSUMER PRICE INDEX OF 82 CITIES IN INDONESIA AND ITS CHANGE (%)
Tahun/Bulan % %Umum /
General% %
Kesehatan/
Medical
Care

No.08.05.148 Lanjutan/Continued
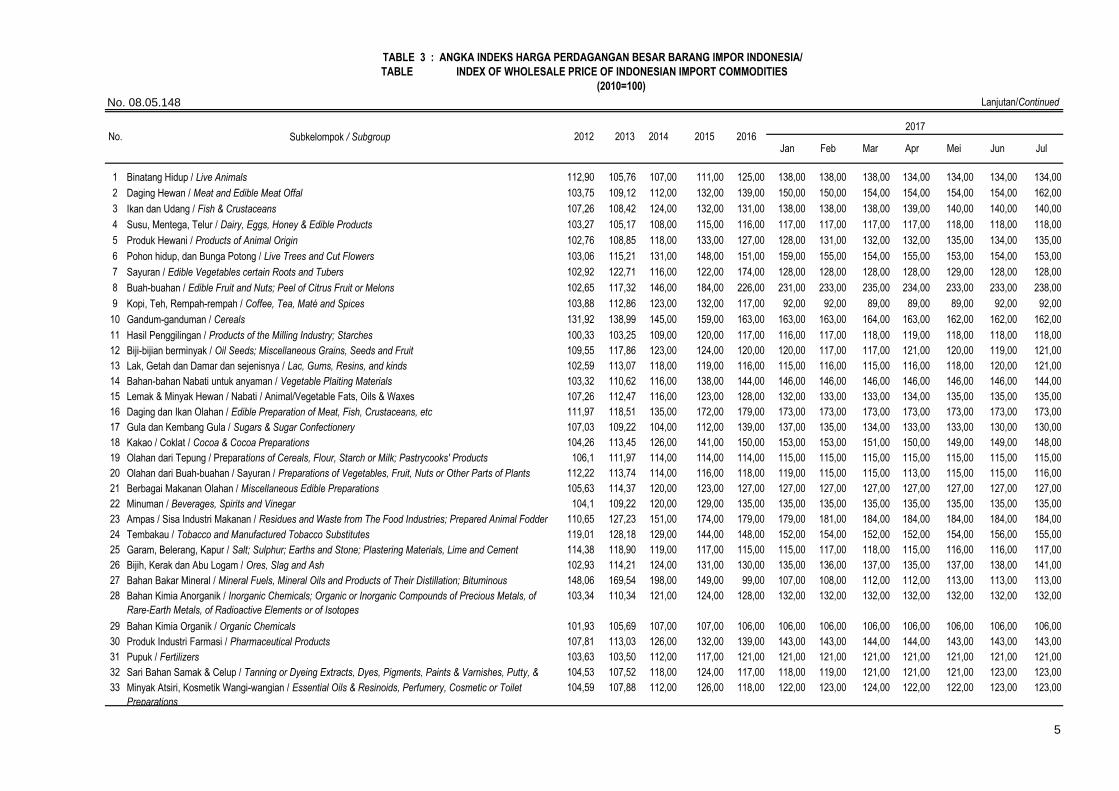
1 Binatang Hidup / Live Animals 101,36 121,16 139,00 154,00 158,00 161,00 164,00 163,00 164,00 165,00 163,00 165,00
2 Daging Hewan / Meat and Edible Meat Offal 104,67 117,73 129,00 138,00 147,00 149,00 148,00 149,00 148,00 150,00 151,00 152,00
3 Ikan dan Udang / Fish & Crustaceans 122,56 133,99 158,00 183,00 198,00 206,00 206,00 205,00 203,00 204,00 204,00 205,00
4 Susu, Mentega, Telur / Dairy, Eggs, Honey & Edible Products 103,34 110,33 118,00 125,00 130,00 132,00 133,00 133,00 133,00 138,00 138,00 138,00
5 Produk Hewani / Products of Animal Origin 103,47 119,02 130,00 140,00 158,00 166,00 167,00 166,00 168,00 168,00 168,00 169,00
6 Pohon hidup, dan Bunga Potong / Live Trees and Cut Flowers 104,62 106,61 120,00 125,00 129,00 136,00 137,00 137,00 137,00 138,00 137,00 138,00
7 Sayuran / Edible Vegetables certain Roots and Tubers 103,73 138,99 140,00 140,00 143,00 140,00 143,00 143,00 143,00 142,00 142,00 142,00
8 Buah-buahan / Edible Fruit and Nuts; Peel of Citrus Fruit or Melons 104,17 118,09 195,00 341,00 375,00 351,00 367,00 400,00 418,00 401,00 389,00 402,00
9 Kopi, Teh, Rempah-rempah / Coffee, Tea, Maté and Spices 101,78 115,36 147,00 149,00 159,00 157,00 153,00 154,00 155,00 154,00 154,00 155,00
10 Gandum-ganduman / Cereals 107,07 118,26 130,00 131,00 131,00 137,00 137,00 137,00 137,00 147,00 147,00 147,00
11 Hasil Penggilingan / Products of the Milling Industry; Starches 100,31 105,51 107,00 105,00 106,00 104,00 99,00 99,00 99,00 99,00 99,00 99,00
12 Biji-bijian berminyak / Oil Seeds; Miscellaneous Grains, Seeds and Fruit 123,64 161,23 212,00 142,00 120,00 149,00 153,00 150,00 154,00 154,00 158,00 160,00
13 Lak, Getah dan Damar dan sejenisnya / Lac, Gums, Resins, and kinds 103,17 117,03 119,00 124,00 126,00 127,00 129,00 129,00 129,00 130,00 131,00 131,00
14 Bahan-bahan Nabati untuk anyaman / Vegetable Plaiting Materials 107,66 114,86 120,00 122,00 119,00 141,00 139,00 138,00 140,00 143,00 152,00 157,00
15 Lemak & Minyak Hewan / Nabati / Animal/Vegetable Fats, Oils and Waxes 121,44 115,75 117,00 115,00 154,00 179,00 181,00 199,00 198,00 191,00 185,00 174,00
16 Daging dan Ikan Olahan / Edible Preparation of Meat, Fish, Crustaceans, etc 111,15 137,00 153,00 170,00 177,00 178,00 176,00 176,00 176,00 180,00 177,00 180,00
17 Gula dan Kembang Gula / Sugars & Sugar Confectionery 107,36 113,28 116,00 116,00 125,00 124,00 124,00 124,00 124,00 124,00 124,00 122,00
18 Kakao / Coklat / Cocoa & Cocoa Preparations 91,09 95,11 119,00 123,00 142,00 120,00 112,00 108,00 113,00 109,00 111,00 104,00
19 Olahan dari Tepung / Preparations of Cereals, Flour, Starch or Milk; Pastrycooks' Products 108,50 123,75 142,00 161,00 155,00 151,00 156,00 156,00 156,00 156,00 156,00 156,00
20 Olahan dari Buah-buahan / Sayuran / Preparations of Vegetables, Fruit, Nuts or Other Parts of Plants 113,98 121,95 119,00 126,00 162,00 162,00 163,00 163,00 164,00 166,00 167,00 167,00
21 Berbagai Makanan Olahan / Miscellaneous Edible Preparations 111,06 120,52 135,00 141,00 141,00 143,00 143,00 143,00 144,00 144,00 144,00 144,00
22 Minuman / Beverages, Spirits and Vinegar 103,73 111,48 115,00 121,00 119,00 120,00 120,00 120,00 121,00 121,00 122,00 122,00
23 Ampas / Sisa Industri Makanan / Residues and Waste from The Food Industries; Prepared Animal Fodder 103,27 113,00 119,00 116,00 128,00 136,00 140,00 134,00 134,00 128,00 128,00 128,00
24 Tembakau / Tobacco and Manufactured Tobacco Substitutes 106,85 125,36 130,00 142,00 162,00 168,00 168,00 168,00 168,00 168,00 167,00 167,00
25 Garam, Belerang, Kapur / Salt; Sulphur; Earths and Stone; Plastering Materials, Lime and Cement 112,11 117,71 150,00 161,00 167,00 167,00 167,00 167,00 167,00 167,00 167,00 167,00
26 Bijih, Kerak dan Abu Logam / Ores, Slag and Ash 118,07 136,81 161,00 194,00 199,00 173,00 173,00 191,00 191,00 189,00 182,00 184,00
27 Bahan Bakar Mineral/Mineral Fuels, Mineral Oils & Products of Their Distillation; Bituminous Substances;
Mineral Waxes
153,88 170,87 169,00 120,00 107,00 128,00 126,00 130,00 127,00 127,00 126,00 125,00
28 Bahan Kimia Anorganik / Inorganic Chemicals; Organic or Inorganic Compounds of Precious Metals, of
Rare-Earth Metals, of Radioactive Elements or of Isotopes
107,10 118,64 136,00 128,00 115,00 115,00 115,00 115,00 115,00 115,00 117,00 117,00
29 Bahan Kimia Organik / Organic Chemicals 114,09 117,65 115,00 125,00 129,00 134,00 131,00 131,00 135,00 133,00 135,00 137,00
30 Produk Industri Farmasi / Pharmaceutical Products 97,27 109,61 127,00 132,00 134,00 134,00 134,00 134,00 134,00 134,00 134,00 134,00
31 Pupuk / Fertilizers 112,30 112,43 121,00 127,00 122,00 124,00 124,00 125,00 125,00 126,00 126,00 126,00
32 Sari Bahan Samak & Celup / Tanning or Dyeing Extracts, Dyes, Pigments, Paints & Varnishes, Putty, & Inks 104,92 113,19 120,00 123,00 123,00 123,00 131,00 131,00 131,00 131,00 131,00 131,00
33 Minyak Atsiri, Kosmetik Wangi-wangian/Essential Oils&Resinoids, Perfumery, Cosmetic or Toilet
Preparations
105,07 121,57 165,00 186,00 185,00 184,00 182,00 184,00 185,00 187,00 182,00 187,00
Jun
TABLE INDEX OF WHOLESALE PRICE OF INDONESIAN EXPORT COMMODITIES
TABLE 2 : ANGKA INDEKS HARGA PERDAGANGAN BESAR BARANG EKSPOR INDONESIA/
Apr2016No.
2
2014Subkelompok / Subgroup 2012 2013FebJan
2015MeiMar Jul
2017
(2010 = 100)

No.08.05.148 Lanjutan/Continued
Jun
TABLE INDEX OF WHOLESALE PRICE OF INDONESIAN EXPORT COMMODITIES
TABLE 2 : ANGKA INDEKS HARGA PERDAGANGAN BESAR BARANG EKSPOR INDONESIA/
Apr2016No. 2014Subkelompok / Subgroup 2012 2013
FebJan2015
MeiMar Jul
2017
(2010 = 100)
34 Sabun dan Preparat Pembersih / Soap, and Washing Preparations 111,70 113,06 116,00 121,00 121,00 124,00 124,00 124,00 125,00 125,00 125,00 125,00
35 Perekat, Enzim /Albuminoidal Substances; Modified Starches; Glues; Enzymes 108,08 117,58 125,00 131,00 130,00 134,00 134,00 134,00 134,00 135,00 135,00 135,00
36 Barang-barang Fotografi / Sinematografi / Photographic or Cinematographic Goods 104,19 114,16 129,00 146,00 152,00 156,00 156,00 156,00 157,00 157,00 156,00 157,00
37 Berbagai Produk Kimia / Miscellaneous Chemical Products 111,78 112,49 121,00 126,00 125,00 126,00 128,00 128,00 129,00 129,00 129,00 128,00
38 Plastik dan Barang dari Plastik / Plastics and Articles Thereof 102,61 109,17 122,00 127,00 123,00 125,00 126,00 129,00 129,00 129,00 129,00 129,00
39 Karet dan Barang dari Karet / Rubber and Articles Thereof 98,58 100,68 104,00 90,00 84,00 93,00 98,00 99,00 98,00 97,00 98,00 94,00
40 Jangat dan Kulit Mentah / Raw Hides and Skins (other than Furskins) and Leather 101,07 116,25 160,00 160,00 151,00 149,00 149,00 143,00 143,00 143,00 145,00 142,00
41 Barang-barang dari Kulit / Articles of Leather; Saddlery and Harness; Travel Goods, Handbags Saddlery
and Harness; and Similar Containers; Articles of Animal Gut (other than Silk-Worm Gut)
88,01 95,13 117,00 133,00 138,00 143,00 146,00 144,00 145,00 145,00 145,00 147,00
42 Kulit Berbulu / Furskins and Artificial Fur; Manufactures Thereof 103,26 112,85 125,00 139,00 148,00 151,00 151,00 152,00 151,00 152,00 151,00 153,00
43 Kayu, Barang dari Kayu / Wood and Articles of Wood; Wood Charcoal 103,68 105,54 107,00 124,00 125,00 122,00 119,00 121,00 122,00 124,00 124,00 124,00
44 Gabus dan Barang-barang Gabus / Cork and Articles of Cork 103,29 114,36 132,00 161,00 165,00 173,00 178,00 178,00 177,00 177,00 177,00 178,00
45 Jerami / Bahan Anyaman / Manufactures of Straw, of Esparto or of Other Plaiting Materials; 104,54 111,92 131,00 149,00 152,00 152,00 152,00 151,00 151,00 151,00 151,00 151,00
46 Bubur Kayu / Pulp / Pulp of Wood or of Other Fibrous Cellulosic Material 115,17 127,30 144,00 162,00 144,00 101,00 102,00 99,00 101,00 101,00 89,00 89,00
47 Kertas / Karton / Paper and Paperboard; Articles of Paper Pulp / Paper / Paperboard 106,30 117,05 133,00 147,00 171,00 187,00 186,00 188,00 188,00 188,00 187,00 190,00
48 Buku dan Barang Cetakan / Printed Books, Newspapers, Pictures and Other Products of The Printing
Industry; Manuscripts, Typescripts and Plans
100,11 101,64 103,00 105,00 109,00 112,00 112,00 113,00 113,00 114,00 114,00 116,00
49 Sutera / Silk, including Yarns & Woven Fabrics Thereof 103,29 109,29 117,00 132,00 132,00 132,00 132,00 132,00 130,00 131,00 131,00 132,00
50 Wol, Bulu Hewan / Wool, Fine or Coarse Animal Hair; Horsehair Yarn and Woven Fabric 101,48 107,53 120,00 132,00 133,00 136,00 135,00 135,00 134,00 137,00 137,00 137,00
51 Kapas / Cotton, including Yarns and Woven Fabrics Thereof 102,88 111,91 114,00 117,00 135,00 137,00 137,00 137,00 137,00 137,00 137,00 137,00
52 Serat Tekstil dan Barang Kertas/Other Vegetable Textile Fibres; Paper Yarn & Woven Fabrics of Paper
Yarn
98,09 99,31 114,00 119,00 112,00 112,00 114,00 114,00 111,00 110,00 110,00 108,00
53 Filamen Buatan / Man-made Filaments 106,59 111,31 117,00 135,00 137,00 137,00 137,00 138,00 137,00 137,00 137,00 137,00
54 Serat Stafel Buatan / Man-made Staple Fibers 102,78 103,14 103,00 101,00 101,00 103,00 103,00 103,00 104,00 104,00 104,00 104,00
55 Kapas Gumpalan, Tali/Wadding, Felt & Nonwovens; Special Yarns; Twine, Cordage, Ropes & Cables &
Articles Thereof
105,50 110,15 121,00 129,00 129,00 131,00 132,00 132,00 133,00 133,00 133,00 134,00
56 Permadani / Carpets and Other Textile Floor Coverings 105,00 109,39 114,00 118,00 115,00 116,00 117,00 117,00 117,00 117,00 117,00 117,00
57 Kain Tenunan Khusus / Special Woven Fabrics; Tufted Textile Fabrics; Lace 104,07 113,67 125,00 126,00 126,00 126,00 126,00 126,00 126,00 126,00 126,00 126,00
58 Kain Ditenun Berlapis/Impregnated, Coated, Covered or Laminated Textile Fabrics; Textile Articles of a kind suitable for Industrial Use103,51 108,92 112,00 115,00 114,00 116,00 116,00 116,00 116,00 116,00 117,00 117,00
59 Kain Rajutan / Knitted or Crocheted Fabrics 104,04 116,42 131,00 143,00 143,00 144,00 144,00 144,00 145,00 145,00 146,00 146,00
60 Barang-barang Rajutan / Articles of Apparel and Clothing Accessories, Knitted or Crocheted 104,07 104,21 103,00 115,00 148,00 160,00 163,00 155,00 151,00 152,00 149,00 158,00
61 Pakaian Jadi Bukan Rajutan / Articles of Apparel and Clothing Accessories, not Knitted or Crocheted 100,43 111,57 135,00 152,00 156,00 157,00 157,00 157,00 159,00 160,00 160,00 160,00
62 Kain Perca / Other Made up Textile Articles; Sets; Worn Clothing and Worn Textile Articles; Rags 105,59 118,80 135,00 134,00 134,00 134,00 134,00 134,00 134,00 134,00 134,00 134,00
63 Alas Kaki / Footwear, Gaiters and The Like; Parts of Such Articles 114,65 115,48 127,00 132,00 134,00 134,00 134,00 134,00 134,00 138,00 138,00 138,00
64 Tutup Kepala / Headgear and Parts Thereof 102,21 104,26 104,00 106,00 115,00 115,00 115,00 115,00 115,00 115,00 115,00 115,00
65 Payung / Umbrellas, Walking-Sticks, Seat-Sticks, Whips, Riding-Crops and Parts Thereof 101,80 111,73 131,00 159,00 165,00 169,00 168,00 169,00 169,00 171,00 170,00 166,00
3

No.08.05.148 Lanjutan/Continued
Jun
TABLE INDEX OF WHOLESALE PRICE OF INDONESIAN EXPORT COMMODITIES
TABLE 2 : ANGKA INDEKS HARGA PERDAGANGAN BESAR BARANG EKSPOR INDONESIA/
Apr2016No. 2014Subkelompok / Subgroup 2012 2013
FebJan2015
MeiMar Jul
2017
(2010 = 100)
66 Bulu Unggas / Prepared Feathers & Down & Articles made of Feathers or of Down; Artificial Flowers; Articles of Human Hair107,38 113,19 145,00 182,00 193,00 244,00 241,00 244,00 236,00 238,00 239,00 241,00
67 Benda-benda dari Batu, Gips & Semen/Articles of Stone, Plaster, Cement, Asbestos, Mica or Similar
Materials
110,76 110,25 111,00 113,00 114,00 114,00 114,00 115,00 115,00 115,00 115,00 116,00
68 Produk Keramik / Ceramic Products 104,82 112,39 115,00 115,00 115,00 115,00 116,00 116,00 116,00 117,00 117,00 117,00
69 Kaca & Barang dari Kaca / Glass and Glassware 107,82 111,92 125,00 140,00 144,00 155,00 155,00 155,00 157,00 158,00 158,00 158,00
70 Perhiasan / Permata / Natural or Cultured Pearls, Precious or Semi-Precious Stones, Precious Metals,
Metals Clad with Precious Metal and Articles Thereof; Imitation Jewellery; Coin
104,16 105,31 107,00 114,00 114,00 115,00 115,00 115,00 115,00 115,00 115,00 116,00
71 Besi dan Baja / Iron and Steel 104,18 107,23 107,00 102,00 102,00 102,00 102,00 102,00 102,00 102,00 102,00 102,00
72 Benda-benda dari Besi dan Baja / Articles of Iron or Steel 98,72 98,82 101,00 103,00 108,00 108,00 108,00 108,00 108,00 108,00 109,00 109,00
73 Tembaga / Copper and Articles Thereof 119,07 141,65 166,00 169,00 165,00 166,00 167,00 166,00 167,00 166,00 165,00 165,00
74 Nikel / Nickel and Articles Thereof 110,77 114,97 107,00 113,00 119,00 126,00 126,00 126,00 129,00 128,00 125,00 122,00
75 Alumunium / Aluminium and Articles Thereof 104,67 118,88 180,00 221,00 218,00 215,00 218,00 218,00 218,00 218,00 218,00 218,00
76 Timah Hitam / Lead and Articles Thereof 103,05 113,29 129,00 132,00 137,00 147,00 148,00 149,00 148,00 148,00 147,00 144,00
77 Seng / Zinc and Articles Thereof 101,91 112,31 129,00 134,00 137,00 141,00 142,00 143,00 144,00 144,00 146,00 146,00
78 Timah / Tin and Articles Thereof 108,70 110,30 106,00 91,00 89,00 102,00 101,00 96,00 98,00 73,00 95,00 93,00
79 Logam Dasar Lainnya / Other Base Metals; Cermets; Articles Thereof 107,92 107,35 113,00 129,00 137,00 140,00 140,00 140,00 137,00 141,00 141,00 141,00
80 Perkakas, Perangkat Potong/Tools, Implements, Cutlery, Spoons & Forks, of Base Metal; Parts Thereof of
Base Metal
115,98 116,79 118,00 129,00 138,00 140,00 140,00 140,00 140,00 140,00 140,00 140,00
81 Berbagai Barang Logam Dasar / Miscellaneous Articles of Base Metal 103,53 111,75 114,00 119,00 121,00 124,00 124,00 124,00 124,00 124,00 126,00 126,00
82 Mesin-mesin / Pesawat Mekanik / Machineries / Mechanical Appliances, Computers 103,20 108,43 115,00 124,00 125,00 125,00 125,00 125,00 125,00 125,00 125,00 125,00
83 Mesin/Peralatan Listik/Electrical Machinery and Equipment & Parts Thereof; Sound Recorders &
Reproducers, Television Image & Sound Recorders & Reproducers, and Parts & Accessories of Such
Articles
105,20 117,14 133,00 139,00 150,00 149,00 149,00 149,00 150,00 151,00 152,00 152,00
84 Kendaraan & Bagiannya/Vehicles Other than Railway or Tramway Rolling-Stock, & Parts & Accessories Thereof103,02 110,53 133,00 189,00 195,00 206,00 206,00 208,00 209,00 212,00 212,00 212,00
85 Kapal Laut dan Bangunan Terapung / Ships, Boats and Floating Structures 103,53 114,75 136,00 160,00 159,00 166,00 166,00 166,00 165,00 165,00 168,00 170,00
86 Perangkat Optik / Optical, Photographic, Cinematographic, Measuring, Checking, Precision, Medical or
Surgical Instruments and Apparatus; Parts and Accessories Thereof
104,19 107,43 113,00 117,00 114,00 114,00 114,00 114,00 115,00 115,00 115,00 116,00
87 Lonceng, Arloji dan Bagiannya / Clocks and Watches and Parts Thereof 103,22 108,33 131,00 177,00 185,00 215,00 215,00 215,00 215,00 215,00 218,00 218,00
88 Perangkat Musik / Musical Instruments; Parts and Accessories of Such Articles 106,20 108,88 109,00 109,00 108,00 108,00 108,00 108,00 108,00 108,00 108,00 108,00
89 Perabot, Penerangan Rumah / Furniture; Bedding, Mattresses, Mattress Supports, Cushions & Similar
Stuffed Furnishings; Lamps & Lighting Fittings, not elsewhere specified or included; Illuminated Signs,
Illuminated Name-Plates and The Like; Prefabricated Buildings.
104,49 124,32 140,00 156,00 162,00 163,00 163,00 163,00 163,00 164,00 164,00 164,00
90 Mainan / Toys, Games and Sports Requisites; Parts and Accessories Thereof 105,65 112,48 119,00 126,00 129,00 131,00 131,00 131,00 131,00 131,00 131,00 131,00
91 Berbagai Barang Buatan Pabrik / Miscellaneous Manufactured Articles 100,52 100,71 99,00 106,00 106,00 107,00 107,00 108,00 108,00 108,00 108,00 108,00
92 Hasil Karya Seni / Works of Art, Collectors' Pieces and Antiques 102,96 105,22 103,00 112,00 106,00 103,00 106,00 106,00 109,00 109,00 110,00 111,00
Ekspor / General Index of Export 122,14 111,91 139,00 130,00 133,00 142,00 142,00 146,00 145,00 144,00 143,00 141,00
Catatan/Note : Tahun Dasar =2010 :100 Whole sale price index base year ( 2010 :100)
Sumber/Source : Badan Pusat Statistik/Central Board of Statistics
4
No. 08.05.148
1 Binatang Hidup / Live Animals 112,90 105,76 107,00 111,00 125,00 138,00 138,00 138,00 134,00 134,00 134,00 134,00
2 Daging Hewan / Meat and Edible Meat Offal 103,75 109,12 112,00 132,00 139,00 150,00 150,00 154,00 154,00 154,00 154,00 162,00
3 Ikan dan Udang / Fish & Crustaceans 107,26 108,42 124,00 132,00 131,00 138,00 138,00 138,00 139,00 140,00 140,00 140,00
4 Susu, Mentega, Telur / Dairy, Eggs, Honey & Edible Products 103,27 105,17 108,00 115,00 116,00 117,00 117,00 117,00 117,00 118,00 118,00 118,00
5 Produk Hewani / Products of Animal Origin 102,76 108,85 118,00 133,00 127,00 128,00 131,00 132,00 132,00 135,00 134,00 135,00
6 Pohon hidup, dan Bunga Potong / Live Trees and Cut Flowers 103,06 115,21 131,00 148,00 151,00 159,00 155,00 154,00 155,00 153,00 154,00 153,00
7 Sayuran / Edible Vegetables certain Roots and Tubers 102,92 122,71 116,00 122,00 174,00 128,00 128,00 128,00 128,00 129,00 128,00 128,00
8 Buah-buahan / Edible Fruit and Nuts; Peel of Citrus Fruit or Melons 102,65 117,32 146,00 184,00 226,00 231,00 233,00 235,00 234,00 233,00 233,00 238,00
9 Kopi, Teh, Rempah-rempah / Coffee, Tea, Maté and Spices 103,88 112,86 123,00 132,00 117,00 92,00 92,00 89,00 89,00 89,00 92,00 92,00
10 Gandum-ganduman / Cereals 131,92 138,99 145,00 159,00 163,00 163,00 163,00 164,00 163,00 162,00 162,00 162,00
11 Hasil Penggilingan / Products of the Milling Industry; Starches 100,33 103,25 109,00 120,00 117,00 116,00 117,00 118,00 119,00 118,00 118,00 118,00
12 Biji-bijian berminyak / Oil Seeds; Miscellaneous Grains, Seeds and Fruit 109,55 117,86 123,00 124,00 120,00 120,00 117,00 117,00 121,00 120,00 119,00 121,00
13 Lak, Getah dan Damar dan sejenisnya / Lac, Gums, Resins, and kinds 102,59 113,07 118,00 119,00 116,00 115,00 116,00 115,00 116,00 118,00 120,00 121,00
14 Bahan-bahan Nabati untuk anyaman / Vegetable Plaiting Materials 103,32 110,62 116,00 138,00 144,00 146,00 146,00 146,00 146,00 146,00 146,00 144,00
15 Lemak & Minyak Hewan / Nabati / Animal/Vegetable Fats, Oils & Waxes 107,26 112,47 116,00 123,00 128,00 132,00 133,00 133,00 134,00 135,00 135,00 135,00
16 Daging dan Ikan Olahan / Edible Preparation of Meat, Fish, Crustaceans, etc 111,97 118,51 135,00 172,00 179,00 173,00 173,00 173,00 173,00 173,00 173,00 173,00
17 Gula dan Kembang Gula / Sugars & Sugar Confectionery 107,03 109,22 104,00 112,00 139,00 137,00 135,00 134,00 133,00 133,00 130,00 130,00
18 Kakao / Coklat / Cocoa & Cocoa Preparations 104,26 113,45 126,00 141,00 150,00 153,00 153,00 151,00 150,00 149,00 149,00 148,00
19 Olahan dari Tepung / Preparations of Cereals, Flour, Starch or Milk; Pastrycooks' Products 106,1 111,97 114,00 114,00 114,00 115,00 115,00 115,00 115,00 115,00 115,00 115,00
20 Olahan dari Buah-buahan / Sayuran / Preparations of Vegetables, Fruit, Nuts or Other Parts of Plants 112,22 113,74 114,00 116,00 118,00 119,00 115,00 115,00 113,00 115,00 115,00 116,00
21 Berbagai Makanan Olahan / Miscellaneous Edible Preparations 105,63 114,37 120,00 123,00 127,00 127,00 127,00 127,00 127,00 127,00 127,00 127,00
22 Minuman / Beverages, Spirits and Vinegar 104,1 109,22 120,00 129,00 135,00 135,00 135,00 135,00 135,00 135,00 135,00 135,00
23 Ampas / Sisa Industri Makanan / Residues and Waste from The Food Industries; Prepared Animal Fodder 110,65 127,23 151,00 174,00 179,00 179,00 181,00 184,00 184,00 184,00 184,00 184,00
24 Tembakau / Tobacco and Manufactured Tobacco Substitutes 119,01 128,18 129,00 144,00 148,00 152,00 154,00 152,00 152,00 154,00 156,00 155,00
25 Garam, Belerang, Kapur / Salt; Sulphur; Earths and Stone; Plastering Materials, Lime and Cement 114,38 118,90 119,00 117,00 115,00 115,00 117,00 118,00 115,00 116,00 116,00 117,00
26 Bijih, Kerak dan Abu Logam / Ores, Slag and Ash 102,93 114,21 124,00 131,00 130,00 135,00 136,00 137,00 135,00 137,00 138,00 141,00
27 Bahan Bakar Mineral / Mineral Fuels, Mineral Oils and Products of Their Distillation; Bituminous
Substances; Mineral Waxes
148,06 169,54 198,00 149,00 99,00 107,00 108,00 112,00 112,00 113,00 113,00 113,00
28 Bahan Kimia Anorganik / Inorganic Chemicals; Organic or Inorganic Compounds of Precious Metals, of
Rare-Earth Metals, of Radioactive Elements or of Isotopes
103,34 110,34 121,00 124,00 128,00 132,00 132,00 132,00 132,00 132,00 132,00 132,00
29 Bahan Kimia Organik / Organic Chemicals 101,93 105,69 107,00 107,00 106,00 106,00 106,00 106,00 106,00 106,00 106,00 106,00
30 Produk Industri Farmasi / Pharmaceutical Products 107,81 113,03 126,00 132,00 139,00 143,00 143,00 144,00 144,00 143,00 143,00 143,00
31 Pupuk / Fertilizers 103,63 103,50 112,00 117,00 121,00 121,00 121,00 121,00 121,00 121,00 121,00 121,00
32 Sari Bahan Samak & Celup / Tanning or Dyeing Extracts, Dyes, Pigments, Paints & Varnishes, Putty, &
Inks
104,53 107,52 118,00 124,00 117,00 118,00 119,00 121,00 121,00 121,00 123,00 123,00
33 Minyak Atsiri, Kosmetik Wangi-wangian / Essential Oils & Resinoids, Perfumery, Cosmetic or Toilet
Preparations
104,59 107,88 112,00 126,00 118,00 122,00 123,00 124,00 122,00 122,00 123,00 123,00
5
TABLE 3 : ANGKA INDEKS HARGA PERDAGANGAN BESAR BARANG IMPOR INDONESIA/
TABLE INDEX OF WHOLESALE PRICE OF INDONESIAN IMPORT COMMODITIES
(2010=100)
Jul
20172014
Mar Apr Mei Jun
Lanjutan/Continued
Jan 2013Subkelompok / Subgroup 2012
Feb2015No. 2016

No. 08.05.148
TABLE 3 : ANGKA INDEKS HARGA PERDAGANGAN BESAR BARANG IMPOR INDONESIA/
TABLE INDEX OF WHOLESALE PRICE OF INDONESIAN IMPORT COMMODITIES
(2010=100)
Jul
20172014
Mar Apr Mei Jun
Lanjutan/Continued
Jan 2013Subkelompok / Subgroup 2012
Feb2015No. 2016
34 Sabun dan Preparat Pembersih / Soap, and Washing Preparations 104,78 106,51 107,00 113,00 114,00 118,00 119,00 120,00 121,00 121,00 122,00 123,00
35 Perekat, Enzim /Albuminoidal Substances; Modified Starches; Glues; Enzymes 106,57 115,76 123,00 134,00 154,00 166,00 166,00 166,00 166,00 170,00 173,00 173,00
36 Barang-barang Fotografi / Sinematografi / Photographic or Cinematographic Goods 102,92 116,10 122,00 131,00 128,00 129,00 129,00 130,00 128,00 130,00 131,00 131,00
37 Berbagai Produk Kimia / Miscellaneous Chemical Products 112,08 114,80 112,00 115,00 118,00 123,00 123,00 123,00 123,00 123,00 123,00 123,00
38 Plastik dan Barang dari Plastik / Plastics and Articles Thereof 103,07 109,09 142,00 171,00 213,00 218,00 223,00 227,00 224,00 226,00 226,00 226,00
39 Karet dan Barang dari Karet / Rubber and Articles Thereof 109,14 111,36 105,00 105,00 104,00 109,00 110,00 114,00 115,00 116,00 115,00 115,00
40 Jangat dan Kulit Mentah / Raw Hides and Skins (other than Furskins) and Leather 101,07 109,61 113,00 115,00 123,00 129,00 128,00 129,00 130,00 130,00 131,00 130,00
41 Barang-barang dari Kulit / Articles of Leather; Saddlery and Harness; Travel Goods, Handbags and Similar
Containers; Articles of Animal Gut (other than Silk-Worm Gut)
112,34 121,13 130,00 156,00 167,00 172,00 173,00 177,00 177,00 179,00 175,00 176,00
42 Kulit Berbulu / Furskins and Artificial Fur; Manufactures Thereof 103,13 114,30 125,00 137,00 139,00 143,00 143,00 143,00 146,00 147,00 146,00 144,00
43 Kayu, Barang dari Kayu / Wood and Articles of Wood; Wood Charcoal 101,79 115,06 156,00 156,00 156,00 158,00 158,00 159,00 159,00 159,00 158,00 156,00
44 Gabus dan Barang-barang Gabus / Cork and Articles of Cork 101,94 119,37 136,00 154,00 165,00 169,00 168,00 171,00 172,00 172,00 169,00 169,00
45 Jerami / Bahan Anyaman / Manufactures of Straw, of Esparto or of Other Plaiting Materials; 103,33 113,34 126,00 149,00 155,00 159,00 161,00 163,00 163,00 163,00 160,00 161,00
46 Bubur Kayu / Pulp / Pulp of Wood or of Other Fibrous Cellulosic Material 124,13 133,50 147,00 153,00 149,00 152,00 152,00 153,00 153,00 155,00 156,00 156,00
47 Kertas / Karton / Paper and Paperboard; Articles of Paper Pulp / Paper / Paperboard 125,64 133,35 140,00 141,00 138,00 138,00 138,00 138,00 138,00 140,00 140,00 140,00
48 Buku dan Barang Cetakan / Printed Books, Newspapers, Pictures and Other Products of The Printing
Industry; Manuscripts, Typescripts and Plans
102,41 114,87 127,00 161,00 174,00 180,00 178,00 180,00 176,00 178,00 180,00 180,00
49 Sutera / Silk, including Yarns & Woven Fabrics Thereof 104,41 113,43 122,00 139,00 142,00 148,00 152,00 152,00 156,00 157,00 156,00 159,00
50 Wol, Bulu Hewan / Wool, Fine or Coarse Animal Hair; Horsehair Yarn and Woven Fabric 101,17 104,41 109,00 108,00 103,00 102,00 103,00 102,00 103,00 103,00 103,00 102,00
51 Kapas / Cotton, including Yarns and Woven Fabrics Thereof 106,51 122,03 135,00 152,00 156,00 161,00 159,00 161,00 158,00 159,00 160,00 161,00
52 Serat Tekstil dan Barang Kertas / Other Vegetable Textile Fibres; Paper Yarn and Woven Fabrics of Paper
Yarn
98,14 100,30 112,00 123,00 128,00 125,00 126,00 125,00 127,00 129,00 129,00 130,00
53 Filamen Buatan / Man-made Filaments 104,34 109,59 110,00 112,00 108,00 110,00 110,00 110,00 111,00 112,00 113,00 114,00
54 Serat Stafel Buatan / Man-made Staple Fibers 103,05 103,80 102,00 107,00 108,00 106,00 107,00 108,00 108,00 109,00 109,00 109,00
55 Kapas Gumpalan, Tali / Wadding, Felt and Nonwovens; Special Yarns; Twine, Cordage, Ropes and
Cables and Articles Thereof
102,65 107,77 107,00 108,00 107,00 106,00 106,00 106,00 107,00 107,00 107,00 105,00
56 Permadani / Carpets and Other Textile Floor Coverings 102,41 106,98 110,00 113,00 118,00 120,00 120,00 120,00 120,00 120,00 126,00 126,00
57 Kain Tenunan Khusus / Special Woven Fabrics; Tufted Textile Fabrics; Lace 104,41 113,50 115,00 116,00 123,00 135,00 134,00 134,00 134,00 135,00 134,00 134,00
58 Kain Ditenun Berlapis/Impregnated, Coated, Covered or Laminated Textile Fabrics; Textile Articles of a
kind suitable for Industrial Use
104,49 112,48 119,00 135,00 139,00 141,00 139,00 141,00 138,00 139,00 141,00 140,00
59 Kain Rajutan / Knitted or Crocheted Fabrics 104,97 110,84 111,00 109,00 107,00 106,00 107,00 108,00 107,00 107,00 107,00 107,00
60 Barang-barang Rajutan / Articles of Apparel and Clothing Accessories, Knitted or Crocheted 103,49 110,61 120,00 136,00 135,00 135,00 135,00 135,00 136,00 136,00 137,00 137,00
61 Pakaian Jadi Bukan Rajutan / Articles of Apparel and Clothing Accessories, not Knitted or Crocheted 104,46 109,10 119,00 124,00 126,00 130,00 130,00 130,00 130,00 131,00 131,00 131,00
62 Kain Perca / Other Made up Textile Articles; Sets; Worn Clothing and Worn Textile Articles; Rags 103,99 112,64 111,00 113,00 126,00 129,00 130,00 132,00 132,00 132,00 132,00 132,00
63 Alas Kaki / Footwear, Gaiters and The Like; Parts of Such Articles 105,85 107,32 104,00 110,00 111,00 112,00 114,00 115,00 117,00 117,00 116,00 117,00
64 Tutup Kepala / Headgear and Parts Thereof 101,26 109,85 114,00 124,00 126,00 132,00 131,00 132,00 132,00 133,00 134,00 136,00
65 Payung / Umbrellas, Walking-Sticks, Seat-Sticks, Whips, Riding-Crops and Parts Thereof 105,37 104,50 99,00 112,00 113,00 115,00 118,00 120,00 121,00 124,00 126,00 126,00
6

No. 08.05.148
TABLE 3 : ANGKA INDEKS HARGA PERDAGANGAN BESAR BARANG IMPOR INDONESIA/
TABLE INDEX OF WHOLESALE PRICE OF INDONESIAN IMPORT COMMODITIES
(2010=100)
Jul
20172014
Mar Apr Mei Jun
Lanjutan/Continued
Jan 2013Subkelompok / Subgroup 2012
Feb2015No. 2016
66 Bulu Unggas/Prepared Feathers & Down and Articles made of Feathers or of Down; Artificial Flowers;
Articles of Human Hair
106,77 112,81 118,00 141,00 138,00 137,00 137,00 134,00 134,00 134,00 135,00 135,00
67 Benda-benda dari Batu, Gips dan Semen / Articles of Stone, Plaster, Cement, Asbestos, Mica or Similar
Materials
105,27 106,87 109,00 113,00 103,00 100,00 100,00 100,00 100,00 100,00 100,00 100,00
68 Produk Keramik / Ceramic Products 110,45 112,68 121,00 133,00 139,00 141,00 141,00 141,00 141,00 141,00 143,00 143,00
69 Kaca & Barang dari Kaca / Glass and Glassware 103,96 112,83 109,00 113,00 116,00 124,00 124,00 125,00 126,00 126,00 126,00 126,00
70 Perhiasan/Permata/Natural or Cultured Pearls, Precious or Semi-Precious Stones, Precious Metals,
Metals Clad with Precious Metal and Articles Thereof; Imitation Jewellery; Coin
103,82 107,27 106,00 145,00 148,00 153,00 151,00 153,00 150,00 151,00 152,00 155,00
71 Besi dan Baja / Iron and Steel 103,28 102,99 108,00 109,00 105,00 107,00 109,00 111,00 112,00 112,00 111,00 111,00
72 Benda-benda dari Besi dan Baja / Articles of Iron or Steel 105,07 116,28 132,00 140,00 145,00 146,00 146,00 146,00 146,00 146,00 146,00 146,00
73 Tembaga / Copper and Articles Thereof 107,31 112,83 116,00 120,00 119,00 126,00 126,00 127,00 127,00 128,00 128,00 129,00
74 Nikel / Nickel and Articles Thereof 99,89 101,42 104,00 112,00 105,00 107,00 106,00 105,00 108,00 106,00 109,00 105,00
75 Alumunium / Aluminium and Articles Thereof 102,81 104,35 106,00 112,00 111,00 111,00 113,00 113,00 114,00 114,00 114,00 115,00
76 Timah Hitam / Lead and Articles Thereof 99,85 101,44 106,00 103,00 100,00 105,00 107,00 107,00 107,00 110,00 108,00 108,00
77 Seng / Zinc and Articles Thereof 97,59 99,01 102,00 111,00 109,00 122,00 122,00 122,00 122,00 122,00 122,00 122,00
78 Timah / Tin and Articles Thereof 105,73 115,77 127,00 143,00 140,00 144,00 144,00 147,00 148,00 152,00 153,00 150,00
79 Logam Dasar Lainnya / Other Base Metals; Cermets; Articles Thereof 104,52 114,40 125,00 138,00 133,00 129,00 130,00 127,00 129,00 130,00 131,00 131,00
80 Perkakas, Perangkat Potong / Tools, Implements, Cutlery, Spoons and Forks, of Base Metal; Parts
Thereof of Base Metal
100,32 104,66 113,00 140,00 154,00 158,00 158,00 158,00 158,00 158,00 158,00 158,00
81 Berbagai Barang Logam Dasar / Miscellaneous Articles of Base Metal Articles of Base Metal 106,46 110,41 117,00 120,00 122,00 123,00 126,00 126,00 126,00 126,00 126,00 126,00
82 Mesin-mesin / Pesawat Mekanik / Machineries / Mechanical Appliances, Computers 110,00 115,58 129,00 140,00 144,00 145,00 145,00 146,00 147,00 147,00 147,00 147,00
83 Mesin / Peralatan Listik / Electrical Machinery and Equipment and Parts Thereof; Sound Recorders and
Reproducers, Television Image and Sound Recorders and Reproducers, and Parts and Accessories of
Such Articles
100,36 104,06 116,00 125,00 130,00 132,00 132,00 133,00 133,00 133,00 133,00 132,00
84 Kendaraan dan Bagiannya / Vehicles Other than Railway or Tramway Rolling-Stock, and Parts and
Accessories Thereof
100,70 104,29 117,00 126,00 131,00 133,00 133,00 134,00 135,00 135,00 135,00 135,00
85 Kapal Laut dan Bangunan Terapung / Ships, Boats and Floating Structures 103,27 112,99 121,00 139,00 141,00 144,00 146,00 143,00 147,00 144,00 143,00 139,00
86 Perangkat Optik/Optical, Photographic, Cinematographic, Measuring, Checking, Precision, Medical or
Surgical Instruments & Apparatus; Parts and Accessories Thereof
104,01 110,87 129,00 135,00 139,00 140,00 141,00 142,00 142,00 144,00 144,00 144,00
87 Lonceng, Arloji dan Bagiannya / Clocks and Watches and Parts Thereof 103,75 140,62 134,00 146,00 155,00 155,00 155,00 155,00 155,00 155,00 155,00 155,00
88 Perangkat Musik / Musical Instruments; Parts and Accessories of Such Articles 99,60 102,46 107,00 117,00 132,00 132,00 132,00 132,00 132,00 132,00 132,00 132,00
89 Perabot, Penerangan Rumah/Furniture; Bedding, Mattresses, Mattress Supports, Cushions & Similar
Stuffed Furnishings; Lamps & Lighting Fittings, not elsewhere specified or included; Illuminated Signs,
Illuminated Name-Plates & The Like; Prefabricated Buildings.
101,41 105,60 109,00 111,00 121,00 131,00 131,00 131,00 131,00 131,00 131,00 131,00
90 Mainan / Toys, Games and Sports Requisites; Parts and Accessories Thereof 103,06 108,42 111,00 114,00 119,00 122,00 122,00 122,00 122,00 122,00 125,00 122,00
91 Berbagai Barang Buatan Pabrik / Miscellaneous Manufactured Articles 104,20 113,02 115,00 117,00 110,00 111,00 112,00 112,00 113,00 114,00 115,00 117,00
92 Hasil Karya Seni / Works of Art, Collectors' Pieces and Antiques 103,84 113,35 132,00 149,00 151,00 159,00 155,00 158,00 157,00 157,00 157,00 157,00
Impor / General index of import sector 114,39 122,03 137,00 134,00 128,00 131,00 132,00 133,00 133,00 134,00 134,00 134,00
Sumber/Source : Badan Pusat Statistik/Central Board of Statistics
7
Catatan/Note : Tahun Dasar =2010 :100 Whole sale price index base year ( 2010 :100)

No. 08.05.148
Jan/Jan Feb/Feb Mar/Mar Apr/Apr Mei/May Jun/Jun Jul/Jul Ags/Ags Sep/Sep
1 Karet/ Rubber, Singapura US $ /Kg 3,4 2,8 2,0 1,6 1,6 2,6 2,7 2,3 2,2 2,1 1,7 1,7 1,8 1,9
2 Kayu: Logs, Malaysia US/cum 360,5 305,4 282,0 246,0 274,4 258,6 263,5 263,5 270,3 265,3 268,4 264,6 271,0 268,9
3 Kayu lapis/Plywood C/sheet 610,3 560,2 517,3 451,2 503,3 474,3 483,2 483,3 495,9 486,6 492,3 485,4 497,0 493,3
4 Myk sawit/Palm Oil US $ /mt 999,3 856,9 821,4 622,7 699,7 805,8 778,8 736,0 685,0 727,0 677,0 663,0 674,0 724,0
5 Minyak biji sawi/Palm Kernel Oil US $ /mt 1.110,3 897,2 1.121,4 908,9 1.288,5 1.762,5 1.613,8 1.228,0 1.029,0 1.097,0 1.029,0 1.007,0 1.165,0 1.346,0
6 Beras putih/White Rice, 5 %Thailand US $ /mt 563,0 505,9 422,8 386,0 396,2 377,0 367,0 370,0 380,0 421,0 458,0 417,0 393,0 402,0
7 Gandum/Wheat (Kanada) US $ /mt 313,2 312,2 284,9 204,5 166,7 153,3 155,2 154,3 166,1 180,4 189,6 202,5 171,2 178,6
8 Jagung /Meize US $ /mt 298,4 259,4 192,9 169,8 159,2 160,0 162,9 159,0 156,4 158,6 157,9 157,5 148,5 147,3
9 Kacang kedelai/Soy beans US $ /mt 591,4 538,4 491,8 390,4 406,1 425,3 427,8 405,0 389,0 388,0 380,0 408,0 390,0 397,0
10 Gula/Sugar, UE domestic US $/Kg 0,4 0,4 0,4 0,4 0,4 0,3 0,3 0,3 0,3 0,4 0,4 0,4 0,4 0,4
11 Kopi Robusta/Robusta Cofee US $/Kg 2,3 2,1 2,2 1,9 2,0 2,4 2,3 2,4 2,3 2,2 2,2 2,3 2,3 2,2
12 Cocoa/Coklat US $/Kg 2,4 2,4 3,1 3,1 2,9 2,2 2,0 2,1 2,0 2,0 2,0 2,0 2,0 2,0
13 Teh kolombo/Tea Colombo auctions US $/Kg 3,1 3,5 3,5 3,0 3,2 4,0 3,9 4,2 4,3 4,1 3,9 3,9 4,0 4,2
14 Kopra/Copra US $ /mt 740,6 627,0 854,3 735,3 983,4 1.225,0 1.146,3 1.016,0 1.044,0 1.112,5 1.119,0 1.059,0 1.062,0 1.015,0
15 Minyak Kelapa/Coconut oils US $ /mt 1.110,8 940,6 1.279,9 1.109,5 1.471,4 1.836,3 1.718,8 1.547,0 1.580,0 1.687,0 1.697,0 1.591,0 1.604,0 1.525,0
16 Udang/shrimp, Mexican US $/kg 10,1 13,8 17,2 14,4 11,2 12,1 12,1 12,1 12,1 12,1 12,1 12,1 .. ..
17 Aluminium /Aluminium US $ /mt 2.023,3 1.846,7 1.867,4 1.664,7 1.603,6 1.790,1 1.860,8 1.901,5 1.921,2 1.913,0 1.885,3 1.903,0 2.030,0 2.096,5
18 Timah/Tin US $/mt 21.126,0 22.282,8 21.898,9 16.066,6 17.925,6 20.737,2 19.446,5 19.875,2 19.910,3 20.200,3 19.658,8 20.223,5 20.521,0 20.796,6
19 Tembaga/copper (London) US $ /mt 7.962,3 7.332,1 6.863,4 5.510,5 4.866,7 5.742,6 5.940,9 5.824,6 5.683,9 5.599,6 5.719,8 5.985,1 6.485,6 6.577,2
20 Nikel/Nickel, (London) US $ /mt 17.547,5 15.031,8 16.893,4 11.862,6 9.593,7 9.975,1 10.643,3 10.204,7 9.609,3 9.155,1 8.931,8 9.491,4 10.890,0 11.215,8
21 Urea, UE Europe, bulk US $ /mt 405,4 340,1 316,2 272,9 199,3 241,0 247,0 234,0 205,0 180,0 185,0 185,0 198,0 235,0
Sumber/Source : DECPG, The World Bank
8
TABLE WORLD MARKET PRICES OF SELECTED COMMODITIES
TABLE 4 : HARGA BEBERAPA BARANG DI PASAR DUNIA/
Jenis Barang/Commodity 2015 2013NO.
Harga
Satuan/
Unit Price
2012
2017
2014 2016
Des Jan Feb Mar Apr Mei Jun Jul Ags Sep
Dec Jan Feb Mar Apr May Jun Jul Ags Sep
1 Beras/Rice Kg 8.922,2 10.147,7 10.697,5 10.697,7 10.703,1 10.629,3 10.557,4 10.589,4 10.599,3 10.574,7 10.616,4 10.636,1
2 Gula Pasir Lokal/ Kg 11.325,7 12.363,1 14.133,3 14.010,5 13.835,4 13.783,5 13.701,4 13.571,2 13.429,1 13.312,2 13.204,5 13.034,6
Local Refined Suger
3 Minyak Goreng Kemasan/ 620 ml 14.604,7 15.148,7 14.932,0 14.929,3 14.918,6 15.020,2 15.017,6 15.005,0 15.060,6 14.990,9 15.043,6 15.071,9
Cooking Oil in Pack
4 Minyak Goreng Tanpa Merk/ Kg 11.527,7 11.014,9 11.674,6 11.753,9 11.927,4 11.913,8 11.498,3 11.483,1 11.478,7 11.458,2 11.403,3 11.430,4
Cooking Oil Non Merk
5 Daging Sapi/Beef Kg 99.331,7 105.306,8 114.318,5 114.430,4 115.405,6 114.811,7 114.813,3 115.187,7 116.363,3 116.607,1 117.275,9 116.417,9
6 Daging Ayam Boiler/ Kg 28.976,4 30.083,5 31.388,6 32.947,7 29.958,9 29.249,7 29.811,0 31.227,3 30.689,4 31.164,3 32.208,0 30.793,1
Flesh of Chicken Boiler
7 Daging Ayam Kampung/ Kg 58.764,4 61.461,3 63.177,5 63.822,3 62.970,0 62.379,9 62.185,7 63.393,8 65.773,8 64.569,9 64.626,0 65.221,7
Flesh of Kampong Chicken
8 Telur Ayam Ras/Chicken's Egg Ras Kg 20.062,7 22.139,2 23.279,3 23.467,1 22.400,1 21.860,7 21.658,6 22.600,3 22.859,2 22.815,6 22.816,2 22.671,2
9 Telur Ayam Kampung/ Kg 40.416,1 41.530,9 44.145,0 44.324,6 44.435,5 44.204,4 44.247,9 44.128,3 44.003,9 43.489,8 44.560,0 45.037,5
Chicken'S Egg Kampong
10 Susu Kental Manis/ Kg 9.839,3 10.262,6 10.423,9 10.414,4 10.415,3 10.419,2 10.392,4 10.412,7 10.431,5 10.421,2 10.444,4 10.427,4
Sweet Heavy Milk
11 Tepung Terigu/Wheat Flour Kg 8.733,2 8.922,6 8.888,1 8.863,9 8.804,3 8.849,1 8.816,5 8.747,2 8.700,6 8.668,7 9.046,9 9.104,6
12 Kedelai Impor/Import Soybean Kg 11.117,7 11.086,4 10.698,7 10.669,2 10.684,0 10.668,4 10.620,3 10.612,4 10.612,5 10.643,6 10.586,1 10.688,4
13 Kedelai Lokal/Local Soybean Kg 10.659,2 10.934,2 10.980,0 10.841,1 10.719,0 10.864,8 10.954,4 10.592,5 10.476,0 10.613,1 10.792,8 10.728,0
14 Mie Instant/Noodles Instant Bks 1.907,9 2.118,2 2.364,8 2.364,6 2.359,6 2.368,0 2.377,7 2.394,7 2.408,3 2.420,3 2.424,0 2.425,3
15 Cabe Merah Keriting/ Kg 30.360,1 31.067,1 45.893,1 44.382,7 43.290,8 38.449,3 30.420,5 29.504,2 27.329,6 29.856,5 29.296,9 29.894,1
Frizzy Ordinary Chili
16 Cabe Merah Besar/ Kg 30.189,4 29.729,9 42.594,3 38.974,6 39.148,7 33.593,9 29.867,3 31.292,0 28.013,8 29.514,8 29.466,3 28.748,3
Large Red Chili Pepper
17 Bawang Merah / Shallot kg 22.634,6 25.243,8 53.921,2 90.167,3 106.529,7 101.283,3 67.050,9 57.139,4 46.779,6 52.735,1 41.593,8 34.732,8
18 Ikan Teri Asin/Small Fish Salted Kg 63.644,2 66.708,2 73.862,1 74.568,3 74.718,4 73.900,3 73.899,1 73.896,2 74.248,3 74.749,7 77.226,2 78.313,7
19 Kacang Hijau/Green Bean Kg 18.925,1 20.538,9 19.923,3 19.716,1 19.702,5 20.099,9 20.555,6 20.975,2 21.245,5 21.130,7 21.440,2 21.226,4
20 Kacang Tanah/Peanut Kg 18.494,8 23.271,6 24.861,1 24.493,0 24.191,5 24.278,6 25.014,2 25.357,5 25.511,6 25.690,3 25.483,8 25.756,8
21 Ketela Pohon/Cassava Kg 5,167,3 5.265,3 5.600,6 5.621,0 5.437,0 5.349,8 5.335,9 5.381,7 5.493,0 5.414,8 5.421,7 5.651,8
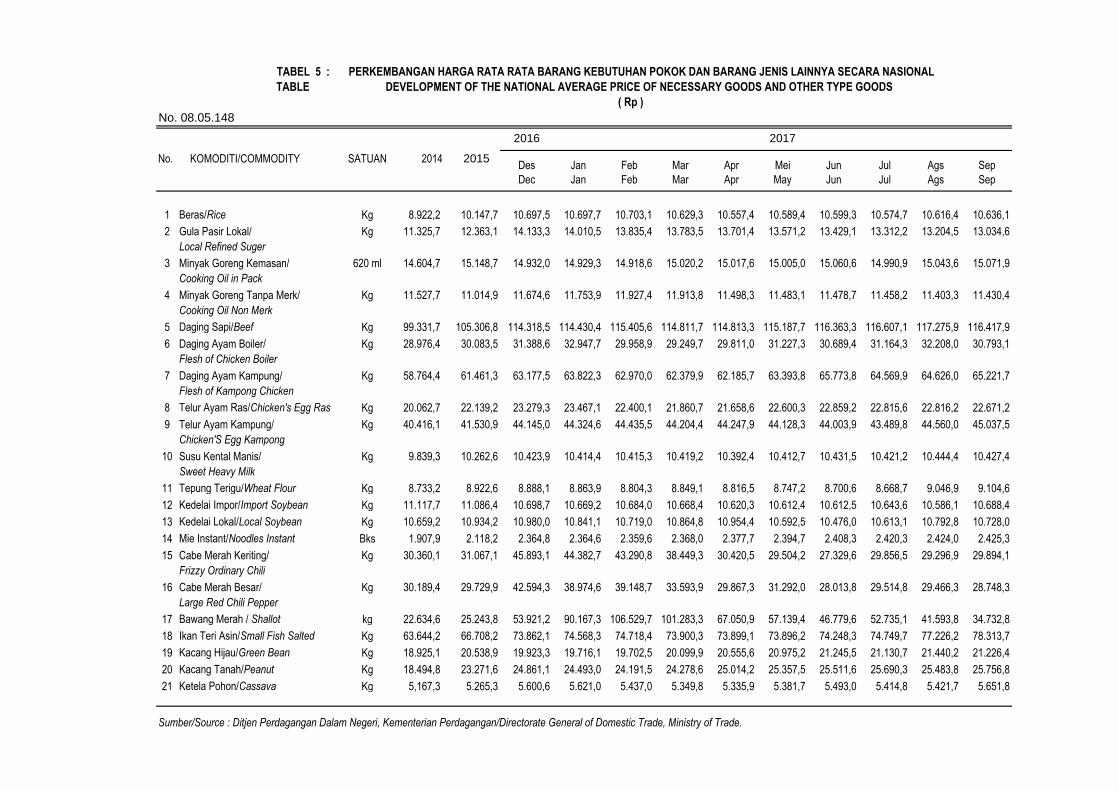
Sumber/Source : Ditjen Perdagangan Dalam Negeri, Kementerian Perdagangan/Directorate General of Domestic Trade, Ministry of Trade.
2017
TABEL 5 : PERKEMBANGAN HARGA RATA RATA BARANG KEBUTUHAN POKOK DAN BARANG JENIS LAINNYA SECARA NASIONAL
TABLE DEVELOPMENT OF THE NATIONAL AVERAGE PRICE OF NECESSARY GOODS AND OTHER TYPE GOODS
( Rp )
2014
No. 08.05.148
SATUAN 2015
2016
No. KOMODITI/COMMODITY

TABEL 6 : NERACA PERDAGANGAN INDONESIA
TABLE THE INDONESIAN BALANCE OF TRADE
No. 08.05.148 Nilai/Value : Juta/Million US$
EKSPOR/EXPORT IMPOR/IMPORT NERACA/BALANCE
MIGAS/ NON MIGAS/ TOTAL/ MIGAS/ NON MIGAS/ TOTAL/ MIGAS/ NON MIGAS/ TOTAL/
OIL & GAS NON OIL & GAS TOTAL OIL & GAS NON OIL & GAS TOTAL OIL & GAS NON OIL & GAS TOTAL
2011 : 41.477,0 162.019,6 203.496,6 40.701,5 136.734,0 177.435,6 775,5 25.285,5 26.061,1
2012 : 36.977,3 153.054,6 190.031,8 42.564,2 149.126,8 191.691,0 -112.149,5 -38.636,4 -150.785,9
2013 : 32.633,0 149.918,8 182.551,8 45.266,4 141.362,3 186.628,7 -12.633,3 8.556,4 -4.076,9
2014 : 30.331,9 145.960,8 176.292,7 43.459,9 134.718,9 178.178,8 -13.128,0 11.241,9 -1.886,2
2015 : 30.331,9 145.960,8 176.292,7 43.459,9 134.718,9 178.178,8 -13.128,0 11.241,9 -1.886,2
2016 : 13.105,5 131.384,4 144.489,8 18.739,3 116.913,6 135.652,9 -5.633,9 14.470,8 8.836,9
Januari/January 1.108,0 9.372,6 10.480,6 1.221,5 9.245,5 10.467,0 -113,5 127,1 13,6
Pebruari/February 1.113,3 10.198,7 11.312,0 1.122,9 9.052,7 10.175,6 -9,6 1.146,0 1.136,4
Maret/March 1.239,3 10.570,7 11.810,0 1.552,4 9.749,3 11.301,7 -313,1 821,4 508,3
April/April 891,7 10.584,1 11.475,9 1.362,1 9.451,5 10.813,6 -470,4 1.132,6 662,2
Mei/May 957,9 10.556,4 11.514,3 1.668,5 9.472,2 11.140,7 -710,5 1.084,2 373,6
Juni/June 1.187,4 11.787,1 12.974,4 1.772,2 10.323,0 12.095,2 -584,8 1.464,1 879,2
Juli/July 998,6 8.532,1 9.530,8 1.506,4 7.510,8 9.017,2 -507,7 1.021,3 513,6
Agustus/August 1.138,6 11.609,7 12.748,3 1.795,8 10.589,3 12.385,2 -657,2 1.020,4 363,2
September/September 1.061,5 11.507,0 12.568,5 1.766,4 9.531,1 11.297,5 -705,0 1.975,9 1.271,0
Oktober/October 1.055,9 11.686,8 12.742,6 1.545,1 9.962,1 11.507,2 -489,2 1.724,6 1.235,4
Nopember/November 1.103,0 12.400,6 13.503,6 1.724,1 10.945,3 12.669,4 -621,1 1.455,2 834,2
Desember/December 1.250,1 12.578,6 13.828,7 1.701,9 11.080,6 12.782,5 -451,8 1.498,0 1.046,2
2017 : 11.467,6 111.907,3 123.374,9 17.341,6 95.144,4 112.486,0 -5.874,0 16.762,9 10.889,0
Januari/January 1.271,6 12.130,1 13.401,7 1.828,0 10.140,4 11.968,4 -556,4 1.989,7 1.433,3
Pebruari/February 1.198,1 11.415,4 12.613,5 2.473,1 8.880,9 11.354,0 -1.275,0 2.534,5 1.259,5
Maret/March 1.511,2 13.167,6 14.678,8 2.277,0 11.006,5 13.283,4 -765,8 2.161,2 1.395,4
April/April 1.035,8 12.243,4 13.279,2 1.646,7 10.298,5 11.945,2 -610,9 1.944,9 1.334,0
Mei/May 1.296,0 13.049,4 14.345,4 1.791,6 11.975,5 13.767,1 -495,6 1.073,8 578,2
Juni/June 1.273,8 10.382,1 11.655,9 1.600,6 8.391,2 9.991,8 -326,8 1.990,9 1.664,1
Juli/July 1.165,0 12.446,2 13.611,2 1.778,7 12.106,9 13.885,6 -613,7 339,3 -274,4
Agustus/August 1.276,9 13.952,5 15.229,4 2.011,2 11.498,3 13.509,5 -734,3 2.454,2 1.719,9
Sumber/Source : Badan Pusat Statistik/ Statistics Indonesia
10
TAHUN - BULAN/
YEAR - MONTH

No.08.05.147 Nilai/Value : Ribu/Thousand US$
EKSPOR/ IMPOR/ NERACA/ EKSPOR/ IMPOR/ NERACA/ EKSPOR/ IMPOR/ NERACA/ EKSPOR/ IMPOR/ NERACA/
EXPORT IMPORT BALANCE EXPORT IMPORT BALANCE EXPORT IMPORT BALANCE EXPORT IMPORT BALANCE
ASIA TIMUR / EAST ASIA 60.610.339,4 65.114.781,6 -4.504.442,2 47.821.891,2 56.104.314,5 -8.282.423,3 45.708.525,4 55.150.512,1 -9.441.986,8 50.257.291,9 58.051.687,0 -7.794.395,1
Jepang/Japan 23.165.662,5 17.007.578,8 6.158.083,7 18.014.346,8 13.263.523,3 4.750.823,6 16.101.545,9 12.984.774,1 3.116.771,8 16.055.790,4 13.914.818,4 2.140.972,0Hongkong/Hongkong 2.777.563,7 1.848.444,7 929.118,9 2.059.396,0 1.817.367,0 242.029,0 2.144.834,9 1.773.785,6 371.049,3 2.211.048,6 1.668.782,0 542.266,5Korea Utara/North Korea 1.414,0 1.562,2 -148,2 1.039,8 2.603,2 -1.563,4 5.548,3 1.391,6 4.156,7 260,7 1.996,9 -1.736,2Korea Selatan/South Korea 10.621.193,3 11.847.398,7 -1.226.205,5 7.649.742,6 8.427.205,9 -777.463,3 7.007.623,7 6.674.573,5 333.050,2 7.503.825,2 7.413.363,4 90.461,8Taiwan/Taiwan, Province of China 6.425.103,3 3.758.171,3 2.666.932,1 5.037.356,4 3.172.722,7 1.864.633,7 3.652.643,6 2.889.874,5 762.769,1 3.804.520,6 2.996.040,8 808.479,8RRC/People Rep. of China 17.606.219,6 30.624.335,5 -13.018.115,9 15.045.331,8 29.410.887,1 -14.365.555,3 16.785.585,2 30.800.493,1 -14.014.907,8 20.669.875,2 32.036.482,9 -11.366.607,7
Asia Timur lainnya/Other East Asia 13.183,1 27.290,4 -14.107,3 14.677,8 10.005,3 4.672,5 10.743,8 25.619,8 -14.876,1 11.971,1 20.202,5 -8.231,4
ASIA SELATAN & TENGGARA / SOUTH & SOUTH EAST ASIA 56.165.649,3 55.179.750,7 985.898,5 49.254.252,7 41.949.460,1 7.304.792,6 47.063.371,3 37.989.047,5 9.074.323,8 52.981.705,8 39.547.957,3 13.433.748,4
ASEAN / ASEAN 39.822.146,1 50.725.953,8 -10.903.807,6 33.572.259,2 38.795.069,2 -5.222.810,0 33.202.853,9 34.696.966,4 -1.494.112,5 35.966.145,6 35.521.423,3 444.722,3
- Muangthai/Thailand 5.829.824,6 9.781.043,4 -3.951.218,8 5.507.225,3 8.083.368,3 -2.576.143,0 5.392.399,3 8.666.934,0 -3.274.534,6 5.933.908,2 8.500.469,4 -2.566.561,2- Singapura/Singapore 16.806.853,4 25.185.667,8 -8.378.814,4 12.632.335,3 18.022.626,4 -5.390.291,1 11.246.431,9 14.548.298,5 -3.301.866,6 11.731.783,3 15.139.340,6 -3.407.557,2- Pilipina/Phillipines 3.887.831,7 699.736,6 3.188.095,1 3.921.250,5 683.083,2 3.238.167,2 5.270.872,7 821.806,2 4.449.066,5 6.012.900,8 786.253,2 5.226.647,6- Malaysia/Malaysia 9.758.874,7 10.855.394,4 -1.096.519,7 7.626.908,2 8.530.667,6 -903.759,3 7.112.008,2 7.200.944,3 -88.936,1 7.731.813,3 7.897.218,9 -165.405,6- Myanmar/Myanmar 566.906,9 122.077,0 444.829,9 615.670,4 160.418,4 455.252,0 615.683,5 113.339,6 502.343,9 739.898,4 136.718,2 603.180,3- Brunai Darussalam/Brunei 100.296,0 594.302,7 -494.006,7 91.229,5 131.437,2 -40.207,7 88.667,3 87.726,7 940,6 59.747,2 41.916,7 17.830,6- Vietnam/Vietnam 2.451.196,7 3.417.776,8 -966.580,1 2.740.178,9 3.161.530,5 -421.351,6 3.045.496,4 3.228.402,1 -182.905,7 3.285.823,3 2.982.583,9 303.239,4- Kamboja/Cambodia 415.816,8 18.696,9 397.119,9 429.715,9 21.127,8 408.588,1 425.420,5 25.317,8 400.102,7 466.588,4 26.163,3 440.425,1- Laos/Laos Peop. Dem. Rep. 4.545,2 51.258,1 -46.712,9 7.745,2 809,8 6.935,4 5.873,9 4.197,1 1.676,9 3.682,7 10.759,2 -7.076,6
DI LUAR ASEAN / NON ASEAN 16.343.503,1 4.453.797,0 11.889.706,2 15.681.993,5 3.154.390,8 12.527.602,6 13.860.517,4 3.292.081,1 10.568.436,3 17.015.560,1 4.026.534,0 12.989.026,1
India/India 12.248.959,6 3.952.081,2 8.296.878,4 11.713.021,1 2.741.418,3 8.971.602,8 10.093.804,4 2.872.789,3 7.221.015,1 12.879.386,3 3.669.757,9 9.209.628,4Pakistan/Pakistan 2.045.294,4 159.389,6 1.885.904,7 1.989.563,4 174.512,4 1.815.051,1 2.018.232,6 157.255,8 1.860.976,8 2.176.170,5 203.792,0 1.972.378,4Bangladesh/Bangladesh 1.377.619,0 71.299,8 1.306.319,2 1.340.794,2 59.471,0 1.281.323,2 1.266.688,1 68.404,3 1.198.283,8 1.464.386,4 66.064,9 1.398.321,5Sri Langka/Sri Lanka 386.328,1 45.995,9 340.332,2 341.490,4 41.281,7 300.208,7 262.228,4 44.303,2 217.925,2 269.409,8 45.327,2 224.082,6Papua Nugini/Papua New Guinea 159.119,5 47.560,7 111.558,8 202.304,4 19.639,6 182.664,8 150.192,3 28.788,1 121.404,1 164.837,5 24.830,5 140.007,0Afganistan/Afghanistan 77.411,2 212,2 77.199,0 36.317,1 248,3 36.068,8 16.220,1 31,1 16.189,0 18.180,0 9,5 18.170,5Republik Maladewa/Maldives 30.952,5 0,2 30.952,3 32.204,6 - 32.204,6 39.202,3 114,7 39.087,6 34.127,7 1,5 34.126,2
Di luar Asean/Other Non-Asean Countries 17.818,9 177.257,3 -159.438,3 26.298,2 117.819,6 -91.521,4 13.949,3 120.394,6 -106.445,3 9.062,0 16.750,5 -7.688,6
ASIA BARAT/WEST ASIA 7.729.042,8 12.926.395,5 -5.197.352,6 6.422.335,5 6.970.115,6 -547.780,2 5.184.161,5 6.021.457,1 -837.295,6 5.137.625,3 7.241.229,5 -2.103.604,2
Pers Emirat Arab/United Arab Emirat 2.503.134,0 1.754.332,4 748.801,5 1.926.295,7 1.356.098,7 570.196,9 1.612.105,6 1.316.201,9 295.903,7 1.499.547,4 1.891.997,0 -392.449,5Saudi Arabia/Arab Saudi 2.156.325,1 6.516.224,0 -4.359.898,9 2.060.685,0 3.421.631,5 -1.360.946,5 1.333.075,0 2.725.032,6 -1.391.957,6 1.292.929,7 2.837.494,0 -1.544.564,3Turki/Turkey 1.446.131,3 1.030.647,6 415.483,7 1.158.833,0 249.821,1 909.011,9 1.024.069,8 311.154,3 712.915,4 1.071.824,3 454.366,7 617.457,6Iran/Iran 406.112,2 42.547,8 363.564,3 216.505,3 56.588,6 159.916,7 235.194,4 103.405,1 131.789,3 271.785,4 328.005,2 -56.219,8Kuwait/Kuwait 171.059,6 1.461.533,8 -1.290.474,2 173.875,0 738.682,9 -564.807,9 121.685,8 293.118,9 -171.433,1 111.813,7 314.997,3 -203.183,6Yordania/Yordan 152.641,9 152.549,2 92,6 95.239,1 160.782,4 -65.543,3 90.204,0 165.841,4 -75.637,3 92.058,2 175.042,4 -82.984,2Libanon/Lebanon 74.166,1 3.729,2 70.436,9 83.573,5 3.703,5 79.870,0 76.368,2 1.683,8 74.684,4 76.815,0 1.766,0 75.048,9Yaman/Yemen 155.785,7 1.883,6 153.902,0 88.729,4 573,2 88.156,2 157.907,7 1.038,8 156.868,9 116.781,2 1.625,0 115.156,3Siria/Syrian Arab Republic 46.303,8 1.333,0 44.970,8 32.184,7 1.608,5 30.576,2 25.888,9 1.402,0 24.486,9 31.808,5 8,5 31.800,0Oman/Oman 244.652,1 193.649,2 51.002,9 211.746,3 144.191,2 67.555,1 201.899,5 61.386,8 140.512,7 226.076,7 245.674,8 -19.598,0Irak/Iraq 72.289,5 369,7 71.919,8 95.100,1 243,0 94.857,0 91.080,1 104,5 90.975,6 114.404,0 246,6 114.157,4
Asia Barat lainnya/Other West Asia 300.441,8 1.767.595,9 -1.467.154,1 279.568,4 836.190,8 -556.622,4 214.682,5 1.041.087,1 -826.404,6 231.781,0 990.006,0 -758.225,0
11
2014
TABEL 7 : NERACA PERDAGANGAN INDONESIA DENGAN NEGARA-NEGARA LAIN (TERMASUK MINYAK BUMI & HASIL-HASILNYA DAN GAS)
TABLE BALANCE OF INDONESIAN TRADE WITH OTHER COUNTRIES (INCLUDING OIL & OIL PRODUCTS & NATURAL GAS) Lanjutan/Continued
NEGARA TUJUAN/
COUNTRY OF DESTINATION
2015 2016 Jan-Jul / Jan-Jul 2017

No.08.05.147 Nilai/Value : Ribu/Thousand US$
EKSPOR/ IMPOR/ NERACA/ EKSPOR/ IMPOR/ NERACA/ EKSPOR/ IMPOR/ NERACA/ EKSPOR/ IMPOR/ NERACA/
EXPORT IMPORT BALANCE EXPORT IMPORT BALANCE EXPORT IMPORT BALANCE EXPORT IMPORT BALANCE
2014
TABEL 7 : NERACA PERDAGANGAN INDONESIA DENGAN NEGARA-NEGARA LAIN (TERMASUK MINYAK BUMI & HASIL-HASILNYA DAN GAS)
TABLE BALANCE OF INDONESIAN TRADE WITH OTHER COUNTRIES (INCLUDING OIL & OIL PRODUCTS & NATURAL GAS) Lanjutan/Continued
NEGARA TUJUAN/
COUNTRY OF DESTINATION
2015 2016 Jan-Jul / Jan-Jul 2017
AFRIKA/AFRICA 6.235.626,6 5.465.636,2 769.990,4 4.735.215,6 3.503.836,0 1.231.379,6 4.173.878,0 3.492.873,7 681.004,4 4.448.615,1 3.527.955,7 920.659,4
Mesir/Egypt 1.341.002,2 145.933,9 1.195.068,3 1.197.912,5 243.088,3 954.824,1 1.110.437,9 352.143,5 758.294,4 1.110.644,6 242.940,2 867.704,4
Maroko/Marocco 82.192,6 140.265,6 -58.072,9 87.394,7 126.934,5 -39.539,8 95.614,8 62.334,0 33.280,8 80.313,3 62.685,9 17.627,4
Tunisia/Tunis 82.514,0 21.696,3 60.817,7 55.932,0 21.206,3 34.725,8 37.994,2 22.752,3 15.241,9 53.125,7 31.959,8 21.165,9
Aljazair/Algeria 178.644,2 299.723,8 -121.079,6 173.838,1 282.771,5 -108.933,4 133.708,9 382.214,4 -248.505,5 186.391,6 272.780,1 -86.388,6
Sudan/Sudan 74.384,5 743,3 73.641,2 77.881,3 352,4 77.528,9 72.372,0 1.666,0 70.706,0 56.514,8 48.368,8 8.146,0
Siera Leone/Siera Leone 24.990,0 314,3 24.675,6 24.257,6 233,4 24.024,3 26.917,8 412,9 26.504,9 26.617,2 91,1 26.526,1
Zimbabwe/Zimbabwe 4.099,3 28.648,6 -24.549,3 2.667,7 25.331,7 -22.664,0 3.128,7 32.206,1 -29.077,4 2.602,9 26.657,9 -24.055,0
Mozambik/Mozambique 114.962,9 26.713,7 88.249,2 103.005,2 16.453,2 86.552,0 35.109,1 9.405,2 25.703,9 50.105,4 27.908,0 22.197,4
Nigeria/Nigeria 648.616,7 3.306.300,7 -2.657.684,0 445.738,3 1.288.155,8 -842.417,5 310.819,2 1.287.967,2 -977.148,0 317.099,2 1.176.702,8 -859.603,6
Sinegal/Senegal 74.073,4 4.183,1 69.890,2 87.647,1 1.731,2 85.915,9 72.588,4 9.271,9 63.316,5 87.298,3 3.395,5 83.902,8
Uganda/Uganda 9.618,3 10.736,0 -1.117,7 5.928,5 10.223,2 -4.294,8 6.382,2 15.727,4 -9.345,1 9.759,8 22.753,7 -12.993,9
Rep.Afrika Sel./Rep. of South Africa 1.379.503,0 498.496,2 881.006,8 666.126,7 231.940,0 434.186,7 727.880,0 290.806,6 437.073,4 656.464,4 353.816,3 302.648,1
Kenya/Kenya 196.193,6 9.672,3 186.521,3 187.653,3 12.317,2 175.336,1 200.781,4 10.020,0 190.761,4 266.074,4 12.623,6 253.450,8
Mauritania/Mauritania 106.810,8 978,7 105.832,1 59.449,3 1.637,4 57.811,9 71.029,7 530,7 70.499,0 94.321,6 2.563,8 91.757,9
Ethiopia/Ethiopia 48.676,5 23.719,9 24.956,6 45.473,9 10.962,8 34.511,1 42.433,6 23.669,4 18.764,2 36.590,1 26.556,5 10.033,6
Tanzania/Tanzania 202.490,4 19.657,8 182.832,6 213.953,6 21.451,4 192.502,2 154.452,8 68.895,6 85.557,2 254.068,1 22.008,8 232.059,3
Ghana/Ghana 212.273,2 28.718,2 183.555,1 158.382,9 22.372,2 136.010,7 109.873,6 7.549,2 102.324,4 99.174,5 12.286,7 86.887,8
Togo/Togo 132.995,0 10.153,3 122.841,8 103.726,9 16.152,0 87.574,8 52.146,4 10.221,1 41.925,3 110.669,8 9.893,6 100.776,2
Angola/Angola 189.664,0 209.281,3 -19.617,3 136.970,0 640.309,0 -503.339,0 57.714,0 235.159,8 -177.445,8 85.720,2 316.377,1 -230.656,9
Kongo/Congo 44.096,4 76.014,9 -31.918,5 35.876,9 126.403,1 -90.526,2 47.344,3 154.076,6 -106.732,2 45.260,3 3.566,5 41.693,8
Benin/Benin 213.117,7 31.098,4 182.019,4 153.441,8 32.592,8 120.849,0 196.963,4 18.750,0 178.213,4 189.696,0 10.748,2 178.947,8
Kamerun/Cameroon 36.516,3 39.580,7 -3.064,4 29.590,1 26.509,8 3.080,3 28.304,3 65.393,9 -37.089,6 18.508,1 76.140,4 -57.632,3
Liberia/Liberia 23.216,2 110,5 23.105,7 23.260,3 15.030,1 8.230,2 19.382,6 4.441,2 14.941,4 28.179,2 62.614,4 -34.435,2
Gabon/Gabon 20.391,6 422,6 19.969,0 16.686,1 296,3 16.389,8 10.479,5 88.197,1 -77.717,6 9.438,7 265.362,5 -255.923,8
Pantai Gading/Cote D'ivoire (Ivory Coast) 103.928,1 245.394,9 -141.466,8 53.525,8 122.056,1 -68.530,2 52.073,8 52.607,4 -533,6 33.064,3 139.912,5 -106.848,2
Mali/Mali 6.567,3 56.601,3 -50.034,0 4.372,0 43.755,3 -39.383,2 5.570,5 26.752,8 -21.182,4 4.623,0 26.786,6 -22.163,6
Niger/Niger 15.171,4 174,9 14.996,5 7.285,8 12,6 7.273,3 9.772,3 19,3 9.753,0 5.753,9 551,3 5.202,6
Afrika lainnya/Other Africa 11.802.336,2 10.700.971,3 1.101.364,9 8.893.194,0 6.844.115,6 2.049.078,4 7.865.153,3 6.726.065,2 1.139.088,2 8.366.694,3 6.786.008,2 1.580.686,2
AUSTRALIA & OSEANIA/AUSTRALIA & OCEANIA 5.828.476,6 6.522.317,4 -693.840,8 4.410.995,6 5.480.199,4 -1.069.203,8 3.862.222,9 5.959.102,2 -2.096.879,3 2.954.055,3 6.434.857,0 -3.480.801,7
Australia/Australia 5.033.182,6 5.647.502,4 -614.319,7 3.679.853,1 4.815.794,5 -1.135.941,4 3.199.006,5 5.260.859,0 -2.061.852,5 2.275.807,3 5.598.378,6 -3.322.571,3
Selandia Baru/New Zealand 486.776,8 836.036,7 -349.259,9 436.253,6 637.009,8 -200.756,2 366.543,1 660.904,2 -294.361,1 393.389,3 687.164,3 -293.774,9
Kaledonia Baru/New Caledonia 12.868,1 624,7 12.243,4 12.750,0 354,3 12.395,7 10.339,7 174,5 10.165,2 10.156,1 451,1 9.705,0
Fiji/Fiji 22.260,4 3.306,6 18.953,7 20.529,1 718,7 19.810,4 27.825,0 1.238,7 26.586,2 21.666,5 534,8 21.131,7
Samoa/Samoa 6.457,4 2.160,2 4.297,2 6.688,4 1.547,4 5.141,0 6.054,5 1.090,1 4.964,4 5.476,1 824,4 4.651,6
Timor Timur/East Timor 226.194,7 244,0 225.950,7 216.482,9 525,3 215.957,7 225.914,4 1.495,3 224.419,1 215.068,5 1.574,8 213.493,7
Oceania lainnya/Other Oceania 40.736,6 32.442,9 8.293,8 38.438,4 24.249,4 14.189,0 26.539,6 33.340,3 -6.800,7 32.491,5 145.929,1 -113.437,6
AMERIKA UTARA/NORTH AMERICA 17.284.925,7 10.030.305,6 7.254.620,1 16.961.591,0 9.202.452,7 7.759.138,2 16.873.277,5 8.681.472,5 8.191.805,0 17.032.266,3 8.718.948,5 8.313.317,8
Amerika Serikat/USA 16.529.904,4 8.170.107,7 8.359.796,7 16.239.246,3 7.593.201,2 8.646.045,2 16.140.705,4 7.298.442,6 8.842.262,8 16.271.589,7 7.293.155,0 8.978.434,8
Kanada/Canada 755.021,3 1.860.197,9 -1.105.176,6 722.344,7 1.609.251,6 -886.906,9 732.572,1 1.383.029,9 -650.457,8 760.676,6 1.425.793,5 -665.116,9
Amerika Utara Lainnya/Other North America - - - - - - - - - - - -
12

No.08.05.147 Nilai/Value : Ribu/Thousand US$
EKSPOR/ IMPOR/ NERACA/ EKSPOR/ IMPOR/ NERACA/ EKSPOR/ IMPOR/ NERACA/ EKSPOR/ IMPOR/ NERACA/
EXPORT IMPORT BALANCE EXPORT IMPORT BALANCE EXPORT IMPORT BALANCE EXPORT IMPORT BALANCE
2014
TABEL 7 : NERACA PERDAGANGAN INDONESIA DENGAN NEGARA-NEGARA LAIN (TERMASUK MINYAK BUMI & HASIL-HASILNYA DAN GAS)
TABLE BALANCE OF INDONESIAN TRADE WITH OTHER COUNTRIES (INCLUDING OIL & OIL PRODUCTS & NATURAL GAS) Lanjutan/Continued
NEGARA TUJUAN/
COUNTRY OF DESTINATION
2015 2016 Jan-Jul / Jan-Jul 2017
AMERIKA TENGAH & SELATAN / CENTRAL & SOUTH AMERICA 3.750.203,8 4.787.399,6 -1.037.195,8 3.272.232,0 4.314.885,4 -1.042.653,4 3.213.614,4 4.405.039,7 -1.191.425,3 3.289.796,0 3.551.459,8 -261.663,8Meksiko/Mexico 850.874,4 187.462,0 663.412,4 823.997,6 197.558,5 626.439,1 815.126,4 176.954,3 638.172,1 916.254,4 200.754,7 715.499,7Panama/Panama 109.118,2 39.489,4 69.628,9 117.236,8 44.623,6 72.613,2 98.584,9 52.309,3 46.275,6 95.680,8 26.754,3 68.926,5Suriname/Suriname 8.238,0 0,8 8.237,2 7.538,1 1,7 7.536,4 5.077,0 0,0 5.077,0 4.952,3 24,5 4.927,8Chili/Chile 177.899,1 241.506,4 -63.607,3 147.349,5 173.847,9 -26.498,4 143.813,2 83.339,0 60.474,2 148.870,0 115.078,2 33.791,9Venezuela/Venezuela 39.054,9 344,4 38.710,5 19.503,9 439,1 19.064,8 13.366,1 265,1 13.101,0 8.075,9 2.372,3 5.703,6Argentina/Argentina 236.923,4 1.465.325,2 -1.228.401,8 237.063,8 1.298.349,7 -1.061.285,9 219.553,6 1.373.635,8 -1.154.082,2 244.817,4 1.077.570,6 -832.753,1Brazil/Brazilia 1.498.199,4 2.553.533,2 -1.055.333,8 1.166.012,3 2.425.426,6 -1.259.414,4 1.102.041,2 2.402.380,0 -1.300.338,8 1.116.983,0 1.716.355,3 -599.372,3Kolumbia/Colombia 147.221,9 7.151,8 140.070,1 130.656,7 6.046,2 124.610,5 124.974,8 8.214,3 116.760,5 114.149,8 15.593,5 98.556,3Guyana/Guyana 2.333,1 0 2.332,8 1.721,6 0 1.721,4 2.032,1 290 1.742,5 2.537,0 1 2.535,8Trinidad & Tobago/Trinidad & Tobago 14.545,9 1.259,6 13.286,3 15.632,8 473,9 15.158,9 17.248,8 2.851,3 14.397,4 18.220,8 4,8 18.216,0Amerika Tengah & Selatan lainnya/Other South and Central America 665.795,5 291.326,6 374.469,0 605.518,9 168.117,9 437.401,0 671.796,4 304.800,9 366.995,4 619.254,7 396.950,7 222.304,0
EROPA BARAT/WEST EUROPE 16.094.590,7 13.046.891,2 3.047.699,5 15.039.455,2 11.657.239,7 3.382.215,5 15.722.452,0 11.193.273,6 4.529.178,4 15.249.005,2 11.741.736,8 3.507.268,4Inggris/United Kingdom 1.658.606,6 894.756,0 763.850,6 1.527.086,0 818.883,1 708.202,9 1.590.355,7 893.835,5 696.520,2 1.307.416,9 918.996,9 388.420,0Belanda/Netherlands 3.984.581,5 908.269,1 3.076.312,4 3.442.102,0 785.230,6 2.656.871,3 3.254.915,9 723.615,6 2.531.300,3 3.694.550,8 878.966,8 2.815.584,1Perancis/France 1.019.329,7 1.332.517,9 -313.188,2 972.962,3 1.336.934,6 -363.972,2 872.746,2 1.362.003,6 -489.257,4 898.513,5 1.467.300,8 -568.787,3Jerman /Germany 2.821.568,4 4.091.177,8 -1.269.609,3 2.663.817,3 3.471.690,5 -807.873,2 2.638.679,9 3.159.486,1 -520.806,2 2.453.587,4 3.196.897,2 -743.309,8Austria/Austria 40.286,6 342.955,0 -302.668,3 29.292,4 316.176,4 -286.884,1 28.570,3 358.605,8 -330.035,5 23.659,7 316.179,0 -292.519,3Belgia/Belgium 1.217.320,7 585.486,5 631.834,3 1.113.313,2 559.364,3 553.949,0 1.125.747,4 491.083,9 634.663,5 1.143.985,3 592.548,9 551.436,4Swiss/Switzerland 133.895,3 627.633,2 -493.738,0 1.071.661,2 634.261,2 437.400,1 2.199.814,0 722.302,6 1.477.511,4 1.239.638,7 740.881,6 498.757,1Luksemburg/Luxemburg 11.807,5 6.312,9 5.494,5 12.418,4 15.852,5 -3.434,1 9.720,5 38.770,0 -29.049,5 12.933,4 17.358,4 -4.425,0Monako/Monaco 272,2 762,8 -490,6 153,0 426,1 -273,1 528,2 338,8 189,5 561,6 299,0 262,6Denmark/Denmark 226.612,9 167.953,6 58.659,3 206.994,2 201.302,9 5.691,3 187.645,1 156.627,5 31.017,6 176.927,0 157.278,3 19.648,7Norwegia/Norway 65.285,9 212.955,2 -147.669,3 65.652,6 226.250,9 -160.598,3 76.449,5 333.697,8 -257.248,3 58.958,3 244.833,6 -185.875,4Swedia/Sweden 177.109,7 691.053,3 -513.943,6 146.845,4 691.166,0 -544.320,6 144.693,0 526.178,5 -381.485,5 139.031,0 540.878,4 -401.847,3Finlandia/Finland 111.443,2 668.427,4 -556.984,2 84.878,4 534.092,1 -449.213,7 83.879,2 338.589,7 -254.710,5 80.066,9 561.961,1 -481.894,2Irlandia/Ireland 70.852,8 100.937,7 -30.084,9 60.140,9 103.340,6 -43.199,7 61.886,3 110.316,0 -48.429,7 71.511,9 113.226,3 -41.714,3Italia/Italy 2.286.859,0 1.722.908,1 563.950,8 1.872.932,5 1.368.233,8 504.698,7 1.572.117,7 1.387.204,5 184.913,2 1.762.784,2 1.419.174,5 343.609,7Spanyol/Spain 1.937.638,8 517.093,1 1.420.545,7 1.481.288,1 472.543,8 1.008.744,4 1.579.275,5 484.060,5 1.095.215,0 1.863.917,9 441.309,9 1.422.608,0Portugal/Portugal 161.315,1 57.351,8 103.963,4 143.212,1 44.349,1 98.863,0 152.371,8 35.120,9 117.250,9 150.655,2 44.291,6 106.363,6Iceland/Iceland 80,6 1.471,9 -1.391,3 248,2 517,9 -269,7 571,2 1.230,6 -659,4 815,3 1.140,9 -325,7Montserrat/Montserrat 0 4 -3,7 4,6 - 4,6 0 - 0,0 0 - 0,0Yunani/Greece 157.344,5 97.193,9 60.150,6 144.201,3 76.426,4 67.774,9 142.207,6 68.753,2 73.454,4 169.425,5 88.073,8 81.351,7Uni Eropa Lainnya/Other Europe Union 12.379,6 19.670,4 -7.290,8 251,0 196,9 54,1 277,0 1.452,7 -1.175,7 64,9 140,0 -75,1
EROPA TIMUR/EAST EUROPE 2.586.357,7 5.097.902,5 -2.511.544,9 2.339.320,2 3.288.864,4 -949.544,2 2.668.753,6 2.696.845,2 -28.091,5 2.568.174,4 2.786.773,1 -218.598,6Chekoslovakia/Czechoslovakia 26.915,5 3.341,9 23.573,6 9.233,3 40.051,5 -30.818,2 28,2 0,0 28,2 0,1 0,0 0,1Honggaria/Hungary 86.871,3 62.424,1 24.447,2 58.324,4 62.246,6 -3.922,2 60.761,9 61.454,3 -692,3 60.143,7 62.884,8 -2.741,1Polandia/Poland 395.947,3 143.765,5 252.181,8 358.889,8 150.373,9 208.515,9 370.027,2 143.091,4 226.935,8 351.246,8 130.162,2 221.084,6Rumania/Romania 116.145,8 36.786,5 79.359,3 92.575,6 25.069,5 67.506,1 92.479,5 42.075,9 50.403,6 114.728,0 42.668,6 72.059,4Bulgaria/Bulgaria 77.454,0 45.741,4 31.712,6 42.298,7 54.518,1 -12.219,4 44.626,7 75.273,0 -30.646,4 53.150,8 54.354,0 -1.203,2Federasi Rusia 1.052.861,3 1.589.806,2 -536.944,9 993.743,5 992.640,4 1.103,1 1.261.604,6 850.613,5 410.991,2 1.158.367,6 1.167.454,3 -9.086,7Yugoslavia/Yugoslavia 0,0 2,8 -2,8 0,0 0 0,0 0,0 0 0,0 0,0 0 0,0Albania/Albania 6.672,4 857,0 5.815,4 5.484,1 180,7 5.303,4 10.477,9 218,1 10.259,8 9.458,7 138,4 9.320,3Eropa Timur lainnya/Other East Europe 823.490,2 3.215.177,2 -2.391.687,1 778.770,7 1.963.783,6 -1.185.012,9 828.747,7 1.524.119,0 -695.371,3 821.078,6 1.329.110,6 -508.031,9
TOTAL/TOTAL 176.285.212,7 178.171.380,4 -1.886.167,7 150.257.288,8 142.471.367,7 7.785.921,1 144.470.256,5 135.589.623,5 8.880.633,0 153.918.535,3 141.602.604,7 12.315.930,6
Sumber : BPS (diolah PDSI Kementerian Perdagangan)
13

Nilai/Value : (Juta/Million US$)
I. Bahan Mentah/Crude Materials 95.215,4 81.897,1 79.586,1 61.779,2 55.027,9 -12,88 52.284,9 62.591,6 19,71
1. Migas/Oil and Gas 36.977,3 29.227,9 30.331,9 18.574,4 13.105,5 -22,34 9.773,7 11.612,0 18,81
- Minyak Mentah/Crude Oil 12.293,4 9.346,2 9.528,2 6.479,4 5.196,7 -18,85 3.614,2 3.261,8 -9,75
- Hasil Minyak/Oil Products 4.163,4 3.798,3 3.623,4 1.754,2 872,0 -32,29 536,8 1.053,7 96,28
- Gas Alam & Olahannya/Natural Gas & Gas Products 20.520,5 16.083,5 17.180,3 10.340,8 7.036,8 -22,76 5.622,7 7.296,5 29,77
2. Hasil tambang diluar Migas/Mining Products 33.281,9 29.819,8 25.118,3 21.191,9 19.865,0 -12,83 11.904,5 16.170,4 35,83
excluding oil and gas
3. Bahan mentah lainnya/Oth. crude materials 24.956,2 22.849,4 24.135,9 22.012,9 22.057,5 -2,80 30.606,7 34.809,3 13,73
II. Hasil Industri/Industrial Products 94.816,5 83.686,9 96.706,6 88.587,1 89.461,9 -0,59 100.544,2 116.894,4 16,26
4. Kayu Lapis dan Olahan lainnya/ 2.647,3 2.535,8 3.014,5 3.004,1 2.881,1 3,45 2.311,7 2.275,7 -1,56
Plywood and Oth. Manufactures
5.Tekstil dan Pakaian Jadi/Textile and Garment 12.130,0 11.339,3 12.487,8 12.083,2 11.674,5 -0,13 9.013,6 9.498,2 5,38
6. Logam tidak mengandung Besi/ Base Metals not containing of iron 4.821,2 3.822,9 4.062,1 3.121,2 2.955,6 -11,14 1.897,1 2.608,7 37,51
7. Minyak dan Lemak Nabati/Vegetable oil and fat 20.067,6 16.079,6 19.951,0 17.766,0 17.094,8 -2,19 31.312,1 44.068,5 40,74
8. Besi dan Baja/Iron and Steel 1.732,3 1.417,5 1.993,4 2.353,1 2.187,3 10,22 1.477,9 2.279,0 54,20
9. Kaca dan Barang dari Kaca/Glass and Glassware 413,9 356,1 375,5 351,3 319,1 -5,20 214,5 194,1 -9,51
10. Kertas dan Barang dari Kertas/Paper and Paper products 3.925,7 3.402,5 3.735,8 3.554,6 3.403,8 -2,39 5.026,0 5.520,8 9,84
11. Hasil Industri lainnya/Other Industrial Products 49.078,4 44.733,1 51.086,3 46.353,7 48.945,6 0,30 49.291,1 50.449,5 2,35
III. Non Migas (2 s/d 11)/Non oil & gas (2 up to 11) 153.054,6 136.356,1 145.960,8 131.791,9 131.384,4 -3,34 143.055,4 167.874,1 17,35
IV.Total Ekspor/Total Export 190.031,8 165.584,0 176.292,7 150.366,3 144.489,8 -6,24 152.829,1 179.486,0 17,44
Keterangan/Note : 1. Migas terdiri atas Minyak Mentah/Oil & Gas consist of Crude Oil (SITC 333), Hasil Minyak/Oil Products (SITC 334,335) & Gas (SITC 34)
2. Hasil Tambang Diluar Migas/Mining Products excl. Oil and Gas (SITC 27,28,32)
3. Bahan Mentah Lainnya/Other crude materials (SITC 0,1,2,4 & 94 dikurangi/minus SITC 27,28 & 42)
4. Hasil Industri/Industrial Products (SITC 5,6,7,8,9 & 42 & 335 yg bukan hasil minyak/Non Oil products), Kayu Lapis dan olahannya (SITC 634,635) Plywood and other manufactures (SITC 634, 635)
Tekstil/Textile & Pakaian Jadi/Garment SITC 65,84; Logam tidak mengandung Besi/Base metals not containing of Iron SITC 68; Minyak & Lemak Nabati
SITC 42; Besi/Iron & Baja/Steel SITC 67; Kaca/Glass & Brg dari Kaca/Glassware SITC 664,665; Kertas/Paper & Brg dari Kertas/Paper Products SITC 64
Sumber : BPS (diolah PDSI Kementerian Perdagangan)
14
Perub. (%)
Change (%)
17-16 2 0 1 6 2 0 1 7
2 0 14 2 0 15 2 0 16Trend (%)
12-16
TABEL 8 : RINGKASAN PERKEMBANGAN EKSPOR INDONESIA
TABLE SUMMARY OF INDONESIAN EXPORT DEVELOPMENT
JENIS BARANG / DESCRIPTION OF GOODS
Jan-Ags / Jan-Aug
2 0 12 2 0 13

No. 08.05.148 Nilai/value : Juta/Million US$
Minyak Hasil Gas Alam & Olahannya/ Hasil Tambang Diluar Bahan Mentah
Mentah/ Minyak/ Natural Gas and Gas Migas/Mining Products Lainnya/Other
Crude Oil Oil Products Products Excl. Oil & Gas Crude Materials
2010 Total/Total 10.402,9 3.967,3 13.669,5 28.421,0 19.538,7
Desember/December 1.245,5 486,3 1.527,5 3.169,0 2.018,9
2011 Total/Total 13.828,7 4.776,9 22.871,5 36.181,3 26.624,3
Desember/December 1.405,1 356,2 1.723,7 3.272,1 2.006,7
2012 Total/Total 12.293,4 4.163,4 20.520,5 33.281,9 24.956,2
Desember/December 1.116,3 341,8 1.508,9 2.992,1 1.961,4
2013 Total/Total 10.204,7 4.299,1 18.129,2 33.066,7 24.956,9
Desember/December 858,6 500,8 2.045,7 3.247,0 2.107,5
2014 Total/Total 9.528,2 3.623,4 17.180,3 25.118,3 24.135,9
Desember/December 877,7 228,8 1.246,9 2.146,5 1.974,2
2015 Total/Total 6.457,0 1.754,2 10.340,8 21.136,0 22.011,5
Desember/December 434,9 79,1 785,5 1.795,0 1.795,5
2016 Total/Total 5.196,7 872,0 7.036,8 19.865,0 22.057,5
Januari/January 357,6 85,5 665,0 1.419,7 1.585,1
Pebruari/February 476,6 55,4 581,3 1.409,0 1.597,4
Maret/March 568,8 62,7 607,9 1.513,0 1.719,2
April/April 331,7 73,9 486,2 1.300,1 1.724,0
Mei/May 431,9 61,2 464,8 1.359,0 1.725,0
Juni/June 551,8 65,9 569,7 1.660,8 1.935,4
Juli/July 407,4 51,6 539,6 1.361,9 1.381,3
Agustus/August 488,4 80,6 569,6 1.851,4 1.999,8
September/September 428,0 79,0 554,5 1.839,9 2.009,4
Oktober/October 309,5 76,5 669,9 1.806,3 2.039,4
Nopember/November 401,1 69,9 632,0 2.076,0 2.142,1
Desember/December 443,9 109,9 696,4 2.267,9 2.199,4
2017 Total/Total 3.783,0 1.250,5 8.269,2 18.578,5 39.554,8
Januari/January 380,3 163,8 936,2 2.126,6 3.830,5
Pebruari/February 407,6 93,9 894,6 1.448,8 3.848,3
Maret/March 613,1 181,0 717,1 2.129,1 4.641,2
April/April 302,5 146,1 803,2 2.201,2 4.211,8
Mei/May 402,6 157,3 962,2 2.161,7 4.756,3
Juni/June 452,0 92,9 943,7 1.791,1 3.920,7
Juli/July 293,7 131,6 999,6 2.109,6 4.580,7
Agustus/August 409,9 87,0 1.040,0 2.202,3 5.019,7
Sumber/Source : Badan Pusat Statistik/ Statistics Indonesia
15
PERIODE/PERIOD
TABEL 9 : RINGKASAN PERKEMBANGAN NILAI EKSPOR BAHAN MENTAH INDONESIA
TABLE SUMMARY OF EXPORT VALUE DEVELOPMENT OF CRUDE MATERIALS
JENIS BARANG/ DESCRIPTION OF GOODS

No. 08.05.148 Nilai/Value : Juta/Million US$
Kayu Lapis dan Tekstil dan Logam Tdk Minyak dan Besi dan Kaca & Barang Kertas & Barang Hasil Industri
Olahan Lainnya/ Pakaian Jadi/ Mengandung Lemak Nabati/ Baja/ dari Kaca/ dari Kertas/ Lainnya/Other
Plywood and other Textile and Besi/Non Fixed Vegetable Iron and Glass and Paper and Industrial
Manufactures Garment *) Ferrous Metals Oil & Fat steel Glassware Paper Products Products
2011 Total/Total 2.602,9 12.836,4 6.846,3 20.330,0 2.129,0 437,3 4.166,3 49.864,1
Desember/December 233,5 1.126,7 506,5 1.855,2 132,0 39,4 331,8 4.088,2
2012 Total/Total 2.647,3 12.130,0 4.821,2 20.067,6 1.732,3 413,9 3.925,7 49.078,4
Desember/December 243,0 1.032,7 393,0 1.551,8 184,3 38,2 315,4 3.715,2
2013 Total/Total 2.794,0 12.408,7 4.286,4 17.671,1 1.582,0 387,6 3.749,4 49.015,9
Desember/December 258,2 1.069,5 463,5 1.591,5 164,5 31,5 346,9 4.282,7
2014 Total/Total 3.014,5 12.487,8 4.062,1 19.951,0 2.029,7 375,5 3.735,8 51.086,3
Desember/December 250,7 1.161,6 389,2 1.611,5 183,8 34,0 282,7 4.233,7
2015 Total/Total 3.000,0 12.083,2 3.121,2 17.766,0 2.356,4 351,3 3.554,6 46.353,4
Desember/December 248,1 1.079,4 237,7 1.548,9 138,2 28,4 290,2 3.455,3
2016 Total/Total 2.881,1 11.674,5 2.955,6 17.094,8 2.193,3 319,1 3.403,8 48.945,6
Januari/January 227,4 954,8 151,4 1.232,7 122,6 21,3 263,6 3.393,8
Pebruari/February 225,8 960,9 189,3 1.230,2 143,1 24,3 272,4 4.152,3
Maret/March 249,8 1.021,2 195,4 1.158,7 173,1 28,0 296,3 4.215,8
April/April 250,5 972,2 288,5 1.330,5 182,5 24,2 285,8 4.225,9
Mei/May 239,6 968,1 203,1 1.277,8 158,4 27,1 284,2 4.314,2
Juni/June 273,7 1.274,3 278,1 1.207,3 208,4 30,1 289,9 4.629,1
Juli/July 162,7 681,8 180,8 1.146,1 171,4 24,0 262,3 3.159,8
Agustus/August 255,8 1.029,8 233,3 1.347,5 184,0 32,7 305,4 4.370,2
September/September 240,8 964,9 324,0 1.392,2 180,8 31,2 293,5 4.230,5
Oktober/October 262,4 853,8 310,3 1.676,0 238,6 27,7 282,9 4.189,4
Nopember/November 256,3 928,9 269,3 2.034,1 172,5 24,6 274,0 4.222,9
Desember/December 236,3 1.063,7 332,3 2.061,7 257,9 24,0 293,6 3.841,7
2017 Total/Total 2.577,1 10.633,0 3.044,2 49.585,5 2.538,4 218,0 6.233,4 56.712,8
Januari/January 295,3 1.162,8 342,8 6.112,4 268,8 23,7 681,8 5.768,4
Pebruari/February 268,5 1.104,4 228,4 5.946,3 143,1 23,0 635,7 6.205,4
Maret/March 317,6 1.284,5 258,4 6.197,1 248,9 25,6 702,4 6.810,8
April/April 269,4 1.067,8 286,3 5.139,6 255,8 24,0 696,6 6.395,2
Mei/May 320,6 1.211,1 366,9 5.348,4 347,0 28,4 728,8 6.883,8
Juni/June 226,9 1.034,4 308,6 4.377,5 295,2 19,4 591,2 5.016,0
Juli/July 273,2 1.237,3 389,1 4.864,3 311,0 24,9 771,8 6.296,0
Agustus/August 304,2 1.395,8 428,2 6.082,7 356,0 25,1 712,5 7.073,9
Keterangan/Note : *) Tidak termasuk benang (bahan baku untuk tekstil)/Not include yarn (raw materials for textile)
Sumber/Source : Badan Pusat Statistik/ Statistics Indonesia
16
PERIODE/PERIOD
JENIS BARANG/DESCRIPTION OF GOODS
TABEL 10 : RINGKASAN PERKEMBANGAN NILAI EKSPOR HASIL INDUSTRI INDONESIA
TABLE SUMMARY OF EXPORT VALUE DEVELOPMENT OF INDUSTRIAL PRODUCTS

Lanjutan/Continued
No. 08.05.148 Nilai/Value : Juta/Million US$
Nilai Pangsa(%) Nilai Pangsa(%) Nilai Pangsa(%) Nilai Pangsa(%) Nilai Pangsa(%) Nilai Pangsa(%) Nilai Pangsa(%)Value Share(%) Value Share(%) Value Share(%) Value Share(%) Value Share(%) Value Share(%) Value Share(%)
ASIA TIMUR / EAST ASIA 75.731,6 39,85 69.692,7 38,18 60.541,8 34,41 47.858,1 31,83 45.708,5 31,64 40.996,4 31,21 50.257,3 32,97 22,59
Jepang/Japan 30.135,1 15,86 27.086,3 14,84 23.117,5 13,14 18.020,9 11,99 16.101,5 11,14 14.605,3 11,12 16.055,8 10,53 9,93
Hongkong/Hongkong 2.631,9 1,39 2.693,3 1,48 2.777,6 1,58 2.067,2 1,37 2.144,8 1,48 1.968,3 1,50 2.211,0 1,45 12,33
Korea Utara/North Korea 1,0 0,00 2,9 0,00 1,4 0,00 1,0 0,00 5,5 0,00 5,5 0,00 0,3 0,00 -95,28
Korea Selatan/South Korea 15.049,9 7,92 11.422,5 6,26 10.601,1 6,03 7.664,4 5,10 7.007,6 4,85 6.328,9 4,82 7.503,8 4,92 18,56
Taiwan/Taiwan 6.242,5 3,29 5.862,4 3,21 6.425,1 3,65 5.043,5 3,35 3.652,6 2,53 3.323,3 2,53 3.804,5 2,50 14,48
RRC/People Rep. of China 21.659,5 11,40 22.601,5 12,38 17.605,9 10,01 15.046,4 10,01 16.785,6 11,62 14.755,2 11,23 20.669,9 13,56 40,09
Asia Timur lainnya/Other East Asia 11,8 0,01 23,9 0,01 13,2 0,01 14,7 0,01 10,7 0,01 9,8 0,01 12,0 0,01 -5.420,89
ASIA SELATAN & TENGGARA/ SOUTH & SOUTH EAST ASIA 57.462,2 30,24 56.802,8 31,12 56.011,6 31,83 49.278,9 32,78 47.063,4 32,58 43.160,1 32,86 52.981,7 34,75 22,76
ASEAN / ASEAN 41.829,1 22,01 40.630,0 22,26 39.668,1 22,54 33.577,0 22,33 33.202,9 22,98 30.600,2 23,30 35.966,1 23,59 17,54
- Muangthai/Thailand 6.635,1 3,49 6.061,9 3,32 5.783,1 3,29 5.507,3 3,66 5.392,4 3,73 4.904,9 3,73 5.933,9 3,89 20,98
- Singapura/Singapore 17.135,0 9,02 16.686,3 9,14 16.728,3 9,51 12.632,6 8,40 11.246,4 7,78 10.846,2 8,26 11.731,8 7,70 8,17
- Pilipina/Phillipines 3.707,6 1,95 3.817,0 2,09 3.887,8 2,21 3.921,7 2,61 5.270,9 3,65 4.788,1 3,65 6.012,9 3,94 25,58
- Malaysia/Malaysia 11.278,3 5,94 10.666,6 5,84 9.730,0 5,53 7.630,9 5,08 7.112,0 4,92 6.366,2 4,85 7.731,8 5,07 21,45
- Myanmar/Myanmar 401,6 0,21 556,4 0,30 566,9 0,32 615,7 0,41 615,7 0,43 563,3 0,43 739,9 0,49 31,34
- Brunai Darussalam/Brunei 81,8 0,04 122,7 0,07 100,3 0,06 91,2 0,06 88,7 0,06 82,5 0,06 59,7 0,04 -27,58
- Vietnam/Vietnam 2.273,7 1,20 2.400,9 1,32 2.451,3 1,39 2.740,2 1,82 3.045,5 2,11 2.666,5 2,03 3.285,8 2,16 23,22
- Kamboja/Cambodia 292,2 0,15 312,5 0,17 415,8 0,24 429,7 0,29 425,4 0,29 377,0 0,29 466,6 0,31 23,76
- Laos/Laos Peop. Dem. Rep. 23,8 0,01 5,8 0,00 4,5 0,00 7,7 0,01 5,9 0,00 5,5 0,00 3,7 0,00 -32,74
DI LUAR ASEAN / NON ASEAN 15.633,2 8,23 16.172,8 8,86 16.343,5 9,29 15.701,9 10,44 13.860,5 9,59 12.559,9 9,56 17.015,6 11,16 35,48
India/India 12.496,3 6,58 13.031,3 7,14 12.249,0 6,96 11.731,0 7,80 10.093,8 6,99 9.180,6 6,99 12.879,4 8,45 40,29
Pakistan/Pakistan 1.381,8 0,73 1.415,4 0,78 2.045,3 1,16 1.989,6 1,32 2.018,2 1,40 1.785,3 1,36 2.176,2 1,43 21,89
Bangladesh/Bangladesh 1.120,3 0,59 1.068,5 0,59 1.377,6 0,78 1.340,8 0,89 1.266,7 0,88 1.153,1 0,88 1.464,4 0,96 27,00
Sri Langka/Sri Lanka 341,6 0,18 390,9 0,21 386,3 0,22 341,5 0,23 262,2 0,18 240,7 0,18 269,4 0,18 11,92
Papua Nugini/Papua New Guinea 199,7 0,11 175,5 0,10 159,1 0,09 204,3 0,14 150,2 0,10 138,0 0,11 164,8 0,11 19,42
Afganistan/Afghanistan 56,2 0,03 50,9 0,03 77,4 0,04 36,3 0,02 16,2 0,01 13,1 0,01 18,2 0,01 39,04
Republik Maladewa/Maldives 25,3 0,01 24,5 0,01 31,0 0,02 32,2 0,02 39,2 0,03 36,3 0,03 34,1 0,02 -5,93
Di luar Asean/Other Non-Asean Countries 12,0 0,01 15,8 0,01 17,8 0,01 26,3 0,02 13,9 0,01 12,8 0,01 9,1 0,01 -29,08
ASIA BARAT/WEST ASIA 6.426,3 3,38 6.441,0 3,53 7.729,0 4,39 6.420,5 4,27 5.184,2 3,59 4.705,7 3,58 5.137,6 3,37 9,18
Pers Emirat Arab/United Arab Emirat 1.616,2 0,85 1.589,1 0,87 2.503,1 1,42 1.926,3 1,28 1.612,1 1,12 1.445,5 1,10 1.499,5 0,98 3,74
Saudi Arabia/Arab Saudi 1.774,5 0,93 1.734,0 0,95 2.156,3 1,23 2.060,7 1,37 1.333,1 0,92 1.233,5 0,94 1.292,9 0,85 4,82
Turki/Turkey 1.369,7 0,72 1.536,2 0,84 1.446,1 0,82 1.158,8 0,77 1.024,1 0,71 925,3 0,70 1.071,8 0,70 15,84
Iran/Iran 482,7 0,25 469,4 0,26 406,1 0,23 216,5 0,14 235,2 0,16 208,4 0,16 271,8 0,18 30,44
Kuwait/Kuwait 129,8 0,07 143,5 0,08 171,1 0,10 173,9 0,12 121,7 0,08 111,4 0,08 111,8 0,07 0,33
Yordania/Yordan 158,2 0,08 159,3 0,09 152,6 0,09 95,2 0,06 90,2 0,06 81,8 0,06 92,1 0,06 12,58
Libanon/Lebanon 75,7 0,04 75,9 0,04 74,2 0,04 83,6 0,06 76,4 0,05 69,4 0,05 76,8 0,05 10,61
Yaman/Yemen 157,2 0,08 156,3 0,09 155,8 0,09 88,7 0,06 157,9 0,11 149,2 0,11 116,8 0,08 -21,71
Siria/Syrian Arab Republic 58,6 0,03 33,0 0,02 46,3 0,03 32,2 0,02 25,9 0,02 22,9 0,02 31,8 0,02 38,94
Oman/Oman 237,8 0,13 209,4 0,11 244,7 0,14 211,7 0,14 201,9 0,14 181,0 0,14 226,1 0,15 24,91
Irak/Iraq 44,9 0,02 45,4 0,02 72,3 0,04 95,1 0,06 91,1 0,06 80,7 0,06 114,4 0,08 41,78
Asia Barat lainnya/Other West Asia 321,0 0,17 289,5 0,16 300,4 0,17 277,8 0,18 214,7 0,15 196,7 0,15 231,8 0,15 17,86
Jan-Ags / Jan-Aug
20172016 Perub. (%)
Change (%)
2016-2015
17
TABEL 11 : NILAI EKSPOR INDONESIA MENURUT NEGARA TUJUAN (TERMASUK MINYAK BUMI & HASIL-HASILNYA DAN GAS)
TABLE INDONESIAN EXPORT VALUE BY COUNTRY OF DESTINATION (INCLUDING OIL & OIL PRODUCTS & NATURAL GAS)
NEGARA TUJUAN/
COUNTRY OF DESTINATION
2012 2013 2014 2015 2016

Lanjutan/Continued
No. 08.05.148 Nilai/Value : Juta/Million US$
Nilai Pangsa(%) Nilai Pangsa(%) Nilai Pangsa(%) Nilai Pangsa(%) Nilai Pangsa(%) Nilai Pangsa(%) Nilai Pangsa(%)Value Share(%) Value Share(%) Value Share(%) Value Share(%) Value Share(%) Value Share(%) Value Share(%)
Jan-Ags / Jan-Aug
20172016 Perub. (%)
Change (%)
2016-2015
TABEL 11 : NILAI EKSPOR INDONESIA MENURUT NEGARA TUJUAN (TERMASUK MINYAK BUMI & HASIL-HASILNYA DAN GAS)
TABLE INDONESIAN EXPORT VALUE BY COUNTRY OF DESTINATION (INCLUDING OIL & OIL PRODUCTS & NATURAL GAS)
NEGARA TUJUAN/
COUNTRY OF DESTINATION
2012 2013 2014 2015 2016
AFRIKA/AFRICA 5.683,7 2,99 5.587,0 3,06 6.234,5 3,54 4.736,4 3,15 4.173,9 2,89 3.782,2 2,88 4.448,6 2,92 17,62
Mesir/Egypt 1.013,8 0,53 1.101,8 0,60 1.341,0 0,76 1.197,9 0,80 1.110,4 0,77 982,3 0,75 1.110,6 0,73 13,07
Maroko/Marocco 89,8 0,05 68,5 0,04 82,2 0,05 87,4 0,06 95,6 0,07 89,5 0,07 80,3 0,05 -10,27
Tunisia/Tunis 95,6 0,05 75,9 0,04 82,5 0,05 55,9 0,04 38,0 0,03 36,9 0,03 53,1 0,03 44,06
Aljazair/Algeria 211,0 0,11 240,5 0,13 178,6 0,10 173,8 0,12 133,7 0,09 119,3 0,09 186,4 0,12 56,29
Sudan/Sudan 82,5 0,04 83,3 0,05 74,4 0,04 77,9 0,05 72,4 0,05 67,8 0,05 56,5 0,04 -16,68
Siera Leone/Siera Leone 22,4 0,01 21,2 0,01 25,0 0,01 24,3 0,02 26,9 0,02 24,4 0,02 26,6 0,02 8,97
Zimbabwe/Zimbabwe 9,1 0,00 5,7 0,00 2,8 0,00 2,7 0,00 3,1 0,00 3,0 0,00 2,6 0,00 -13,82
Mozambik/Mozambique 99,9 0,05 120,8 0,07 115,0 0,07 103,0 0,07 35,1 0,02 30,8 0,02 50,1 0,03 62,93
Nigeria/Nigeria 413,1 0,22 558,2 0,31 648,8 0,37 445,7 0,30 310,8 0,22 286,1 0,22 317,1 0,21 10,83
Sinegal/Senegal 43,1 0,02 54,7 0,03 74,1 0,04 87,6 0,06 72,6 0,05 45,9 0,03 87,3 0,06 90,09
Uganda/Uganda 10,7 0,01 10,1 0,01 9,6 0,01 5,9 0,00 6,4 0,00 6,0 0,00 9,8 0,01 62,69
Rep.Afrika Sel./Rep. of South Africa 1.691,5 0,89 1.270,3 0,70 1.379,5 0,78 666,1 0,44 727,9 0,50 681,5 0,52 656,5 0,43 -3,68
Kenya/Kenya 266,9 0,14 233,2 0,13 196,2 0,11 187,7 0,12 200,8 0,14 184,3 0,14 266,1 0,17 44,40
Mauritania/Mauritania 69,7 0,04 96,1 0,05 106,8 0,06 59,4 0,04 71,0 0,05 60,5 0,05 94,3 0,06 55,88
Ethiopia/Ethiopia 30,2 0,02 42,4 0,02 48,7 0,03 45,5 0,03 42,4 0,03 39,3 0,03 36,6 0,02 -7,00
Tanzania/Tanzania 236,7 0,12 192,7 0,11 202,5 0,12 214,0 0,14 154,5 0,11 147,0 0,11 254,1 0,17 72,81
Ghana/Ghana 159,3 0,08 246,5 0,14 212,3 0,12 158,4 0,11 109,9 0,08 98,9 0,08 99,2 0,07 0,29
Togo/Togo 68,3 0,04 72,9 0,04 133,0 0,08 103,7 0,07 52,1 0,04 45,8 0,03 110,7 0,07 141,88
Angola/Angola 141,8 0,07 164,2 0,09 189,7 0,11 137,0 0,09 57,7 0,04 50,0 0,04 85,7 0,06 71,49
Kongo/Congo 34,4 0,02 32,7 0,02 44,1 0,03 35,9 0,02 47,3 0,03 42,8 0,03 45,3 0,03 5,75
Benin/Benin 63,5 0,03 71,0 0,04 213,1 0,12 153,4 0,10 197,0 0,14 177,7 0,14 189,7 0,12 6,77
Kamerun/Cameroon 42,6 0,02 35,9 0,02 36,5 0,02 29,6 0,02 28,3 0,02 26,0 0,02 18,5 0,01 -28,84
Liberia/Liberia 32,9 0,02 21,1 0,01 23,2 0,01 23,3 0,02 19,4 0,01 18,2 0,01 28,2 0,02 54,85
Gabon/Gabon 17,9 0,01 16,3 0,01 20,4 0,01 16,7 0,01 10,5 0,01 9,5 0,01 9,4 0,01 -0,37
Pantai Gading/Cote D'ivoire (Ivory Coast) 86,9 0,05 58,4 0,03 103,9 0,06 53,5 0,04 52,1 0,04 49,7 0,04 33,1 0,02 -33,43
Mali/Mali 4,5 0,00 7,0 0,00 6,6 0,00 4,4 0,00 5,6 0,00 5,5 0,00 4,6 0,00 -15,58
Niger/Niger 2,7 0,00 4,1 0,00 15,2 0,01 7,3 0,00 9,8 0,01 9,8 0,01 5,8 0,00 -41,12
Afrika lainnya/Other Africa 643,0 0,34 681,4 0,37 668,9 0,38 578,5 0,38 482,6 0,33 443,9 0,34 530,5 0,35 19,51
AUSTRALIA & OSEANIA/AUSTRALIA & OCEANIA 5.682,8 2,99 5.207,5 2,85 5.738,4 3,26 4.433,4 2,95 3.862,2 2,67 3.642,2 2,77 2.954,1 1,94 -18,89
Australia/Australia 4.905,4 2,58 4.370,5 2,39 4.948,4 2,81 3.702,3 2,46 3.199,0 2,21 3.008,3 2,29 3.834,0 2,51 27,45
Selandia Baru/New Zealand 441,0 0,23 469,5 0,26 481,4 0,27 436,3 0,29 366,5 0,25 323,0 0,25 393,4 0,26 21,79
Kaledonia Baru/New Caledonia 15,6 0,01 23,5 0,01 12,9 0,01 12,7 0,01 10,3 0,01 9,2 0,01 10,2 0,01 10,61
Fiji/Fiji 25,4 0,01 23,6 0,01 22,3 0,01 20,5 0,01 27,8 0,02 26,5 0,02 21,7 0,01 -18,15
Samoa/Samoa 7,1 0,00 6,5 0,00 6,5 0,00 6,7 0,00 6,1 0,00 5,7 0,00 5,5 0,00 -3,38
Timor Timur/East Timor 258,2 0,14 246,3 0,13 226,3 0,13 216,5 0,14 225,9 0,16 203,8 0,16 215,1 0,14 5,52
Oceania lainnya/Other Oceania 336,4 0,18 367,5 0,20 308,6 0,18 294,9 0,20 296,7 0,21 65,8 0,05 -1.525,7 -1,00 -2.419,20
AMERIKA UTARA/NORTH AMERICA 15.666,8 8,24 16.474,1 9,02 17.285,1 9,82 16.963,1 11,28 16.873,3 11,68 15.289,4 11,64 17.032,3 11,17 11,40
Amerika Serikat/USA 14.874,4 7,83 15.691,7 8,60 16.530,1 9,39 16.240,8 10,80 16.140,7 11,17 14.630,2 11,14 16.271,6 10,67 11,22
Kanada/Canada 792,4 0,42 782,3 0,43 755,0 0,43 722,3 0,48 732,6 0,51 659,2 0,50 760,7 0,50 15,39
Amerika Utara lainnya/Oth. North America 0,0 0,00 0,0 0,00 0,0 0,00 0,0 0,00 0,0 0,00 - - - - -
18

Lanjutan/Continued
No. 08.05.148 Nilai/Value : Juta/Million US$
Nilai Pangsa(%) Nilai Pangsa(%) Nilai Pangsa(%) Nilai Pangsa(%) Nilai Pangsa(%) Nilai Pangsa(%) Nilai Pangsa(%)Value Share(%) Value Share(%) Value Share(%) Value Share(%) Value Share(%) Value Share(%) Value Share(%)
Jan-Ags / Jan-Aug
20172016 Perub. (%)
Change (%)
2016-2015
TABEL 11 : NILAI EKSPOR INDONESIA MENURUT NEGARA TUJUAN (TERMASUK MINYAK BUMI & HASIL-HASILNYA DAN GAS)
TABLE INDONESIAN EXPORT VALUE BY COUNTRY OF DESTINATION (INCLUDING OIL & OIL PRODUCTS & NATURAL GAS)
NEGARA TUJUAN/
COUNTRY OF DESTINATION
2012 2013 2014 2015 2016
AMERIKA TENGAH & SELATAN/CENTRAL & SOUTH AMERICA 3.625,1 1,91 3.705,9 2,03 3.749,9 2,13 3.272,2 2,18 3.213,6 2,22 2.934,6 2,23 3.289,8 2,16 12,10
Meksiko/Mexico 649,9 0,34 687,3 0,38 850,9 0,48 824,0 0,55 815,1 0,56 740,4 0,56 916,3 0,60 23,75Panama/Panama 154,1 0,08 151,7 0,08 109,1 0,06 117,2 0,08 98,6 0,07 91,8 0,07 95,7 0,06 4,22Suriname/Suriname 7,1 0,00 5,8 0,00 8,2 0,00 7,5 0,01 5,1 0,00 4,7 0,00 5,0 0,00 5,97Chili/Chile 175,3 0,09 170,8 0,09 177,9 0,10 147,3 0,10 143,8 0,10 132,5 0,10 148,9 0,10 12,35Venezuela/Venezuela 96,0 0,05 61,9 0,03 39,1 0,02 19,5 0,01 13,4 0,01 13,1 0,01 8,1 0,01 -38,12Argentina/Argentina 312,5 0,16 335,2 0,18 236,9 0,13 237,1 0,16 219,6 0,15 199,4 0,15 244,8 0,16 22,79Brazil/Brazilia 1.486,2 0,78 1.514,4 0,83 1.498,2 0,85 1.166,0 0,78 1.102,0 0,76 1.004,4 0,76 1.117,0 0,73 11,20Kolumbia/Colombia 170,7 0,09 132,0 0,07 147,2 0,08 130,7 0,09 125,0 0,09 115,7 0,09 114,1 0,07 -1,32Guyana/Guyana 2,9 0,00 2,3 0,00 2,3 0,00 1,7 0,00 2,0 0,00 1,9 0,00 2,5 0,00 30,20Trinidad & Tobago/Trinidad & Tobago 9,7 0,01 14,9 0,01 14,5 0,01 15,6 0,01 17,2 0,01 16,2 0,01 18,2 0,01 12,39
Amerika Tengah & Selatan lainnya/Other South and Central America 560,7 0,30 629,6 0,34 665,5 0,38 605,5 0,40 671,8 0,46 614,5 0,47 619,3 0,41 0,77
EROPA BARAT/WEST EUROPE 17.300,8 9,10 16.005,6 8,77 16.082,2 9,14 15.039,3 10,00 15.722,2 10,88 14.367,6 10,94 15.249,0 10,00 6,13
Inggris/United Kingdom 1.696,8 0,89 1.634,8 0,90 1.658,6 0,94 1.527,1 1,02 1.590,4 1,10 1.458,1 1,11 1.307,4 0,86 -10,33Belanda/Netherlands 4.664,3 2,45 4.106,0 2,25 3.984,6 2,26 3.442,2 2,29 3.254,9 2,25 2.870,2 2,19 3.694,6 2,42 28,72Perancis/France 1.128,2 0,59 1.062,7 0,58 1.019,3 0,58 973,0 0,65 872,7 0,60 794,2 0,60 898,5 0,59 13,14Jerman /Germany 3.075,0 1,62 2.883,4 1,58 2.821,6 1,60 2.664,2 1,77 2.638,7 1,83 2.394,1 1,82 2.453,6 1,61 2,48Austria/Austria 43,0 0,02 50,0 0,03 40,3 0,02 29,3 0,02 28,6 0,02 27,5 0,02 23,7 0,02 -14,09Belgia/Belgium 1.297,7 0,68 1.259,3 0,69 1.217,3 0,69 1.113,3 0,74 1.125,7 0,78 1.015,6 0,77 1.144,0 0,75 12,64Swiss/Switzerland 58,4 0,03 81,9 0,04 133,9 0,08 1.071,7 0,71 2.199,8 1,52 2.194,5 1,67 1.239,6 0,81 -43,51Luksemburg/Luxemburg 23,7 0,01 16,3 0,01 11,8 0,01 12,4 0,01 9,7 0,01 8,2 0,01 12,9 0,01 57,75Monako/Monaco 0,7 0,00 0,3 0,00 0,3 0,00 0,2 0,00 0,5 0,00 0,4 0,00 0,6 0,00 33,40Denmark/Denmark 229,4 0,12 224,5 0,12 226,6 0,13 207,0 0,14 187,6 0,13 170,4 0,13 176,9 0,12 3,80Norwegia/Norway 87,1 0,05 72,7 0,04 65,3 0,04 65,7 0,04 76,4 0,05 72,0 0,05 59,0 0,04 -18,14Swedia/Sweden 166,3 0,09 162,4 0,09 177,1 0,10 146,8 0,10 144,7 0,10 130,8 0,10 139,0 0,09 6,31Finlandia/Finland 197,8 0,10 149,1 0,08 111,4 0,06 84,9 0,06 83,9 0,06 76,8 0,06 80,1 0,05 4,21Irlandia/Ireland 65,0 0,03 56,0 0,03 70,9 0,04 60,1 0,04 61,9 0,04 56,3 0,04 71,5 0,05 27,10Italia/Italy 2.277,0 1,20 2.128,6 1,17 2.286,9 1,30 1.872,9 1,25 1.572,1 1,09 1.440,4 1,10 1.762,8 1,16 22,38Spanyol/Spain 2.069,3 1,09 1.810,4 0,99 1.937,6 1,10 1.481,3 0,99 1.579,3 1,09 1.386,8 1,06 1.863,9 1,22 34,41Portugal/Portugal 81,0 0,04 157,6 0,09 161,3 0,09 143,2 0,10 152,4 0,11 141,0 0,11 150,7 0,10 6,84Iceland/Iceland 0,4 0,00 0,2 0,00 0,1 0,00 0,2 0,00 0,6 0,00 0,5 0,00 0,8 0,00 50,06Montserrat/Montserrat 0,0 0,00 0,0 0,00 0,0 0,00 0,0 0,00 0,0 0,00 - - - - -Yunani/Greece 139,9 0,07 149,2 0,08 157,3 0,09 143,9 0,10 142,2 0,10 129,5 0,10 169,4 0,11 30,83Uni Eropa Lainnya/Other Europe Union 0,7 0,00 1,0 0,00 12,3 0,01 0,3 0,00 0,3 0,00 0,2 0,00 0,1 0,00 -63,05
EROPA TIMUR/EAST EUROPE 2.440,0 1,28 2.634,4 1,44 2.566,7 1,46 2.338,8 1,56 2.675,3 1,85 2.459,5 1,87 2.572,0 1,69 4,57
Chekoslovakia/Czechoslovakia 30,0 0,02 28,5 0,02 0,0 0,00 0,0 0,00 0,0 0,00 0,0 0,00 0,0 0,00 -99,73Honggaria/Hungary 60,8 0,03 91,2 0,05 86,9 0,05 58,3 0,04 60,8 0,04 56,1 0,04 60,1 0,04 7,16Polandia/Poland 340,0 0,18 365,4 0,20 395,9 0,23 358,9 0,24 370,0 0,26 337,5 0,26 351,2 0,23 4,07Rumania/Romania 106,4 0,06 97,1 0,05 116,1 0,07 92,6 0,06 92,5 0,06 83,2 0,06 114,7 0,08 37,85Bulgaria/Bulgaria 48,0 0,03 44,4 0,02 77,5 0,04 42,3 0,03 44,6 0,03 39,8 0,03 53,2 0,03 33,50Federasi Rusia 867,3 0,46 930,3 0,51 1.052,9 0,60 993,7 0,66 1.261,6 0,87 1.180,5 0,90 1.158,4 0,76 -1,88Yugoslavia/Yugoslavia 0,0 0,00 0,0 0,00 0,0 0,00 0,0 0,00 0,0 0,00 - - - - -Albania/Albania 7,8 0,00 12,7 0,01 6,7 0,00 5,5 0,00 10,5 0,01 9,6 0,01 9,5 0,01 -1,42Eropa Timur lainnya/Other East Europe 979,7 0,52 1.064,9 0,58 830,8 0,47 787,5 0,52 835,2 0,58 752,7 0,57 824,9 0,54 9,59
TOTAL EKSPOR/TOTAL EXPORT 190.020,3 100,00 182.551,8 100,00 175.951,6 100,00 150.341,2 100,00 144.476,8 100,00 131.337,8 100,00 152.446,4 100,00 16,07
Sumber/Source : Badan Pusat Statistik/ Statistics Indonesia
19

Lanjutan/Continued
No. 08.05.148 Nilai/Value : Juta/Million US$
Nilai Pangsa(%) Nilai Pangsa(%) Nilai Pangsa(%) Nilai Pangsa(%) Nilai Pangsa(%) Nilai Pangsa(%) Nilai Pangsa(%)
Value Share(%) Value Share(%) Value Share(%) Value Share(%) Value Share(%) Value Share(%) Value Share(%)
ASIA TIMUR/EAST ASIA 51.518,4 33,66 49.869,9 33,26 43.417,6 29,75 37.531,2 28,48 38.311,5 29,16 34.374,2 28,75 43.114,4 30,82 25,43
Jepang/Japan 17.231,2 11,26 16.084,1 10,73 14.565,7 9,98 13.096,1 9,94 13.212,5 10,06 11.966,2 10,01 13.222,0 9,45 10,50
Hongkong/Hongkong 2.631,7 1,72 2.693,3 1,80 2.777,6 1,90 2.067,1 1,57 2.143,1 1,63 1.966,6 1,64 2.211,0 1,58 12,43
Korea Utara/North Korea 1,0 0,00 2,9 0,00 1,4 0,00 1,0 0,00 5,5 0,00 5,5 0,00 0,3 0,00 -95,28
Korea Selatan/South Korea 6.684,6 4,37 6.052,5 4,04 5.716,9 3,92 5.439,7 4,13 5.263,3 4,01 4.723,0 3,95 5.795,1 4,14 22,70
Taiwan/Taiwan 4.094,1 2,68 3.731,7 2,49 3.883,7 2,66 3.652,0 2,77 2.563,5 1,95 2.329,9 1,95 2.580,2 1,84 10,74
RRC/People Rep. of China 20.864,1 13,63 21.281,6 14,20 16.459,1 11,28 13.260,7 10,06 15.112,8 11,50 13.238,7 11,07 19.129,0 13,67 44,49
Asia Timur lainnya/Other East Asia 11,8 0,01 23,9 0,02 13,2 0,01 14,7 0,01 10,7 0,01 144,2 0,12 176,8 0,13 22,62
ASIA SELATAN & TENGGARA/SOUTH & SOUTH EAST 46.833,7 30,60 46.208,3 30,82 45.191,6 30,97 42.857,9 32,53 42.445,5 32,31 47.251,2 39,52 48.772,6 34,87 3,22
ASEAN/ASEAN 31.252,6 20,42 30.061,4 20,05 28.876,1 19,79 27.285,3 20,71 28.759,0 21,89 26.656,4 22,29 22.137,9 15,83 -16,95
- Muangthai/Thailand 5.490,2 3,59 5.214,1 3,48 5.002,9 3,43 4.600,5 3,49 4.608,7 3,51 4.217,1 3,53 5.012,1 3,58 18,85
- Singapura/Singapore 10.550,9 6,89 10.385,8 6,93 10.065,9 6,90 8.661,0 6,57 8.725,5 6,64 8.614,6 7,20 8.371,7 5,98 -2,82
- Pilipina/Phillipines 3.688,0 2,41 3.798,5 2,53 3.886,8 2,66 3.917,0 2,97 5.256,9 4,00 4.774,1 3,99 5.983,4 4,28 25,33
- Malaysia/Malaysia 8.469,0 5,53 7.268,2 4,85 6.397,2 4,38 6.227,8 4,73 6.013,3 4,58 5.381,6 4,50 6.473,4 4,63 20,29
- Myanmar/Myanmar 400,8 0,26 555,7 0,37 566,4 0,39 613,4 0,47 603,3 0,46 551,2 0,46 739,3 0,53 34,11
- Brunai Darussalam/Brunei 81,8 0,05 122,7 0,08 100,3 0,07 91,2 0,07 88,6 0,07 82,4 0,07 59,7 0,04 -27,53
- Vietnam/Vietnam 2.256,5 1,47 2.398,4 1,60 2.436,3 1,67 2.736,9 2,08 3.031,4 2,31 2.652,8 2,22 3.274,7 2,34 23,45
- Kamboja/Cambodia 291,6 0,19 312,1 0,21 415,7 0,28 429,7 0,33 425,4 0,32 377,0 0,32 464,2 0,33 23,11
- Laos/Laos Peop. Dem. Rep. 23,8 0,02 5,8 0,00 4,5 0,00 7,7 0,01 5,9 0,00 5,5 0,00 3,7 0,00 -32,74
Di Luar Asean/Non Asean 15.581,1 10,18 16.146,9 10,77 16.315,5 11,18 15.572,6 11,82 13.686,5 10,42 20.594,8 17,22 26.634,8 19,04 29,33
India/India 12.446,7 8,13 13.009,8 8,68 12.223,7 8,38 11.602,0 8,80 9.924,2 7,55 9.011,2 7,54 12.756,1 9,12 41,56
Pakistan/Pakistan 1.379,7 0,90 1.415,0 0,94 2.045,3 1,40 1.989,5 1,51 2.018,2 1,54 1.785,3 1,49 2.176,1 1,56 21,89
Bangladesh/Bangladesh 1.119,9 0,73 1.064,5 0,71 1.375,3 0,94 1.340,6 1,02 1.266,0 0,96 1.152,4 0,96 1.448,3 1,04 25,68
Sri Langka/Sri Lanka 341,6 0,22 390,9 0,26 385,8 0,26 341,5 0,26 262,2 0,20 240,7 0,20 269,4 0,19 11,92
Papua Nugini/Papua New Guinea 199,6 0,13 175,5 0,12 159,1 0,11 204,3 0,16 146,5 0,11 134,3 0,11 164,8 0,12 22,69
Afganistan/Afghanistan 56,2 0,04 50,9 0,03 77,4 0,05 36,3 0,03 16,2 0,01 13,1 0,01 18,2 0,01 39,04
Republik Maladewa/Maldives 25,3 0,02 24,5 0,02 31,0 0,02 32,2 0,02 39,2 0,03 36,3 0,03 34,1 0,02 -5,91
Di luar Asean lainnya/Other Non-Asean Countries 12,0 0,01 15,8 0,01 17,8 0,01 26,3 0,02 13,9 0,01 8.221,5 6,88 9.767,7 6,98 18,81
ASIA BARAT/WEST ASIA 6.415,2 4,19 6.434,9 4,29 7.726,1 5,29 6.366,1 4,83 5.159,2 3,93 4.960,2 4,15 5.682,0 4,06 14,55
Pers Emirat Arab/United Arab Emirat 1.614,9 1,06 1.584,0 1,06 2.501,4 1,71 1.899,9 1,44 1.587,9 1,21 1.421,3 1,19 1.464,1 1,05 3,01
Saudi Arabia/Arab Saudi 1.771,4 1,16 1.734,0 1,16 2.156,2 1,48 2.060,7 1,56 1.333,1 1,01 1.233,5 1,03 1.292,9 0,92 4,82
Turki/Turkey 1.363,4 0,89 1.536,2 1,02 1.446,1 0,99 1.158,8 0,88 1.024,0 0,78 925,2 0,77 1.071,8 0,77 15,85
Iran/Iran 482,6 0,32 469,3 0,31 406,1 0,28 216,5 0,16 234,8 0,18 208,0 0,17 271,8 0,19 30,67
Kuwait/Kuwait 129,8 0,08 143,5 0,10 171,1 0,12 146,2 0,11 121,7 0,09 111,4 0,09 111,8 0,08 0,33
Yordania/Yordan 158,2 0,10 159,3 0,11 152,6 0,10 95,2 0,07 90,2 0,07 81,8 0,07 92,1 0,07 12,58
Libanon/Lebanon 75,7 0,05 75,9 0,05 74,2 0,05 83,6 0,06 76,4 0,06 69,4 0,06 76,8 0,05 10,61
Yaman/Yemen 157,2 0,10 155,7 0,10 155,0 0,11 88,7 0,07 157,8 0,12 149,0 0,12 116,8 0,08 -21,66
Siria/Syrian Arab Republic 58,6 0,04 33,0 0,02 46,3 0,03 32,2 0,02 25,9 0,02 22,9 0,02 31,8 0,02 38,94
Oman/Oman 237,8 0,16 209,4 0,14 244,6 0,17 211,6 0,16 201,8 0,15 180,9 0,15 225,9 0,16 24,88
Irak/Iraq 44,9 0,03 45,4 0,03 72,3 0,05 95,1 0,07 91,1 0,07 80,7 0,07 114,4 0,08 41,78
Asia Barat lainnya/Other West Asia 320,7 0,21 289,2 0,19 300,2 0,21 277,6 0,21 214,7 0,16 476,1 0,40 811,9 0,58 70,54
20172015 2016
2016 Perub. (%)
Change (%)
2017-2016
TABEL 12 : NILAI EKSPOR INDONESIA MENURUT NEGARA TUJUAN (DILUAR MINYAK BUMI & HASIL-HASILNYA DAN GAS) TABLE INDONESIAN EXPORT VALUE BY COUNTRY OF DESTINATION (EXCLUDING OIL & OIL PRODUCTS & NATURAL GAS)
20
NEGARA TUJUAN/
COUNTRY OF DESTINATION
2012 2013 2014Jan-Ags / Jan-Aug

Lanjutan/Continued
No. 08.05.148 Nilai/Value : Juta/Million US$
Nilai Pangsa(%) Nilai Pangsa(%) Nilai Pangsa(%) Nilai Pangsa(%) Nilai Pangsa(%) Nilai Pangsa(%) Nilai Pangsa(%)
Value Share(%) Value Share(%) Value Share(%) Value Share(%) Value Share(%) Value Share(%) Value Share(%)
20172015 2016
2016 Perub. (%)
Change (%)
2017-2016
TABEL 12 : NILAI EKSPOR INDONESIA MENURUT NEGARA TUJUAN (DILUAR MINYAK BUMI & HASIL-HASILNYA DAN GAS) TABLE INDONESIAN EXPORT VALUE BY COUNTRY OF DESTINATION (EXCLUDING OIL & OIL PRODUCTS & NATURAL GAS)
NEGARA TUJUAN/
COUNTRY OF DESTINATION
2012 2013 2014Jan-Ags / Jan-Aug
AFRIKA/AFRICA 5.641,5 3,69 5.586,3 3,73 6.233,7 4,27 4.709,3 3,57 4.173,4 3,18 4.907,5 4,10 4.385,0 3,13 -10,65
Mesir/Egypt 1.013,7 0,66 1.101,8 0,73 1.341,0 0,92 1.171,7 0,89 1.110,4 0,85 982,3 0,82 1.108,1 0,79 12,81
Maroko/Marocco 89,8 0,06 68,5 0,05 82,2 0,06 87,4 0,07 95,6 0,07 89,5 0,07 80,3 0,06 -10,27
Tunisia/Tunis 95,6 0,06 75,9 0,05 82,5 0,06 55,9 0,04 38,0 0,03 36,9 0,03 53,1 0,04 44,06
Aljazair/Algeria 211,0 0,14 240,5 0,16 178,6 0,12 173,8 0,13 133,7 0,10 119,3 0,10 186,4 0,13 56,29
Sudan/Sudan 82,5 0,05 83,3 0,06 74,4 0,05 77,9 0,06 72,4 0,06 67,8 0,06 56,5 0,04 -16,68
Siera Leone/Siera Leone 22,4 0,01 21,2 0,01 25,0 0,02 24,3 0,02 26,9 0,02 24,4 0,02 26,6 0,02 8,97
Zimbabwe/Zimbabwe 9,1 0,01 5,7 0,00 2,8 0,00 2,7 0,00 3,1 0,00 3,0 0,00 2,6 0,00 -13,82
Mozambik/Mozambique 99,9 0,07 120,8 0,08 115,0 0,08 103,0 0,08 35,1 0,03 30,8 0,03 50,1 0,04 62,93
Nigeria/Nigeria 413,0 0,27 557,8 0,37 648,5 0,44 445,4 0,34 310,6 0,24 285,9 0,24 316,9 0,23 10,86
Sinegal/Senegal 43,1 0,03 54,7 0,04 74,1 0,05 87,6 0,07 72,6 0,06 45,9 0,04 87,3 0,06 90,09
Uganda/Uganda 10,7 0,01 10,1 0,01 9,6 0,01 5,9 0,00 6,4 0,00 6,0 0,01 9,8 0,01 62,69
Rep.Afrika Sel./Rep. of South Africa 1.650,3 1,08 1.270,1 0,85 1.379,1 0,95 665,6 0,51 727,6 0,55 681,3 0,57 638,8 0,46 -6,24
Kenya/Kenya 266,9 0,17 233,2 0,16 196,2 0,13 187,7 0,14 200,8 0,15 184,3 0,15 266,1 0,19 44,40
Mauritania/Mauritania 69,7 0,05 96,1 0,06 106,8 0,07 59,4 0,05 71,0 0,05 60,5 0,05 94,3 0,07 55,88
Ethiopia/Ethiopia 30,2 0,02 42,4 0,03 48,7 0,03 45,5 0,03 42,4 0,03 39,3 0,03 36,6 0,03 -7,00
Tanzania/Tanzania 236,6 0,15 192,7 0,13 202,5 0,14 214,0 0,16 154,5 0,12 147,0 0,12 254,1 0,18 72,81
Ghana/Ghana 159,3 0,10 246,5 0,16 212,3 0,15 158,4 0,12 109,9 0,08 98,9 0,08 99,2 0,07 0,29
Togo/Togo 68,3 0,04 72,9 0,05 133,0 0,09 103,7 0,08 52,1 0,04 45,8 0,04 110,7 0,08 141,88
Angola/Angola 141,8 0,09 164,2 0,11 189,7 0,13 137,0 0,10 57,7 0,04 50,0 0,04 85,7 0,06 71,49
Kongo/Congo 34,4 0,02 32,7 0,02 44,1 0,03 35,9 0,03 47,3 0,04 42,8 0,04 45,3 0,03 5,75
Benin/Benin 63,5 0,04 71,0 0,05 213,1 0,15 153,4 0,12 196,9 0,15 177,6 0,15 189,6 0,14 6,72
Kamerun/Cameroon 42,6 0,03 35,9 0,02 36,5 0,03 29,6 0,02 28,3 0,02 26,0 0,02 18,5 0,01 -28,84
Liberia/Liberia 32,9 0,02 21,1 0,01 23,2 0,02 23,3 0,02 19,4 0,01 18,2 0,02 28,2 0,02 54,85
Gabon/Gabon 17,9 0,01 16,3 0,01 20,4 0,01 16,7 0,01 10,5 0,01 9,5 0,01 9,3 0,01 -1,31
Pantai Gading/Cote D'ivoire (Ivory Coast) 86,9 0,06 58,4 0,04 103,9 0,07 53,5 0,04 52,1 0,04 49,7 0,04 33,1 0,02 -33,43
Mali/Mali 4,5 0,00 7,0 0,00 6,6 0,00 4,4 0,00 5,6 0,00 5,5 0,00 4,6 0,00 -15,57
Niger/Niger 2,7 0,00 4,1 0,00 15,2 0,01 7,3 0,01 9,8 0,01 9,8 0,01 5,8 0,00 -41,12
Afrika lainnya/Other Africa 642,1 0,42 681,4 0,45 668,9 0,46 578,5 0,44 482,6 0,37 1.569,6 1,31 487,6 0,35 -68,94
AUSTRALIA & OSEANIA/AUSTRALIA & OCEANIA 4.019,5 2,63 3.773,3 2,52 4.458,2 3,05 3.682,5 2,79 3.311,3 2,52 17.712,2 14,81 19.689,5 14,08 11,16
Australia/Australia 3.358,5 2,19 2.973,3 1,98 3.696,5 2,53 2.994,6 2,27 2.660,7 2,03 2.520,2 2,11 1.798,1 1,29 -28,65
Selandia Baru/New Zealand 366,1 0,24 446,1 0,30 460,0 0,32 397,0 0,30 357,6 0,27 314,0 0,26 368,0 0,26 17,18
Kaledonia Baru/New Caledonia 15,6 0,01 23,5 0,02 12,9 0,01 12,7 0,01 10,3 0,01 9,2 0,01 9,4 0,01 2,62
Fiji/Fiji 25,4 0,02 23,4 0,02 22,3 0,02 20,5 0,02 27,8 0,02 26,5 0,02 21,7 0,02 -18,15
Samoa/Samoa 7,1 0,00 6,5 0,00 6,5 0,00 6,7 0,01 6,1 0,00 5,7 0,00 5,5 0,00 -3,38
Timor Timur/East Timor 216,7 0,14 233,0 0,16 219,4 0,15 212,4 0,16 222,3 0,17 200,5 0,17 210,8 0,15 5,11
Oceania lainnya/Other Oceania 295,0 0,19 354,0 0,24 301,6 0,21 290,8 0,22 293,0 0,22 14.878,0 12,44 17.523,4 12,53 17,78
AMERIKA UTARA/NORTH AMERICA 15.383,4 10,05 15.864,3 10,58 16.612,0 11,38 16.030,5 12,17 16.416,7 12,50 18,7 0,02 21,3 0,02 14,27
Amerika Serikat/USA 14.590,9 9,53 15.081,9 10,06 15.857,0 10,87 15.308,2 11,62 15.684,3 11,94 14.228,0 11,90 15.719,1 11,24 10,48
Kanada/Canada 792,4 0,52 782,3 0,52 755,0 0,52 722,3 0,55 732,5 0,56 659,1 0,55 760,6 0,54 15,40
Amerika Utara lainnya/Oth. North America 0,0 - 0,0 - 0,0 - 0,0 - 0,0 - - - - - -
21

Lanjutan/Continued
No. 08.05.148 Nilai/Value : Juta/Million US$
Nilai Pangsa(%) Nilai Pangsa(%) Nilai Pangsa(%) Nilai Pangsa(%) Nilai Pangsa(%) Nilai Pangsa(%) Nilai Pangsa(%)
Value Share(%) Value Share(%) Value Share(%) Value Share(%) Value Share(%) Value Share(%) Value Share(%)
20172015 2016
2016 Perub. (%)
Change (%)
2017-2016
TABEL 12 : NILAI EKSPOR INDONESIA MENURUT NEGARA TUJUAN (DILUAR MINYAK BUMI & HASIL-HASILNYA DAN GAS) TABLE INDONESIAN EXPORT VALUE BY COUNTRY OF DESTINATION (EXCLUDING OIL & OIL PRODUCTS & NATURAL GAS)
NEGARA TUJUAN/
COUNTRY OF DESTINATION
2012 2013 2014Jan-Ags / Jan-Aug
AMERIKA TENGAH & SELATAN/CENTRAL & SOUTH 3.568,2 2,33 3.635,2 2,42 3.712,1 2,54 3.251,4 2,47 3.195,3 2,43 14.619,7 12,23 15.457,1 11,05 5,73
Meksiko/Mexico 593,5 0,39 635,3 0,42 813,1 0,56 803,2 0,61 796,8 0,61 722,0 0,60 892,1 0,64 23,56Panama/Panama 154,1 0,10 133,0 0,09 109,1 0,07 117,2 0,09 98,6 0,08 91,8 0,08 95,7 0,07 4,22Suriname/Suriname 7,1 0,00 5,8 0,00 8,2 0,01 7,5 0,01 5,1 0,00 4,7 0,00 4,9 0,00 5,89Chili/Chile 175,3 0,11 170,8 0,11 177,9 0,12 147,3 0,11 143,8 0,11 132,5 0,11 148,9 0,11 12,35Venezuela/Venezuela 96,0 0,06 61,9 0,04 39,1 0,03 19,5 0,01 13,4 0,01 13,1 0,01 8,1 0,01 -38,12Argentina/Argentina 312,5 0,20 335,2 0,22 236,9 0,16 237,1 0,18 219,6 0,17 199,4 0,17 244,8 0,18 22,79Brazil/Brazilia 1.485,9 0,97 1.514,4 1,01 1.498,2 1,03 1.166,0 0,88 1.102,0 0,84 1.004,4 0,84 1.117,0 0,80 11,20Kolumbia/Colombia 170,7 0,11 132,0 0,09 147,2 0,10 130,7 0,10 125,0 0,10 115,7 0,10 114,1 0,08 -1,32Guyana/Guyana 2,9 0,00 2,3 0,00 2,3 0,00 1,7 0,00 2,0 0,00 1,9 0,00 2,5 0,00 30,20Trinidad & Tobago/Trinidad & Tobago 9,7 0,01 14,9 0,01 14,5 0,01 15,6 0,01 17,2 0,01 16,2 0,01 18,2 0,01 12,39
Amerika Tengah & Selatan lainnya/Other South and Central 560,5 0,37 629,6 0,42 665,5 0,46 605,5 0,46 671,8 0,51 12.318,0 10,30 12.810,7 9,16 4,00
EROPA BARAT/WEST EUROPE 17.222,3 11,25 15.911,3 10,61 16.002,4 10,97 14.999,0 11,38 15.682,9 11,94 1.038,3 0,87 1.161,2 0,83 11,83Inggris/United Kingdom 1.696,8 1,11 1.633,7 1,09 1.658,6 1,14 1.527,1 1,16 1.590,2 1,21 1.458,0 1,22 1.307,0 0,93 -10,36Belanda/Netherlands 4.586,0 3,00 4.014,5 2,68 3.906,2 2,68 3.409,7 2,59 3.219,9 2,45 2.839,6 2,37 3.640,2 2,60 28,19Perancis/France 1.128,2 0,74 1.062,7 0,71 1.019,3 0,70 973,0 0,74 872,7 0,66 794,2 0,66 898,5 0,64 13,14Jerman /Germany 3.074,9 2,01 2.881,9 1,92 2.820,5 1,93 2.661,9 2,02 2.635,1 2,01 2.390,7 2,00 2.452,9 1,75 2,60Austria/Austria 43,0 0,03 50,0 0,03 40,3 0,03 29,3 0,02 28,6 0,02 27,5 0,02 23,7 0,02 -14,09Belgia/Belgium 1.297,7 0,85 1.259,2 0,84 1.217,3 0,83 1.107,8 0,84 1.125,2 0,86 1.015,0 0,85 1.143,7 0,82 12,68Swiss/Switzerland 58,4 0,04 81,9 0,05 133,9 0,09 1.071,7 0,81 2.199,8 1,67 2.194,5 1,84 1.239,6 0,89 -43,51Luksemburg/Luxemburg 23,7 0,02 16,3 0,01 11,8 0,01 12,4 0,01 9,7 0,01 8,2 0,01 12,9 0,01 57,75Monako/Monaco 0,7 0,00 0,3 0,00 0,3 0,00 0,2 0,00 0,5 0,00 0,4 0,00 0,5 0,00 22,69Denmark/Denmark 229,4 0,15 224,5 0,15 226,6 0,16 207,0 0,16 187,6 0,14 170,4 0,14 176,9 0,13 3,80Norwegia/Norway 87,1 0,06 72,7 0,05 65,3 0,04 65,7 0,05 76,4 0,06 72,0 0,06 59,0 0,04 -18,14Swedia/Sweden 166,3 0,11 162,4 0,11 177,1 0,12 146,8 0,11 144,7 0,11 130,8 0,11 139,0 0,10 6,31Finlandia/Finland 197,8 0,13 149,1 0,10 111,4 0,08 84,9 0,06 83,9 0,06 76,8 0,06 80,1 0,06 4,21Irlandia/Ireland 65,0 0,04 56,0 0,04 70,9 0,05 60,1 0,05 61,9 0,05 56,3 0,05 71,5 0,05 27,10Italia/Italy 2.277,0 1,49 2.128,4 1,42 2.286,5 1,57 1.872,9 1,42 1.572,1 1,20 1.440,4 1,20 1.762,8 1,26 22,38Spanyol/Spain 2.069,3 1,35 1.810,4 1,21 1.937,6 1,33 1.481,3 1,12 1.579,3 1,20 1.386,8 1,16 1.863,9 1,33 34,41Portugal/Portugal 81,0 0,05 157,6 0,11 161,3 0,11 143,2 0,11 152,4 0,12 141,0 0,12 150,7 0,11 6,84Iceland/Iceland 0,4 0,00 0,2 0,00 0,1 0,00 0,2 0,00 0,6 0,00 0,5 0,00 0,8 0,00 50,06Montserrat/Montserrat 0,0 0,00 0,0 0,00 0,0 0,00 0,0 0,00 0,0 0,00 0,0 0,00 0,0 0,00 -Yunani/Greece 139,9 0,09 149,2 0,10 157,3 0,11 143,9 0,11 142,2 0,11 129,5 0,11 169,4 0,12 30,83Uni Eropa Lainnya/Other Europe Union 0,7 0,00 1,0 0,00 12,3 0,01 0,3 0,00 0,3 0,00 151,2 0,13 177,3 0,13 17,27
EROPA TIMUR/EAST EUROPE 2.440,0 1,59 2.634,4 1,76 2.566,7 1,76 2.338,6 1,77 2.675,3 2,04 1.510,4 1,26 1.603,2 1,15 6,15Chekoslovakia/Czechoslovakia 30,0 0,02 28,5 0,02 0,0 0,00 0,0 0,00 0,0 0,00 0,0 0,00 0,0 0,00 -99,73Honggaria/Hungary 60,8 0,04 91,2 0,06 86,9 0,06 58,3 0,04 60,8 0,05 56,1 0,05 60,1 0,04 7,16Polandia/Poland 340,0 0,22 365,4 0,24 395,9 0,27 358,6 0,27 370,0 0,28 337,5 0,28 351,2 0,25 4,07Rumania/Romania 106,4 0,07 97,1 0,06 116,1 0,08 92,6 0,07 92,5 0,07 83,2 0,07 114,7 0,08 37,85Bulgaria/Bulgaria 48,0 0,03 44,4 0,03 77,5 0,05 42,3 0,03 44,6 0,03 39,8 0,03 53,2 0,04 33,50Federasi Rusia 867,3 0,57 930,3 0,62 1.052,9 0,72 993,7 0,75 1.261,6 0,96 1.180,5 0,99 1.158,4 0,83 -1,88Yugoslavia/Yugoslavia 0,0 0,00 0,0 0,00 0,0 0,00 0,0 0,00 0,0 0,00 0 0,00 0 0,00 -Albania/Albania 7,8 0,01 12,7 0,01 6,7 0,00 5,5 0,00 10,5 0,01 9,6 0,01 9,5 0,01 -1,42Eropa Timur lainnya/Oth East Europe 979,7 0,64 1.064,9 0,71 830,8 0,57 787,5 0,60 835,2 0,64 -196,4 -0,16 -143,9 -0,10 -26,75
TOTAL EKSPOR/TOTAL EXPORT 153.043,0 100,00 149.918,8 100,00 145.932,8 100,00 131.766,8 100,00 ####### 100,00 119.571,5 100,00 139.886,4 100,00 16,99
Sumber/Source : Badan Pusat Statistik/ Statistics Indonesia
22

Lanjutan/Continued
Nilai/Value : Ribu/Thousand US$
Perub. (%)
Change (%)
17-16
0303 Fish; frozen, excluding fish fillets and other fish meat of heading 0304 519.856,2 466.889,4 407.525,3 329.170,0 388.913,0 -8,88 241.801,1 383.368,8 58,55
0304 Fish fillets and other fish meat (whether or not minced); fresh, chilled or frozen 423.212,9 384.057,9 413.554,8 430.697,1 427.299,3 1,35 277.917,9 353.116,0 27,06
0306 Crustaceans; in shell or not, live, fresh, chilled, frozen, dried, salted or in brine; smoked, cooked or not before or during
smoking; in shell, steamed or boiled, whether or not chilled,
1.206.543,8 1.481.284,3 1.815.229,8 1.356.322,5 1.464.398,7 3,04 976.081,3 1.363.685,4 39,71
0307 Molluscs; whether in shell or not, live, fresh, chilled, frozen, dried, salted or in brine; smoked molluscs, whether in shell
or not, cooked or not before or during the smoking process; flours, meals
197.779,0 174.524,5 173.604,8 232.117,2 342.946,1 14,87 189.410,2 292.492,1 54,42
0801 Nuts, edible; coconuts, Brazil nuts and cashew nuts, fresh or dried, whether or not shelled or peeled 213.959,8 224.822,5 346.571,4 399.372,0 373.433,2 18,39 187.026,9 423.279,8 126,32
0802 Nuts (excluding coconuts, Brazils and cashew nuts); fresh or dried, whether or not shelled or peeled 157.682,0 170.730,9 268.338,9 326.247,2 281.627,2 19,81 203.429,0 291.783,2 43,43
0901 Coffee, whether or not roasted or decaffeinated; husks and skins; coffee substitutes containing coffee in any proportion 1.249.518,8 1.174.044,5 1.039.609,5 1.197.735,1 1.008.549,1 -4,00 550.253,6 1.046.935,2 90,26
0904 Pepper of the genus piper; dried or crushed or ground fruits of the genus capsicum or of the genus pimenta 435.257,1 354.712,1 330.032,0 559.241,8 441.352,9 4,95 222.594,0 212.291,1 -4,63
1511 Palm oil and its fractions; whether or not refined, but not chemically modified 17.602.168,0 15.838.850,2 17.464.904,7 15.385.275,3 14.365.422,2 -4,26 8.307.471,2 15.338.784,5 84,64
1513 Coconut (copra), palm kernel or babassu oil and their fractions; whether or not refined but not chemically modified 2.458.229,9 1.829.519,4 2.484.350,2 2.378.262,2 2.726.685,9 4,81 1.623.139,0 2.482.923,4 52,97
1516 Animal or vegetable fats and oils and their fractions; partly or wholly hydrogenated, inter-esterified, re-esterified or
elaidinised, whether or not refined, but not further prepared
258.406,6 797.117,6 176.620,3 179.293,9 312.462,5 -10,52 164.629,9 269.350,8 63,61
1517 Margarine; edible mixtures or preparations of animal or vegetable fats or oils or of fractions of different fats or oils of this
chapter, other than edible fats or oils of heading no. 1516
806.388,3 600.050,9 778.219,1 617.751,6 684.627,4 -2,94 396.329,9 743.309,1 87,55
1604 Prepared or preserved fish; caviar and caviar substitutes prepared from fish eggs 410.205,3 424.187,8 397.809,6 338.893,9 327.858,0 -6,51 208.784,9 328.469,3 57,32
1605 Crustaceans, molluscs and other aquatic invertebrates, prepared or preserved 430.327,3 564.815,6 737.471,7 605.414,4 633.856,8 8,81 413.271,9 439.063,7 6,24
1804 Cocoa; butter, fat and oil 236.138,4 356.763,6 660.783,6 726.296,0 697.860,0 33,35 426.782,8 562.931,4 31,90
1905 Bread, pastry, cakes, biscuits, other bakers' wares, whether or not 258.667,6 319.403,8 394.489,3 430.407,2 520.486,1 18,49 299.976,3 493.035,3 64,36
2101 Extracts, essences, concentrates of coffee, tea or mate; preparations with a basis of these products or with a basis of
coffee, tea or mate; roasted chicory and other roasted coffee
320.673,0 297.509,1 327.502,8 350.402,3 424.197,1 7,50 281.330,6 366.961,3 30,44
2106 Food preparations not elsewhere specified or included 226.401,1 240.466,8 303.167,6 344.078,6 361.479,0 13,82 243.669,8 305.976,7 25,57
2306 Oil-cake and other solid residues; whether or not ground or in the form of pellets, resulting from the extraction of
vegetable fats or oils other than those of heading no. 2304 or 2305 from the extraction of cotton seed oils pellets,
resulting from the e
502.900,0 576.605,2 604.300,2 437.693,3 413.115,2 -6,47 256.720,1 382.695,7 49,07
2402 Cigars, cheroots, cigarillos and cigarettes; of tobacco or of tobacco substitutes 617.830,9 708.141,4 804.713,6 793.316,8 803.902,3 6,61 526.803,7 744.857,5 41,39
2603 Copper ores and concentrates 2.594.674,5 3.006.809,9 1.683.587,7 3.277.157,6 3.481.556,9 6,97 2.040.555,5 2.469.323,1 21,01
2701 Coal; briquettes, ovoids and similar solid fuels manufactured from coal 24.293.180,4 22.773.242,2 18.697.799,9 14.717.264,7 12.898.709,8 -15,66 7.919.527,6 14.529.074,2 83,46
2702 Lignite; whether or not agglomerated, excluding jet 1.878.098,9 1.741.688,5 2.121.528,8 1.281.696,2 1.613.043,8 -5,93 804.938,0 2.103.616,6 161,34
2814 Ammonia; anhydrous or in aqueous solution 476.600,1 360.719,4 345.145,9 434.208,4 330.946,4 -5,29 266.467,0 248.346,1 -6,80
2905 Acyclic alcohols and their halogenated, sulphonated, nitrated or nitrosated derivatives 635.508,2 640.144,1 609.625,3 433.624,9 381.817,7 -13,14 237.580,9 445.366,8 87,46
2915 Acids; saturated acyclic monocarboxylic acids and their anhydrides, halides, peroxides and peroxyacids; their
halogenated, sulphonated, nitrated or nitrosated derivatives
218.739,3 191.586,8 329.764,1 380.764,1 499.040,5 26,32 279.663,0 490.539,7 75,40
2922 Oxygen-function amino-compounds 680.094,7 615.435,3 630.968,2 564.719,3 454.748,5 -8,52 311.136,0 351.973,7 13,13
3004 Medicaments; (not goods of heading no. 3002, 3005 or 3006) consisting of mixed or unmixed products for therapeutic
or prophylactic use, put up in measured doses (incl. those in the form
297.418,9 286.185,8 357.060,1 431.083,6 442.541,1 12,80 296.197,8 367.528,1 24,08
19
No. 08.05.148
2012 2013 2014 2015
2016 2017
2016
TABEL 13 : PERKEMBANGAN NILAI 100 JENIS BARANG EKSPOR UTAMA INDONESIA *)
DEVELOPMENT OF INDONESIAN EXPORT VALUE AT 100 MAJOR COMMODITIES
JENIS BARANG
DESCRIPTION OF GOODS
Trend (%)
12-16
Jan-Ags/Jan-Aug

Lanjutan/Continued
Nilai/Value : Ribu/Thousand US$
Perub. (%)
Change (%)
17-16
No. 08.05.148
2012 2013 2014 2015
2016 2017
2016
TABEL 13 : PERKEMBANGAN NILAI 100 JENIS BARANG EKSPOR UTAMA INDONESIA *)
DEVELOPMENT OF INDONESIAN EXPORT VALUE AT 100 MAJOR COMMODITIES
JENIS BARANG
DESCRIPTION OF GOODS
Trend (%)
12-16
Jan-Ags/Jan-Aug
3102 Fertilizers; mineral or chemical, nitrogenous 488.311,5 552.419,8 402.174,1 263.395,3 295.554,5 -16,01 162.232,5 174.322,9 7,45
3401 Soap; organic surface-active preparations used as soap, skin washing, in bars, cakes, moulded pieces, shapes, liquid
or cream, containing soap or not; for retail, paper, wadding, felt and
635.926,1 658.793,2 623.204,6 531.266,4 554.957,9 -4,76 356.892,2 559.466,1 56,76
3402 Organic surface-active agents (not soap); surface-active, washing (including auxiliary washing) and cleaning
preparations, containing soap or not, excluding those of heading no. 3401
236.341,4 242.420,1 279.649,5 273.830,3 264.915,0 3,56 171.467,9 241.226,0 40,68
3808 Insecticides, rodenticides, fungicides, herbicides, anti-sprouting products, plant growth regulators, disinfectants and the
like, put up in forms or packings for retail sale or as preparations or forms or packings for retail sale or as preparations
or ar
249.577,5 317.445,1 300.839,9 275.704,4 280.151,4 0,91 198.658,0 247.691,4 24,68
3823 Industrial monocarboxylic fatty acids; acid oils from refining; industrial fatty alcohols 1.881.201,2 1.721.166,7 2.367.120,9 1.835.159,6 2.328.242,7 5,03 1.380.998,9 2.438.528,9 76,58
3826 Biodiesel and mixtures thereof; not containing or containing less than 70% by weight of petroleum oils or oils obtained
from bituminous minerals weight of petroleum oils or oils obtained from bituminous materials
1.380.806,6 1.406.996,6 1.141.337,8 195.163,2 287.246,5 -40,04 218.088,3 117.178,0 -46,27
3907 Polyacetals, other polyethers and epoxide resins, in primary forms; polycarbonates, alkyd resins, polyallyl esters and
other polyesters, in primary forms
412.927,9 405.395,4 519.117,2 417.554,1 346.128,5 -3,18 223.678,2 309.867,3 38,53
3920 Plastics; plates, sheets, film, foil and strip (not self-adhesive); non-cellular and not reinforced, laminated, supported or
similarly combined with other materials, n.e.c. in chapter 39
537.389,5 527.392,6 567.227,4 503.505,4 509.574,7 -1,51 332.205,1 465.756,3 40,20
3923 Plastic articles for the conveyance or packing of goods; stoppers, lids, caps and other closures of plastics 390.258,6 371.236,2 380.273,4 356.014,7 337.963,4 -3,24 225.767,8 288.254,1 27,68
4001 Natural rubber, balata, gutta-percha, guayule, chicle and similar gums; in primary forms or in plates, sheets or strip 7.864.528,1 6.910.663,1 4.744.753,1 3.701.477,6 3.372.319,0 -20,69 2.084.201,3 4.428.842,6 112,50
4011 New pneumatic tyres, of rubber 1.704.181,1 1.652.349,0 1.627.754,8 1.546.876,1 1.605.021,5 -1,84 1.064.694,4 1.322.504,5 24,21
4202 Trunks; suit, camera, jewellery, cutlery cases; travel, tool, similar bags; wholly or mainly covered by leather, composition
leather, plastic sheeting, textile materials, vulcanised fibre, paperboard
203.907,4 219.523,2 225.806,7 228.643,3 266.889,0 5,96 162.063,3 299.624,6 84,88
4409 Wood (including strips, friezes for parquet flooring, not assembled), continuously shaped (tongued, grooved, v-jointed,
beaded or the like) along any edges, ends or faces, whether or not planed, sanded or end-jointed
514.980,4 508.960,2 616.507,9 613.754,5 614.539,5 5,56 393.385,6 555.908,5 41,31
4412 Plywood, veneered panels and similar laminated wood 2.011.518,2 2.176.212,9 2.372.470,9 2.345.947,2 2.211.610,2 2,68 1.450.498,4 1.810.258,2 24,80
4418 Builders' joinery and carpentry of wood, including cellular wood panels, assembled flooring panels, shingles and shakes 315.786,3 330.433,8 341.399,3 355.270,5 362.871,9 3,57 234.708,6 325.086,8 38,51
4703 Chemical wood pulp, soda or sulphate, other than dissolving grades 1.544.658,4 1.841.062,9 1.718.324,9 1.725.447,3 1.560.591,0 -0,44 1.044.843,9 1.807.952,4 73,04
4802 Uncoated paper and paperboard, used for writing, printing or other graphics, non perforated punch-cards and punch
tape paper, in rolls or rectangular sheets, of any size, other than paper of
2.077.101,5 1.843.305,7 1.912.658,0 1.792.984,0 1.794.182,7 -3,15 1.174.628,2 1.663.407,9 41,61
4803 Tissue, towel, napkin stock or similar; for household or sanitary uses, cellulose wadding, webs of cellulose fibres, in
rolls over 36cm in width or rectangular sheets with one side exceeding 36cm when or rectangular sheets with one side
more than 36cm in
333.841,4 375.167,1 353.188,3 438.938,4 503.520,5 10,28 356.780,6 430.473,9 20,66
4810 Paper and paperboard, coated one or both sides with kaolin (china clay) or inorganic substances, with binder or not, no
other coating, surface coloured or not, surface decorated or printed, in rolls or of total fibres obtained by mechanical or
chemi-mech
602.108,6 615.539,5 548.070,1 470.677,6 385.569,7 -10,95 257.975,4 284.638,2 10,34
5205 Cotton yarn (other than sewing thread), containing 85% or more by weight of cotton, not put up for retail sale 272.568,2 371.834,2 451.514,3 428.174,1 431.255,6 11,17 277.988,3 396.366,0 42,58
5402 Synthetic filament yarn (other than sewing thread), not put up for retail sale, including synthetic monofilament of less
than 67 decitex
495.812,6 485.651,3 462.607,3 425.532,1 381.781,2 -6,34 248.390,7 342.107,9 37,73
20

Lanjutan/Continued
Nilai/Value : Ribu/Thousand US$
Perub. (%)
Change (%)
17-16
No. 08.05.148
2012 2013 2014 2015
2016 2017
2016
TABEL 13 : PERKEMBANGAN NILAI 100 JENIS BARANG EKSPOR UTAMA INDONESIA *)
DEVELOPMENT OF INDONESIAN EXPORT VALUE AT 100 MAJOR COMMODITIES
JENIS BARANG
DESCRIPTION OF GOODS
Trend (%)
12-16
Jan-Ags/Jan-Aug
5407 Woven fabrics of synthetic filament yarn, including woven fabrics obtained from materials of heading no. 5404 848.042,0 737.960,7 756.215,4 646.318,0 602.952,4 -7,82 424.226,6 435.858,3 2,74
5509 Yarn (other than sewing thread) of synthetic staple fibres, not put up for retail sale 894.903,4 953.198,0 988.741,8 859.263,5 792.685,9 -3,40 553.434,4 669.160,8 20,91
5510 Yarn (other than sewing thread) of artificial staple fibres, not put up for retail sale 388.793,0 461.133,8 442.455,2 503.797,2 499.646,0 6,08 344.154,9 416.596,5 21,05
6103 Suits, ensembles, jackets, blazers, trousers, bib and brace overalls, breeches, shorts (not swimwear); men's or boys',
knitted or crocheted
225.027,5 256.403,8 287.007,8 274.371,7 268.751,2 4,32 175.648,9 275.276,4 56,72
6104 Suits, ensembles, jackets, dresses, skirts, divided skirts, trousers, bib and brace overalls, breeches and shorts (not
swimwear), women's or girls', knitted or crocheted knitted or crocheted
586.154,4 618.394,2 656.886,1 644.011,3 624.682,0 1,69 412.152,5 625.301,4 51,72
6109 T-shirts, singlets and other vests; knitted or crocheted 613.553,3 425.362,0 348.574,8 487.040,0 489.762,2 -3,10 319.803,6 423.941,7 32,56
6110 Jerseys, pullovers, cardigans, waistcoats and similar articles; knitted or crocheted 841.558,1 924.053,6 837.614,2 619.775,7 677.892,8 -7,98 428.545,5 726.619,9 69,55
6201 Overcoats, car-coats, capes, cloaks, anoraks (including ski-jackets), wind-cheaters, wind-jackets and similar articles,
men's or boys', other than those of heading no. 6203 (not knitted
403.473,2 350.851,4 362.279,4 322.445,9 370.534,3 -2,52 240.476,2 358.307,2 49,00
6203 Suits, ensembles, jackets, blazers, trousers, bib and brace overalls, breeches and shorts (other than swimwear); men's
or boys' (not knitted or crocheted)
641.441,6 728.398,0 709.427,3 678.374,7 701.771,8 1,09 481.182,2 588.988,4 22,40
6204 Suits, ensembles, jackets, dresses, skirts, divided skirts, trousers, bib and brace overalls, breeches and shorts (other
than swimwear); women's or girls' (not knitted or crocheted)
825.035,6 869.257,9 884.799,7 1.010.701,0 939.973,5 4,20 647.279,9 798.174,0 23,31
6205 Shirts; men's or boys' (not knitted or crocheted) 504.892,5 532.951,4 510.401,8 457.125,3 450.771,5 -3,73 298.664,5 361.465,2 21,03
6206 Blouses, shirts and shirt-blouses; women's or girls' (not knitted or crocheted) 497.990,7 564.595,7 586.930,2 600.819,0 559.765,0 3,00 391.797,2 503.502,1 28,51
6212 Brassieres, girdles, corsets, braces, suspenders, garters and similar articles and parts thereof; whether or not knitted or
crocheted
323.414,8 326.865,9 325.126,8 383.571,6 351.151,0 3,30 234.960,1 317.906,8 35,30
6402 Footwear; with outer soles and uppers of rubber or plastics (excluding waterproof footwear) 540.446,0 536.220,8 643.464,1 554.391,8 512.507,5 -0,73 313.705,4 447.554,2 42,67
6403 Footwear; with outer soles of rubber, plastics, leather or composition leather and uppers of leather 2.195.930,3 2.272.075,5 2.233.324,2 2.303.477,6 2.260.269,7 0,72 1.441.492,1 2.083.510,7 44,54
6404 Footwear; with outer soles of rubber, plastics, leather or composition leather and uppers of textile materials 671.281,4 905.619,6 1.065.774,7 1.474.816,5 1.707.373,5 26,55 1.170.120,3 1.347.980,7 15,20
6704 Wigs, false beards, eyebrows and eyelashes, switches and the like, of human or animal hair or of textile materials;
articles of human hair, n.e.c. or included
270.780,3 297.322,8 311.725,4 340.871,9 381.962,8 8,60 245.390,2 362.364,0 47,67
7108 Gold (including gold plated with platinum) unwrought or in semi-manufactured forms, or in powder form 2.006.180,6 1.817.465,0 1.504.594,1 1.377.388,0 1.373.479,0 -9,83 861.418,1 1.491.051,6 73,09
7112 Waste and scrap of precious metal or of metal clad with precious metal; other waste and scrap containing precious
metal compounds, of a kind uses principally for the recovery of precious
940.794,5 622.853,5 886.719,5 685.461,9 736.510,7 -3,86 492.661,6 738.846,2 49,97
7113 Jewellery articles and parts thereof, of precious metal or of metal clad with precious metal 157.499,1 177.425,1 2.114.581,5 3.287.912,6 4.078.827,7 156,71 3.488.262,0 2.394.608,5 -31,35
7201 Pig iron and spiegeleisen in pigs, blocks or other primary forms 5.037,6 38.948,6 130.421,3 184.885,1 533.336,3 196,89 393.120,8 165.316,6 -57,95
7202 Ferro-alloys 369.169,1 249.848,5 331.762,3 349.086,3 589.026,5 13,53 237.257,6 1.110.344,0 367,99
7308 Structures of iron or steel and parts thereof; plates, rods, angles, shapes, sections, tubes and the like, prepared for use
in structures
427.400,4 580.851,2 691.507,5 247.445,4 701.271,9 1,38 489.805,1 138.938,7 -71,63
7403 Copper; refined and copper alloys, unwrought 556.098,1 525.860,5 757.179,3 553.843,8 788.588,8 7,79 443.723,5 895.906,5 101,91
7408 Copper wire 913.382,1 853.258,0 762.736,7 641.214,5 499.973,3 -13,85 322.284,5 447.777,2 38,94
7501 Nickel mattes; nickel oxide sinters and other intermediate products of nickel metallurgy 981.839,0 921.889,9 1.038.074,3 789.745,9 584.143,3 -11,25 348.115,7 494.402,6 42,02
8001 Tin; unwrought 2.051.317,3 1.959.795,1 1.580.196,8 1.153.622,7 1.119.872,1 -15,97 606.467,7 1.276.192,7 110,43
8407 Reciprocating or rotary internal combustion piston engines 92.646,5 124.032,3 139.233,8 143.789,6 319.197,5 29,98 188.689,0 329.077,7 74,40
21

Lanjutan/Continued
Nilai/Value : Ribu/Thousand US$
Perub. (%)
Change (%)
17-16
No. 08.05.148
2012 2013 2014 2015
2016 2017
2016
TABEL 13 : PERKEMBANGAN NILAI 100 JENIS BARANG EKSPOR UTAMA INDONESIA *)
DEVELOPMENT OF INDONESIAN EXPORT VALUE AT 100 MAJOR COMMODITIES
JENIS BARANG
DESCRIPTION OF GOODS
Trend (%)
12-16
Jan-Ags/Jan-Aug
8409 Parts suitable for use solely or principally with the engines of heading no. 8407 or 8408 335.092,8 502.088,3 321.163,2 298.879,6 315.821,3 -6,17 203.511,4 334.473,9 64,35
8418 Refrigerators, freezers and other refrigerating or freezing equipment, electric or other; heat pumps other than air
conditioning machines of heading no. 8415
456.139,1 424.380,9 397.459,8 322.484,4 328.360,5 -8,90 218.965,4 295.503,7 34,95
8419 Machinery, plant (not domestic), or laboratory equipment; electrically heated or not, (excluding items in 85.14) for the
treatment of materials by a process involving change of
28.565,4 62.882,1 325.417,9 147.167,6 434.451,9 87,65 349.542,1 48.622,6 -86,09
8443 Printing machinery; used for printing by means of plates, cylinders and other printing components of heading 84.42;
other printers, copying machines and facsimile machines, whether or not textile, leather, wallpaper, wrapping paper,
linoleum or other mat
1.826.819,9 1.537.449,5 1.593.788,2 1.531.098,6 1.358.024,7 -5,80 855.518,1 1.311.416,9 53,29
8471 Automatic data processing machines and units thereof, magnetic or optical readers, machines for transcribing data onto
data media in coded form and machines for processing such data, not
429.161,4 310.465,0 380.225,4 250.493,5 273.130,3 -10,58 168.136,8 252.563,0 50,21
8504 Electric transformers, static converters (e.g. rectifiers) and inductors 578.805,5 475.800,4 441.781,0 450.965,3 392.598,8 -7,96 256.276,9 434.843,9 69,68
8506 Cells and batteries; primary 333.602,9 396.691,2 452.071,1 481.468,4 463.568,3 8,89 303.221,8 425.300,0 40,26
8507 Electric accumulators, including separators therefor; whether or not rectangular (including square) 412.761,0 346.827,0 307.272,5 288.420,5 308.635,5 -7,37 199.512,0 210.220,3 5,37
8518 Microphones and their stands; loudspeakers, mounted or not in their enclosures; headphones and earphones,
combined or not with a microphone, and sets of a microphone and one or more
328.923,3 386.872,6 379.263,9 354.054,0 331.840,5 -0,71 222.842,9 256.754,1 15,22
8521 Video recording or reproducing apparatus 657.895,4 562.126,3 538.097,7 474.623,7 382.667,5 -11,78 259.783,0 174.835,7 -32,70
8528 Monitors and projectors, not incorporating television reception apparatus; reception apparatus for television, whether or
not incorporating radio-broadcast receivers or sound or video
1.347.309,3 1.151.682,8 1.052.682,2 1.034.120,1 976.322,2 -7,24 627.800,8 762.347,9 21,43
8529 Transmission apparatus; parts suitable for use solely or principally with the apparatus of heading no. 8525 to 8528 475.571,1 512.438,1 455.912,0 369.050,7 287.921,9 -12,47 203.652,0 190.186,5 -6,61
8532 Electrical capacitors; fixed, variable or adjustable (pre-set) 479.888,0 479.860,3 509.173,0 502.281,3 496.575,1 1,15 319.738,1 445.879,0 39,45
8536 Electrical apparatus for switching, protecting electrical circuits, for making connections to or in electrical circuits, for a
voltage not exceeding 1000 volts; connectors for optical fibres, optical fibre
552.880,1 591.667,7 569.608,5 506.330,5 519.934,9 -2,75 347.439,9 416.791,8 19,96
8542 Electronic integrated circuits 531.491,3 506.609,4 487.358,3 417.177,1 368.136,0 -8,87 255.212,4 295.165,3 15,65
8544 Insulated wire, cable and other electric conductors, connector fitted or not; optical fibre cables of individually sheathed
fibres, whether or not assembled with electric conductors or fitted with
1.073.175,2 1.158.497,1 1.156.249,3 1.068.976,5 1.128.778,7 0,21 717.816,8 1.046.380,1 45,77
8703 Motor cars and other motor vehicles; principally designed for the transport of persons (other than those of heading no.
8702), including station wagons and racing cars
2.264.346,5 2.084.865,1 2.641.589,8 2.430.597,5 2.565.830,6 4,12 1.594.147,4 2.603.607,2 63,32
8708 Motor vehicles; parts and accessories, of heading no. 8701 to 8705 1.476.959,0 1.448.899,2 1.619.938,9 1.834.442,1 1.981.045,5 8,58 1.290.142,6 1.698.322,8 31,64
8711 Motorcycles (including mopeds) and cycles; fitted with an auxiliary motor, with or without side-cars; side-cars 200.738,5 126.443,0 143.306,6 401.790,4 468.063,7 32,97 304.662,2 616.445,4 102,34
8714 Vehicles; parts and accessories of heading no. 8711 to 8713 463.265,8 437.976,6 448.739,5 426.586,9 500.851,9 1,31 314.691,1 492.747,8 56,58
9401 Seats (not those of heading no. 9402), whether or not convertible into beds and parts thereof 528.408,9 511.437,4 510.272,7 518.848,6 506.289,3 -0,71 342.891,1 402.231,4 17,31
9403 Furniture and parts thereof, n.e.c. in chapter 94 1.221.082,0 1.216.624,1 1.255.611,5 1.172.264,5 1.086.555,2 -2,67 722.292,6 935.126,6 29,47
9503 Tricycles, scooters, pedal cars and similar wheeled toys; dolls' carriages; dolls; other toys; reduced-size (scale) models
and similar recreational models, working or not; puzzles of all kinds
347.067,8 428.966,8 391.800,6 348.306,1 282.330,9 -6,02 189.019,2 285.459,2 51,02
*) Komoditi pada tahun 2016 berdasarkan kelompok HS 4 digit mempunyai kontribusi sebesar 80% dari nilai total ekspor non migas.
Commodities in group HS 4 digit have contribution 80% Total Export Value of Non Oil and Gas in 2016.
Sumber/Source : Badan Pusat Statistik (diolah, Pusat Data dan Informasi Perdagangan, Kementerian Perdagangan)/Central Board of Statistics (processed by Trade Information and Data Centre, Ministry of Trade)
22

Lanjutan/Continued
Volume : Ton
Perub. (%)
Change (%)
17-16
0303 Fish; frozen, excluding fish fillets and other fish meat of heading 0304 431.044,6 425.807,0 415.342,9 210.434,8 213.790,9 -19,00 134.687,4 217.183,4 61,25
0304 Fish fillets and other fish meat (whether or not minced); fresh, chilled or frozen 90.677,1 81.219,5 88.198,5 95.429,6 95.522,5 2,69 62.519,1 67.796,4 8,44
0306 Crustaceans; in shell or not, live, fresh, chilled, frozen, dried, salted or in brine; smoked, cooked or not
before or during smoking; in shell, steamed or boiled, whether or not chilled,
137.777,8 145.661,9 160.938,6 152.677,2 164.308,0 4,07 112.343,3 137.305,2 22,22
0307 Molluscs; whether in shell or not, live, fresh, chilled, frozen, dried, salted or in brine; smoked molluscs,
whether in shell or not, cooked or not before or during the smoking process; flours, meals
85.044,8 86.542,4 81.887,1 104.165,1 125.173,6 10,06 70.643,2 90.907,4 28,69
0801 Nuts, edible; coconuts, Brazil nuts and cashew nuts, fresh or dried, whether or not shelled or peeled 284.034,6 358.671,0 562.270,9 697.378,1 678.960,3 27,22 367.301,6 840.529,2 128,84
0802 Nuts (excluding coconuts, Brazils and cashew nuts); fresh or dried, whether or not shelled or peeled 217.006,1 226.291,5 253.765,6 282.918,3 222.086,1 2,73 162.283,8 200.432,3 23,51
0901 Coffee, whether or not roasted or decaffeinated; husks and skins; coffee substitutes containing coffee in
any proportion
448.590,6 534.025,1 384.827,7 502.020,7 414.651,2 -2,17 223.078,1 415.900,5 86,44
0904 Pepper of the genus piper; dried or crushed or ground fruits of the genus capsicum or of the genus
pimenta
63.834,1 48.959,1 35.655,9 60.551,5 55.146,6 -0,80 24.905,9 37.413,7 50,22
1511 Palm oil and its fractions; whether or not refined, but not chemically modified 18.845.020,2 20.577.975,9 22.892.386,9 26.467.563,6 22.759.304,5 6,49 13.821.772,1 22.613.010,2 63,60
1513 Coconut (copra), palm kernel or babassu oil and their fractions; whether or not refined but not chemically
modified
2.263.320,3 2.275.102,5 2.251.251,3 2.579.941,2 2.178.806,9 0,50 1.405.369,5 1.836.316,9 30,66
1516 Animal or vegetable fats and oils and their fractions; partly or wholly hydrogenated, inter-esterified, re-
esterified or elaidinised, whether or not refined, but not further prepared
248.683,3 1.072.959,1 135.471,9 167.705,3 305.780,0 -13,43 177.073,9 238.640,1 34,77
1517 Margarine; edible mixtures or preparations of animal or vegetable fats or oils or of fractions of different
fats or oils of this chapter, other than edible fats or oils of heading no. 1516
761.214,4 663.240,6 807.252,7 799.649,9 852.675,0 4,23 526.295,0 837.980,9 59,22
1604 Prepared or preserved fish; caviar and caviar substitutes prepared from fish eggs 95.094,2 95.231,9 106.329,6 90.134,3 85.837,8 -2,56 57.424,8 73.607,3 28,18
1605 Crustaceans, molluscs and other aquatic invertebrates, prepared or preserved 51.296,7 55.453,4 60.832,5 62.920,9 67.091,6 6,86 45.328,6 40.095,0 -11,55
1804 Cocoa; butter, fat and oil 94.345,5 86.806,8 99.482,7 114.547,1 109.503,9 5,92 68.872,9 110.851,1 60,95
1905 Bread, pastry, cakes, biscuits, other bakers' wares, whether or not 94.502,9 113.430,4 129.605,0 142.394,7 186.665,1 17,22 112.701,3 184.598,4 63,79
2101 Extracts, essences, concentrates of coffee, tea or mate; preparations with a basis of these products or
with a basis of coffee, tea or mate; roasted chicory and other roasted coffee
87.190,2 83.945,8 97.462,8 106.905,9 144.301,0 13,31 95.942,6 136.509,2 42,28
2106 Food preparations not elsewhere specified or included 84.708,4 95.109,7 126.494,5 137.876,5 148.038,8 16,04 97.588,5 134.165,0 37,48
2306 Oil-cake and other solid residues; whether or not ground or in the form of pellets, resulting from the
extraction of vegetable fats or oils other than those of heading no. 2304 or 2305 from the extraction of
cotton seed oils pellets, resulting from the e
3.876.134,2 3.836.864,6 3.949.152,5 4.540.007,7 4.025.572,9 2,47 2.482.997,9 3.734.738,4 50,41
2402 Cigars, cheroots, cigarillos and cigarettes; of tobacco or of tobacco substitutes 67.535,5 73.644,8 79.007,2 81.667,8 85.013,8 5,80 55.490,4 76.912,3 38,60
2603 Copper ores and concentrates 1.123.541,0 1.453.731,9 714.950,4 1.711.396,5 1.912.881,5 13,06 1.195.491,7 1.159.871,4 -2,98
2701 Coal; briquettes, ovoids and similar solid fuels manufactured from coal 347.575.751,8 381.519.673,5 356.302.906,0 328.387.443,4 310.662.259,3 -3,68 ########### ########### 27,88
2702 Lignite; whether or not agglomerated, excluding jet 36.802.743,8 42.941.031,4 51.935.570,9 38.582.958,0 58.246.961,4 8,45 31.376.303,0 57.937.802,0 84,65
2814 Ammonia; anhydrous or in aqueous solution 959.888,6 793.510,5 684.400,3 1.033.468,1 1.115.524,5 5,81 817.271,8 887.324,6 8,57
2905 Acyclic alcohols and their halogenated, sulphonated, nitrated or nitrosated derivatives 954.341,2 990.009,0 925.441,8 908.081,4 879.993,6 -2,46 596.328,2 790.536,4 32,57
2915 Acids; saturated acyclic monocarboxylic acids and their anhydrides, halides, peroxides and peroxyacids;
their halogenated, sulphonated, nitrated or nitrosated derivatives
171.496,1 172.736,2 297.619,2 359.800,3 386.519,9 26,61 243.629,1 346.003,2 42,02
2922 Oxygen-function amino-compounds 363.610,9 375.575,0 403.198,3 401.700,3 408.152,9 3,03 276.151,0 320.654,9 16,12
3004 Medicaments; (not goods of heading no. 3002, 3005 or 3006) consisting of mixed or unmixed products
for therapeutic or prophylactic use, put up in measured doses (incl. those in the form
16.436,9 38.434,8 19.897,7 18.527,0 16.536,9 -6,92 11.076,0 22.005,4 98,68
23
20162012 2013 2014 2015
TABEL 13.1 : PERKEMBANGAN VOLUME 100 JENIS BARANG EKSPOR UTAMA INDONESIA *)
DEVELOPMENT OF INDONESIAN EXPORT VOLUME AT 100 MAJOR COMMODITIES
JENIS BARANG
DESCRIPTION OF GOODS
Trend (%)
12-16
Jan-Ags/Jan-Aug
2016 2017
No. 08.05.148
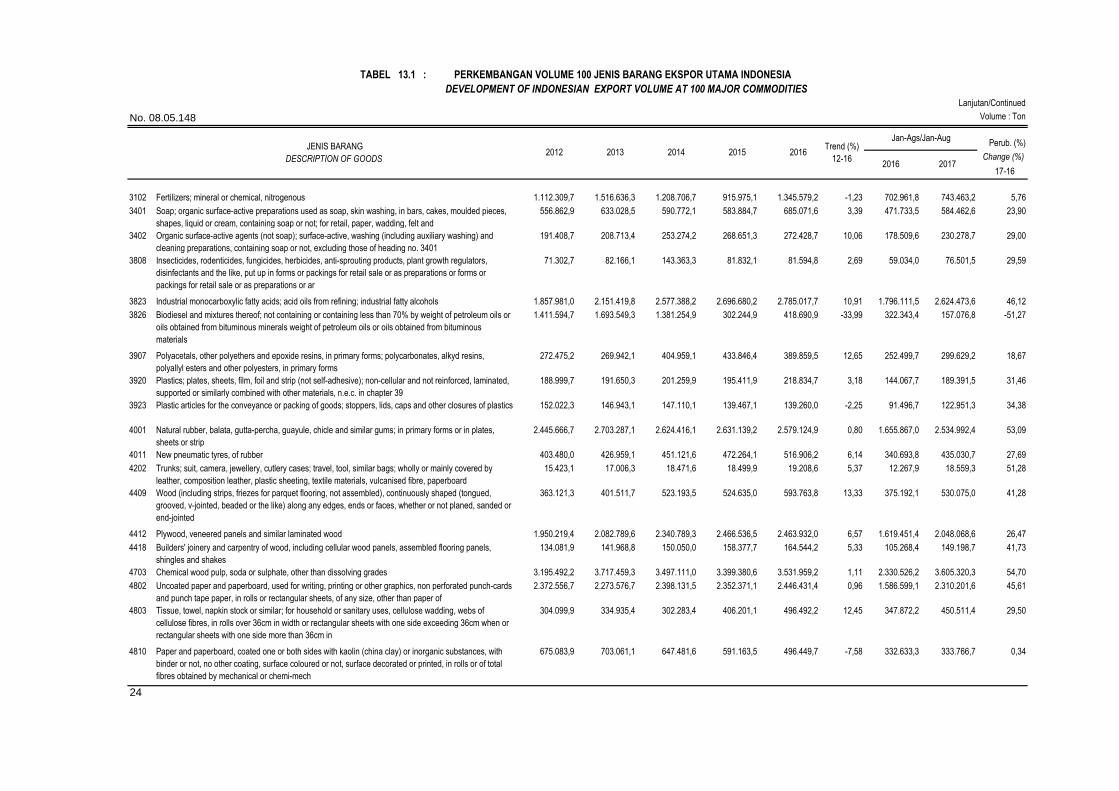
Lanjutan/Continued
Volume : Ton
Perub. (%)
Change (%)
17-16
20162012 2013 2014 2015
TABEL 13.1 : PERKEMBANGAN VOLUME 100 JENIS BARANG EKSPOR UTAMA INDONESIA *)
DEVELOPMENT OF INDONESIAN EXPORT VOLUME AT 100 MAJOR COMMODITIES
JENIS BARANG
DESCRIPTION OF GOODS
Trend (%)
12-16
Jan-Ags/Jan-Aug
2016 2017
No. 08.05.148
3102 Fertilizers; mineral or chemical, nitrogenous 1.112.309,7 1.516.636,3 1.208.706,7 915.975,1 1.345.579,2 -1,23 702.961,8 743.463,2 5,76
3401 Soap; organic surface-active preparations used as soap, skin washing, in bars, cakes, moulded pieces,
shapes, liquid or cream, containing soap or not; for retail, paper, wadding, felt and
556.862,9 633.028,5 590.772,1 583.884,7 685.071,6 3,39 471.733,5 584.462,6 23,90
3402 Organic surface-active agents (not soap); surface-active, washing (including auxiliary washing) and
cleaning preparations, containing soap or not, excluding those of heading no. 3401
191.408,7 208.713,4 253.274,2 268.651,3 272.428,7 10,06 178.509,6 230.278,7 29,00
3808 Insecticides, rodenticides, fungicides, herbicides, anti-sprouting products, plant growth regulators,
disinfectants and the like, put up in forms or packings for retail sale or as preparations or forms or
packings for retail sale or as preparations or ar
71.302,7 82.166,1 143.363,3 81.832,1 81.594,8 2,69 59.034,0 76.501,5 29,59
3823 Industrial monocarboxylic fatty acids; acid oils from refining; industrial fatty alcohols 1.857.981,0 2.151.419,8 2.577.388,2 2.696.680,2 2.785.017,7 10,91 1.796.111,5 2.624.473,6 46,12
3826 Biodiesel and mixtures thereof; not containing or containing less than 70% by weight of petroleum oils or
oils obtained from bituminous minerals weight of petroleum oils or oils obtained from bituminous
materials
1.411.594,7 1.693.549,3 1.381.254,9 302.244,9 418.690,9 -33,99 322.343,4 157.076,8 -51,27
3907 Polyacetals, other polyethers and epoxide resins, in primary forms; polycarbonates, alkyd resins,
polyallyl esters and other polyesters, in primary forms
272.475,2 269.942,1 404.959,1 433.846,4 389.859,5 12,65 252.499,7 299.629,2 18,67
3920 Plastics; plates, sheets, film, foil and strip (not self-adhesive); non-cellular and not reinforced, laminated,
supported or similarly combined with other materials, n.e.c. in chapter 39
188.999,7 191.650,3 201.259,9 195.411,9 218.834,7 3,18 144.067,7 189.391,5 31,46
3923 Plastic articles for the conveyance or packing of goods; stoppers, lids, caps and other closures of plastics 152.022,3 146.943,1 147.110,1 139.467,1 139.260,0 -2,25 91.496,7 122.951,3 34,38
4001 Natural rubber, balata, gutta-percha, guayule, chicle and similar gums; in primary forms or in plates,
sheets or strip
2.445.666,7 2.703.287,1 2.624.416,1 2.631.139,2 2.579.124,9 0,80 1.655.867,0 2.534.992,4 53,09
4011 New pneumatic tyres, of rubber 403.480,0 426.959,1 451.121,6 472.264,1 516.906,2 6,14 340.693,8 435.030,7 27,69
4202 Trunks; suit, camera, jewellery, cutlery cases; travel, tool, similar bags; wholly or mainly covered by
leather, composition leather, plastic sheeting, textile materials, vulcanised fibre, paperboard
15.423,1 17.006,3 18.471,6 18.499,9 19.208,6 5,37 12.267,9 18.559,3 51,28
4409 Wood (including strips, friezes for parquet flooring, not assembled), continuously shaped (tongued,
grooved, v-jointed, beaded or the like) along any edges, ends or faces, whether or not planed, sanded or
end-jointed
363.121,3 401.511,7 523.193,5 524.635,0 593.763,8 13,33 375.192,1 530.075,0 41,28
4412 Plywood, veneered panels and similar laminated wood 1.950.219,4 2.082.789,6 2.340.789,3 2.466.536,5 2.463.932,0 6,57 1.619.451,4 2.048.068,6 26,47
4418 Builders' joinery and carpentry of wood, including cellular wood panels, assembled flooring panels,
shingles and shakes
134.081,9 141.968,8 150.050,0 158.377,7 164.544,2 5,33 105.268,4 149.198,7 41,73
4703 Chemical wood pulp, soda or sulphate, other than dissolving grades 3.195.492,2 3.717.459,3 3.497.111,0 3.399.380,6 3.531.959,2 1,11 2.330.526,2 3.605.320,3 54,70
4802 Uncoated paper and paperboard, used for writing, printing or other graphics, non perforated punch-cards
and punch tape paper, in rolls or rectangular sheets, of any size, other than paper of
2.372.556,7 2.273.576,7 2.398.131,5 2.352.371,1 2.446.431,4 0,96 1.586.599,1 2.310.201,6 45,61
4803 Tissue, towel, napkin stock or similar; for household or sanitary uses, cellulose wadding, webs of
cellulose fibres, in rolls over 36cm in width or rectangular sheets with one side exceeding 36cm when or
rectangular sheets with one side more than 36cm in
304.099,9 334.935,4 302.283,4 406.201,1 496.492,2 12,45 347.872,2 450.511,4 29,50
4810 Paper and paperboard, coated one or both sides with kaolin (china clay) or inorganic substances, with
binder or not, no other coating, surface coloured or not, surface decorated or printed, in rolls or of total
fibres obtained by mechanical or chemi-mech
675.083,9 703.061,1 647.481,6 591.163,5 496.449,7 -7,58 332.633,3 333.766,7 0,34
24

Lanjutan/Continued
Volume : Ton
Perub. (%)
Change (%)
17-16
20162012 2013 2014 2015
TABEL 13.1 : PERKEMBANGAN VOLUME 100 JENIS BARANG EKSPOR UTAMA INDONESIA *)
DEVELOPMENT OF INDONESIAN EXPORT VOLUME AT 100 MAJOR COMMODITIES
JENIS BARANG
DESCRIPTION OF GOODS
Trend (%)
12-16
Jan-Ags/Jan-Aug
2016 2017
No. 08.05.148
5205 Cotton yarn (other than sewing thread), containing 85% or more by weight of cotton, not put up for retail
sale
77.100,4 147.472,0 141.418,0 155.141,2 163.159,9 16,77 109.523,8 141.200,7 28,92
5402 Synthetic filament yarn (other than sewing thread), not put up for retail sale, including synthetic
monofilament of less than 67 decitex
194.704,8 196.844,0 201.459,1 225.117,0 231.905,0 4,96 148.387,9 190.615,1 28,46
5407 Woven fabrics of synthetic filament yarn, including woven fabrics obtained from materials of heading no.
5404
110.487,1 100.420,2 162.038,4 112.488,1 91.017,3 -2,70 64.810,4 69.039,9 6,53
5509 Yarn (other than sewing thread) of synthetic staple fibres, not put up for retail sale 306.786,8 337.653,8 372.458,7 364.150,8 364.119,2 4,27 255.498,6 298.993,6 17,02
5510 Yarn (other than sewing thread) of artificial staple fibres, not put up for retail sale 116.986,1 156.693,0 169.756,4 207.269,5 192.007,9 13,55 134.123,8 154.331,8 15,07
6103 Suits, ensembles, jackets, blazers, trousers, bib and brace overalls, breeches, shorts (not swimwear);
men's or boys', knitted or crocheted
18.059,2 18.595,3 20.993,0 20.287,1 18.496,5 1,36 12.666,2 16.812,9 32,74
6104 Suits, ensembles, jackets, dresses, skirts, divided skirts, trousers, bib and brace overalls, breeches and
shorts (not swimwear), women's or girls', knitted or crocheted knitted or crocheted
47.689,7 46.193,7 51.822,9 48.042,5 49.176,7 1,01 33.449,8 39.508,2 18,11
6109 T-shirts, singlets and other vests; knitted or crocheted 44.137,8 31.175,8 21.732,6 32.341,5 36.720,7 -3,26 22.071,3 31.102,9 40,92
6110 Jerseys, pullovers, cardigans, waistcoats and similar articles; knitted or crocheted 58.549,8 79.609,2 61.096,0 51.324,7 49.139,5 -7,59 32.187,7 44.459,1 38,12
6201 Overcoats, car-coats, capes, cloaks, anoraks (including ski-jackets), wind-cheaters, wind-jackets and
similar articles, men's or boys', other than those of heading no. 6203 (not knitted
16.116,2 12.637,8 12.918,0 9.838,0 13.346,7 -6,08 8.567,9 12.374,6 44,43
6203 Suits, ensembles, jackets, blazers, trousers, bib and brace overalls, breeches and shorts (other than
swimwear); men's or boys' (not knitted or crocheted)
36.164,1 39.542,4 38.247,1 36.882,2 39.985,7 1,32 26.515,4 32.612,1 22,99
6204 Suits, ensembles, jackets, dresses, skirts, divided skirts, trousers, bib and brace overalls, breeches and
shorts (other than swimwear); women's or girls' (not knitted or crocheted)
44.731,9 49.117,8 45.705,0 54.461,3 51.694,8 4,00 36.037,2 41.772,6 15,92
6205 Shirts; men's or boys' (not knitted or crocheted) 23.096,9 24.162,1 22.593,9 21.312,4 20.232,8 -3,83 13.638,2 16.374,6 20,06
6206 Blouses, shirts and shirt-blouses; women's or girls' (not knitted or crocheted) 23.327,2 24.731,0 23.438,2 31.209,5 23.890,9 2,84 16.516,1 19.402,3 17,48
6212 Brassieres, girdles, corsets, braces, suspenders, garters and similar articles and parts thereof; whether
or not knitted or crocheted
8.995,6 9.244,0 9.047,9 10.014,1 9.432,4 1,76 6.309,3 8.054,2 27,66
6402 Footwear; with outer soles and uppers of rubber or plastics (excluding waterproof footwear) 35.821,7 34.275,2 38.492,3 31.132,8 28.398,4 -5,45 18.014,3 25.446,7 41,26
6403 Footwear; with outer soles of rubber, plastics, leather or composition leather and uppers of leather 115.111,9 116.533,4 110.113,2 119.371,5 118.128,6 0,76 76.007,8 105.822,7 39,23
6404 Footwear; with outer soles of rubber, plastics, leather or composition leather and uppers of textile
materials
40.888,4 54.672,5 58.621,6 75.909,1 84.847,0 19,58 60.102,9 64.447,9 7,23
6704 Wigs, false beards, eyebrows and eyelashes, switches and the like, of human or animal hair or of textile
materials; articles of human hair, n.e.c. or included
10.758,4 11.310,7 11.136,7 12.680,2 13.082,9 5,19 8.902,6 9.816,9 10,27
7108 Gold (including gold plated with platinum) unwrought or in semi-manufactured forms, or in powder form 37,3 48,6 37,2 37,1 34,4 -4,23 21,6 36,8 69,93
7112 Waste and scrap of precious metal or of metal clad with precious metal; other waste and scrap
containing precious metal compounds, of a kind uses principally for the recovery of precious
1.193,7 1.427,2 1.491,4 1.363,2 1.454,7 3,56 1.053,4 1.001,2 -4,96
7113 Jewellery articles and parts thereof, of precious metal or of metal clad with precious metal 95,0 111,1 205,9 194,3 245,1 27,83 180,4 167,0 -7,40
7201 Pig iron and spiegeleisen in pigs, blocks or other primary forms 2.232,1 62.785,4 286.019,5 282.942,3 568.860,7 252,08 438.281,7 143.306,7 -67,30
7202 Ferro-alloys 101.683,9 85.071,7 122.492,8 202.604,6 432.346,4 45,68 187.467,8 862.113,2 359,87
7308 Structures of iron or steel and parts thereof; plates, rods, angles, shapes, sections, tubes and the like,
prepared for use in structures
139.789,1 128.463,8 192.293,1 105.504,9 171.594,7 2,15 129.129,8 68.013,1 -47,33
7403 Copper; refined and copper alloys, unwrought 69.102,9 71.052,1 109.998,0 97.154,5 161.264,4 22,24 93.015,9 150.090,6 61,36
7408 Copper wire 111.050,2 111.965,0 105.507,8 108.592,7 97.143,4 -2,94 63.699,3 71.173,6 11,73
7501 Nickel mattes; nickel oxide sinters and other intermediate products of nickel metallurgy 91.024,3 96.602,3 99.363,4 103.794,8 98.530,6 2,33 62.714,2 78.257,9 24,79
8001 Tin; unwrought 101.237,0 88.441,5 70.484,8 69.804,1 61.874,9 -11,50 36.293,7 63.067,0 73,77
25

Lanjutan/Continued
Volume : Ton
Perub. (%)
Change (%)
17-16
20162012 2013 2014 2015
TABEL 13.1 : PERKEMBANGAN VOLUME 100 JENIS BARANG EKSPOR UTAMA INDONESIA *)
DEVELOPMENT OF INDONESIAN EXPORT VOLUME AT 100 MAJOR COMMODITIES
JENIS BARANG
DESCRIPTION OF GOODS
Trend (%)
12-16
Jan-Ags/Jan-Aug
2016 2017
No. 08.05.148
8407 Reciprocating or rotary internal combustion piston engines 10.469,5 13.423,0 15.082,7 16.316,9 30.261,6 26,09 18.274,1 31.915,0 74,65
8409 Parts suitable for use solely or principally with the engines of heading no. 8407 or 8408 36.776,1 46.928,2 38.221,5 42.996,5 43.000,7 2,28 28.833,6 45.903,0 59,20
8418 Refrigerators, freezers and other refrigerating or freezing equipment, electric or other; heat pumps other
than air conditioning machines of heading no. 8415
103.877,7 94.657,5 84.998,5 69.118,8 72.977,3 -9,70 49.077,0 65.055,1 32,56
8419 Machinery, plant (not domestic), or laboratory equipment; electrically heated or not, (excluding items in
85.14) for the treatment of materials by a process involving change of
4.592,2 8.033,6 24.553,5 19.691,4 36.048,6 65,16 29.828,0 4.580,4 -84,64
8443 Printing machinery; used for printing by means of plates, cylinders and other printing components of
heading 84.42; other printers, copying machines and facsimile machines, whether or not textile, leather,
86.381,8 69.349,3 79.203,2 75.895,8 72.294,9 -2,62 44.075,8 66.828,8 51,62
8471 Automatic data processing machines and units thereof, magnetic or optical readers, machines for
transcribing data onto data media in coded form and machines for processing such data, not
12.660,2 9.271,6 11.271,0 7.085,4 6.636,7 -14,45 4.161,6 5.314,1 27,69
8504 Electric transformers, static converters (e.g. rectifiers) and inductors 27.654,4 21.835,0 20.298,5 20.819,8 19.030,7 -7,64 11.523,4 33.431,3 190,12
8506 Cells and batteries; primary 62.677,1 62.038,7 64.610,6 67.032,4 59.844,0 -0,15 39.548,8 49.955,4 26,31
8507 Electric accumulators, including separators therefor; whether or not rectangular (including square) 100.084,3 84.267,3 76.086,3 86.514,0 94.749,7 -0,83 59.175,6 76.619,5 29,48
8518 Microphones and their stands; loudspeakers, mounted or not in their enclosures; headphones and
earphones, combined or not with a microphone, and sets of a microphone and one or more
27.552,4 36.560,2 35.409,0 34.412,7 34.519,3 3,98 23.238,1 26.606,4 14,49
8521 Video recording or reproducing apparatus 38.502,2 28.011,6 21.513,6 18.380,6 13.736,9 -21,98 9.835,3 4.947,3 -49,70
8528 Monitors and projectors, not incorporating television reception apparatus; reception apparatus for
television, whether or not incorporating radio-broadcast receivers or sound or video
41.248,2 29.110,5 27.326,1 26.821,2 25.004,6 -10,26 16.016,9 19.431,2 21,32
8529 Transmission apparatus; parts suitable for use solely or principally with the apparatus of heading no.
8525 to 8528
11.848,9 13.094,7 9.417,3 7.208,0 5.430,3 -19,41 3.763,3 4.089,8 8,68
8532 Electrical capacitors; fixed, variable or adjustable (pre-set) 7.719,4 8.902,5 9.650,5 9.129,1 10.046,2 5,68 6.715,6 9.105,1 35,58
8536 Electrical apparatus for switching, protecting electrical circuits, for making connections to or in electrical
circuits, for a voltage not exceeding 1000 volts; connectors for optical fibres, optical fibre
13.395,4 13.752,5 13.021,1 12.792,6 15.567,3 2,31 10.697,1 12.834,1 19,98
8542 Electronic integrated circuits 1.793,6 1.757,0 1.458,8 1.223,1 1.117,9 -12,26 753,8 968,9 28,52
8544 Insulated wire, cable and other electric conductors, connector fitted or not; optical fibre cables of
individually sheathed fibres, whether or not assembled with electric conductors or fitted with
86.114,0 92.520,9 88.351,4 94.629,5 94.928,7 2,20 63.215,8 75.510,9 19,45
8703 Motor cars and other motor vehicles; principally designed for the transport of persons (other than those
of heading no. 8702), including station wagons and racing cars
226.361,1 209.046,1 273.825,6 270.594,9 283.160,3 7,31 176.597,3 290.625,1 64,57
8708 Motor vehicles; parts and accessories, of heading no. 8701 to 8705 178.468,4 186.263,0 199.995,6 235.292,4 258.462,4 10,23 168.435,6 222.430,6 32,06
8711 Motorcycles (including mopeds) and cycles; fitted with an auxiliary motor, with or without side-cars; side-
cars
19.935,9 13.196,7 15.030,8 36.653,9 42.504,6 28,86 27.792,5 55.778,7 100,70
8714 Vehicles; parts and accessories of heading no. 8711 to 8713 48.281,7 48.609,8 51.403,4 51.504,4 56.918,8 3,95 36.502,1 58.138,9 59,28
9401 Seats (not those of heading no. 9402), whether or not convertible into beds and parts thereof 134.861,0 120.314,6 113.959,8 110.133,5 108.028,2 -5,18 72.999,2 81.179,1 11,21
9403 Furniture and parts thereof, n.e.c. in chapter 94 466.104,8 437.318,8 445.423,7 395.785,9 360.964,4 -5,93 238.402,7 297.761,8 24,90
9503 Tricycles, scooters, pedal cars and similar wheeled toys; dolls' carriages; dolls; other toys; reduced-size
(scale) models and similar recreational models, working or not; puzzles of all kinds
30.713,5 34.320,9 27.894,8 28.015,6 22.602,1 -7,84 15.210,0 22.615,2 48,69
*) Komoditi pada tahun 2016 berdasarkan kelompok HS 4 digit mempunyai kontribusi sebesar 80% dari nilai total ekspor non migas.
Commodities in group HS 4 digit have contribution 80% Total Export Value of Non Oil and Gas in 2016.
Sumber/Source : Badan Pusat Statistik (diolah, Pusat Data dan Informasi Perdagangan, Kementerian Perdagangan)/Central Board of Statistics (processed by Trade Information and Data Centre, Ministry of Trade)
26
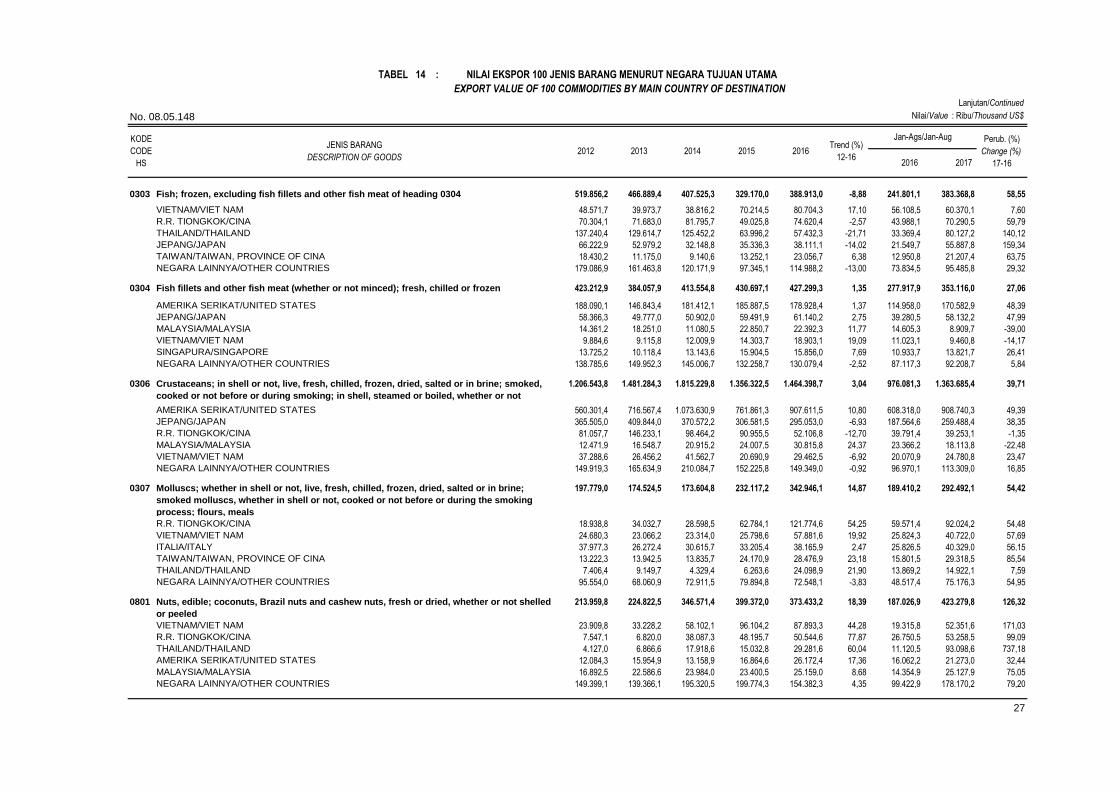
Lanjutan/Continued
Nilai/Value : Ribu/Thousand US$
0303 Fish; frozen, excluding fish fillets and other fish meat of heading 0304 519.856,2 466.889,4 407.525,3 329.170,0 388.913,0 -8,88 241.801,1 383.368,8 58,55
VIETNAM/VIET NAM 48.571,7 39.973,7 38.816,2 70.214,5 80.704,3 17,10 56.108,5 60.370,1 7,60
R.R. TIONGKOK/CINA 70.304,1 71.683,0 81.795,7 49.025,8 74.620,4 -2,57 43.988,1 70.290,5 59,79
THAILAND/THAILAND 137.240,4 129.614,7 125.452,2 63.996,2 57.432,3 -21,71 33.369,4 80.127,2 140,12
JEPANG/JAPAN 66.222,9 52.979,2 32.148,8 35.336,3 38.111,1 -14,02 21.549,7 55.887,8 159,34
TAIWAN/TAIWAN, PROVINCE OF CINA 18.430,2 11.175,0 9.140,6 13.252,1 23.056,7 6,38 12.950,8 21.207,4 63,75
NEGARA LAINNYA/OTHER COUNTRIES 179.086,9 161.463,8 120.171,9 97.345,1 114.988,2 -13,00 73.834,5 95.485,8 29,32
0304 Fish fillets and other fish meat (whether or not minced); fresh, chilled or frozen 423.212,9 384.057,9 413.554,8 430.697,1 427.299,3 1,35 277.917,9 353.116,0 27,06
AMERIKA SERIKAT/UNITED STATES 188.090,1 146.843,4 181.412,1 185.887,5 178.928,4 1,37 114.958,0 170.582,9 48,39
JEPANG/JAPAN 58.366,3 49.777,0 50.902,0 59.491,9 61.140,2 2,75 39.280,5 58.132,2 47,99
MALAYSIA/MALAYSIA 14.361,2 18.251,0 11.080,5 22.850,7 22.392,3 11,77 14.605,3 8.909,7 -39,00
VIETNAM/VIET NAM 9.884,6 9.115,8 12.009,9 14.303,7 18.903,1 19,09 11.023,1 9.460,8 -14,17
SINGAPURA/SINGAPORE 13.725,2 10.118,4 13.143,6 15.904,5 15.856,0 7,69 10.933,7 13.821,7 26,41
NEGARA LAINNYA/OTHER COUNTRIES 138.785,6 149.952,3 145.006,7 132.258,7 130.079,4 -2,52 87.117,3 92.208,7 5,84
0306 Crustaceans; in shell or not, live, fresh, chilled, frozen, dried, salted or in brine; smoked,
cooked or not before or during smoking; in shell, steamed or boiled, whether or not
chilled,
1.206.543,8 1.481.284,3 1.815.229,8 1.356.322,5 1.464.398,7 3,04 976.081,3 1.363.685,4 39,71
AMERIKA SERIKAT/UNITED STATES 560.301,4 716.567,4 1.073.630,9 761.861,3 907.611,5 10,80 608.318,0 908.740,3 49,39
JEPANG/JAPAN 365.505,0 409.844,0 370.572,2 306.581,5 295.053,0 -6,93 187.564,6 259.488,4 38,35
R.R. TIONGKOK/CINA 81.057,7 146.233,1 98.464,2 90.955,5 52.106,8 -12,70 39.791,4 39.253,1 -1,35
MALAYSIA/MALAYSIA 12.471,9 16.548,7 20.915,2 24.007,5 30.815,8 24,37 23.366,2 18.113,8 -22,48
VIETNAM/VIET NAM 37.288,6 26.456,2 41.562,7 20.690,9 29.462,5 -6,92 20.070,9 24.780,8 23,47
NEGARA LAINNYA/OTHER COUNTRIES 149.919,3 165.634,9 210.084,7 152.225,8 149.349,0 -0,92 96.970,1 113.309,0 16,85
0307 Molluscs; whether in shell or not, live, fresh, chilled, frozen, dried, salted or in brine;
smoked molluscs, whether in shell or not, cooked or not before or during the smoking
process; flours, meals
197.779,0 174.524,5 173.604,8 232.117,2 342.946,1 14,87 189.410,2 292.492,1 54,42
R.R. TIONGKOK/CINA 18.938,8 34.032,7 28.598,5 62.784,1 121.774,6 54,25 59.571,4 92.024,2 54,48
VIETNAM/VIET NAM 24.680,3 23.066,2 23.314,0 25.798,6 57.881,6 19,92 25.824,3 40.722,0 57,69
ITALIA/ITALY 37.977,3 26.272,4 30.615,7 33.205,4 38.165,9 2,47 25.826,5 40.329,0 56,15
TAIWAN/TAIWAN, PROVINCE OF CINA 13.222,3 13.942,5 13.835,7 24.170,9 28.476,9 23,18 15.801,5 29.318,5 85,54
THAILAND/THAILAND 7.406,4 9.149,7 4.329,4 6.263,6 24.098,9 21,90 13.869,2 14.922,1 7,59
NEGARA LAINNYA/OTHER COUNTRIES 95.554,0 68.060,9 72.911,5 79.894,8 72.548,1 -3,83 48.517,4 75.176,3 54,95
0801 Nuts, edible; coconuts, Brazil nuts and cashew nuts, fresh or dried, whether or not shelled
or peeled
213.959,8 224.822,5 346.571,4 399.372,0 373.433,2 18,39 187.026,9 423.279,8 126,32
VIETNAM/VIET NAM 23.909,8 33.228,2 58.102,1 96.104,2 87.893,3 44,28 19.315,8 52.351,6 171,03
R.R. TIONGKOK/CINA 7.547,1 6.820,0 38.087,3 48.195,7 50.544,6 77,87 26.750,5 53.258,5 99,09
THAILAND/THAILAND 4.127,0 6.866,6 17.918,6 15.032,8 29.281,6 60,04 11.120,5 93.098,6 737,18
AMERIKA SERIKAT/UNITED STATES 12.084,3 15.954,9 13.158,9 16.864,6 26.172,4 17,36 16.062,2 21.273,0 32,44
MALAYSIA/MALAYSIA 16.892,5 22.586,6 23.984,0 23.400,5 25.159,0 8,68 14.354,9 25.127,9 75,05
NEGARA LAINNYA/OTHER COUNTRIES 149.399,1 139.366,1 195.320,5 199.774,3 154.382,3 4,35 99.422,9 178.170,2 79,20
27
2012 2013
TABEL 14 : NILAI EKSPOR 100 JENIS BARANG MENURUT NEGARA TUJUAN UTAMA
EXPORT VALUE OF 100 COMMODITIES BY MAIN COUNTRY OF DESTINATION
KODE
CODE
HS
JENIS BARANG
DESCRIPTION OF GOODS
Trend (%)
12-16
Jan-Ags/Jan-Aug Perub. (%)
Change (%)
17-16
No. 08.05.148
2015 2016
2016 2017
2014

Lanjutan/Continued
Nilai/Value : Ribu/Thousand US$
2012 2013
TABEL 14 : NILAI EKSPOR 100 JENIS BARANG MENURUT NEGARA TUJUAN UTAMA
EXPORT VALUE OF 100 COMMODITIES BY MAIN COUNTRY OF DESTINATION
KODE
CODE
HS
JENIS BARANG
DESCRIPTION OF GOODS
Trend (%)
12-16
Jan-Ags/Jan-Aug Perub. (%)
Change (%)
17-16
No. 08.05.148
2015 2016
2016 2017
2014
0802 Nuts (excluding coconuts, Brazils and cashew nuts); fresh or dried, whether or not shelled
or peeled
157.682,0 170.730,9 268.338,9 326.247,2 281.627,2 19,81 203.429,0 291.783,2 43,43
PAKISTAN/PAKISTAN 67.223,4 68.579,7 91.635,6 97.969,1 133.759,9 18,92 95.979,7 109.803,7 14,40
THAILAND/THAILAND 27,8 427,8 5.401,6 76.033,9 78.901,8 723,50 56.696,1 78.282,1 38,07
INDIA/INDIA 17.308,7 28.874,2 32.043,6 37.637,1 21.623,6 7,36 16.546,4 22.125,3 33,72
SINGAPURA/SINGAPORE 24.056,2 15.771,7 21.806,3 23.100,8 15.865,6 -4,41 11.905,9 14.418,9 21,11
MYANMAR/MYANMAR (FORM. BURMA) - - 76,5 2.711,6 6.320,6 - 3.826,1 24.651,0 544,28
NEGARA LAINNYA/OTHER COUNTRIES 49.066,0 57.077,5 117.375,2 88.794,7 25.155,7 -8,55 18.474,7 42.502,1 130,06
0901 Coffee, whether or not roasted or decaffeinated; husks and skins; coffee substitutes
containing coffee in any proportion
1.249.518,8 1.174.044,5 1.039.609,5 1.197.735,1 1.008.549,1 -4,00 550.253,6 1.046.935,2 90,26
AMERIKA SERIKAT/UNITED STATES 331.223,0 207.091,5 295.988,2 281.159,3 269.941,3 -1,03 164.895,5 221.668,5 34,43
JERMAN/GERMANY 116.922,5 122.178,1 84.732,9 88.423,5 90.188,9 -8,08 32.234,8 95.540,8 196,39
JEPANG/JAPAN 145.745,1 102.924,4 101.366,0 104.961,6 86.510,8 -9,73 48.027,5 70.377,6 46,54
MALAYSIA/MALAYSIA 70.494,5 79.717,2 60.844,9 70.808,5 71.432,2 -0,92 41.976,2 75.669,0 80,27
ITALIA/ITALY 64.638,5 77.130,5 60.638,4 84.005,4 66.403,8 1,40 44.739,5 71.923,0 60,76
NEGARA LAINNYA/OTHER COUNTRIES 520.495,1 585.002,9 436.039,1 568.376,7 424.072,1 -4,29 218.380,1 511.756,3 134,34
0904 Pepper of the genus piper; dried or crushed or ground fruits of the genus capsicum or of
the genus pimenta
435.257,1 354.712,1 330.032,0 559.241,8 441.352,9 4,95 222.594,0 212.291,1 -4,63
VIETNAM/VIET NAM 105.307,5 80.241,2 48.164,8 179.912,3 122.435,1 11,73 35.248,0 55.473,3 57,38
AMERIKA SERIKAT/UNITED STATES 156.769,1 105.798,8 56.299,3 104.756,1 78.609,3 -12,98 41.705,3 45.255,9 8,51
INDIA/INDIA 41.031,3 23.791,9 34.083,4 34.537,8 52.377,7 8,99 26.596,3 19.894,2 -25,20
SINGAPURA/SINGAPORE 23.823,1 45.858,7 83.300,7 78.223,0 34.592,4 13,65 20.513,5 15.180,8 -26,00
BELANDA/NETHERLANDS 16.741,3 22.861,7 16.037,1 23.814,4 27.305,2 10,73 15.711,4 11.664,9 -25,76
NEGARA LAINNYA/OTHER COUNTRIES 91.584,7 76.159,7 92.146,7 137.998,3 126.033,1 13,12 82.819,5 64.821,9 -21,73
1511 Palm oil and its fractions; whether or not refined, but not chemically modified 17.602.168,0 15.838.850,2 17.464.904,7 15.385.275,3 14.365.422,2 -4,26 8.307.471,2 15.338.784,5 84,64
INDIA/INDIA 4.838.414,1 4.281.590,5 3.635.344,7 3.217.042,6 3.438.611,0 -9,23 1.955.215,8 4.133.853,2 111,43
R.R. TIONGKOK/CINA 2.599.992,9 1.794.127,1 1.789.785,8 2.046.930,8 1.641.622,0 -7,58 818.848,9 1.587.541,7 93,87
PAKISTAN/PAKISTAN 714.273,8 814.449,7 1.353.944,5 1.313.460,4 1.289.448,0 18,05 763.898,4 1.187.597,0 55,47
SPANYOL/SPAIN 245.899,7 461.709,9 672.650,3 570.272,1 689.077,5 25,51 438.139,3 782.660,7 78,63
MESIR/EGYPT 462.601,3 563.799,3 751.879,6 672.822,8 627.559,8 8,19 357.081,8 639.706,9 79,15
NEGARA LAINNYA/OTHER COUNTRIES 8.740.986,3 7.923.173,8 9.261.299,8 7.564.746,6 6.679.103,8 -5,68 3.974.287,1 7.007.424,9 76,32
1513 Coconut (copra), palm kernel or babassu oil and their fractions; whether or not refined but
not chemically modified
2.458.229,9 1.829.519,4 2.484.350,2 2.378.262,2 2.726.685,9 4,81 1.623.139,0 2.482.923,4 52,97
R.R. TIONGKOK/CINA 523.324,7 324.322,0 490.499,8 596.621,0 711.869,1 13,03 397.384,8 569.073,3 43,20
AMERIKA SERIKAT/UNITED STATES 96.930,1 150.375,0 319.027,0 285.722,9 458.757,7 45,51 286.827,5 484.812,7 69,03
BELANDA/NETHERLANDS 529.187,1 370.364,1 445.792,3 389.839,0 421.624,0 -3,95 261.661,7 388.792,6 48,59
MALAYSIA/MALAYSIA 544.838,2 204.131,9 337.382,1 374.498,3 287.522,7 -6,50 141.181,2 240.844,6 70,59
BRASILIA/BRAZIL 146.067,0 124.664,0 171.069,9 143.561,9 205.071,1 8,54 124.230,2 174.381,1 40,37
NEGARA LAINNYA/OTHER COUNTRIES 617.883,0 655.662,2 720.579,1 588.019,2 641.841,2 -0,33 411.853,7 625.019,1 51,76
28

Lanjutan/Continued
Nilai/Value : Ribu/Thousand US$
2012 2013
TABEL 14 : NILAI EKSPOR 100 JENIS BARANG MENURUT NEGARA TUJUAN UTAMA
EXPORT VALUE OF 100 COMMODITIES BY MAIN COUNTRY OF DESTINATION
KODE
CODE
HS
JENIS BARANG
DESCRIPTION OF GOODS
Trend (%)
12-16
Jan-Ags/Jan-Aug Perub. (%)
Change (%)
17-16
No. 08.05.148
2015 2016
2016 2017
2014
1516 Animal or vegetable fats and oils and their fractions; partly or wholly hydrogenated, inter-
esterified, re-esterified or elaidinised, whether or not refined, but not further prepared
258.406,6 797.117,6 176.620,3 179.293,9 312.462,5 -10,52 164.629,9 269.350,8 63,61
R.R. TIONGKOK/CINA 73.939,8 113.294,0 101.855,2 76.229,6 108.305,3 3,74 49.065,8 68.460,2 39,53
ITALIA/ITALY - 2.823,4 269,5 167,2 49.363,3 - 31.702,6 35.015,8 10,45
THAILAND/THAILAND 3.656,4 2.810,5 21.413,0 29.963,1 37.213,5 101,52 20.783,7 44.981,7 116,43
AMERIKA SERIKAT/UNITED STATES 658,8 4.549,3 2.395,4 10.747,9 18.607,6 112,58 10.344,4 23.323,2 125,47
VIETNAM/VIET NAM 1.476,6 1.561,8 1.761,0 2.706,9 13.206,5 63,75 5.526,9 7.643,2 38,29
NEGARA LAINNYA/OTHER COUNTRIES 178.675,0 672.078,7 48.926,2 59.479,2 85.766,3 -32,24 47.206,5 89.926,7 90,50
1517 Margarine; edible mixtures or preparations of animal or vegetable fats or oils or of
fractions of different fats or oils of this chapter, other than edible fats or oils of heading no.
1516
806.388,3 600.050,9 778.219,1 617.751,6 684.627,4 -2,94 396.329,9 743.309,1 87,55
R.R. TIONGKOK/CINA 328.473,0 185.186,0 256.949,5 196.530,6 235.544,9 -5,88 116.709,4 259.054,2 121,97
MESIR/EGYPT 13.928,4 12.969,3 20.257,0 18.354,5 42.525,2 29,43 29.254,2 28.646,6 -2,08
FEDERASI RUSIA/RUSSIA FEDERATION 26.973,9 21.753,5 36.060,5 38.935,1 35.768,0 12,15 20.787,9 43.581,7 109,65
ALJAZAIR/ALGERIA 38.480,5 28.690,0 34.801,8 27.989,5 31.249,0 -4,31 21.821,4 29.162,4 33,64
NIGERIA/NIGERIA 38.413,1 40.635,7 54.141,4 36.077,8 25.403,1 -9,03 13.778,5 36.445,3 164,51
NEGARA LAINNYA/OTHER COUNTRIES 360.119,4 310.816,4 376.008,8 299.864,1 314.137,3 -3,04 193.978,5 346.419,0 78,59
1604 Prepared or preserved fish; caviar and caviar substitutes prepared from fish eggs 410.205,3 424.187,8 397.809,6 338.893,9 327.858,0 -6,51 208.784,9 328.469,3 57,32
SAUDI ARABIA/SAUDI ARABIA 53.491,9 59.414,3 55.253,5 61.190,9 57.198,8 1,65 37.801,7 52.001,0 37,56
JEPANG/JAPAN 62.179,4 46.380,1 55.523,6 40.928,7 44.683,5 -7,56 31.310,2 52.542,3 67,81
AMERIKA SERIKAT/UNITED STATES 49.868,2 40.684,8 42.211,9 44.099,9 43.653,4 -1,84 27.241,6 43.711,4 60,46
ITALIA/ITALY 2.049,7 16.882,8 25.051,9 29.186,0 24.530,3 73,53 11.765,5 37.344,8 217,41
THAILAND/THAILAND 33.372,4 33.704,5 13.786,8 13.594,7 21.579,1 -16,31 14.427,9 21.730,0 50,61
NEGARA LAINNYA/OTHER COUNTRIES 209.243,7 227.121,2 205.981,9 149.893,7 136.212,8 -11,96 86.238,1 121.139,9 40,47
1605 Crustaceans, molluscs and other aquatic invertebrates, prepared or preserved 430.327,3 564.815,6 737.471,7 605.414,4 633.856,8 8,81 413.271,9 439.063,7 6,24
AMERIKA SERIKAT/UNITED STATES 255.640,2 362.315,8 491.067,1 412.963,4 424.006,1 12,11 279.901,6 299.153,4 6,88
JEPANG/JAPAN 84.101,2 85.469,4 88.079,6 81.481,3 77.045,4 -2,21 46.153,6 59.329,5 28,55
INGGRIS/UNITED KINGDOM 15.955,2 18.272,2 27.151,2 26.674,9 28.426,5 16,57 15.617,3 16.807,3 7,62
BELANDA/NETHERLANDS 24.443,7 44.619,1 57.770,7 18.695,3 24.358,1 -8,40 15.599,3 18.323,3 17,46
JERMAN/GERMANY 5.897,7 7.332,2 17.112,8 12.155,6 13.795,6 24,67 9.193,7 6.769,4 -26,37
NEGARA LAINNYA/OTHER COUNTRIES 44.289,4 46.806,7 56.290,2 53.443,9 66.225,1 9,83 - 38.680,8 -
1804 Cocoa; butter, fat and oil 236.138,4 356.763,6 660.783,6 726.296,0 697.860,0 33,35 426.782,8 562.931,4 31,90
AMERIKA SERIKAT/UNITED STATES 64.491,7 113.686,8 236.335,7 235.382,0 217.459,8 37,15 143.243,2 228.685,7 59,65
JERMAN/GERMANY 28.807,3 29.323,5 61.430,0 60.598,3 91.177,1 35,39 58.727,8 22.006,8 -62,53
KANADA/CANADA 6.204,1 21.894,1 19.349,3 18.876,4 44.300,7 45,98 18.120,4 39.549,8 118,26
BELANDA/NETHERLANDS 4.895,8 13.123,1 34.210,3 35.213,3 38.083,3 66,36 25.497,7 54.741,1 114,69
JEPANG/JAPAN 10.094,3 23.796,8 34.093,2 32.178,3 37.781,0 34,20 25.297,5 20.864,4 -17,52
NEGARA LAINNYA/OTHER COUNTRIES 121.645,2 154.939,4 275.365,2 344.047,6 269.058,2 26,94 155.896,3 197.083,4 26,42
29
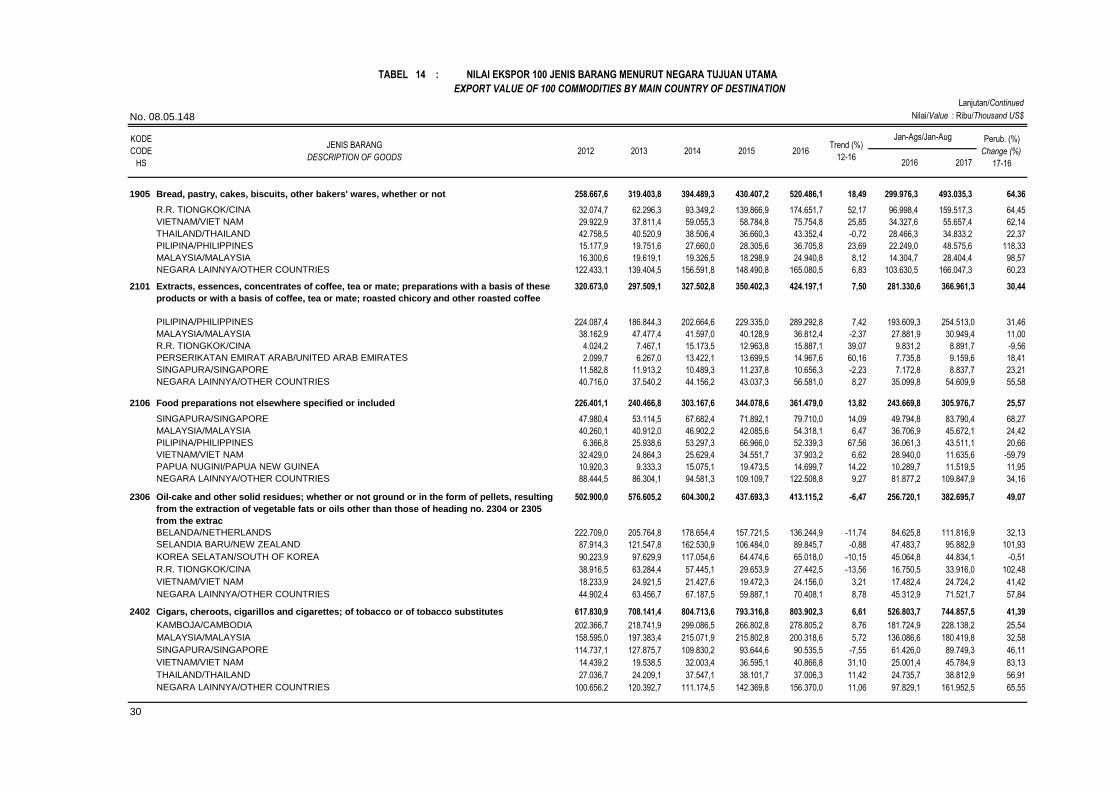
Lanjutan/Continued
Nilai/Value : Ribu/Thousand US$
2012 2013
TABEL 14 : NILAI EKSPOR 100 JENIS BARANG MENURUT NEGARA TUJUAN UTAMA
EXPORT VALUE OF 100 COMMODITIES BY MAIN COUNTRY OF DESTINATION
KODE
CODE
HS
JENIS BARANG
DESCRIPTION OF GOODS
Trend (%)
12-16
Jan-Ags/Jan-Aug Perub. (%)
Change (%)
17-16
No. 08.05.148
2015 2016
2016 2017
2014
1905 Bread, pastry, cakes, biscuits, other bakers' wares, whether or not 258.667,6 319.403,8 394.489,3 430.407,2 520.486,1 18,49 299.976,3 493.035,3 64,36
R.R. TIONGKOK/CINA 32.074,7 62.296,3 93.349,2 139.866,9 174.651,7 52,17 96.998,4 159.517,3 64,45
VIETNAM/VIET NAM 29.922,9 37.811,4 59.055,3 58.784,8 75.754,8 25,85 34.327,6 55.657,4 62,14
THAILAND/THAILAND 42.758,5 40.520,9 38.506,4 36.660,3 43.352,4 -0,72 28.466,3 34.833,2 22,37
PILIPINA/PHILIPPINES 15.177,9 19.751,6 27.660,0 28.305,6 36.705,8 23,69 22.249,0 48.575,6 118,33
MALAYSIA/MALAYSIA 16.300,6 19.619,1 19.326,5 18.298,9 24.940,8 8,12 14.304,7 28.404,4 98,57
NEGARA LAINNYA/OTHER COUNTRIES 122.433,1 139.404,5 156.591,8 148.490,8 165.080,5 6,83 103.630,5 166.047,3 60,23
2101 Extracts, essences, concentrates of coffee, tea or mate; preparations with a basis of these
products or with a basis of coffee, tea or mate; roasted chicory and other roasted coffee
320.673,0 297.509,1 327.502,8 350.402,3 424.197,1 7,50 281.330,6 366.961,3 30,44
PILIPINA/PHILIPPINES 224.087,4 186.844,3 202.664,6 229.335,0 289.292,8 7,42 193.609,3 254.513,0 31,46
MALAYSIA/MALAYSIA 38.162,9 47.477,4 41.597,0 40.128,9 36.812,4 -2,37 27.881,9 30.949,4 11,00
R.R. TIONGKOK/CINA 4.024,2 7.467,1 15.173,5 12.963,8 15.887,1 39,07 9.831,2 8.891,7 -9,56
PERSERIKATAN EMIRAT ARAB/UNITED ARAB EMIRATES 2.099,7 6.267,0 13.422,1 13.699,5 14.967,6 60,16 7.735,8 9.159,6 18,41
SINGAPURA/SINGAPORE 11.582,8 11.913,2 10.489,3 11.237,8 10.656,3 -2,23 7.172,8 8.837,7 23,21
NEGARA LAINNYA/OTHER COUNTRIES 40.716,0 37.540,2 44.156,2 43.037,3 56.581,0 8,27 35.099,8 54.609,9 55,58
2106 Food preparations not elsewhere specified or included 226.401,1 240.466,8 303.167,6 344.078,6 361.479,0 13,82 243.669,8 305.976,7 25,57
SINGAPURA/SINGAPORE 47.980,4 53.114,5 67.682,4 71.892,1 79.710,0 14,09 49.794,8 83.790,4 68,27
MALAYSIA/MALAYSIA 40.260,1 40.912,0 46.902,2 42.085,6 54.318,1 6,47 36.706,9 45.672,1 24,42
PILIPINA/PHILIPPINES 6.366,8 25.938,6 53.297,3 66.966,0 52.339,3 67,56 36.061,3 43.511,1 20,66
VIETNAM/VIET NAM 32.429,0 24.864,3 25.629,4 34.551,7 37.903,2 6,62 28.940,0 11.635,6 -59,79
PAPUA NUGINI/PAPUA NEW GUINEA 10.920,3 9.333,3 15.075,1 19.473,5 14.699,7 14,22 10.289,7 11.519,5 11,95
NEGARA LAINNYA/OTHER COUNTRIES 88.444,5 86.304,1 94.581,3 109.109,7 122.508,8 9,27 81.877,2 109.847,9 34,16
2306 Oil-cake and other solid residues; whether or not ground or in the form of pellets, resulting
from the extraction of vegetable fats or oils other than those of heading no. 2304 or 2305
from the extrac
502.900,0 576.605,2 604.300,2 437.693,3 413.115,2 -6,47 256.720,1 382.695,7 49,07
BELANDA/NETHERLANDS 222.709,0 205.764,8 178.654,4 157.721,5 136.244,9 -11,74 84.625,8 111.816,9 32,13
SELANDIA BARU/NEW ZEALAND 87.914,3 121.547,8 162.530,9 106.484,0 89.845,7 -0,88 47.483,7 95.882,9 101,93
KOREA SELATAN/SOUTH OF KOREA 90.223,9 97.629,9 117.054,6 64.474,6 65.018,0 -10,15 45.064,8 44.834,1 -0,51
R.R. TIONGKOK/CINA 38.916,5 63.284,4 57.445,1 29.653,9 27.442,5 -13,56 16.750,5 33.916,0 102,48
VIETNAM/VIET NAM 18.233,9 24.921,5 21.427,6 19.472,3 24.156,0 3,21 17.482,4 24.724,2 41,42
NEGARA LAINNYA/OTHER COUNTRIES 44.902,4 63.456,7 67.187,5 59.887,1 70.408,1 8,78 45.312,9 71.521,7 57,84
2402 Cigars, cheroots, cigarillos and cigarettes; of tobacco or of tobacco substitutes 617.830,9 708.141,4 804.713,6 793.316,8 803.902,3 6,61 526.803,7 744.857,5 41,39
KAMBOJA/CAMBODIA 202.366,7 218.741,9 299.086,5 266.802,8 278.805,2 8,76 181.724,9 228.138,2 25,54
MALAYSIA/MALAYSIA 158.595,0 197.383,4 215.071,9 215.802,8 200.318,6 5,72 136.086,6 180.419,8 32,58
SINGAPURA/SINGAPORE 114.737,1 127.875,7 109.830,2 93.644,6 90.535,5 -7,55 61.426,0 89.749,3 46,11
VIETNAM/VIET NAM 14.439,2 19.538,5 32.003,4 36.595,1 40.866,8 31,10 25.001,4 45.784,9 83,13
THAILAND/THAILAND 27.036,7 24.209,1 37.547,1 38.101,7 37.006,3 11,42 24.735,7 38.812,9 56,91
NEGARA LAINNYA/OTHER COUNTRIES 100.656,2 120.392,7 111.174,5 142.369,8 156.370,0 11,06 97.829,1 161.952,5 65,55
30

Lanjutan/Continued
Nilai/Value : Ribu/Thousand US$
2012 2013
TABEL 14 : NILAI EKSPOR 100 JENIS BARANG MENURUT NEGARA TUJUAN UTAMA
EXPORT VALUE OF 100 COMMODITIES BY MAIN COUNTRY OF DESTINATION
KODE
CODE
HS
JENIS BARANG
DESCRIPTION OF GOODS
Trend (%)
12-16
Jan-Ags/Jan-Aug Perub. (%)
Change (%)
17-16
No. 08.05.148
2015 2016
2016 2017
2014
2603 Copper ores and concentrates 2.594.674,5 3.006.809,9 1.683.587,7 3.277.157,6 3.481.556,9 6,97 2.040.555,5 2.469.323,1 21,01
JEPANG/JAPAN 958.088,5 902.036,6 432.011,5 1.066.410,7 1.297.054,0 8,04 839.500,8 681.002,3 -18,88
PILIPINA/PHILIPPINES 190.084,7 223.136,8 24.508,5 421.377,2 657.409,6 36,58 395.459,0 566.061,1 43,14
R.R. TIONGKOK/CINA 190.483,8 391.849,6 381.805,0 368.124,4 534.283,8 22,14 259.048,1 350.100,7 35,15
INDIA/INDIA 450.595,8 754.416,5 338.786,0 801.637,5 529.946,5 3,93 203.749,7 528.598,9 159,44
KOREA SELATAN/SOUTH OF KOREA 368.078,9 358.578,9 162.589,8 490.154,6 408.641,7 5,36 288.576,6 343.560,0 19,05
NEGARA LAINNYA/OTHER COUNTRIES 437.342,8 376.791,6 343.886,9 129.453,1 54.221,3 -40,81 54.221,3 0,0 -100,00
2701 Coal; briquettes, ovoids and similar solid fuels manufactured from coal 24.293.180,4 22.773.242,2 18.697.799,9 14.717.264,7 12.898.709,8 -15,66 7.919.527,6 14.529.074,2 83,46
INDIA/INDIA 4.848.069,2 5.450.724,7 5.604.160,3 4.651.387,4 3.295.907,7 -8,88 2.137.074,9 3.818.705,5 78,69
R.R. TIONGKOK/CINA 5.613.990,1 5.275.673,8 2.697.627,6 1.537.710,3 2.092.059,1 -27,44 1.119.018,4 2.284.211,1 104,13
JEPANG/JAPAN 3.558.885,6 3.238.592,4 2.593.488,3 2.033.723,6 1.980.148,6 -15,11 1.234.042,5 2.004.987,2 62,47
KOREA SELATAN/SOUTH OF KOREA 2.545.197,5 2.061.812,2 1.874.377,6 1.377.429,2 1.200.613,0 -17,35 722.955,7 1.498.445,0 107,27
TAIWAN/TAIWAN, PROVINCE OF CINA 2.393.176,8 1.997.289,5 1.724.711,6 1.284.806,8 952.106,1 -20,42 631.474,4 898.832,1 42,34
NEGARA LAINNYA/OTHER COUNTRIES 5.333.861,2 4.749.149,5 4.203.434,5 3.832.207,3 3.377.875,1 -10,67 2.074.961,6 4.023.893,3 93,93
2702 Lignite; whether or not agglomerated, excluding jet 1.878.098,9 1.741.688,5 2.121.528,8 1.281.696,2 1.613.043,8 -5,93 804.938,0 2.103.616,6 161,34
R.R. TIONGKOK/CINA 1.696.503,3 1.618.349,9 2.028.120,0 1.180.822,5 1.534.300,6 -5,03 776.495,9 1.944.140,3 150,37
KOREA SELATAN/SOUTH OF KOREA - 6.265,5 2.888,1 38.629,6 43.759,8 - 18.294,0 103.347,8 464,93
INDIA/INDIA 85.813,6 76.175,0 68.550,5 19.314,9 8.899,4 -44,59 1.541,8 16.259,1 954,54
PILIPINA/PHILIPPINES 976,6 - - 454,1 8.534,9 - 725,4 1.016,4 40,12
MALAYSIA/MALAYSIA 4.102,3 321,6 2.301,7 - 6.410,8 - 1.526,2 287,1 -81,19
NEGARA LAINNYA/OTHER COUNTRIES 90.703,0 40.576,5 19.668,5 42.475,1 11.138,3 -33,96 6.354,7 38.565,9 506,89
2814 Ammonia; anhydrous or in aqueous solution 476.600,1 360.719,4 345.145,9 434.208,4 330.946,4 -5,29 266.467,0 248.346,1 -6,80
KOREA SELATAN/SOUTH OF KOREA 116.345,5 98.088,1 70.866,4 84.556,4 110.848,9 -2,42 89.128,3 52.364,9 -41,25
R.R. TIONGKOK/CINA 18.417,1 14.241,9 39.944,1 103.175,7 62.573,6 55,68 49.210,9 66.891,1 35,93
JEPANG/JAPAN 69.570,1 66.969,1 102.571,9 70.600,7 54.737,8 -4,18 48.602,2 35.092,6 -27,80
THAILAND/THAILAND 34.939,3 17.597,3 25.903,1 37.762,1 37.399,4 9,41 27.393,7 25.018,3 -8,67
TAIWAN/TAIWAN, PROVINCE OF CINA 113.568,8 50.492,3 74.136,6 52.153,2 24.630,2 -26,10 21.681,1 12.028,7 -44,52
NEGARA LAINNYA/OTHER COUNTRIES 123.759,4 113.330,7 31.723,7 85.960,3 40.756,5 -22,10 30.450,8 56.950,4 87,02
2905 Acyclic alcohols and their halogenated, sulphonated, nitrated or nitrosated derivatives 635.508,2 640.144,1 609.625,3 433.624,9 381.817,7 -13,14 237.580,9 445.366,8 87,46
R.R. TIONGKOK/CINA 339.554,7 300.859,1 238.453,1 176.366,8 158.717,0 -18,58 89.983,4 194.838,6 116,53
JEPANG/JAPAN 37.514,6 45.319,8 47.556,6 36.424,0 37.398,5 -2,22 24.647,9 41.756,6 69,41
AMERIKA SERIKAT/UNITED STATES 39.719,2 35.782,1 54.350,7 32.280,7 26.606,0 -8,65 18.404,1 29.261,5 58,99
INDIA/INDIA 27.336,2 21.449,8 69.296,9 27.589,8 20.494,7 -3,19 13.360,3 25.432,8 90,36
MALAYSIA/MALAYSIA 22.768,1 35.037,7 21.655,5 17.034,6 19.719,6 -9,59 12.604,4 17.919,2 42,17
NEGARA LAINNYA/OTHER COUNTRIES 168.615,4 201.695,6 178.312,5 143.928,9 118.881,9 -9,85 78.580,7 136.158,0 73,27
31

Lanjutan/Continued
Nilai/Value : Ribu/Thousand US$
2012 2013
TABEL 14 : NILAI EKSPOR 100 JENIS BARANG MENURUT NEGARA TUJUAN UTAMA
EXPORT VALUE OF 100 COMMODITIES BY MAIN COUNTRY OF DESTINATION
KODE
CODE
HS
JENIS BARANG
DESCRIPTION OF GOODS
Trend (%)
12-16
Jan-Ags/Jan-Aug Perub. (%)
Change (%)
17-16
No. 08.05.148
2015 2016
2016 2017
2014
2915 Acids; saturated acyclic monocarboxylic acids and their anhydrides, halides, peroxides
and peroxyacids; their halogenated, sulphonated, nitrated or nitrosated derivatives
218.739,3 191.586,8 329.764,1 380.764,1 499.040,5 26,32 279.663,0 490.539,7 75,40
BELANDA/NETHERLANDS 30.124,9 17.873,5 92.930,7 149.392,4 210.761,1 82,47 109.702,1 196.010,2 78,67
R.R. TIONGKOK/CINA 25.150,2 17.988,4 32.504,3 41.152,3 69.555,7 33,14 28.420,4 54.248,0 90,88
AMERIKA SERIKAT/UNITED STATES 25.580,3 36.107,8 43.202,2 40.899,1 44.241,4 12,98 28.057,0 40.174,3 43,19
INDIA/INDIA 23.119,5 15.804,8 19.193,4 23.191,7 37.685,5 14,58 24.389,4 45.868,0 88,07
JEPANG/JAPAN 12.934,0 8.830,5 9.188,4 13.708,7 19.231,1 13,12 11.870,7 16.938,6 42,69
NEGARA LAINNYA/OTHER COUNTRIES 101.830,4 94.981,9 132.745,1 112.420,0 117.565,7 4,66 77.223,3 137.300,6 77,80
2922 Oxygen-function amino-compounds 680.094,7 615.435,3 630.968,2 564.719,3 454.748,5 -8,52 311.136,0 351.973,7 13,13
JEPANG/JAPAN 63.791,0 67.331,5 65.002,0 71.728,5 65.365,7 1,13 44.658,8 50.129,7 12,25
BELANDA/NETHERLANDS 77.436,1 45.120,9 48.604,3 41.340,3 34.024,6 -15,91 25.557,3 20.828,0 -18,50
MALAYSIA/MALAYSIA 31.929,3 38.735,7 42.116,0 30.835,6 32.590,0 -1,85 21.239,8 24.529,4 15,49
KOREA SELATAN/SOUTH OF KOREA 26.208,0 30.818,3 43.384,1 43.962,0 30.887,4 7,08 21.059,9 24.139,3 14,62
VIETNAM/VIET NAM 31.061,3 38.769,9 35.017,5 29.975,8 26.602,4 -5,51 16.848,9 23.345,7 38,56
NEGARA LAINNYA/OTHER COUNTRIES 449.668,9 394.659,0 396.844,3 346.877,1 265.278,4 -11,17 181.771,3 209.001,7 14,98
3004 Medicaments; (not goods of heading no. 3002, 3005 or 3006) consisting of mixed or
unmixed products for therapeutic or prophylactic use, put up in measured doses (incl.
those in the form
297.418,9 286.185,8 357.060,1 431.083,6 442.541,1 12,80 296.197,8 367.528,1 24,08
PILIPINA/PHILIPPINES 48.496,9 52.005,5 62.978,1 73.667,3 68.840,8 11,06 45.626,9 64.182,5 40,67
SINGAPURA/SINGAPORE 10.105,8 8.690,4 12.604,9 26.160,5 66.515,3 62,75 20.715,7 94.800,2 357,63
JEPANG/JAPAN 45.273,3 31.447,7 36.963,4 36.396,2 61.216,6 7,78 42.195,2 52.578,8 24,61
THAILAND/THAILAND 32.994,7 32.922,5 44.540,4 46.162,0 44.526,5 9,83 33.950,9 26.809,8 -21,03
KOREA SELATAN/SOUTH OF KOREA 27.261,3 23.425,2 16.278,3 47.407,3 40.297,3 16,03 33.326,6 14.157,7 -57,52
NEGARA LAINNYA/OTHER COUNTRIES 133.286,9 137.694,5 183.695,2 201.290,3 161.144,6 7,89 120.382,6 114.999,2 -4,47
3102 Fertilizers; mineral or chemical, nitrogenous 488.311,5 552.419,8 402.174,1 263.395,3 295.554,5 -16,01 162.232,5 174.322,9 7,45
PILIPINA/PHILIPPINES 71.723,4 66.555,8 33.830,7 14.679,6 65.202,0 -15,65 34.859,3 59.326,0 70,19
AUSTRALIA/AUSTRALIA 97.884,1 89.137,0 110.358,4 52.091,3 63.435,0 -13,11 48.579,2 20.632,0 -57,53
VIETNAM/VIET NAM 1.527,5 14.403,7 3.762,0 60.170,5 62.469,0 142,34 29.351,8 43.742,5 49,03
AMERIKA SERIKAT/UNITED STATES 151.564,3 65.849,3 71.283,4 46.421,9 28.432,7 -30,90 19.641,9 42,4 -99,78
MALAYSIA/MALAYSIA 7.981,9 34.702,2 11.380,2 2.627,2 11.893,7 -16,33 3.766,4 16.129,7 328,25
NEGARA LAINNYA/OTHER COUNTRIES 157.630,2 281.771,8 171.559,4 87.404,9 64.122,1 -25,69 26.033,9 34.450,3 32,33
3401 Soap; organic surface-active preparations used as soap, skin washing, in bars, cakes,
moulded pieces, shapes, liquid or cream, containing soap or not; for retail, paper,
wadding, felt and
635.926,1 658.793,2 623.204,6 531.266,4 554.957,9 -4,76 356.892,2 559.466,1 56,76
R.R. TIONGKOK/CINA 28.470,5 21.476,0 26.904,1 41.025,2 43.550,9 16,15 24.530,5 51.090,4 108,27
MALAYSIA/MALAYSIA 33.580,8 36.800,3 44.261,2 35.370,7 40.954,8 3,64 28.643,1 39.017,3 36,22
PERSERIKATAN EMIRAT ARAB/UNITED ARAB EMIRATES 39.477,6 51.738,2 46.291,3 35.561,0 38.347,1 -4,24 22.341,5 25.501,2 14,14
THAILAND/THAILAND 23.442,1 44.333,6 36.775,7 32.203,3 32.254,5 3,24 22.728,9 32.000,5 40,79
PILIPINA/PHILIPPINES 19.322,9 19.626,2 22.818,0 22.707,7 24.366,9 6,29 14.120,4 34.779,1 146,30
NEGARA LAINNYA/OTHER COUNTRIES 491.632,2 484.818,8 446.154,3 364.398,5 375.483,8 -7,91 244.527,7 377.077,7 54,21
32

Lanjutan/Continued
Nilai/Value : Ribu/Thousand US$
2012 2013
TABEL 14 : NILAI EKSPOR 100 JENIS BARANG MENURUT NEGARA TUJUAN UTAMA
EXPORT VALUE OF 100 COMMODITIES BY MAIN COUNTRY OF DESTINATION
KODE
CODE
HS
JENIS BARANG
DESCRIPTION OF GOODS
Trend (%)
12-16
Jan-Ags/Jan-Aug Perub. (%)
Change (%)
17-16
No. 08.05.148
2015 2016
2016 2017
2014
3402 Organic surface-active agents (not soap); surface-active, washing (including auxiliary
washing) and cleaning preparations, containing soap or not, excluding those of heading
no. 3401
236.341,4 242.420,1 279.649,5 273.830,3 264.915,0 3,56 171.467,9 241.226,0 40,68
MALAYSIA/MALAYSIA 48.669,7 52.728,3 50.469,3 41.906,8 45.336,6 -3,65 30.078,4 34.433,7 14,48
AUSTRALIA/AUSTRALIA 14.331,3 22.228,3 24.790,5 21.213,1 18.941,4 5,24 12.061,7 17.711,3 46,84
R.R. TIONGKOK/CINA 14.904,4 11.011,9 17.084,6 18.245,0 17.915,3 9,12 10.373,9 20.448,9 97,12
VIETNAM/VIET NAM 9.207,9 10.785,6 12.528,9 14.038,3 13.551,4 10,92 9.107,7 12.516,8 37,43
ANGOLA/ANGOLA 19.330,0 16.464,3 13.649,9 16.745,3 12.393,4 -8,35 5.666,3 12.860,7 126,97
NEGARA LAINNYA/OTHER COUNTRIES 129.898,1 129.201,8 161.126,3 161.681,8 156.776,8 6,19 104.179,8 143.254,4 37,51
3808 Insecticides, rodenticides, fungicides, herbicides, anti-sprouting products, plant growth
regulators, disinfectants and the like, put up in forms or packings for retail sale or as
preparations or form
249.577,5 317.445,1 300.839,9 275.704,4 280.151,4 0,91 198.658,0 247.691,4 24,68
PILIPINA/PHILIPPINES 29.735,7 32.870,5 43.217,4 38.518,9 42.878,8 9,31 27.274,5 41.744,3 53,05
R.R. TIONGKOK/CINA 55.005,4 74.820,2 54.421,1 48.967,2 41.182,7 -9,54 35.759,8 36.625,4 2,42
THAILAND/THAILAND 54.038,1 75.604,5 37.803,9 32.648,8 39.403,2 -13,68 26.972,4 41.266,4 52,99
VIETNAM/VIET NAM 14.322,4 17.435,4 20.628,8 25.041,2 28.904,0 19,32 16.630,5 18.843,3 13,31
MALAYSIA/MALAYSIA 28.458,4 27.009,1 30.230,0 23.647,1 22.969,3 -5,46 16.133,6 21.060,1 30,54
NEGARA LAINNYA/OTHER COUNTRIES 68.017,7 89.705,4 114.538,7 106.881,2 104.813,4 10,96 75.887,2 88.151,9 16,16
3823 Industrial monocarboxylic fatty acids; acid oils from refining; industrial fatty alcohols 1.881.201,2 1.721.166,7 2.367.120,9 1.835.159,6 2.328.242,7 5,03 1.380.998,9 2.438.528,9 76,58
R.R. TIONGKOK/CINA 538.085,0 492.328,4 624.358,8 462.554,3 630.272,1 2,57 357.268,4 543.827,1 52,22
MALAYSIA/MALAYSIA 218.477,7 197.983,1 325.760,4 228.505,7 377.636,3 13,18 226.966,1 316.732,6 39,55
BELANDA/NETHERLANDS 223.116,6 292.643,0 397.085,1 270.763,6 244.274,8 1,04 146.948,2 344.841,9 134,67
SINGAPURA/SINGAPORE 155.592,5 87.578,8 151.870,6 204.689,6 223.285,3 17,02 135.036,4 193.970,1 43,64
INDIA/INDIA 74.770,2 70.835,0 162.132,3 110.735,1 170.500,2 23,31 101.140,8 207.245,6 104,91
NEGARA LAINNYA/OTHER COUNTRIES 671.159,2 579.798,4 705.913,8 557.911,4 682.274,0 -0,06 413.639,1 831.911,6 101,12
3826 Biodiesel and mixtures thereof; not containing or containing less than 70% by weight of
petroleum oils or oils obtained from bituminous minerals weight of petroleum oils or oils
obtained from bitumino
1.380.806,6 1.406.996,6 1.141.337,8 195.163,2 287.246,5 -40,04 218.088,3 117.178,0 -46,27
AMERIKA SERIKAT/UNITED STATES 57,7 182.493,1 149.525,9 146.996,3 255.563,5 424,71 203.824,5 - -
SPANYOL/SPAIN 346.121,8 166.788,9 122.142,5 14.504,0 16.491,0 -57,39 - 96.536,9 -
ITALIA/ITALY 310.907,9 99.063,5 - - 13.340,0 - 13.340,0 20.200,0 51,42
KOREA SELATAN/SOUTH OF KOREA 2,2 18,9 - 340,0 1.127,6 - 581,9 439,5 -24,46
R.R. TIONGKOK/CINA 10.961,5 137.106,2 672.811,6 11.494,8 717,5 -54,76 335,0 - -
NEGARA LAINNYA/OTHER COUNTRIES 712.755,6 821.526,0 196.857,8 21.828,2 7,0 -93,06 7,0 1,6 -77,69
3907 Polyacetals, other polyethers and epoxide resins, in primary forms; polycarbonates, alkyd
resins, polyallyl esters and other polyesters, in primary forms
412.927,9 405.395,4 519.117,2 417.554,1 346.128,5 -3,18 223.678,2 309.867,3 38,53
ITALIA/ITALY 1.105,4 30.957,3 96.915,1 85.522,0 66.706,3 151,34 44.055,3 63.750,4 44,71
VIETNAM/VIET NAM 33.272,3 44.468,1 57.746,1 64.135,9 52.708,1 13,73 32.199,4 44.247,1 37,42
JEPANG/JAPAN 87.542,0 83.713,1 59.794,9 50.270,7 49.702,7 -15,14 32.789,3 50.291,8 53,38
AMERIKA SERIKAT/UNITED STATES 32.870,0 28.888,8 33.419,0 22.665,4 40.129,8 1,58 27.101,8 38.663,9 42,66
R.R. TIONGKOK/CINA 10.579,6 13.237,6 37.585,2 47.421,0 24.629,6 34,53 16.392,1 13.463,5 -17,87
NEGARA LAINNYA/OTHER COUNTRIES 247.558,5 204.130,5 233.656,8 147.539,2 112.252,0 -17,36 71.140,2 99.450,7 39,80
33

Lanjutan/Continued
Nilai/Value : Ribu/Thousand US$
2012 2013
TABEL 14 : NILAI EKSPOR 100 JENIS BARANG MENURUT NEGARA TUJUAN UTAMA
EXPORT VALUE OF 100 COMMODITIES BY MAIN COUNTRY OF DESTINATION
KODE
CODE
HS
JENIS BARANG
DESCRIPTION OF GOODS
Trend (%)
12-16
Jan-Ags/Jan-Aug Perub. (%)
Change (%)
17-16
No. 08.05.148
2015 2016
2016 2017
2014
3920 Plastics; plates, sheets, film, foil and strip (not self-adhesive); non-cellular and not
reinforced, laminated, supported or similarly combined with other materials, n.e.c. in
chapter 39
537.389,5 527.392,6 567.227,4 503.505,4 509.574,7 -1,51 332.205,1 465.756,3 40,20
JEPANG/JAPAN 107.204,5 107.830,4 102.618,8 88.993,7 97.967,6 -3,65 62.991,7 89.079,9 41,42
AMERIKA SERIKAT/UNITED STATES 71.595,6 61.723,3 65.152,9 52.180,6 49.528,4 -8,65 32.906,8 50.428,5 53,25
THAILAND/THAILAND 34.007,5 36.778,9 38.835,6 41.114,8 41.693,9 5,33 28.072,6 37.666,6 34,18
AUSTRALIA/AUSTRALIA 30.807,6 36.213,7 38.443,5 37.559,6 36.038,5 3,56 22.774,4 32.589,3 43,10
KOREA SELATAN/SOUTH OF KOREA 38.420,6 36.867,9 40.971,6 35.132,9 31.963,6 -4,08 21.138,8 33.350,8 57,77
NEGARA LAINNYA/OTHER COUNTRIES 255.353,6 247.978,3 281.205,0 248.523,7 252.382,7 -0,21 164.320,8 222.641,2 35,49
3923 Plastic articles for the conveyance or packing of goods; stoppers, lids, caps and other
closures of plastics
390.258,6 371.236,2 380.273,4 356.014,7 337.963,4 -3,24 225.767,8 288.254,1 27,68
JEPANG/JAPAN 137.416,8 141.704,7 151.446,8 135.375,2 130.721,3 -1,45 85.083,7 110.950,0 30,40
SINGAPURA/SINGAPORE 47.841,1 45.033,9 48.808,7 51.846,6 39.226,4 -2,53 26.438,3 35.042,1 32,54
AMERIKA SERIKAT/UNITED STATES 14.091,2 16.957,0 18.639,2 19.128,6 22.709,5 11,35 15.406,6 20.207,1 31,16
BRASILIA/BRAZIL 6.705,7 8.707,3 9.748,0 10.464,1 16.654,9 22,18 11.244,7 5.979,7 -46,82
INGGRIS/UNITED KINGDOM 12.005,2 10.200,1 10.734,0 8.831,3 9.953,0 -5,06 6.806,3 9.918,7 45,73
NEGARA LAINNYA/OTHER COUNTRIES 172.198,7 148.633,1 140.896,7 130.368,9 118.698,4 -8,38 80.788,2 106.156,5 31,40
4001 Natural rubber, balata, gutta-percha, guayule, chicle and similar gums; in primary forms or
in plates, sheets or strip
7.864.528,1 6.910.663,1 4.744.753,1 3.701.477,6 3.372.319,0 -20,69 2.084.201,3 4.428.842,6 112,50
AMERIKA SERIKAT/UNITED STATES 1.835.843,0 1.563.789,5 1.074.514,2 874.987,6 743.091,0 -21,25 494.287,7 873.238,1 76,67
JEPANG/JAPAN 1.256.315,5 1.092.584,9 732.687,1 598.140,1 551.955,5 -20,13 363.660,5 689.674,6 89,65
R.R. TIONGKOK/CINA 1.416.808,8 1.307.399,8 681.516,9 404.325,1 401.027,4 -30,91 174.768,4 679.001,6 288,52
INDIA/INDIA 345.064,8 361.144,5 354.514,6 289.932,9 306.422,2 -4,47 186.185,7 379.845,7 104,01
KOREA SELATAN/SOUTH OF KOREA 456.960,1 378.787,6 285.098,0 257.774,9 232.406,5 -15,95 141.824,7 280.029,0 97,45
NEGARA LAINNYA/OTHER COUNTRIES 2.553.535,9 2.206.956,8 1.616.422,3 1.276.316,9 1.137.416,4 -19,47 723.474,2 1.527.053,6 111,07
4011 New pneumatic tyres, of rubber 1.704.181,1 1.652.349,0 1.627.754,8 1.546.876,1 1.605.021,5 -1,84 1.064.694,4 1.322.504,5 24,21
AMERIKA SERIKAT/UNITED STATES 447.083,1 489.714,4 472.596,6 623.417,7 742.774,4 13,39 479.572,8 571.107,0 19,09
JEPANG/JAPAN 170.050,1 170.992,3 158.858,1 122.240,6 127.000,6 -8,78 83.614,5 108.741,9 30,05
PILIPINA/PHILIPPINES 54.831,3 56.923,9 60.500,8 62.546,1 70.227,5 6,07 43.213,4 64.032,2 48,18
MALAYSIA/MALAYSIA 94.588,6 91.679,3 73.285,0 70.192,4 70.072,0 -8,31 46.608,7 59.775,3 28,25
AUSTRALIA/AUSTRALIA 114.689,1 87.639,2 82.065,7 76.983,3 62.518,4 -12,57 39.861,8 48.243,1 21,03
NEGARA LAINNYA/OTHER COUNTRIES 822.938,9 755.399,8 780.448,6 591.496,0 532.428,5 -10,55 371.823,3 470.605,0 26,57
4202 Trunks; suit, camera, jewellery, cutlery cases; travel, tool, similar bags; wholly or mainly
covered by leather, composition leather, plastic sheeting, textile materials, vulcanised
fibre, paperboard
203.907,4 219.523,2 225.806,7 228.643,3 266.889,0 5,96 162.063,3 299.624,6 84,88
AMERIKA SERIKAT/UNITED STATES 65.837,3 70.530,9 66.333,0 67.083,3 83.468,3 4,34 52.841,6 116.242,0 119,98
BELGIA/BELGIUM 11.681,4 6.896,7 11.553,6 16.707,6 25.113,5 27,32 14.775,8 36.025,4 143,81
BELANDA/NETHERLANDS 9.446,5 17.504,5 17.855,3 18.590,3 21.807,5 18,93 13.782,3 18.144,3 31,65
JEPANG/JAPAN 13.558,1 14.811,5 15.739,5 18.188,1 21.572,1 12,01 13.269,6 22.950,8 72,96
JERMAN/GERMANY 7.775,4 5.689,6 10.280,4 13.217,1 14.137,7 22,61 8.304,6 10.896,2 31,21
NEGARA LAINNYA/OTHER COUNTRIES 95.608,7 104.090,0 104.044,9 94.856,8 100.790,0 0,13 59.089,4 95.366,0 61,39
34

Lanjutan/Continued
Nilai/Value : Ribu/Thousand US$
2012 2013
TABEL 14 : NILAI EKSPOR 100 JENIS BARANG MENURUT NEGARA TUJUAN UTAMA
EXPORT VALUE OF 100 COMMODITIES BY MAIN COUNTRY OF DESTINATION
KODE
CODE
HS
JENIS BARANG
DESCRIPTION OF GOODS
Trend (%)
12-16
Jan-Ags/Jan-Aug Perub. (%)
Change (%)
17-16
No. 08.05.148
2015 2016
2016 2017
2014
4409 Wood (including strips, friezes for parquet flooring, not assembled), continuously shaped
(tongued, grooved, v-jointed, beaded or the like) along any edges, ends or faces, whether
or not planed, sande
514.980,4 508.960,2 616.507,9 613.754,5 614.539,5 5,56 393.385,6 555.908,5 41,31
R.R. TIONGKOK/CINA 81.334,1 95.820,1 145.625,9 152.098,0 168.115,8 21,10 99.765,7 164.428,7 64,81
AUSTRALIA/AUSTRALIA 127.324,5 118.514,8 139.853,1 108.797,7 99.745,6 -5,58 60.599,8 99.814,5 64,71
JEPANG/JAPAN 49.416,5 44.803,6 49.723,3 51.007,6 53.552,8 2,95 34.839,3 38.617,4 10,84
INDIA/INDIA 12.280,4 24.355,6 27.925,2 41.578,8 53.383,1 41,54 34.901,5 44.683,7 28,03
BELANDA/NETHERLANDS 41.988,0 34.503,8 39.035,0 41.145,1 41.278,2 1,43 28.169,9 34.009,0 20,73
NEGARA LAINNYA/OTHER COUNTRIES 202.636,8 190.962,3 214.345,4 219.127,2 198.464,0 0,96 135.109,3 174.355,1 29,05
4412 Plywood, veneered panels and similar laminated wood 2.011.518,2 2.176.212,9 2.372.470,9 2.345.947,2 2.211.610,2 2,68 1.450.498,4 1.810.258,2 24,80
JEPANG/JAPAN 738.538,7 788.599,9 743.476,0 598.667,7 576.356,8 -7,42 383.103,4 476.935,5 24,49
R.R. TIONGKOK/CINA 313.753,5 426.412,7 532.113,3 554.629,0 526.307,8 13,85 334.551,5 395.073,3 18,09
KOREA SELATAN/SOUTH OF KOREA 80.124,0 95.128,2 129.214,6 176.055,8 214.498,3 29,50 137.799,8 197.421,5 43,27
AMERIKA SERIKAT/UNITED STATES 129.304,1 155.049,7 151.430,4 218.860,9 176.014,1 10,09 107.683,7 146.697,0 36,23
TAIWAN/TAIWAN, PROVINCE OF CINA 108.307,2 131.538,6 147.478,5 117.901,3 135.229,4 3,40 91.742,5 106.779,9 16,39
NEGARA LAINNYA/OTHER COUNTRIES 641.490,7 579.483,7 668.758,0 679.832,5 583.203,9 -0,31 395.617,5 487.350,9 23,19
4418 Builders' joinery and carpentry of wood, including cellular wood panels, assembled
flooring panels, shingles and shakes
315.786,3 330.433,8 341.399,3 355.270,5 362.871,9 3,57 234.708,6 325.086,8 38,51
INGGRIS/UNITED KINGDOM 54.685,9 67.978,5 65.151,5 76.087,6 84.258,8 10,27 54.119,5 64.502,8 19,19
AMERIKA SERIKAT/UNITED STATES 39.171,0 45.746,5 48.573,4 52.609,2 63.219,0 11,60 38.538,7 61.232,8 58,89
JEPANG/JAPAN 55.016,9 60.454,2 55.029,6 54.261,9 57.930,0 -0,05 37.086,1 53.176,6 43,39
BELANDA/NETHERLANDS 28.909,6 23.968,0 29.476,8 34.015,6 29.739,8 4,15 20.341,8 33.242,2 63,42
AUSTRALIA/AUSTRALIA 24.378,8 26.566,7 28.031,6 28.260,7 24.324,6 0,58 15.355,2 24.328,2 58,44
NEGARA LAINNYA/OTHER COUNTRIES 113.624,0 105.719,9 115.136,5 110.035,5 103.399,7 -1,47 69.267,3 88.604,4 27,92
4703 Chemical wood pulp, soda or sulphate, other than dissolving grades 1.544.658,4 1.841.062,9 1.718.324,9 1.725.447,3 1.560.591,0 -0,44 1.044.843,9 1.807.952,4 73,04
R.R. TIONGKOK/CINA 848.785,6 1.098.097,0 1.087.434,1 1.086.887,8 969.163,4 2,58 636.164,5 1.280.097,7 101,22
KOREA SELATAN/SOUTH OF KOREA 261.639,6 312.203,5 238.704,1 230.177,5 157.254,1 -12,39 116.017,8 139.512,8 20,25
BANGLA DESH/BANGLADESH 61.713,2 77.687,8 84.928,8 88.620,2 136.305,7 18,73 88.618,6 99.890,9 12,72
INDIA/INDIA 135.473,1 128.381,8 82.149,2 89.423,5 102.869,3 -8,72 67.103,5 99.242,0 47,89
JEPANG/JAPAN 72.274,1 59.651,9 76.857,1 72.515,4 45.171,0 -7,18 26.879,3 40.828,8 51,90
NEGARA LAINNYA/OTHER COUNTRIES 164.772,8 165.040,9 148.251,7 157.822,9 149.827,5 -2,32 110.060,2 148.380,2 34,82
4802 Uncoated paper and paperboard, used for writing, printing or other graphics, non
perforated punch-cards and punch tape paper, in rolls or rectangular sheets, of any size,
other than paper of
2.077.101,5 1.843.305,7 1.912.658,0 1.792.984,0 1.794.182,7 -3,15 1.174.628,2 1.663.407,9 41,61
JEPANG/JAPAN 520.587,3 394.420,9 316.243,3 327.602,0 296.174,1 -12,31 197.134,2 229.718,5 16,53
MALAYSIA/MALAYSIA 181.224,6 152.730,0 146.500,1 132.549,4 130.774,8 -7,64 93.484,5 114.210,7 22,17
R.R. TIONGKOK/CINA 94.541,2 61.210,4 69.533,1 121.157,7 129.642,7 14,05 84.764,7 187.087,4 120,71
PILIPINA/PHILIPPINES 61.315,2 68.795,1 83.443,5 72.884,4 94.847,7 9,75 66.786,4 91.394,7 36,85
INDIA/INDIA 9.579,6 20.603,6 31.795,1 29.754,3 71.574,3 55,11 32.359,4 134.990,1 317,16
NEGARA LAINNYA/OTHER COUNTRIES 1.209.853,6 1.145.545,6 1.265.142,9 1.109.036,3 1.071.169,1 -2,72 700.098,9 906.006,6 29,41
35

Lanjutan/Continued
Nilai/Value : Ribu/Thousand US$
2012 2013
TABEL 14 : NILAI EKSPOR 100 JENIS BARANG MENURUT NEGARA TUJUAN UTAMA
EXPORT VALUE OF 100 COMMODITIES BY MAIN COUNTRY OF DESTINATION
KODE
CODE
HS
JENIS BARANG
DESCRIPTION OF GOODS
Trend (%)
12-16
Jan-Ags/Jan-Aug Perub. (%)
Change (%)
17-16
No. 08.05.148
2015 2016
2016 2017
2014
4803 Tissue, towel, napkin stock or similar; for household or sanitary uses, cellulose wadding,
webs of cellulose fibres, in rolls over 36cm in width or rectangular sheets with one side
exceeding 36cm when
333.841,4 375.167,1 353.188,3 438.938,4 503.520,5 10,28 356.780,6 430.473,9 20,66
AMERIKA SERIKAT/UNITED STATES 80.146,0 89.332,0 82.021,5 100.419,7 118.436,7 9,40 90.877,0 75.685,8 -16,72
AUSTRALIA/AUSTRALIA 29.232,5 21.576,3 26.341,9 36.200,3 47.430,7 16,01 37.197,8 36.093,1 -2,97
TAIWAN/TAIWAN, PROVINCE OF CINA 26.547,6 22.661,0 21.863,3 41.895,3 44.396,6 17,86 31.101,6 39.942,0 28,42
KOREA SELATAN/SOUTH OF KOREA 8.660,0 14.784,0 19.372,1 23.043,5 34.865,1 38,12 21.038,3 45.776,2 117,59
MALAYSIA/MALAYSIA 33.507,3 32.720,3 27.814,0 34.140,3 30.536,0 -1,42 19.654,0 30.597,4 55,68
NEGARA LAINNYA/OTHER COUNTRIES 155.748,2 194.093,6 175.775,6 203.239,3 227.855,5 8,40 156.911,9 202.379,4 28,98
4810 Paper and paperboard, coated one or both sides with kaolin (CINA clay) or inorganic
substances, with binder or not, no other coating, surface coloured or not, surface
decorated or printed, in rolls o
602.108,6 615.539,5 548.070,1 470.677,6 385.569,7 -10,95 257.975,4 284.638,2 10,34
VIETNAM/VIET NAM 84.530,2 96.572,4 60.866,5 63.764,3 61.070,9 -10,10 39.003,3 47.604,4 22,05
INDIA/INDIA 25.136,2 32.341,3 47.756,9 55.375,3 59.400,0 25,33 38.414,7 41.244,1 7,37
BANGLA DESH/BANGLADESH 21.455,7 29.406,2 32.069,6 25.425,7 28.487,2 4,30 17.455,5 13.391,5 -23,28
THAILAND/THAILAND 39.855,7 35.189,1 28.371,0 30.434,3 28.056,4 -8,12 19.077,9 22.450,2 17,68
PAKISTAN/PAKISTAN 26.623,0 22.989,0 33.414,3 28.302,3 27.354,5 2,66 19.227,7 23.586,4 22,67
NEGARA LAINNYA/OTHER COUNTRIES 404.507,8 399.041,6 345.591,9 267.375,8 181.200,8 -18,18 124.796,3 136.361,5 9,27
5205 Cotton yarn (other than sewing thread), containing 85% or more by weight of cotton, not
put up for retail sale
272.568,2 371.834,2 451.514,3 428.174,1 431.255,6 11,17 277.988,3 396.366,0 42,58
R.R. TIONGKOK/CINA 104.016,7 202.068,2 266.232,1 280.055,6 267.636,4 24,81 165.183,1 283.212,8 71,45
JEPANG/JAPAN 72.663,8 78.099,2 81.024,1 62.055,8 62.662,6 -5,13 41.941,1 46.195,3 10,14
BANGLA DESH/BANGLADESH 16.229,2 14.067,5 15.640,4 12.081,4 26.826,4 8,90 21.852,6 17.092,4 -21,78
KOREA SELATAN/SOUTH OF KOREA 22.698,0 21.649,4 18.908,0 20.978,4 26.033,4 2,46 16.586,4 16.388,7 -1,19
HONGKONG/HONG KONG 19.164,3 10.991,0 18.582,8 15.709,5 10.226,4 -8,60 3.810,1 3.528,0 -7,40
NEGARA LAINNYA/OTHER COUNTRIES 37.796,2 44.958,9 51.126,9 37.293,4 37.870,3 -1,81 28.615,0 29.948,9 4,66
5402 Synthetic filament yarn (other than sewing thread), not put up for retail sale, including
synthetic monofilament of less than 67 decitex
495.812,6 485.651,3 462.607,3 425.532,1 381.781,2 -6,34 248.390,7 342.107,9 37,73
TURKI/TURKEY 97.464,0 83.970,1 72.484,0 66.662,1 73.364,1 -7,68 43.392,2 78.202,2 80,22
VIETNAM/VIET NAM 34.283,1 38.919,5 45.551,3 49.112,7 48.570,7 9,74 30.670,4 41.281,7 34,60
JEPANG/JAPAN 47.892,8 45.495,0 51.385,4 46.739,2 43.739,3 -1,53 28.699,6 37.478,1 30,59
THAILAND/THAILAND 27.309,3 53.560,9 49.846,6 40.934,9 38.236,2 4,13 25.765,3 34.688,3 34,63
INDIA/INDIA 25.389,6 18.322,8 17.026,0 18.683,8 17.744,9 -6,73 12.284,2 16.939,8 37,90
NEGARA LAINNYA/OTHER COUNTRIES 263.473,8 245.383,0 226.314,0 203.399,3 160.125,9 -11,16 107.579,0 133.517,9 24,11
5407 Woven fabrics of synthetic filament yarn, including woven fabrics obtained from materials
of heading no. 5404
848.042,0 737.960,7 756.215,4 646.318,0 602.952,4 -7,82 424.226,6 435.858,3 2,74
PERSERIKATAN EMIRAT ARAB/UNITED ARAB EMIRATES 143.252,9 153.045,2 203.450,6 187.058,1 190.336,3 7,99 137.874,1 126.341,9 -8,36
TURKI/TURKEY 219.949,8 201.024,6 205.562,7 144.154,3 118.502,2 -14,53 90.213,2 68.533,7 -24,03
MALAYSIA/MALAYSIA 68.310,1 67.355,5 63.273,4 61.839,1 61.961,6 -2,77 40.109,3 45.873,4 14,37
JEPANG/JAPAN 51.534,2 42.375,2 39.277,4 45.218,6 40.662,2 -4,01 24.819,5 35.163,6 41,68
SAUDI ARABIA/SAUDI ARABIA 86.640,8 52.796,9 43.587,7 27.700,5 29.739,5 -24,30 22.649,7 32.812,3 44,87
NEGARA LAINNYA/OTHER COUNTRIES 278.354,1 221.363,2 201.063,6 180.347,4 161.750,6 -12,11 108.560,8 127.133,4 17,11
36

Lanjutan/Continued
Nilai/Value : Ribu/Thousand US$
2012 2013
TABEL 14 : NILAI EKSPOR 100 JENIS BARANG MENURUT NEGARA TUJUAN UTAMA
EXPORT VALUE OF 100 COMMODITIES BY MAIN COUNTRY OF DESTINATION
KODE
CODE
HS
JENIS BARANG
DESCRIPTION OF GOODS
Trend (%)
12-16
Jan-Ags/Jan-Aug Perub. (%)
Change (%)
17-16
No. 08.05.148
2015 2016
2016 2017
2014
5509 Yarn (other than sewing thread) of synthetic staple fibres, not put up for retail sale 894.903,4 953.198,0 988.741,8 859.263,5 792.685,9 -3,40 553.434,4 669.160,8 20,91
TURKI/TURKEY 33.973,4 60.242,6 126.473,7 112.371,5 111.180,9 34,91 77.011,7 94.432,7 22,62
KOREA SELATAN/SOUTH OF KOREA 118.713,2 118.227,2 93.437,4 86.532,7 102.664,8 -5,85 70.940,0 79.415,9 11,95
BRASILIA/BRAZIL 133.722,4 154.718,5 126.238,6 75.483,6 72.147,8 -17,73 53.396,2 75.498,4 41,39
JEPANG/JAPAN 72.219,2 68.711,0 64.920,6 54.519,6 51.601,0 -8,64 35.582,1 37.647,1 5,80
PAKISTAN/PAKISTAN 59.627,7 52.967,8 63.502,9 59.018,0 44.157,3 -4,81 30.874,0 27.700,1 -10,28
NEGARA LAINNYA/OTHER COUNTRIES 476.647,5 498.330,9 514.168,7 471.338,1 410.934,1 -3,46 285.630,4 354.466,7 24,10
5510 Yarn (other than sewing thread) of artificial staple fibres, not put up for retail sale 388.793,0 461.133,8 442.455,2 503.797,2 499.646,0 6,08 344.154,9 416.596,5 21,05
BRASILIA/BRAZIL 131.469,4 115.414,1 109.946,9 101.456,4 98.371,8 -6,84 69.302,1 71.116,2 2,62
MESIR/EGYPT 11.114,0 42.998,3 51.752,8 72.330,9 74.399,9 54,07 56.736,4 53.964,6 -4,89
TURKI/TURKEY 36.125,1 62.497,3 59.695,8 69.467,2 67.566,9 14,55 46.727,1 67.535,6 44,53
KOREA SELATAN/SOUTH OF KOREA 47.027,8 48.730,6 36.631,4 34.006,9 50.126,9 -2,29 33.096,9 44.607,9 34,78
VIETNAM/VIET NAM 1.331,0 6.653,3 18.503,8 28.907,7 24.542,0 107,46 14.188,6 23.494,4 65,59
NEGARA LAINNYA/OTHER COUNTRIES 161.725,7 184.840,2 165.924,5 197.628,1 184.638,5 3,37 124.103,9 155.877,7 25,60
6103 Suits, ensembles, jackets, blazers, trousers, bib and brace overalls, breeches, shorts (not
swimwear); men's or boys', knitted or crocheted
225.027,5 256.403,8 287.007,8 274.371,7 268.751,2 4,32 175.648,9 275.276,4 56,72
AMERIKA SERIKAT/UNITED STATES 131.194,6 133.784,2 141.468,8 122.761,4 108.122,7 -4,62 74.849,5 116.266,6 55,33
JEPANG/JAPAN 16.862,7 17.833,7 29.143,2 28.721,0 38.356,0 23,62 19.015,1 35.675,7 87,62
BELGIA/BELGIUM 9.682,6 9.123,6 16.015,1 20.949,5 22.593,8 28,74 15.833,7 17.321,0 9,39
R.R. TIONGKOK/CINA 1.553,5 5.856,9 6.463,1 10.769,7 15.448,3 68,26 8.875,9 21.266,1 139,59
JERMAN/GERMANY 5.667,6 10.560,2 14.392,0 12.743,9 13.399,2 21,03 8.860,5 10.885,0 22,85
NEGARA LAINNYA/OTHER COUNTRIES 60.066,6 79.245,2 79.525,7 78.426,2 70.831,3 3,24 48.214,3 73.862,1 53,20
6104 Suits, ensembles, jackets, dresses, skirts, divided skirts, trousers, bib and brace overalls,
breeches and shorts (not swimwear), women's or girls', knitted or crocheted knitted or
crocheted
586.154,4 618.394,2 656.886,1 644.011,3 624.682,0 1,69 412.152,5 625.301,4 51,72
AMERIKA SERIKAT/UNITED STATES 418.241,1 424.775,1 431.098,5 402.463,4 393.060,4 -1,77 257.283,3 409.365,8 59,11
JERMAN/GERMANY 32.341,1 27.432,6 35.798,0 34.432,3 37.323,5 5,27 23.751,7 29.721,3 25,13
JEPANG/JAPAN 10.943,8 22.489,2 25.632,7 39.288,9 24.434,2 24,16 18.650,4 26.477,8 41,97
KANADA/CANADA 12.807,1 13.584,9 18.633,6 17.127,8 17.253,0 8,63 10.200,3 17.766,7 74,18
INGGRIS/UNITED KINGDOM 9.787,3 8.905,3 13.247,9 16.478,8 13.882,0 14,05 9.700,9 12.655,3 30,46
NEGARA LAINNYA/OTHER COUNTRIES 102.034,1 121.207,1 132.475,5 134.220,2 138.728,9 7,43 92.565,8 129.314,5 39,70
6109 T-shirts, singlets and other vests; knitted or crocheted 613.553,3 425.362,0 348.574,8 487.040,0 489.762,2 -3,10 319.803,6 423.941,7 32,56
AMERIKA SERIKAT/UNITED STATES 249.463,8 129.164,3 131.604,5 194.115,8 165.223,8 -4,08 110.205,4 156.726,5 42,21
JEPANG/JAPAN 45.034,6 34.640,0 49.294,2 74.597,8 85.911,3 22,86 57.386,4 71.203,8 24,08
KOREA SELATAN/SOUTH OF KOREA 24.368,8 22.067,8 19.046,0 25.687,7 29.014,2 5,14 21.994,1 33.481,6 52,23
JERMAN/GERMANY 34.153,2 30.747,5 31.731,7 32.699,0 28.036,3 -3,28 16.279,3 21.714,5 33,39
AUSTRALIA/AUSTRALIA 5.219,1 3.867,2 3.882,5 8.351,9 18.496,3 39,10 11.262,6 12.568,6 11,60
NEGARA LAINNYA/OTHER COUNTRIES 255.313,7 204.875,2 113.015,9 151.587,9 163.080,2 -11,29 102.675,8 128.246,6 24,90
37

Lanjutan/Continued
Nilai/Value : Ribu/Thousand US$
2012 2013
TABEL 14 : NILAI EKSPOR 100 JENIS BARANG MENURUT NEGARA TUJUAN UTAMA
EXPORT VALUE OF 100 COMMODITIES BY MAIN COUNTRY OF DESTINATION
KODE
CODE
HS
JENIS BARANG
DESCRIPTION OF GOODS
Trend (%)
12-16
Jan-Ags/Jan-Aug Perub. (%)
Change (%)
17-16
No. 08.05.148
2015 2016
2016 2017
2014
6110 Jerseys, pullovers, cardigans, waistcoats and similar articles; knitted or crocheted 841.558,1 924.053,6 837.614,2 619.775,7 677.892,8 -7,98 428.545,5 726.619,9 69,55
AMERIKA SERIKAT/UNITED STATES 557.616,6 573.642,2 543.376,9 417.978,9 455.109,8 -6,97 292.944,4 519.640,9 77,39
JEPANG/JAPAN 62.304,0 98.370,8 82.213,1 61.787,4 65.988,6 -3,44 40.668,2 68.283,1 67,90
JERMAN/GERMANY 53.225,1 50.812,5 46.640,8 27.921,1 29.843,3 -16,10 16.885,1 20.373,2 20,66
KANADA/CANADA 18.762,4 22.859,4 21.163,0 13.584,8 17.650,9 -6,22 13.089,2 15.920,1 21,63
KOREA SELATAN/SOUTH OF KOREA 23.285,1 31.289,8 29.820,1 21.170,7 17.392,0 -9,28 9.205,5 17.775,5 93,10
NEGARA LAINNYA/OTHER COUNTRIES 126.364,9 147.078,8 114.400,5 77.332,8 91.908,1 -12,01 55.753,0 84.627,0 51,79
6201 Overcoats, car-coats, capes, cloaks, anoraks (including ski-jackets), wind-cheaters, wind-
jackets and similar articles, men's or boys', other than those of heading no. 6203 (not
knitted
403.473,2 350.851,4 362.279,4 322.445,9 370.534,3 -2,52 240.476,2 358.307,2
AMERIKA SERIKAT/UNITED STATES 130.934,7 111.967,9 114.784,3 134.690,5 155.499,4 5,43 104.611,0 146.914,9 40,44
BELGIA/BELGIUM 43.485,7 37.431,5 47.475,5 31.368,4 30.190,3 -8,67 18.579,2 25.391,0 36,66
KOREA SELATAN/SOUTH OF KOREA 13.504,6 27.595,5 22.170,7 23.454,4 25.289,6 11,54 14.721,4 24.605,8 67,14
R.R. TIONGKOK/CINA 11.086,1 8.543,0 9.796,3 11.645,3 20.444,7 16,58 12.873,2 28.105,6 118,33
JEPANG/JAPAN 11.038,1 12.033,5 10.451,0 8.174,4 16.069,0 3,71 10.138,7 13.411,7 32,28
NEGARA LAINNYA/OTHER COUNTRIES 193.424,0 153.280,0 157.601,7 113.112,8 123.041,4 -11,38 79.552,9 119.878,3 50,69
6203 Suits, ensembles, jackets, blazers, trousers, bib and brace overalls, breeches and shorts
(other than swimwear); men's or boys' (not knitted or crocheted)
641.441,6 728.398,0 709.427,3 678.374,7 701.771,8 1,09 481.182,2 588.988,4 22,40
AMERIKA SERIKAT/UNITED STATES 258.992,3 289.473,3 276.749,4 295.765,7 314.893,8 4,21 215.847,3 293.509,6 35,98
JEPANG/JAPAN 64.328,1 121.478,9 89.968,8 56.843,3 70.907,3 -5,49 48.221,9 69.499,7 44,12
KOREA SELATAN/SOUTH OF KOREA 34.890,7 39.251,2 40.253,2 52.050,1 51.921,4 11,37 35.739,7 42.409,9 18,66
JERMAN/GERMANY 45.482,4 55.224,0 58.248,6 38.636,2 36.131,7 -7,85 27.060,8 20.104,3 -25,71
R.R. TIONGKOK/CINA 8.780,4 13.390,2 19.759,0 19.687,2 23.758,5 26,82 18.439,8 18.893,6 2,46
NEGARA LAINNYA/OTHER COUNTRIES 228.967,8 209.580,3 224.448,3 215.392,1 204.159,1 -2,00 135.872,7 144.571,5 6,40
6204 Suits, ensembles, jackets, dresses, skirts, divided skirts, trousers, bib and brace overalls,
breeches and shorts (other than swimwear); women's or girls' (not knitted or crocheted)
825.035,6 869.257,9 884.799,7 1.010.701,0 939.973,5 4,20 647.279,9 798.174,0 23,31
AMERIKA SERIKAT/UNITED STATES 495.018,1 533.391,1 512.873,5 552.520,5 531.218,1 1,78 360.186,0 449.064,6 24,68
JEPANG/JAPAN 22.407,3 37.580,8 50.273,3 114.289,9 101.340,1 51,14 67.029,9 98.772,3 47,36
JERMAN/GERMANY 39.998,4 35.939,8 40.723,3 33.070,1 33.988,3 -4,01 24.862,5 29.175,4 17,35
AUSTRALIA/AUSTRALIA 13.928,9 14.751,2 18.414,3 25.335,3 29.176,3 22,38 18.415,3 22.677,5 23,14
INGGRIS/UNITED KINGDOM 32.994,7 30.634,4 31.722,9 28.525,2 28.166,2 -3,80 19.956,2 20.600,6 3,23
NEGARA LAINNYA/OTHER COUNTRIES 220.688,1 216.960,6 230.792,5 256.959,9 216.084,5 1,28 156.830,0 177.883,7 13,42
6205 Shirts; men's or boys' (not knitted or crocheted) 504.892,5 532.951,4 510.401,8 457.125,3 450.771,5 -3,73 298.664,5 361.465,2 21,03
AMERIKA SERIKAT/UNITED STATES 273.903,6 278.886,3 268.462,1 258.841,5 274.828,3 -0,68 178.963,8 219.287,6 22,53
JERMAN/GERMANY 53.492,2 59.107,3 54.110,7 50.049,4 48.235,4 -3,66 31.994,2 35.841,8 12,03
JEPANG/JAPAN 50.961,8 54.452,0 58.676,2 46.847,5 45.996,7 -3,49 31.119,9 37.556,0 20,68
AUSTRALIA/AUSTRALIA 11.005,0 14.879,7 14.453,9 20.052,9 16.013,2 11,05 9.821,4 12.645,7 28,76
KANADA/CANADA 14.163,1 15.937,5 17.050,5 15.714,6 14.810,4 0,76 10.064,1 11.473,8 14,01
NEGARA LAINNYA/OTHER COUNTRIES 101.366,8 109.688,7 97.648,5 65.619,4 50.887,4 -17,24 36.701,1 44.660,3 21,69
38

Lanjutan/Continued
Nilai/Value : Ribu/Thousand US$
2012 2013
TABEL 14 : NILAI EKSPOR 100 JENIS BARANG MENURUT NEGARA TUJUAN UTAMA
EXPORT VALUE OF 100 COMMODITIES BY MAIN COUNTRY OF DESTINATION
KODE
CODE
HS
JENIS BARANG
DESCRIPTION OF GOODS
Trend (%)
12-16
Jan-Ags/Jan-Aug Perub. (%)
Change (%)
17-16
No. 08.05.148
2015 2016
2016 2017
2014
6206 Blouses, shirts and shirt-blouses; women's or girls' (not knitted or crocheted) 497.990,7 564.595,7 586.930,2 600.819,0 559.765,0 3,00 391.797,2 503.502,1 28,51
AMERIKA SERIKAT/UNITED STATES 298.052,5 330.430,5 332.494,5 341.128,5 317.532,4 1,60 216.890,9 309.532,5 42,71
JERMAN/GERMANY 67.159,4 61.550,5 69.576,8 66.068,1 62.249,1 -0,81 43.469,6 49.346,9 13,52
JEPANG/JAPAN 30.888,2 44.293,8 38.838,2 31.649,9 29.569,6 -4,15 21.924,2 21.980,6 0,26
PERSERIKATAN EMIRAT ARAB/UNITED ARAB EMIRATES 4.051,5 5.640,7 11.346,4 17.351,7 14.459,4 44,31 10.447,7 9.442,3 -9,62
BELGIA/BELGIUM 4.136,3 5.311,9 9.125,7 12.241,5 13.599,9 37,93 10.256,3 8.727,1 -14,91
NEGARA LAINNYA/OTHER COUNTRIES 93.702,8 117.368,3 125.548,4 132.379,2 122.354,7 6,76 88.808,6 104.472,8 17,64
6212 Brassieres, girdles, corsets, braces, suspenders, garters and similar articles and parts
thereof; whether or not knitted or crocheted
323.414,8 326.865,9 325.126,8 383.571,6 351.151,0 3,30 234.960,1 317.906,8 35,30
AMERIKA SERIKAT/UNITED STATES 182.180,8 182.457,9 162.200,1 208.670,2 167.638,1 -0,32 113.010,6 154.500,8 36,71
JERMAN/GERMANY 28.441,0 31.002,0 36.742,4 35.501,6 41.839,4 9,50 28.446,6 29.879,5 5,04
JEPANG/JAPAN 8.568,2 7.572,3 19.316,8 15.268,8 24.426,0 32,27 16.644,0 19.675,3 18,21
AUSTRALIA/AUSTRALIA 16.975,8 21.590,7 23.118,5 21.845,1 20.934,4 4,40 14.501,2 17.957,2 23,83
INGGRIS/UNITED KINGDOM 18.875,3 15.670,2 17.519,2 18.795,2 16.952,9 -0,33 12.029,5 18.496,9 53,76
NEGARA LAINNYA/OTHER COUNTRIES 68.373,7 68.572,8 66.229,9 83.490,6 79.360,2 5,07 50.328,2 77.397,1 53,78
6402 Footwear; with outer soles and uppers of rubber or plastics (excluding waterproof
footwear)
540.446,0 536.220,8 643.464,1 554.391,8 512.507,5 -0,73 313.705,4 447.554,2 42,67
AMERIKA SERIKAT/UNITED STATES 163.508,4 174.540,3 242.162,2 203.309,6 163.353,1 1,52 92.947,8 125.009,4 34,49
JEPANG/JAPAN 38.997,3 44.230,4 52.525,3 46.268,6 50.175,2 5,64 34.558,3 41.623,6 20,44
BELGIA/BELGIUM 50.606,1 33.931,9 55.771,3 44.195,7 43.289,1 -0,48 25.762,7 45.933,8 78,30
R.R. TIONGKOK/CINA 10.124,6 11.656,0 23.211,9 20.431,1 40.177,8 39,35 25.486,8 25.885,1 1,56
JERMAN/GERMANY 31.740,2 29.019,9 27.694,7 23.900,2 21.722,3 -9,09 14.511,9 28.193,4 94,28
NEGARA LAINNYA/OTHER COUNTRIES 245.469,3 242.842,3 242.098,8 216.286,7 193.790,0 -5,72 120.437,8 180.909,0 50,21
6403 Footwear; with outer soles of rubber, plastics, leather or composition leather and uppers
of leather
2.195.930,3 2.272.075,5 2.233.324,2 2.303.477,6 2.260.269,7 0,72 1.441.492,1 2.083.510,7 44,54
AMERIKA SERIKAT/UNITED STATES 570.191,6 597.826,6 590.401,8 598.411,6 571.341,2 0,05 360.023,0 583.740,3 62,14
JERMAN/GERMANY 178.959,8 173.994,9 165.859,9 199.488,3 223.690,0 6,00 132.454,3 176.761,6 33,45
R.R. TIONGKOK/CINA 91.783,2 103.651,1 136.158,5 177.693,8 172.695,5 19,76 108.247,3 197.342,1 82,31
BELGIA/BELGIUM 205.291,2 207.639,3 188.780,4 188.335,9 168.422,0 -4,82 109.315,4 161.631,2 47,86
INGGRIS/UNITED KINGDOM 176.179,6 172.849,9 177.738,4 180.270,4 133.216,0 -5,04 88.569,3 118.094,1 33,34
NEGARA LAINNYA/OTHER COUNTRIES 973.524,8 1.016.113,8 974.385,3 959.277,6 990.905,0 -0,22 642.882,7 845.941,3 31,59
6404 Footwear; with outer soles of rubber, plastics, leather or composition leather and uppers
of textile materials
671.281,4 905.619,6 1.065.774,7 1.474.816,5 1.707.373,5 26,55 1.170.120,3 1.347.980,7 15,20
AMERIKA SERIKAT/UNITED STATES 143.818,9 248.731,0 275.904,2 448.273,5 542.414,0 38,32 383.363,0 381.672,2 -0,44
R.R. TIONGKOK/CINA 22.093,9 27.447,9 60.471,0 111.149,8 177.830,2 74,54 126.092,4 176.573,5 40,03
BELGIA/BELGIUM 43.628,2 55.188,2 98.203,1 119.592,8 128.917,1 34,18 90.151,6 94.874,3 5,24
JEPANG/JAPAN 64.397,3 84.170,5 88.199,9 100.503,0 126.749,7 16,55 82.924,2 114.465,8 38,04
BELANDA/NETHERLANDS 46.328,9 51.901,5 48.709,2 75.169,1 84.767,0 17,10 54.384,2 84.164,7 54,76
NEGARA LAINNYA/OTHER COUNTRIES 351.014,3 438.180,6 494.287,3 620.128,4 646.695,5 16,99 433.204,8 496.230,3 14,55
39

Lanjutan/Continued
Nilai/Value : Ribu/Thousand US$
2012 2013
TABEL 14 : NILAI EKSPOR 100 JENIS BARANG MENURUT NEGARA TUJUAN UTAMA
EXPORT VALUE OF 100 COMMODITIES BY MAIN COUNTRY OF DESTINATION
KODE
CODE
HS
JENIS BARANG
DESCRIPTION OF GOODS
Trend (%)
12-16
Jan-Ags/Jan-Aug Perub. (%)
Change (%)
17-16
No. 08.05.148
2015 2016
2016 2017
2014
6704 Wigs, false beards, eyebrows and eyelashes, switches and the like, of human or animal
hair or of textile materials; articles of human hair, n.e.c. or included
270.780,3 297.322,8 311.725,4 340.871,9 381.962,8 8,60 245.390,2 362.364,0 47,67
AMERIKA SERIKAT/UNITED STATES 185.571,6 205.723,5 200.812,4 224.856,8 252.471,0 7,30 166.007,6 241.418,7 45,43
MALAYSIA/MALAYSIA 101,2 39,2 1.042,6 42.587,0 50.359,6 596,64 30.028,2 51.377,6 71,10
INGGRIS/UNITED KINGDOM 21.035,7 16.152,2 18.026,7 13.468,6 18.792,0 -3,99 11.027,0 16.405,9 48,78
JERMAN/GERMANY 9.464,0 11.504,1 12.254,6 13.794,8 13.058,5 8,60 8.369,3 12.016,2 43,57
KOREA SELATAN/SOUTH OF KOREA 8.767,8 9.212,2 9.232,1 9.769,4 10.126,2 3,53 6.598,4 9.291,8 40,82
NEGARA LAINNYA/OTHER COUNTRIES 45.840,0 54.691,5 70.357,1 36.395,2 37.155,5 -7,94 23.359,8 31.853,9 36,36
7108 Gold (including gold plated with platinum) unwrought or in semi-manufactured forms, or in
powder form
2.006.180,6 1.817.465,0 1.504.594,1 1.377.388,0 1.373.479,0 -9,83 861.418,1 1.491.051,6 73,09
SINGAPURA/SINGAPORE 351.860,1 564.589,0 684.887,5 1.280.936,3 1.133.178,5 37,14 724.547,4 1.202.518,3 65,97
HONGKONG/HONG KONG 56.745,8 502.422,6 562.509,7 64.034,1 139.405,8 -2,59 108.805,9 123.222,7 13,25
AUSTRALIA/AUSTRALIA 804.756,3 201.394,6 17.126,3 26.608,9 35.033,4 -56,36 22.762,2 23.585,0 3,61
INGGRIS/UNITED KINGDOM - - - - 30.049,0 - - 3.851,1 -
SWISS/SWITZERLAND - - - - 27.510,6 - - 47.173,8 -
NEGARA LAINNYA/OTHER COUNTRIES 792.818,4 549.058,7 240.070,6 5.808,7 8.301,6 -74,51 5.302,6 90.700,7 1610,49
7112 Waste and scrap of precious metal or of metal clad with precious metal; other waste and
scrap containing precious metal compounds, of a kind uses principally for the recovery of
precious
940.794,5 622.853,5 886.719,5 685.461,9 736.510,7 -3,86 492.661,6 738.846,2 49,97
JEPANG/JAPAN 940.546,0 619.343,5 856.534,3 654.083,9 717.748,2 -4,74 475.751,6 735.052,7 54,50
SINGAPURA/SINGAPORE 0,1 1,2 26.972,0 24.636,1 12.770,0 2548,93 12.770,0 49,1 -99,62
THAILAND/THAILAND - 1.092,8 2.311,2 2.607,7 3.448,8 - 2.348,7 2.805,0 19,43
R.R. TIONGKOK/CINA - - 0,9 117,7 1.318,0 - 869,5 141,1 -83,78
HONGKONG/HONG KONG 38,8 1.327,3 892,9 797,2 1.214,8 89,24 911,9 735,4 -19,36
NEGARA LAINNYA/OTHER COUNTRIES 209,6 1.088,7 8,2 3.219,5 11,0 -38,23 - 62,8 -
7113 Jewellery articles and parts thereof, of precious metal or of metal clad with precious metal 157.499,1 177.425,1 2.114.581,5 3.287.912,6 4.078.827,7 156,71 3.488.262,0 2.394.608,5 -31,35
SWISS/SWITZERLAND 3.125,7 198,5 15.560,7 938.428,2 2.066.220,5 754,12 1.837.044,1 1.048.534,7 -42,92
SINGAPURA/SINGAPORE 21.299,9 16.697,0 238.045,5 374.299,6 942.276,8 191,22 854.683,6 720.101,1 -15,75
HONGKONG/HONG KONG 36.479,5 27.233,1 364.437,0 427.001,5 462.501,1 118,85 328.792,9 319.507,5 -2,82
PERSERIKATAN EMIRAT ARAB/UNITED ARAB EMIRATES 14.115,3 18.245,9 380.907,2 248.000,8 226.300,0 126,11 148.784,0 140.095,7 -5,84
REP.AFRIKA SELATAN/SOUTH AFRICA 5.292,3 8.914,3 547.521,9 12.309,8 118.709,7 92,39 118.694,9 0,7 -100,00
NEGARA LAINNYA/OTHER COUNTRIES 77.186,4 106.136,4 568.109,2 1.287.872,7 262.819,5 63,99 200.262,5 166.368,8 -16,92
7201 Pig iron and spiegeleisen in pigs, blocks or other primary forms 5.037,6 38.948,6 130.421,3 184.885,1 533.336,3 196,89 393.120,8 165.316,6 -57,95
R.R. TIONGKOK/CINA 1,1 - 2.017,7 106.153,3 464.979,6 - 351.892,7 131.566,6 -62,61
TAIWAN/TAIWAN, PROVINCE OF CINA 4.390,8 23.502,0 46.396,0 40.210,7 36.040,8 60,76 21.422,4 24.142,7 12,70
INDIA/INDIA 473,1 9.068,3 7.496,3 14.981,9 20.394,2 123,21 9.301,8 5.430,6 -41,62
THAILAND/THAILAND - 2.349,3 30.739,1 18.738,5 5.659,3 - 5.659,3 1.800,0 -68,19
KOREA SELATAN/SOUTH OF KOREA - - 16.745,2 1.333,3 3.415,5 - 2.889,5 2.376,6 -17,75
NEGARA LAINNYA/OTHER COUNTRIES 172,6 4.029,0 27.027,0 3.467,4 2.846,8 72,55 1.955,0 0,0 -100,00
40

Lanjutan/Continued
Nilai/Value : Ribu/Thousand US$
2012 2013
TABEL 14 : NILAI EKSPOR 100 JENIS BARANG MENURUT NEGARA TUJUAN UTAMA
EXPORT VALUE OF 100 COMMODITIES BY MAIN COUNTRY OF DESTINATION
KODE
CODE
HS
JENIS BARANG
DESCRIPTION OF GOODS
Trend (%)
12-16
Jan-Ags/Jan-Aug Perub. (%)
Change (%)
17-16
No. 08.05.148
2015 2016
2016 2017
2014
7202 Ferro-alloys 369.169,1 249.848,5 331.762,3 349.086,3 589.026,5 13,53 237.257,6 1.110.344,0 367,99
R.R. TIONGKOK/CINA 11.435,0 2.389,8 41.606,3 184.628,2 426.897,2 218,58 141.871,9 945.685,1 566,58
KOREA SELATAN/SOUTH OF KOREA 104.432,6 90.449,6 106.821,7 67.364,5 88.628,6 -6,04 53.928,6 55.283,9 2,51
INDIA/INDIA - 81,7 4.534,3 23.577,2 51.846,4 - 29.605,9 78.122,8 163,88
TAIWAN/TAIWAN, PROVINCE OF CINA 5.815,5 3.069,0 19.182,2 8.390,9 12.117,0 28,07 4.521,6 24.681,3 445,86
JEPANG/JAPAN 8.502,6 11.196,7 19.909,4 6.920,0 3.430,7 -20,52 2.979,2 653,2 -78,07
NEGARA LAINNYA/OTHER COUNTRIES 238.983,5 142.661,7 139.708,4 58.205,6 6.106,5 -56,09 4.350,5 5.917,8 36,03
7308 Structures of iron or steel and parts thereof; plates, rods, angles, shapes, sections, tubes
and the like, prepared for use in structures
427.400,4 580.851,2 691.507,5 247.445,4 701.271,9 1,38 489.805,1 138.938,7 -71,63
AUSTRALIA/AUSTRALIA 125.135,9 342.263,7 455.511,9 64.337,3 470.755,9 10,28 366.577,9 17.364,8 -95,26
AMERIKA SERIKAT/UNITED STATES 50.212,4 370,4 76.078,0 76.864,5 85.796,4 89,77 62.775,6 42.704,9 -31,97
SINGAPURA/SINGAPORE 117.857,2 98.531,6 42.937,1 17.359,3 56.646,7 -27,40 21.888,2 33.375,8 52,48
FEDERASI RUSIA/RUSSIA FEDERATION 130,2 - 0,7 - 32.309,6 - - 1,1 -
MALAYSIA/MALAYSIA 12.725,2 40.484,7 14.768,1 5.170,0 12.215,1 -19,26 3.817,7 20.344,0 432,89
NEGARA LAINNYA/OTHER COUNTRIES 121.339,4 99.200,8 102.211,8 83.714,3 43.548,1 -19,90 34.745,7 25.148,3 -27,62
7403 Copper; refined and copper alloys, unwrought 556.098,1 525.860,5 757.179,3 553.843,8 788.588,8 7,79 443.723,5 895.906,5 101,91
MALAYSIA/MALAYSIA 251.104,6 249.132,3 239.856,4 231.318,5 292.009,4 2,30 197.234,8 345.001,2 74,92
VIETNAM/VIET NAM 31.082,6 47.991,5 73.754,0 79.868,7 186.086,3 50,51 99.439,2 164.423,0 65,35
THAILAND/THAILAND 187.341,1 152.696,9 197.891,3 115.816,7 151.298,8 -6,80 83.139,5 206.162,8 147,97
R.R. TIONGKOK/CINA 48.683,9 52.696,8 119.408,2 81.313,5 67.421,3 11,46 27.114,8 96.799,4 257,00
TAIWAN/TAIWAN, PROVINCE OF CINA 24.312,1 16.547,2 55.220,5 35.716,1 47.695,0 23,58 30.712,1 41.378,0 34,73
NEGARA LAINNYA/OTHER COUNTRIES 13.573,8 6.795,8 71.048,8 9.810,3 44.078,0 31,30 6.083,2 42.142,2 592,76
7408 Copper wire 913.382,1 853.258,0 762.736,7 641.214,5 499.973,3 -13,85 322.284,5 447.777,2 38,94
INDIA/INDIA 2.581,7 13.288,8 25.484,5 71.673,1 118.697,2 154,50 72.454,3 148.712,3 105,25
R.R. TIONGKOK/CINA 211.168,0 209.652,2 170.166,5 120.253,1 113.713,1 -16,42 66.061,6 125.398,4 89,82
MALAYSIA/MALAYSIA 220.338,1 170.398,7 171.521,4 116.663,2 83.124,0 -20,77 55.763,5 69.772,5 25,12
THAILAND/THAILAND 175.886,8 174.205,4 149.320,4 114.678,5 61.740,2 -22,21 43.889,8 47.008,5 7,11
VIETNAM/VIET NAM 97.215,7 122.054,5 130.736,6 99.123,6 61.728,1 -10,56 40.390,7 14.838,3 -63,26
NEGARA LAINNYA/OTHER COUNTRIES 206.191,8 163.658,3 115.507,2 118.822,9 60.970,8 -24,10 43.724,6 42.047,0 -3,84
7501 Nickel mattes; nickel oxide sinters and other intermediate products of nickel metallurgy 981.839,0 921.889,9 1.038.074,3 789.745,9 584.143,3 -11,25 348.115,7 494.402,6 42,02
JEPANG/JAPAN 981.839,0 921.889,9 1.038.074,3 789.745,9 584.143,3 -11,25 348.115,7 494.402,6 42,02
- - - - - - - - - -
- - - - - - - - - -
- - - - - - - - - -
- - - - - - - - - -
NEGARA LAINNYA/OTHER COUNTRIES - - - - - - - - -
41
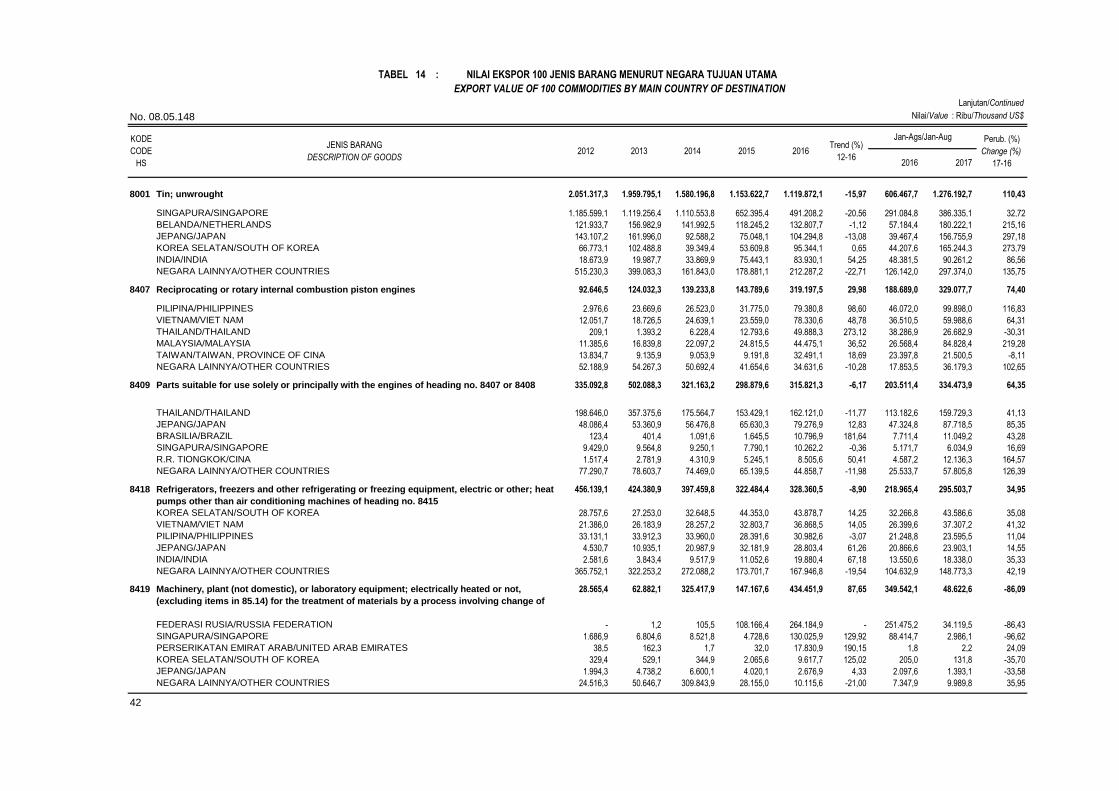
Lanjutan/Continued
Nilai/Value : Ribu/Thousand US$
2012 2013
TABEL 14 : NILAI EKSPOR 100 JENIS BARANG MENURUT NEGARA TUJUAN UTAMA
EXPORT VALUE OF 100 COMMODITIES BY MAIN COUNTRY OF DESTINATION
KODE
CODE
HS
JENIS BARANG
DESCRIPTION OF GOODS
Trend (%)
12-16
Jan-Ags/Jan-Aug Perub. (%)
Change (%)
17-16
No. 08.05.148
2015 2016
2016 2017
2014
8001 Tin; unwrought 2.051.317,3 1.959.795,1 1.580.196,8 1.153.622,7 1.119.872,1 -15,97 606.467,7 1.276.192,7 110,43
SINGAPURA/SINGAPORE 1.185.599,1 1.119.256,4 1.110.553,8 652.395,4 491.208,2 -20,56 291.084,8 386.335,1 32,72
BELANDA/NETHERLANDS 121.933,7 156.982,9 141.992,5 118.245,2 132.807,7 -1,12 57.184,4 180.222,1 215,16
JEPANG/JAPAN 143.107,2 161.996,0 92.588,2 75.048,1 104.294,8 -13,08 39.467,4 156.755,9 297,18
KOREA SELATAN/SOUTH OF KOREA 66.773,1 102.488,8 39.349,4 53.609,8 95.344,1 0,65 44.207,6 165.244,3 273,79
INDIA/INDIA 18.673,9 19.987,7 33.869,9 75.443,1 83.930,1 54,25 48.381,5 90.261,2 86,56
NEGARA LAINNYA/OTHER COUNTRIES 515.230,3 399.083,3 161.843,0 178.881,1 212.287,2 -22,71 126.142,0 297.374,0 135,75
8407 Reciprocating or rotary internal combustion piston engines 92.646,5 124.032,3 139.233,8 143.789,6 319.197,5 29,98 188.689,0 329.077,7 74,40
PILIPINA/PHILIPPINES 2.976,6 23.669,6 26.523,0 31.775,0 79.380,8 98,60 46.072,0 99.898,0 116,83
VIETNAM/VIET NAM 12.051,7 18.726,5 24.639,1 23.559,0 78.330,6 48,78 36.510,5 59.988,6 64,31
THAILAND/THAILAND 209,1 1.393,2 6.228,4 12.793,6 49.888,3 273,12 38.286,9 26.682,9 -30,31
MALAYSIA/MALAYSIA 11.385,6 16.839,8 22.097,2 24.815,5 44.475,1 36,52 26.568,4 84.828,4 219,28
TAIWAN/TAIWAN, PROVINCE OF CINA 13.834,7 9.135,9 9.053,9 9.191,8 32.491,1 18,69 23.397,8 21.500,5 -8,11
NEGARA LAINNYA/OTHER COUNTRIES 52.188,9 54.267,3 50.692,4 41.654,6 34.631,6 -10,28 17.853,5 36.179,3 102,65
8409 Parts suitable for use solely or principally with the engines of heading no. 8407 or 8408 335.092,8 502.088,3 321.163,2 298.879,6 315.821,3 -6,17 203.511,4 334.473,9 64,35
THAILAND/THAILAND 198.646,0 357.375,6 175.564,7 153.429,1 162.121,0 -11,77 113.182,6 159.729,3 41,13
JEPANG/JAPAN 48.086,4 53.360,9 56.476,8 65.630,3 79.276,9 12,83 47.324,8 87.718,5 85,35
BRASILIA/BRAZIL 123,4 401,4 1.091,6 1.645,5 10.796,9 181,64 7.711,4 11.049,2 43,28
SINGAPURA/SINGAPORE 9.429,0 9.564,8 9.250,1 7.790,1 10.262,2 -0,36 5.171,7 6.034,9 16,69
R.R. TIONGKOK/CINA 1.517,4 2.781,9 4.310,9 5.245,1 8.505,6 50,41 4.587,2 12.136,3 164,57
NEGARA LAINNYA/OTHER COUNTRIES 77.290,7 78.603,7 74.469,0 65.139,5 44.858,7 -11,98 25.533,7 57.805,8 126,39
8418 Refrigerators, freezers and other refrigerating or freezing equipment, electric or other; heat
pumps other than air conditioning machines of heading no. 8415
456.139,1 424.380,9 397.459,8 322.484,4 328.360,5 -8,90 218.965,4 295.503,7 34,95
KOREA SELATAN/SOUTH OF KOREA 28.757,6 27.253,0 32.648,5 44.353,0 43.878,7 14,25 32.266,8 43.586,6 35,08
VIETNAM/VIET NAM 21.386,0 26.183,9 28.257,2 32.803,7 36.868,5 14,05 26.399,6 37.307,2 41,32
PILIPINA/PHILIPPINES 33.131,1 33.912,3 33.960,0 28.391,6 30.982,6 -3,07 21.248,8 23.595,5 11,04
JEPANG/JAPAN 4.530,7 10.935,1 20.987,9 32.181,9 28.803,4 61,26 20.866,6 23.903,1 14,55
INDIA/INDIA 2.581,6 3.843,4 9.517,9 11.052,6 19.880,4 67,18 13.550,6 18.338,0 35,33
NEGARA LAINNYA/OTHER COUNTRIES 365.752,1 322.253,2 272.088,2 173.701,7 167.946,8 -19,54 104.632,9 148.773,3 42,19
8419 Machinery, plant (not domestic), or laboratory equipment; electrically heated or not,
(excluding items in 85.14) for the treatment of materials by a process involving change of
28.565,4 62.882,1 325.417,9 147.167,6 434.451,9 87,65 349.542,1 48.622,6 -86,09
FEDERASI RUSIA/RUSSIA FEDERATION - 1,2 105,5 108.166,4 264.184,9 - 251.475,2 34.119,5 -86,43
SINGAPURA/SINGAPORE 1.686,9 6.804,6 8.521,8 4.728,6 130.025,9 129,92 88.414,7 2.986,1 -96,62
PERSERIKATAN EMIRAT ARAB/UNITED ARAB EMIRATES 38,5 162,3 1,7 32,0 17.830,9 190,15 1,8 2,2 24,09
KOREA SELATAN/SOUTH OF KOREA 329,4 529,1 344,9 2.065,6 9.617,7 125,02 205,0 131,8 -35,70
JEPANG/JAPAN 1.994,3 4.738,2 6.600,1 4.020,1 2.676,9 4,33 2.097,6 1.393,1 -33,58
NEGARA LAINNYA/OTHER COUNTRIES 24.516,3 50.646,7 309.843,9 28.155,0 10.115,6 -21,00 7.347,9 9.989,8 35,95
42

Lanjutan/Continued
Nilai/Value : Ribu/Thousand US$
2012 2013
TABEL 14 : NILAI EKSPOR 100 JENIS BARANG MENURUT NEGARA TUJUAN UTAMA
EXPORT VALUE OF 100 COMMODITIES BY MAIN COUNTRY OF DESTINATION
KODE
CODE
HS
JENIS BARANG
DESCRIPTION OF GOODS
Trend (%)
12-16
Jan-Ags/Jan-Aug Perub. (%)
Change (%)
17-16
No. 08.05.148
2015 2016
2016 2017
2014
8443 Printing machinery; used for printing by means of plates, cylinders and other printing
components of heading 84.42; other printers, copying machines and facsimile machines,
1.826.819,9 1.537.449,5 1.593.788,2 1.531.098,6 1.358.024,7 -5,80 855.518,1 1.311.416,9 53,29
AMERIKA SERIKAT/UNITED STATES 466.201,8 392.423,0 466.288,5 450.923,5 417.727,2 -0,80 269.563,2 403.296,6 49,61
JERMAN/GERMANY 347.596,7 232.194,5 251.785,4 241.114,1 250.213,7 -6,01 166.218,4 229.185,7 37,88
JEPANG/JAPAN 418.699,8 359.573,9 393.138,1 308.106,8 248.342,6 -11,30 118.356,8 221.395,6 87,06
SINGAPURA/SINGAPORE 140.418,5 164.392,0 110.616,5 188.191,6 117.563,6 -2,18 84.872,5 108.805,1 28,20
PILIPINA/PHILIPPINES 46.409,6 95.569,7 68.561,9 65.080,5 67.399,5 3,69 44.454,0 67.347,1 51,50
NEGARA LAINNYA/OTHER COUNTRIES 407.493,5 293.296,4 303.397,7 277.682,1 256.778,2 -9,32 172.053,2 281.386,7 63,55
8471 Automatic data processing machines and units thereof, magnetic or optical readers,
machines for transcribing data onto data media in coded form and machines for
processing such data, not
429.161,4 310.465,0 380.225,4 250.493,5 273.130,3 -10,58 168.136,8 252.563,0 50,21
SINGAPURA/SINGAPORE 271.529,3 201.269,1 268.613,0 149.394,5 165.570,4 -12,08 99.408,8 135.375,7 36,18
AMERIKA SERIKAT/UNITED STATES 37.700,5 28.917,0 29.949,5 28.243,2 33.410,8 -2,62 21.808,2 32.316,2 48,18
IRLANDIA/IRELAND 3.495,8 5.182,1 9.831,8 9.055,7 13.777,6 39,11 9.111,6 23.785,4 161,04
JEPANG/JAPAN 14.919,5 14.354,4 13.913,1 10.496,1 10.784,8 -9,17 6.568,2 10.712,4 63,10
R.R. TIONGKOK/CINA 9.185,5 13.033,5 14.521,2 9.750,8 9.416,1 -2,38 6.693,5 8.518,9 27,27
NEGARA LAINNYA/OTHER COUNTRIES 92.330,7 47.708,8 43.396,7 43.553,3 40.170,7 -16,10 24.546,5 41.854,4 70,51
8504 Electric transformers, static converters (e.g. rectifiers) and inductors 578.805,5 475.800,4 441.781,0 450.965,3 392.598,8 -7,96 256.276,9 434.843,9 69,68
SINGAPURA/SINGAPORE 98.489,3 105.604,3 97.432,4 79.541,7 79.366,4 -6,90 43.740,9 181.857,1 315,76
PERANCIS/FRANCE 74.783,5 81.933,8 78.580,2 79.854,3 70.680,4 -1,38 46.352,6 70.591,9 52,29
JEPANG/JAPAN 87.640,6 70.811,6 75.399,0 62.369,7 51.100,7 -11,36 33.964,5 41.222,2 21,37
MALAYSIA/MALAYSIA 53.052,8 51.861,6 32.140,0 40.962,4 38.221,4 -8,53 25.800,2 30.612,2 18,65
R.R. TIONGKOK/CINA 32.384,6 39.531,3 37.680,0 42.290,3 37.132,5 3,47 24.393,4 30.263,3 24,06
NEGARA LAINNYA/OTHER COUNTRIES 232.454,8 126.057,7 120.549,4 145.946,8 116.097,4 -11,68 82.025,3 80.297,1 -2,11
8506 Cells and batteries; primary 333.602,9 396.691,2 452.071,1 481.468,4 463.568,3 8,89 303.221,8 425.300,0 40,26
SINGAPURA/SINGAPORE 62.511,3 77.699,7 92.820,9 92.660,7 91.911,4 9,93 62.920,6 80.347,7 27,70
AMERIKA SERIKAT/UNITED STATES 29.746,7 35.299,5 45.281,1 61.783,4 66.997,0 24,40 40.075,3 59.648,2 48,84
JEPANG/JAPAN 37.196,0 60.098,5 54.970,8 67.766,5 62.618,8 12,32 42.129,3 58.759,6 39,47
HONGKONG/HONG KONG 33.373,3 35.571,9 43.947,1 42.662,0 41.154,6 6,19 26.260,8 41.405,4 57,67
BELANDA/NETHERLANDS 14.244,7 20.894,1 35.241,1 38.194,1 22.906,4 16,80 14.062,2 23.792,3 69,19
NEGARA LAINNYA/OTHER COUNTRIES 156.530,9 167.127,4 179.810,1 178.401,6 177.980,1 3,27 117.773,5 161.346,9 37,00
8507 Electric accumulators, including separators therefor; whether or not rectangular (including
square)
412.761,0 346.827,0 307.272,5 288.420,5 308.635,5 -7,37 199.512,0 210.220,3 5,37
MALAYSIA/MALAYSIA 34.472,6 28.199,1 26.313,3 33.386,1 47.738,4 8,55 30.400,5 26.869,5 -11,62
SINGAPURA/SINGAPORE 116.710,8 74.130,0 59.494,7 48.336,7 46.849,8 -20,17 33.322,6 4.470,1 -86,59
INGGRIS/UNITED KINGDOM 30.954,1 35.298,1 26.999,1 35.994,6 42.506,9 6,76 26.360,8 34.399,7 30,50
JEPANG/JAPAN 33.929,2 36.703,5 28.188,9 11.072,3 15.846,4 -23,82 9.368,6 6.678,8 -28,71
PERSERIKATAN EMIRAT ARAB/UNITED ARAB EMIRATES 21.702,8 26.106,3 27.977,2 19.163,4 14.701,1 -10,31 10.621,5 13.901,9 30,88
NEGARA LAINNYA/OTHER COUNTRIES 174.991,5 146.390,0 138.299,2 140.467,4 140.992,8 -4,62 89.437,9 123.900,3 38,53
43

Lanjutan/Continued
Nilai/Value : Ribu/Thousand US$
2012 2013
TABEL 14 : NILAI EKSPOR 100 JENIS BARANG MENURUT NEGARA TUJUAN UTAMA
EXPORT VALUE OF 100 COMMODITIES BY MAIN COUNTRY OF DESTINATION
KODE
CODE
HS
JENIS BARANG
DESCRIPTION OF GOODS
Trend (%)
12-16
Jan-Ags/Jan-Aug Perub. (%)
Change (%)
17-16
No. 08.05.148
2015 2016
2016 2017
2014
8518 Microphones and their stands; loudspeakers, mounted or not in their enclosures;
headphones and earphones, combined or not with a microphone, and sets of a
microphone and one or more
328.923,3 386.872,6 379.263,9 354.054,0 331.840,5 -0,71 222.842,9 256.754,1 15,22
AMERIKA SERIKAT/UNITED STATES 38.200,9 79.626,4 80.482,4 87.502,8 77.424,3 16,27 51.263,1 54.248,4 5,82
JEPANG/JAPAN 35.192,9 35.912,3 38.143,3 33.951,1 33.669,3 -1,44 22.075,2 25.993,2 17,75
SINGAPURA/SINGAPORE 51.049,5 46.033,7 46.488,4 34.652,3 32.277,0 -11,32 21.440,4 27.514,4 28,33
R.R. TIONGKOK/CINA 46.434,6 53.419,4 47.386,4 33.411,1 28.460,1 -13,48 20.394,6 19.117,6 -6,26
JERMAN/GERMANY 16.619,1 20.768,3 23.182,8 29.710,4 28.387,5 15,36 19.022,2 20.148,5 5,92
NEGARA LAINNYA/OTHER COUNTRIES 141.426,2 151.112,5 143.580,7 134.826,4 131.622,2 -2,54 88.647,4 109.732,0 23,78
8521 Video recording or reproducing apparatus 657.895,4 562.126,3 538.097,7 474.623,7 382.667,5 -11,78 259.783,0 174.835,7 -32,70
AMERIKA SERIKAT/UNITED STATES 63.178,8 79.313,2 149.900,8 175.000,7 144.534,1 27,72 93.686,7 91.057,3 -2,81
KOREA SELATAN/SOUTH OF KOREA 46.655,2 83.473,7 86.259,4 74.441,7 64.868,8 5,60 46.118,6 687,5 -98,51
SLOVAKIA/SLOVAKIA 11.112,9 7.204,8 2.661,0 13.747,1 26.049,1 26,49 16.214,0 10.620,1 -34,50
PERANCIS/FRANCE 37.804,2 24.932,7 33.340,8 26.854,2 19.839,6 -11,44 13.615,8 7.823,9 -42,54
INGGRIS/UNITED KINGDOM 26.360,1 16.614,5 6.053,7 9.044,1 15.639,0 -15,23 8.660,6 12.159,1 40,40
NEGARA LAINNYA/OTHER COUNTRIES 472.784,1 350.587,4 259.882,0 175.536,0 111.736,9 -30,07 81.487,5 52.487,8 -35,59
8528 Monitors and projectors, not incorporating television reception apparatus; reception
apparatus for television, whether or not incorporating radio-broadcast receivers or sound
or video
1.347.309,3 1.151.682,8 1.052.682,2 1.034.120,1 976.322,2 -7,24 627.800,8 762.347,9 21,43
AMERIKA SERIKAT/UNITED STATES 265.671,8 247.486,6 222.745,1 255.819,2 315.376,2 3,83 198.779,5 180.908,6 -8,99
BELANDA/NETHERLANDS 34.763,3 115.368,9 70.466,5 128.360,1 107.638,2 26,71 78.358,9 104.963,1 33,95
MALAYSIA/MALAYSIA 54.724,9 46.416,8 45.834,3 53.947,9 73.353,7 7,64 43.831,0 80.839,1 84,43
THAILAND/THAILAND 124.061,4 77.303,2 80.055,4 75.912,7 52.674,3 -15,90 36.081,8 88.455,0 145,15
INGGRIS/UNITED KINGDOM 64.958,4 52.744,3 41.557,2 15.284,0 45.488,8 -17,73 17.798,9 104,1 -99,42
NEGARA LAINNYA/OTHER COUNTRIES 803.129,5 612.363,0 592.023,7 504.796,2 381.791,0 -15,47 252.950,6 307.078,0 21,40
8529 Transmission apparatus; parts suitable for use solely or principally with the apparatus of
heading no. 8525 to 8528
475.571,1 512.438,1 455.912,0 369.050,7 287.921,9 -12,47 203.652,0 190.186,5 -6,61
KOREA SELATAN/SOUTH OF KOREA 78.259,0 72.615,9 99.058,7 89.073,0 68.769,8 -0,54 48.021,6 60.521,8 26,03
SINGAPURA/SINGAPORE 76.074,9 88.970,9 74.168,4 56.279,4 51.526,9 -11,64 40.254,3 35.056,5 -12,91
AMERIKA SERIKAT/UNITED STATES 15.327,1 15.158,9 45.181,4 69.106,0 31.916,1 34,77 26.867,9 5.864,9 -78,17
POLANDIA/POLAND 43.447,0 57.675,8 51.725,3 36.038,1 26.488,4 -13,58 14.713,2 23.382,1 58,92
R.R. TIONGKOK/CINA 83.651,7 33.539,4 17.876,2 15.435,6 24.604,8 -27,56 14.751,2 21.621,4 46,57
NEGARA LAINNYA/OTHER COUNTRIES 178.811,3 244.477,3 167.902,0 103.118,7 84.615,8 -21,02 59.043,8 43.739,7 -25,92
8532 Electrical capacitors; fixed, variable or adjustable (pre-set) 479.888,0 479.860,3 509.173,0 502.281,3 496.575,1 1,15 319.738,1 445.879,0 39,45
SINGAPURA/SINGAPORE 198.748,9 230.981,8 219.476,7 188.930,3 211.119,0 -0,80 138.698,3 204.267,2 47,27
HONGKONG/HONG KONG 74.340,6 69.240,4 94.879,7 114.340,8 95.755,9 10,60 59.127,5 86.162,9 45,72
TAIWAN/TAIWAN, PROVINCE OF CINA 95.076,0 53.086,9 50.259,6 60.905,0 51.247,0 -10,40 30.545,6 38.071,8 24,64
R.R. TIONGKOK/CINA 55.840,8 54.582,1 53.940,9 49.999,9 47.949,9 -3,85 31.850,4 34.332,0 7,79
JEPANG/JAPAN 22.005,3 20.215,5 29.797,7 19.753,1 21.201,8 -0,97 14.094,5 21.735,0 54,21
NEGARA LAINNYA/OTHER COUNTRIES 33.876,5 51.753,6 60.818,4 68.352,2 69.301,4 18,65 45.421,9 61.310,1 34,98
44

Lanjutan/Continued
Nilai/Value : Ribu/Thousand US$
2012 2013
TABEL 14 : NILAI EKSPOR 100 JENIS BARANG MENURUT NEGARA TUJUAN UTAMA
EXPORT VALUE OF 100 COMMODITIES BY MAIN COUNTRY OF DESTINATION
KODE
CODE
HS
JENIS BARANG
DESCRIPTION OF GOODS
Trend (%)
12-16
Jan-Ags/Jan-Aug Perub. (%)
Change (%)
17-16
No. 08.05.148
2015 2016
2016 2017
2014
8536 Electrical apparatus for switching, protecting electrical circuits, for making connections to
or in electrical circuits, for a voltage not exceeding 1000 volts; connectors for optical
fibres, optical
552.880,1 591.667,7 569.608,5 506.330,5 519.934,9 -2,75 347.439,9 416.791,8 19,96
SINGAPURA/SINGAPORE 220.955,9 244.688,8 229.535,8 153.619,1 153.585,5 -11,25 107.152,9 109.556,1 2,24
PERANCIS/FRANCE 81.417,9 88.319,0 73.971,4 72.465,2 72.135,9 -4,30 50.879,7 49.570,2 -2,57
JEPANG/JAPAN 77.595,4 65.250,2 69.420,4 60.349,7 60.094,4 -5,72 38.613,8 53.045,0 37,37
AMERIKA SERIKAT/UNITED STATES 31.464,1 38.715,4 36.552,4 41.130,3 47.122,4 9,07 30.750,1 44.734,0 45,48
HONGKONG/HONG KONG 53.121,2 43.471,1 34.577,6 40.018,7 46.459,5 -3,45 28.133,4 40.522,5 44,04
NEGARA LAINNYA/OTHER COUNTRIES 88.325,7 111.223,2 125.550,9 138.747,5 140.537,2 12,19 91.910,0 119.363,9 29,87
8542 Electronic integrated circuits 531.491,3 506.609,4 487.358,3 417.177,1 368.136,0 -8,87 255.212,4 295.165,3 15,65
SINGAPURA/SINGAPORE 385.953,6 370.259,7 395.809,4 331.465,6 290.192,4 -6,58 199.950,9 235.784,3 17,92
HONGKONG/HONG KONG 8.870,4 11.002,2 9.966,7 18.476,6 17.267,5 20,33 12.599,6 10.586,4 -15,98
JERMAN/GERMANY 23.636,4 28.258,8 18.445,1 14.419,9 13.704,3 -16,16 9.779,8 11.792,7 20,58
R.R. TIONGKOK/CINA 6.663,2 8.460,5 10.978,7 12.314,8 10.562,6 13,85 7.371,9 7.939,5 7,70
JEPANG/JAPAN 45.906,7 37.490,3 27.749,8 19.367,0 9.445,8 -31,77 7.268,1 6.044,8 -16,83
NEGARA LAINNYA/OTHER COUNTRIES 60.460,9 51.137,8 24.408,6 21.133,3 26.963,4 -22,11 18.242,0 23.017,7 26,18
8544 Insulated wire, cable and other electric conductors, connector fitted or not; optical fibre
cables of individually sheathed fibres, whether or not assembled with electric conductors
or fitted with
1.073.175,2 1.158.497,1 1.156.249,3 1.068.976,5 1.128.778,7 0,21 717.816,8 1.046.380,1 45,77
JEPANG/JAPAN 501.402,0 510.313,7 517.944,4 525.269,0 603.870,1 4,09 365.131,1 619.712,3 69,72
AMERIKA SERIKAT/UNITED STATES 227.775,1 210.502,9 243.305,0 161.326,6 160.316,0 -9,23 102.965,7 126.730,2 23,08
SINGAPURA/SINGAPORE 109.368,6 115.496,5 129.365,9 109.143,6 124.938,9 2,12 81.784,7 73.025,2 -10,71
THAILAND/THAILAND 16.195,4 27.018,8 40.064,4 71.182,8 55.839,0 41,12 39.562,6 79.526,1 101,01
AUSTRALIA/AUSTRALIA 33.513,3 42.089,6 35.681,8 34.087,0 35.809,5 -0,78 25.216,2 18.356,6 -27,20
NEGARA LAINNYA/OTHER COUNTRIES 184.920,8 253.075,7 189.887,8 167.967,4 148.005,2 -8,20 103.156,7 129.029,7 25,08
8703 Motor cars and other motor vehicles; principally designed for the transport of persons
(other than those of heading no. 8702), including station wagons and racing cars
2.264.346,5 2.084.865,1 2.641.589,8 2.430.597,5 2.565.830,6 4,12 1.594.147,4 2.603.607,2 63,32
PILIPINA/PHILIPPINES 335.237,8 343.002,8 558.595,5 503.856,7 1.071.193,0 31,10 700.242,7 998.223,5 42,55
SAUDI ARABIA/SAUDI ARABIA 528.622,1 528.628,7 684.153,2 873.466,7 447.869,8 1,72 306.178,2 403.946,6 31,93
THAILAND/THAILAND 475.254,2 386.519,4 344.004,1 122.744,5 174.255,0 -27,05 94.607,6 155.811,0 64,69
JEPANG/JAPAN 156.913,8 129.726,8 128.370,3 116.934,0 115.824,3 -6,86 75.528,1 113.580,5 50,38
MALAYSIA/MALAYSIA 145.983,1 81.707,5 60.329,9 54.234,4 93.389,6 -12,22 32.452,1 72.874,9 124,56
NEGARA LAINNYA/OTHER COUNTRIES 622.335,6 615.279,9 866.136,7 759.361,2 663.299,0 3,44 385.138,7 859.170,8 123,08
8708 Motor vehicles; parts and accessories, of heading no. 8701 to 8705 1.476.959,0 1.448.899,2 1.619.938,9 1.834.442,1 1.981.045,5 8,58 1.290.142,6 1.698.322,8 31,64
THAILAND/THAILAND 401.855,9 321.417,0 354.181,2 437.870,8 506.489,3 8,03 345.967,7 415.360,8 20,06
MALAYSIA/MALAYSIA 149.629,3 185.109,9 206.591,9 292.110,2 277.946,2 18,47 168.626,5 207.643,4 23,14
JEPANG/JAPAN 286.650,8 266.920,4 249.250,3 250.674,0 255.848,1 -2,86 165.111,9 224.583,2 36,02
MEKSIKO/MEXICO 23.867,1 30.239,7 130.636,4 142.025,0 156.977,2 70,13 111.001,6 102.382,9 -7,76
BRASILIA/BRAZIL 103.273,6 113.822,7 130.674,2 143.683,4 114.036,2 4,41 74.607,5 106.426,2 42,65
NEGARA LAINNYA/OTHER COUNTRIES 511.682,3 531.389,4 548.605,0 568.078,8 669.748,5 6,24 424.827,4 641.926,3 51,10
45

Lanjutan/Continued
Nilai/Value : Ribu/Thousand US$
2012 2013
TABEL 14 : NILAI EKSPOR 100 JENIS BARANG MENURUT NEGARA TUJUAN UTAMA
EXPORT VALUE OF 100 COMMODITIES BY MAIN COUNTRY OF DESTINATION
KODE
CODE
HS
JENIS BARANG
DESCRIPTION OF GOODS
Trend (%)
12-16
Jan-Ags/Jan-Aug Perub. (%)
Change (%)
17-16
No. 08.05.148
2015 2016
2016 2017
2014
8711 Motorcycles (including mopeds) and cycles; fitted with an auxiliary motor, with or without
side-cars; side-cars
200.738,5 126.443,0 143.306,6 401.790,4 468.063,7 32,97 304.662,2 616.445,4 102,34
PILIPINA/PHILIPPINES 97.372,4 43.279,1 47.583,7 82.438,2 176.319,2 20,10 105.931,0 223.016,7 110,53
THAILAND/THAILAND 20.196,1 15.880,6 11.436,6 87.029,7 70.659,7 52,29 40.806,4 105.916,5 159,56
JEPANG/JAPAN 1.377,1 1.189,4 10.131,6 43.443,3 39.547,6 180,47 28.303,5 34.024,6 20,21
VIETNAM/VIET NAM 417,5 8.984,7 18.352,2 12.114,0 30.169,4 142,53 13.376,9 46.864,9 250,34
TURKI/TURKEY - - 828,4 6.274,8 14.700,8 - 12.533,0 9.830,0 -21,57
NEGARA LAINNYA/OTHER COUNTRIES 81.375,5 57.109,3 54.974,0 170.490,4 136.667,1 23,75 103.711,2 196.792,7 89,75
8714 Vehicles; parts and accessories of heading no. 8711 to 8713 463.265,8 437.976,6 448.739,5 426.586,9 500.851,9 1,31 314.691,1 492.747,8 56,58
SINGAPURA/SINGAPORE 216.066,5 168.261,3 202.329,4 171.179,5 144.028,3 -7,63 90.604,6 116.481,9 28,56
PILIPINA/PHILIPPINES 18.592,2 44.223,8 52.921,8 59.338,6 98.431,1 43,72 60.310,9 118.478,4 96,45
MALAYSIA/MALAYSIA 45.788,6 46.641,3 38.441,4 36.443,6 56.462,5 1,74 36.643,6 58.715,1 60,23
JEPANG/JAPAN 31.593,6 31.732,4 49.093,9 32.541,5 40.509,4 5,36 30.056,6 38.669,8 28,66
THAILAND/THAILAND 50.406,9 49.213,0 23.942,5 29.210,4 36.935,1 -10,81 21.979,3 37.975,5 72,78
NEGARA LAINNYA/OTHER COUNTRIES 100.818,0 97.904,8 82.010,5 97.873,4 124.485,5 4,30 75.096,0 122.427,1 63,03
9401 Seats (not those of heading no. 9402), whether or not convertible into beds and parts
thereof
528.408,9 511.437,4 510.272,7 518.848,6 506.289,3 -0,71 342.891,1 402.231,4 17,31
AMERIKA SERIKAT/UNITED STATES 141.897,7 155.496,4 163.360,8 172.803,9 165.675,4 4,24 112.395,0 136.154,7 21,14
JERMAN/GERMANY 39.898,8 32.388,0 38.468,3 38.224,9 37.148,7 0,23 24.782,1 27.749,4 11,97
INGGRIS/UNITED KINGDOM 41.371,5 40.431,1 38.137,8 38.160,5 36.954,3 -2,80 27.258,5 29.591,8 8,56JEPANG/JAPAN 38.353,3 43.834,3 32.359,6 32.483,6 33.793,5 -5,38 24.341,0 24.614,8 1,12BELANDA/NETHERLANDS 33.357,2 29.559,0 28.785,9 27.322,7 26.471,1 -5,27 18.119,2 21.384,4 18,02
NEGARA LAINNYA/OTHER COUNTRIES 233.530,4 209.728,5 209.160,4 209.852,9 206.246,2 -2,45 135.995,3 162.736,2 19,66
9403 Furniture and parts thereof, n.e.c. in chapter 94 1.221.082,0 1.216.624,1 1.255.611,5 1.172.264,5 1.086.555,2 -2,67 722.292,6 935.126,6 29,47
AMERIKA SERIKAT/UNITED STATES 419.601,0 468.006,8 465.014,3 475.757,1 434.054,3 0,85 289.567,2 406.029,9 40,22JEPANG/JAPAN 216.847,3 185.488,5 167.899,4 131.936,4 141.008,4 -11,32 91.359,0 113.141,8 23,84PERANCIS/FRANCE 62.596,8 56.515,7 67.369,7 55.018,5 48.710,5 -5,15 32.801,0 30.109,6 -8,21BELANDA/NETHERLANDS 51.432,8 43.386,4 47.984,6 46.949,0 47.247,4 -0,90 32.030,0 48.331,5 50,89AUSTRALIA/AUSTRALIA 38.189,6 42.540,1 45.771,1 43.783,8 41.370,9 1,91 24.735,6 33.650,6 36,04
NEGARA LAINNYA/OTHER COUNTRIES 432.414,5 420.686,5 461.572,3 418.819,7 374.163,7 -2,90 251.799,8 303.863,1 20,68
9503 Tricycles, scooters, pedal cars and similar wheeled toys; dolls' carriages; dolls; other toys; reduced-size
(scale) models and similar recreational models, working or not; puzzles of all kinds
347.067,8 428.966,8 391.800,6 348.306,1 282.330,9 -6,02 189.019,2 285.459,2 51,02
AMERIKA SERIKAT/UNITED STATES 140.581,2 163.678,0 156.428,3 124.328,3 100.431,0 -9,04 61.673,0 97.536,9 58,15SINGAPURA/SINGAPORE 7.262,5 31.324,8 24.638,6 34.018,6 40.662,3 42,30 29.621,1 34.080,3 15,05INGGRIS/UNITED KINGDOM 26.628,1 30.619,7 32.924,2 29.303,0 23.223,0 -3,13 14.053,4 24.548,4 74,68JERMAN/GERMANY 16.185,1 17.416,4 16.472,2 16.101,6 15.961,2 -1,06 10.041,7 13.124,7 30,70JEPANG/JAPAN 2.969,0 3.550,1 5.658,4 8.039,9 9.290,7 36,33 5.869,7 11.860,4 102,06NEGARA LAINNYA/OTHER COUNTRIES 153.442,0 182.377,8 155.678,9 136.514,8 92.762,8 -12,16 67.760,3 104.308,4 53,94
Sumber/Source : Badan Pusat Statistik (diolah, Pusat Data dan Sistem Informasi, Kementerian Perdagangan)/Central Board of Statistics (processed by Trade Data Centre, Ministry of Trade)
46

Lanjutan/Continued
Volume/Volume : Ton
0303 Fish; frozen, excluding fish fillets and other fish meat of heading 0304 431.044,6 425.807,0 415.342,9 210.434,8 213.790,9 -19,00 134.687,4 217.183,4 61,25
VIETNAM/VIET NAM 35.712,8 32.981,4 34.892,1 42.760,7 50.922,0 10,18 35.203,0 38.165,2 8,41
R.R. TIONGKOK/CINA 117.094,7 112.039,3 122.497,1 38.410,4 49.058,8 -24,50 29.729,3 45.802,2 54,06
THAILAND/THAILAND 177.108,3 184.034,3 176.201,9 52.688,1 35.396,6 -36,05 20.760,9 46.722,9 125,05
JEPANG/JAPAN 28.362,8 27.105,7 20.272,8 24.449,1 20.396,8 -7,34 12.179,6 34.367,0 182,17
TAIWAN/TAIWAN, PROVINCE OF CINA 16.351,0 9.711,8 8.018,0 9.552,0 15.359,1 -1,41 8.906,1 12.793,6 43,65
NEGARA LAINNYA/OTHER COUNTRIES 56.415,0 59.934,7 53.461,0 42.574,6 42.657,7 -8,62 27.908,4 39.332,5 40,93
0304 Fish fillets and other fish meat (whether or not minced); fresh, chilled or frozen 90.677,1 81.219,5 88.198,5 95.429,6 95.522,5 2,69 62.519,1 67.796,4 8,44
AMERIKA SERIKAT/UNITED STATES 23.836,8 21.290,6 26.487,7 24.415,9 23.121,8 0,76 15.076,3 19.941,4 32,27
JEPANG/JAPAN 12.150,6 10.042,1 11.168,6 17.329,3 17.811,6 14,00 11.844,6 15.650,5 32,13
MALAYSIA/MALAYSIA 5.479,7 7.092,1 4.538,9 9.198,0 8.904,8 13,10 5.718,0 3.293,1 -42,41
VIETNAM/VIET NAM 2.136,8 2.039,6 2.874,7 5.877,0 7.091,8 41,31 4.447,9 2.696,1 -39,38
SINGAPURA/SINGAPORE 4.550,3 3.016,2 3.777,7 4.601,4 4.551,9 4,32 3.220,8 3.435,7 6,67
NEGARA LAINNYA/OTHER COUNTRIES 42.523,0 37.738,8 39.350,9 34.008,0 34.040,8 -5,34 22.211,5 22.779,7 2,56
0306 Crustaceans; in shell or not, live, fresh, chilled, frozen, dried, salted or in brine;
smoked, cooked or not before or during smoking; in shell, steamed or boiled,
whether or not chilled,
137.777,8 145.661,9 160.938,6 152.677,2 164.308,0 4,07 112.343,3 137.305,2 22,22
AMERIKA SERIKAT/UNITED STATES 62.591,5 65.945,2 87.535,8 83.027,9 96.096,9 11,49 65.868,0 84.117,7 27,71
JEPANG/JAPAN 32.524,7 32.951,8 27.598,4 27.183,0 26.727,8 -5,68 17.706,8 22.644,3 27,89
R.R. TIONGKOK/CINA 12.972,0 18.422,0 12.194,6 12.076,5 6.540,3 -16,41 5.063,1 5.952,8 17,57
MALAYSIA/MALAYSIA 4.608,7 4.995,3 6.165,7 7.450,2 9.961,4 21,43 7.129,8 6.065,2 -14,93
VIETNAM/VIET NAM 3.964,5 3.170,5 5.518,7 4.248,6 6.354,8 13,16 4.376,1 4.626,0 5,71
NEGARA LAINNYA/OTHER COUNTRIES 21.116,3 20.177,1 21.925,4 18.691,0 18.626,7 -3,22 12.199,6 13.899,2 13,93
0307 Molluscs; whether in shell or not, live, fresh, chilled, frozen, dried, salted or in brine;
smoked molluscs, whether in shell or not, cooked or not before or during the
smoking process; flours, meals
85.044,8 86.542,4 81.887,1 104.165,1 125.173,6 10,06 70.643,2 90.907,4 28,69
R.R. TIONGKOK/CINA 19.507,4 30.709,9 27.957,1 40.585,0 52.843,7 25,51 26.646,3 37.300,8 39,98
VIETNAM/VIET NAM 20.448,5 13.957,2 14.267,5 16.402,1 24.240,1 5,14 12.323,4 14.802,9 20,12
ITALIA/ITALY 7.686,4 6.286,3 8.505,6 8.881,4 9.340,2 7,63 6.608,5 8.252,0 24,87
TAIWAN/TAIWAN, PROVINCE OF CINA 8.215,2 8.884,6 8.428,2 14.269,4 12.832,6 14,63 7.760,0 10.611,4 36,75
THAILAND/THAILAND 6.228,7 9.023,2 4.943,2 2.760,5 5.898,7 -12,13 3.489,0 3.376,6 -3,22
NEGARA LAINNYA/OTHER COUNTRIES 22.958,5 17.681,1 17.785,5 21.266,7 20.018,3 -0,89 13.816,1 16.563,8 19,89
0801 Nuts, edible; coconuts, Brazil nuts and cashew nuts, fresh or dried, whether or not
shelled or peeled
284.034,6 358.671,0 562.270,9 697.378,1 678.960,3 27,22 367.301,6 840.529,2 128,84
VIETNAM/VIET NAM 19.750,3 27.391,5 40.765,7 69.753,0 52.398,0 33,46 14.939,1 34.862,9 133,37
R.R. TIONGKOK/CINA 23.939,5 20.805,8 140.702,4 199.692,1 202.883,9 92,24 106.972,7 193.804,6 81,17
THAILAND/THAILAND 15.876,8 19.441,5 73.719,5 69.104,4 108.047,6 66,59 42.747,9 313.428,7 633,20
AMERIKA SERIKAT/UNITED STATES 2.818,7 3.285,2 2.444,8 2.552,4 3.628,6 2,56 2.266,3 2.410,4 6,36
MALAYSIA/MALAYSIA 107.581,6 183.585,5 200.145,0 237.923,9 223.692,9 18,81 142.807,1 203.927,9 42,80
NEGARA LAINNYA/OTHER COUNTRIES 114.067,6 104.161,5 104.493,4 118.352,3 88.309,4 -3,77 57.568,7 92.094,6 59,97
47
No. 08.05.148
2015 2016
2016 2017
20142012 2013
TABEL 14.1 : VOLUME EKSPOR 100 JENIS BARANG MENURUT NEGARA TUJUAN UTAMA
EXPORT VOLUME OF 100 COMMODITIES BY MAIN COUNTRY OF DESTINATION
KODE
CODE
HS
JENIS BARANG
DESCRIPTION OF GOODS
Trend (%)
12-16
Jan-Ags/Jan-Aug Perub. (%)
Change (%)
17-16

Lanjutan/Continued
Volume/Volume : TonNo. 08.05.148
2015 2016
2016 2017
20142012 2013
TABEL 14.1 : VOLUME EKSPOR 100 JENIS BARANG MENURUT NEGARA TUJUAN UTAMA
EXPORT VOLUME OF 100 COMMODITIES BY MAIN COUNTRY OF DESTINATION
KODE
CODE
HS
JENIS BARANG
DESCRIPTION OF GOODS
Trend (%)
12-16
Jan-Ags/Jan-Aug Perub. (%)
Change (%)
17-16
0802 Nuts (excluding coconuts, Brazils and cashew nuts); fresh or dried, whether or not
shelled or peeled
217.006,1 226.291,5 253.765,6 282.918,3 222.086,1 2,73 162.283,8 200.432,3 23,51
PAKISTAN/PAKISTAN 86.967,7 90.446,5 100.908,6 98.788,9 112.376,6 6,19 82.287,9 83.355,6 1,30
THAILAND/THAILAND 28,0 658,0 4.604,8 64.045,1 58.505,6 629,05 42.183,5 56.007,6 32,77
INDIA/INDIA 23.014,2 36.498,2 30.828,4 29.269,7 14.483,9 -10,84 11.028,5 11.964,8 8,49
SINGAPURA/SINGAPORE 32.877,5 21.004,6 17.834,5 16.735,2 10.050,6 -22,88 7.413,6 8.002,6 7,94
MYANMAR/MYANMAR (FORM. BURMA) - - 68,0 1.846,1 4.145,2 - 2.603,2 13.087,8 402,77
NEGARA LAINNYA/OTHER COUNTRIES 74.118,7 77.684,2 99.521,2 72.233,3 22.524,2 -21,77 16.767,1 28.013,9 67,08
0901 Coffee, whether or not roasted or decaffeinated; husks and skins; coffee substitutes
containing coffee in any proportion
448.590,6 534.025,1 384.827,7 502.020,7 414.651,2 -2,17 223.078,1 415.900,5 86,44
AMERIKA SERIKAT/UNITED STATES 69.743,1 66.161,3 58.344,0 65.508,8 67.323,6 -0,80 39.292,9 55.894,1 42,25
JERMAN/GERMANY 50.984,5 60.432,7 38.067,9 47.664,3 42.628,4 -5,78 13.658,3 41.651,3 204,95
JEPANG/JAPAN 51.439,0 41.921,6 41.235,0 41.240,7 35.352,4 -7,38 20.678,2 25.438,1 23,02
MALAYSIA/MALAYSIA 34.291,8 42.098,1 30.787,9 39.393,7 40.387,4 2,64 24.909,8 37.665,4 51,21
ITALIA/ITALY 29.080,8 38.152,5 29.745,5 43.048,3 35.819,8 5,52 24.780,3 34.501,5 39,23
NEGARA LAINNYA/OTHER COUNTRIES 213.051,5 285.258,9 186.647,4 265.164,9 193.139,5 -2,66 99.758,5 220.750,0 121,28
0904 Pepper of the genus piper; dried or crushed or ground fruits of the genus capsicum
or of the genus pimenta
63.834,1 48.959,1 35.655,9 60.551,5 55.146,6 -0,80 24.905,9 37.413,7 50,22
VIETNAM/VIET NAM 17.226,0 12.012,2 6.117,6 22.697,6 19.327,4 9,05 5.315,0 13.124,5 146,93
AMERIKA SERIKAT/UNITED STATES 22.922,7 14.649,2 6.149,5 10.114,5 8.540,4 -20,90 3.998,1 6.517,0 63,00
INDIA/INDIA 6.042,3 3.749,3 4.501,5 4.661,6 7.105,5 5,57 3.619,2 4.210,5 16,34
SINGAPURA/SINGAPORE 3.400,3 5.952,8 8.072,8 6.637,3 3.228,3 0,05 1.805,8 2.090,0 15,74
BELANDA/NETHERLANDS 1.972,3 2.673,3 1.421,7 1.895,3 2.808,0 3,69 1.483,9 1.478,7 -0,35
NEGARA LAINNYA/OTHER COUNTRIES 12.270,5 9.922,3 9.392,8 14.545,2 14.136,9 6,88 8.683,9 9.992,9 15,07
1511 Palm oil and its fractions; whether or not refined, but not chemically modified 18.845.020,2 20.577.975,9 22.892.386,9 26.467.563,6 22.759.304,5 6,49 13.821.772,1 22.613.010,2 63,60
INDIA/INDIA 5.253.807,8 5.634.127,8 4.867.846,5 5.737.744,0 5.414.476,1 0,79 3.233.084,9 6.157.172,5 90,44
R.R. TIONGKOK/CINA 2.842.111,2 2.343.398,5 2.357.262,5 3.629.607,7 2.664.866,1 3,14 1.422.526,9 2.413.495,3 69,66
PAKISTAN/PAKISTAN 749.136,1 1.080.336,9 1.814.750,2 2.318.376,2 2.096.001,4 32,60 1.300.848,9 1.772.432,8 36,25
SPANYOL/SPAIN 268.971,7 613.309,2 903.242,5 994.878,5 1.111.134,9 39,39 734.908,2 1.158.923,8 57,70
MESIR/EGYPT 494.143,3 735.542,4 1.010.313,5 1.137.847,1 977.554,9 19,73 588.095,7 926.157,4 57,48
NEGARA LAINNYA/OTHER COUNTRIES 9.236.850,2 10.171.261,2 11.938.971,7 12.649.110,0 10.495.271,1 4,85 6.542.307,5 10.184.828,5 55,68
1513 Coconut (copra), palm kernel or babassu oil and their fractions; whether or not
refined but not chemically modified
2.263.320,3 2.275.102,5 2.251.251,3 2.579.941,2 2.178.806,9 0,50 1.405.369,5 1.836.316,9 30,66
R.R. TIONGKOK/CINA 498.284,2 418.981,3 445.089,1 662.514,3 565.652,6 7,38 344.886,3 430.814,9 24,92
AMERIKA SERIKAT/UNITED STATES 82.161,4 178.897,0 274.789,0 290.719,1 367.412,7 41,64 247.962,8 346.998,1 39,94
BELANDA/NETHERLANDS 463.282,4 462.605,9 404.445,4 421.260,5 341.056,3 -6,82 226.487,3 291.829,4 28,85
MALAYSIA/MALAYSIA 513.539,9 255.767,2 306.827,8 401.959,7 222.666,2 -11,48 120.099,8 167.152,6 39,18
BRASILIA/BRAZIL 137.624,7 149.659,7 160.679,5 161.719,6 170.632,3 5,21 113.552,3 137.549,2 21,13
NEGARA LAINNYA/OTHER COUNTRIES 568.427,8 809.191,5 659.420,5 641.768,0 511.386,9 -4,34 352.381,0 461.972,7 31,10
48

Lanjutan/Continued
Volume/Volume : TonNo. 08.05.148
2015 2016
2016 2017
20142012 2013
TABEL 14.1 : VOLUME EKSPOR 100 JENIS BARANG MENURUT NEGARA TUJUAN UTAMA
EXPORT VOLUME OF 100 COMMODITIES BY MAIN COUNTRY OF DESTINATION
KODE
CODE
HS
JENIS BARANG
DESCRIPTION OF GOODS
Trend (%)
12-16
Jan-Ags/Jan-Aug Perub. (%)
Change (%)
17-16
1516 Animal or vegetable fats and oils and their fractions; partly or wholly hydrogenated,
inter-esterified, re-esterified or elaidinised, whether or not refined, but not further
prepared
248.683,3 1.072.959,1 135.471,9 167.705,3 305.780,0 -13,43 177.073,9 238.640,1 34,77
R.R. TIONGKOK/CINA 65.309,2 150.873,6 78.248,8 79.705,2 101.859,7 2,54 47.868,9 68.125,4 42,32
ITALIA/ITALY - 4.099,9 105,5 80,3 87.206,2 - 58.946,1 50.914,7 -13,63
THAILAND/THAILAND 3.215,8 3.300,8 17.688,1 30.349,7 36.258,9 102,67 23.147,8 40.752,0 76,05
AMERIKA SERIKAT/UNITED STATES 669,4 5.997,2 763,3 4.353,9 4.556,4 42,13 2.653,2 5.663,8 113,47
VIETNAM/VIET NAM 1.426,2 1.710,9 1.829,4 2.127,2 11.822,9 56,02 5.631,9 5.687,2 0,98
NEGARA LAINNYA/OTHER COUNTRIES 178.062,7 906.976,8 36.836,8 51.089,0 64.075,8 -38,86 38.826,0 67.497,0 73,85
1517 Margarine; edible mixtures or preparations of animal or vegetable fats or oils or of
fractions of different fats or oils of this chapter, other than edible fats or oils of
heading no. 1516
761.214,4 663.240,6 807.252,7 799.649,9 852.675,0 4,23 526.295,0 837.980,9 59,22
R.R. TIONGKOK/CINA 322.681,5 221.137,5 284.426,4 282.771,8 310.544,8 1,71 168.685,1 315.255,1 86,89
MESIR/EGYPT 11.983,6 13.562,4 17.961,6 21.262,2 50.150,7 39,27 36.418,9 29.495,5 -19,01
FEDERASI RUSIA/RUSSIA FEDERATION 18.460,6 19.666,7 27.853,1 34.430,8 31.202,6 17,47 19.847,6 32.530,0 63,90
ALJAZAIR/ALGERIA 37.592,3 33.373,9 38.697,1 37.332,8 42.765,8 3,77 31.126,5 33.572,1 7,86
NIGERIA/NIGERIA 39.263,2 47.820,4 64.211,8 52.159,5 36.600,9 -0,53 21.268,9 49.910,2 134,66
NEGARA LAINNYA/OTHER COUNTRIES 331.233,2 327.679,7 374.102,7 371.692,9 381.410,2 4,17 248.948,1 377.218,0 51,52
1604 Prepared or preserved fish; caviar and caviar substitutes prepared from fish eggs 95.094,2 95.231,9 106.329,6 90.134,3 85.837,8 -2,56 57.424,8 73.607,3 28,18
SAUDI ARABIA/SAUDI ARABIA 10.272,8 11.150,7 11.633,1 14.146,6 13.348,3 7,92 8.974,4 11.699,0 30,36
JEPANG/JAPAN 9.375,9 7.208,9 11.733,4 7.319,5 7.768,5 -3,54 5.615,1 8.174,3 45,58
AMERIKA SERIKAT/UNITED STATES 10.068,4 9.238,4 10.176,3 10.996,9 10.836,3 3,26 6.957,7 10.387,3 49,29
ITALIA/ITALY 404,3 2.784,2 4.356,3 6.174,1 5.098,5 79,78 2.697,8 6.289,0 133,12
THAILAND/THAILAND 6.092,5 6.442,6 3.469,8 4.207,2 5.615,5 -5,72 3.917,0 5.075,8 29,58
NEGARA LAINNYA/OTHER COUNTRIES 58.880,3 58.407,1 64.960,8 47.290,1 43.170,7 -7,98 29.262,8 31.981,9 9,29
1605 Crustaceans, molluscs and other aquatic invertebrates, prepared or preserved 51.296,7 55.453,4 60.832,5 62.920,9 67.091,6 6,86 45.328,6 40.095,0 -11,55
AMERIKA SERIKAT/UNITED STATES 22.377,4 28.566,4 31.752,5 33.870,2 36.615,4 12,24 24.363,5 24.100,4 -1,08
JEPANG/JAPAN 8.568,6 9.036,8 8.399,7 8.678,0 8.190,7 -1,30 4.931,3 6.253,3 26,81
INGGRIS/UNITED KINGDOM 1.684,5 1.836,6 2.301,6 2.527,9 2.765,8 14,01 1.483,3 1.502,9 1,32
BELANDA/NETHERLANDS 2.630,9 3.638,8 4.626,2 2.240,9 2.654,6 -4,56 1.719,0 1.812,5 5,44
JERMAN/GERMANY 650,8 644,2 1.201,3 1.105,3 1.208,9 19,46 804,9 586,5 -27,13
NEGARA LAINNYA/OTHER COUNTRIES 15.384,4 11.730,6 12.551,2 14.498,6 15.656,1 2,50 12.026,6 5.839,5 -51,44
1804 Cocoa; butter, fat and oil 94.345,5 86.806,8 99.482,7 114.547,1 109.503,9 5,92 68.872,9 110.851,1 60,95
AMERIKA SERIKAT/UNITED STATES 24.612,4 26.132,8 33.872,5 36.884,5 32.894,3 9,69 22.527,1 44.526,3 97,66
JERMAN/GERMANY 11.800,0 8.020,0 9.634,6 10.158,9 15.113,2 7,59 9.831,2 4.661,2 -52,59
KANADA/CANADA 2.330,7 6.421,8 3.023,1 2.984,5 7.005,5 15,43 3.022,8 7.926,0 162,21
BELANDA/NETHERLANDS 2.353,0 3.140,4 4.915,0 5.637,4 6.099,2 28,27 4.170,1 11.304,0 171,07
JEPANG/JAPAN 3.891,8 5.201,8 5.387,4 4.757,3 5.861,1 7,57 4.005,1 4.066,0 1,52
NEGARA LAINNYA/OTHER COUNTRIES 49.357,5 37.890,0 42.650,1 54.124,5 42.530,4 0,59 25.316,6 38.367,6 51,55
49

Lanjutan/Continued
Volume/Volume : TonNo. 08.05.148
2015 2016
2016 2017
20142012 2013
TABEL 14.1 : VOLUME EKSPOR 100 JENIS BARANG MENURUT NEGARA TUJUAN UTAMA
EXPORT VOLUME OF 100 COMMODITIES BY MAIN COUNTRY OF DESTINATION
KODE
CODE
HS
JENIS BARANG
DESCRIPTION OF GOODS
Trend (%)
12-16
Jan-Ags/Jan-Aug Perub. (%)
Change (%)
17-16
1905 Bread, pastry, cakes, biscuits, other bakers' wares, whether or not 94.502,9 113.430,4 129.605,0 142.394,7 186.665,1 17,22 112.701,3 184.598,4 63,79
R.R. TIONGKOK/CINA 6.986,8 13.645,2 20.573,4 33.346,8 50.596,8 62,47 28.503,0 48.897,1 71,55
VIETNAM/VIET NAM 8.613,0 10.142,8 15.661,8 16.406,7 22.838,9 27,52 11.396,9 18.731,1 64,35
THAILAND/THAILAND 15.521,7 14.826,8 13.978,8 15.401,4 18.837,1 4,34 12.207,3 16.247,9 33,10
PILIPINA/PHILIPPINES 6.827,7 8.917,5 11.337,9 10.802,5 14.513,8 18,53 8.670,5 21.345,0 146,18
MALAYSIA/MALAYSIA 7.630,3 8.603,5 7.833,3 8.341,1 10.537,4 6,34 5.922,7 12.834,4 116,70
NEGARA LAINNYA/OTHER COUNTRIES 48.923,5 57.294,5 60.219,9 58.096,1 69.341,0 7,37 46.000,9 66.542,9 44,66
2101 Extracts, essences, concentrates of coffee, tea or mate; preparations with a basis of
these products or with a basis of coffee, tea or mate; roasted chicory and other
roasted coffee
87.190,2 83.945,8 97.462,8 106.905,9 144.301,0 13,31 95.942,6 136.509,2 42,28
PILIPINA/PHILIPPINES 65.903,0 57.553,7 68.427,7 77.041,6 107.759,0 13,60 71.775,6 106.786,9 48,78
MALAYSIA/MALAYSIA 11.015,7 12.838,3 10.504,8 9.532,3 10.508,6 -3,84 7.811,5 8.873,0 13,59
R.R. TIONGKOK/CINA 903,9 1.700,4 3.216,0 3.285,8 4.284,0 45,80 2.471,3 2.615,4 5,83
PERSERIKATAN EMIRAT ARAB/UNITED ARAB EMIRATES 428,6 1.125,5 2.653,6 3.169,0 3.389,4 67,72 1.707,9 2.359,1 38,13
SINGAPURA/SINGAPORE 1.607,8 1.791,6 1.696,3 1.719,0 1.619,5 -0,27 1.115,1 1.378,1 23,58
NEGARA LAINNYA/OTHER COUNTRIES 7.331,3 8.936,3 10.964,5 12.158,2 16.740,5 21,64 11.061,1 14.496,7 31,06
2106 Food preparations not elsewhere specified or included 84.708,4 95.109,7 126.494,5 137.876,5 148.038,8 16,04 97.588,5 134.165,0 37,48
SINGAPURA/SINGAPORE 24.476,1 29.167,7 36.159,7 39.670,0 48.514,3 18,24 30.549,1 50.196,0 64,31
MALAYSIA/MALAYSIA 16.680,3 17.960,4 19.014,8 17.548,0 19.712,8 3,16 12.947,2 17.543,9 35,50
PILIPINA/PHILIPPINES 1.941,1 11.185,9 24.386,4 28.618,7 21.896,8 78,35 15.427,1 17.061,8 10,60
VIETNAM/VIET NAM 12.179,0 7.278,9 6.676,7 6.662,1 9.167,5 -6,36 6.181,9 5.013,9 -18,89
PAPUA NUGINI/PAPUA NEW GUINEA 377,2 228,4 335,2 409,1 395,2 6,99 267,2 411,7 54,04
NEGARA LAINNYA/OTHER COUNTRIES 29.054,7 29.288,4 39.921,5 44.968,7 48.352,3 15,57 32.215,9 43.937,7 36,39
2306 Oil-cake and other solid residues; whether or not ground or in the form of pellets,
resulting from the extraction of vegetable fats or oils other than those of heading no.
2304 or 2305 from the extrac
3.876.134,2 3.836.864,6 3.949.152,5 4.540.007,7 4.025.572,9 2,47 2.482.997,9 3.734.738,4 50,41
BELANDA/NETHERLANDS 1.699.664,5 1.355.597,6 1.250.859,8 1.726.551,0 1.417.711,5 -1,20 878.031,8 1.168.286,0 33,06
SELANDIA BARU/NEW ZEALAND 617.317,3 822.302,1 1.065.522,2 1.167.138,5 963.171,3 13,20 502.613,3 1.032.488,3 105,42
KOREA SELATAN/SOUTH OF KOREA 621.586,9 603.968,1 674.807,9 595.675,1 602.573,8 -0,76 414.743,2 451.961,7 8,97
R.R. TIONGKOK/CINA 362.442,5 449.019,0 407.285,8 336.355,6 289.732,8 -7,10 176.242,7 291.227,2 65,24
VIETNAM/VIET NAM 159.494,3 181.170,9 175.386,8 246.583,9 280.355,2 15,45 199.729,9 293.687,1 47,04
NEGARA LAINNYA/OTHER COUNTRIES 415.628,7 424.807,1 375.290,1 467.703,6 472.028,3 3,57 311.637,0 497.088,1 59,51
2402 Cigars, cheroots, cigarillos and cigarettes; of tobacco or of tobacco substitutes 67.535,5 73.644,8 79.007,2 81.667,8 85.013,8 5,80 55.490,4 76.912,3 38,60
KAMBOJA/CAMBODIA 29.724,0 31.856,4 38.624,9 37.433,5 39.060,7 7,33 25.439,1 31.966,6 25,66
MALAYSIA/MALAYSIA 10.199,9 10.808,8 11.842,7 12.616,5 12.354,5 5,53 8.360,3 9.381,6 12,22
SINGAPURA/SINGAPORE 11.504,7 11.277,8 9.144,1 10.321,8 11.419,5 -1,03 7.651,3 12.436,8 62,55
VIETNAM/VIET NAM 1.102,0 1.513,5 2.536,2 3.135,4 3.356,1 34,39 2.040,8 3.801,7 86,28
THAILAND/THAILAND 4.122,5 3.843,6 5.335,5 5.765,3 5.928,6 11,99 3.898,1 6.194,3 58,91
NEGARA LAINNYA/OTHER COUNTRIES 10.882,3 14.344,7 11.523,9 12.395,3 12.894,4 1,95 8.100,9 13.131,4 62,10
50

Lanjutan/Continued
Volume/Volume : TonNo. 08.05.148
2015 2016
2016 2017
20142012 2013
TABEL 14.1 : VOLUME EKSPOR 100 JENIS BARANG MENURUT NEGARA TUJUAN UTAMA
EXPORT VOLUME OF 100 COMMODITIES BY MAIN COUNTRY OF DESTINATION
KODE
CODE
HS
JENIS BARANG
DESCRIPTION OF GOODS
Trend (%)
12-16
Jan-Ags/Jan-Aug Perub. (%)
Change (%)
17-16
2603 Copper ores and concentrates 1.123.541,0 1.453.731,9 714.950,4 1.711.396,5 1.912.881,5 13,06 1.195.491,7 1.159.871,4 -2,98
JEPANG/JAPAN 418.221,9 447.743,6 202.918,6 552.541,8 689.632,1 12,87 464.407,5 324.053,6 -30,22
PILIPINA/PHILIPPINES 87.721,2 99.988,3 9.152,1 222.955,1 358.296,9 43,57 232.313,0 290.911,1 25,22
R.R. TIONGKOK/CINA 83.816,6 185.903,4 163.080,3 195.500,3 302.479,2 29,91 164.978,6 145.000,0 -12,11
INDIA/INDIA 171.923,0 326.477,9 123.000,0 441.529,4 293.868,3 14,73 127.000,1 225.439,8 77,51
KOREA SELATAN/SOUTH OF KOREA 175.346,9 194.771,8 83.353,4 239.397,6 230.605,1 7,83 168.792,5 174.466,9 3,36
NEGARA LAINNYA/OTHER COUNTRIES 186.511,4 198.846,9 133.446,0 59.472,4 38.000,0 -35,52 38.000,0 0,0 -100,00
2701 Coal; briquettes, ovoids and similar solid fuels manufactured from coal 347.575.751,8 381.519.673,5 356.302.906,0 ############ ############ -3,68 205.772.839,1 263.143.457,9 27,88
INDIA/INDIA 94.681.889,8 116.823.517,0 134.451.840,2 ########### 94.629.388,8 0,57 66.737.593,7 80.407.151,0 20,48
R.R. TIONGKOK/CINA 81.600.067,8 89.777.806,6 49.781.973,9 36.684.463,0 50.843.138,5 -16,82 30.512.511,5 41.045.592,1 34,52
JEPANG/JAPAN 35.068.211,2 37.846.895,7 35.579.266,4 32.503.484,1 33.037.829,1 -2,68 21.934.371,0 25.772.912,0 17,50
KOREA SELATAN/SOUTH OF KOREA 37.899.178,9 36.149.655,0 35.574.103,9 33.037.286,4 34.929.742,6 -2,50 22.300.492,1 31.573.672,5 41,58
TAIWAN/TAIWAN, PROVINCE OF CINA 28.692.361,9 27.947.166,1 27.018.299,4 24.088.090,1 20.289.534,0 -8,07 13.707.810,0 15.219.146,0 11,03
NEGARA LAINNYA/OTHER COUNTRIES 69.634.042,2 72.974.633,2 73.897.422,2 78.232.269,5 76.932.626,3 2,73 50.580.060,9 69.124.984,4 36,66
2702 Lignite; whether or not agglomerated, excluding jet 36.802.743,8 42.941.031,4 51.935.570,9 38.582.958,0 58.246.961,4 8,45 31.376.303,0 57.937.802,0 84,65
R.R. TIONGKOK/CINA 34.173.157,6 40.615.616,5 49.498.363,0 36.056.373,0 55.801.037,0 9,00 30.379.499,0 53.946.054,3 77,57
KOREA SELATAN/SOUTH OF KOREA - 123.647,0 57.351,9 978.398,0 1.479.338,3 - 627.612,3 2.502.084,0 298,67
INDIA/INDIA 1.394.124,0 1.464.992,0 1.900.248,0 639.631,0 231.720,9 -35,71 66.751,9 458.515,0 586,89
PILIPINA/PHILIPPINES 15.113,6 - - 11.885,0 249.810,4 - 29.448,4 36.300,0 23,27
MALAYSIA/MALAYSIA 103.586,8 8.300,0 41.484,8 - 146.932,8 - 64.868,4 14.355,5 -77,87
NEGARA LAINNYA/OTHER COUNTRIES 1.116.761,9 728.475,9 438.123,2 896.671,0 338.122,0 -19,60 208.123,0 980.493,1 371,11
2814 Ammonia; anhydrous or in aqueous solution 959.888,6 793.510,5 684.400,3 1.033.468,1 1.115.524,5 5,81 817.271,8 887.324,6 8,57
KOREA SELATAN/SOUTH OF KOREA 256.495,2 259.723,3 137.899,0 202.582,9 379.067,7 5,47 277.990,5 172.482,1 -37,95
R.R. TIONGKOK/CINA 30.107,3 31.338,8 78.003,6 247.555,0 216.357,3 82,41 151.371,6 242.570,1 60,25
JEPANG/JAPAN 144.759,8 134.432,3 206.525,2 168.523,4 176.577,6 6,43 148.959,5 132.641,3 -10,95
THAILAND/THAILAND 69.089,9 34.893,7 50.013,9 88.722,7 130.027,4 24,58 84.330,7 88.498,8 4,94
TAIWAN/TAIWAN, PROVINCE OF CINA 191.598,6 92.904,7 148.382,8 124.366,3 78.121,1 -13,95 65.019,4 45.437,1 -30,12
NEGARA LAINNYA/OTHER COUNTRIES 267.837,8 240.217,7 63.575,8 201.717,7 135.373,3 -14,27 89.600,1 205.695,2 129,57
2905 Acyclic alcohols and their halogenated, sulphonated, nitrated or nitrosated
derivatives
954.341,2 990.009,0 925.441,8 908.081,4 879.993,6 -2,46 596.328,2 790.536,4 32,57
R.R. TIONGKOK/CINA 410.043,6 375.332,1 311.743,1 290.221,5 302.840,7 -8,27 190.260,9 300.926,8 58,17
JEPANG/JAPAN 69.107,4 85.548,3 85.118,6 77.350,2 62.799,6 -2,88 43.992,2 66.471,3 51,10
AMERIKA SERIKAT/UNITED STATES 74.145,9 45.580,9 83.174,7 50.760,8 46.908,8 -7,76 32.959,9 42.032,8 27,53
INDIA/INDIA 30.990,6 22.402,5 62.719,0 34.046,1 34.733,1 6,68 22.904,6 32.491,7 41,86
MALAYSIA/MALAYSIA 55.869,6 76.011,2 60.978,6 70.132,0 80.186,1 6,63 58.227,5 53.576,1 -7,99
NEGARA LAINNYA/OTHER COUNTRIES 314.184,1 385.133,9 321.707,8 385.570,7 352.525,2 2,34 247.983,1 295.037,7 18,97
51
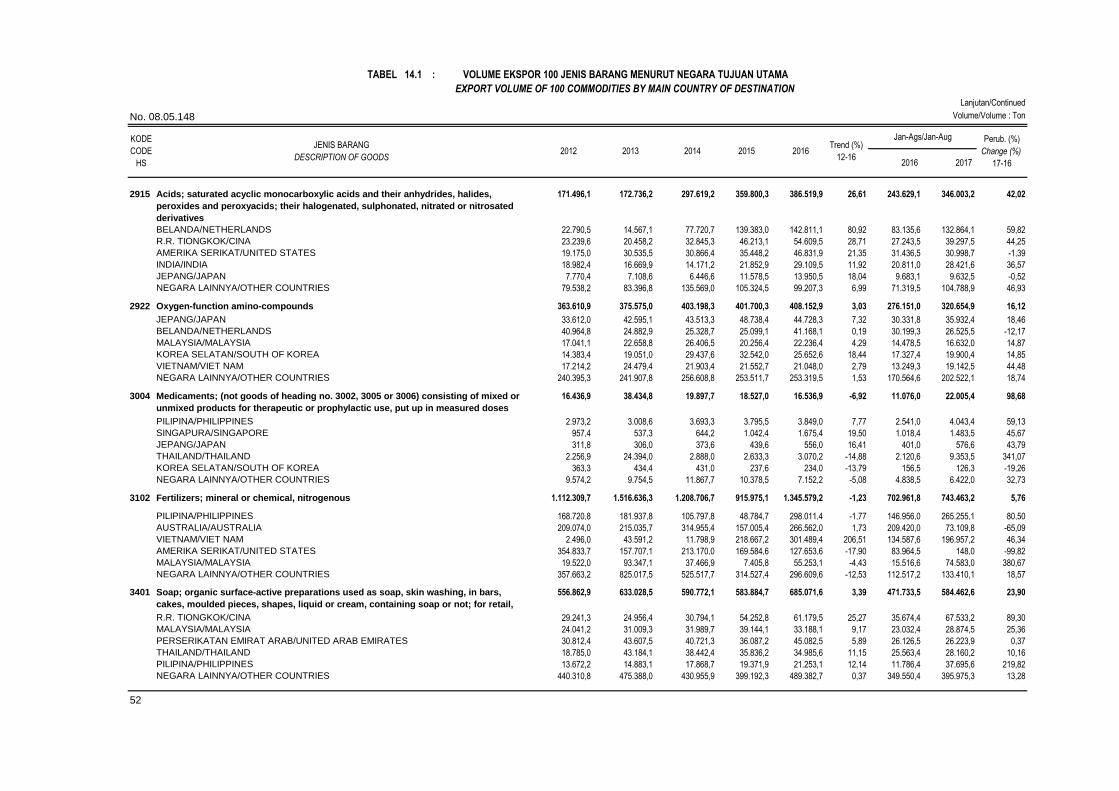
Lanjutan/Continued
Volume/Volume : TonNo. 08.05.148
2015 2016
2016 2017
20142012 2013
TABEL 14.1 : VOLUME EKSPOR 100 JENIS BARANG MENURUT NEGARA TUJUAN UTAMA
EXPORT VOLUME OF 100 COMMODITIES BY MAIN COUNTRY OF DESTINATION
KODE
CODE
HS
JENIS BARANG
DESCRIPTION OF GOODS
Trend (%)
12-16
Jan-Ags/Jan-Aug Perub. (%)
Change (%)
17-16
2915 Acids; saturated acyclic monocarboxylic acids and their anhydrides, halides,
peroxides and peroxyacids; their halogenated, sulphonated, nitrated or nitrosated
derivatives
171.496,1 172.736,2 297.619,2 359.800,3 386.519,9 26,61 243.629,1 346.003,2 42,02
BELANDA/NETHERLANDS 22.790,5 14.567,1 77.720,7 139.383,0 142.811,1 80,92 83.135,6 132.864,1 59,82
R.R. TIONGKOK/CINA 23.239,6 20.458,2 32.845,3 46.213,1 54.609,5 28,71 27.243,5 39.297,5 44,25
AMERIKA SERIKAT/UNITED STATES 19.175,0 30.535,5 30.866,4 35.448,2 46.831,9 21,35 31.436,5 30.998,7 -1,39
INDIA/INDIA 18.982,4 16.669,9 14.171,2 21.852,9 29.109,5 11,92 20.811,0 28.421,6 36,57
JEPANG/JAPAN 7.770,4 7.108,6 6.446,6 11.578,5 13.950,5 18,04 9.683,1 9.632,5 -0,52
NEGARA LAINNYA/OTHER COUNTRIES 79.538,2 83.396,8 135.569,0 105.324,5 99.207,3 6,99 71.319,5 104.788,9 46,93
2922 Oxygen-function amino-compounds 363.610,9 375.575,0 403.198,3 401.700,3 408.152,9 3,03 276.151,0 320.654,9 16,12
JEPANG/JAPAN 33.612,0 42.595,1 43.513,3 48.738,4 44.728,3 7,32 30.331,8 35.932,4 18,46
BELANDA/NETHERLANDS 40.964,8 24.882,9 25.328,7 25.099,1 41.168,1 0,19 30.199,3 26.525,5 -12,17
MALAYSIA/MALAYSIA 17.041,1 22.658,8 26.406,5 20.256,4 22.236,4 4,29 14.478,5 16.632,0 14,87
KOREA SELATAN/SOUTH OF KOREA 14.383,4 19.051,0 29.437,6 32.542,0 25.652,6 18,44 17.327,4 19.900,4 14,85
VIETNAM/VIET NAM 17.214,2 24.479,4 21.903,4 21.552,7 21.048,0 2,79 13.249,3 19.142,5 44,48
NEGARA LAINNYA/OTHER COUNTRIES 240.395,3 241.907,8 256.608,8 253.511,7 253.319,5 1,53 170.564,6 202.522,1 18,74
3004 Medicaments; (not goods of heading no. 3002, 3005 or 3006) consisting of mixed or
unmixed products for therapeutic or prophylactic use, put up in measured doses
(incl. those in the form
16.436,9 38.434,8 19.897,7 18.527,0 16.536,9 -6,92 11.076,0 22.005,4 98,68
PILIPINA/PHILIPPINES 2.973,2 3.008,6 3.693,3 3.795,5 3.849,0 7,77 2.541,0 4.043,4 59,13
SINGAPURA/SINGAPORE 957,4 537,3 644,2 1.042,4 1.675,4 19,50 1.018,4 1.483,5 45,67
JEPANG/JAPAN 311,8 306,0 373,6 439,6 556,0 16,41 401,0 576,6 43,79
THAILAND/THAILAND 2.256,9 24.394,0 2.888,0 2.633,3 3.070,2 -14,88 2.120,6 9.353,5 341,07
KOREA SELATAN/SOUTH OF KOREA 363,3 434,4 431,0 237,6 234,0 -13,79 156,5 126,3 -19,26
NEGARA LAINNYA/OTHER COUNTRIES 9.574,2 9.754,5 11.867,7 10.378,5 7.152,2 -5,08 4.838,5 6.422,0 32,73
3102 Fertilizers; mineral or chemical, nitrogenous 1.112.309,7 1.516.636,3 1.208.706,7 915.975,1 1.345.579,2 -1,23 702.961,8 743.463,2 5,76
PILIPINA/PHILIPPINES 168.720,8 181.937,8 105.797,8 48.784,7 298.011,4 -1,77 146.956,0 265.255,1 80,50
AUSTRALIA/AUSTRALIA 209.074,0 215.035,7 314.955,4 157.005,4 266.562,0 1,73 209.420,0 73.109,8 -65,09
VIETNAM/VIET NAM 2.496,0 43.591,2 11.798,9 218.667,2 301.489,4 206,51 134.587,6 196.957,2 46,34
AMERIKA SERIKAT/UNITED STATES 354.833,7 157.707,1 213.170,0 169.584,6 127.653,6 -17,90 83.964,5 148,0 -99,82
MALAYSIA/MALAYSIA 19.522,0 93.347,1 37.466,9 7.405,8 55.253,1 -4,43 15.516,6 74.583,0 380,67
NEGARA LAINNYA/OTHER COUNTRIES 357.663,2 825.017,5 525.517,7 314.527,4 296.609,6 -12,53 112.517,2 133.410,1 18,57
3401 Soap; organic surface-active preparations used as soap, skin washing, in bars,
cakes, moulded pieces, shapes, liquid or cream, containing soap or not; for retail,
paper, wadding, felt and
556.862,9 633.028,5 590.772,1 583.884,7 685.071,6 3,39 471.733,5 584.462,6 23,90
R.R. TIONGKOK/CINA 29.241,3 24.956,4 30.794,1 54.252,8 61.179,5 25,27 35.674,4 67.533,2 89,30
MALAYSIA/MALAYSIA 24.041,2 31.009,3 31.989,7 39.144,1 33.188,1 9,17 23.032,4 28.874,5 25,36
PERSERIKATAN EMIRAT ARAB/UNITED ARAB EMIRATES 30.812,4 43.607,5 40.721,3 36.087,2 45.082,5 5,89 26.126,5 26.223,9 0,37
THAILAND/THAILAND 18.785,0 43.184,1 38.442,4 35.836,2 34.985,6 11,15 25.563,4 28.160,2 10,16
PILIPINA/PHILIPPINES 13.672,2 14.883,1 17.868,7 19.371,9 21.253,1 12,14 11.786,4 37.695,6 219,82
NEGARA LAINNYA/OTHER COUNTRIES 440.310,8 475.388,0 430.955,9 399.192,3 489.382,7 0,37 349.550,4 395.975,3 13,28
52

Lanjutan/Continued
Volume/Volume : TonNo. 08.05.148
2015 2016
2016 2017
20142012 2013
TABEL 14.1 : VOLUME EKSPOR 100 JENIS BARANG MENURUT NEGARA TUJUAN UTAMA
EXPORT VOLUME OF 100 COMMODITIES BY MAIN COUNTRY OF DESTINATION
KODE
CODE
HS
JENIS BARANG
DESCRIPTION OF GOODS
Trend (%)
12-16
Jan-Ags/Jan-Aug Perub. (%)
Change (%)
17-16
3402 Organic surface-active agents (not soap); surface-active, washing (including
auxiliary washing) and cleaning preparations, containing soap or not, excluding
those of heading no. 3401
191.408,7 208.713,4 253.274,2 268.651,3 272.428,7 10,06 178.509,6 230.278,7 29,00
MALAYSIA/MALAYSIA 43.842,3 54.007,6 54.530,7 49.499,8 59.382,2 5,33 39.265,9 42.015,1 7,00
AUSTRALIA/AUSTRALIA 10.431,3 18.200,4 19.776,7 17.673,9 16.645,8 9,48 10.420,7 15.955,1 53,11
R.R. TIONGKOK/CINA 8.556,9 7.378,7 12.013,4 15.640,8 15.046,3 20,68 9.625,7 16.428,4 70,67
VIETNAM/VIET NAM 5.484,6 7.940,4 8.750,9 11.605,5 11.318,0 20,06 8.252,5 8.261,4 0,11
ANGOLA/ANGOLA 16.469,1 13.980,8 12.231,3 16.137,4 12.933,3 -3,34 6.154,8 13.492,5 119,22
NEGARA LAINNYA/OTHER COUNTRIES 106.624,5 107.205,5 145.971,1 158.094,0 157.103,1 12,34 104.790,1 134.126,2 28,00
3808 Insecticides, rodenticides, fungicides, herbicides, anti-sprouting products, plant
growth regulators, disinfectants and the like, put up in forms or packings for retail
sale or as preparations or form
71.302,7 82.166,1 143.363,3 81.832,1 81.594,8 2,69 59.034,0 76.501,5 29,59
PILIPINA/PHILIPPINES 12.795,9 13.359,0 60.248,6 18.308,9 17.786,4 10,23 12.433,9 11.678,5 -6,08
R.R. TIONGKOK/CINA 3.640,5 4.548,2 3.107,5 3.244,9 2.894,3 -7,66 2.390,4 8.025,8 235,75
THAILAND/THAILAND 10.250,9 14.380,7 9.143,7 5.454,9 5.940,1 -18,62 3.281,7 8.890,3 170,91
VIETNAM/VIET NAM 1.419,2 1.688,9 3.568,1 3.607,0 4.021,1 32,87 2.930,9 3.862,3 31,78
MALAYSIA/MALAYSIA 5.334,1 5.762,1 22.741,8 5.912,3 5.388,8 0,46 3.721,7 4.585,1 23,20
NEGARA LAINNYA/OTHER COUNTRIES 37.862,1 42.427,2 44.553,6 45.304,0 45.564,1 4,46 34.275,5 39.459,6 15,12
3823 Industrial monocarboxylic fatty acids; acid oils from refining; industrial fatty alcohols 1.857.981,0 2.151.419,8 2.577.388,2 2.696.680,2 2.785.017,7 10,91 1.796.111,5 2.624.473,6 46,12
R.R. TIONGKOK/CINA 537.223,7 604.605,1 669.382,6 626.128,9 699.370,3 5,79 436.482,9 513.551,4 17,66
MALAYSIA/MALAYSIA 205.495,9 251.851,1 320.410,0 289.390,2 349.787,7 12,78 228.392,5 267.255,1 17,02
BELANDA/NETHERLANDS 210.296,9 361.830,3 465.627,3 441.902,5 334.365,2 11,93 208.995,7 425.670,9 103,67
SINGAPURA/SINGAPORE 156.662,4 116.454,3 182.301,9 374.869,3 339.625,4 31,21 229.738,8 252.274,7 9,81
INDIA/INDIA 75.191,9 100.098,8 175.573,0 167.484,7 215.455,5 29,95 139.274,4 248.170,2 78,19
NEGARA LAINNYA/OTHER COUNTRIES 673.110,3 716.580,2 764.093,4 796.904,6 846.413,7 5,81 553.227,3 917.551,2 65,85
3826 Biodiesel and mixtures thereof; not containing or containing less than 70% by weight
of petroleum oils or oils obtained from bituminous minerals weight of petroleum oils
or oils obtained from bitumino
1.411.594,7 1.693.549,3 1.381.254,9 302.244,9 418.690,9 -33,99 322.343,4 157.076,8 -51,27
AMERIKA SERIKAT/UNITED STATES 57,0 216.576,9 184.534,6 220.852,1 372.021,5 480,48 300.433,9 - -
SPANYOL/SPAIN 355.969,3 203.420,8 152.300,2 28.000,0 22.999,9 -52,58 - 130.992,4 -
ITALIA/ITALY 310.220,2 111.736,0 - - 19.999,9 - 19.999,9 25.000,0 25,00
KOREA SELATAN/SOUTH OF KOREA 1,6 18,9 - 900,0 2.660,0 - 1.400,0 1.082,4 -22,68
R.R. TIONGKOK/CINA 7.948,3 159.523,4 812.115,0 13.482,9 1.000,0 -48,40 500,0 - -
NEGARA LAINNYA/OTHER COUNTRIES 737.398,2 1.002.273,3 232.305,1 39.010,0 9,6 -92,38 9,6 2,0 -78,77
3907 Polyacetals, other polyethers and epoxide resins, in primary forms; polycarbonates,
alkyd resins, polyallyl esters and other polyesters, in primary forms
272.475,2 269.942,1 404.959,1 433.846,4 389.859,5 12,65 252.499,7 299.629,2 18,67
ITALIA/ITALY 713,7 22.313,3 77.287,1 87.851,8 75.680,1 191,48 49.470,1 62.518,9 26,38
VIETNAM/VIET NAM 21.967,1 29.057,6 40.596,7 60.249,0 55.549,1 29,49 33.880,4 40.152,9 18,51
JEPANG/JAPAN 57.297,8 54.560,1 44.284,4 46.466,1 50.982,6 -3,86 33.928,8 46.670,3 37,55
AMERIKA SERIKAT/UNITED STATES 19.888,0 18.706,5 24.491,8 22.923,8 42.042,6 18,54 28.539,9 38.582,5 35,19
R.R. TIONGKOK/CINA 10.035,9 11.325,4 41.421,7 73.065,4 40.344,2 59,15 27.941,1 13.661,4 -51,11
NEGARA LAINNYA/OTHER COUNTRIES 162.572,7 133.979,0 176.877,4 143.290,4 125.260,9 -4,44 78.739,5 98.043,3 24,52
53

Lanjutan/Continued
Volume/Volume : TonNo. 08.05.148
2015 2016
2016 2017
20142012 2013
TABEL 14.1 : VOLUME EKSPOR 100 JENIS BARANG MENURUT NEGARA TUJUAN UTAMA
EXPORT VOLUME OF 100 COMMODITIES BY MAIN COUNTRY OF DESTINATION
KODE
CODE
HS
JENIS BARANG
DESCRIPTION OF GOODS
Trend (%)
12-16
Jan-Ags/Jan-Aug Perub. (%)
Change (%)
17-16
3920 Plastics; plates, sheets, film, foil and strip (not self-adhesive); non-cellular and not
reinforced, laminated, supported or similarly combined with other materials, n.e.c. in
chapter 39
188.999,7 191.650,3 201.259,9 195.411,9 218.834,7 3,18 144.067,7 189.391,5 31,46
JEPANG/JAPAN 29.317,1 35.614,7 35.841,4 34.258,9 39.651,7 5,81 26.385,7 36.931,9 39,97
AMERIKA SERIKAT/UNITED STATES 25.036,8 21.650,5 22.822,3 20.905,0 21.255,3 -3,56 14.056,1 19.715,6 40,26
THAILAND/THAILAND 11.123,9 10.129,7 10.828,6 14.314,4 17.844,4 13,78 12.280,5 14.755,9 20,16
AUSTRALIA/AUSTRALIA 10.638,4 12.380,1 12.408,6 13.425,8 14.414,9 7,13 9.243,9 12.126,6 31,19
KOREA SELATAN/SOUTH OF KOREA 14.510,7 13.785,0 14.235,8 14.301,6 13.593,8 -0,93 9.233,8 13.376,9 44,87
NEGARA LAINNYA/OTHER COUNTRIES 98.372,9 98.090,4 105.123,3 98.206,3 112.074,5 2,65 72.867,6 92.484,5 26,92
3923 Plastic articles for the conveyance or packing of goods; stoppers, lids, caps and
other closures of plastics
152.022,3 146.943,1 147.110,1 139.467,1 139.260,0 -2,25 91.496,7 122.951,3 34,38
JEPANG/JAPAN 75.285,4 78.468,5 81.800,5 77.843,3 78.413,5 0,74 50.798,1 65.108,2 28,17
SINGAPURA/SINGAPORE 11.222,8 8.999,5 11.033,1 15.300,5 15.129,2 11,94 10.246,9 12.179,9 18,86
AMERIKA SERIKAT/UNITED STATES 2.708,7 3.184,3 2.694,7 2.979,5 3.445,0 4,23 2.276,9 3.433,4 50,79
BRASILIA/BRAZIL 821,7 558,8 592,8 964,0 2.318,2 29,95 1.567,5 1.340,5 -14,49
INGGRIS/UNITED KINGDOM 5.859,9 5.047,7 5.765,1 5.192,9 6.144,5 1,24 4.189,6 6.053,5 44,49
NEGARA LAINNYA/OTHER COUNTRIES 56.123,8 50.684,3 45.223,9 37.186,9 33.809,6 -12,39 22.417,6 34.835,9 55,40
4001 Natural rubber, balata, gutta-percha, guayule, chicle and similar gums; in primary
forms or in plates, sheets or strip
2.445.666,7 2.703.287,1 2.624.416,1 2.631.139,2 2.579.124,9 0,80 1.655.867,0 2.534.992,4 53,09
AMERIKA SERIKAT/UNITED STATES 572.278,4 609.774,1 597.847,9 624.733,3 577.669,1 0,43 398.059,4 500.110,5 25,64
JEPANG/JAPAN 389.360,1 426.031,2 409.168,5 425.145,3 421.359,7 1,57 288.675,0 395.104,9 36,87
R.R. TIONGKOK/CINA 437.760,9 511.700,3 367.032,9 289.490,4 302.918,2 -12,24 139.450,0 387.080,1 177,58
INDIA/INDIA 107.848,5 144.489,2 195.811,1 204.598,3 230.947,0 20,57 143.009,8 217.886,8 52,36
KOREA SELATAN/SOUTH OF KOREA 142.717,0 147.332,4 158.759,9 182.894,9 179.347,2 6,96 113.973,3 160.708,1 41,01
NEGARA LAINNYA/OTHER COUNTRIES 795.701,8 863.959,8 895.795,9 904.277,0 866.883,7 2,19 572.699,4 874.101,9 52,63
4011 New pneumatic tyres, of rubber 403.480,0 426.959,1 451.121,6 472.264,1 516.906,2 6,14 340.693,8 435.030,7 27,69
AMERIKA SERIKAT/UNITED STATES 110.776,0 128.510,2 134.428,1 188.976,1 232.686,1 20,56 149.775,0 184.705,9 23,32
JEPANG/JAPAN 38.628,3 44.539,2 46.018,7 40.422,1 43.835,2 1,57 28.932,3 37.938,3 31,13
PILIPINA/PHILIPPINES 17.527,8 19.011,1 21.370,5 22.966,6 25.566,8 9,90 15.696,3 21.770,3 38,70
MALAYSIA/MALAYSIA 23.419,6 25.161,3 21.687,3 22.201,1 23.965,0 -0,79 15.962,6 26.955,6 68,87
AUSTRALIA/AUSTRALIA 25.539,9 22.056,7 22.512,6 23.875,4 20.341,1 -3,69 12.974,6 15.040,4 15,92
NEGARA LAINNYA/OTHER COUNTRIES 187.588,4 187.680,6 205.104,2 173.822,7 170.512,1 -2,64 117.353,1 148.620,3 26,64
4202 Trunks; suit, camera, jewellery, cutlery cases; travel, tool, similar bags; wholly or
mainly covered by leather, composition leather, plastic sheeting, textile materials,
vulcanised fibre, paperboard
15.423,1 17.006,3 18.471,6 18.499,9 19.208,6 5,37 12.267,9 18.559,3 51,28
AMERIKA SERIKAT/UNITED STATES 4.059,8 4.200,8 4.426,8 4.915,9 5.097,6 6,32 3.279,5 6.030,4 83,88
BELGIA/BELGIUM 2.208,3 1.841,6 3.014,2 2.653,1 3.017,8 10,40 2.115,3 2.993,6 41,52
BELANDA/NETHERLANDS 300,1 548,5 556,5 635,0 644,2 18,22 410,5 693,3 68,91
JEPANG/JAPAN 1.178,5 1.174,2 1.384,3 1.487,4 1.589,6 8,71 1.047,8 1.505,5 43,68
JERMAN/GERMANY 501,7 552,5 964,9 1.298,1 1.109,3 27,65 660,3 808,2 22,40
NEGARA LAINNYA/OTHER COUNTRIES 7.174,7 8.688,6 8.124,9 7.510,3 7.750,2 0,09 4.754,5 6.528,3 37,31
54

Lanjutan/Continued
Volume/Volume : TonNo. 08.05.148
2015 2016
2016 2017
20142012 2013
TABEL 14.1 : VOLUME EKSPOR 100 JENIS BARANG MENURUT NEGARA TUJUAN UTAMA
EXPORT VOLUME OF 100 COMMODITIES BY MAIN COUNTRY OF DESTINATION
KODE
CODE
HS
JENIS BARANG
DESCRIPTION OF GOODS
Trend (%)
12-16
Jan-Ags/Jan-Aug Perub. (%)
Change (%)
17-16
4409 Wood (including strips, friezes for parquet flooring, not assembled), continuously
shaped (tongued, grooved, v-jointed, beaded or the like) along any edges, ends or
faces, whether or not planed, sande
363.121,3 401.511,7 523.193,5 524.635,0 593.763,8 13,33 375.192,1 530.075,0 41,28
R.R. TIONGKOK/CINA 98.686,8 125.284,2 191.449,0 191.941,0 227.630,6 23,34 136.814,4 217.561,0 59,02
AUSTRALIA/AUSTRALIA 70.574,9 72.888,9 85.520,7 73.576,5 78.426,0 2,23 48.153,5 64.898,4 34,77
JEPANG/JAPAN 26.031,1 25.003,3 28.426,4 30.113,1 33.433,1 7,11 21.584,3 25.566,4 18,45
INDIA/INDIA 16.522,6 35.546,8 41.119,1 59.112,3 84.761,9 45,92 54.833,8 69.937,6 27,54
BELANDA/NETHERLANDS 23.859,8 21.277,1 25.251,4 25.955,3 26.970,4 4,54 18.143,9 22.806,4 25,70
NEGARA LAINNYA/OTHER COUNTRIES 127.446,2 121.511,5 151.426,8 143.936,8 142.541,8 4,01 95.662,2 129.305,2 35,17
4412 Plywood, veneered panels and similar laminated wood 1.950.219,4 2.082.789,6 2.340.789,3 2.466.536,5 2.463.932,0 6,57 1.619.451,4 2.048.068,6 26,47
JEPANG/JAPAN 625.161,1 670.626,2 643.507,0 546.754,1 564.991,5 -3,98 373.169,9 461.949,4 23,79
R.R. TIONGKOK/CINA 393.083,1 486.737,3 607.173,9 697.388,1 683.804,9 15,80 445.271,7 528.721,1 18,74
KOREA SELATAN/SOUTH OF KOREA 74.457,9 92.991,8 131.585,9 194.559,9 250.002,3 37,17 157.230,5 229.287,1 45,83
AMERIKA SERIKAT/UNITED STATES 111.513,0 133.370,8 134.276,5 191.565,1 174.996,7 13,47 106.029,2 147.826,2 39,42
TAIWAN/TAIWAN, PROVINCE OF CINA 138.987,4 151.107,4 175.162,3 154.091,3 188.564,4 6,50 131.312,4 149.379,6 13,76
NEGARA LAINNYA/OTHER COUNTRIES 607.016,8 547.956,1 649.083,7 682.178,1 601.572,3 2,03 406.437,6 530.905,3 30,62
4418 Builders' joinery and carpentry of wood, including cellular wood panels, assembled
flooring panels, shingles and shakes
134.081,9 141.968,8 150.050,0 158.377,7 164.544,2 5,33 105.268,4 149.198,7 41,73
INGGRIS/UNITED KINGDOM 19.851,3 27.205,5 26.361,8 32.360,9 38.011,2 15,87 24.190,8 29.432,0 21,67
AMERIKA SERIKAT/UNITED STATES 14.007,3 16.177,6 16.763,2 18.396,9 22.337,8 11,20 13.465,8 21.628,6 60,62
JEPANG/JAPAN 26.624,3 29.552,0 27.213,6 25.632,5 26.626,1 -1,41 17.530,6 24.370,4 39,02
BELANDA/NETHERLANDS 13.138,1 10.649,3 13.717,3 15.079,2 13.415,8 3,97 9.178,4 15.849,5 72,68
AUSTRALIA/AUSTRALIA 9.002,9 9.479,5 10.367,7 10.917,6 9.483,0 2,48 5.900,7 9.098,4 54,19
NEGARA LAINNYA/OTHER COUNTRIES 51.458,0 48.904,9 55.626,4 55.990,8 54.670,2 2,60 35.002,1 48.819,8 39,48
4703 Chemical wood pulp, soda or sulphate, other than dissolving grades 3.195.492,2 3.717.459,3 3.497.111,0 3.399.380,6 3.531.959,2 1,11 2.330.526,2 3.605.320,3 54,70
R.R. TIONGKOK/CINA 1.741.175,7 2.180.194,5 2.202.894,3 2.132.419,3 2.172.974,6 4,30 1.403.741,0 2.530.650,5 80,28
KOREA SELATAN/SOUTH OF KOREA 551.725,4 646.553,7 493.626,0 456.409,5 365.474,5 -11,06 266.729,6 283.528,8 6,30
BANGLA DESH/BANGLADESH 130.945,8 162.759,0 175.055,5 179.323,7 313.450,4 20,23 200.788,7 214.317,7 6,74
INDIA/INDIA 285.012,9 274.123,2 169.926,7 178.317,8 230.206,5 -8,21 148.398,6 196.500,1 32,41
JEPANG/JAPAN 141.568,0 118.427,9 154.582,3 141.315,2 104.762,9 -4,17 61.312,0 81.864,5 33,52
NEGARA LAINNYA/OTHER COUNTRIES 345.064,3 335.400,9 301.026,2 311.595,0 345.090,3 -0,73 249.556,2 298.458,7 19,60
4802 Uncoated paper and paperboard, used for writing, printing or other graphics, non
perforated punch-cards and punch tape paper, in rolls or rectangular sheets, of any
size, other than paper of
2.372.556,7 2.273.576,7 2.398.131,5 2.352.371,1 2.446.431,4 0,96 1.586.599,1 2.310.201,6 45,61
JEPANG/JAPAN 461.297,2 407.403,5 353.610,0 369.918,8 327.950,2 -7,49 219.131,3 253.741,9 15,79
MALAYSIA/MALAYSIA 210.371,7 188.294,1 182.372,0 175.307,6 182.859,7 -3,46 131.182,2 157.256,0 19,88
R.R. TIONGKOK/CINA 129.175,5 83.782,0 96.136,3 177.974,3 199.217,7 17,58 127.228,0 280.997,3 120,86
PILIPINA/PHILIPPINES 82.583,1 101.336,2 115.692,6 107.989,7 142.934,0 12,31 100.332,1 137.974,2 37,52
INDIA/INDIA 12.009,3 29.224,8 43.362,1 41.911,8 108.276,6 60,94 47.741,4 217.086,0 354,71
NEGARA LAINNYA/OTHER COUNTRIES 1.477.119,9 1.463.536,1 1.606.958,5 1.479.268,9 1.485.193,1 0,22 960.984,1 1.263.146,2 31,44
55

Lanjutan/Continued
Volume/Volume : TonNo. 08.05.148
2015 2016
2016 2017
20142012 2013
TABEL 14.1 : VOLUME EKSPOR 100 JENIS BARANG MENURUT NEGARA TUJUAN UTAMA
EXPORT VOLUME OF 100 COMMODITIES BY MAIN COUNTRY OF DESTINATION
KODE
CODE
HS
JENIS BARANG
DESCRIPTION OF GOODS
Trend (%)
12-16
Jan-Ags/Jan-Aug Perub. (%)
Change (%)
17-16
4803 Tissue, towel, napkin stock or similar; for household or sanitary uses, cellulose
wadding, webs of cellulose fibres, in rolls over 36cm in width or rectangular sheets
with one side exceeding 36cm when
304.099,9 334.935,4 302.283,4 406.201,1 496.492,2 12,45 347.872,2 450.511,4 29,50
AMERIKA SERIKAT/UNITED STATES 81.389,4 83.519,6 68.182,6 89.072,1 112.214,5 7,32 85.224,6 79.720,7 -6,46
AUSTRALIA/AUSTRALIA 24.069,4 17.858,7 22.269,4 32.528,5 44.734,5 20,19 34.875,6 36.426,1 4,45
TAIWAN/TAIWAN, PROVINCE OF CINA 26.807,6 21.887,8 20.937,1 41.667,4 45.980,1 18,80 31.559,9 41.435,4 31,29
KOREA SELATAN/SOUTH OF KOREA 7.644,4 13.325,9 17.241,5 22.031,1 37.029,8 44,17 22.371,2 48.160,5 115,28
MALAYSIA/MALAYSIA 29.598,8 30.343,2 25.221,5 32.956,1 30.667,6 1,55 19.456,3 33.255,4 70,92
NEGARA LAINNYA/OTHER COUNTRIES 134.590,1 168.000,2 148.431,3 187.946,0 225.865,7 12,16 154.384,6 211.513,3 37,00
4810 Paper and paperboard, coated one or both sides with kaolin (CINA clay) or inorganic
substances, with binder or not, no other coating, surface coloured or not, surface
decorated or printed, in rolls o
675.083,9 703.061,1 647.481,6 591.163,5 496.449,7 -7,58 332.633,3 333.766,7 0,34
VIETNAM/VIET NAM 97.957,4 118.731,4 76.951,3 93.926,1 95.253,2 -2,86 60.446,3 67.365,2 11,45
INDIA/INDIA 23.037,8 34.807,8 52.067,2 64.647,6 64.041,8 30,52 43.817,9 34.259,8 -21,81
BANGLA DESH/BANGLADESH 28.234,7 38.093,8 39.868,5 35.326,0 41.596,2 7,25 25.211,5 18.450,7 -26,82
THAILAND/THAILAND 39.879,9 37.769,3 31.163,5 36.868,4 35.082,1 -2,77 23.162,0 26.699,7 15,27
PAKISTAN/PAKISTAN 36.696,6 32.013,1 45.866,2 39.660,6 40.985,8 4,45 28.727,5 32.564,1 13,36
NEGARA LAINNYA/OTHER COUNTRIES 449.277,5 441.645,7 401.564,9 320.734,8 219.490,5 -16,08 151.268,2 154.427,4 2,09
5205 Cotton yarn (other than sewing thread), containing 85% or more by weight of cotton,
not put up for retail sale
77.100,4 147.472,0 141.418,0 155.141,2 163.159,9 16,77 109.523,8 141.200,7 28,92
R.R. TIONGKOK/CINA 31.563,6 98.557,9 86.905,2 103.800,6 102.031,4 27,10 66.611,3 101.484,5 52,35
JEPANG/JAPAN 18.168,3 20.094,6 21.333,8 18.680,9 21.111,6 2,30 14.236,0 15.014,2 5,47
BANGLA DESH/BANGLADESH 4.028,0 3.587,5 4.352,8 4.092,8 9.500,3 20,30 7.909,2 5.623,2 -28,90
KOREA SELATAN/SOUTH OF KOREA 7.291,3 6.398,3 6.808,9 8.705,4 10.801,3 11,56 7.169,0 6.381,2 -10,99
HONGKONG/HONG KONG 4.710,6 2.960,6 5.606,6 5.243,2 3.534,2 -0,03 1.337,0 1.132,9 -15,27
NEGARA LAINNYA/OTHER COUNTRIES 11.338,7 15.873,1 16.410,6 14.618,2 16.181,2 6,49 12.261,4 11.564,8 -5,68
5402 Synthetic filament yarn (other than sewing thread), not put up for retail sale,
including synthetic monofilament of less than 67 decitex
194.704,8 196.844,0 201.459,1 225.117,0 231.905,0 4,96 148.387,9 190.615,1 28,46
TURKI/TURKEY 43.510,7 40.564,9 36.476,3 40.193,1 51.893,2 3,49 30.068,4 50.459,1 67,81
VIETNAM/VIET NAM 13.665,3 14.635,9 18.127,5 22.821,2 25.447,5 18,39 16.194,8 21.049,8 29,98
JEPANG/JAPAN 16.432,8 15.750,5 18.755,4 18.397,6 18.120,3 3,57 12.022,6 14.278,4 18,76
THAILAND/THAILAND 8.843,7 17.096,4 17.477,5 16.248,7 18.017,1 14,71 12.029,9 16.040,0 33,33
INDIA/INDIA 8.151,4 7.290,0 8.773,4 12.357,2 14.137,8 17,69 9.629,6 11.070,7 14,96
NEGARA LAINNYA/OTHER COUNTRIES 104.100,9 101.506,3 101.849,1 115.099,2 104.289,0 1,30 68.442,8 77.717,0 13,55
5407 Woven fabrics of synthetic filament yarn, including woven fabrics obtained from
materials of heading no. 5404
110.487,1 100.420,2 162.038,4 112.488,1 91.017,3 -2,70 64.810,4 69.039,9 6,53
PERSERIKATAN EMIRAT ARAB/UNITED ARAB EMIRATES 14.585,6 15.970,8 21.393,4 20.425,9 22.713,5 11,98 17.039,7 14.318,6 -15,97
TURKI/TURKEY 24.158,1 25.045,7 83.246,0 36.278,9 19.385,0 -0,69 14.655,7 11.077,3 -24,42
MALAYSIA/MALAYSIA 17.014,4 14.823,9 14.649,3 15.373,7 15.310,2 -1,73 10.419,1 13.760,6 32,07
JEPANG/JAPAN 7.988,7 6.583,7 6.307,7 7.540,7 6.751,5 -1,99 4.072,9 5.778,9 41,89
SAUDI ARABIA/SAUDI ARABIA 9.839,9 5.959,7 5.184,9 3.464,1 4.348,1 -19,56 3.317,3 4.823,0 45,39
NEGARA LAINNYA/OTHER COUNTRIES 36.900,4 32.036,4 31.257,2 29.404,9 22.509,1 -10,19 15.305,7 19.281,5 25,98
56

Lanjutan/Continued
Volume/Volume : TonNo. 08.05.148
2015 2016
2016 2017
20142012 2013
TABEL 14.1 : VOLUME EKSPOR 100 JENIS BARANG MENURUT NEGARA TUJUAN UTAMA
EXPORT VOLUME OF 100 COMMODITIES BY MAIN COUNTRY OF DESTINATION
KODE
CODE
HS
JENIS BARANG
DESCRIPTION OF GOODS
Trend (%)
12-16
Jan-Ags/Jan-Aug Perub. (%)
Change (%)
17-16
5509 Yarn (other than sewing thread) of synthetic staple fibres, not put up for retail sale 306.786,8 337.653,8 372.458,7 364.150,8 364.119,2 4,27 255.498,6 298.993,6 17,02
TURKI/TURKEY 13.283,9 23.446,6 52.516,2 54.210,6 57.222,7 45,63 39.512,2 46.916,8 18,74
KOREA SELATAN/SOUTH OF KOREA 40.900,8 43.114,9 35.062,8 37.375,3 46.207,9 1,02 32.133,9 34.067,8 6,02
BRASILIA/BRAZIL 52.352,3 63.558,6 56.389,2 37.823,1 38.645,1 -10,65 29.156,5 37.637,9 29,09
JEPANG/JAPAN 18.181,7 18.069,6 18.697,2 17.316,6 17.198,6 -1,53 11.749,2 12.667,3 7,81
PAKISTAN/PAKISTAN 21.839,5 19.880,8 25.347,2 25.618,5 21.689,1 2,43 15.577,7 13.536,5 -13,10
NEGARA LAINNYA/OTHER COUNTRIES 160.228,5 169.583,3 184.446,1 191.806,8 183.155,8 3,98 127.369,1 154.167,4 21,04
5510 Yarn (other than sewing thread) of artificial staple fibres, not put up for retail sale 116.986,1 156.693,0 169.756,4 207.269,5 192.007,9 13,55 134.123,8 154.331,8 15,07
BRASILIA/BRAZIL 38.768,7 40.153,8 43.406,4 44.482,7 40.531,7 1,93 28.706,2 28.631,8 -0,26
MESIR/EGYPT 3.476,4 15.317,3 21.051,3 31.058,0 29.604,3 64,72 22.726,6 20.585,0 -9,42
TURKI/TURKEY 10.958,4 21.452,1 22.013,2 26.934,0 24.586,7 20,25 17.216,1 24.538,2 42,53
KOREA SELATAN/SOUTH OF KOREA 14.620,7 16.996,5 14.512,9 13.978,7 18.730,2 3,04 12.556,0 16.064,6 27,94
VIETNAM/VIET NAM 419,4 2.382,6 7.574,4 12.644,8 9.919,3 122,47 5.872,8 8.828,2 50,32
NEGARA LAINNYA/OTHER COUNTRIES 48.742,6 60.390,9 61.198,2 78.171,3 68.635,8 9,88 47.046,0 55.684,1 18,36
6103 Suits, ensembles, jackets, blazers, trousers, bib and brace overalls, breeches, shorts
(not swimwear); men's or boys', knitted or crocheted
18.059,2 18.595,3 20.993,0 20.287,1 18.496,5 1,36 12.666,2 16.812,9 32,74
AMERIKA SERIKAT/UNITED STATES 11.703,4 10.365,3 11.414,9 10.157,0 8.067,0 -7,36 5.751,7 7.755,3 34,84
JEPANG/JAPAN 1.760,8 1.778,6 2.289,4 1.951,0 2.249,5 6,00 1.289,3 1.698,6 31,75
BELGIA/BELGIUM 532,7 488,7 843,2 1.060,0 1.206,9 27,25 863,2 778,6 -9,80
R.R. TIONGKOK/CINA 149,0 408,4 407,2 643,1 905,7 50,14 560,7 1.141,2 103,53
JERMAN/GERMANY 274,6 575,9 998,2 839,3 907,4 31,88 654,0 633,3 -3,16
NEGARA LAINNYA/OTHER COUNTRIES 3.638,7 4.978,5 5.040,2 5.636,7 5.160,1 8,58 3.547,4 4.805,9 35,48
6104 Suits, ensembles, jackets, dresses, skirts, divided skirts, trousers, bib and brace
overalls, breeches and shorts (not swimwear), women's or girls', knitted or
crocheted knitted or crocheted
47.689,7 46.193,7 51.822,9 48.042,5 49.176,7 1,01 33.449,8 39.508,2 18,11
AMERIKA SERIKAT/UNITED STATES 35.165,5 34.129,6 37.136,9 32.218,5 33.392,3 -1,60 22.604,0 26.936,5 19,17
JERMAN/GERMANY 1.320,7 1.271,5 1.883,3 1.790,9 2.046,6 12,96 1.356,4 1.459,4 7,59
JEPANG/JAPAN 813,2 1.618,1 2.108,2 2.321,5 1.748,3 20,83 1.369,0 1.706,1 24,62
KANADA/CANADA 700,1 798,6 1.141,4 992,3 992,5 9,58 632,9 836,7 32,22
INGGRIS/UNITED KINGDOM 423,7 356,0 557,8 739,8 775,5 21,41 534,0 657,7 23,16
NEGARA LAINNYA/OTHER COUNTRIES 9.266,5 8.019,9 8.995,4 9.979,5 10.221,6 4,24 6.953,5 7.911,8 13,78
6109 T-shirts, singlets and other vests; knitted or crocheted 44.137,8 31.175,8 21.732,6 32.341,5 36.720,7 -3,26 22.071,3 31.102,9 40,92
AMERIKA SERIKAT/UNITED STATES 19.438,0 9.879,7 8.526,4 13.899,0 11.997,2 -6,05 8.071,3 11.303,7 40,05
JEPANG/JAPAN 2.338,7 1.922,2 2.097,7 3.219,8 3.425,9 13,65 2.360,0 2.962,1 25,51
KOREA SELATAN/SOUTH OF KOREA 2.292,6 1.689,7 1.529,3 2.052,4 2.654,9 5,00 1.965,3 2.354,1 19,78
JERMAN/GERMANY 1.283,6 1.159,6 1.161,9 1.167,9 1.146,0 -2,17 627,0 955,7 52,43
AUSTRALIA/AUSTRALIA 170,5 143,8 147,7 378,7 1.336,1 66,30 799,8 970,6 21,36
NEGARA LAINNYA/OTHER COUNTRIES 18.614,4 16.380,8 8.269,7 11.623,7 16.160,6 -6,07 8.247,8 12.556,8 52,24
57

Lanjutan/Continued
Volume/Volume : TonNo. 08.05.148
2015 2016
2016 2017
20142012 2013
TABEL 14.1 : VOLUME EKSPOR 100 JENIS BARANG MENURUT NEGARA TUJUAN UTAMA
EXPORT VOLUME OF 100 COMMODITIES BY MAIN COUNTRY OF DESTINATION
KODE
CODE
HS
JENIS BARANG
DESCRIPTION OF GOODS
Trend (%)
12-16
Jan-Ags/Jan-Aug Perub. (%)
Change (%)
17-16
6110 Jerseys, pullovers, cardigans, waistcoats and similar articles; knitted or crocheted 58.549,8 79.609,2 61.096,0 51.324,7 49.139,5 -7,59 32.187,7 44.459,1 38,12
AMERIKA SERIKAT/UNITED STATES 40.563,0 51.770,3 41.911,0 33.925,7 33.580,2 -7,69 22.491,4 30.619,4 36,14
JEPANG/JAPAN 4.565,0 6.388,2 5.461,2 4.205,2 4.607,7 -3,92 2.869,2 4.286,0 49,38
JERMAN/GERMANY 2.669,1 2.685,9 2.688,6 1.502,1 1.776,0 -13,03 1.027,0 1.238,9 20,63
KANADA/CANADA 1.529,6 2.034,1 1.723,8 1.242,6 1.414,5 -6,29 1.116,9 837,7 -25,00
KOREA SELATAN/SOUTH OF KOREA 1.631,8 5.582,1 2.145,5 5.422,1 1.834,8 2,08 966,5 1.585,8 64,08
NEGARA LAINNYA/OTHER COUNTRIES 7.591,3 11.148,5 7.165,9 5.027,1 5.926,1 -12,12 3.716,6 5.891,4 58,51
6201 Overcoats, car-coats, capes, cloaks, anoraks (including ski-jackets), wind-cheaters,
wind-jackets and similar articles, men's or boys', other than those of heading no.
6203 (not knitted
16.116,2 12.637,8 12.918,0 9.838,0 13.346,7 -6,08 8.567,9 12.374,6
AMERIKA SERIKAT/UNITED STATES 4.583,1 3.443,2 3.519,2 3.499,8 4.555,7 0,04 2.991,3 4.379,8 46,42
BELGIA/BELGIUM 1.271,7 1.046,0 1.299,7 865,1 956,8 -7,31 594,8 660,3 11,00
KOREA SELATAN/SOUTH OF KOREA 628,4 1.401,3 1.285,1 1.091,0 1.551,3 16,85 991,7 1.338,7 34,99
R.R. TIONGKOK/CINA 295,6 521,8 326,5 308,3 522,0 6,30 350,1 667,1 90,52
JEPANG/JAPAN 399,3 398,3 420,2 295,4 472,5 0,38 303,6 329,6 8,57
NEGARA LAINNYA/OTHER COUNTRIES 8.938,1 5.827,3 6.067,3 3.778,4 5.288,4 -13,78 3.336,4 4.999,2 49,84
6203 Suits, ensembles, jackets, blazers, trousers, bib and brace overalls, breeches and
shorts (other than swimwear); men's or boys' (not knitted or crocheted)
36.164,1 39.542,4 38.247,1 36.882,2 39.985,7 1,32 26.515,4 32.612,1 22,99
AMERIKA SERIKAT/UNITED STATES 14.266,5 15.809,8 14.838,6 15.752,2 16.659,1 3,11 11.466,3 13.863,2 20,90
JEPANG/JAPAN 3.467,1 6.451,4 4.868,4 3.554,2 4.041,2 -2,86 2.827,4 3.251,7 15,01
KOREA SELATAN/SOUTH OF KOREA 2.826,2 3.213,3 3.064,1 3.612,1 3.958,8 8,23 2.494,8 3.305,6 32,50
JERMAN/GERMANY 1.767,7 2.010,2 2.139,4 1.227,5 1.122,6 -13,08 867,4 1.327,0 52,99
R.R. TIONGKOK/CINA 383,1 738,0 836,0 930,4 1.024,5 24,60 749,2 756,9 1,03
NEGARA LAINNYA/OTHER COUNTRIES 13.453,4 11.319,8 12.500,6 11.805,7 13.179,4 0,01 8.110,3 10.107,7 24,63
6204 Suits, ensembles, jackets, dresses, skirts, divided skirts, trousers, bib and brace
overalls, breeches and shorts (other than swimwear); women's or girls' (not knitted
or crocheted)
44.731,9 49.117,8 45.705,0 54.461,3 51.694,8 4,00 36.037,2 41.772,6 15,92
AMERIKA SERIKAT/UNITED STATES 25.312,0 29.335,7 25.019,5 29.026,2 28.252,4 2,11 19.495,2 22.972,2 17,84
JEPANG/JAPAN 1.023,6 1.979,7 2.466,6 5.886,8 5.627,4 56,81 4.025,8 4.714,8 17,11
JERMAN/GERMANY 1.543,6 1.389,2 1.689,0 1.480,7 1.565,3 0,92 1.114,9 1.254,9 12,56
AUSTRALIA/AUSTRALIA 460,8 536,3 632,7 998,0 1.168,3 28,17 746,3 991,0 32,78
INGGRIS/UNITED KINGDOM 1.438,1 1.279,0 1.076,8 983,5 930,9 -10,71 667,0 633,2 -5,07
NEGARA LAINNYA/OTHER COUNTRIES 14.953,8 14.597,9 14.820,5 16.086,0 14.150,5 -0,13 9.988,0 11.206,6 12,20
6205 Shirts; men's or boys' (not knitted or crocheted) 23.096,9 24.162,1 22.593,9 21.312,4 20.232,8 -3,83 13.638,2 16.374,6 20,06
AMERIKA SERIKAT/UNITED STATES 11.449,7 11.985,7 11.225,4 11.351,7 12.123,2 0,60 7.948,0 9.459,7 19,02
JERMAN/GERMANY 2.039,3 2.190,2 1.987,7 1.906,8 1.827,8 -3,51 1.179,0 1.350,1 14,51
JEPANG/JAPAN 2.015,0 2.078,8 2.450,4 1.976,6 2.008,1 -0,57 1.339,0 1.529,5 14,22
AUSTRALIA/AUSTRALIA 479,1 653,6 578,3 781,6 634,5 7,69 385,7 487,5 26,38
KANADA/CANADA 425,4 515,8 537,9 563,3 558,8 6,54 386,6 407,8 5,48
NEGARA LAINNYA/OTHER COUNTRIES 6.688,3 6.737,9 5.814,2 4.732,4 3.080,5 -17,34 2.399,8 3.140,1 30,85
58

Lanjutan/Continued
Volume/Volume : TonNo. 08.05.148
2015 2016
2016 2017
20142012 2013
TABEL 14.1 : VOLUME EKSPOR 100 JENIS BARANG MENURUT NEGARA TUJUAN UTAMA
EXPORT VOLUME OF 100 COMMODITIES BY MAIN COUNTRY OF DESTINATION
KODE
CODE
HS
JENIS BARANG
DESCRIPTION OF GOODS
Trend (%)
12-16
Jan-Ags/Jan-Aug Perub. (%)
Change (%)
17-16
6206 Blouses, shirts and shirt-blouses; women's or girls' (not knitted or crocheted) 23.327,2 24.731,0 23.438,2 31.209,5 23.890,9 2,84 16.516,1 19.402,3 17,48
AMERIKA SERIKAT/UNITED STATES 14.327,0 16.066,1 14.338,1 21.237,0 14.867,7 3,59 10.192,5 12.185,0 19,55
JERMAN/GERMANY 1.627,2 1.485,6 1.782,5 1.708,3 1.819,5 3,70 1.263,0 1.443,6 14,30
JEPANG/JAPAN 902,2 1.526,2 1.159,7 1.137,2 1.050,3 0,10 753,1 770,3 2,28
PERSERIKATAN EMIRAT ARAB/UNITED ARAB EMIRATES 224,0 248,3 427,7 776,9 594,9 36,26 436,4 385,5 -11,68
BELGIA/BELGIUM 115,2 209,6 364,2 441,3 498,4 44,40 359,9 295,9 -17,79
NEGARA LAINNYA/OTHER COUNTRIES 6.131,7 5.195,2 5.366,0 5.908,7 5.060,1 -2,52 3.511,1 4.322,1 23,10
6212 Brassieres, girdles, corsets, braces, suspenders, garters and similar articles and
parts thereof; whether or not knitted or crocheted
8.995,6 9.244,0 9.047,9 10.014,1 9.432,4 1,76 6.309,3 8.054,2 27,66
AMERIKA SERIKAT/UNITED STATES 5.080,1 5.011,9 4.497,9 5.507,7 4.505,0 -1,45 3.051,8 4.021,2 31,76
JERMAN/GERMANY 819,0 872,9 1.175,9 1.076,0 1.229,9 10,76 843,9 811,3 -3,86
JEPANG/JAPAN 179,4 215,7 380,3 321,6 651,2 34,68 433,1 521,9 20,51
AUSTRALIA/AUSTRALIA 322,4 397,6 443,2 409,8 404,1 4,94 271,6 360,6 32,76
INGGRIS/UNITED KINGDOM 537,0 428,5 510,5 530,5 473,1 -0,40 348,7 428,0 22,72
NEGARA LAINNYA/OTHER COUNTRIES 2.057,6 2.317,4 2.040,1 2.168,6 2.169,1 0,39 1.360,1 1.911,2 40,52
6402 Footwear; with outer soles and uppers of rubber or plastics (excluding waterproof
footwear)
35.821,7 34.275,2 38.492,3 31.132,8 28.398,4 -5,45 18.014,3 25.446,7 41,26
AMERIKA SERIKAT/UNITED STATES 10.876,7 10.075,7 14.099,2 10.403,2 8.642,4 -4,19 5.117,0 6.543,8 27,88
JEPANG/JAPAN 2.502,2 2.824,5 3.362,1 2.703,7 2.914,2 2,65 2.048,9 2.511,9 22,60
BELGIA/BELGIUM 3.181,0 2.216,9 3.316,6 2.638,2 2.208,2 -5,41 1.388,7 2.413,9 73,83
R.R. TIONGKOK/CINA 603,0 724,3 1.216,5 1.087,2 1.795,3 29,54 1.200,4 1.212,9 1,04
JERMAN/GERMANY 2.004,0 1.930,0 1.596,8 1.385,2 1.245,9 -12,03 840,1 1.791,9 113,29
NEGARA LAINNYA/OTHER COUNTRIES 16.654,7 16.503,8 14.901,2 12.915,2 11.592,5 -9,24 7.419,1 10.972,3 47,89
6403 Footwear; with outer soles of rubber, plastics, leather or composition leather and
uppers of leather
115.111,9 116.533,4 110.113,2 119.371,5 118.128,6 0,76 76.007,8 105.822,7 39,23
AMERIKA SERIKAT/UNITED STATES 28.646,6 29.652,9 27.753,2 29.748,8 30.082,0 1,02 19.356,7 28.579,3 47,65
JERMAN/GERMANY 9.536,9 8.883,2 8.788,6 11.460,4 12.378,4 8,07 7.357,5 9.754,8 32,58
R.R. TIONGKOK/CINA 4.527,5 4.883,2 6.052,7 7.891,4 7.842,3 17,10 4.877,4 8.939,5 83,28
BELGIA/BELGIUM 11.129,1 11.162,8 9.800,2 10.297,7 8.811,9 -5,33 5.888,8 8.172,2 38,78
INGGRIS/UNITED KINGDOM 11.460,5 10.694,7 10.477,9 10.627,8 7.138,1 -9,09 4.850,1 6.252,5 28,91
NEGARA LAINNYA/OTHER COUNTRIES 49.811,2 51.256,7 47.240,6 49.345,3 51.875,9 0,43 33.677,3 44.124,4 31,02
6404 Footwear; with outer soles of rubber, plastics, leather or composition leather and
uppers of textile materials
40.888,4 54.672,5 58.621,6 75.909,1 84.847,0 19,58 60.102,9 64.447,9 7,23
AMERIKA SERIKAT/UNITED STATES 9.209,4 15.331,4 16.167,4 23.936,4 28.400,4 30,97 21.028,5 18.462,8 -12,20
R.R. TIONGKOK/CINA 1.147,1 1.456,2 2.821,2 4.999,3 7.721,9 65,65 5.592,7 7.433,0 32,90
BELGIA/BELGIUM 3.181,2 3.875,5 6.252,4 6.732,7 6.175,9 20,67 4.448,8 4.615,1 3,74
JEPANG/JAPAN 4.571,5 6.389,8 5.916,0 6.147,1 7.032,7 8,58 4.653,2 6.630,7 42,50
BELANDA/NETHERLANDS 2.655,2 2.473,0 2.043,6 3.226,8 3.684,8 9,65 2.425,1 3.496,4 44,17
NEGARA LAINNYA/OTHER COUNTRIES 20.124,1 25.146,7 25.421,1 30.866,8 31.831,3 11,87 21.954,5 23.809,9 8,45
59
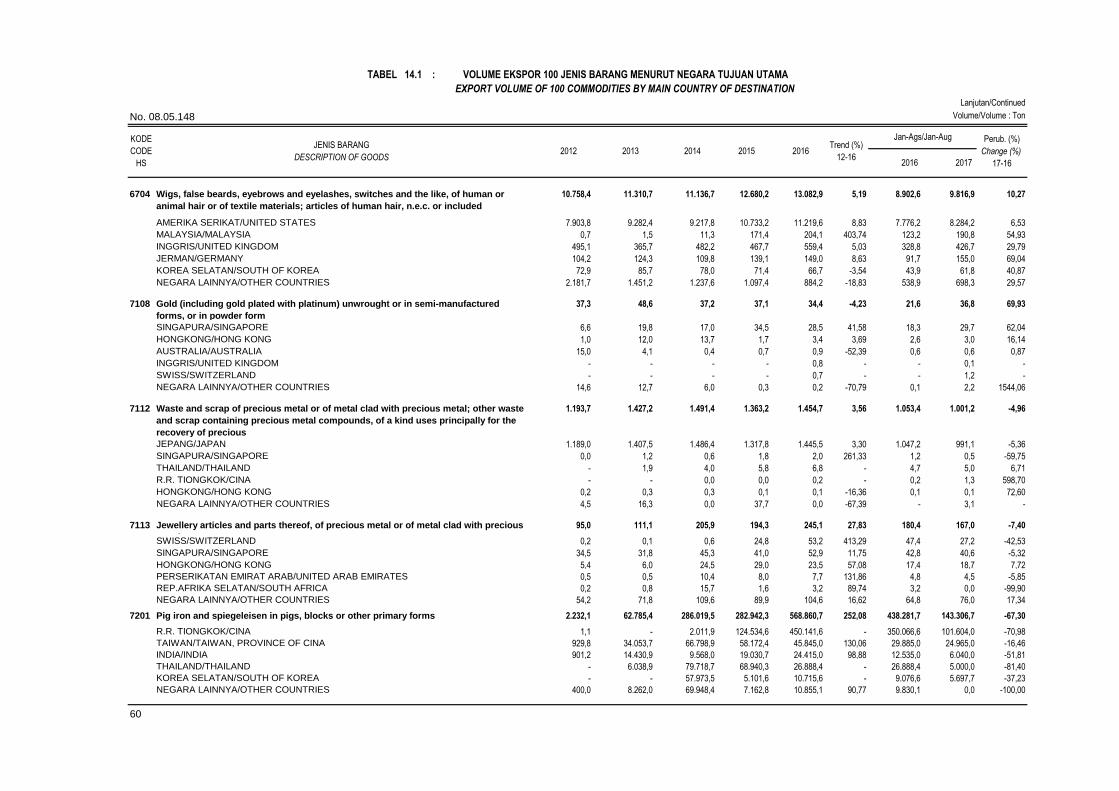
Lanjutan/Continued
Volume/Volume : TonNo. 08.05.148
2015 2016
2016 2017
20142012 2013
TABEL 14.1 : VOLUME EKSPOR 100 JENIS BARANG MENURUT NEGARA TUJUAN UTAMA
EXPORT VOLUME OF 100 COMMODITIES BY MAIN COUNTRY OF DESTINATION
KODE
CODE
HS
JENIS BARANG
DESCRIPTION OF GOODS
Trend (%)
12-16
Jan-Ags/Jan-Aug Perub. (%)
Change (%)
17-16
6704 Wigs, false beards, eyebrows and eyelashes, switches and the like, of human or
animal hair or of textile materials; articles of human hair, n.e.c. or included
10.758,4 11.310,7 11.136,7 12.680,2 13.082,9 5,19 8.902,6 9.816,9 10,27
AMERIKA SERIKAT/UNITED STATES 7.903,8 9.282,4 9.217,8 10.733,2 11.219,6 8,83 7.776,2 8.284,2 6,53
MALAYSIA/MALAYSIA 0,7 1,5 11,3 171,4 204,1 403,74 123,2 190,8 54,93
INGGRIS/UNITED KINGDOM 495,1 365,7 482,2 467,7 559,4 5,03 328,8 426,7 29,79
JERMAN/GERMANY 104,2 124,3 109,8 139,1 149,0 8,63 91,7 155,0 69,04
KOREA SELATAN/SOUTH OF KOREA 72,9 85,7 78,0 71,4 66,7 -3,54 43,9 61,8 40,87
NEGARA LAINNYA/OTHER COUNTRIES 2.181,7 1.451,2 1.237,6 1.097,4 884,2 -18,83 538,9 698,3 29,57
7108 Gold (including gold plated with platinum) unwrought or in semi-manufactured
forms, or in powder form
37,3 48,6 37,2 37,1 34,4 -4,23 21,6 36,8 69,93
SINGAPURA/SINGAPORE 6,6 19,8 17,0 34,5 28,5 41,58 18,3 29,7 62,04
HONGKONG/HONG KONG 1,0 12,0 13,7 1,7 3,4 3,69 2,6 3,0 16,14
AUSTRALIA/AUSTRALIA 15,0 4,1 0,4 0,7 0,9 -52,39 0,6 0,6 0,87
INGGRIS/UNITED KINGDOM - - - - 0,8 - - 0,1 -
SWISS/SWITZERLAND - - - - 0,7 - - 1,2 -
NEGARA LAINNYA/OTHER COUNTRIES 14,6 12,7 6,0 0,3 0,2 -70,79 0,1 2,2 1544,06
7112 Waste and scrap of precious metal or of metal clad with precious metal; other waste
and scrap containing precious metal compounds, of a kind uses principally for the
recovery of precious
1.193,7 1.427,2 1.491,4 1.363,2 1.454,7 3,56 1.053,4 1.001,2 -4,96
JEPANG/JAPAN 1.189,0 1.407,5 1.486,4 1.317,8 1.445,5 3,30 1.047,2 991,1 -5,36
SINGAPURA/SINGAPORE 0,0 1,2 0,6 1,8 2,0 261,33 1,2 0,5 -59,75
THAILAND/THAILAND - 1,9 4,0 5,8 6,8 - 4,7 5,0 6,71
R.R. TIONGKOK/CINA - - 0,0 0,0 0,2 - 0,2 1,3 598,70
HONGKONG/HONG KONG 0,2 0,3 0,3 0,1 0,1 -16,36 0,1 0,1 72,60
NEGARA LAINNYA/OTHER COUNTRIES 4,5 16,3 0,0 37,7 0,0 -67,39 - 3,1 -
7113 Jewellery articles and parts thereof, of precious metal or of metal clad with precious
metal
95,0 111,1 205,9 194,3 245,1 27,83 180,4 167,0 -7,40
SWISS/SWITZERLAND 0,2 0,1 0,6 24,8 53,2 413,29 47,4 27,2 -42,53
SINGAPURA/SINGAPORE 34,5 31,8 45,3 41,0 52,9 11,75 42,8 40,6 -5,32
HONGKONG/HONG KONG 5,4 6,0 24,5 29,0 23,5 57,08 17,4 18,7 7,72
PERSERIKATAN EMIRAT ARAB/UNITED ARAB EMIRATES 0,5 0,5 10,4 8,0 7,7 131,86 4,8 4,5 -5,85
REP.AFRIKA SELATAN/SOUTH AFRICA 0,2 0,8 15,7 1,6 3,2 89,74 3,2 0,0 -99,90
NEGARA LAINNYA/OTHER COUNTRIES 54,2 71,8 109,6 89,9 104,6 16,62 64,8 76,0 17,34
7201 Pig iron and spiegeleisen in pigs, blocks or other primary forms 2.232,1 62.785,4 286.019,5 282.942,3 568.860,7 252,08 438.281,7 143.306,7 -67,30
R.R. TIONGKOK/CINA 1,1 - 2.011,9 124.534,6 450.141,6 - 350.066,6 101.604,0 -70,98
TAIWAN/TAIWAN, PROVINCE OF CINA 929,8 34.053,7 66.798,9 58.172,4 45.845,0 130,06 29.885,0 24.965,0 -16,46
INDIA/INDIA 901,2 14.430,9 9.568,0 19.030,7 24.415,0 98,88 12.535,0 6.040,0 -51,81
THAILAND/THAILAND - 6.038,9 79.718,7 68.940,3 26.888,4 - 26.888,4 5.000,0 -81,40
KOREA SELATAN/SOUTH OF KOREA - - 57.973,5 5.101,6 10.715,6 - 9.076,6 5.697,7 -37,23
NEGARA LAINNYA/OTHER COUNTRIES 400,0 8.262,0 69.948,4 7.162,8 10.855,1 90,77 9.830,1 0,0 -100,00
60

Lanjutan/Continued
Volume/Volume : TonNo. 08.05.148
2015 2016
2016 2017
20142012 2013
TABEL 14.1 : VOLUME EKSPOR 100 JENIS BARANG MENURUT NEGARA TUJUAN UTAMA
EXPORT VOLUME OF 100 COMMODITIES BY MAIN COUNTRY OF DESTINATION
KODE
CODE
HS
JENIS BARANG
DESCRIPTION OF GOODS
Trend (%)
12-16
Jan-Ags/Jan-Aug Perub. (%)
Change (%)
17-16
7202 Ferro-alloys 101.683,9 85.071,7 122.492,8 202.604,6 432.346,4 45,68 187.467,8 862.113,2 359,87
R.R. TIONGKOK/CINA 2.046,8 5.311,2 13.190,8 131.065,6 339.870,3 283,07 125.446,7 775.990,5 518,58
KOREA SELATAN/SOUTH OF KOREA 23.790,2 23.961,7 29.391,7 24.057,6 44.231,7 13,25 29.521,2 24.765,5 -16,11
INDIA/INDIA - 299,5 2.176,4 10.174,1 27.462,5 - 17.222,0 43.613,5 153,24
TAIWAN/TAIWAN, PROVINCE OF CINA 5.209,8 2.805,7 14.718,4 6.712,9 9.419,2 22,84 6.150,7 12.568,0 104,34
JEPANG/JAPAN 7.422,0 10.595,0 14.914,9 7.866,8 4.394,1 -12,59 3.903,3 550,9 -85,89
NEGARA LAINNYA/OTHER COUNTRIES 63.215,1 42.098,6 48.100,7 22.727,6 6.968,7 -39,51 5.224,0 4.624,7 -11,47
7308 Structures of iron or steel and parts thereof; plates, rods, angles, shapes, sections,
tubes and the like, prepared for use in structures
139.789,1 128.463,8 192.293,1 105.504,9 171.594,7 2,15 129.129,8 68.013,1 -47,33
AUSTRALIA/AUSTRALIA 32.110,7 52.462,5 87.841,4 13.583,7 65.057,4 0,61 57.533,0 4.509,2 -92,16
AMERIKA SERIKAT/UNITED STATES 29.506,1 168,5 45.720,5 47.786,5 60.697,0 103,20 43.251,5 31.068,2 -28,17
SINGAPURA/SINGAPORE 34.434,2 33.563,0 18.625,8 7.984,0 11.376,9 -30,59 5.795,0 7.614,9 31,40
FEDERASI RUSIA/RUSSIA FEDERATION 15,7 - 0,1 - 3.343,1 - - 0,1 -
MALAYSIA/MALAYSIA 1.461,4 2.473,9 2.191,1 1.838,9 6.493,3 30,81 2.829,9 9.963,7 252,09
NEGARA LAINNYA/OTHER COUNTRIES 42.261,0 39.795,9 37.914,1 34.311,8 24.627,0 -11,56 19.720,4 14.856,9 -24,66
7403 Copper; refined and copper alloys, unwrought 69.102,9 71.052,1 109.998,0 97.154,5 161.264,4 22,24 93.015,9 150.090,6 61,36
MALAYSIA/MALAYSIA 31.485,2 33.574,8 34.732,1 40.251,9 60.028,5 15,86 41.174,8 57.221,4 38,97
VIETNAM/VIET NAM 3.917,1 6.607,3 10.775,2 14.124,7 38.229,0 70,17 20.989,4 27.683,1 31,89
THAILAND/THAILAND 23.972,7 20.600,3 28.798,6 20.333,5 30.814,2 5,01 17.472,5 34.661,4 98,38
R.R. TIONGKOK/CINA 6.221,4 7.181,3 17.293,7 14.360,7 13.910,8 25,89 5.702,4 16.162,9 183,44
TAIWAN/TAIWAN, PROVINCE OF CINA 3.102,4 2.252,8 8.057,7 6.351,9 9.687,0 39,29 6.364,6 6.811,7 7,02
NEGARA LAINNYA/OTHER COUNTRIES 404,1 835,6 10.340,8 1.731,9 8.594,8 98,24 1.312,2 7.550,2 475,40
7408 Copper wire 111.050,2 111.965,0 105.507,8 108.592,7 97.143,4 -2,94 63.699,3 71.173,6 11,73
INDIA/INDIA 300,0 1.780,1 3.533,0 12.156,1 22.706,0 187,91 14.182,3 23.194,1 63,54
R.R. TIONGKOK/CINA 25.544,4 27.375,2 23.391,1 20.218,0 22.098,6 -5,76 13.082,4 20.044,1 53,21
MALAYSIA/MALAYSIA 26.871,0 22.384,9 23.810,0 19.981,7 16.183,9 -10,66 11.018,7 11.221,0 1,84
THAILAND/THAILAND 21.499,0 22.963,0 20.820,1 19.594,8 12.190,1 -12,13 8.813,7 7.568,0 -14,13
VIETNAM/VIET NAM 11.792,3 16.007,4 18.033,7 16.856,5 12.069,8 0,99 8.017,7 2.385,7 -70,24
NEGARA LAINNYA/OTHER COUNTRIES 25.043,6 21.454,5 15.920,0 19.785,7 11.895,0 -14,53 8.584,6 6.760,6 -21,25
7501 Nickel mattes; nickel oxide sinters and other intermediate products of nickel
metallurgy
91.024,3 96.602,3 99.363,4 103.794,8 98.530,6 2,33 62.714,2 78.257,9 24,79
JEPANG/JAPAN 91.024,3 96.602,3 99.363,4 103.794,8 98.530,6 2,33 62.714,2 78.257,9 24,79
- - - - - - - 0,0 0,0 -
- - - - - - - 0,0 0,0 -
- - - - - - - 0,0 0,0 -
- - - - - - - 0,0 0,0 -
NEGARA LAINNYA/OTHER COUNTRIES - - - - - - 0,0 0,0 -
61

Lanjutan/Continued
Volume/Volume : TonNo. 08.05.148
2015 2016
2016 2017
20142012 2013
TABEL 14.1 : VOLUME EKSPOR 100 JENIS BARANG MENURUT NEGARA TUJUAN UTAMA
EXPORT VOLUME OF 100 COMMODITIES BY MAIN COUNTRY OF DESTINATION
KODE
CODE
HS
JENIS BARANG
DESCRIPTION OF GOODS
Trend (%)
12-16
Jan-Ags/Jan-Aug Perub. (%)
Change (%)
17-16
8001 Tin; unwrought 101.237,0 88.441,5 70.484,8 69.804,1 61.874,9 -11,50 36.293,7 63.067,0 73,77
SINGAPURA/SINGAPORE 58.621,9 50.340,1 49.355,2 39.289,5 27.306,2 -16,27 17.336,0 19.063,6 9,97
BELANDA/NETHERLANDS 5.923,6 7.063,5 6.334,3 7.203,7 7.188,9 4,15 3.392,2 8.902,7 162,45
JEPANG/JAPAN 7.022,8 7.358,5 4.161,7 4.613,5 5.565,6 -8,90 2.336,2 7.751,2 231,78
KOREA SELATAN/SOUTH OF KOREA 3.295,1 4.623,3 1.763,5 3.243,7 5.196,7 5,73 2.654,2 8.210,8 209,35
INDIA/INDIA 952,2 885,6 1.526,0 4.614,7 4.736,3 62,57 2.954,3 4.463,3 51,08
NEGARA LAINNYA/OTHER COUNTRIES 25.421,3 18.170,5 7.344,2 10.839,0 11.881,3 -18,44 7.620,8 14.675,3 92,57
8407 Reciprocating or rotary internal combustion piston engines 10.469,5 13.423,0 15.082,7 16.316,9 30.261,6 26,09 18.274,1 31.915,0 74,65
PILIPINA/PHILIPPINES 438,1 2.384,9 2.985,0 3.855,1 8.376,5 89,30 4.892,1 10.315,8 110,87
VIETNAM/VIET NAM 1.469,4 2.320,7 2.947,2 3.083,8 7.575,3 42,82 3.780,7 5.263,9 39,23
THAILAND/THAILAND 4,3 168,9 562,3 1.320,7 4.236,1 387,10 3.197,8 2.150,8 -32,74
MALAYSIA/MALAYSIA 1.379,3 1.882,1 2.463,2 2.780,5 4.321,9 30,66 2.477,4 9.054,0 265,47
TAIWAN/TAIWAN, PROVINCE OF CINA 1.735,2 1.163,5 1.156,8 1.232,0 3.025,7 12,40 2.260,3 1.682,6 -25,56
NEGARA LAINNYA/OTHER COUNTRIES 5.443,2 5.503,0 4.968,2 4.044,9 2.726,0 -15,56 1.665,8 3.447,8 106,98
8409 Parts suitable for use solely or principally with the engines of heading no. 8407 or
8408
36.776,1 46.928,2 38.221,5 42.996,5 43.000,7 2,28 28.833,6 45.903,0 59,20
THAILAND/THAILAND 27.498,3 36.062,5 27.556,9 26.135,7 24.504,0 -5,38 17.255,7 24.653,2 42,87
JEPANG/JAPAN 2.915,8 3.900,7 3.845,5 9.902,8 12.132,7 45,98 7.782,1 14.409,7 85,16
BRASILIA/BRAZIL 6,2 16,2 55,2 374,6 566,2 237,81 369,1 574,0 55,50
SINGAPURA/SINGAPORE 750,2 700,4 847,2 1.326,6 995,3 12,80 570,5 179,7 -68,50
R.R. TIONGKOK/CINA 156,8 205,0 323,8 452,2 1.630,6 72,89 922,8 2.182,5 136,51
NEGARA LAINNYA/OTHER COUNTRIES 5.448,8 6.043,3 5.593,0 4.804,6 3.172,0 -12,29 1.933,4 3.903,9 101,92
8418 Refrigerators, freezers and other refrigerating or freezing equipment, electric or
other; heat pumps other than air conditioning machines of heading no. 8415
103.877,7 94.657,5 84.998,5 69.118,8 72.977,3 -9,70 49.077,0 65.055,1 32,56
KOREA SELATAN/SOUTH OF KOREA 6.632,9 5.645,9 6.927,8 9.845,7 11.503,6 18,03 8.598,1 11.725,9 36,38
VIETNAM/VIET NAM 4.934,9 5.768,5 5.593,4 6.707,6 7.667,5 10,87 5.393,1 8.787,0 62,93
PILIPINA/PHILIPPINES 8.144,4 7.889,8 7.756,1 6.562,9 7.708,5 -2,90 5.281,3 5.316,1 0,66
JEPANG/JAPAN 808,3 2.032,6 4.146,2 6.395,2 6.146,7 68,26 4.481,6 5.174,6 15,46
INDIA/INDIA 166,8 491,5 851,3 1.123,3 1.366,5 65,42 1.080,5 1.177,4 8,96
NEGARA LAINNYA/OTHER COUNTRIES 83.190,4 72.829,3 59.723,6 38.484,2 38.584,5 -19,54 24.242,3 32.874,2 35,61
8419 Machinery, plant (not domestic), or laboratory equipment; electrically heated or not,
(excluding items in 85.14) for the treatment of materials by a process involving
change of
4.592,2 8.033,6 24.553,5 19.691,4 36.048,6 65,16 29.828,0 4.580,4 -84,64
FEDERASI RUSIA/RUSSIA FEDERATION - 0,3 109,1 7.431,1 23.256,9 - 21.975,4 2.823,3 -87,15
SINGAPURA/SINGAPORE 289,6 797,5 665,6 546,4 9.171,3 92,18 6.226,3 262,8 -95,78
PERSERIKATAN EMIRAT ARAB/UNITED ARAB EMIRATES 3,0 15,8 0,3 1,2 1.336,8 162,87 0,1 0,0 -63,98
KOREA SELATAN/SOUTH OF KOREA 41,1 52,0 63,5 160,8 285,5 64,95 37,3 23,2 -37,74
JEPANG/JAPAN 281,9 357,8 1.243,4 1.214,3 523,9 27,91 424,8 293,4 -30,93
NEGARA LAINNYA/OTHER COUNTRIES 3.976,6 6.810,1 22.471,7 10.337,6 1.474,1 -14,51 1.164,1 1.177,6 1,16
62

Lanjutan/Continued
Volume/Volume : TonNo. 08.05.148
2015 2016
2016 2017
20142012 2013
TABEL 14.1 : VOLUME EKSPOR 100 JENIS BARANG MENURUT NEGARA TUJUAN UTAMA
EXPORT VOLUME OF 100 COMMODITIES BY MAIN COUNTRY OF DESTINATION
KODE
CODE
HS
JENIS BARANG
DESCRIPTION OF GOODS
Trend (%)
12-16
Jan-Ags/Jan-Aug Perub. (%)
Change (%)
17-16
8443 Printing machinery; used for printing by means of plates, cylinders and other
printing components of heading 84.42; other printers, copying machines and
facsimile machines, whether or not textile, lea
86.381,8 69.349,3 79.203,2 75.895,8 72.294,9 -2,62 44.075,8 66.828,8 51,62
AMERIKA SERIKAT/UNITED STATES 23.147,2 20.266,6 23.888,8 24.210,1 23.242,5 1,88 14.662,5 20.717,2 41,29
JERMAN/GERMANY 16.984,7 11.016,3 12.560,0 13.340,0 13.990,9 -1,95 9.116,1 12.614,9 38,38
JEPANG/JAPAN 19.383,3 15.182,2 19.407,3 14.439,8 12.854,7 -8,35 5.748,4 10.622,2 84,79
SINGAPURA/SINGAPORE 5.556,8 6.202,5 4.636,9 7.003,9 4.726,5 -2,00 3.267,9 4.321,7 32,25
PILIPINA/PHILIPPINES 821,5 924,0 800,8 753,5 935,4 0,56 575,1 913,1 58,77
NEGARA LAINNYA/OTHER COUNTRIES 20.488,3 15.757,8 17.909,4 16.148,5 16.544,9 -3,95 10.705,9 17.639,7 64,77
8471 Automatic data processing machines and units thereof, magnetic or optical readers,
machines for transcribing data onto data media in coded form and machines for
processing such data, not
12.660,2 9.271,6 11.271,0 7.085,4 6.636,7 -14,45 4.161,6 5.314,1 27,69
SINGAPURA/SINGAPORE 7.661,5 5.889,3 8.019,8 4.654,4 4.598,6 -11,81 2.805,2 3.589,0 27,94
AMERIKA SERIKAT/UNITED STATES 1.113,0 984,5 857,0 723,4 649,2 -12,95 407,0 576,8 41,72
IRLANDIA/IRELAND 5,7 11,8 17,1 18,1 22,9 37,69 15,1 40,8 169,55
JEPANG/JAPAN 316,1 296,5 310,9 216,4 204,7 -11,17 131,1 201,6 53,75
R.R. TIONGKOK/CINA 621,2 553,8 306,5 200,8 145,3 -32,43 106,8 142,4 33,35
NEGARA LAINNYA/OTHER COUNTRIES 2.942,6 1.535,7 1.759,7 1.272,3 1.016,1 -20,67 696,3 763,5 9,65
8504 Electric transformers, static converters (e.g. rectifiers) and inductors 27.654,4 21.835,0 20.298,5 20.819,8 19.030,7 -7,64 11.523,4 33.431,3 190,12
SINGAPURA/SINGAPORE 2.861,3 2.277,0 2.275,4 2.402,9 4.311,6 9,13 1.414,0 20.578,6 1355,37
PERANCIS/FRANCE 2.465,3 2.383,6 2.343,0 2.375,3 2.337,0 -1,10 1.552,3 2.343,8 50,99
JEPANG/JAPAN 3.273,8 3.072,8 3.329,8 2.904,8 2.421,4 -6,38 1.601,9 1.837,1 14,68
MALAYSIA/MALAYSIA 2.554,1 4.444,4 2.779,2 3.105,5 2.426,5 -4,50 1.531,4 3.391,2 121,44
R.R. TIONGKOK/CINA 1.259,0 1.490,2 1.301,3 1.296,8 1.213,0 -2,11 753,7 1.057,8 40,35
NEGARA LAINNYA/OTHER COUNTRIES 15.240,9 8.167,1 8.269,7 8.734,4 6.321,2 -15,57 4.670,0 4.222,8 -9,58
8506 Cells and batteries; primary 62.677,1 62.038,7 64.610,6 67.032,4 59.844,0 -0,15 39.548,8 49.955,4 26,31
SINGAPURA/SINGAPORE 3.981,7 4.431,0 4.294,0 4.155,6 3.155,2 -5,16 2.242,4 2.888,9 28,83
AMERIKA SERIKAT/UNITED STATES 6.823,5 6.430,8 6.712,9 9.330,5 10.601,1 13,35 6.153,5 8.771,5 42,54
JEPANG/JAPAN 4.439,4 4.334,8 4.382,8 3.591,4 3.449,0 -6,70 2.294,3 2.963,3 29,16
HONGKONG/HONG KONG 1.928,7 1.711,3 1.798,4 1.512,6 1.535,4 -5,63 1.046,0 1.319,1 26,10
BELANDA/NETHERLANDS 1.490,5 1.623,6 1.971,2 1.536,4 718,0 -14,07 517,9 661,3 27,67
NEGARA LAINNYA/OTHER COUNTRIES 44.013,4 43.507,2 45.451,3 46.905,9 40.385,2 -0,96 27.294,6 33.351,4 22,19
8507 Electric accumulators, including separators therefor; whether or not rectangular
(including square)
100.084,3 84.267,3 76.086,3 86.514,0 94.749,7 -0,83 59.175,6 76.619,5 29,48
MALAYSIA/MALAYSIA 12.383,9 9.172,5 8.665,7 11.115,7 15.980,5 7,27 9.906,6 9.800,8 -1,07
SINGAPURA/SINGAPORE 1.889,2 2.111,4 2.346,5 3.356,3 2.871,4 13,89 2.236,3 1.426,8 -36,20
INGGRIS/UNITED KINGDOM 16.268,4 17.096,9 12.965,3 18.650,6 23.242,7 8,33 14.470,5 16.546,4 14,35
JEPANG/JAPAN 1.648,5 1.438,2 749,8 296,9 1.317,6 -18,34 450,3 1.530,5 239,90
PERSERIKATAN EMIRAT ARAB/UNITED ARAB EMIRATES 7.159,8 8.140,7 9.273,1 7.312,6 5.804,1 -5,13 4.165,0 5.426,0 30,28
NEGARA LAINNYA/OTHER COUNTRIES 60.734,5 46.307,6 42.085,9 45.781,9 45.533,4 -5,71 27.946,9 41.889,0 49,89
63

Lanjutan/Continued
Volume/Volume : TonNo. 08.05.148
2015 2016
2016 2017
20142012 2013
TABEL 14.1 : VOLUME EKSPOR 100 JENIS BARANG MENURUT NEGARA TUJUAN UTAMA
EXPORT VOLUME OF 100 COMMODITIES BY MAIN COUNTRY OF DESTINATION
KODE
CODE
HS
JENIS BARANG
DESCRIPTION OF GOODS
Trend (%)
12-16
Jan-Ags/Jan-Aug Perub. (%)
Change (%)
17-16
8518 Microphones and their stands; loudspeakers, mounted or not in their enclosures;
headphones and earphones, combined or not with a microphone, and sets of a
microphone and one or more
27.552,4 36.560,2 35.409,0 34.412,7 34.519,3 3,98 23.238,1 26.606,4 14,49
AMERIKA SERIKAT/UNITED STATES 3.679,4 8.849,8 9.710,8 11.140,4 11.097,1 27,61 7.402,6 7.538,7 1,84
JEPANG/JAPAN 3.495,1 3.304,8 3.477,0 2.975,6 3.145,5 -3,11 2.101,9 2.547,5 21,20
SINGAPURA/SINGAPORE 4.223,2 4.557,5 4.286,7 3.226,5 2.893,6 -10,43 1.990,5 2.098,1 5,41
R.R. TIONGKOK/CINA 1.529,9 1.661,8 1.869,9 1.779,5 2.139,8 7,67 1.526,3 1.701,7 11,50
JERMAN/GERMANY 2.153,4 2.441,3 2.448,5 2.939,4 2.946,0 8,46 1.933,6 2.241,6 15,93
NEGARA LAINNYA/OTHER COUNTRIES 12.471,4 15.744,9 13.616,1 12.351,3 12.297,2 -2,67 8.283,3 10.478,8 26,51
8521 Video recording or reproducing apparatus 38.502,2 28.011,6 21.513,6 18.380,6 13.736,9 -21,98 9.835,3 4.947,3 -49,70
AMERIKA SERIKAT/UNITED STATES 2.144,9 3.000,2 4.424,4 5.480,3 3.987,9 20,24 2.644,6 2.163,9 -18,18
KOREA SELATAN/SOUTH OF KOREA 1.905,4 1.627,2 1.383,6 893,1 676,5 -23,44 542,7 16,7 -96,92
SLOVAKIA/SLOVAKIA 772,7 564,2 178,5 474,9 796,0 -1,12 472,5 299,5 -36,62
PERANCIS/FRANCE 2.514,1 1.218,1 1.456,8 1.482,3 1.194,9 -12,11 848,1 341,4 -59,75
INGGRIS/UNITED KINGDOM 1.322,0 687,4 286,0 389,2 678,9 -17,32 356,7 415,4 16,45
NEGARA LAINNYA/OTHER COUNTRIES 29.843,2 20.914,6 13.784,2 9.660,8 6.402,7 -31,96 4.970,8 1.710,5 -65,59
8528 Monitors and projectors, not incorporating television reception apparatus; reception
apparatus for television, whether or not incorporating radio-broadcast receivers or
sound or video
41.248,2 29.110,5 27.326,1 26.821,2 25.004,6 -10,26 16.016,9 19.431,2 21,32
AMERIKA SERIKAT/UNITED STATES 5.615,8 4.625,9 4.127,4 5.004,6 6.402,7 3,47 4.007,5 3.891,8 -2,89
BELANDA/NETHERLANDS 382,4 1.410,0 913,1 1.438,4 1.303,9 28,06 908,8 1.467,3 61,45
MALAYSIA/MALAYSIA 1.972,9 1.313,1 1.349,9 1.837,9 2.448,5 7,98 1.532,1 2.140,9 39,74
THAILAND/THAILAND 7.379,3 4.211,4 3.288,6 3.464,5 2.100,7 -23,72 1.485,1 3.026,5 103,78
INGGRIS/UNITED KINGDOM 1.190,1 827,6 731,6 334,9 1.051,9 -10,88 392,3 4,6 -98,83
NEGARA LAINNYA/OTHER COUNTRIES 24.707,6 16.722,5 16.915,5 14.741,1 11.696,8 -14,97 7.691,1 8.900,2 15,72
8529 Transmission apparatus; parts suitable for use solely or principally with the
apparatus of heading no. 8525 to 8528
11.848,9 13.094,7 9.417,3 7.208,0 5.430,3 -19,41 3.763,3 4.089,8 8,68
KOREA SELATAN/SOUTH OF KOREA 612,8 699,5 925,8 1.025,2 828,3 10,35 544,3 549,6 0,98
SINGAPURA/SINGAPORE 2.677,0 1.944,5 1.505,5 334,1 149,6 -52,91 119,1 91,3 -23,33
AMERIKA SERIKAT/UNITED STATES 401,1 501,7 1.055,5 1.628,6 946,9 33,58 748,2 497,6 -33,49
POLANDIA/POLAND 277,6 1.179,2 374,0 251,1 283,7 -13,96 153,4 226,8 47,82
R.R. TIONGKOK/CINA 571,5 439,4 205,3 184,5 413,7 -14,05 238,3 338,7 42,09
NEGARA LAINNYA/OTHER COUNTRIES 7.308,9 8.330,3 5.351,2 3.784,5 2.808,1 -23,68 1.960,0 2.385,8 21,73
8532 Electrical capacitors; fixed, variable or adjustable (pre-set) 7.719,4 8.902,5 9.650,5 9.129,1 10.046,2 5,68 6.715,6 9.105,1 35,58
SINGAPURA/SINGAPORE 4.891,2 5.457,7 5.650,8 4.990,0 5.418,1 1,16 3.615,5 4.998,3 38,25
HONGKONG/HONG KONG 890,0 958,7 1.123,8 944,9 824,9 -1,65 516,2 743,4 44,00
TAIWAN/TAIWAN, PROVINCE OF CINA 176,4 160,9 200,0 193,4 159,0 -0,24 103,1 117,8 14,22
R.R. TIONGKOK/CINA 421,5 502,1 606,2 587,5 619,1 9,70 433,8 562,5 29,65
JEPANG/JAPAN 126,8 296,2 339,5 312,6 445,2 29,24 344,1 255,7 -25,69
NEGARA LAINNYA/OTHER COUNTRIES 1.213,5 1.526,9 1.730,3 2.100,7 2.580,0 20,05 1.702,8 2.427,4 42,56
64

Lanjutan/Continued
Volume/Volume : TonNo. 08.05.148
2015 2016
2016 2017
20142012 2013
TABEL 14.1 : VOLUME EKSPOR 100 JENIS BARANG MENURUT NEGARA TUJUAN UTAMA
EXPORT VOLUME OF 100 COMMODITIES BY MAIN COUNTRY OF DESTINATION
KODE
CODE
HS
JENIS BARANG
DESCRIPTION OF GOODS
Trend (%)
12-16
Jan-Ags/Jan-Aug Perub. (%)
Change (%)
17-16
8536 Electrical apparatus for switching, protecting electrical circuits, for making
connections to or in electrical circuits, for a voltage not exceeding 1000 volts;
connectors for optical fibres, optical
13.395,4 13.752,5 13.021,1 12.792,6 15.567,3 2,31 10.697,1 12.834,1 19,98
SINGAPURA/SINGAPORE 4.323,4 4.745,8 4.662,8 3.647,1 4.657,4 -1,14 3.549,0 3.334,4 -6,05
PERANCIS/FRANCE 2.086,7 2.122,9 1.849,5 1.803,4 2.070,5 -1,77 1.471,1 1.469,7 -0,09
JEPANG/JAPAN 1.244,3 1.225,0 1.431,5 1.348,7 1.419,6 3,66 935,5 1.197,1 27,97
AMERIKA SERIKAT/UNITED STATES 680,2 919,3 790,8 1.082,0 1.560,7 20,01 976,0 1.547,6 58,57
HONGKONG/HONG KONG 1.940,3 1.012,2 442,4 398,0 1.096,7 -18,74 629,9 1.203,0 90,98
NEGARA LAINNYA/OTHER COUNTRIES 3.120,4 3.727,3 3.844,2 4.513,5 4.762,6 10,93 3.135,7 4.082,2 30,18
8542 Electronic integrated circuits 1.793,6 1.757,0 1.458,8 1.223,1 1.117,9 -12,26 753,8 968,9 28,52
SINGAPURA/SINGAPORE 1.126,8 1.036,4 1.010,7 830,8 658,8 -12,14 456,4 649,6 42,34
HONGKONG/HONG KONG 17,1 17,4 55,6 98,7 24,7 28,10 10,8 33,5 211,61
JERMAN/GERMANY 138,5 152,7 123,8 98,7 94,4 -11,34 68,3 73,1 7,01
R.R. TIONGKOK/CINA 6,5 5,3 10,1 19,5 12,2 29,26 8,7 7,3 -16,02
JEPANG/JAPAN 54,6 48,0 44,6 46,4 34,2 -9,22 22,1 34,0 53,80
NEGARA LAINNYA/OTHER COUNTRIES 450,1 497,3 213,9 128,9 293,5 -19,79 187,6 171,3 -8,68
8544 Insulated wire, cable and other electric conductors, connector fitted or not; optical
fibre cables of individually sheathed fibres, whether or not assembled with electric
conductors or fitted with
86.114,0 92.520,9 88.351,4 94.629,5 94.928,7 2,20 63.215,8 75.510,9 19,45
JEPANG/JAPAN 31.158,9 32.208,3 34.965,4 37.564,8 39.175,5 6,31 24.775,5 38.590,2 55,76
AMERIKA SERIKAT/UNITED STATES 20.265,9 19.813,0 19.008,7 15.398,4 15.338,8 -7,77 10.098,2 12.316,6 21,97
SINGAPURA/SINGAPORE 9.700,6 8.808,9 9.868,5 9.118,5 11.173,4 3,22 7.663,2 6.447,2 -15,87
THAILAND/THAILAND 1.829,2 2.878,1 3.432,4 5.267,6 4.848,1 29,10 3.273,4 3.661,0 11,84
AUSTRALIA/AUSTRALIA 2.817,5 2.581,4 2.848,0 3.421,9 4.026,2 10,47 2.944,1 1.128,6 -61,67
NEGARA LAINNYA/OTHER COUNTRIES 20.341,9 26.231,2 18.228,4 23.858,3 20.366,7 -0,92 14.461,4 13.367,2 -7,57
8703 Motor cars and other motor vehicles; principally designed for the transport of
persons (other than those of heading no. 8702), including station wagons and racing
cars
226.361,1 209.046,1 273.825,6 270.594,9 283.160,3 7,31 176.597,3 290.625,1 64,57
PILIPINA/PHILIPPINES 32.770,2 32.708,3 57.381,8 54.282,1 107.471,8 33,40 69.887,5 104.641,9 49,73
SAUDI ARABIA/SAUDI ARABIA 54.138,2 53.496,3 70.742,9 92.659,4 50.311,1 4,11 34.939,5 42.857,8 22,66
THAILAND/THAILAND 46.863,2 37.970,9 31.343,8 13.247,2 18.392,2 -25,35 10.023,2 17.752,3 77,11
JEPANG/JAPAN 12.934,8 11.801,0 13.361,5 13.537,6 13.763,4 2,65 9.287,3 12.288,0 32,31
MALAYSIA/MALAYSIA 15.531,3 9.011,9 6.588,2 6.613,3 12.225,6 -7,58 4.077,5 9.084,8 122,80
NEGARA LAINNYA/OTHER COUNTRIES 64.123,4 64.057,7 94.407,4 90.255,3 80.996,2 8,44 48.382,2 104.000,4 114,96
8708 Motor vehicles; parts and accessories, of heading no. 8701 to 8705 178.468,4 186.263,0 199.995,6 235.292,4 258.462,4 10,23 168.435,6 222.430,6 32,06
THAILAND/THAILAND 39.704,5 37.982,9 39.965,8 55.118,5 67.268,0 15,34 45.576,3 54.807,6 20,25
MALAYSIA/MALAYSIA 20.939,0 25.170,6 24.162,7 28.418,4 35.129,5 12,26 21.982,5 28.314,3 28,80
JEPANG/JAPAN 48.496,3 45.731,9 45.615,0 55.838,4 50.684,5 2,92 33.242,6 40.807,7 22,76
MEKSIKO/MEXICO 1.051,5 1.576,1 7.719,5 9.365,9 10.878,1 90,70 7.566,0 7.795,4 3,03
BRASILIA/BRAZIL 6.598,7 7.907,6 8.624,7 9.732,9 7.622,9 5,09 5.029,3 7.008,7 39,36
NEGARA LAINNYA/OTHER COUNTRIES 61.678,5 67.893,9 73.907,8 76.818,2 86.879,5 8,42 55.038,8 83.696,8 52,07
65

Lanjutan/Continued
Volume/Volume : TonNo. 08.05.148
2015 2016
2016 2017
20142012 2013
TABEL 14.1 : VOLUME EKSPOR 100 JENIS BARANG MENURUT NEGARA TUJUAN UTAMA
EXPORT VOLUME OF 100 COMMODITIES BY MAIN COUNTRY OF DESTINATION
KODE
CODE
HS
JENIS BARANG
DESCRIPTION OF GOODS
Trend (%)
12-16
Jan-Ags/Jan-Aug Perub. (%)
Change (%)
17-16
8711 Motorcycles (including mopeds) and cycles; fitted with an auxiliary motor, with or
without side-cars; side-cars
19.935,9 13.196,7 15.030,8 36.653,9 42.504,6 28,86 27.792,5 55.778,7 100,70
PILIPINA/PHILIPPINES 9.208,4 3.840,8 5.148,8 8.264,8 16.843,8 21,82 10.266,4 22.172,1 115,97
THAILAND/THAILAND 2.201,5 1.928,2 890,7 7.714,1 5.904,4 39,93 3.349,9 8.908,7 165,94
JEPANG/JAPAN 102,9 91,4 723,7 3.506,9 3.185,1 186,12 2.300,2 2.713,1 17,95
VIETNAM/VIET NAM 34,8 833,7 1.737,0 1.001,4 2.331,9 136,15 1.040,8 4.100,9 294,03
TURKI/TURKEY - - 96,3 487,6 1.132,3 - 967,9 746,7 -22,85
NEGARA LAINNYA/OTHER COUNTRIES 8.388,3 6.502,6 6.434,4 15.679,1 13.107,2 19,40 9.867,4 17.137,1 73,67
8714 Vehicles; parts and accessories of heading no. 8711 to 8713 48.281,7 48.609,8 51.403,4 51.504,4 56.918,8 3,95 36.502,1 58.138,9 59,28
SINGAPURA/SINGAPORE 23.196,4 17.379,7 22.583,2 19.843,4 15.660,1 -6,32 10.377,7 13.488,0 29,97
PILIPINA/PHILIPPINES 2.058,6 5.567,1 7.419,2 9.208,5 14.997,3 56,44 9.208,8 17.042,0 85,06
MALAYSIA/MALAYSIA 4.177,2 4.128,1 3.499,5 3.556,6 5.363,5 3,57 3.211,2 5.826,4 81,44
JEPANG/JAPAN 2.817,9 2.869,3 4.278,1 3.264,0 3.356,1 4,90 2.220,5 4.523,5 103,72
THAILAND/THAILAND 4.457,7 6.587,8 2.973,1 3.504,3 3.885,7 -8,66 2.442,7 4.027,8 64,89
NEGARA LAINNYA/OTHER COUNTRIES 11.573,9 12.077,7 10.650,3 12.127,6 13.656,1 3,41 9.041,1 13.231,2 46,34
9401 Seats (not those of heading no. 9402), whether or not convertible into beds and parts
thereof
134.861,0 120.314,6 113.959,8 110.133,5 108.028,2 -5,18 72.999,2 81.179,1 11,21
AMERIKA SERIKAT/UNITED STATES 28.584,9 29.547,4 28.140,6 28.052,1 27.399,2 -1,36 18.130,2 21.584,8 19,05
JERMAN/GERMANY 10.077,0 7.705,0 8.784,9 8.570,2 8.358,5 -2,64 5.687,2 6.348,8 11,63
INGGRIS/UNITED KINGDOM 7.549,1 6.938,7 6.772,7 6.162,2 5.600,2 -6,91 4.310,9 4.437,3 2,93
JEPANG/JAPAN 8.910,2 7.599,4 6.638,1 6.007,5 6.892,9 -7,21 4.974,9 4.688,4 -5,76
BELANDA/NETHERLANDS 9.131,5 7.597,4 7.371,4 6.688,1 7.570,3 -4,90 5.103,8 6.067,9 18,89
NEGARA LAINNYA/OTHER COUNTRIES 70.608,3 60.926,9 56.252,1 54.653,4 52.207,2 -6,88 34.792,1 38.052,0 9,37
9403 Furniture and parts thereof, n.e.c. in chapter 94 466.104,8 437.318,8 445.423,7 395.785,9 360.964,4 -5,93 238.402,7 297.761,8 24,90
AMERIKA SERIKAT/UNITED STATES 122.513,0 125.773,6 120.451,2 121.920,1 109.214,1 -2,58 72.116,1 97.491,5 35,19
JEPANG/JAPAN 92.566,4 83.990,9 76.666,3 60.243,0 62.581,2 -10,55 40.648,2 49.595,9 22,01
PERANCIS/FRANCE 30.762,0 27.367,4 36.188,8 27.639,8 25.148,8 -3,85 17.043,8 15.097,9 -11,42
BELANDA/NETHERLANDS 17.067,0 14.738,5 16.372,7 15.715,2 16.275,7 -0,31 10.807,5 16.941,9 56,76
AUSTRALIA/AUSTRALIA 13.572,5 14.524,1 13.914,3 12.662,4 12.075,7 -3,64 7.352,2 9.643,6 31,17
NEGARA LAINNYA/OTHER COUNTRIES 189.623,9 170.924,3 181.830,5 157.605,5 135.668,9 -7,23 90.435,0 108.991,0 20,52
9503 Tricycles, scooters, pedal cars and similar wheeled toys; dolls' carriages; dolls;
other toys; reduced-size (scale) models and similar recreational models, working or
not; puzzles of all kinds
30.713,5 34.320,9 27.894,8 28.015,6 22.602,1 -7,84 15.210,0 22.615,2 48,69
AMERIKA SERIKAT/UNITED STATES 12.217,4 13.240,1 10.791,0 10.447,6 8.702,8 -8,75 5.356,5 8.216,6 53,39
SINGAPURA/SINGAPORE 328,0 410,4 383,7 744,4 779,5 26,20 583,0 604,7 3,73
INGGRIS/UNITED KINGDOM 2.625,1 3.116,2 2.856,1 2.666,7 2.264,1 -4,42 1.341,4 2.256,5 68,21
JERMAN/GERMANY 1.216,7 1.241,3 964,9 894,5 982,7 -7,27 669,7 965,8 44,21
JEPANG/JAPAN 181,8 194,9 374,8 552,7 814,5 49,81 464,9 878,0 88,83
NEGARA LAINNYA/OTHER COUNTRIES 14.144,4 16.118,0 12.524,4 12.709,7 9.058,7 -10,67 6.794,4 9.693,6 42,67
Sumber/Source : Badan Pusat Statistik (diolah, Pusat Data dan Sistem Informasi, Kementerian Perdagangan)/Central Board of Statistics (processed by Trade Data Centre, Ministry of Trade)
66

Lanjutan/Continued
Nilai/Value : Ribu/Thousand US$
0303 Fish; frozen, excluding fish fillets and other fish meat of heading 0304 519.856,2 466.889,4 407.525,3 329.170,0 388.913,0 -8,88 241.801,1 383.368,8 58,55
TANJUNG PRIOK 220.313,9 186.461,1 150.913,1 157.099,0 182.787,0 -5,30 112.619,0 224.393,5 99,25
TANJUNG PERAK 122.937,6 109.814,9 115.995,4 146.499,1 158.229,6 8,25 101.008,6 120.630,2 19,43
BELAWAN 10.646,0 13.875,0 9.941,9 12.153,3 22.506,3 14,62 15.421,3 19.567,2 26,88
TANJUNG EMAS 9.471,0 4.400,3 3.757,8 5.358,8 12.605,3 7,99 6.907,2 10.671,4 54,50
BITUNG 27.988,2 9.644,6 6.172,4 4.294,7 7.625,8 -28,89 2.702,7 2.641,1 -2,28
PELABUHAN LAINNYA/OTHER PORTS 128.499,6 142.693,6 120.744,7 3.765,1 5.159,1 -63,45 3.142,2 5.465,3 73,93
0304 Fish fillets and other fish meat (whether or not minced); fresh, chilled or frozen 423.212,9 384.057,9 413.554,8 430.697,1 427.299,3 1,35 277.917,9 353.116,0 27,06
TANJUNG PERAK 88.766,9 75.079,6 78.480,8 132.931,2 138.969,5 15,81 92.651,8 122.862,0 32,61
TANJUNG PRIOK 132.286,5 124.681,3 142.647,4 135.035,5 123.489,4 -0,58 78.917,2 118.806,8 50,55
BELAWAN 77.374,3 72.604,3 84.103,4 77.744,6 68.134,9 -1,84 45.036,7 52.253,1 16,02
TANJUNG EMAS 41.742,2 41.702,1 29.569,1 38.501,5 28.980,7 -7,78 19.423,4 14.833,2 -23,63
BITUNG 15.939,0 13.312,0 15.019,4 8.063,7 23.280,8 2,60 14.456,3 12.984,9 -10,18
PELABUHAN LAINNYA/OTHER PORTS 67.104,1 56.678,6 63.734,6 38.420,6 44.444,0 -11,42 27.432,4 31.376,0 14,38
0306 Crustaceans; in shell or not, live, fresh, chilled, frozen, dried, salted or in brine; smoked,
cooked or not before or during smoking; in shell, steamed or boiled, whether or not
chilled,
1.206.543,8 1.481.284,3 1.815.229,8 1.356.322,5 1.464.398,7 3,04 976.081,3 1.363.685,4 39,71
TANJUNG PERAK 426.100,7 538.273,3 688.663,4 616.652,4 630.504,1 9,63 429.853,3 578.512,9 34,58
TANJUNG PRIOK 248.160,9 276.483,6 436.517,9 294.481,1 394.225,5 10,39 245.910,7 409.865,3 66,67
PANJANG 164.318,8 177.774,7 209.646,5 149.467,4 115.463,7 -8,42 87.335,3 64.288,1 -26,39
BELAWAN 66.314,7 94.780,3 130.781,1 78.556,2 100.930,7 6,74 62.915,2 91.681,9 45,72
LINGKAS TARAKAN 50.636,4 72.455,3 99.650,9 78.300,1 62.084,0 4,97 41.167,1 32.248,8 -21,66
PELABUHAN LAINNYA/OTHER PORTS 251.012,3 321.517,1 249.970,0 138.865,4 161.190,7 -15,85 108.899,7 187.088,4 71,80
0307 Molluscs; whether in shell or not, live, fresh, chilled, frozen, dried, salted or in brine;
smoked molluscs, whether in shell or not, cooked or not before or during the smoking
process; flours, meals
197.779,0 174.524,5 173.604,8 232.117,2 342.946,1 14,87 189.410,2 292.492,1 54,42
TANJUNG PRIOK 51.262,9 55.619,1 57.930,0 105.047,9 187.831,9 38,17 96.605,8 143.706,4 48,76
TANJUNG PERAK 60.498,1 36.886,8 40.814,0 51.446,7 77.091,5 8,52 42.499,2 58.956,5 38,72
BELAWAN 46.126,8 41.475,9 47.882,9 49.134,1 55.167,2 5,42 35.480,1 68.099,2 91,94
TANJUNG EMAS 2.737,2 1.416,9 1.210,5 2.984,4 10.339,3 40,54 6.129,8 8.739,7 42,58
UJUNGPANDANG 5.455,2 1.546,5 2.469,2 5.074,1 4.605,0 8,86 3.178,8 6.008,4 89,01
PELABUHAN LAINNYA/OTHER PORTS 31.698,9 37.579,3 23.298,2 18.430,1 7.911,1 -29,45 5.516,5 6.981,9 26,56
0801 Nuts, edible; coconuts, Brazil nuts and cashew nuts, fresh or dried, whether or not shelled
or peeled
213.959,8 224.822,5 346.571,4 399.372,0 373.433,2 18,39 187.026,9 423.279,8 126,32
TANJUNG PERAK 83.060,2 67.886,4 90.817,2 150.935,7 110.232,3 14,63 33.620,2 111.337,2 231,16
UJUNGPANDANG 18.032,7 25.186,8 25.473,9 40.918,2 55.917,2 31,63 35.962,1 29.331,7 -18,44
BELAWAN 32.332,4 45.335,9 71.997,8 52.503,0 50.463,3 10,93 32.103,8 56.952,6 77,40
MUSI RIVER/BOOM BARU 3.036,2 1.660,5 28.522,7 37.384,5 36.907,4 125,01 18.137,0 42.353,3 133,52
TANJUNG PRIOK 12.950,5 17.950,7 32.762,9 31.009,6 26.478,8 21,86 15.406,9 69.966,4 354,12
PELABUHAN LAINNYA/OTHER PORTS 64.547,8 66.802,1 96.996,9 86.620,9 93.434,1 10,51 51.796,8 113.338,5 118,81
27
No. 08.05.148
2015 2016
2016 2017
20142012 2013
TABEL 15 : NILAI EKSPOR 100 JENIS BARANG MENURUT PELABUHAN MUAT UTAMA
EXPORT VALUE OF 100 COMMODITIES BY MAIN PORT OF EMBARKATION
KODE
CODE
HS
JENIS BARANG
DESCRIPTION OF GOODS
Trend (%)
12-16
Jan-Ags/Jan-Aug Perub. (%)
Change (%)
17-16

Lanjutan/Continued
Nilai/Value : Ribu/Thousand US$No. 08.05.148
2015 2016
2016 2017
20142012 2013
TABEL 15 : NILAI EKSPOR 100 JENIS BARANG MENURUT PELABUHAN MUAT UTAMA
EXPORT VALUE OF 100 COMMODITIES BY MAIN PORT OF EMBARKATION
KODE
CODE
HS
JENIS BARANG
DESCRIPTION OF GOODS
Trend (%)
12-16
Jan-Ags/Jan-Aug Perub. (%)
Change (%)
17-16
0802 Nuts (excluding coconuts, Brazils and cashew nuts); fresh or dried, whether or not shelled
or peeled
157.682,0 170.730,9 268.338,9 326.247,2 281.627,2 19,81 203.429,0 291.783,2 43,43
BELAWAN 85.331,5 101.034,0 153.842,2 179.841,6 158.546,3 19,91 114.584,9 147.377,2 28,62
JAMBI 3.586,1 4.391,8 19.904,0 50.590,1 52.321,7 118,25 34.955,2 69.919,4 100,03
TANJUNG PRIOK 21.999,6 23.988,1 40.072,0 40.653,4 35.331,9 15,89 26.964,0 42.300,5 56,88
KUALA TUNGKAL 24.193,9 18.342,8 23.393,6 20.831,6 11.895,3 -12,13 9.123,5 14.349,0 57,27
MUSI RIVER/BOOM BARU 12.370,7 13.195,8 15.069,1 14.442,2 8.386,6 -6,64 6.417,1 6.347,3 -1,09
PELABUHAN LAINNYA/OTHER PORTS 10.200,2 9.778,3 16.058,0 19.888,3 15.145,4 16,19 11.384,2 11.489,6 0,93
0901 Coffee, whether or not roasted or decaffeinated; husks and skins; coffee substitutes
containing coffee in any proportion
1.249.518,8 1.174.044,5 1.039.609,5 1.197.735,1 1.008.549,1 -4,00 550.253,6 1.046.935,2 90,26
PANJANG 604.020,7 692.573,2 432.633,2 581.370,9 442.823,1 -7,65 202.319,7 555.390,2 174,51
BELAWAN 412.832,0 267.536,6 384.658,5 391.569,0 350.216,9 0,52 230.894,7 300.922,3 30,33
TANJUNG PERAK 180.817,4 175.677,1 179.047,3 178.451,2 177.482,1 -0,22 99.598,8 155.676,3 56,30
UJUNGPANDANG 17.852,7 8.493,2 16.136,2 17.513,6 13.000,5 0,90 6.139,5 1.370,4 -77,68
TANJUNG EMAS 16.368,2 17.268,6 15.573,8 14.470,2 8.015,1 -14,83 4.640,8 7.144,6 53,95
PELABUHAN LAINNYA/OTHER PORTS 17.627,8 12.495,8 11.560,6 14.360,1 17.011,3 0,68 6.660,1 26.431,3 296,86
0904 Pepper of the genus piper; dried or crushed or ground fruits of the genus capsicum or of
the genus pimenta
435.257,1 354.712,1 330.032,0 559.241,8 441.352,9 4,95 222.594,0 212.291,1 -4,63
PANJANG 292.813,0 182.797,7 136.121,2 293.334,3 219.989,7 -0,98 97.631,2 79.534,4 -18,54
TANJUNG PRIOK 93.675,6 108.653,3 111.516,1 155.548,5 123.306,5 9,51 67.996,5 78.262,6 15,10
TANJUNG PERAK 27.690,6 28.126,1 32.174,4 44.770,8 53.923,4 19,70 29.897,1 31.791,9 6,34
PANGKAL BALAM 18.312,6 33.992,6 46.993,4 56.365,3 38.422,5 21,99 24.075,9 18.929,7 -21,37
MAKASSAR - - - 509,3 1.557,8 - 772,5 259,3 -66,43
PELABUHAN LAINNYA/OTHER PORTS 2.765,3 1.142,4 3.227,0 8.713,7 4.153,0 32,91 2.220,8 3.513,3 58,20
1511 Palm oil and its fractions; whether or not refined, but not chemically modified 17.602.168,0 15.838.850,2 17.464.904,7 15.385.275,3 14.365.422,2 -4,26 8.307.471,2 15.338.784,5 84,64
DUMAI 7.360.543,1 6.120.165,3 6.429.187,4 6.124.762,8 6.154.992,8 -3,51 3.438.081,9 6.709.453,0 95,15
BELAWAN 2.802.788,9 2.343.045,2 2.414.161,6 1.924.931,2 1.901.839,7 -9,26 1.170.181,5 1.802.615,3 54,05
PADANG/TL.BAYUR 1.325.744,4 1.188.290,1 1.347.178,9 1.136.985,0 1.111.721,6 -3,89 677.064,5 1.131.125,3 67,06
TARAHAN - - - 956.583,9 663.491,0 - 380.868,0 704.103,4 84,87
KABIL/PANAU 781.195,6 768.605,1 737.287,9 733.132,7 647.031,3 -4,15 335.267,0 765.809,0 128,42
PELABUHAN LAINNYA/OTHER PORTS 5.331.896,0 5.418.744,4 6.537.089,0 4.508.879,7 3.886.345,8 -7,84 2.306.008,3 4.225.678,5 83,25
1513 Coconut (copra), palm kernel or babassu oil and their fractions; whether or not refined but
not chemically modified
2.458.229,9 1.829.519,4 2.484.350,2 2.378.262,2 2.726.685,9 4,81 1.623.139,0 2.482.923,4 52,97
DUMAI 576.970,0 488.482,0 701.280,5 730.462,6 846.961,1 12,41 507.553,8 792.097,7 56,06
BITUNG 514.223,8 297.722,4 460.324,7 399.761,6 412.142,3 -1,47 275.954,2 356.120,1 29,05
BELAWAN 238.046,9 243.152,1 207.108,8 195.159,8 227.765,1 -3,03 140.807,1 205.803,5 46,16
KUALA TANJUNG 226.922,8 148.902,2 202.935,5 198.689,9 220.297,7 2,32 129.116,3 160.426,4 24,25
TARAHAN - - - 160.538,2 215.269,4 - 130.130,5 196.225,8 50,79
PELABUHAN LAINNYA/OTHER PORTS 902.066,4 651.260,6 912.700,7 693.650,1 804.250,3 -1,65 439.577,3 772.250,0 75,68
28

Lanjutan/Continued
Nilai/Value : Ribu/Thousand US$No. 08.05.148
2015 2016
2016 2017
20142012 2013
TABEL 15 : NILAI EKSPOR 100 JENIS BARANG MENURUT PELABUHAN MUAT UTAMA
EXPORT VALUE OF 100 COMMODITIES BY MAIN PORT OF EMBARKATION
KODE
CODE
HS
JENIS BARANG
DESCRIPTION OF GOODS
Trend (%)
12-16
Jan-Ags/Jan-Aug Perub. (%)
Change (%)
17-16
1516 Animal or vegetable fats and oils and their fractions; partly or wholly hydrogenated, inter-
esterified, re-esterified or elaidinised, whether or not refined, but not further prepared
258.406,6 797.117,6 176.620,3 179.293,9 312.462,5 -10,52 164.629,9 269.350,8 63,61
TANJUNG PRIOK 47.852,5 38.445,2 103.790,1 105.075,1 139.252,3 36,91 70.165,7 105.528,1 50,40
BELAWAN 89.819,0 111.709,1 30.798,5 50.033,3 78.825,3 -10,10 37.787,8 88.899,6 135,26
DUMAI 15.766,7 350.270,9 - - 49.270,5 - 31.610,0 35.015,8 10,77
GRESIK 8.465,8 2.206,8 12.833,5 9.344,7 20.270,2 37,57 7.400,8 18.435,9 149,11
KUALA TANJUNG 68.856,2 44.194,1 15.933,0 1.610,6 11.302,2 -49,97 8.027,5 3.332,2 -58,49
PELABUHAN LAINNYA/OTHER PORTS 27.646,4 250.291,4 13.265,3 13.230,1 13.542,0 -35,39 9.638,0 18.139,2 88,21
1517 Margarine; edible mixtures or preparations of animal or vegetable fats or oils or of
fractions of different fats or oils of this chapter, other than edible fats or oils of heading no.
1516
806.388,3 600.050,9 778.219,1 617.751,6 684.627,4 -2,94 396.329,9 743.309,1 87,55
TANJUNG PERAK 177.997,5 198.649,8 313.306,4 246.361,2 309.528,9 14,13 167.769,1 349.587,7 108,37
BELAWAN 156.194,5 107.200,1 166.806,3 211.296,8 228.983,0 15,53 143.150,5 244.375,6 70,71
TANJUNG PRIOK 315.420,5 138.170,6 170.570,2 114.952,2 123.425,4 -18,62 69.910,5 119.290,4 70,63
TANJUNG EMAS 9.993,7 30.791,5 29.011,4 25.376,7 20.606,6 13,36 13.421,6 14.767,3 10,03
PONTIANAK 7.396,4 12.038,4 9.940,2 5.136,2 2.022,2 -29,15 2.022,2 2.005,0 -0,85
PELABUHAN LAINNYA/OTHER PORTS 139.385,7 113.200,5 88.584,6 14.628,5 61,3 -82,63 55,9 13.283,2 23645,73
1604 Prepared or preserved fish; caviar and caviar substitutes prepared from fish eggs 410.205,3 424.187,8 397.809,6 338.893,9 327.858,0 -6,51 208.784,9 328.469,3 57,32
TANJUNG PERAK 227.845,2 225.102,6 225.627,8 200.077,6 188.493,5 -4,85 126.590,0 164.349,8 29,83
TANJUNG PRIOK 64.528,5 73.787,9 37.186,4 46.188,7 53.808,2 -7,98 31.490,0 97.285,5 208,94
BITUNG 72.995,7 85.166,0 82.987,6 51.452,1 45.059,3 -13,66 28.945,9 21.711,9 -24,99
TANJUNG EMAS 18.330,7 14.070,8 30.558,3 18.224,6 17.277,3 1,41 10.166,4 13.764,1 35,39
BELAWAN 24.261,3 24.669,7 17.068,4 16.632,9 11.708,0 -16,90 7.449,0 22.226,1 198,38
PELABUHAN LAINNYA/OTHER PORTS 2.243,8 1.390,8 4.381,1 6.318,1 11.511,8 61,35 4.143,7 9.132,0 120,38
1605 Crustaceans, molluscs and other aquatic invertebrates, prepared or preserved 430.327,3 564.815,6 737.471,7 605.414,4 633.856,8 8,81 413.271,9 439.063,7 6,24
TANJUNG PERAK 244.437,4 312.648,2 375.059,8 314.799,9 330.374,8 6,28 198.373,0 255.332,9 28,71
PANJANG 85.731,7 112.514,9 141.835,0 107.134,4 116.107,2 5,73 76.297,3 78.004,7 2,24
TANJUNG PRIOK 40.902,6 66.728,7 99.329,4 83.967,4 73.937,0 15,19 60.928,5 39.333,0 -35,44
TANJUNG EMAS 5.664,4 21.639,2 54.139,9 51.630,2 59.349,5 74,51 39.785,5 23.520,8 -40,88
BELAWAN 29.527,1 30.956,2 41.913,7 28.955,2 32.586,3 1,31 23.087,7 22.868,6 -0,95
PELABUHAN LAINNYA/OTHER PORTS 24.064,1 20.328,4 25.193,9 18.927,4 21.502,0 -2,92 - 20.003,7 -
1804 Cocoa; butter, fat and oil 236.138,4 356.763,6 660.783,6 726.296,0 697.860,0 33,35 426.782,8 562.931,4 31,90
TANJUNG PRIOK 88.412,1 123.308,1 273.384,9 376.299,6 294.014,2 42,18 176.725,8 232.762,6 31,71
TANJUNG PERAK 3.739,3 13.737,7 57.065,4 139.234,4 201.094,0 179,71 118.160,0 159.502,6 34,99
BATU AMPAR 70.515,0 116.963,4 193.033,0 182.559,3 177.935,9 25,81 117.165,4 161.658,5 37,97
UJUNGPANDANG 13.394,7 31.204,9 53.425,9 27.355,6 23.119,6 10,08 14.431,8 5.177,4 -64,13
KENDARI - - - 341,3 934,6 - - - -
PELABUHAN LAINNYA/OTHER PORTS 60.077,3 71.549,4 83.874,4 505,9 761,7 -74,56 299,8 3.830,3 1177,43
29
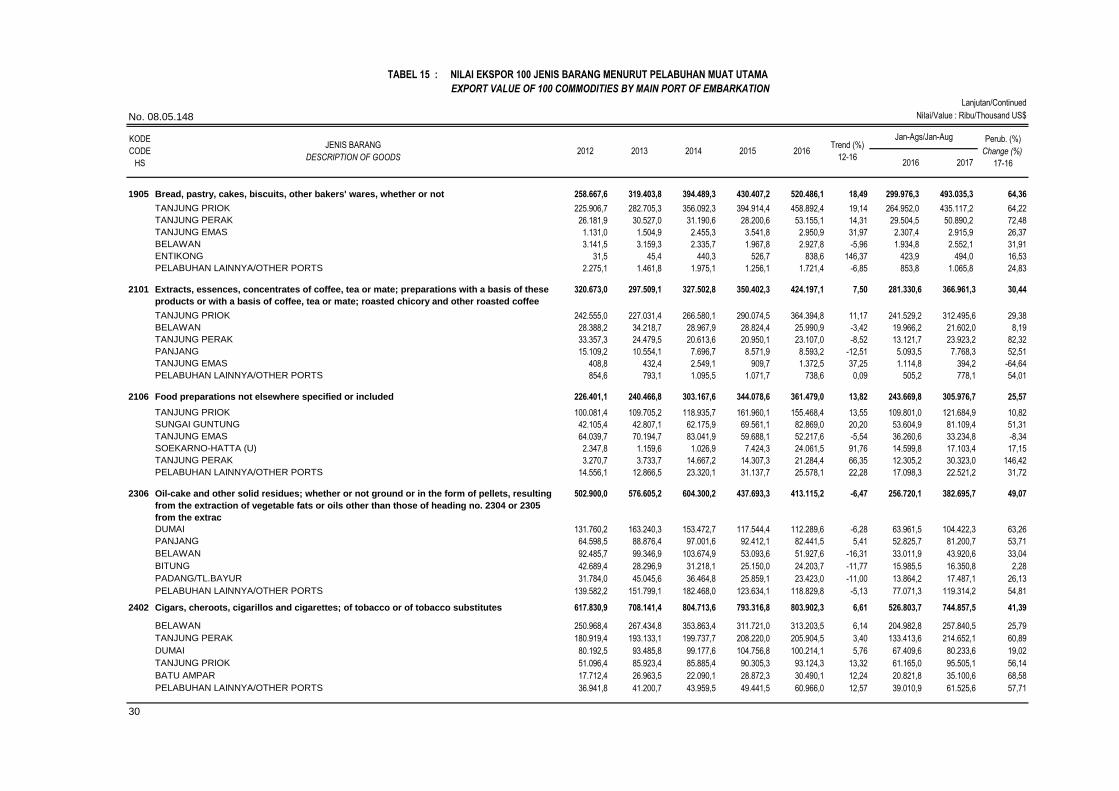
Lanjutan/Continued
Nilai/Value : Ribu/Thousand US$No. 08.05.148
2015 2016
2016 2017
20142012 2013
TABEL 15 : NILAI EKSPOR 100 JENIS BARANG MENURUT PELABUHAN MUAT UTAMA
EXPORT VALUE OF 100 COMMODITIES BY MAIN PORT OF EMBARKATION
KODE
CODE
HS
JENIS BARANG
DESCRIPTION OF GOODS
Trend (%)
12-16
Jan-Ags/Jan-Aug Perub. (%)
Change (%)
17-16
1905 Bread, pastry, cakes, biscuits, other bakers' wares, whether or not 258.667,6 319.403,8 394.489,3 430.407,2 520.486,1 18,49 299.976,3 493.035,3 64,36
TANJUNG PRIOK 225.906,7 282.705,3 356.092,3 394.914,4 458.892,4 19,14 264.952,0 435.117,2 64,22
TANJUNG PERAK 26.181,9 30.527,0 31.190,6 28.200,6 53.155,1 14,31 29.504,5 50.890,2 72,48
TANJUNG EMAS 1.131,0 1.504,9 2.455,3 3.541,8 2.950,9 31,97 2.307,4 2.915,9 26,37
BELAWAN 3.141,5 3.159,3 2.335,7 1.967,8 2.927,8 -5,96 1.934,8 2.552,1 31,91
ENTIKONG 31,5 45,4 440,3 526,7 838,6 146,37 423,9 494,0 16,53
PELABUHAN LAINNYA/OTHER PORTS 2.275,1 1.461,8 1.975,1 1.256,1 1.721,4 -6,85 853,8 1.065,8 24,83
2101 Extracts, essences, concentrates of coffee, tea or mate; preparations with a basis of these
products or with a basis of coffee, tea or mate; roasted chicory and other roasted coffee
320.673,0 297.509,1 327.502,8 350.402,3 424.197,1 7,50 281.330,6 366.961,3 30,44
TANJUNG PRIOK 242.555,0 227.031,4 266.580,1 290.074,5 364.394,8 11,17 241.529,2 312.495,6 29,38
BELAWAN 28.388,2 34.218,7 28.967,9 28.824,4 25.990,9 -3,42 19.966,2 21.602,0 8,19
TANJUNG PERAK 33.357,3 24.479,5 20.613,6 20.950,1 23.107,0 -8,52 13.121,7 23.923,2 82,32
PANJANG 15.109,2 10.554,1 7.696,7 8.571,9 8.593,2 -12,51 5.093,5 7.768,3 52,51
TANJUNG EMAS 408,8 432,4 2.549,1 909,7 1.372,5 37,25 1.114,8 394,2 -64,64
PELABUHAN LAINNYA/OTHER PORTS 854,6 793,1 1.095,5 1.071,7 738,6 0,09 505,2 778,1 54,01
2106 Food preparations not elsewhere specified or included 226.401,1 240.466,8 303.167,6 344.078,6 361.479,0 13,82 243.669,8 305.976,7 25,57
TANJUNG PRIOK 100.081,4 109.705,2 118.935,7 161.960,1 155.468,4 13,55 109.801,0 121.684,9 10,82
SUNGAI GUNTUNG 42.105,4 42.807,1 62.175,9 69.561,1 82.869,0 20,20 53.604,9 81.109,4 51,31
TANJUNG EMAS 64.039,7 70.194,7 83.041,9 59.688,1 52.217,6 -5,54 36.260,6 33.234,8 -8,34
SOEKARNO-HATTA (U) 2.347,8 1.159,6 1.026,9 7.424,3 24.061,5 91,76 14.599,8 17.103,4 17,15
TANJUNG PERAK 3.270,7 3.733,7 14.667,2 14.307,3 21.284,4 66,35 12.305,2 30.323,0 146,42
PELABUHAN LAINNYA/OTHER PORTS 14.556,1 12.866,5 23.320,1 31.137,7 25.578,1 22,28 17.098,3 22.521,2 31,72
2306 Oil-cake and other solid residues; whether or not ground or in the form of pellets, resulting
from the extraction of vegetable fats or oils other than those of heading no. 2304 or 2305
from the extrac
502.900,0 576.605,2 604.300,2 437.693,3 413.115,2 -6,47 256.720,1 382.695,7 49,07
DUMAI 131.760,2 163.240,3 153.472,7 117.544,4 112.289,6 -6,28 63.961,5 104.422,3 63,26
PANJANG 64.598,5 88.876,4 97.001,6 92.412,1 82.441,5 5,41 52.825,7 81.200,7 53,71
BELAWAN 92.485,7 99.346,9 103.674,9 53.093,6 51.927,6 -16,31 33.011,9 43.920,6 33,04
BITUNG 42.689,4 28.296,9 31.218,1 25.150,0 24.203,7 -11,77 15.985,5 16.350,8 2,28
PADANG/TL.BAYUR 31.784,0 45.045,6 36.464,8 25.859,1 23.423,0 -11,00 13.864,2 17.487,1 26,13
PELABUHAN LAINNYA/OTHER PORTS 139.582,2 151.799,1 182.468,0 123.634,1 118.829,8 -5,13 77.071,3 119.314,2 54,81
2402 Cigars, cheroots, cigarillos and cigarettes; of tobacco or of tobacco substitutes 617.830,9 708.141,4 804.713,6 793.316,8 803.902,3 6,61 526.803,7 744.857,5 41,39
BELAWAN 250.968,4 267.434,8 353.863,4 311.721,0 313.203,5 6,14 204.982,8 257.840,5 25,79
TANJUNG PERAK 180.919,4 193.133,1 199.737,7 208.220,0 205.904,5 3,40 133.413,6 214.652,1 60,89
DUMAI 80.192,5 93.485,8 99.177,6 104.756,8 100.214,1 5,76 67.409,6 80.233,6 19,02
TANJUNG PRIOK 51.096,4 85.923,4 85.885,4 90.305,3 93.124,3 13,32 61.165,0 95.505,1 56,14
BATU AMPAR 17.712,4 26.963,5 22.090,1 28.872,3 30.490,1 12,24 20.821,8 35.100,6 68,58
PELABUHAN LAINNYA/OTHER PORTS 36.941,8 41.200,7 43.959,5 49.441,5 60.966,0 12,57 39.010,9 61.525,6 57,71
30

Lanjutan/Continued
Nilai/Value : Ribu/Thousand US$No. 08.05.148
2015 2016
2016 2017
20142012 2013
TABEL 15 : NILAI EKSPOR 100 JENIS BARANG MENURUT PELABUHAN MUAT UTAMA
EXPORT VALUE OF 100 COMMODITIES BY MAIN PORT OF EMBARKATION
KODE
CODE
HS
JENIS BARANG
DESCRIPTION OF GOODS
Trend (%)
12-16
Jan-Ags/Jan-Aug Perub. (%)
Change (%)
17-16
2603 Copper ores and concentrates 2.594.674,5 3.006.809,9 1.683.587,7 3.277.157,6 3.481.556,9 6,97 2.040.555,5 2.469.323,1 21,01
AMAMAPARE 1.996.809,0 2.608.595,4 1.376.498,2 1.831.814,1 1.907.955,3 -4,35 960.722,8 1.589.145,7 65,41
BENETE - - - 1.445.343,5 1.573.601,7 - 1.079.832,7 880.177,4 -18,49
TANJUNG PERAK 42,7 - - - - - - - -
TANJUNG PRIOK 1.651,0 99,0 27,4 - - - - - -
BIMA 596.165,2 398.115,5 307.062,0 - - - - - -
PELABUHAN LAINNYA/OTHER PORTS 6,6 - - - - - 0,0 0,0 -
2701 Coal; briquettes, ovoids and similar solid fuels manufactured from coal 24.293.180,4 22.773.242,2 18.697.799,9 14.717.264,7 12.898.709,8 -15,66 7.919.527,6 14.529.074,2 83,46
SAMARINDA 5.583.830,0 5.029.749,3 3.960.916,5 3.213.832,1 2.756.048,8 -16,97 1.655.903,7 3.216.855,1 94,27
TANJUNG BARA, KL - - - 2.506.611,3 2.573.479,7 - 1.585.695,2 2.476.705,6 56,19
BANJARMASIN 3.985.703,3 3.618.630,0 3.377.521,6 2.687.884,6 2.278.304,2 -13,20 1.442.201,2 2.575.666,6 78,59
TANJUNG REDEP 60.960,4 56.059,4 1.219.983,8 1.086.953,7 1.102.303,2 140,00 648.624,9 1.501.240,5 131,45
BONTANG 1.702.282,1 1.577.559,7 1.107.433,6 819.058,5 701.532,2 -21,56 436.683,1 716.466,4 64,07
PELABUHAN LAINNYA/OTHER PORTS 12.960.404,6 12.491.243,7 9.031.944,3 4.402.924,4 3.487.041,6 -30,71 2.150.419,6 4.042.140,1 87,97
2702 Lignite; whether or not agglomerated, excluding jet 1.878.098,9 1.741.688,5 2.121.528,8 1.281.696,2 1.613.043,8 -5,93 804.938,0 2.103.616,6 161,34
BANJARMASIN 411.764,5 454.229,8 424.847,2 443.207,6 542.739,5 5,42 281.924,1 710.786,3 152,12
SATUI - - - 388.613,3 426.708,2 - 211.261,2 619.348,2 193,17
ADANG BAY 455.660,4 337.063,8 350.996,1 217.855,0 217.737,2 -17,41 134.394,7 274.359,3 104,14
SAMARINDA 192.171,4 153.444,5 276.106,6 100.015,4 154.583,4 -8,27 76.319,2 141.255,8 85,09
KOTABARU 581.199,4 511.887,1 594.808,5 22.419,4 129.456,7 -45,84 51.387,9 100.101,0 94,79
PELABUHAN LAINNYA/OTHER PORTS 237.303,1 285.063,3 474.770,4 109.585,4 141.818,9 -18,01 49.650,9 257.766,0 419,16
2814 Ammonia; anhydrous or in aqueous solution 476.600,1 360.719,4 345.145,9 434.208,4 330.946,4 -5,29 266.467,0 248.346,1 -6,80
BONTANG 455.268,4 318.006,5 322.591,6 367.654,7 289.739,2 -7,31 231.761,6 220.364,7 -4,92
MUSI RIVER/BOOM BARU 3.352,2 3.392,4 20.729,3 35.760,6 26.261,7 91,02 23.450,0 19.390,1 -17,31
LHOK SEUMAWE 17.979,5 26.878,2 1.702,4 30.649,1 14.672,1 -2,72 11.026,3 8.419,4 -23,64
TANJUNG PRIOK - - 122,5 144,0 273,4 - 229,0 171,9 -24,93
SOEKARNO-HATTA (U) - - - - 0,0 - 0,0 - -
PELABUHAN LAINNYA/OTHER PORTS 0,0 12.442,4 - - 0,0 - - - -
2905 Acyclic alcohols and their halogenated, sulphonated, nitrated or nitrosated derivatives 635.508,2 640.144,1 609.625,3 433.624,9 381.817,7 -13,14 237.580,9 445.366,8 87,46
GRESIK 214.504,5 198.033,5 177.959,0 113.332,9 83.224,2 -21,74 48.749,4 83.667,4 71,63
BATU AMPAR 52.975,5 49.491,9 65.581,0 49.282,3 65.208,4 4,20 41.278,4 71.889,6 74,16
BELAWAN 80.439,1 84.966,2 86.894,1 63.289,8 64.564,4 -7,08 38.740,9 82.064,5 111,83
TANJUNG PERAK 81.576,3 75.372,2 84.070,2 62.680,5 61.687,2 -7,16 41.134,6 54.958,5 33,61
BONTANG 124.494,6 135.823,0 114.634,2 75.285,0 51.662,5 -20,94 36.706,6 63.158,0 72,06
PELABUHAN LAINNYA/OTHER PORTS 81.518,3 96.457,4 80.486,8 69.754,3 55.471,0 -10,36 30.971,1 89.628,7 189,40
31

Lanjutan/Continued
Nilai/Value : Ribu/Thousand US$No. 08.05.148
2015 2016
2016 2017
20142012 2013
TABEL 15 : NILAI EKSPOR 100 JENIS BARANG MENURUT PELABUHAN MUAT UTAMA
EXPORT VALUE OF 100 COMMODITIES BY MAIN PORT OF EMBARKATION
KODE
CODE
HS
JENIS BARANG
DESCRIPTION OF GOODS
Trend (%)
12-16
Jan-Ags/Jan-Aug Perub. (%)
Change (%)
17-16
2915 Acids; saturated acyclic monocarboxylic acids and their anhydrides, halides, peroxides
and peroxyacids; their halogenated, sulphonated, nitrated or nitrosated derivatives
218.739,3 191.586,8 329.764,1 380.764,1 499.040,5 26,32 279.663,0 490.539,7 75,40
BELAWAN 135.367,3 133.616,9 184.833,5 191.993,3 255.218,1 17,71 150.312,5 275.458,2 83,26
DUMAI 1.877,8 1.477,2 56.495,1 122.287,5 152.346,2 274,65 72.238,2 152.487,6 111,09
GRESIK 21.116,5 9.256,8 26.784,0 22.565,1 43.070,3 26,07 27.007,0 32.075,2 18,77
TANJUNG PRIOK 30.403,9 29.626,0 31.933,6 27.807,4 24.753,6 -4,63 18.137,1 16.059,7 -11,45
TANJUNG PERAK 5.158,0 7.038,2 17.222,7 9.286,7 13.426,5 24,49 6.835,3 6.397,1 -6,41
PELABUHAN LAINNYA/OTHER PORTS 24.815,8 10.571,8 12.495,2 6.824,2 10.225,7 -19,84 5.132,8 8.061,8 57,06
2922 Oxygen-function amino-compounds 680.094,7 615.435,3 630.968,2 564.719,3 454.748,5 -8,52 311.136,0 351.973,7 13,13
TANJUNG PERAK 677.680,1 613.616,9 628.207,1 563.667,6 454.327,1 -8,47 310.892,8 351.730,6 13,14
SOEKARNO-HATTA (U) 375,9 301,5 39,9 108,9 180,2 -22,03 179,9 2,2 -98,77
TANJUNG PRIOK 1.817,6 1.376,9 2.467,9 753,7 148,5 -42,94 48,9 199,3 307,43
JUANDA (U)-SURABAYA 2,3 4,5 90,8 63,1 59,8 149,80 2,5 9,8 295,16
NGURAH RAI (U) 15,1 - 49,8 88,0 20,1 - - - -
PELABUHAN LAINNYA/OTHER PORTS 203,7 135,5 112,6 38,0 12,8 -49,38 11,8 31,8 169,00
3004 Medicaments; (not goods of heading no. 3002, 3005 or 3006) consisting of mixed or
unmixed products for therapeutic or prophylactic use, put up in measured doses (incl.
those in the form
297.418,9 286.185,8 357.060,1 431.083,6 442.541,1 12,80 296.197,8 367.528,1 24,08
TANJUNG PRIOK 168.631,6 164.748,0 192.296,8 181.120,1 161.896,9 0,13 112.465,8 141.767,4 26,05
JUANDA (U)-SURABAYA 8.918,7 11.722,6 53.161,3 140.411,5 133.154,6 120,11 109.944,2 63.492,7 -42,25
TANJUNG PERAK 22.522,3 23.419,7 47.108,9 39.475,9 95.666,3 40,70 40.948,1 115.792,3 182,78
SOEKARNO-HATTA (U) 67.732,1 61.466,2 60.012,9 51.388,0 47.650,1 -8,45 30.205,1 42.554,1 40,88
TANJUNG EMAS 2.191,5 2.786,2 2.613,9 2.941,1 3.020,9 7,21 1.882,4 2.994,7 59,09
PELABUHAN LAINNYA/OTHER PORTS 27.422,6 22.043,0 1.866,3 15.747,0 1.152,3 -48,70 752,1 926,8 23,23
3102 Fertilizers; mineral or chemical, nitrogenous 488.311,5 552.419,8 402.174,1 263.395,3 295.554,5 -16,01 162.232,5 174.322,9 7,45
BONTANG 429.995,8 438.388,6 349.534,2 226.876,9 270.730,5 -14,65 150.700,8 110.272,2 -26,83
TANJUNG PRIOK 4.048,7 25.413,8 17.900,8 14.286,8 14.145,3 21,24 6.158,4 9.987,9 62,18
MUSI RIVER/BOOM BARU 20.880,6 57.725,1 32.913,5 20.654,6 8.836,1 -24,03 5.370,0 49.604,8 823,74
GRESIK 1.601,8 8.330,0 1.820,5 - 1.839,3 - - 4.219,9 -
ACHMAD YANI (U) - - - - 3,3 - 3,3 - -
PELABUHAN LAINNYA/OTHER PORTS 31.784,6 22.562,3 5,1 1.577,0 0,0 -97,58 0,0 238,0 23801617,67
3401 Soap; organic surface-active preparations used as soap, skin washing, in bars, cakes,
moulded pieces, shapes, liquid or cream, containing soap or not; for retail, paper,
wadding, felt and
635.926,1 658.793,2 623.204,6 531.266,4 554.957,9 -4,76 356.892,2 559.466,1 56,76
TANJUNG PRIOK 278.998,7 283.733,1 257.715,5 239.301,9 218.354,3 -6,39 141.622,1 224.963,2 58,85
BELAWAN 184.777,4 163.048,0 155.823,1 143.445,0 167.481,3 -3,19 106.915,0 179.089,6 67,51
TANJUNG PERAK 160.685,3 201.232,4 198.914,9 140.123,6 160.826,3 -3,54 103.055,9 148.168,4 43,77
TANJUNG EMAS 6.230,6 6.149,3 5.674,3 6.554,6 5.514,7 -1,79 3.391,4 4.636,9 36,72
SOEKARNO-HATTA (U) 153,7 187,0 1.028,4 406,3 919,8 54,57 553,6 799,3 44,38
PELABUHAN LAINNYA/OTHER PORTS 5.080,4 4.443,5 4.048,3 1.435,0 1.861,6 -26,93 1.354,2 1.808,7 33,57
32

Lanjutan/Continued
Nilai/Value : Ribu/Thousand US$No. 08.05.148
2015 2016
2016 2017
20142012 2013
TABEL 15 : NILAI EKSPOR 100 JENIS BARANG MENURUT PELABUHAN MUAT UTAMA
EXPORT VALUE OF 100 COMMODITIES BY MAIN PORT OF EMBARKATION
KODE
CODE
HS
JENIS BARANG
DESCRIPTION OF GOODS
Trend (%)
12-16
Jan-Ags/Jan-Aug Perub. (%)
Change (%)
17-16
3402 Organic surface-active agents (not soap); surface-active, washing (including auxiliary
washing) and cleaning preparations, containing soap or not, excluding those of heading
no. 3401
236.341,4 242.420,1 279.649,5 273.830,3 264.915,0 3,56 171.467,9 241.226,0 40,68
TANJUNG PRIOK 137.842,2 148.364,9 171.847,1 176.504,4 172.201,6 6,38 108.876,5 165.341,0 51,86
TANJUNG PERAK 90.430,5 90.402,9 100.120,5 83.669,9 78.376,5 -3,57 52.890,9 52.044,4 -1,60
BELAWAN 420,0 204,7 6.468,9 10.434,7 10.723,1 183,24 6.816,3 21.457,6 214,80
PANJANG - - 279,4 1.967,3 1.778,3 - 1.407,2 1.412,3 0,36
BATU AMPAR 627,5 412,2 192,2 260,3 814,2 0,61 771,2 61,7 -92,00
PELABUHAN LAINNYA/OTHER PORTS 7.021,2 3.035,6 741,4 993,7 1.021,3 -39,18 705,8 908,9 28,78
3808 Insecticides, rodenticides, fungicides, herbicides, anti-sprouting products, plant growth
regulators, disinfectants and the like, put up in forms or packings for retail sale or as
preparations or form
249.577,5 317.445,1 300.839,9 275.704,4 280.151,4 0,91 198.658,0 247.691,4 24,68
TANJUNG PRIOK 83.630,3 115.907,5 121.249,6 93.290,0 109.958,3 3,36 79.858,3 98.678,4 23,57
BELAWAN 103.162,6 121.106,3 85.218,7 81.656,6 68.807,0 -11,34 48.402,2 48.608,0 0,43
TANJUNG PERAK 33.245,7 35.666,2 48.208,2 48.927,4 51.941,9 12,85 36.841,8 44.609,7 21,08
TANJUNG EMAS 18.325,7 32.105,1 29.695,5 39.965,6 41.319,2 20,26 27.374,0 48.597,0 77,53
BATU AMPAR 9.271,5 9.407,9 9.400,7 9.461,4 7.084,1 -5,19 5.277,0 6.139,1 16,34
PELABUHAN LAINNYA/OTHER PORTS 1.941,8 3.252,0 7.067,3 2.403,3 1.040,9 -14,35 904,7 1.059,3 17,08
3823 Industrial monocarboxylic fatty acids; acid oils from refining; industrial fatty alcohols 1.881.201,2 1.721.166,7 2.367.120,9 1.835.159,6 2.328.242,7 5,03 1.380.998,9 2.438.528,9 76,58
DUMAI 420.417,4 468.220,7 732.502,4 523.658,0 745.265,5 13,39 445.281,6 627.083,6 40,83
BELAWAN 414.135,4 385.239,9 509.983,5 394.928,9 473.558,5 2,97 271.957,1 596.956,0 119,50
GRESIK 306.694,4 208.738,6 269.797,3 199.296,0 263.056,9 -3,47 170.136,6 273.063,7 60,50
TANJUNG PRIOK 308.430,4 246.327,6 271.518,2 260.690,3 238.583,3 -4,47 152.753,2 208.949,5 36,79
TANJUNG PERAK 75.437,8 89.394,4 160.895,1 107.615,2 172.174,5 20,15 88.925,9 173.922,6 95,58
PELABUHAN LAINNYA/OTHER PORTS 356.085,8 323.245,5 422.424,4 348.971,3 435.604,1 4,91 251.944,5 558.553,4 121,70
3826 Biodiesel and mixtures thereof; not containing or containing less than 70% by weight of
petroleum oils or oils obtained from bituminous minerals weight of petroleum oils or oils
obtained from bitumino
1.380.806,6 1.406.996,6 1.141.337,8 195.163,2 287.246,5 -40,04 218.088,3 117.178,0 -46,27
DUMAI 802.990,3 840.992,7 818.931,5 166.914,0 208.641,5 -35,03 156.520,0 46.665,0 -70,19
KABIL/PANAU 379.454,1 406.509,8 255.338,0 23.734,7 77.470,5 -45,22 60.979,5 70.071,8 14,91
BELAWAN 140.391,1 109.679,2 16.099,1 340,0 659,5 -80,79 343,2 274,6 -20,01
TANJUNG PERAK 926,7 2.420,4 4.411,2 1.875,3 474,8 -14,73 245,4 1,1 -99,57
SOEKARNO-HATTA (U) - - - 0,1 0,3 - 0,3 0,2 -46,73
PELABUHAN LAINNYA/OTHER PORTS 57.044,4 47.394,4 46.558,0 2.299,1 0,0 -95,72 - 165,4 -
3907 Polyacetals, other polyethers and epoxide resins, in primary forms; polycarbonates, alkyd
resins, polyallyl esters and other polyesters, in primary forms
412.927,9 405.395,4 519.117,2 417.554,1 346.128,5 -3,18 223.678,2 309.867,3 38,53
TANJUNG PRIOK 396.684,3 392.321,8 504.279,0 392.424,9 331.442,8 -3,53 213.698,6 300.280,2 40,52
TANJUNG PERAK 6.120,3 6.358,3 8.689,7 20.868,6 12.256,8 29,40 8.224,1 7.370,1 -10,38
BATU AMPAR 1.638,9 1.115,8 2.593,1 783,2 1.166,2 -9,83 739,2 1.070,9 44,87
TANJUNG EMAS 2,3 2,7 262,7 1.819,8 684,9 500,72 615,2 419,1 -31,87
SOEKARNO-HATTA (U) 147,0 331,8 326,0 319,4 379,5 20,43 245,4 184,6 -24,77
PELABUHAN LAINNYA/OTHER PORTS 8.335,1 5.265,0 2.966,8 1.338,3 198,2 -58,72 155,8 542,5 248,19
33

Lanjutan/Continued
Nilai/Value : Ribu/Thousand US$No. 08.05.148
2015 2016
2016 2017
20142012 2013
TABEL 15 : NILAI EKSPOR 100 JENIS BARANG MENURUT PELABUHAN MUAT UTAMA
EXPORT VALUE OF 100 COMMODITIES BY MAIN PORT OF EMBARKATION
KODE
CODE
HS
JENIS BARANG
DESCRIPTION OF GOODS
Trend (%)
12-16
Jan-Ags/Jan-Aug Perub. (%)
Change (%)
17-16
3920 Plastics; plates, sheets, film, foil and strip (not self-adhesive); non-cellular and not
reinforced, laminated, supported or similarly combined with other materials, n.e.c. in
537.389,5 527.392,6 567.227,4 503.505,4 509.574,7 -1,51 332.205,1 465.756,3 40,20
TANJUNG PRIOK 433.076,3 429.477,9 453.180,4 413.006,1 415.953,8 -1,19 270.939,3 385.488,7 42,28
TANJUNG PERAK 100.290,5 94.379,1 101.640,9 87.011,1 90.358,2 -2,86 59.031,8 77.212,1 30,80
SOEKARNO-HATTA (U) 1.272,1 2.216,0 10.486,4 2.354,1 2.078,1 10,98 1.596,4 1.515,6 -5,07
BATU AMPAR 1.439,9 379,0 455,9 169,3 398,3 -28,65 196,1 808,4 312,17
JUANDA (U)-SURABAYA 67,2 185,5 242,2 252,5 313,8 40,35 201,4 57,8 -71,31
PELABUHAN LAINNYA/OTHER PORTS 1.243,5 755,1 1.221,6 712,2 472,4 -18,08 240,0 673,7 180,68
3923 Plastic articles for the conveyance or packing of goods; stoppers, lids, caps and other
closures of plastics
390.258,6 371.236,2 380.273,4 356.014,7 337.963,4 -3,24 225.767,8 288.254,1 27,68
TANJUNG PRIOK 177.489,0 162.315,4 155.886,1 146.614,2 158.306,5 -3,25 101.168,8 138.223,0 36,63
BATU AMPAR 49.690,2 50.130,3 55.433,6 65.798,4 52.292,2 3,81 36.655,4 38.862,3 6,02
BELAWAN 41.865,5 42.877,4 50.444,3 41.699,1 43.033,0 0,27 27.840,6 39.697,9 42,59
TANJUNG EMAS 41.499,9 45.715,5 43.886,2 46.561,8 37.590,4 -1,78 26.513,2 34.873,2 31,53
TANJUNG PERAK 53.212,4 44.145,8 45.710,6 34.638,4 24.564,0 -16,38 16.763,4 20.186,8 20,42
PELABUHAN LAINNYA/OTHER PORTS 26.501,6 26.051,8 28.912,6 20.702,8 22.177,2 -5,69 16.826,5 16.410,9 -2,47
4001 Natural rubber, balata, gutta-percha, guayule, chicle and similar gums; in primary forms or
in plates, sheets or strip
7.864.528,1 6.910.663,1 4.744.753,1 3.701.477,6 3.372.319,0 -20,69 2.084.201,3 4.428.842,6 112,50
MUSI RIVER/BOOM BARU 2.845.935,2 2.505.331,7 1.876.044,2 1.418.481,5 1.290.873,4 -19,35 779.027,9 1.333.496,2 71,17
BELAWAN 2.006.267,0 1.779.322,2 1.136.038,5 840.344,2 743.835,7 -23,93 456.735,3 968.620,7 112,07
PADANG/TL.BAYUR 738.952,7 611.153,2 428.529,1 362.677,1 358.860,5 -17,85 222.248,9 420.743,1 89,31
JAMBI 617.936,6 505.073,2 411.561,5 322.084,4 302.274,8 -17,14 195.996,9 393.715,9 100,88
TANJUNG PERAK 511.274,6 450.272,4 326.663,8 284.672,0 273.042,1 -15,74 172.436,5 342.759,5 98,77
PELABUHAN LAINNYA/OTHER PORTS 1.144.162,0 1.059.510,3 565.915,9 473.218,4 403.432,5 -25,11 257.755,6 969.507,2 276,13
4011 New pneumatic tyres, of rubber 1.704.181,1 1.652.349,0 1.627.754,8 1.546.876,1 1.605.021,5 -1,84 1.064.694,4 1.322.504,5 24,21
TANJUNG PRIOK 1.610.282,3 1.565.924,9 1.523.927,9 1.464.935,2 1.522.156,2 -1,78 1.007.292,1 1.251.966,7 24,29
BELAWAN 88.535,7 80.765,4 93.125,2 70.372,2 73.720,8 -4,92 51.250,5 58.005,5 13,18
SOEKARNO-HATTA (U) 3.708,5 3.589,3 8.306,6 8.522,5 4.543,9 13,55 3.173,2 4.338,1 36,71
TANJUNG PERAK 736,6 1.724,0 1.404,9 1.698,6 3.920,5 39,50 2.495,0 3.663,4 46,83
BATU AMPAR 154,1 113,2 146,3 297,5 197,4 15,74 154,2 78,1 -49,35
PELABUHAN LAINNYA/OTHER PORTS 763,9 232,2 844,0 1.050,1 482,8 6,09 329,4 4.452,6 1251,93
4202 Trunks; suit, camera, jewellery, cutlery cases; travel, tool, similar bags; wholly or mainly
covered by leather, composition leather, plastic sheeting, textile materials, vulcanised
fibre, paperboard
203.907,4 219.523,2 225.806,7 228.643,3 266.889,0 5,96 162.063,3 299.624,6 84,88
TANJUNG PRIOK 160.685,7 171.401,6 174.405,6 179.395,9 218.341,7 6,81 130.095,7 241.543,2 85,67
SOEKARNO-HATTA (U) 15.581,8 17.346,7 17.457,1 12.628,1 15.271,9 -3,51 10.462,5 16.293,4 55,73
TANJUNG EMAS 4.585,0 7.762,6 9.160,1 13.787,9 12.878,4 30,21 7.425,8 24.810,0 234,11
TANJUNG PERAK 8.387,2 8.232,2 9.854,4 9.165,6 9.311,4 3,22 6.383,9 7.402,8 15,96
NGURAH RAI (U) 8.513,5 9.449,7 9.057,2 9.156,9 7.102,3 -3,86 4.981,4 6.441,4 29,31
PELABUHAN LAINNYA/OTHER PORTS 6.154,2 5.330,5 5.872,4 4.508,9 3.983,2 -9,85 2.714,0 3.133,7 15,46
34

Lanjutan/Continued
Nilai/Value : Ribu/Thousand US$No. 08.05.148
2015 2016
2016 2017
20142012 2013
TABEL 15 : NILAI EKSPOR 100 JENIS BARANG MENURUT PELABUHAN MUAT UTAMA
EXPORT VALUE OF 100 COMMODITIES BY MAIN PORT OF EMBARKATION
KODE
CODE
HS
JENIS BARANG
DESCRIPTION OF GOODS
Trend (%)
12-16
Jan-Ags/Jan-Aug Perub. (%)
Change (%)
17-16
4409 Wood (including strips, friezes for parquet flooring, not assembled), continuously shaped
(tongued, grooved, v-jointed, beaded or the like) along any edges, ends or faces, whether
or not planed, sande
514.980,4 508.960,2 616.507,9 613.754,5 614.539,5 5,56 393.385,6 555.908,5 41,31
TANJUNG PERAK 322.591,7 311.777,1 398.658,1 405.432,5 415.033,6 7,97 257.584,5 388.973,5 51,01
TANJUNG EMAS 113.302,6 126.384,6 136.590,5 128.640,5 124.992,1 2,16 87.343,9 104.407,4 19,54
TANJUNG PRIOK 29.479,2 29.851,5 36.084,8 34.282,1 32.397,1 3,33 20.717,7 30.500,0 47,22
BELAWAN 21.988,3 19.408,1 19.434,5 19.240,8 18.324,7 -3,66 12.252,4 15.483,3 26,37
PONTIANAK 6.612,9 4.630,4 5.134,1 4.352,3 4.550,0 -7,78 3.325,7 3.126,2 -6,00
PELABUHAN LAINNYA/OTHER PORTS 21.005,7 16.908,6 20.605,9 21.806,2 19.242,1 0,79 12.161,4 13.418,1 10,33
4412 Plywood, veneered panels and similar laminated wood 2.011.518,2 2.176.212,9 2.372.470,9 2.345.947,2 2.211.610,2 2,68 1.450.498,4 1.810.258,2 24,80
TANJUNG EMAS 477.652,7 629.990,7 700.288,9 682.537,6 631.547,8 6,60 404.896,1 509.905,7 25,93
TANJUNG PERAK 356.010,7 375.358,1 412.499,4 406.070,5 440.038,8 5,15 287.343,4 389.934,4 35,70
TANJUNG PRIOK 178.988,4 194.097,2 207.885,0 213.463,7 243.986,1 7,41 160.876,5 278.072,8 72,85
BANJARMASIN 193.717,3 202.080,8 221.405,6 214.516,8 221.530,0 3,33 143.414,4 139.976,1 -2,40
SAMARINDA 149.295,5 142.706,7 179.675,7 196.132,7 190.634,3 8,40 119.758,5 103.835,6 -13,30
PELABUHAN LAINNYA/OTHER PORTS 655.853,4 631.979,3 650.716,2 633.225,9 483.873,2 -5,88 334.209,6 388.533,7 16,25
4418 Builders' joinery and carpentry of wood, including cellular wood panels, assembled
flooring panels, shingles and shakes
315.786,3 330.433,8 341.399,3 355.270,5 362.871,9 3,57 234.708,6 325.086,8 38,51
TANJUNG PERAK 106.421,0 112.888,4 114.313,7 112.335,7 117.092,6 1,88 75.134,8 104.156,2 38,63
TANJUNG EMAS 84.144,4 89.653,2 92.277,9 93.634,4 96.031,9 3,13 63.938,3 81.672,9 27,74
TANJUNG PRIOK 60.854,7 65.123,1 70.139,9 71.449,8 73.954,1 4,94 48.004,9 69.887,1 45,58
BELAWAN 56.993,5 54.899,9 58.586,1 71.835,1 71.331,6 7,44 44.384,6 65.339,1 47,21
SOEKARNO-HATTA (U) 464,0 492,1 847,1 2.860,3 1.980,0 59,39 1.511,6 1.229,8 -18,64
PELABUHAN LAINNYA/OTHER PORTS 6.908,6 7.377,0 5.234,6 3.155,1 2.481,8 -25,15 1.734,3 2.801,7 61,55
4703 Chemical wood pulp, soda or sulphate, other than dissolving grades 1.544.658,4 1.841.062,9 1.718.324,9 1.725.447,3 1.560.591,0 -0,44 1.044.843,9 1.807.952,4 73,04
BUATAN 906.304,4 880.324,1 852.344,8 914.260,5 858.896,0 -0,69 567.368,9 706.085,5 24,45
PERAWANG, SUMATRA 273.088,1 582.815,9 476.890,3 386.455,2 317.207,7 -1,11 222.727,0 205.649,9 -7,67
KUALA TUNGKAL 85.799,6 112.728,6 111.648,2 139.843,2 142.849,8 13,15 93.262,8 113.866,6 22,09
PANJANG 177.007,6 174.521,4 163.662,9 198.350,8 97.711,4 -10,06 73.717,3 67.515,6 -8,41
BELAWAN 98.421,7 86.093,7 100.100,1 86.517,3 74.378,1 -5,40 58.995,8 30.274,1 -48,68
PELABUHAN LAINNYA/OTHER PORTS 4.037,1 4.579,1 13.678,7 20,5 69.548,1 2,87 28.772,2 684.560,7 2279,25
4802 Uncoated paper and paperboard, used for writing, printing or other graphics, non
perforated punch-cards and punch tape paper, in rolls or rectangular sheets, of any size,
other than paper of
2.077.101,5 1.843.305,7 1.912.658,0 1.792.984,0 1.794.182,7 -3,15 1.174.628,2 1.663.407,9 41,61
PERAWANG, SUMATRA 553.891,7 532.970,3 637.093,7 589.652,3 609.750,1 2,98 406.236,2 559.996,9 37,85
TANJUNG PRIOK 496.465,4 402.043,5 387.818,2 413.973,8 410.569,4 -3,45 267.422,9 367.486,2 37,42
BUATAN 490.279,6 425.407,3 433.174,4 375.846,3 387.182,2 -5,79 257.568,8 385.475,2 49,66
TANJUNG PERAK 522.900,4 477.343,4 448.175,7 408.066,2 383.830,8 -7,46 241.134,6 349.409,5 44,90
TANJUNG EMAS 3.153,9 1.794,4 1.625,1 4.132,7 2.765,6 5,88 2.182,3 769,6 -64,74
PELABUHAN LAINNYA/OTHER PORTS 10.410,6 3.746,9 4.770,9 1.312,7 84,7 -65,60 83,4 270,5 224,49
35

Lanjutan/Continued
Nilai/Value : Ribu/Thousand US$No. 08.05.148
2015 2016
2016 2017
20142012 2013
TABEL 15 : NILAI EKSPOR 100 JENIS BARANG MENURUT PELABUHAN MUAT UTAMA
EXPORT VALUE OF 100 COMMODITIES BY MAIN PORT OF EMBARKATION
KODE
CODE
HS
JENIS BARANG
DESCRIPTION OF GOODS
Trend (%)
12-16
Jan-Ags/Jan-Aug Perub. (%)
Change (%)
17-16
4803 Tissue, towel, napkin stock or similar; for household or sanitary uses, cellulose wadding,
webs of cellulose fibres, in rolls over 36cm in width or rectangular sheets with one side
exceeding 36cm when
333.841,4 375.167,1 353.188,3 438.938,4 503.520,5 10,28 356.780,6 430.473,9 20,66
PERAWANG, SUMATRA 193.404,1 187.369,2 162.091,0 243.049,3 271.544,4 9,84 195.020,5 241.325,7 23,74
KUALA TUNGKAL 53.102,4 96.657,5 76.132,3 85.543,3 109.705,0 14,21 80.779,8 98.909,9 22,44
TANJUNG PERAK 42.866,7 38.829,7 52.315,4 62.187,0 69.628,0 15,50 45.508,7 59.634,4 31,04
TANJUNG PRIOK 44.388,4 52.307,9 62.441,8 44.675,3 49.291,4 0,52 34.279,2 30.591,3 -10,76
TANJUNG EMAS 57,9 - 199,9 3.323,5 3.245,3 - 1.088,0 1,5 -99,87
PELABUHAN LAINNYA/OTHER PORTS 22,0 2,8 7,9 160,1 106,4 105,72 104,4 11,2 -89,25
4810 Paper and paperboard, coated one or both sides with kaolin (china clay) or inorganic
substances, with binder or not, no other coating, surface coloured or not, surface
602.108,6 615.539,5 548.070,1 470.677,6 385.569,7 -10,95 257.975,4 284.638,2 10,34
TANJUNG PRIOK 318.622,1 352.979,2 331.301,0 309.129,7 245.757,9 -6,31 168.386,8 204.538,2 21,47
TANJUNG PERAK 217.045,3 217.396,1 185.527,0 148.133,7 113.827,2 -15,42 76.838,8 49.930,2 -35,02
TANJUNG EMAS 10.527,8 8.792,6 11.813,8 5.539,0 16.153,0 4,02 8.234,2 18.146,6 120,38
MERAK 55.741,0 36.299,5 16.317,5 7.500,8 9.276,8 -40,33 4.040,0 11.327,0 180,37
SURABAYA (PTT) - - - - 272,3 - 234,0 685,4 192,87
PELABUHAN LAINNYA/OTHER PORTS 172,3 72,1 3.110,8 374,4 282,4 30,14 241,6 10,7 -95,56
5205 Cotton yarn (other than sewing thread), containing 85% or more by weight of cotton, not
put up for retail sale
272.568,2 371.834,2 451.514,3 428.174,1 431.255,6 11,17 277.988,3 396.366,0 42,58
TANJUNG PRIOK 235.389,6 299.640,8 354.992,8 319.488,0 325.010,3 7,35 202.375,5 299.659,4 48,07
TANJUNG EMAS 25.053,0 63.199,4 78.711,3 95.369,4 95.618,3 36,21 69.502,8 82.625,4 18,88
TANJUNG PERAK 10.191,6 8.750,8 17.749,0 13.119,1 10.558,3 4,87 6.058,6 14.024,7 131,49
SOEKARNO-HATTA (U) 119,1 243,0 58,5 197,6 68,6 -12,27 51,4 56,4 9,55
JUANDA (U)-SURABAYA - 0,2 2,4 - - - - - -
PELABUHAN LAINNYA/OTHER PORTS 1.815,1 0,1 0,3 - - - - 0,2 -
5402 Synthetic filament yarn (other than sewing thread), not put up for retail sale, including
synthetic monofilament of less than 67 decitex
495.812,6 485.651,3 462.607,3 425.532,1 381.781,2 -6,34 248.390,7 342.107,9 37,73
TANJUNG PRIOK 383.363,5 377.141,7 359.086,7 335.776,6 311.170,6 -5,19 202.230,0 275.192,4 36,08
TANJUNG EMAS 97.186,6 91.275,1 85.012,9 67.846,6 53.362,5 -13,89 34.461,1 52.674,7 52,85
TANJUNG PERAK 14.800,4 16.205,2 17.927,9 21.307,7 16.600,8 5,16 11.207,4 13.566,8 21,05
SOEKARNO-HATTA (U) 293,0 847,4 420,2 475,5 397,7 0,34 284,7 581,1 104,14
JUANDA (U)-SURABAYA 71,6 27,1 143,1 112,5 167,2 36,61 140,9 85,9 -39,07
PELABUHAN LAINNYA/OTHER PORTS 97,5 154,8 16,5 13,2 82,3 -24,45 66,6 7,0 -89,55
5407 Woven fabrics of synthetic filament yarn, including woven fabrics obtained from materials
of heading no. 5404
848.042,0 737.960,7 756.215,4 646.318,0 602.952,4 -7,82 424.226,6 435.858,3 2,74
TANJUNG PRIOK 798.278,5 696.041,3 709.469,8 607.931,5 573.305,4 -7,66 403.769,0 409.441,5 1,40
TANJUNG PERAK 15.234,2 15.026,6 19.110,2 17.435,8 10.810,6 -5,23 7.524,4 10.963,7 45,71
SOEKARNO-HATTA (U) 8.127,9 6.495,5 7.258,6 5.838,2 9.043,4 1,07 6.244,5 5.562,7 -10,92
TANJUNG EMAS 24.925,7 18.837,4 19.836,8 14.445,5 8.747,6 -21,02 5.731,2 9.647,6 68,33
BELAWAN - - - 228,9 724,6 - 724,1 85,9 -88,14
PELABUHAN LAINNYA/OTHER PORTS 1.475,7 1.559,9 540,1 438,1 320,7 -35,09 233,4 157,0 -32,73
36

Lanjutan/Continued
Nilai/Value : Ribu/Thousand US$No. 08.05.148
2015 2016
2016 2017
20142012 2013
TABEL 15 : NILAI EKSPOR 100 JENIS BARANG MENURUT PELABUHAN MUAT UTAMA
EXPORT VALUE OF 100 COMMODITIES BY MAIN PORT OF EMBARKATION
KODE
CODE
HS
JENIS BARANG
DESCRIPTION OF GOODS
Trend (%)
12-16
Jan-Ags/Jan-Aug Perub. (%)
Change (%)
17-16
5509 Yarn (other than sewing thread) of synthetic staple fibres, not put up for retail sale 894.903,4 953.198,0 988.741,8 859.263,5 792.685,9 -3,40 553.434,4 669.160,8 20,91
TANJUNG PRIOK 588.292,6 612.611,7 617.732,3 539.175,1 483.152,5 -5,08 339.756,0 381.977,7 12,43
TANJUNG EMAS 187.547,4 215.030,5 266.437,1 245.104,0 238.473,9 6,30 167.783,6 213.165,6 27,05
TANJUNG PERAK 118.279,4 124.645,2 103.566,9 74.230,3 70.159,8 -14,47 45.422,8 73.475,9 61,76
SOEKARNO-HATTA (U) 696,9 363,8 962,6 704,0 863,3 11,50 445,9 520,9 16,83
JUANDA (U)-SURABAYA 82,2 26,3 24,8 48,5 36,2 -9,79 26,0 0,8 -97,06
PELABUHAN LAINNYA/OTHER PORTS 4,8 520,5 18,1 1,7 0,3 -68,31 0,1 19,9 36113,64
5510 Yarn (other than sewing thread) of artificial staple fibres, not put up for retail sale 388.793,0 461.133,8 442.455,2 503.797,2 499.646,0 6,08 344.154,9 416.596,5 21,05
TANJUNG EMAS 132.383,7 199.179,5 207.183,5 274.663,0 272.272,9 19,29 190.176,5 219.926,7 15,64
TANJUNG PRIOK 243.245,2 249.690,4 217.630,3 204.778,5 204.297,4 -5,33 137.080,3 177.247,4 29,30
TANJUNG PERAK 13.116,1 12.017,6 17.549,1 24.266,6 22.949,9 19,98 16.810,0 19.262,4 14,59
SOEKARNO-HATTA (U) 36,8 230,9 63,0 89,1 123,8 15,91 87,3 157,8 80,82
JUANDA (U)-SURABAYA - 3,1 - - 2,0 - 0,8 - -
PELABUHAN LAINNYA/OTHER PORTS 11,2 12,4 29,3 0,0 0,0 -88,20 0,0 2,3 25387,11
6103 Suits, ensembles, jackets, blazers, trousers, bib and brace overalls, breeches, shorts (not
swimwear); men's or boys', knitted or crocheted
225.027,5 256.403,8 287.007,8 274.371,7 268.751,2 4,32 175.648,9 275.276,4 56,72
TANJUNG PRIOK 173.700,3 202.300,6 230.770,3 208.793,1 182.077,8 1,27 116.356,6 191.514,1 64,59
TANJUNG EMAS 26.475,7 23.734,1 33.333,0 43.572,8 58.853,1 24,67 42.347,1 61.826,4 46,00
SOEKARNO-HATTA (U) 14.195,0 22.194,4 15.450,1 17.076,4 23.852,9 8,07 14.560,9 18.168,4 24,78
BELAWAN 2.263,3 2.729,2 2.004,2 1.498,2 1.544,8 -12,75 975,2 1.211,0 24,19
SEKUPANG 103,5 503,8 946,0 1.388,0 1.284,2 83,14 705,9 1.477,3 109,28
PELABUHAN LAINNYA/OTHER PORTS 8.289,8 4.941,6 4.504,1 2.043,1 1.138,5 -38,45 703,4 1.079,2 53,43
6104 Suits, ensembles, jackets, dresses, skirts, divided skirts, trousers, bib and brace overalls,
breeches and shorts (not swimwear), women's or girls', knitted or crocheted knitted or
crocheted
586.154,4 618.394,2 656.886,1 644.011,3 624.682,0 1,69 412.152,5 625.301,4 51,72
TANJUNG PRIOK 469.442,7 443.192,1 490.907,8 464.711,9 436.640,6 -0,97 289.741,2 446.220,1 54,01
TANJUNG EMAS 23.358,7 54.572,0 62.685,5 60.265,3 88.579,7 31,85 53.524,4 82.191,5 53,56
SOEKARNO-HATTA (U) 38.666,2 48.333,8 53.580,2 54.446,3 58.477,9 9,93 40.524,5 53.272,9 31,46
BATU AMPAR 45.517,8 43.412,6 22.289,7 36.497,2 18.605,3 -17,82 13.556,5 24.604,3 81,49
SEKUPANG 916,4 5.898,9 10.555,6 20.028,0 14.309,0 95,79 9.158,5 13.010,4 42,06
PELABUHAN LAINNYA/OTHER PORTS 8.252,5 22.984,8 16.867,3 8.062,7 8.069,6 -10,35 5.647,5 6.002,3 6,28
6109 T-shirts, singlets and other vests; knitted or crocheted 613.553,3 425.362,0 348.574,8 487.040,0 489.762,2 -3,10 319.803,6 423.941,7 32,56
TANJUNG PRIOK 453.698,9 317.148,1 239.013,4 304.435,0 316.697,4 -7,32 200.680,6 297.067,0 48,03
TANJUNG EMAS 80.694,7 58.182,5 68.823,8 115.951,7 111.623,1 14,32 75.127,5 74.013,2 -1,48
SOEKARNO-HATTA (U) 65.355,6 37.167,8 31.222,5 53.689,0 50.038,8 -1,65 36.221,0 46.275,7 27,76
SEKUPANG 354,6 1.311,9 2.470,8 3.274,6 3.580,2 74,00 2.451,8 1.313,9 -46,41
NGURAH RAI (U) 5.979,6 3.338,4 2.688,6 3.654,7 3.204,2 -10,93 2.288,7 1.853,0 -19,04
PELABUHAN LAINNYA/OTHER PORTS 7.469,8 8.213,3 4.355,6 6.035,0 4.618,4 -11,92 3.034,0 3.418,8 12,69
37

Lanjutan/Continued
Nilai/Value : Ribu/Thousand US$No. 08.05.148
2015 2016
2016 2017
20142012 2013
TABEL 15 : NILAI EKSPOR 100 JENIS BARANG MENURUT PELABUHAN MUAT UTAMA
EXPORT VALUE OF 100 COMMODITIES BY MAIN PORT OF EMBARKATION
KODE
CODE
HS
JENIS BARANG
DESCRIPTION OF GOODS
Trend (%)
12-16
Jan-Ags/Jan-Aug Perub. (%)
Change (%)
17-16
6110 Jerseys, pullovers, cardigans, waistcoats and similar articles; knitted or crocheted 841.558,1 924.053,6 837.614,2 619.775,7 677.892,8 -7,98 428.545,5 726.619,9 69,55
TANJUNG PRIOK 681.379,5 744.237,6 680.148,4 482.519,1 513.766,3 -9,50 328.870,1 551.181,5 67,60
SOEKARNO-HATTA (U) 91.084,6 108.231,9 91.648,1 76.749,5 97.912,3 -1,97 59.090,1 85.047,7 43,93
TANJUNG EMAS 35.444,0 39.690,7 45.790,4 39.602,6 52.633,5 8,21 32.095,0 71.515,8 122,83
BATU AMPAR 30.887,5 25.471,6 14.176,1 17.523,3 11.097,9 -21,50 6.700,6 15.627,0 133,22
NGURAH RAI (U) 718,5 785,8 724,3 447,1 899,1 -1,15 622,7 692,1 11,14
PELABUHAN LAINNYA/OTHER PORTS 2.044,0 5.636,0 5.127,0 2.934,0 1.583,7 -10,98 1.167,0 2.555,7 119,00
6201 Overcoats, car-coats, capes, cloaks, anoraks (including ski-jackets), wind-cheaters, wind-
jackets and similar articles, men's or boys', other than those of heading no. 6203 (not
knitted
403.473,2 350.851,4 362.279,4 322.445,9 370.534,3 -2,52 240.476,2 358.307,2 49,00
TANJUNG PRIOK 315.428,1 281.230,4 277.854,2 241.723,0 237.678,4 -6,92 165.446,2 211.172,3 27,64
TANJUNG EMAS 31.638,0 17.685,9 38.356,7 41.507,0 80.357,8 31,22 48.818,2 68.576,3 40,47
SOEKARNO-HATTA (U) 43.309,1 43.240,6 37.693,2 34.368,2 45.777,4 -1,18 22.367,6 74.173,6 231,61
TANJUNG PERAK 12.681,2 8.220,8 7.816,2 4.507,2 5.735,8 -19,65 3.208,3 3.440,2 7,23
JUANDA (U)-SURABAYA 170,4 273,0 248,5 136,6 344,1 7,39 315,3 42,1 -86,64
PELABUHAN LAINNYA/OTHER PORTS 246,4 200,7 310,7 203,9 640,9 21,26 320,5 902,6 181,59
6203 Suits, ensembles, jackets, blazers, trousers, bib and brace overalls, breeches and shorts
(other than swimwear); men's or boys' (not knitted or crocheted)
641.441,6 728.398,0 709.427,3 678.374,7 701.771,8 1,09 481.182,2 588.988,4 22,40
TANJUNG PRIOK 504.579,6 505.796,0 468.649,0 494.278,7 496.021,8 -0,57 348.718,2 394.332,2 13,08
TANJUNG EMAS 65.336,9 122.690,8 137.958,8 105.990,5 124.587,2 12,13 81.763,7 106.546,7 30,31
SOEKARNO-HATTA (U) 46.825,2 69.898,2 61.153,0 59.495,0 58.078,9 2,73 35.103,8 69.727,2 98,63
TANJUNG PERAK 365,2 3.476,0 7.038,2 14.986,8 19.970,4 157,65 13.713,9 15.708,4 14,54
JUANDA (U)-SURABAYA 24,7 374,9 385,9 1.532,6 803,9 131,05 372,3 1.332,4 257,87
PELABUHAN LAINNYA/OTHER PORTS 24.310,0 26.162,2 34.242,5 2.091,1 2.309,6 -51,49 1.510,3 1.341,6 -11,17
6204 Suits, ensembles, jackets, dresses, skirts, divided skirts, trousers, bib and brace overalls,
breeches and shorts (other than swimwear); women's or girls' (not knitted or crocheted)
825.035,6 869.257,9 884.799,7 1.010.701,0 939.973,5 4,20 647.279,9 798.174,0 23,31
TANJUNG PRIOK 548.852,2 562.872,1 596.682,5 594.416,4 566.200,5 1,17 398.103,7 432.192,6 8,56
TANJUNG EMAS 104.672,6 115.064,9 116.266,2 203.377,5 194.999,3 19,89 130.257,5 188.082,1 44,39
SOEKARNO-HATTA (U) 103.609,2 122.633,6 113.740,9 151.370,7 124.888,7 6,02 85.606,2 130.831,1 52,83
TANJUNG PERAK 7.017,7 9.370,9 11.146,1 36.167,1 32.020,9 55,06 18.499,7 28.826,6 55,82
NGURAH RAI (U) 29.522,1 24.895,1 26.225,9 20.432,5 19.940,2 -9,36 13.395,2 16.209,9 21,01
PELABUHAN LAINNYA/OTHER PORTS 31.361,9 34.421,3 20.738,1 4.936,8 1.923,9 -52,88 1.417,5 2.031,7 43,33
6205 Shirts; men's or boys' (not knitted or crocheted) 504.892,5 532.951,4 510.401,8 457.125,3 450.771,5 -3,73 298.664,5 361.465,2 21,03
TANJUNG EMAS 205.325,5 223.408,3 226.518,7 215.678,4 212.552,0 0,34 142.599,5 166.977,2 17,10
TANJUNG PRIOK 263.351,7 270.205,0 253.952,4 206.929,4 211.381,9 -6,82 139.020,1 171.113,0 23,09
SOEKARNO-HATTA (U) 31.442,2 32.199,9 25.078,9 29.070,3 21.980,9 -7,86 14.295,4 19.740,4 38,09
TANJUNG PINANG 2.924,8 2.574,1 2.235,7 2.959,4 3.614,6 5,79 1.891,1 2.613,3 38,19
NGURAH RAI (U) 635,7 814,9 1.574,6 2.006,1 499,2 4,26 376,1 486,4 29,33
PELABUHAN LAINNYA/OTHER PORTS 1.212,6 3.749,1 1.041,6 481,8 742,8 -26,15 482,4 535,0 10,89
38

Lanjutan/Continued
Nilai/Value : Ribu/Thousand US$No. 08.05.148
2015 2016
2016 2017
20142012 2013
TABEL 15 : NILAI EKSPOR 100 JENIS BARANG MENURUT PELABUHAN MUAT UTAMA
EXPORT VALUE OF 100 COMMODITIES BY MAIN PORT OF EMBARKATION
KODE
CODE
HS
JENIS BARANG
DESCRIPTION OF GOODS
Trend (%)
12-16
Jan-Ags/Jan-Aug Perub. (%)
Change (%)
17-16
6206 Blouses, shirts and shirt-blouses; women's or girls' (not knitted or crocheted) 497.990,7 564.595,7 586.930,2 600.819,0 559.765,0 3,00 391.797,2 503.502,1 28,51
TANJUNG PRIOK 298.050,9 336.337,0 344.965,1 361.231,3 322.488,6 2,32 227.007,2 265.302,3 16,87
TANJUNG EMAS 124.865,4 129.548,2 134.750,7 123.971,7 135.736,0 1,24 94.814,5 135.324,2 42,73
SOEKARNO-HATTA (U) 63.627,5 88.279,6 97.426,7 106.143,6 92.495,1 9,77 63.592,5 95.779,2 50,61
NGURAH RAI (U) 7.512,6 5.891,9 6.113,8 5.221,7 4.464,4 -10,97 3.180,4 3.544,0 11,43
TANJUNG PERAK 2.245,7 2.052,8 1.951,7 2.844,8 3.413,0 12,34 2.351,8 2.381,0 1,24
PELABUHAN LAINNYA/OTHER PORTS 1.688,5 2.486,2 1.722,1 1.406,0 1.167,9 -12,26 850,8 1.171,4 37,69
6212 Brassieres, girdles, corsets, braces, suspenders, garters and similar articles and parts
thereof; whether or not knitted or crocheted
323.414,8 326.865,9 325.126,8 383.571,6 351.151,0 3,30 234.960,1 317.906,8 35,30
TANJUNG PRIOK 216.085,5 219.211,6 189.018,9 206.410,6 174.210,4 -4,79 119.373,2 147.233,4 23,34
TANJUNG EMAS 66.993,6 82.297,1 92.523,4 118.122,2 127.495,9 17,92 82.923,6 118.025,7 42,33
SOEKARNO-HATTA (U) 38.655,6 23.051,9 40.647,1 56.160,1 47.103,9 13,72 30.741,4 49.726,6 61,76
SEKUPANG 98,0 1.874,9 1.798,2 2.345,8 1.144,2 67,18 988,2 269,8 -72,69
HALIM PERDANA KUSUMA (U) 15,6 6,2 3,1 9,2 414,0 100,25 413,8 0,9 -99,79
PELABUHAN LAINNYA/OTHER PORTS 1.566,5 424,1 1.136,1 523,7 782,7 -11,10 519,8 2.650,5 409,89
6402 Footwear; with outer soles and uppers of rubber or plastics (excluding waterproof
footwear)
540.446,0 536.220,8 643.464,1 554.391,8 512.507,5 -0,73 313.705,4 447.554,2 42,67
TANJUNG PRIOK 462.794,5 436.656,0 534.081,5 462.560,2 431.045,8 -0,84 262.359,3 368.862,3 40,59
TANJUNG PERAK 66.617,8 76.499,5 79.043,9 70.356,1 60.498,0 -2,73 41.536,3 47.836,3 15,17
SOEKARNO-HATTA (U) 8.310,3 20.089,7 26.817,2 17.934,5 16.043,5 12,77 6.800,9 18.476,0 171,67
TANJUNG EMAS 2.174,8 2.385,8 2.964,0 2.908,9 3.398,8 11,53 2.049,9 11.538,3 462,87
JUANDA (U)-SURABAYA 412,2 417,6 345,2 429,4 839,2 15,60 363,2 669,0 84,20
PELABUHAN LAINNYA/OTHER PORTS 136,4 172,2 212,3 202,7 682,3 40,25 595,9 172,4 -71,07
6403 Footwear; with outer soles of rubber, plastics, leather or composition leather and uppers
of leather
2.195.930,3 2.272.075,5 2.233.324,2 2.303.477,6 2.260.269,7 0,72 1.441.492,1 2.083.510,7 44,54
TANJUNG PRIOK 1.701.499,2 1.715.163,5 1.667.710,2 1.791.367,9 1.750.215,5 1,00 1.099.061,5 1.583.379,3 44,07
TANJUNG PERAK 322.224,2 404.900,5 424.351,8 371.539,0 344.546,7 0,48 238.967,5 267.031,7 11,74
SOEKARNO-HATTA (U) 80.306,5 73.686,2 63.357,2 74.830,9 86.706,3 1,70 54.125,3 84.283,5 55,72
BATU AMPAR 3.506,4 185,0 189,2 25.304,2 35.838,1 160,32 24.823,9 9.264,6 -62,68
TANJUNG EMAS 18.898,0 13.792,4 17.996,1 17.629,2 29.110,1 11,73 13.677,8 104.676,0 665,30
PELABUHAN LAINNYA/OTHER PORTS 69.496,0 64.347,9 59.719,7 22.806,3 13.853,0 -34,71 10.836,2 34.875,6 221,84
6404 Footwear; with outer soles of rubber, plastics, leather or composition leather and uppers
of textile materials
671.281,4 905.619,6 1.065.774,7 1.474.816,5 1.707.373,5 26,55 1.170.120,3 1.347.980,7 15,20
TANJUNG PRIOK 626.920,6 849.089,1 997.188,3 1.382.597,1 1.605.487,7 26,72 1.112.402,2 1.227.965,0 10,39
TANJUNG PERAK 31.568,9 38.768,2 42.285,2 48.180,2 63.677,1 17,59 35.351,0 39.330,8 11,26
SOEKARNO-HATTA (U) 9.165,7 14.245,1 24.277,4 41.993,9 35.826,5 46,34 21.383,8 66.222,5 209,68
JUANDA (U)-SURABAYA 1.940,7 723,0 1.121,6 1.425,6 991,3 -6,43 656,6 1.193,9 81,84
TANJUNG EMAS 172,9 78,6 184,9 167,0 845,3 48,11 25,2 12.163,7 48206,23
PELABUHAN LAINNYA/OTHER PORTS 1.512,7 2.715,8 717,3 452,6 545,6 -31,83 301,5 1.104,8 266,40
39

Lanjutan/Continued
Nilai/Value : Ribu/Thousand US$No. 08.05.148
2015 2016
2016 2017
20142012 2013
TABEL 15 : NILAI EKSPOR 100 JENIS BARANG MENURUT PELABUHAN MUAT UTAMA
EXPORT VALUE OF 100 COMMODITIES BY MAIN PORT OF EMBARKATION
KODE
CODE
HS
JENIS BARANG
DESCRIPTION OF GOODS
Trend (%)
12-16
Jan-Ags/Jan-Aug Perub. (%)
Change (%)
17-16
6704 Wigs, false beards, eyebrows and eyelashes, switches and the like, of human or animal
hair or of textile materials; articles of human hair, n.e.c. or included
270.780,3 297.322,8 311.725,4 340.871,9 381.962,8 8,60 245.390,2 362.364,0 47,67
TANJUNG PRIOK 178.313,5 198.602,6 194.559,4 206.572,6 212.566,6 3,99 139.399,8 217.321,5 55,90
SOEKARNO-HATTA (U) 56.005,1 49.300,9 46.538,4 64.903,5 89.197,5 12,81 56.327,1 69.509,9 23,40
TANJUNG PERAK 30.145,5 40.078,1 58.972,2 58.318,8 68.341,3 22,29 42.222,8 64.149,4 51,93
TANJUNG EMAS 4.614,0 5.548,1 6.009,9 7.436,8 8.954,6 17,58 5.671,7 9.894,6 74,46
JUANDA (U)-SURABAYA 117,4 1.661,1 2.032,4 798,7 1.007,0 42,86 687,9 618,3 -10,12
PELABUHAN LAINNYA/OTHER PORTS 1.584,9 2.132,0 3.613,2 2.841,5 1.895,7 6,67 1.080,8 870,4 -19,47
7108 Gold (including gold plated with platinum) unwrought or in semi-manufactured forms, or in
powder form
2.006.180,6 1.817.465,0 1.504.594,1 1.377.388,0 1.373.479,0 -9,83 861.418,1 1.491.051,6 73,09
SOEKARNO-HATTA (U) 1.200.339,9 1.269.714,4 1.264.523,4 1.377.388,0 1.373.479,0 3,57 861.418,1 1.491.051,6 73,09
HANG NADIM (U) 88,1 - 0,1 - - - - - -
JUANDA (U)-SURABAYA 805.752,6 547.710,6 240.070,6 - - - - - -
TANJUNG PRIOK - 40,0 - - - - - - -
- - - - - - - #N/A #N/A -
PELABUHAN LAINNYA/OTHER PORTS - - - - - - #N/A #N/A -
7112 Waste and scrap of precious metal or of metal clad with precious metal; other waste and
scrap containing precious metal compounds, of a kind uses principally for the recovery of
precious
940.794,5 622.853,5 886.719,5 685.461,9 736.510,7 -3,86 492.661,6 738.846,2 49,97
TANJUNG PERAK 940.546,0 619.344,0 856.532,2 654.087,8 717.685,2 -4,75 475.740,3 734.854,9 54,47
SOEKARNO-HATTA (U) 92,4 - 26.981,1 27.662,0 14.108,4 - 13.659,9 217,0 -98,41
NGURAH RAI (U) 39,1 2.421,8 3.204,1 3.447,5 4.367,7 166,10 3.036,1 3.425,5 12,83
JUANDA (U)-SURABAYA - - - - 296,4 - 225,2 116,4 -48,29
TANJUNG PRIOK 90,8 1.075,3 2,1 264,1 53,0 -21,96 0,2 231,0 115413,67
PELABUHAN LAINNYA/OTHER PORTS 26,2 12,5 - 0,5 - - - 1,2 -
7113 Jewellery articles and parts thereof, of precious metal or of metal clad with precious metal 157.499,1 177.425,1 2.114.581,5 3.287.912,6 4.078.827,7 156,71 3.488.262,0 2.394.608,5 -31,35
JUANDA (U)-SURABAYA 31.091,0 45.519,2 1.828.813,6 2.631.869,5 3.439.333,8 284,57 3.071.912,8 1.973.323,3 -35,76
SOEKARNO-HATTA (U) 57.858,5 79.614,2 233.938,5 607.695,1 594.871,2 95,29 388.086,0 389.437,2 0,35
NGURAH RAI (U) 65.630,9 50.385,9 46.020,9 43.266,1 36.585,0 -12,38 22.984,3 30.643,7 33,32
HALIM PERDANA KUSUMA (U) 2.852,3 1.859,6 1.879,7 4.621,2 7.953,4 34,46 5.231,7 730,1 -86,05
TANJUNG PERAK 57,1 45,7 74,1 60,1 73,5 8,08 24,8 74,6 200,64
PELABUHAN LAINNYA/OTHER PORTS 9,5 0,5 3.854,8 400,6 10,8 99,98 22,5 399,7 1679,52
7201 Pig iron and spiegeleisen in pigs, blocks or other primary forms 5.037,6 38.948,6 130.421,3 184.885,1 533.336,3 196,89 393.120,8 165.316,6 -57,95
KOLONEDALE - - - 90.283,4 420.843,5 - 317.812,8 121.188,1 -61,87
TANJUNG PRIOK 1.247,8 16.436,4 41.064,5 26.877,9 44.000,9 114,20 23.279,5 28.739,2 23,45
PULAU GEBE - - - - 26.420,6 - 19.717,2 - -
MERAK 3.788,7 18.637,2 37.760,3 39.286,2 26.225,6 58,65 16.991,6 11.739,7 -30,91
CIGADING - - 36.558,7 24.585,8 10.240,9 - 9.714,9 3.649,6 -62,43
PELABUHAN LAINNYA/OTHER PORTS 1,1 3.875,0 15.037,8 3.851,8 5.604,7 455,54 5.604,7 0,0 -100,00
40

Lanjutan/Continued
Nilai/Value : Ribu/Thousand US$No. 08.05.148
2015 2016
2016 2017
20142012 2013
TABEL 15 : NILAI EKSPOR 100 JENIS BARANG MENURUT PELABUHAN MUAT UTAMA
EXPORT VALUE OF 100 COMMODITIES BY MAIN PORT OF EMBARKATION
KODE
CODE
HS
JENIS BARANG
DESCRIPTION OF GOODS
Trend (%)
12-16
Jan-Ags/Jan-Aug Perub. (%)
Change (%)
17-16
7202 Ferro-alloys 369.169,1 249.848,5 331.762,3 349.086,3 589.026,5 13,53 237.257,6 1.110.344,0 367,99
KOLONEDALE - - - 95.531,1 346.001,8 - 115.456,3 741.416,4 542,16
POMALAA 342.271,0 229.722,8 272.320,6 128.864,7 107.071,3 -25,19 58.789,6 58.048,1 -1,26
TANJUNG PERAK 1.448,6 22,6 19.812,8 98.477,2 91.918,2 430,19 37.622,6 112.549,3 199,15
TANJUNG PRIOK 25.448,2 17.772,1 38.575,8 26.211,9 35.928,5 11,39 25.385,4 27.839,7 9,67
GEBE - - - - 8.001,9 - - 14.602,8 -
PELABUHAN LAINNYA/OTHER PORTS 1,3 2.331,0 1.053,2 1,6 104,8 15,70 3,7 155.887,8 4260060,54
7308 Structures of iron or steel and parts thereof; plates, rods, angles, shapes, sections, tubes
and the like, prepared for use in structures
427.400,4 580.851,2 691.507,5 247.445,4 701.271,9 1,38 489.805,1 138.938,7 -71,63
KABIL/PANAU 50.969,0 139.263,4 236.059,8 6.870,8 427.440,3 13,25 292.682,1 8.824,8 -96,98
BATU AMPAR 186.433,3 247.599,6 237.794,3 101.026,4 96.374,1 -19,88 64.158,8 35.030,4 -45,40
TANJUNG LENENG 67.567,6 16.690,4 82.515,9 85.270,1 73.014,2 19,55 70.969,9 - -
SEKUPANG 37.001,9 65.299,5 25.545,7 12.301,9 36.780,7 -15,47 33.676,2 7.172,1 -78,70
CIWANDAN - - - 661,2 22.912,6 - 18,5 44.386,9 240479,29
PELABUHAN LAINNYA/OTHER PORTS 85.428,5 111.998,3 109.591,8 41.315,1 44.749,9 -20,47 28.299,6 43.524,6 53,80
7403 Copper; refined and copper alloys, unwrought 556.098,1 525.860,5 757.179,3 553.843,8 788.588,8 7,79 443.723,5 895.906,5 101,91
TANJUNG PERAK 544.060,4 521.077,4 756.834,8 553.057,6 786.050,8 8,28 442.475,3 889.141,1 100,95
TANJUNG PRIOK 461,3 4.339,5 47,2 670,5 2.433,9 15,71 1.153,0 6.623,7 474,45
TANJUNG EMAS 21,7 42,0 68,7 80,8 65,6 33,16 60,2 23,4 -61,18
NGURAH RAI (U) 4,0 6,9 1,9 6,6 19,2 36,52 16,1 9,2 -42,83
SOEKARNO-HATTA (U) 579,6 357,8 211,0 27,8 10,9 -65,02 10,4 11,3 9,05
PELABUHAN LAINNYA/OTHER PORTS 10.971,0 36,9 15,7 0,5 8,5 -84,38 8,5 97,8 1049,74
7408 Copper wire 913.382,1 853.258,0 762.736,7 641.214,5 499.973,3 -13,85 322.284,5 447.777,2 38,94
TANJUNG PRIOK 913.178,8 852.814,9 762.132,7 640.362,9 499.707,0 -13,86 322.179,4 447.607,2 38,93
SOEKARNO-HATTA (U) 9,8 68,6 214,1 325,0 200,4 113,48 74,0 101,0 36,51
TANJUNG UBAN 5,1 26,7 198,6 435,3 28,9 86,72 17,7 19,2 8,57
TANJUNG PERAK 6,0 1,1 0,3 43,7 22,6 89,16 - - -
NGURAH RAI (U) 72,6 73,7 19,0 10,9 12,5 -41,87 12,5 - -
PELABUHAN LAINNYA/OTHER PORTS 109,7 273,0 171,9 36,7 1,9 -63,77 0,9 49,7 5205,20
7501 Nickel mattes; nickel oxide sinters and other intermediate products of nickel metallurgy 981.839,0 921.889,9 1.038.074,3 789.745,9 584.143,3 -11,25 348.115,7 494.402,6 42,02
BALANTANG/MALILI 35.612,4 - - 789.745,9 584.143,3 - 348.115,7 494.402,6 42,02
MALILI, SULAWESI 946.226,6 921.889,9 1.038.074,3 - - - - - -
- - - - - - - - - -
- - - - - - - - - -
- - - - - - - - - -
PELABUHAN LAINNYA/OTHER PORTS - - - - - - - - -
41

Lanjutan/Continued
Nilai/Value : Ribu/Thousand US$No. 08.05.148
2015 2016
2016 2017
20142012 2013
TABEL 15 : NILAI EKSPOR 100 JENIS BARANG MENURUT PELABUHAN MUAT UTAMA
EXPORT VALUE OF 100 COMMODITIES BY MAIN PORT OF EMBARKATION
KODE
CODE
HS
JENIS BARANG
DESCRIPTION OF GOODS
Trend (%)
12-16
Jan-Ags/Jan-Aug Perub. (%)
Change (%)
17-16
8001 Tin; unwrought 2.051.317,3 1.959.795,1 1.580.196,8 1.153.622,7 1.119.872,1 -15,97 606.467,7 1.276.192,7 110,43
PANGKAL BALAM 1.027.239,0 1.037.697,9 984.585,0 666.824,1 732.831,4 -10,57 405.215,8 816.310,9 101,45
MUNTOK 444.708,7 288.262,0 298.345,4 306.364,4 230.997,7 -11,74 100.770,2 308.303,7 205,95
TANJUNG BALAI KARIMUN 171.546,8 249.438,3 195.892,0 173.302,3 156.042,9 -5,39 100.481,7 151.465,6 50,74
TANJUNG PERAK - - 0,0 - - - - - -
SEKUPANG 9,1 - - 0,0 - - - - -
PELABUHAN LAINNYA/OTHER PORTS 407.813,7 384.397,0 101.374,4 7.132,0 - - - 112,5 -
8407 Reciprocating or rotary internal combustion piston engines 92.646,5 124.032,3 139.233,8 143.789,6 319.197,5 29,98 188.689,0 329.077,7 74,40
TANJUNG PRIOK 88.398,4 121.032,3 130.615,7 137.717,1 304.482,7 29,73 181.628,4 322.573,4 77,60
SOEKARNO-HATTA (U) 1.997,4 673,5 5.834,2 5.732,0 14.651,5 84,53 7.022,1 5.994,0 -14,64
BELAWAN - - - 0,2 18,0 - 18,0 - -
TANJUNG PERAK 14,5 20,2 61,3 9,1 17,9 -3,67 0,1 92,5 129258,52
BATU AMPAR 6,7 339,3 11,0 34,6 10,3 -13,16 4,6 22,5 393,15
PELABUHAN LAINNYA/OTHER PORTS 2.229,6 1.967,0 2.711,6 296,6 17,1 -68,75 15,9 395,2 2384,17
8409 Parts suitable for use solely or principally with the engines of heading no. 8407 or 8408 335.092,8 502.088,3 321.163,2 298.879,6 315.821,3 -6,17 203.511,4 334.473,9 64,35
TANJUNG PRIOK 307.750,7 469.814,9 292.439,5 271.539,6 281.691,4 -7,00 183.678,3 306.849,5 67,06
SOEKARNO-HATTA (U) 10.496,0 13.506,6 11.485,2 12.644,1 17.547,1 10,10 10.787,7 17.470,5 61,95
JUANDA (U)-SURABAYA 32,3 142,7 2.272,5 2.192,9 6.316,1 277,47 5.004,2 2.940,4 -41,24
TANJUNG PERAK 8.008,4 4.847,3 1.995,3 4.341,6 4.492,6 -11,89 1.932,3 4.996,7 158,58
TANJUNG EMAS 549,1 564,9 552,7 447,3 1.630,4 21,45 415,2 444,5 7,06
PELABUHAN LAINNYA/OTHER PORTS 8.256,3 13.211,9 12.418,1 7.714,1 4.143,7 -17,44 1.693,7 1.772,2 4,64
8418 Refrigerators, freezers and other refrigerating or freezing equipment, electric or other; heat
pumps other than air conditioning machines of heading no. 8415
456.139,1 424.380,9 397.459,8 322.484,4 328.360,5 -8,90 218.965,4 295.503,7 34,95
TANJUNG PRIOK 395.618,6 371.169,7 360.737,6 290.905,0 289.225,8 -8,33 196.320,3 260.493,0 32,69
TANJUNG PERAK 25.147,6 24.707,6 21.975,1 23.850,8 31.735,3 4,39 18.977,7 28.782,4 51,66
TANJUNG EMAS 5.177,3 2.556,8 4.995,1 3.941,2 2.917,2 -6,90 1.898,2 3.162,9 66,62
BATU AMPAR 16.911,6 2.865,6 150,7 117,7 2.018,8 -52,49 34,0 590,1 1637,06
SOEKARNO-HATTA (U) 560,2 626,2 1.234,5 812,3 1.241,8 20,35 947,0 1.348,7 42,41
PELABUHAN LAINNYA/OTHER PORTS 12.723,8 22.455,1 8.366,9 2.857,3 1.221,6 -49,08 788,2 1.126,7 42,96
8419 Machinery, plant (not domestic), or laboratory equipment; electrically heated or not,
(excluding items in 85.14) for the treatment of materials by a process involving change of
28.565,4 62.882,1 325.417,9 147.167,6 434.451,9 87,65 349.542,1 48.622,6 -86,09
KABIL/PANAU 11.588,0 38.620,6 215.127,7 96.178,0 246.909,3 101,99 246.909,3 31.717,8 -87,15
BATU AMPAR 4.084,4 7.056,0 5.758,9 19.030,8 145.010,5 125,50 91.655,4 3.017,5 -96,71
TANJUNG PRIOK 8.891,8 9.386,7 10.647,4 9.095,7 25.409,1 22,98 5.679,3 6.428,2 13,19
SEKUPANG 290,4 20,6 82.151,7 613,9 9.124,2 179,80 0,6 403,7 69444,58
TANJUNG PERAK 2.899,8 3.123,3 1.099,0 4.038,3 4.469,9 11,88 3.003,0 4.312,9 43,62
PELABUHAN LAINNYA/OTHER PORTS 811,1 4.675,0 10.633,3 18.210,9 3.528,9 53,73 2.294,7 2.742,5 19,52
42

Lanjutan/Continued
Nilai/Value : Ribu/Thousand US$No. 08.05.148
2015 2016
2016 2017
20142012 2013
TABEL 15 : NILAI EKSPOR 100 JENIS BARANG MENURUT PELABUHAN MUAT UTAMA
EXPORT VALUE OF 100 COMMODITIES BY MAIN PORT OF EMBARKATION
KODE
CODE
HS
JENIS BARANG
DESCRIPTION OF GOODS
Trend (%)
12-16
Jan-Ags/Jan-Aug Perub. (%)
Change (%)
17-16
8443 Printing machinery; used for printing by means of plates, cylinders and other printing
components of heading 84.42; other printers, copying machines and facsimile machines,
whether or not textile, lea
1.826.819,9 1.537.449,5 1.593.788,2 1.531.098,6 1.358.024,7 -5,80 855.518,1 1.311.416,9 53,29
TANJUNG PRIOK 1.583.772,3 1.241.532,5 1.318.658,9 1.219.370,0 1.175.432,2 -5,96 731.085,7 1.100.375,0 50,51
SEKUPANG 114.123,7 158.795,4 173.433,5 258.530,3 118.679,3 5,82 87.032,4 116.128,8 33,43
SOEKARNO-HATTA (U) 42.787,1 42.025,8 77.446,5 42.296,8 56.939,2 5,95 33.906,6 89.688,1 164,52
BATU AMPAR 84.234,9 93.288,2 20.629,7 9.159,4 4.930,2 -55,06 2.028,7 3.517,4 73,38
TANJUNG PERAK 1.242,1 1.419,2 1.200,0 1.240,0 1.294,9 -0,52 906,5 252,8 -72,11
PELABUHAN LAINNYA/OTHER PORTS 659,9 388,4 2.419,7 502,1 748,8 5,23 558,3 1.454,8 160,59
8471 Automatic data processing machines and units thereof, magnetic or optical readers,
machines for transcribing data onto data media in coded form and machines for
processing such data, not
429.161,4 310.465,0 380.225,4 250.493,5 273.130,3 -10,58 168.136,8 252.563,0 50,21
SEKUPANG 124.862,1 61.018,4 83.017,4 85.803,5 111.837,0 1,21 65.610,1 101.932,8 55,36
BATU AMPAR 263.490,3 195.288,4 224.302,6 101.510,5 94.112,0 -23,76 60.629,2 72.735,8 19,97
SOEKARNO-HATTA (U) 17.194,0 30.864,0 37.561,0 40.097,8 32.457,4 16,56 19.727,1 23.346,7 18,35
TANJUNG PRIOK 17.410,7 17.101,2 13.377,4 14.526,1 18.598,6 -0,31 10.629,4 24.887,4 134,14
HANG NADIM (U) 2.981,2 4.017,7 18.564,2 6.610,5 14.009,8 43,23 10.173,6 28.763,6 182,73
PELABUHAN LAINNYA/OTHER PORTS 3.223,1 2.175,3 3.402,7 1.945,0 2.115,5 -9,10 1.367,4 896,6 -34,43
8504 Electric transformers, static converters (e.g. rectifiers) and inductors 578.805,5 475.800,4 441.781,0 450.965,3 392.598,8 -7,96 256.276,9 434.843,9 69,68
TANJUNG PRIOK 330.102,0 215.600,0 193.062,8 201.076,6 151.289,5 -15,04 103.740,6 102.076,6 -1,60
SEKUPANG 71.056,8 133.204,4 142.985,1 151.532,2 123.587,8 13,15 82.029,3 85.667,3 4,44
BATU AMPAR 96.948,1 38.037,2 32.593,4 51.696,8 51.991,9 -8,97 36.667,8 74.351,1 102,77
SOEKARNO-HATTA (U) 38.104,1 28.616,6 21.047,6 20.240,7 20.204,1 -14,91 12.180,9 21.793,4 78,91
BELAWAN 13,8 348,9 2.045,6 7.218,2 14.146,7 441,52 5.969,4 8.586,2 43,84
PELABUHAN LAINNYA/OTHER PORTS 42.580,9 59.993,3 50.046,6 19.201,0 31.378,7 -16,05 15.688,9 142.369,3 807,45
8506 Cells and batteries; primary 333.602,9 396.691,2 452.071,1 481.468,4 463.568,3 8,89 303.221,8 425.300,0 40,26
TANJUNG PRIOK 261.617,0 308.408,1 324.628,4 340.695,4 341.809,8 6,55 221.210,2 313.268,7 41,62
BATU AMPAR 5.002,5 4.937,8 10.510,5 61.487,8 79.157,2 123,56 53.973,1 34.539,9 -36,01
SEKUPANG 43.412,3 59.902,8 70.610,4 32.555,7 26.116,8 -15,01 17.646,5 68.419,2 287,72
SOEKARNO-HATTA (U) 17.424,5 22.052,6 43.244,3 44.626,8 15.537,9 4,87 9.839,2 8.372,9 -14,90
BELAWAN 95,0 9,3 34,6 259,2 624,2 103,18 369,0 515,3 39,66
PELABUHAN LAINNYA/OTHER PORTS 6.051,7 1.380,5 3.043,0 1.843,6 322,4 -42,74 183,8 184,0 0,09
8507 Electric accumulators, including separators therefor; whether or not rectangular (including
square)
412.761,0 346.827,0 307.272,5 288.420,5 308.635,5 -7,37 199.512,0 210.220,3 5,37
TANJUNG PRIOK 215.474,0 194.737,8 172.785,9 177.867,0 195.784,4 -2,78 122.118,3 177.410,1 45,28
BATU AMPAR 110.218,9 80.761,1 89.945,1 65.508,4 67.992,3 -11,09 47.637,2 2.526,5 -94,70
TANJUNG PERAK 49.010,5 42.482,9 37.768,0 34.077,2 32.098,1 -10,12 21.248,7 27.037,4 27,24
SEKUPANG 35.063,8 27.091,7 4.705,1 7.492,0 10.163,2 -31,35 7.169,1 601,1 -91,62
SOEKARNO-HATTA (U) 46,1 155,5 216,2 788,9 1.273,5 128,40 540,1 2.475,0 358,27
PELABUHAN LAINNYA/OTHER PORTS 2.947,6 1.598,0 1.852,3 2.686,9 1.324,0 -10,25 798,5 170,2 -78,68
43

Lanjutan/Continued
Nilai/Value : Ribu/Thousand US$No. 08.05.148
2015 2016
2016 2017
20142012 2013
TABEL 15 : NILAI EKSPOR 100 JENIS BARANG MENURUT PELABUHAN MUAT UTAMA
EXPORT VALUE OF 100 COMMODITIES BY MAIN PORT OF EMBARKATION
KODE
CODE
HS
JENIS BARANG
DESCRIPTION OF GOODS
Trend (%)
12-16
Jan-Ags/Jan-Aug Perub. (%)
Change (%)
17-16
8518 Microphones and their stands; loudspeakers, mounted or not in their enclosures;
headphones and earphones, combined or not with a microphone, and sets of a
microphone and one or more
328.923,3 386.872,6 379.263,9 354.054,0 331.840,5 -0,71 222.842,9 256.754,1 15,22
TANJUNG PERAK 52.655,3 79.860,5 84.678,7 105.764,4 101.224,0 17,21 67.925,4 73.912,1 8,81
TANJUNG PRIOK 107.753,5 108.349,0 116.997,9 102.596,6 93.647,5 -3,30 62.757,8 77.900,6 24,13
BATU AMPAR 75.516,0 76.885,7 63.213,3 55.296,9 54.815,8 -9,25 38.716,3 29.526,9 -23,74
SEKUPANG 21.152,5 27.043,2 39.450,8 37.178,7 41.631,9 18,21 25.021,5 38.040,6 52,03
SOEKARNO-HATTA (U) 66.081,5 84.967,0 55.047,9 44.651,7 34.158,6 -17,82 23.746,0 33.986,5 43,13
PELABUHAN LAINNYA/OTHER PORTS 5.764,5 9.767,2 19.875,3 8.565,8 6.362,7 0,66 4.675,9 3.387,3 -27,56
8521 Video recording or reproducing apparatus 657.895,4 562.126,3 538.097,7 474.623,7 382.667,5 -11,78 259.783,0 174.835,7 -32,70
TANJUNG PRIOK 626.394,0 543.599,6 469.504,7 424.740,5 353.837,4 -12,97 241.016,4 156.051,6 -35,25
TANJUNG EMAS 12.907,2 8.449,0 39.468,2 38.607,8 25.517,9 33,41 16.880,3 16.893,4 0,08
SOEKARNO-HATTA (U) 17.174,0 9.675,4 28.508,2 10.190,1 3.108,8 -28,58 1.743,5 1.789,6 2,65
TANJUNG PERAK 890,0 180,7 507,0 1.062,3 177,8 -13,49 135,9 91,8 -32,43
NGURAH RAI (U) 400,9 147,5 0,0 16,8 21,0 -55,36 4,1 0,0 -99,76
PELABUHAN LAINNYA/OTHER PORTS 129,4 74,1 109,6 6,1 4,5 -60,12 2,9 9,2 217,29
8528 Monitors and projectors, not incorporating television reception apparatus; reception
apparatus for television, whether or not incorporating radio-broadcast receivers or sound
or video
1.347.309,3 1.151.682,8 1.052.682,2 1.034.120,1 976.322,2 -7,24 627.800,8 762.347,9 21,43
TANJUNG PRIOK 1.285.363,2 1.117.160,2 1.013.607,7 952.497,3 864.154,4 -9,09 573.122,8 722.733,4 26,10
SOEKARNO-HATTA (U) 48.708,9 22.793,4 21.408,9 66.501,0 104.740,6 29,72 48.990,3 34.489,4 -29,60
TANJUNG EMAS 9.030,3 8.386,6 15.111,6 11.412,2 4.463,3 -10,43 3.266,9 3.628,7 11,08
TANJUNG PERAK 531,1 563,1 874,4 948,7 1.858,2 35,34 1.419,4 831,8 -41,40
SEKUPANG 93,7 166,6 1.014,3 2.180,3 803,1 98,75 802,7 1,0 -99,88
PELABUHAN LAINNYA/OTHER PORTS 3.582,3 2.612,8 665,4 580,6 302,7 -47,51 198,7 663,7 234,08
8529 Transmission apparatus; parts suitable for use solely or principally with the apparatus of
heading no. 8525 to 8528
475.571,1 512.438,1 455.912,0 369.050,7 287.921,9 -12,47 203.652,0 190.186,5 -6,61
TANJUNG PRIOK 204.325,0 287.591,5 255.913,8 211.198,1 155.787,5 -8,16 119.710,0 71.946,4 -39,90
SOEKARNO-HATTA (U) 199.957,1 138.575,4 127.546,9 99.188,6 87.763,0 -17,97 52.002,5 81.591,9 56,90
LOBAM - - - 39.175,9 35.197,1 - 25.514,3 33.337,2 30,66
SEKUPANG 20.237,0 13.332,4 8.165,1 5.298,4 5.314,9 -30,21 3.382,6 2.329,8 -31,12
HALIM PERDANA KUSUMA (U) 1.899,5 331,3 1.394,1 2.312,8 1.915,2 21,65 1.273,8 311,2 -75,57
PELABUHAN LAINNYA/OTHER PORTS 49.152,5 72.607,5 62.892,1 11.876,9 1.944,1 -56,27 1.768,8 670,0 -62,12
8532 Electrical capacitors; fixed, variable or adjustable (pre-set) 479.888,0 479.860,3 509.173,0 502.281,3 496.575,1 1,15 319.738,1 445.879,0 39,45
SOEKARNO-HATTA (U) 247.875,2 207.200,4 235.690,9 268.013,5 239.974,6 1,94 151.646,5 205.421,2 35,46
BATU AMPAR 172.406,0 202.101,9 202.826,4 167.398,5 187.988,4 -0,15 123.679,0 186.971,5 51,17
TANJUNG PRIOK 48.202,6 48.632,2 57.105,6 57.902,3 58.861,0 5,91 37.734,7 45.663,5 21,01
SEKUPANG 9.715,9 19.165,4 11.290,2 7.900,1 6.564,6 -15,38 4.769,1 5.430,5 13,87
HANG NADIM (U) 1.544,3 2.353,2 2.164,3 1.049,9 3.163,0 6,47 1.866,9 2.349,2 25,83
PELABUHAN LAINNYA/OTHER PORTS 144,0 407,3 95,7 17,2 23,5 -49,31 41,9 43,0 2,75
44

Lanjutan/Continued
Nilai/Value : Ribu/Thousand US$No. 08.05.148
2015 2016
2016 2017
20142012 2013
TABEL 15 : NILAI EKSPOR 100 JENIS BARANG MENURUT PELABUHAN MUAT UTAMA
EXPORT VALUE OF 100 COMMODITIES BY MAIN PORT OF EMBARKATION
KODE
CODE
HS
JENIS BARANG
DESCRIPTION OF GOODS
Trend (%)
12-16
Jan-Ags/Jan-Aug Perub. (%)
Change (%)
17-16
8536 Electrical apparatus for switching, protecting electrical circuits, for making connections to
or in electrical circuits, for a voltage not exceeding 1000 volts; connectors for optical
fibres, optical
552.880,1 591.667,7 569.608,5 506.330,5 519.934,9 -2,75 347.439,9 416.791,8 19,96
TANJUNG PRIOK 137.155,2 151.579,7 161.831,1 151.452,8 184.100,7 6,06 119.748,6 156.426,8 30,63
SEKUPANG 181.480,6 270.971,3 192.943,7 128.510,7 149.122,6 -10,76 102.047,2 81.598,7 -20,04
SOEKARNO-HATTA (U) 99.548,9 75.833,2 79.467,4 88.371,7 71.022,5 -5,09 43.507,6 65.897,2 51,46
LOBAM - - - 50.034,3 48.522,0 - 31.615,4 54.403,0 72,08
BATU AMPAR 77.384,6 24.217,9 55.391,9 71.398,2 48.488,7 1,47 39.147,7 40.762,7 4,13
PELABUHAN LAINNYA/OTHER PORTS 57.310,9 69.065,5 79.974,5 16.562,9 18.678,5 -30,72 11.373,3 17.703,5 55,66
8542 Electronic integrated circuits 531.491,3 506.609,4 487.358,3 417.177,1 368.136,0 -8,87 255.212,4 295.165,3 15,65
BATU AMPAR 117.281,4 160.573,8 165.161,3 151.825,5 137.669,2 2,68 93.194,4 121.150,1 30,00
SEKUPANG 79.560,2 93.186,9 98.242,4 105.509,8 102.389,3 6,49 67.667,4 78.377,4 15,83
LOBAM - - - 58.817,2 43.821,2 - 33.850,1 36.185,6 6,90
SOEKARNO-HATTA (U) 85.463,2 61.570,0 73.601,6 64.202,7 41.126,3 -13,25 30.804,9 26.745,2 -13,18
HANG NADIM (U) 155.494,6 74.601,5 54.554,3 25.161,2 36.756,8 -32,78 25.044,5 28.458,0 13,63
PELABUHAN LAINNYA/OTHER PORTS 93.691,9 116.677,2 95.798,7 11.660,7 6.373,2 -53,60 4.651,2 4.249,1 -8,65
8544 Insulated wire, cable and other electric conductors, connector fitted or not; optical fibre
cables of individually sheathed fibres, whether or not assembled with electric conductors
or fitted with
1.073.175,2 1.158.497,1 1.156.249,3 1.068.976,5 1.128.778,7 0,21 717.816,8 1.046.380,1 45,77
TANJUNG PRIOK 492.902,9 518.486,8 547.905,0 469.734,3 460.645,4 -2,31 312.815,6 366.812,0 17,26
TANJUNG PERAK 256.610,1 297.931,0 254.988,8 274.912,2 292.567,8 1,84 194.587,6 288.650,6 48,34
TANJUNG EMAS 96.665,6 91.865,1 114.908,1 139.614,8 199.916,9 20,59 99.152,9 237.314,1 139,34
BATU AMPAR 130.217,2 148.441,9 104.615,7 118.230,8 120.645,3 -3,73 78.873,4 102.745,0 30,27
SOEKARNO-HATTA (U) 57.423,8 55.647,1 55.736,0 34.471,4 30.774,7 -15,86 16.639,1 23.545,0 41,50
PELABUHAN LAINNYA/OTHER PORTS 39.355,7 46.125,3 78.095,6 32.012,9 24.228,6 -12,50 15.748,3 27.313,4 73,44
8703 Motor cars and other motor vehicles; principally designed for the transport of persons
(other than those of heading no. 8702), including station wagons and racing cars
2.264.346,5 2.084.865,1 2.641.589,8 2.430.597,5 2.565.830,6 4,12 1.594.147,4 2.603.607,2 63,32
TANJUNG PRIOK 2.259.928,9 2.078.215,1 2.629.741,0 2.415.455,0 2.551.822,6 4,01 1.584.664,2 2.593.498,0 63,66
TANJUNG PERAK 3.171,1 3.514,8 6.480,4 9.923,6 7.740,2 32,61 5.919,2 6.040,5 2,05
BATU AMPAR 42,7 1.105,2 86,5 206,7 3.597,0 105,21 1.950,6 1.313,7 -32,65
ATAPUPU 100,5 467,3 3.042,0 2.874,6 1.766,8 112,77 1.271,3 1.273,2 0,15
SOEKARNO-HATTA (U) 874,5 1.270,9 1.445,5 1.911,5 756,5 1,19 239,5 712,5 197,47
PELABUHAN LAINNYA/OTHER PORTS 228,7 291,8 794,3 226,1 147,5 -10,70 102,6 769,2 649,93
8708 Motor vehicles; parts and accessories, of heading no. 8701 to 8705 1.476.959,0 1.448.899,2 1.619.938,9 1.834.442,1 1.981.045,5 8,58 1.290.142,6 1.698.322,8 31,64
TANJUNG PRIOK 1.215.272,8 1.197.394,3 1.352.443,0 1.576.396,3 1.751.355,3 10,58 1.142.415,2 1.488.573,0 30,30
TANJUNG PERAK 231.413,2 220.680,8 223.911,6 218.219,9 186.349,8 -4,35 127.740,5 179.296,4 40,36
SOEKARNO-HATTA (U) 25.601,0 20.758,2 33.785,2 31.888,8 26.329,3 4,97 16.169,7 18.496,5 14,39
NGURAH RAI (U) 5,5 0,0 0,8 5,9 5.816,4 631,87 52,5 1.414,1 2594,53
JUANDA (U)-SURABAYA 393,5 1.245,2 1.396,5 2.937,1 5.063,3 81,62 1.710,6 3.072,1 79,59
PELABUHAN LAINNYA/OTHER PORTS 4.273,0 8.820,8 8.401,9 4.994,3 6.131,4 1,55 2.054,2 7.470,7 263,69
45

Lanjutan/Continued
Nilai/Value : Ribu/Thousand US$No. 08.05.148
2015 2016
2016 2017
20142012 2013
TABEL 15 : NILAI EKSPOR 100 JENIS BARANG MENURUT PELABUHAN MUAT UTAMA
EXPORT VALUE OF 100 COMMODITIES BY MAIN PORT OF EMBARKATION
KODE
CODE
HS
JENIS BARANG
DESCRIPTION OF GOODS
Trend (%)
12-16
Jan-Ags/Jan-Aug Perub. (%)
Change (%)
17-16
8711 Motorcycles (including mopeds) and cycles; fitted with an auxiliary motor, with or without
side-cars; side-cars
200.738,5 126.443,0 143.306,6 401.790,4 468.063,7 32,97 304.662,2 616.445,4 102,34
TANJUNG PRIOK 195.159,5 121.060,1 136.734,1 390.725,3 451.999,8 33,00 296.302,2 579.834,9 95,69
TANJUNG PERAK 4.594,9 3.847,3 4.293,0 8.141,4 13.800,5 34,30 6.800,4 34.158,3 402,30
SOEKARNO-HATTA (U) 696,0 1.144,5 2.124,4 1.556,6 1.793,6 24,62 1.152,9 1.688,7 46,47
BATU AMPAR 159,8 185,9 26,7 303,1 204,7 10,33 155,7 70,0 -55,00
TANJUNG EMAS 55,8 65,0 32,7 89,6 141,5 24,38 140,3 599,7 327,48
PELABUHAN LAINNYA/OTHER PORTS 72,4 140,3 95,8 974,3 123,6 35,09 110,7 93,7 -15,37
8714 Vehicles; parts and accessories of heading no. 8711 to 8713 463.265,8 437.976,6 448.739,5 426.586,9 500.851,9 1,31 314.691,1 492.747,8 56,58
TANJUNG PRIOK 227.845,1 262.367,2 238.844,6 245.404,6 330.688,4 7,02 211.633,4 359.968,2 70,09
SEKUPANG 197.755,1 166.180,5 153.409,4 133.647,3 108.380,5 -13,24 69.716,5 105.903,2 51,91
SOEKARNO-HATTA (U) 16.748,1 7.899,1 7.769,8 12.557,3 43.087,2 26,53 18.762,2 22.248,2 18,58
BATU AMPAR 17.711,5 85,2 47.530,3 33.026,2 17.308,9 80,65 13.653,8 3.004,5 -77,99
TANJUNG PERAK 2.566,5 1.019,7 649,1 983,9 644,1 -24,43 424,9 753,7 77,37
PELABUHAN LAINNYA/OTHER PORTS 639,4 425,0 536,4 967,6 742,7 11,88 500,2 870,1 73,94
9401 Seats (not those of heading no. 9402), whether or not convertible into beds and parts thereof 528.408,9 511.437,4 510.272,7 518.848,6 506.289,3 -0,71 342.891,1 402.231,4 17,31
TANJUNG EMAS 262.333,7 243.937,9 223.315,0 200.551,7 193.961,0 -7,69 133.059,8 149.305,1 12,21
TANJUNG PRIOK 180.924,5 170.236,5 177.429,3 191.375,1 190.925,3 2,27 127.161,9 165.249,2 29,95
TANJUNG PERAK 74.004,5 84.715,9 96.419,2 112.093,0 106.930,4 10,70 73.516,8 75.405,0 2,57
BELAWAN 7.604,8 8.701,7 7.312,1 9.467,1 9.032,4 4,38 5.649,9 7.380,0 30,62
SOEKARNO-HATTA (U) 798,5 2.151,6 3.821,5 2.954,3 3.553,0 39,14 2.504,5 1.636,3 -34,67
PELABUHAN LAINNYA/OTHER PORTS 2.743,0 1.693,8 1.975,6 2.407,4 1.887,2 -3,89 998,3 3.255,7 226,14
9403 Furniture and parts thereof, n.e.c. in chapter 94 1.221.082,0 1.216.624,1 1.255.611,5 1.172.264,5 1.086.555,2 -2,67 722.292,6 935.126,6 29,47
TANJUNG EMAS 351.805,5 408.836,0 465.559,3 478.365,6 452.323,4 6,82 303.194,7 375.089,9 23,71
TANJUNG PERAK 477.207,5 450.721,8 458.547,4 428.178,0 391.438,3 -4,38 259.059,3 355.035,2 37,05
TANJUNG PRIOK 308.144,4 274.741,2 252.598,8 203.934,0 176.636,1 -13,16 115.999,7 162.407,5 40,01
BELAWAN 48.389,6 44.175,7 36.532,1 31.731,2 33.957,0 -9,87 23.014,2 19.988,0 -13,15
BATU AMPAR 19.049,9 16.928,6 11.778,0 11.709,0 13.063,0 -10,62 8.387,3 9.125,0 8,80
PELABUHAN LAINNYA/OTHER PORTS 16.485,0 21.220,8 30.595,8 18.346,8 19.137,3 1,54 12.637,3 13.480,9 6,68
9503 Tricycles, scooters, pedal cars and similar wheeled toys; dolls' carriages; dolls; other toys;
reduced-size (scale) models and similar recreational models, working or not; puzzles of all
kinds
347.067,8 428.966,8 391.800,6 348.306,1 282.330,9 -6,02 189.019,2 285.459,2 51,02
TANJUNG PRIOK 300.823,5 355.065,5 327.004,3 297.311,1 224.966,0 -7,31 149.451,8 233.502,1 56,24
BATU AMPAR 554,0 16.592,1 20.283,5 30.084,0 37.005,1 145,92 26.411,2 31.130,5 17,87
TANJUNG PERAK 10.692,7 10.810,6 9.106,8 8.520,2 8.870,7 -5,93 5.501,1 8.497,4 54,47
SEKUPANG 23.141,0 22.346,5 10.140,2 5.904,7 5.402,8 -34,56 4.332,4 2.635,0 -39,18
SOEKARNO-HATTA (U) 11.207,6 23.099,4 24.067,1 5.618,9 5.244,2 -25,42 2.754,1 9.231,5 235,19
PELABUHAN LAINNYA/OTHER PORTS 649,1 1.052,7 1.198,7 867,2 842,2 3,33 568,6 462,8 -18,61
Sumber/Source : Badan Pusat Statistik (diolah, Pusat Data dan Sistem Informasi, Kementerian Perdagangan)/Central Board of Statistics (processed by Trade Data Centre, Ministry of Trade)
46

Lanjutan/Continued
Volume/Volume : Ton
0303 Fish; frozen, excluding fish fillets and other fish meat of heading 0304 431.044,6 425.807,0 415.342,9 210.434,8 213.790,9 -19,00 134.687,4 217.183,4 61,25
TANJUNG PRIOK 104.062,9 99.937,6 95.729,2 97.993,1 98.790,5 -1,23 60.044,6 126.481,6 110,65
TANJUNG PERAK 70.149,1 64.257,1 77.501,7 93.304,5 90.832,5 9,31 59.623,7 69.540,4 16,63
BELAWAN 9.928,9 10.199,5 9.634,8 10.078,8 14.434,0 7,64 9.849,4 10.840,9 10,07
TANJUNG EMAS 6.673,0 3.471,5 2.716,8 3.820,6 6.539,9 0,56 3.557,8 6.841,1 92,29
BITUNG 6.785,3 2.934,7 1.972,7 1.375,7 1.293,8 -33,45 618,0 331,2 -46,42
PELABUHAN LAINNYA/OTHER PORTS 233.445,4 245.006,6 227.787,6 3.862,2 1.900,1 -74,77 993,9 3.148,3 216,76
0304 Fish fillets and other fish meat (whether or not minced); fresh, chilled or frozen 90.677,1 81.219,5 88.198,5 95.429,6 95.522,5 2,69 62.519,1 67.796,4 8,44
TANJUNG PERAK 21.067,4 21.492,4 22.224,5 40.426,5 40.580,2 21,44 26.727,5 27.374,3 2,42
TANJUNG PRIOK 22.806,9 21.720,6 24.229,2 25.632,3 25.594,2 4,04 16.970,8 21.966,4 29,44
BELAWAN 11.929,3 12.335,7 13.857,0 11.339,8 10.443,7 -3,44 6.798,8 7.790,6 14,59
TANJUNG EMAS 15.150,7 14.285,1 8.130,3 12.414,6 10.232,1 -8,84 6.629,2 4.743,1 -28,45
BITUNG 2.223,4 2.027,1 2.812,6 1.046,6 2.547,1 -3,82 1.526,2 1.567,3 2,69
PELABUHAN LAINNYA/OTHER PORTS 17.499,3 9.358,5 16.944,9 4.569,7 6.125,2 -24,55 3.866,6 4.354,8 12,62
0306 Crustaceans; in shell or not, live, fresh, chilled, frozen, dried, salted or in brine; smoked,
cooked or not before or during smoking; in shell, steamed or boiled, whether or not
chilled,
137.777,8 145.661,9 160.938,6 152.677,2 164.308,0 4,07 112.343,3 137.305,2 22,22
TANJUNG PERAK 39.996,9 44.271,6 51.312,5 60.772,6 63.234,1 13,12 44.250,1 52.094,5 17,73
TANJUNG PRIOK 32.968,6 31.528,5 43.477,5 38.795,7 46.348,5 9,29 30.017,4 45.694,0 52,22
PANJANG 19.580,0 16.494,6 17.906,0 16.994,0 12.371,2 -8,50 9.609,5 5.794,9 -39,70
BELAWAN 9.111,7 9.786,3 12.822,7 10.284,7 11.665,2 5,59 7.349,4 9.266,2 26,08
LINGKAS TARAKAN 5.171,7 5.794,8 6.302,0 8.098,5 7.314,2 10,83 4.932,6 4.046,4 -17,96
PELABUHAN LAINNYA/OTHER PORTS 30.948,8 37.786,0 29.118,0 17.731,7 23.374,8 -12,35 16.184,3 20.409,2 26,10
0307 Molluscs; whether in shell or not, live, fresh, chilled, frozen, dried, salted or in brine;
smoked molluscs, whether in shell or not, cooked or not before or during the smoking
process; flours, meals
85.044,8 86.542,4 81.887,1 104.165,1 125.173,6 10,06 70.643,2 90.907,4 28,69
TANJUNG PRIOK 39.408,3 41.325,7 40.814,9 61.655,7 73.571,8 17,92 39.421,9 51.433,5 30,47
TANJUNG PERAK 14.441,3 12.214,5 14.112,9 17.540,5 27.133,9 17,62 14.521,1 16.792,3 15,64
BELAWAN 17.063,8 15.253,9 16.492,3 17.383,5 16.447,2 0,57 11.050,3 16.404,6 48,45
TANJUNG EMAS 947,4 614,6 569,0 1.564,9 3.587,6 43,30 2.431,4 2.127,8 -12,49
UJUNGPANDANG 1.199,2 497,3 696,7 1.346,5 1.294,4 12,17 915,9 1.327,9 44,99
PELABUHAN LAINNYA/OTHER PORTS 11.984,8 16.636,3 9.201,3 4.674,0 3.138,7 -32,63 2.302,6 2.821,3 22,53
0801 Nuts, edible; coconuts, Brazil nuts and cashew nuts, fresh or dried, whether or not shelled
or peeled
284.034,6 358.671,0 562.270,9 697.378,1 678.960,3 27,22 367.301,6 840.529,2 128,84
TANJUNG PERAK 67.939,0 52.139,3 70.925,4 110.979,3 75.332,0 10,10 26.637,8 136.613,2 412,85
UJUNGPANDANG 4.643,2 5.362,4 4.652,3 8.521,8 8.664,3 18,66 6.004,0 3.050,5 -49,19
BELAWAN 25.421,5 32.932,0 33.852,8 30.546,3 36.397,2 6,64 23.014,0 30.086,6 30,73
MUSI RIVER/BOOM BARU 10.499,8 7.209,1 113.869,9 168.158,7 154.020,0 134,46 78.288,9 156.973,3 100,51
TANJUNG PRIOK 14.413,5 18.627,4 41.917,8 47.033,2 41.229,0 35,37 19.236,8 105.030,5 445,99
PELABUHAN LAINNYA/OTHER PORTS 161.117,5 242.400,8 297.052,6 332.138,8 363.317,8 21,42 214.120,1 408.775,0 90,91
27
No. 08.05.148
2015 2016
2016 2017
20142012 2013
TABEL 15.1 : VOLUME EKSPOR 100 JENIS BARANG MENURUT PELABUHAN MUAT UTAMA
EXPORT VOLUME OF 100 COMMODITIES BY MAIN PORT OF EMBARKATION
JENIS BARANG
DESCRIPTION OF GOODS
Trend (%)
12-16
Jan-Ags/Jan-Aug Perub. (%)
Change (%)
17-16

Lanjutan/Continued
Volume/Volume : TonNo. 08.05.148
2015 2016
2016 2017
20142012 2013
TABEL 15.1 : VOLUME EKSPOR 100 JENIS BARANG MENURUT PELABUHAN MUAT UTAMA
EXPORT VOLUME OF 100 COMMODITIES BY MAIN PORT OF EMBARKATION
JENIS BARANG
DESCRIPTION OF GOODS
Trend (%)
12-16
Jan-Ags/Jan-Aug Perub. (%)
Change (%)
17-16
0802 Nuts (excluding coconuts, Brazils and cashew nuts); fresh or dried, whether or not shelled
or peeled
217.006,1 226.291,5 253.765,6 282.918,3 222.086,1 2,73 162.283,8 200.432,3 23,51
BELAWAN 114.808,0 132.932,4 148.139,7 154.425,0 127.523,0 3,66 92.989,6 106.076,3 14,07
JAMBI 6.545,8 6.328,0 19.570,6 47.266,1 39.424,3 75,10 26.381,5 47.069,8 78,42
TANJUNG PRIOK 32.234,1 32.011,9 37.555,4 34.479,2 26.891,7 -2,84 20.790,7 25.229,1 21,35
KUALA TUNGKAL 33.141,6 24.512,7 19.240,8 14.693,9 7.489,9 -29,43 5.613,0 8.184,8 45,82
MUSI RIVER/BOOM BARU 16.038,9 16.109,9 12.870,5 12.609,1 6.710,5 -18,03 5.538,4 3.599,8 -35,00
PELABUHAN LAINNYA/OTHER PORTS 14.237,9 14.396,7 16.388,6 19.445,0 14.046,6 2,77 10.970,6 10.272,4 -6,36
0901 Coffee, whether or not roasted or decaffeinated; husks and skins; coffee substitutes
containing coffee in any proportion
448.590,6 534.025,1 384.827,7 502.020,7 414.651,2 -2,17 223.078,1 415.900,5 86,44
PANJANG 292.467,3 372.596,7 223.835,6 326.332,3 246.619,6 -4,63 119.393,1 275.951,0 131,13
BELAWAN 70.066,6 67.051,8 71.632,0 77.461,0 73.513,2 2,43 49.072,7 61.169,5 24,65
TANJUNG PERAK 69.137,1 79.090,8 75.147,1 82.435,6 82.548,1 4,04 48.916,4 65.311,6 33,52
UJUNGPANDANG 2.884,8 1.779,7 2.676,0 3.203,7 2.397,5 2,20 1.123,0 441,6 -60,68
TANJUNG EMAS 6.256,3 7.830,7 6.905,1 7.090,9 3.695,9 -10,88 2.285,4 3.032,4 32,69
PELABUHAN LAINNYA/OTHER PORTS 7.778,6 5.675,4 4.631,9 5.497,3 5.876,8 -5,75 2.287,6 9.994,5 336,90
0904 Pepper of the genus piper; dried or crushed or ground fruits of the genus capsicum or of
the genus pimenta
63.834,1 48.959,1 35.655,9 60.551,5 55.146,6 -0,80 24.905,9 37.413,7 50,22
PANJANG 46.384,4 28.341,5 16.056,6 32.524,8 28.419,7 -8,08 11.396,4 13.515,7 18,60
TANJUNG PRIOK 11.019,1 12.228,6 9.813,9 14.106,7 12.750,1 4,44 6.416,5 12.017,7 87,29
TANJUNG PERAK 3.814,5 4.488,0 5.509,2 7.658,8 9.074,4 25,45 4.539,2 7.439,4 63,89
PANGKAL BALAM 2.039,5 3.706,0 3.792,4 4.117,7 3.308,0 11,32 1.965,0 2.454,5 24,91
MAKASSAR - - - 43,1 187,4 - 60,0 62,4 3,93
PELABUHAN LAINNYA/OTHER PORTS 576,5 195,0 483,8 2.100,4 1.407,1 51,61 528,7 1.924,0 263,90
1511 Palm oil and its fractions; whether or not refined, but not chemically modified 18.845.020,2 20.577.975,9 22.892.386,9 26.467.563,6 22.759.304,5 6,49 13.821.772,1 22.613.010,2 63,60
DUMAI 7.947.869,1 8.056.066,4 8.612.060,6 10.680.699,8 9.813.275,2 7,29 5.736.276,3 10.004.859,9 74,41
BELAWAN 2.982.731,8 2.993.769,1 3.104.014,3 3.269.204,1 2.888.120,4 0,24 1.842.505,4 2.582.327,6 40,15
PADANG/TL.BAYUR 1.426.460,4 1.561.050,6 1.773.495,0 1.994.543,5 1.782.709,1 7,15 1.134.205,8 1.686.976,8 48,74
TARAHAN - - - 1.674.382,0 1.097.721,0 - 659.440,0 1.061.933,0 61,04
KABIL/PANAU 824.920,5 1.001.917,7 972.435,9 1.305.584,1 1.025.032,3 7,24 574.240,4 1.130.323,6 96,84
PELABUHAN LAINNYA/OTHER PORTS 5.663.038,4 6.965.172,1 8.430.381,2 7.543.150,2 6.152.446,5 2,49 3.875.104,3 6.146.589,3 58,62
1513 Coconut (copra), palm kernel or babassu oil and their fractions; whether or not refined but
not chemically modified
2.263.320,3 2.275.102,5 2.251.251,3 2.579.941,2 2.178.806,9 0,50 1.405.369,5 1.836.316,9 30,66
DUMAI 561.998,9 609.510,4 674.328,2 874.240,2 699.548,6 8,31 455.476,4 631.533,4 38,65
BITUNG 422.617,6 360.269,9 388.613,5 392.927,2 321.563,6 -4,49 226.857,6 228.318,8 0,64
BELAWAN 220.787,0 297.045,6 182.416,0 203.060,2 178.389,9 -7,75 120.640,8 143.868,0 19,25
KUALA TANJUNG 228.304,3 188.989,1 180.269,3 216.459,2 180.515,3 -3,28 116.099,7 125.084,5 7,74
TARAHAN - - - 187.460,0 182.832,0 - 121.272,0 159.036,0 31,14
PELABUHAN LAINNYA/OTHER PORTS 829.612,5 819.287,5 825.624,3 705.794,3 615.957,4 -7,18 365.023,1 548.476,2 50,26
28

Lanjutan/Continued
Volume/Volume : TonNo. 08.05.148
2015 2016
2016 2017
20142012 2013
TABEL 15.1 : VOLUME EKSPOR 100 JENIS BARANG MENURUT PELABUHAN MUAT UTAMA
EXPORT VOLUME OF 100 COMMODITIES BY MAIN PORT OF EMBARKATION
JENIS BARANG
DESCRIPTION OF GOODS
Trend (%)
12-16
Jan-Ags/Jan-Aug Perub. (%)
Change (%)
17-16
1516 Animal or vegetable fats and oils and their fractions; partly or wholly hydrogenated, inter-
esterified, re-esterified or elaidinised, whether or not refined, but not further prepared
248.683,3 1.072.959,1 135.471,9 167.705,3 305.780,0 -13,43 177.073,9 238.640,1 34,77
TANJUNG PRIOK 43.902,9 43.643,3 76.906,4 104.612,8 129.651,9 35,53 70.267,3 91.345,4 30,00
BELAWAN 82.960,3 143.558,0 21.431,4 37.485,9 47.395,1 -21,83 24.061,2 53.705,1 123,20
DUMAI 15.254,8 483.139,3 - - 87.062,2 - 58.802,1 50.914,7 -13,41
GRESIK 7.837,3 3.100,3 11.998,7 10.899,1 19.198,7 35,65 7.699,3 17.474,4 126,96
KUALA TANJUNG 71.217,4 58.396,6 14.902,5 1.696,6 9.629,0 -52,95 6.629,3 3.199,7 -51,73
PELABUHAN LAINNYA/OTHER PORTS 27.510,6 341.121,6 10.232,9 13.011,0 12.842,9 -38,06 9.614,8 22.000,8 128,82
1517 Margarine; edible mixtures or preparations of animal or vegetable fats or oils or of
fractions of different fats or oils of this chapter, other than edible fats or oils of heading no.
1516
761.214,4 663.240,6 807.252,7 799.649,9 852.675,0 4,23 526.295,0 837.980,9 59,22
TANJUNG PERAK 171.517,8 229.840,0 337.203,0 330.784,3 397.313,3 22,68 232.353,7 401.819,4 72,93
BELAWAN 144.759,3 115.038,3 168.663,2 245.110,2 256.874,2 20,97 171.874,0 243.610,4 41,74
TANJUNG PRIOK 313.555,0 159.367,3 186.313,3 159.718,4 167.240,8 -11,79 100.134,0 153.173,6 52,97
TANJUNG EMAS 9.928,5 37.428,6 34.963,2 39.163,6 30.481,7 25,72 21.172,3 19.668,9 -7,10
PONTIANAK 2.788,2 4.587,1 3.036,8 1.542,5 682,0 -32,34 682,0 676,2 -0,85
PELABUHAN LAINNYA/OTHER PORTS 118.665,6 116.979,2 77.073,2 23.331,0 82,9 -80,10 79,0 19.032,2 23997,88
1604 Prepared or preserved fish; caviar and caviar substitutes prepared from fish eggs 95.094,2 95.231,9 106.329,6 90.134,3 85.837,8 -2,56 57.424,8 73.607,3 28,18
TANJUNG PERAK 54.421,4 53.066,5 62.113,4 53.201,6 51.332,9 -1,14 35.158,4 38.878,2 10,58
TANJUNG PRIOK 13.185,5 14.101,5 8.095,0 12.020,2 13.436,9 -1,21 8.613,4 20.222,2 134,78
BITUNG 18.490,8 19.399,6 21.462,1 14.921,0 13.267,9 -8,85 8.837,7 5.761,8 -34,80
TANJUNG EMAS 4.220,0 3.693,6 10.229,6 4.500,1 4.095,2 1,38 2.426,7 3.282,4 35,26
BELAWAN 4.611,1 4.878,1 4.189,6 5.130,0 3.132,3 -6,97 2.087,6 4.978,7 138,48
PELABUHAN LAINNYA/OTHER PORTS 165,5 92,6 240,0 361,4 572,6 46,88 301,0 484,0 60,77
1605 Crustaceans, molluscs and other aquatic invertebrates, prepared or preserved 51.296,7 55.453,4 60.832,5 62.920,9 67.091,6 6,86 45.328,6 40.095,0 -11,55
TANJUNG PERAK 26.559,7 30.280,2 32.679,6 32.682,3 34.728,0 6,32 20.823,0 25.568,1 22,79
PANJANG 8.323,0 8.731,9 9.714,0 9.783,4 10.639,1 6,23 7.062,4 6.575,4 -6,90
TANJUNG PRIOK 4.356,3 7.161,8 7.967,3 7.241,9 7.297,7 10,99 6.011,2 2.943,6 -51,03
TANJUNG EMAS 659,8 2.490,0 2.740,6 3.832,1 4.310,9 51,97 2.994,6 1.754,7 -41,41
BELAWAN 3.591,1 4.007,5 6.775,4 8.334,7 7.890,9 25,95 6.646,9 2.344,3 -64,73
PELABUHAN LAINNYA/OTHER PORTS 7.806,8 2.782,1 955,7 1.046,6 2.225,0 -29,45 1.790,3 908,8 -49,24
1804 Cocoa; butter, fat and oil 94.345,5 86.806,8 99.482,7 114.547,1 109.503,9 5,92 68.872,9 110.851,1 60,95
TANJUNG PRIOK 40.610,1 28.871,5 42.182,6 59.083,5 46.115,1 10,19 28.389,8 46.574,0 64,05
TANJUNG PERAK 1.238,8 2.530,8 8.103,9 22.237,9 30.302,8 135,55 18.411,1 31.012,3 68,44
BATU AMPAR 26.958,0 32.777,2 30.288,1 30.436,6 30.665,1 1,85 20.637,1 32.321,1 56,62
UJUNGPANDANG 4.489,6 5.556,9 5.160,2 2.609,8 2.184,4 -19,72 1.402,4 542,4 -61,32
KENDARI - - - 58,9 160,0 - - - -
PELABUHAN LAINNYA/OTHER PORTS 21.049,0 17.070,4 13.747,9 120,5 76,6 -80,18 32,5 401,3 1135,50
29

Lanjutan/Continued
Volume/Volume : TonNo. 08.05.148
2015 2016
2016 2017
20142012 2013
TABEL 15.1 : VOLUME EKSPOR 100 JENIS BARANG MENURUT PELABUHAN MUAT UTAMA
EXPORT VOLUME OF 100 COMMODITIES BY MAIN PORT OF EMBARKATION
JENIS BARANG
DESCRIPTION OF GOODS
Trend (%)
12-16
Jan-Ags/Jan-Aug Perub. (%)
Change (%)
17-16
1905 Bread, pastry, cakes, biscuits, other bakers' wares, whether or not 94.502,9 113.430,4 129.605,0 142.394,7 186.665,1 17,22 112.701,3 184.598,4 63,79
TANJUNG PRIOK 77.484,8 91.961,5 111.192,2 125.070,2 156.985,6 18,76 93.612,2 158.281,3 69,08
TANJUNG PERAK 13.823,5 18.212,5 15.100,4 12.584,0 19.835,1 3,59 11.163,4 18.501,9 65,74
TANJUNG EMAS 558,1 722,8 1.026,8 2.693,3 7.015,2 89,23 6.185,8 5.396,7 -12,76
BELAWAN 1.316,7 1.299,8 974,8 900,3 1.422,1 -2,11 951,8 1.225,2 28,72
ENTIKONG 32,8 17,4 201,0 256,8 324,2 106,92 178,7 174,2 -2,52
PELABUHAN LAINNYA/OTHER PORTS 1.286,9 1.216,3 1.109,8 890,0 1.082,9 -6,36 609,4 1.019,2 67,23
2101 Extracts, essences, concentrates of coffee, tea or mate; preparations with a basis of these
products or with a basis of coffee, tea or mate; roasted chicory and other roasted coffee
87.190,2 83.945,8 97.462,8 106.905,9 144.301,0 13,31 95.942,6 136.509,2 42,28
TANJUNG PRIOK 70.580,2 68.812,0 84.228,7 93.397,5 130.290,8 16,55 86.690,1 123.873,5 42,89
BELAWAN 8.457,7 8.633,2 6.199,0 5.905,0 6.144,0 -9,69 4.548,3 5.110,6 12,36
TANJUNG PERAK 6.499,2 5.096,9 5.027,6 6.337,9 6.457,7 2,07 3.752,2 6.434,1 71,48
PANJANG 1.527,7 1.143,4 819,2 902,5 918,7 -11,78 567,5 844,9 48,89
TANJUNG EMAS 59,1 190,3 1.026,3 229,4 377,3 47,61 300,4 96,8 -67,76
PELABUHAN LAINNYA/OTHER PORTS 66,3 69,9 162,0 133,5 112,6 18,58 84,2 149,3 77,23
2106 Food preparations not elsewhere specified or included 84.708,4 95.109,7 126.494,5 137.876,5 148.038,8 16,04 97.588,5 134.165,0 37,48
TANJUNG PRIOK 19.057,1 18.251,4 22.466,0 33.007,2 32.547,0 18,09 22.212,2 29.057,5 30,82
SUNGAI GUNTUNG 26.169,4 31.654,2 39.768,2 44.160,0 53.163,2 19,13 34.851,4 50.963,6 46,23
TANJUNG EMAS 29.162,2 33.651,9 38.816,6 29.543,7 27.793,8 -2,24 19.015,0 17.338,2 -8,82
SOEKARNO-HATTA (U) 119,3 49,7 58,4 390,8 1.762,2 110,56 1.047,4 701,8 -33,00
TANJUNG PERAK 1.530,7 2.501,7 9.888,1 10.826,8 17.417,8 88,30 10.227,2 23.822,3 132,93
PELABUHAN LAINNYA/OTHER PORTS 8.669,7 9.000,8 15.497,2 19.948,1 15.354,8 21,40 10.235,2 12.281,7 19,99
2306 Oil-cake and other solid residues; whether or not ground or in the form of pellets, resulting
from the extraction of vegetable fats or oils other than those of heading no. 2304 or 2305
from the extrac
3.876.134,2 3.836.864,6 3.949.152,5 4.540.007,7 4.025.572,9 2,47 2.482.997,9 3.734.738,4 50,41
DUMAI 1.045.126,2 1.110.083,3 1.103.454,9 1.342.008,9 1.235.677,2 5,39 703.516,0 1.180.604,7 67,81
PANJANG 471.462,6 549.726,3 581.047,8 928.319,5 802.471,3 17,21 506.886,5 817.734,2 61,32
BELAWAN 688.817,4 621.430,6 611.370,7 558.752,5 473.300,4 -8,21 300.271,8 417.097,1 38,91
BITUNG 300.331,1 177.859,3 194.988,9 209.131,2 194.306,0 -6,84 130.684,0 134.660,0 3,04
PADANG/TL.BAYUR 272.111,6 341.169,5 261.926,0 293.982,0 252.446,8 -2,94 150.444,0 181.702,0 20,78
PELABUHAN LAINNYA/OTHER PORTS 1.098.285,3 1.036.595,6 1.196.364,1 1.207.813,6 1.067.371,2 0,96 691.195,6 1.002.940,4 45,10
2402 Cigars, cheroots, cigarillos and cigarettes; of tobacco or of tobacco substitutes 67.535,5 73.644,8 79.007,2 81.667,8 85.013,8 5,80 55.490,4 76.912,3 38,60
BELAWAN 38.820,4 41.614,1 47.753,6 45.065,2 44.243,0 3,47 28.977,5 36.181,5 24,86
TANJUNG PERAK 10.964,9 10.579,0 10.554,0 11.074,8 11.118,1 0,74 7.355,3 12.471,5 69,56
DUMAI 4.643,8 4.308,1 4.496,1 4.744,5 4.203,7 -1,02 3.061,4 2.192,7 -28,37
TANJUNG PRIOK 3.918,7 6.183,5 6.362,8 7.510,2 8.463,1 18,94 5.425,6 8.546,9 57,53
BATU AMPAR 6.043,2 7.309,9 6.235,2 8.790,0 10.642,9 14,07 6.987,2 11.831,3 69,33
PELABUHAN LAINNYA/OTHER PORTS 3.144,4 3.650,2 3.605,7 4.483,2 6.343,0 17,46 3.683,4 5.688,3 54,43
30

Lanjutan/Continued
Volume/Volume : TonNo. 08.05.148
2015 2016
2016 2017
20142012 2013
TABEL 15.1 : VOLUME EKSPOR 100 JENIS BARANG MENURUT PELABUHAN MUAT UTAMA
EXPORT VOLUME OF 100 COMMODITIES BY MAIN PORT OF EMBARKATION
JENIS BARANG
DESCRIPTION OF GOODS
Trend (%)
12-16
Jan-Ags/Jan-Aug Perub. (%)
Change (%)
17-16
2603 Copper ores and concentrates 1.123.541,0 1.453.731,9 714.950,4 1.711.396,5 1.912.881,5 13,06 1.195.491,7 1.159.871,4 -2,98
AMAMAPARE 782.954,3 1.179.327,5 525.740,6 1.015.240,0 1.114.400,0 5,72 636.400,0 672.000,0 5,59
BENETE - - - 696.156,5 798.481,5 - 559.091,7 487.871,4 -12,74
TANJUNG PERAK 308,0 - - - - - - - -
TANJUNG PRIOK 8.545,6 70,0 19,2 - - - - - -
BIMA 331.639,3 274.334,4 189.190,6 - - - - - -
PELABUHAN LAINNYA/OTHER PORTS 94,0 - - - - - 0,0 0,0 -
2701 Coal; briquettes, ovoids and similar solid fuels manufactured from coal ############ ############ ############ ############ ############ -3,68 205.772.839,1 263.143.457,9 27,88
SAMARINDA 81.140.656,2 87.059.635,6 75.859.000,2 73.960.935,3 73.847.087,1 -3,45 47.464.476,0 62.035.648,9 30,70
TANJUNG BARA, KL - - - 46.890.017,0 50.335.131,0 - 33.991.139,0 38.015.311,0 11,84
BANJARMASIN 55.909.490,8 60.972.981,3 64.136.612,1 58.646.739,9 51.397.374,1 -2,05 35.233.541,9 41.649.261,6 18,21
TANJUNG REDEP 950.226,0 1.379.389,0 25.090.349,9 25.657.598,0 27.705.861,2 162,97 18.031.011,8 27.920.077,0 54,84
BONTANG 19.031.075,7 20.824.933,0 16.862.540,0 15.361.564,0 15.241.608,0 -7,21 10.223.998,0 10.845.670,0 6,08
PELABUHAN LAINNYA/OTHER PORTS ########### ########### ########### ########### 92.135.197,9 -19,15 60.828.672,4 82.677.489,4 35,92
2702 Lignite; whether or not agglomerated, excluding jet 36.802.743,8 42.941.031,4 51.935.570,9 38.582.958,0 58.246.961,4 8,45 31.376.303,0 57.937.802,0 84,65
BANJARMASIN 8.399.769,4 10.745.844,0 10.032.216,0 11.618.460,0 16.831.958,0 15,81 9.322.796,0 17.300.755,5 85,57
SATUI - - - 13.125.684,0 15.995.924,0 - 8.965.147,0 17.227.166,4 92,16
ADANG BAY 8.229.687,0 7.444.381,0 8.555.242,0 6.410.774,0 7.329.662,0 -3,74 4.996.518,0 6.573.696,0 31,57
SAMARINDA 4.400.314,0 3.894.192,9 6.190.423,8 2.658.263,8 5.557.494,6 0,85 3.033.794,6 3.993.212,3 31,62
KOTABARU 11.183.492,0 14.259.476,0 16.852.595,0 1.115.491,0 7.934.332,0 -27,64 3.126.557,0 4.912.888,0 57,13
PELABUHAN LAINNYA/OTHER PORTS 4.589.481,4 6.597.137,5 10.305.094,2 3.654.285,1 4.597.590,8 -5,70 1.931.490,4 7.930.083,8 310,57
2814 Ammonia; anhydrous or in aqueous solution 959.888,6 793.510,5 684.400,3 1.033.468,1 1.115.524,5 5,81 817.271,8 887.324,6 8,57
BONTANG 920.866,5 710.699,7 643.949,4 881.582,0 988.712,1 3,64 717.741,4 792.585,5 10,43
MUSI RIVER/BOOM BARU 7.706,2 5.893,0 36.799,2 82.690,7 79.223,6 107,55 67.908,2 65.118,6 -4,11
LHOK SEUMAWE 31.316,0 51.056,6 2.790,0 68.074,0 46.532,1 11,40 30.830,6 29.444,5 -4,50
TANJUNG PRIOK - - 861,7 1.121,4 1.056,6 - 791,6 176,0 -77,77
SOEKARNO-HATTA (U) - - - - 0,0 - 0,0 - -
PELABUHAN LAINNYA/OTHER PORTS 0,0 25.861,1 - - 0,0 - 0,0 0,0 -
2905 Acyclic alcohols and their halogenated, sulphonated, nitrated or nitrosated derivatives 954.341,2 990.009,0 925.441,8 908.081,4 879.993,6 -2,46 596.328,2 790.536,4 32,57
GRESIK 143.049,1 144.567,8 136.866,9 132.164,2 116.215,9 -4,93 71.977,4 89.846,5 24,83
BATU AMPAR 48.804,8 46.051,9 52.927,3 39.683,5 62.666,0 3,57 39.527,8 54.398,2 37,62
BELAWAN 101.452,1 97.253,7 105.757,7 97.933,8 113.248,0 2,30 68.191,6 107.481,6 57,62
TANJUNG PERAK 118.869,0 105.765,3 121.468,7 103.086,7 106.322,7 -2,46 71.362,8 92.098,2 29,06
BONTANG 438.741,4 465.305,2 401.991,5 422.636,2 384.813,2 -3,52 290.220,7 322.704,8 11,19
PELABUHAN LAINNYA/OTHER PORTS 103.424,8 131.065,0 106.429,7 112.577,0 96.727,9 -2,82 55.047,9 124.007,1 125,27
31

Lanjutan/Continued
Volume/Volume : TonNo. 08.05.148
2015 2016
2016 2017
20142012 2013
TABEL 15.1 : VOLUME EKSPOR 100 JENIS BARANG MENURUT PELABUHAN MUAT UTAMA
EXPORT VOLUME OF 100 COMMODITIES BY MAIN PORT OF EMBARKATION
JENIS BARANG
DESCRIPTION OF GOODS
Trend (%)
12-16
Jan-Ags/Jan-Aug Perub. (%)
Change (%)
17-16
2915 Acids; saturated acyclic monocarboxylic acids and their anhydrides, halides, peroxides
and peroxyacids; their halogenated, sulphonated, nitrated or nitrosated derivatives
171.496,1 172.736,2 297.619,2 359.800,3 386.519,9 26,61 243.629,1 346.003,2 42,02
BELAWAN 104.503,7 123.283,2 149.675,4 176.444,4 208.673,9 19,02 136.890,4 199.417,0 45,68
DUMAI 2.014,1 1.598,0 54.840,4 123.900,6 109.203,1 243,39 61.003,4 100.983,1 65,54
GRESIK 17.509,6 10.549,9 23.814,3 24.247,8 26.442,4 18,02 17.575,8 26.068,4 48,32
TANJUNG PRIOK 16.754,8 17.897,9 18.673,6 17.570,4 16.994,0 0,10 13.288,6 8.407,6 -36,73
TANJUNG PERAK 4.914,9 7.506,3 36.130,6 10.069,3 15.557,5 29,67 8.965,5 5.750,2 -35,86
PELABUHAN LAINNYA/OTHER PORTS 25.799,0 11.901,0 14.485,0 7.567,8 9.649,1 -21,49 5.905,3 5.376,8 -8,95
2922 Oxygen-function amino-compounds 363.610,9 375.575,0 403.198,3 401.700,3 408.152,9 3,03 276.151,0 320.654,9 16,12
TANJUNG PERAK 363.013,4 375.097,8 402.329,9 401.342,8 408.049,5 3,06 276.131,2 320.542,6 16,08
SOEKARNO-HATTA (U) 5,5 1,3 0,7 74,8 1,0 7,52 1,0 0,5 -51,05
TANJUNG PRIOK 533,0 431,7 727,0 115,5 38,7 -48,13 11,7 78,8 574,16
JUANDA (U)-SURABAYA 1,8 3,0 60,9 72,1 42,6 160,08 1,6 0,2 -89,74
NGURAH RAI (U) 7,8 - 39,6 77,0 15,2 - - - -
PELABUHAN LAINNYA/OTHER PORTS 49,4 41,2 40,1 18,0 5,8 -40,05 5,5 32,8 500,70
3004 Medicaments; (not goods of heading no. 3002, 3005 or 3006) consisting of mixed or
unmixed products for therapeutic or prophylactic use, put up in measured doses (incl.
those in the form
16.436,9 38.434,8 19.897,7 18.527,0 16.536,9 -6,92 11.076,0 22.005,4 98,68
TANJUNG PRIOK 12.509,5 33.793,0 15.704,8 15.116,7 13.224,2 -6,70 8.977,0 18.743,8 108,80
JUANDA (U)-SURABAYA 70,4 69,8 82,0 137,5 241,1 36,88 130,9 335,4 156,24
TANJUNG PERAK 2.403,1 1.768,4 2.248,0 1.554,2 1.607,6 -8,91 1.075,9 1.306,0 21,39
SOEKARNO-HATTA (U) 895,0 2.178,9 1.249,5 1.192,1 899,5 -5,76 527,0 772,2 46,53
TANJUNG EMAS 207,1 236,9 288,6 339,4 356,8 15,58 223,2 351,9 57,67
PELABUHAN LAINNYA/OTHER PORTS 351,8 387,8 324,8 187,0 207,7 -16,33 142,1 496,1 249,12
3102 Fertilizers; mineral or chemical, nitrogenous 1.112.309,7 1.516.636,3 1.208.706,7 915.975,1 1.345.579,2 -1,23 702.961,8 743.463,2 5,76
BONTANG 974.883,0 1.198.084,2 1.038.874,4 785.834,5 1.239.768,7 0,59 660.974,3 458.303,7 -30,66
TANJUNG PRIOK 11.575,0 74.333,3 55.802,5 46.337,0 61.663,9 33,28 22.383,1 43.941,6 96,32
MUSI RIVER/BOOM BARU 53.489,5 155.217,0 108.503,4 72.478,5 35.141,1 -14,80 19.603,4 220.387,8 1024,23
GRESIK 3.725,0 24.500,0 5.500,0 - 9.004,4 - - 19.999,7 -
ACHMAD YANI (U) - - - - 1,0 - 1,0 - -
PELABUHAN LAINNYA/OTHER PORTS 68.637,1 64.501,9 26,4 11.325,0 0,1 -94,84 0,1 830,3 1383808,83
3401 Soap; organic surface-active preparations used as soap, skin washing, in bars, cakes,
moulded pieces, shapes, liquid or cream, containing soap or not; for retail, paper,
wadding, felt and
556.862,9 633.028,5 590.772,1 583.884,7 685.071,6 3,39 471.733,5 584.462,6 23,90
TANJUNG PRIOK 227.902,3 236.242,9 213.996,9 217.008,3 210.008,2 -2,45 136.977,8 205.247,1 49,84
BELAWAN 195.238,3 199.679,0 194.869,1 211.811,5 246.627,5 5,40 163.098,0 230.706,2 41,45
TANJUNG PERAK 124.799,7 187.676,5 173.060,5 149.001,1 222.580,2 9,71 167.759,6 143.846,1 -14,25
TANJUNG EMAS 4.094,5 4.156,5 3.895,8 4.869,7 4.203,8 2,13 2.609,0 3.370,5 29,19
SOEKARNO-HATTA (U) 73,1 52,2 58,0 61,9 148,1 17,14 96,1 134,2 39,59
PELABUHAN LAINNYA/OTHER PORTS 4.755,0 5.221,4 4.891,8 1.132,2 1.503,8 -31,83 1.193,0 1.158,5 -2,90
32
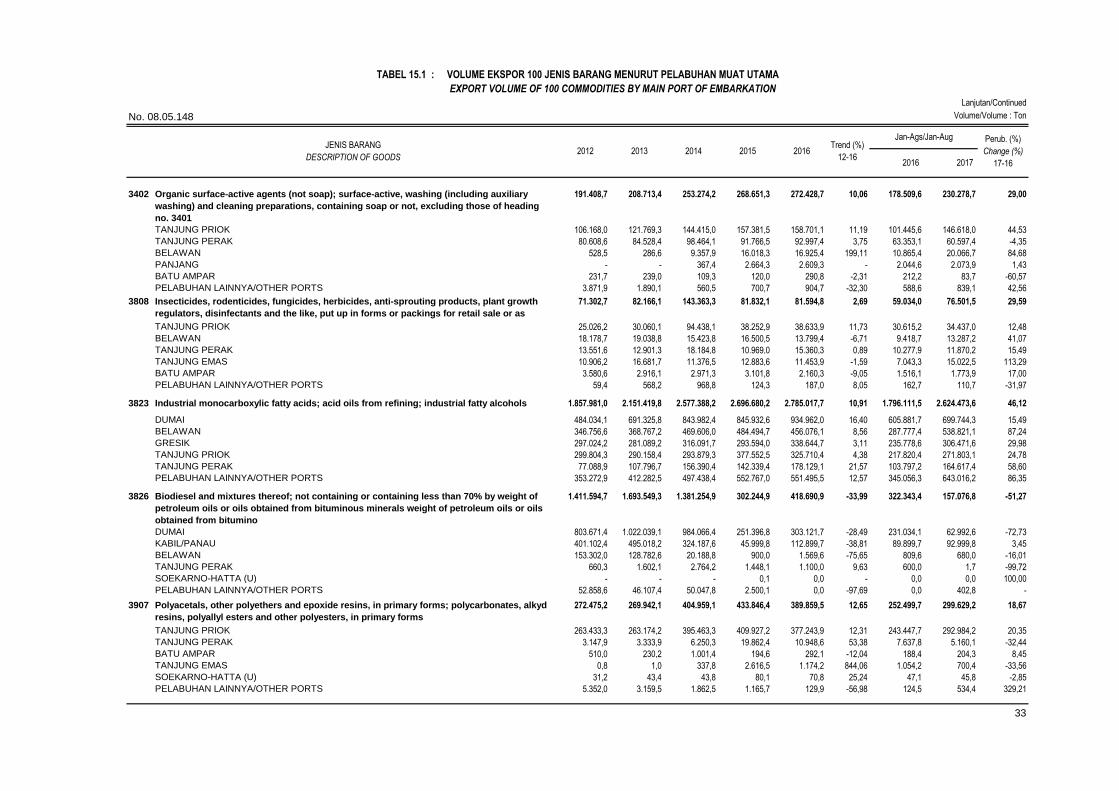
Lanjutan/Continued
Volume/Volume : TonNo. 08.05.148
2015 2016
2016 2017
20142012 2013
TABEL 15.1 : VOLUME EKSPOR 100 JENIS BARANG MENURUT PELABUHAN MUAT UTAMA
EXPORT VOLUME OF 100 COMMODITIES BY MAIN PORT OF EMBARKATION
JENIS BARANG
DESCRIPTION OF GOODS
Trend (%)
12-16
Jan-Ags/Jan-Aug Perub. (%)
Change (%)
17-16
3402 Organic surface-active agents (not soap); surface-active, washing (including auxiliary
washing) and cleaning preparations, containing soap or not, excluding those of heading
no. 3401
191.408,7 208.713,4 253.274,2 268.651,3 272.428,7 10,06 178.509,6 230.278,7 29,00
TANJUNG PRIOK 106.168,0 121.769,3 144.415,0 157.381,5 158.701,1 11,19 101.445,6 146.618,0 44,53
TANJUNG PERAK 80.608,6 84.528,4 98.464,1 91.766,5 92.997,4 3,75 63.353,1 60.597,4 -4,35
BELAWAN 528,5 286,6 9.357,9 16.018,3 16.925,4 199,11 10.865,4 20.066,7 84,68
PANJANG - - 367,4 2.664,3 2.609,3 - 2.044,6 2.073,9 1,43
BATU AMPAR 231,7 239,0 109,3 120,0 290,8 -2,31 212,2 83,7 -60,57
PELABUHAN LAINNYA/OTHER PORTS 3.871,9 1.890,1 560,5 700,7 904,7 -32,30 588,6 839,1 42,56
3808 Insecticides, rodenticides, fungicides, herbicides, anti-sprouting products, plant growth
regulators, disinfectants and the like, put up in forms or packings for retail sale or as
preparations or form
71.302,7 82.166,1 143.363,3 81.832,1 81.594,8 2,69 59.034,0 76.501,5 29,59
TANJUNG PRIOK 25.026,2 30.060,1 94.438,1 38.252,9 38.633,9 11,73 30.615,2 34.437,0 12,48
BELAWAN 18.178,7 19.038,8 15.423,8 16.500,5 13.799,4 -6,71 9.418,7 13.287,2 41,07
TANJUNG PERAK 13.551,6 12.901,3 18.184,8 10.969,0 15.360,3 0,89 10.277,9 11.870,2 15,49
TANJUNG EMAS 10.906,2 16.681,7 11.376,5 12.883,6 11.453,9 -1,59 7.043,3 15.022,5 113,29
BATU AMPAR 3.580,6 2.916,1 2.971,3 3.101,8 2.160,3 -9,05 1.516,1 1.773,9 17,00
PELABUHAN LAINNYA/OTHER PORTS 59,4 568,2 968,8 124,3 187,0 8,05 162,7 110,7 -31,97
3823 Industrial monocarboxylic fatty acids; acid oils from refining; industrial fatty alcohols 1.857.981,0 2.151.419,8 2.577.388,2 2.696.680,2 2.785.017,7 10,91 1.796.111,5 2.624.473,6 46,12
DUMAI 484.034,1 691.325,8 843.982,4 845.932,6 934.962,0 16,40 605.881,7 699.744,3 15,49
BELAWAN 346.756,6 368.767,2 469.606,0 484.494,7 456.076,1 8,56 287.777,4 538.821,1 87,24
GRESIK 297.024,2 281.089,2 316.091,7 293.594,0 338.644,7 3,11 235.778,6 306.471,6 29,98
TANJUNG PRIOK 299.804,3 290.158,4 293.879,3 377.552,5 325.710,4 4,38 217.820,4 271.803,1 24,78
TANJUNG PERAK 77.088,9 107.796,7 156.390,4 142.339,4 178.129,1 21,57 103.797,2 164.617,4 58,60
PELABUHAN LAINNYA/OTHER PORTS 353.272,9 412.282,5 497.438,4 552.767,0 551.495,5 12,57 345.056,3 643.016,2 86,35
3826 Biodiesel and mixtures thereof; not containing or containing less than 70% by weight of
petroleum oils or oils obtained from bituminous minerals weight of petroleum oils or oils
obtained from bitumino
1.411.594,7 1.693.549,3 1.381.254,9 302.244,9 418.690,9 -33,99 322.343,4 157.076,8 -51,27
DUMAI 803.671,4 1.022.039,1 984.066,4 251.396,8 303.121,7 -28,49 231.034,1 62.992,6 -72,73
KABIL/PANAU 401.102,4 495.018,2 324.187,6 45.999,8 112.899,7 -38,81 89.899,7 92.999,8 3,45
BELAWAN 153.302,0 128.782,6 20.188,8 900,0 1.569,6 -75,65 809,6 680,0 -16,01
TANJUNG PERAK 660,3 1.602,1 2.764,2 1.448,1 1.100,0 9,63 600,0 1,7 -99,72
SOEKARNO-HATTA (U) - - - 0,1 0,0 - 0,0 0,0 100,00
PELABUHAN LAINNYA/OTHER PORTS 52.858,6 46.107,4 50.047,8 2.500,1 0,0 -97,69 0,0 402,8 -
3907 Polyacetals, other polyethers and epoxide resins, in primary forms; polycarbonates, alkyd
resins, polyallyl esters and other polyesters, in primary forms
272.475,2 269.942,1 404.959,1 433.846,4 389.859,5 12,65 252.499,7 299.629,2 18,67
TANJUNG PRIOK 263.433,3 263.174,2 395.463,3 409.927,2 377.243,9 12,31 243.447,7 292.984,2 20,35
TANJUNG PERAK 3.147,9 3.333,9 6.250,3 19.862,4 10.948,6 53,38 7.637,8 5.160,1 -32,44
BATU AMPAR 510,0 230,2 1.001,4 194,6 292,1 -12,04 188,4 204,3 8,45
TANJUNG EMAS 0,8 1,0 337,8 2.616,5 1.174,2 844,06 1.054,2 700,4 -33,56
SOEKARNO-HATTA (U) 31,2 43,4 43,8 80,1 70,8 25,24 47,1 45,8 -2,85
PELABUHAN LAINNYA/OTHER PORTS 5.352,0 3.159,5 1.862,5 1.165,7 129,9 -56,98 124,5 534,4 329,21
33

Lanjutan/Continued
Volume/Volume : TonNo. 08.05.148
2015 2016
2016 2017
20142012 2013
TABEL 15.1 : VOLUME EKSPOR 100 JENIS BARANG MENURUT PELABUHAN MUAT UTAMA
EXPORT VOLUME OF 100 COMMODITIES BY MAIN PORT OF EMBARKATION
JENIS BARANG
DESCRIPTION OF GOODS
Trend (%)
12-16
Jan-Ags/Jan-Aug Perub. (%)
Change (%)
17-16
3920 Plastics; plates, sheets, film, foil and strip (not self-adhesive); non-cellular and not
reinforced, laminated, supported or similarly combined with other materials, n.e.c. in
chapter 39
188.999,7 191.650,3 201.259,9 195.411,9 218.834,7 3,18 144.067,7 189.391,5 31,46
TANJUNG PRIOK 146.131,5 149.429,9 156.787,8 158.376,1 177.298,6 4,55 116.858,8 154.128,6 31,89
TANJUNG PERAK 41.698,8 41.141,3 43.240,8 36.037,8 40.686,0 -1,80 26.647,8 34.572,2 29,74
SOEKARNO-HATTA (U) 194,5 369,6 495,8 285,3 447,3 15,11 348,9 274,0 -21,47
BATU AMPAR 405,8 400,1 257,2 63,5 122,1 -34,58 54,1 196,5 263,39
JUANDA (U)-SURABAYA 15,0 50,5 76,7 68,8 92,7 48,42 57,0 12,7 -77,65
PELABUHAN LAINNYA/OTHER PORTS 554,0 258,8 401,6 580,4 188,0 -12,67 101,0 207,4 105,30
3923 Plastic articles for the conveyance or packing of goods; stoppers, lids, caps and other
closures of plastics
152.022,3 146.943,1 147.110,1 139.467,1 139.260,0 -2,25 91.496,7 122.951,3 34,38
TANJUNG PRIOK 53.650,0 54.742,9 51.322,3 46.539,8 47.563,9 -3,95 30.695,4 42.745,9 39,26
BATU AMPAR 32.329,1 31.643,7 34.755,7 36.091,8 36.798,6 3,98 24.160,2 29.968,0 24,04
BELAWAN 22.728,1 21.819,2 24.088,8 22.637,1 25.332,7 2,57 16.468,4 21.585,6 31,07
TANJUNG EMAS 15.689,7 16.364,5 14.037,9 16.351,4 14.692,4 -1,31 10.281,3 14.697,8 42,96
TANJUNG PERAK 21.506,7 16.100,1 17.008,1 13.157,4 10.041,8 -15,84 6.840,6 9.954,5 45,52
PELABUHAN LAINNYA/OTHER PORTS 6.118,6 6.272,6 5.897,3 4.689,6 4.830,6 -7,35 3.050,6 3.999,3 31,10
4001 Natural rubber, balata, gutta-percha, guayule, chicle and similar gums; in primary forms or
in plates, sheets or strip
2.445.666,7 2.703.287,1 2.624.416,1 2.631.139,2 2.579.124,9 0,80 1.655.867,0 2.534.992,4 53,09
MUSI RIVER/BOOM BARU 880.876,8 970.730,1 1.041.122,3 1.011.829,1 994.339,1 2,88 623.881,6 747.278,6 19,78
BELAWAN 625.998,2 693.877,1 625.527,1 597.445,0 561.229,1 -3,61 361.117,5 551.068,9 52,60
PADANG/TL.BAYUR 230.428,2 241.499,3 238.085,8 258.633,9 278.238,2 4,56 178.038,0 238.210,6 33,80
JAMBI 190.975,5 199.319,1 230.636,1 232.618,9 232.348,2 5,62 156.205,7 226.807,1 45,20
TANJUNG PERAK 158.819,0 175.468,0 181.620,5 199.352,8 209.619,6 7,07 136.168,3 194.663,3 42,96
PELABUHAN LAINNYA/OTHER PORTS 358.568,9 422.393,5 307.424,3 331.259,5 303.350,7 -5,61 200.455,9 576.964,0 187,83
4011 New pneumatic tyres, of rubber 403.480,0 426.959,1 451.121,6 472.264,1 516.906,2 6,14 340.693,8 435.030,7 27,69
TANJUNG PRIOK 377.672,9 401.050,5 420.757,6 447.035,8 488.345,9 6,42 321.324,1 410.416,7 27,73
BELAWAN 24.745,8 24.767,4 28.509,7 23.163,8 26.202,1 0,48 17.956,7 20.128,8 12,10
SOEKARNO-HATTA (U) 269,9 453,2 1.002,1 927,3 551,8 23,94 370,4 2.464,6 565,45
TANJUNG PERAK 403,7 538,9 601,2 773,2 1.497,9 34,76 835,7 1.035,5 23,91
BATU AMPAR 109,7 27,1 29,8 93,9 98,2 10,75 75,9 43,2 -43,11
PELABUHAN LAINNYA/OTHER PORTS 278,0 122,1 221,2 270,0 210,4 2,39 131,0 941,8 619,02
4202 Trunks; suit, camera, jewellery, cutlery cases; travel, tool, similar bags; wholly or mainly
covered by leather, composition leather, plastic sheeting, textile materials, vulcanised
fibre, paperboard
15.423,1 17.006,3 18.471,6 18.499,9 19.208,6 5,37 12.267,9 18.559,3 51,28
TANJUNG PRIOK 12.403,5 13.554,9 14.723,9 15.091,5 15.936,9 6,28 10.121,6 15.395,6 52,11
SOEKARNO-HATTA (U) 483,9 496,7 600,8 435,8 541,4 0,94 343,3 522,0 52,05
TANJUNG EMAS 332,6 595,8 981,9 1.063,5 982,7 31,60 634,5 1.489,5 134,76
TANJUNG PERAK 1.110,3 1.068,6 1.286,7 1.171,9 945,6 -2,26 671,7 708,1 5,42
NGURAH RAI (U) 244,3 249,4 237,5 250,1 215,8 -2,42 145,4 187,7 29,11
PELABUHAN LAINNYA/OTHER PORTS 848,6 1.040,9 640,8 487,0 586,3 -13,92 351,5 256,5 -27,02
34

Lanjutan/Continued
Volume/Volume : TonNo. 08.05.148
2015 2016
2016 2017
20142012 2013
TABEL 15.1 : VOLUME EKSPOR 100 JENIS BARANG MENURUT PELABUHAN MUAT UTAMA
EXPORT VOLUME OF 100 COMMODITIES BY MAIN PORT OF EMBARKATION
JENIS BARANG
DESCRIPTION OF GOODS
Trend (%)
12-16
Jan-Ags/Jan-Aug Perub. (%)
Change (%)
17-16
4409 Wood (including strips, friezes for parquet flooring, not assembled), continuously shaped
(tongued, grooved, v-jointed, beaded or the like) along any edges, ends or faces, whether
or not planed, sande
363.121,3 401.511,7 523.193,5 524.635,0 593.763,8 13,33 375.192,1 530.075,0 41,28
TANJUNG PERAK 236.916,9 269.831,2 363.449,1 379.875,8 443.438,9 17,30 275.934,9 396.821,4 43,81
TANJUNG EMAS 60.584,6 75.662,1 97.988,5 82.216,1 88.156,7 8,69 59.798,6 80.397,9 34,45
TANJUNG PRIOK 27.026,3 25.224,9 26.631,9 25.797,3 24.856,8 -1,44 15.580,1 22.959,9 47,37
BELAWAN 14.854,7 12.590,4 13.626,9 12.721,5 13.079,3 -2,41 8.324,2 10.532,5 26,53
PONTIANAK 5.257,5 3.403,4 4.067,8 3.891,7 4.596,1 -1,34 3.333,4 2.771,2 -16,87
PELABUHAN LAINNYA/OTHER PORTS 18.481,3 14.799,7 17.429,3 20.132,6 19.635,9 4,38 12.220,9 16.592,1 35,77
4412 Plywood, veneered panels and similar laminated wood 1.950.219,4 2.082.789,6 2.340.789,3 2.466.536,5 2.463.932,0 6,57 1.619.451,4 2.048.068,6 26,47
TANJUNG EMAS 528.265,1 658.014,9 757.369,5 799.179,5 760.493,3 9,67 494.127,8 620.267,0 25,53
TANJUNG PERAK 302.624,4 318.426,0 363.746,7 382.304,2 425.870,2 9,05 279.903,2 388.441,7 38,78
TANJUNG PRIOK 165.717,7 172.239,3 194.678,4 225.060,6 264.398,2 12,77 175.502,5 304.458,2 73,48
BANJARMASIN 187.504,5 197.227,4 219.861,0 225.278,8 249.202,0 7,27 159.643,0 158.658,9 -0,62
SAMARINDA 136.880,4 128.017,1 161.756,0 182.971,5 203.107,9 12,15 126.262,6 112.112,1 -11,21
PELABUHAN LAINNYA/OTHER PORTS 629.227,3 608.864,8 643.377,8 651.742,0 560.860,5 -1,61 384.012,3 464.130,7 20,86
4418 Builders' joinery and carpentry of wood, including cellular wood panels, assembled
flooring panels, shingles and shakes
134.081,9 141.968,8 150.050,0 158.377,7 164.544,2 5,33 105.268,4 149.198,7 41,73
TANJUNG PERAK 51.750,0 55.714,0 59.631,6 58.316,1 61.387,4 3,95 38.098,6 55.777,8 46,40
TANJUNG EMAS 31.329,7 33.110,8 34.434,4 37.796,7 39.622,9 6,21 26.254,3 33.530,5 27,71
TANJUNG PRIOK 21.648,4 23.692,3 26.793,3 26.500,3 28.458,3 6,81 18.866,2 27.215,6 44,26
BELAWAN 26.165,0 25.673,5 26.378,7 33.154,1 32.958,9 7,44 20.578,0 31.064,7 50,96
SOEKARNO-HATTA (U) 61,7 90,3 103,3 860,3 638,5 99,96 497,5 134,6 -72,94
PELABUHAN LAINNYA/OTHER PORTS 3.127,1 3.688,0 2.708,8 1.750,2 1.478,2 -20,10 973,8 1.475,5 51,52
4703 Chemical wood pulp, soda or sulphate, other than dissolving grades 3.195.492,2 3.717.459,3 3.497.111,0 3.399.380,6 3.531.959,2 1,11 2.330.526,2 3.605.320,3 54,70
BUATAN 1.958.350,6 1.927.528,9 1.796.202,6 1.870.975,1 2.051.530,6 0,63 1.341.131,9 1.571.878,3 17,21
PERAWANG, SUMATRA 536.095,0 1.081.866,1 941.326,2 733.126,4 650.468,0 -0,02 450.728,0 392.352,0 -12,95
KUALA TUNGKAL 168.260,0 216.064,0 222.242,2 268.263,5 296.490,7 14,45 190.464,9 212.263,3 11,44
PANJANG 327.120,5 307.303,8 315.197,1 361.935,0 211.339,5 -6,85 155.893,8 124.379,7 -20,22
BELAWAN 198.296,4 175.668,2 196.339,2 165.056,7 161.598,0 -4,61 126.221,6 62.824,7 -50,23
PELABUHAN LAINNYA/OTHER PORTS 7.369,7 9.028,3 25.803,6 24,0 160.532,3 2,33 66.085,9 1.241.622,2 1778,80
4802 Uncoated paper and paperboard, used for writing, printing or other graphics, non
perforated punch-cards and punch tape paper, in rolls or rectangular sheets, of any size,
other than paper of
2.372.556,7 2.273.576,7 2.398.131,5 2.352.371,1 2.446.431,4 0,96 1.586.599,1 2.310.201,6 45,61
PERAWANG, SUMATRA 677.465,3 698.293,3 821.822,1 804.291,0 879.499,4 6,86 581.709,4 792.744,5 36,28
TANJUNG PRIOK 489.578,0 426.039,6 420.463,8 481.815,5 501.235,8 1,72 324.750,4 438.283,3 34,96
BUATAN 689.036,8 633.516,9 633.859,9 585.135,2 601.690,3 -3,44 391.360,7 658.247,2 68,19
TANJUNG PERAK 504.552,2 510.800,5 516.355,1 477.001,3 462.098,3 -2,41 287.101,7 420.210,1 46,36
TANJUNG EMAS 1.520,1 1.036,4 866,9 1.882,2 1.268,1 2,37 1.038,6 473,0 -54,46
PELABUHAN LAINNYA/OTHER PORTS 10.404,4 3.890,0 4.763,6 2.245,8 639,6 -45,81 638,3 243,5 -61,86
35

Lanjutan/Continued
Volume/Volume : TonNo. 08.05.148
2015 2016
2016 2017
20142012 2013
TABEL 15.1 : VOLUME EKSPOR 100 JENIS BARANG MENURUT PELABUHAN MUAT UTAMA
EXPORT VOLUME OF 100 COMMODITIES BY MAIN PORT OF EMBARKATION
JENIS BARANG
DESCRIPTION OF GOODS
Trend (%)
12-16
Jan-Ags/Jan-Aug Perub. (%)
Change (%)
17-16
4803 Tissue, towel, napkin stock or similar; for household or sanitary uses, cellulose wadding,
webs of cellulose fibres, in rolls over 36cm in width or rectangular sheets with one side
exceeding 36cm when
304.099,9 334.935,4 302.283,4 406.201,1 496.492,2 12,45 347.872,2 450.511,4 29,50
PERAWANG, SUMATRA 183.153,2 171.644,7 143.306,7 228.297,6 269.420,5 11,15 189.060,9 254.481,8 34,60
KUALA TUNGKAL 50.843,1 89.694,0 66.935,8 82.094,5 114.723,3 16,64 83.563,9 109.161,8 30,63
TANJUNG PERAK 35.255,8 33.316,9 46.046,1 58.495,4 67.325,8 20,40 44.331,7 59.013,0 33,12
TANJUNG PRIOK 34.810,3 40.278,3 45.900,4 36.336,5 44.063,1 3,75 30.546,8 27.844,3 -8,85
TANJUNG EMAS 31,7 - 92,3 937,6 941,3 - 354,7 0,6 -99,84
PELABUHAN LAINNYA/OTHER PORTS 5,7 1,6 2,2 39,5 18,2 74,08 14,1 10,0 -29,11
4810 Paper and paperboard, coated one or both sides with kaolin (china clay) or inorganic
substances, with binder or not, no other coating, surface coloured or not, surface
decorated or printed, in rolls o
675.083,9 703.061,1 647.481,6 591.163,5 496.449,7 -7,58 332.633,3 333.766,7 0,34
TANJUNG PRIOK 343.048,2 406.374,3 394.245,8 389.714,4 317.988,6 -1,92 219.168,3 242.926,7 10,84
TANJUNG PERAK 259.676,5 261.301,6 221.169,4 187.876,4 157.481,5 -12,45 103.447,3 68.123,8 -34,15
TANJUNG EMAS 4.239,1 3.989,3 6.478,0 1.952,5 4.082,6 -7,59 2.101,3 4.411,0 109,91
MERAK 67.963,3 31.359,0 21.292,9 11.173,4 16.172,8 -32,32 7.248,7 17.524,5 141,76
SURABAYA (PTT) - - - - 399,9 - 352,9 773,7 119,25
PELABUHAN LAINNYA/OTHER PORTS 156,9 36,9 4.295,6 446,8 324,1 48,35 314,8 7,0 -97,79
5205 Cotton yarn (other than sewing thread), containing 85% or more by weight of cotton, not
put up for retail sale
77.100,4 147.472,0 141.418,0 155.141,2 163.159,9 16,77 109.523,8 141.200,7 28,92
TANJUNG PRIOK 64.401,8 124.754,2 107.998,3 112.148,6 118.604,8 11,79 77.162,5 104.479,4 35,40
TANJUNG EMAS 6.920,9 17.845,2 24.698,7 35.110,6 37.528,1 50,05 28.010,5 29.293,0 4,58
TANJUNG PERAK 5.163,2 4.828,5 8.704,9 7.859,3 7.013,8 11,63 4.342,7 7.413,6 70,71
SOEKARNO-HATTA (U) 31,2 43,8 14,1 22,7 13,2 -21,18 8,2 14,8 80,92
JUANDA (U)-SURABAYA - 0,0 0,5 - - - - - -
PELABUHAN LAINNYA/OTHER PORTS 583,4 0,2 1,4 - - - 0,0 0,0 -
5402 Synthetic filament yarn (other than sewing thread), not put up for retail sale, including
synthetic monofilament of less than 67 decitex
194.704,8 196.844,0 201.459,1 225.117,0 231.905,0 4,96 148.387,9 190.615,1 28,46
TANJUNG PRIOK 147.661,4 150.574,2 154.022,4 178.893,2 192.328,2 7,26 122.747,9 154.380,7 25,77
TANJUNG EMAS 45.250,8 44.228,9 45.090,0 43.501,4 37.221,0 -3,99 24.079,4 34.168,4 41,90
TANJUNG PERAK 1.683,5 1.828,9 2.204,3 2.546,4 2.219,8 9,24 1.459,8 1.935,4 32,58
SOEKARNO-HATTA (U) 67,2 165,0 125,5 161,3 113,9 10,87 82,1 118,9 44,89
JUANDA (U)-SURABAYA 9,4 3,0 15,9 12,1 15,9 27,98 13,2 10,3 -21,74
PELABUHAN LAINNYA/OTHER PORTS 32,6 44,1 1,0 2,6 6,1 -46,09 5,6 1,4 -75,31
5407 Woven fabrics of synthetic filament yarn, including woven fabrics obtained from materials
of heading no. 5404
110.487,1 100.420,2 162.038,4 112.488,1 91.017,3 -2,70 64.810,4 69.039,9 6,53
TANJUNG PRIOK 98.413,5 88.665,1 146.406,1 98.503,1 81.851,6 -2,60 58.117,2 59.258,1 1,96
TANJUNG PERAK 5.904,9 5.948,3 8.213,1 7.665,6 4.607,9 -2,40 3.374,4 4.965,8 47,16
SOEKARNO-HATTA (U) 738,5 543,3 532,7 495,8 702,0 -1,91 469,4 465,5 -0,84
TANJUNG EMAS 5.205,7 5.048,0 6.769,5 5.609,6 3.212,7 -8,24 2.215,4 4.274,0 92,92
BELAWAN - - - 180,7 605,7 - 605,6 61,0 -89,92
PELABUHAN LAINNYA/OTHER PORTS 224,4 215,6 116,9 33,3 37,4 -42,01 28,4 15,6 -45,28
36

Lanjutan/Continued
Volume/Volume : TonNo. 08.05.148
2015 2016
2016 2017
20142012 2013
TABEL 15.1 : VOLUME EKSPOR 100 JENIS BARANG MENURUT PELABUHAN MUAT UTAMA
EXPORT VOLUME OF 100 COMMODITIES BY MAIN PORT OF EMBARKATION
JENIS BARANG
DESCRIPTION OF GOODS
Trend (%)
12-16
Jan-Ags/Jan-Aug Perub. (%)
Change (%)
17-16
5509 Yarn (other than sewing thread) of synthetic staple fibres, not put up for retail sale 306.786,8 337.653,8 372.458,7 364.150,8 364.119,2 4,27 255.498,6 298.993,6 17,02
TANJUNG PRIOK 195.783,3 211.944,4 227.819,1 222.080,5 215.631,7 2,43 152.143,4 162.898,4 7,07
TANJUNG EMAS 68.478,1 80.008,6 103.859,2 110.288,0 114.820,5 14,51 81.437,1 101.983,6 25,23
TANJUNG PERAK 42.410,0 45.526,4 40.589,4 31.608,3 33.433,3 -8,06 21.794,9 33.966,6 55,85
SOEKARNO-HATTA (U) 95,9 63,1 179,4 158,4 225,8 30,11 117,2 142,2 21,37
JUANDA (U)-SURABAYA 17,9 7,4 7,3 12,8 7,8 -10,46 6,0 0,4 -93,22
PELABUHAN LAINNYA/OTHER PORTS 1,5 103,9 4,3 2,8 0,1 -62,64 0,1 2,4 4083,93
5510 Yarn (other than sewing thread) of artificial staple fibres, not put up for retail sale 116.986,1 156.693,0 169.756,4 207.269,5 192.007,9 13,55 134.123,8 154.331,8 15,07
TANJUNG EMAS 39.326,1 67.889,1 81.047,8 116.091,8 106.187,8 28,70 75.155,3 82.441,4 9,69
TANJUNG PRIOK 73.535,4 84.383,2 81.635,9 80.665,6 76.439,0 0,32 52.041,2 64.352,3 23,66
TANJUNG PERAK 4.112,4 4.343,3 7.048,1 10.491,1 9.350,0 28,72 6.906,4 7.499,7 8,59
SOEKARNO-HATTA (U) 9,2 73,1 11,6 21,0 30,4 12,08 20,6 37,7 83,16
JUANDA (U)-SURABAYA - 0,8 - - 0,7 - 0,3 - -
PELABUHAN LAINNYA/OTHER PORTS 3,0 3,6 13,0 0,0 0,0 -82,25 0,0 0,7 7484,38
6103 Suits, ensembles, jackets, blazers, trousers, bib and brace overalls, breeches, shorts (not
swimwear); men's or boys', knitted or crocheted
18.059,2 18.595,3 20.993,0 20.287,1 18.496,5 1,36 12.666,2 16.812,9 32,74
TANJUNG PRIOK 13.375,9 14.547,8 16.626,3 15.189,4 13.168,9 0,12 9.038,5 12.646,7 39,92
TANJUNG EMAS 2.947,4 2.402,6 2.597,4 3.927,5 3.853,9 10,82 2.690,5 3.060,4 13,75
SOEKARNO-HATTA (U) 950,6 1.064,2 924,2 842,0 1.150,3 1,48 751,9 871,0 15,84
BELAWAN 262,2 257,5 170,1 144,2 153,2 -15,25 97,6 79,3 -18,74
SEKUPANG 5,9 19,1 50,7 29,7 23,7 38,04 13,6 25,9 90,67
PELABUHAN LAINNYA/OTHER PORTS 517,1 304,0 624,3 154,3 146,6 -27,39 74,1 129,5 74,68
6104 Suits, ensembles, jackets, dresses, skirts, divided skirts, trousers, bib and brace overalls,
breeches and shorts (not swimwear), women's or girls', knitted or crocheted knitted or
crocheted
47.689,7 46.193,7 51.822,9 48.042,5 49.176,7 1,01 33.449,8 39.508,2 18,11
TANJUNG PRIOK 40.134,7 35.575,3 39.915,0 36.531,7 35.415,9 -2,21 24.304,6 28.301,9 16,45
TANJUNG EMAS 1.978,5 3.684,3 4.781,5 4.214,7 6.017,4 26,61 3.795,1 4.694,1 23,69
SOEKARNO-HATTA (U) 1.997,6 2.419,2 2.603,0 3.262,5 3.454,3 14,96 2.197,4 2.624,3 19,43
BATU AMPAR 3.124,8 2.868,9 2.477,5 2.718,5 3.212,5 0,02 2.435,4 3.063,4 25,79
SEKUPANG 48,3 160,8 355,7 738,0 377,0 75,66 269,9 337,3 24,96
PELABUHAN LAINNYA/OTHER PORTS 405,9 1.485,3 1.690,2 577,2 699,7 1,45 447,3 487,3 8,92
6109 T-shirts, singlets and other vests; knitted or crocheted 44.137,8 31.175,8 21.732,6 32.341,5 36.720,7 -3,26 22.071,3 31.102,9 40,92
TANJUNG PRIOK 34.753,0 25.304,0 16.819,8 23.710,3 29.300,4 -3,98 17.060,3 25.384,0 48,79
TANJUNG EMAS 5.080,4 3.456,3 2.883,1 5.603,3 4.481,4 2,35 3.009,4 3.200,4 6,35
SOEKARNO-HATTA (U) 3.694,3 1.800,9 1.565,4 2.386,8 2.383,6 -5,77 1.637,3 2.042,4 24,74
SEKUPANG 21,6 43,0 52,9 75,4 72,2 34,70 46,7 28,7 -38,55
NGURAH RAI (U) 174,0 130,8 108,5 132,2 122,9 -6,62 80,9 67,3 -16,76
PELABUHAN LAINNYA/OTHER PORTS 414,5 440,8 302,9 433,6 360,1 -2,93 236,6 380,1 60,64
37

Lanjutan/Continued
Volume/Volume : TonNo. 08.05.148
2015 2016
2016 2017
20142012 2013
TABEL 15.1 : VOLUME EKSPOR 100 JENIS BARANG MENURUT PELABUHAN MUAT UTAMA
EXPORT VOLUME OF 100 COMMODITIES BY MAIN PORT OF EMBARKATION
JENIS BARANG
DESCRIPTION OF GOODS
Trend (%)
12-16
Jan-Ags/Jan-Aug Perub. (%)
Change (%)
17-16
6110 Jerseys, pullovers, cardigans, waistcoats and similar articles; knitted or crocheted 58.549,8 79.609,2 61.096,0 51.324,7 49.139,5 -7,59 32.187,7 44.459,1 38,12
TANJUNG PRIOK 49.772,2 69.678,3 51.383,4 42.379,1 38.747,5 -9,50 25.776,9 34.530,0 33,96
SOEKARNO-HATTA (U) 4.368,4 5.470,6 4.676,9 4.150,0 4.895,7 -0,48 2.984,8 4.077,3 36,60
TANJUNG EMAS 2.212,1 2.227,1 3.436,4 3.532,6 4.116,2 18,57 2.590,1 4.145,2 60,04
BATU AMPAR 2.041,5 1.496,2 1.192,0 1.065,2 1.206,0 -13,00 728,1 1.378,5 89,34
NGURAH RAI (U) 25,9 26,6 24,8 14,1 23,8 -7,66 15,0 22,2 48,09
PELABUHAN LAINNYA/OTHER PORTS 129,7 710,3 382,5 183,6 150,2 -10,05 92,8 305,8 229,50
6201 Overcoats, car-coats, capes, cloaks, anoraks (including ski-jackets), wind-cheaters, wind-
jackets and similar articles, men's or boys', other than those of heading no. 6203 (not
knitted
16.116,2 12.637,8 12.918,0 9.838,0 13.346,7 -6,08 8.567,9 12.374,6
TANJUNG PRIOK 10.868,2 9.088,0 8.959,7 7.178,6 8.266,0 -7,53 5.581,9 7.244,2 29,78
TANJUNG EMAS 3.290,6 1.926,8 2.598,1 1.643,6 3.540,3 -0,13 2.187,1 3.276,7 49,82
SOEKARNO-HATTA (U) 1.208,1 1.028,1 860,7 745,5 1.166,3 -3,84 618,2 1.559,6 152,28
TANJUNG PERAK 682,2 527,2 452,4 234,0 318,9 -20,81 142,0 251,6 77,16
JUANDA (U)-SURABAYA 8,4 12,8 10,3 5,0 12,7 -1,34 12,4 0,7 -93,99
PELABUHAN LAINNYA/OTHER PORTS 58,7 54,9 36,7 31,4 42,5 -11,34 26,4 41,8 58,51
6203 Suits, ensembles, jackets, blazers, trousers, bib and brace overalls, breeches and shorts
(other than swimwear); men's or boys' (not knitted or crocheted)
36.164,1 39.542,4 38.247,1 36.882,2 39.985,7 1,32 26.515,4 32.612,1 22,99
TANJUNG PRIOK 29.157,9 28.846,8 26.343,9 28.229,8 30.279,3 0,54 20.381,3 23.021,4 12,95
TANJUNG EMAS 3.581,1 6.180,6 6.614,1 5.577,7 6.173,8 10,37 4.018,5 6.103,7 51,89
SOEKARNO-HATTA (U) 2.052,5 2.950,0 2.225,7 2.168,2 2.339,0 -0,47 1.316,3 2.533,5 92,48
TANJUNG PERAK 22,6 200,7 329,6 714,7 1.010,0 142,86 693,8 808,5 16,55
JUANDA (U)-SURABAYA 1,8 19,4 16,3 83,4 36,1 111,31 15,6 76,0 387,47
PELABUHAN LAINNYA/OTHER PORTS 1.348,3 1.344,9 2.717,6 108,3 147,4 -50,07 90,1 68,9 -23,46
6204 Suits, ensembles, jackets, dresses, skirts, divided skirts, trousers, bib and brace overalls,
breeches and shorts (other than swimwear); women's or girls' (not knitted or crocheted)
44.731,9 49.117,8 45.705,0 54.461,3 51.694,8 4,00 36.037,2 41.772,6 15,92
TANJUNG PRIOK 30.264,5 33.408,7 31.735,8 33.392,5 32.528,2 1,45 23.178,1 24.345,3 5,04
TANJUNG EMAS 7.286,3 8.000,6 7.560,8 12.125,3 12.007,6 15,20 8.096,7 10.327,0 27,55
SOEKARNO-HATTA (U) 4.195,7 4.620,3 3.799,5 5.826,0 4.444,4 3,53 3.101,5 4.672,6 50,66
TANJUNG PERAK 394,2 493,5 729,1 2.103,7 1.855,4 57,59 1.080,8 1.732,5 60,29
NGURAH RAI (U) 844,1 700,6 787,1 677,8 659,3 -5,14 447,7 509,9 13,89
PELABUHAN LAINNYA/OTHER PORTS 1.747,1 1.894,1 1.092,7 336,0 200,0 -45,47 132,5 185,2 39,82
6205 Shirts; men's or boys' (not knitted or crocheted) 23.096,9 24.162,1 22.593,9 21.312,4 20.232,8 -3,83 13.638,2 16.374,6 20,06
TANJUNG EMAS 9.006,6 10.082,6 9.779,5 9.697,6 9.663,1 1,02 6.538,0 7.308,9 11,79
TANJUNG PRIOK 12.758,1 12.652,9 11.678,1 10.344,4 9.470,3 -7,66 6.412,7 8.152,1 27,12
SOEKARNO-HATTA (U) 1.085,8 1.074,9 899,5 1.027,5 827,0 -5,73 543,1 706,7 30,12
TANJUNG PINANG 125,0 116,8 93,3 128,7 125,2 1,01 69,6 80,1 15,06
NGURAH RAI (U) 23,4 21,3 49,6 56,5 17,0 3,42 12,7 14,5 13,92
PELABUHAN LAINNYA/OTHER PORTS 98,0 213,6 94,0 57,8 130,3 -7,11 62,0 112,4 81,22
38

Lanjutan/Continued
Volume/Volume : TonNo. 08.05.148
2015 2016
2016 2017
20142012 2013
TABEL 15.1 : VOLUME EKSPOR 100 JENIS BARANG MENURUT PELABUHAN MUAT UTAMA
EXPORT VOLUME OF 100 COMMODITIES BY MAIN PORT OF EMBARKATION
JENIS BARANG
DESCRIPTION OF GOODS
Trend (%)
12-16
Jan-Ags/Jan-Aug Perub. (%)
Change (%)
17-16
6206 Blouses, shirts and shirt-blouses; women's or girls' (not knitted or crocheted) 23.327,2 24.731,0 23.438,2 31.209,5 23.890,9 2,84 16.516,1 19.402,3 17,48
TANJUNG PRIOK 13.730,5 13.602,7 12.837,3 20.444,6 12.741,8 2,61 8.800,0 9.939,5 12,95
TANJUNG EMAS 6.756,6 6.894,1 6.969,6 6.663,9 7.702,2 2,31 5.322,2 6.036,4 13,42
SOEKARNO-HATTA (U) 2.135,3 3.561,1 2.747,9 3.179,7 2.828,6 4,59 1.973,8 2.946,6 49,28
NGURAH RAI (U) 198,5 160,3 179,3 169,3 146,0 -5,45 102,5 105,9 3,37
TANJUNG PERAK 92,4 82,5 74,7 127,0 160,4 16,60 115,3 125,3 8,60
PELABUHAN LAINNYA/OTHER PORTS 413,9 430,3 629,5 625,0 311,9 -1,91 202,3 248,6 22,91
6212 Brassieres, girdles, corsets, braces, suspenders, garters and similar articles and parts
thereof; whether or not knitted or crocheted
8.995,6 9.244,0 9.047,9 10.014,1 9.432,4 1,76 6.309,3 8.054,2 27,66
TANJUNG PRIOK 5.854,5 6.136,2 5.010,8 5.387,0 4.574,2 -6,05 3.168,3 3.590,5 13,33
TANJUNG EMAS 2.128,6 2.459,4 3.001,9 3.323,2 3.752,7 15,43 2.408,5 3.290,6 36,62
SOEKARNO-HATTA (U) 960,2 571,5 957,1 1.246,3 1.042,9 9,91 679,5 1.085,5 59,75
SEKUPANG 2,8 61,2 31,2 41,7 23,6 47,72 20,4 6,1 -69,86
HALIM PERDANA KUSUMA (U) 0,9 0,8 0,6 0,2 14,7 49,70 14,7 0,0 -99,77
PELABUHAN LAINNYA/OTHER PORTS 48,6 14,8 46,2 15,8 24,4 -12,34 17,9 81,4 354,22
6402 Footwear; with outer soles and uppers of rubber or plastics (excluding waterproof
footwear)
35.821,7 34.275,2 38.492,3 31.132,8 28.398,4 -5,45 18.014,3 25.446,7 41,26
TANJUNG PRIOK 28.595,7 27.015,4 31.166,7 24.855,6 22.689,6 -5,31 14.307,6 20.204,7 41,22
TANJUNG PERAK 6.294,8 5.845,6 5.819,8 5.227,0 4.608,4 -7,09 3.136,2 3.654,7 16,53
SOEKARNO-HATTA (U) 445,0 960,0 1.192,0 751,6 699,3 6,82 313,1 854,5 172,90
TANJUNG EMAS 133,5 154,0 208,6 213,3 208,2 12,93 123,7 666,0 438,39
JUANDA (U)-SURABAYA 31,8 33,8 17,9 25,2 59,7 10,14 22,5 39,2 74,23
PELABUHAN LAINNYA/OTHER PORTS 320,9 266,5 87,4 60,0 133,1 -27,76 111,1 27,6 -75,19
6403 Footwear; with outer soles of rubber, plastics, leather or composition leather and uppers
of leather
115.111,9 116.533,4 110.113,2 119.371,5 118.128,6 0,76 76.007,8 105.822,7 39,23
TANJUNG PRIOK 88.493,8 88.607,5 82.885,8 93.586,3 93.408,2 1,64 59.528,8 80.940,2 35,97
TANJUNG PERAK 16.780,7 18.952,9 19.037,4 17.516,9 15.302,4 -2,60 10.695,6 10.972,5 2,59
SOEKARNO-HATTA (U) 3.202,6 3.055,2 2.589,4 3.268,5 3.570,4 2,89 2.276,3 3.380,9 48,52
BATU AMPAR 373,4 18,8 3,7 2.428,6 3.524,8 154,75 2.430,6 1.163,0 -52,15
TANJUNG EMAS 850,7 625,3 941,7 921,1 1.715,6 19,60 640,3 6.766,6 956,82
PELABUHAN LAINNYA/OTHER PORTS 5.410,7 5.273,8 4.655,3 1.650,1 607,2 -42,52 436,2 2.599,7 496,02
6404 Footwear; with outer soles of rubber, plastics, leather or composition leather and uppers
of textile materials
40.888,4 54.672,5 58.621,6 75.909,1 84.847,0 19,58 60.102,9 64.447,9 7,23
TANJUNG PRIOK 37.912,4 49.361,4 53.733,7 70.699,4 79.265,7 20,13 56.849,1 58.182,2 2,35
TANJUNG PERAK 2.361,5 3.262,0 3.563,0 3.104,3 3.757,9 9,19 2.089,7 2.165,9 3,64
SOEKARNO-HATTA (U) 487,7 743,8 1.210,7 1.993,4 1.670,1 41,16 1.097,7 2.517,8 129,36
JUANDA (U)-SURABAYA 73,8 33,6 59,2 72,1 56,4 2,28 36,3 67,7 86,50
TANJUNG EMAS 6,7 28,8 18,2 9,6 62,0 39,92 3,7 1.339,8 36537,32
PELABUHAN LAINNYA/OTHER PORTS 46,2 1.242,9 36,7 30,4 34,9 -34,75 26,4 174,5 560,78
39

Lanjutan/Continued
Volume/Volume : TonNo. 08.05.148
2015 2016
2016 2017
20142012 2013
TABEL 15.1 : VOLUME EKSPOR 100 JENIS BARANG MENURUT PELABUHAN MUAT UTAMA
EXPORT VOLUME OF 100 COMMODITIES BY MAIN PORT OF EMBARKATION
JENIS BARANG
DESCRIPTION OF GOODS
Trend (%)
12-16
Jan-Ags/Jan-Aug Perub. (%)
Change (%)
17-16
6704 Wigs, false beards, eyebrows and eyelashes, switches and the like, of human or animal
hair or of textile materials; articles of human hair, n.e.c. or included
10.758,4 11.310,7 11.136,7 12.680,2 13.082,9 5,19 8.902,6 9.816,9 10,27
TANJUNG PRIOK 9.446,0 10.146,2 9.841,7 10.495,1 10.269,9 2,03 6.985,7 8.103,1 16,00
SOEKARNO-HATTA (U) 606,2 478,2 488,3 985,0 1.449,4 27,97 1.006,5 801,7 -20,35
TANJUNG PERAK 596,3 534,8 646,7 979,7 1.119,0 20,49 754,3 672,2 -10,88
TANJUNG EMAS 100,4 109,2 111,9 163,3 191,7 18,47 125,9 213,6 69,72
JUANDA (U)-SURABAYA 0,7 29,8 29,6 40,0 31,9 123,32 21,3 21,9 2,86
PELABUHAN LAINNYA/OTHER PORTS 8,8 12,5 18,5 17,2 21,0 22,90 9,0 4,3 -51,93
7108 Gold (including gold plated with platinum) unwrought or in semi-manufactured forms, or in
powder form
37,3 48,6 37,2 37,1 34,4 -4,23 21,6 36,8 69,93
SOEKARNO-HATTA (U) 22,5 28,4 31,1 37,1 34,4 11,84 21,6 36,8 69,93
HANG NADIM (U) 0,0 - 0,1 - - - - - -
JUANDA (U)-SURABAYA 14,8 12,7 6,0 - - - - - -
TANJUNG PRIOK - 7,5 - - - - - - -
- - - - - - - 0,0 0,0 -
PELABUHAN LAINNYA/OTHER PORTS - - - - - - 0,0 0,0 -
7112 Waste and scrap of precious metal or of metal clad with precious metal; other waste and
scrap containing precious metal compounds, of a kind uses principally for the recovery of
precious
1.193,7 1.427,2 1.491,4 1.363,2 1.454,7 3,56 1.053,4 1.001,2 -4,96
TANJUNG PERAK 1.189,0 1.408,6 1.485,0 1.317,1 1.441,8 3,24 1.045,9 987,3 -5,60
SOEKARNO-HATTA (U) 0,1 - 0,6 0,7 2,0 - 1,9 2,1 11,99
NGURAH RAI (U) 0,2 2,2 4,3 6,0 6,4 119,80 4,4 5,2 17,19
JUANDA (U)-SURABAYA - - - - 0,5 - 0,4 0,2 -53,67
TANJUNG PRIOK 4,4 14,0 1,4 39,4 4,0 8,33 0,9 6,4 632,51
PELABUHAN LAINNYA/OTHER PORTS 0,0 2,4 - 0,0 - - 0,0 0,0 -
7113 Jewellery articles and parts thereof, of precious metal or of metal clad with precious metal 95,0 111,1 205,9 194,3 245,1 27,83 180,4 167,0 -7,40
JUANDA (U)-SURABAYA 1,3 2,9 51,1 75,8 91,0 223,67 80,7 53,0 -34,31
SOEKARNO-HATTA (U) 25,0 52,7 80,1 51,0 53,0 15,82 35,3 43,4 22,81
NGURAH RAI (U) 51,9 48,1 65,5 56,3 96,1 14,95 61,3 68,4 11,67
HALIM PERDANA KUSUMA (U) 2,6 2,0 1,8 4,7 2,2 6,00 1,5 0,2 -87,34
TANJUNG PERAK 12,2 5,4 6,9 4,9 1,9 -31,84 0,8 1,6 114,93
PELABUHAN LAINNYA/OTHER PORTS 2,0 0,0 0,5 1,5 0,8 33,75 0,9 0,4 -53,79
7201 Pig iron and spiegeleisen in pigs, blocks or other primary forms 2.232,1 62.785,4 286.019,5 282.942,3 568.860,7 252,08 438.281,7 143.306,7 -67,30
KOLONEDALE - - - 101.000,0 383.000,0 - 296.000,0 90.000,0 -69,59
TANJUNG PRIOK 2.226,9 23.381,0 79.542,7 35.773,7 60.268,1 101,81 36.158,0 31.729,0 -12,25
PULAU GEBE - - - - 37.056,9 - 29.556,9 - -
MERAK 4,1 29.404,5 60.500,6 53.852,0 33.125,0 541,73 22.795,0 11.495,0 -49,57
CIGADING - - 109.676,8 89.037,1 46.301,1 - 44.662,1 10.082,7 -77,42
PELABUHAN LAINNYA/OTHER PORTS 1,1 10.000,0 36.299,3 3.279,6 9.109,7 445,71 9.109,7 0,0 -100,00
40

Lanjutan/Continued
Volume/Volume : TonNo. 08.05.148
2015 2016
2016 2017
20142012 2013
TABEL 15.1 : VOLUME EKSPOR 100 JENIS BARANG MENURUT PELABUHAN MUAT UTAMA
EXPORT VOLUME OF 100 COMMODITIES BY MAIN PORT OF EMBARKATION
JENIS BARANG
DESCRIPTION OF GOODS
Trend (%)
12-16
Jan-Ags/Jan-Aug Perub. (%)
Change (%)
17-16
7202 Ferro-alloys 101.683,9 85.071,7 122.492,8 202.604,6 432.346,4 45,68 187.467,8 862.113,2 359,87
KOLONEDALE - - - 96.000,0 293.000,0 - 109.000,0 612.630,8 462,05
POMALAA 78.330,0 63.180,8 76.831,1 43.743,8 52.195,0 -11,13 31.433,3 26.526,1 -15,61
TANJUNG PERAK 1.152,4 25,0 6.918,3 36.002,5 43.454,5 327,65 20.003,4 57.044,0 185,17
TANJUNG PRIOK 22.201,4 16.845,7 37.171,4 26.857,7 35.626,3 15,17 27.031,1 21.088,7 -21,98
GEBE - - - - 8.023,9 - - 16.100,1 -
PELABUHAN LAINNYA/OTHER PORTS 0,1 5.020,1 1.571,9 0,7 46,8 53,59 0,0 128.723,5 ###########
7308 Structures of iron or steel and parts thereof; plates, rods, angles, shapes, sections, tubes
and the like, prepared for use in structures
139.789,1 128.463,8 192.293,1 105.504,9 171.594,7 2,15 129.129,8 68.013,1 -47,33
KABIL/PANAU 12.018,3 18.065,3 16.692,8 4.825,8 33.410,3 7,52 22.612,4 4.432,9 -80,40
BATU AMPAR 31.011,2 31.529,6 70.110,3 16.588,4 36.696,2 -3,01 31.893,9 7.445,2 -76,66
TANJUNG LENENG 39.319,5 12.193,5 50.883,8 53.822,2 51.272,9 22,33 49.563,4 - -
SEKUPANG 19.644,7 24.713,2 12.859,8 7.133,6 12.975,3 -18,71 11.858,5 2.652,3 -77,63
CIWANDAN - - - 1.186,2 17.862,2 - 495,4 32.866,0 6534,23
PELABUHAN LAINNYA/OTHER PORTS 37.795,4 41.962,2 41.746,4 21.948,7 19.377,9 -18,00 12.706,2 20.616,8 62,26
7403 Copper; refined and copper alloys, unwrought 69.102,9 71.052,1 109.998,0 97.154,5 161.264,4 22,24 93.015,9 150.090,6 61,36
TANJUNG PERAK 68.773,8 70.462,4 109.947,2 96.988,7 160.664,5 22,34 92.719,8 148.561,1 60,23
TANJUNG PRIOK 110,8 576,5 13,4 146,4 579,9 21,40 277,0 1.419,3 412,43
TANJUNG EMAS 8,4 4,9 20,5 17,5 18,9 33,64 18,2 4,1 -77,66
NGURAH RAI (U) 0,0 0,1 0,2 0,9 0,2 126,36 0,1 0,1 -58,67
SOEKARNO-HATTA (U) 1,8 4,8 3,0 1,0 0,6 -31,14 0,6 0,4 -29,31
PELABUHAN LAINNYA/OTHER PORTS 208,0 3,3 13,6 0,1 0,3 -81,39 0,3 105,8 36889,86
7408 Copper wire 111.050,2 111.965,0 105.507,8 108.592,7 97.143,4 -2,94 63.699,3 71.173,6 11,73
TANJUNG PRIOK 111.015,8 111.893,6 105.447,5 108.548,2 97.118,7 -2,93 63.691,2 71.168,6 11,74
SOEKARNO-HATTA (U) 0,4 0,5 13,4 22,0 17,8 216,51 7,2 1,8 -75,10
TANJUNG UBAN 0,2 0,3 3,6 3,6 1,0 77,57 0,5 0,3 -46,55
TANJUNG PERAK 1,2 0,2 0,8 6,8 5,4 97,65 - - -
NGURAH RAI (U) 0,5 0,4 0,2 0,1 0,1 -36,00 0,1 - -
PELABUHAN LAINNYA/OTHER PORTS 32,1 70,1 42,4 12,0 0,5 -63,52 0,4 3,0 594,39
7501 Nickel mattes; nickel oxide sinters and other intermediate products of nickel metallurgy 91.024,3 96.602,3 99.363,4 103.794,8 98.530,6 2,33 62.714,2 78.257,9 24,79
BALANTANG/MALILI 2.809,1 - - 103.794,8 98.530,6 - 62.714,2 78.257,9 24,79
MALILI, SULAWESI 88.215,2 96.602,3 99.363,4 - - - - - -
- - - - - - - 0,0 0,0 -
- - - - - - - 0,0 0,0 -
- - - - - - - 0,0 0,0 -
PELABUHAN LAINNYA/OTHER PORTS - - - - - - 0,0 0,0 -
41

Lanjutan/Continued
Volume/Volume : TonNo. 08.05.148
2015 2016
2016 2017
20142012 2013
TABEL 15.1 : VOLUME EKSPOR 100 JENIS BARANG MENURUT PELABUHAN MUAT UTAMA
EXPORT VOLUME OF 100 COMMODITIES BY MAIN PORT OF EMBARKATION
JENIS BARANG
DESCRIPTION OF GOODS
Trend (%)
12-16
Jan-Ags/Jan-Aug Perub. (%)
Change (%)
17-16
8001 Tin; unwrought 101.237,0 88.441,5 70.484,8 69.804,1 61.874,9 -11,50 36.293,7 63.067,0 73,77
PANGKAL BALAM 51.392,8 46.698,5 43.349,9 39.940,1 40.471,1 -6,14 24.136,4 40.277,4 66,87
MUNTOK 21.591,0 12.900,1 13.772,4 19.123,3 12.690,0 -6,47 6.180,0 15.280,0 147,25
TANJUNG BALAI KARIMUN 8.445,0 11.450,8 8.904,9 10.310,0 8.713,8 -0,42 5.977,3 7.506,9 25,59
TANJUNG PERAK - - 1,3 - - - - - -
SEKUPANG 0,3 - - 0,0 - - - - -
PELABUHAN LAINNYA/OTHER PORTS 19.807,9 17.392,1 4.456,4 430,7 - - 0,0 2,7 -
8407 Reciprocating or rotary internal combustion piston engines 10.469,5 13.423,0 15.082,7 16.316,9 30.261,6 26,09 18.274,1 31.915,0 74,65
TANJUNG PRIOK 10.333,7 13.300,0 15.000,8 16.246,8 30.174,4 26,41 18.211,0 31.827,6 74,77
SOEKARNO-HATTA (U) 23,6 13,3 41,5 56,5 73,9 45,31 53,9 66,5 23,56
BELAWAN - - - 0,0 5,2 - 5,2 - -
TANJUNG PERAK 10,0 11,6 21,0 7,4 2,7 -26,55 0,3 11,8 4516,47
BATU AMPAR 3,0 60,2 0,0 1,2 3,7 -29,22 2,7 1,0 -63,71
PELABUHAN LAINNYA/OTHER PORTS 99,2 37,9 19,5 4,9 1,7 -63,88 1,1 8,1 638,58
8409 Parts suitable for use solely or principally with the engines of heading no. 8407 or 8408 36.776,1 46.928,2 38.221,5 42.996,5 43.000,7 2,28 28.833,6 45.903,0 59,20
TANJUNG PRIOK 35.262,4 45.248,3 36.833,0 41.469,1 41.511,3 2,42 27.950,6 44.646,6 59,73
SOEKARNO-HATTA (U) 393,3 459,5 326,5 277,6 337,6 -7,77 212,9 931,8 337,71
JUANDA (U)-SURABAYA 1,5 5,5 42,4 42,2 116,4 193,81 92,0 53,9 -41,38
TANJUNG PERAK 196,3 267,0 69,4 94,0 100,7 -21,18 52,8 88,0 66,46
TANJUNG EMAS 148,2 101,5 86,7 69,0 61,3 -19,35 46,8 57,2 22,20
PELABUHAN LAINNYA/OTHER PORTS 774,5 846,4 863,4 1.044,7 873,3 4,61 478,5 125,5 -73,78
8418 Refrigerators, freezers and other refrigerating or freezing equipment, electric or other; heat
pumps other than air conditioning machines of heading no. 8415
103.877,7 94.657,5 84.998,5 69.118,8 72.977,3 -9,70 49.077,0 65.055,1 32,56
TANJUNG PRIOK 96.619,3 89.039,9 80.238,4 64.743,8 68.094,1 -9,68 46.271,1 60.501,1 30,75
TANJUNG PERAK 2.702,6 2.683,2 2.315,2 2.666,4 3.457,2 4,98 2.011,4 3.169,8 57,59
TANJUNG EMAS 1.677,2 673,0 1.433,8 1.186,0 931,5 -5,91 625,2 1.041,3 66,55
BATU AMPAR 1.694,2 286,9 12,6 24,8 239,7 -47,06 7,0 61,1 766,75
SOEKARNO-HATTA (U) 53,4 58,9 181,0 66,8 48,4 -0,73 36,4 65,7 80,56
PELABUHAN LAINNYA/OTHER PORTS 1.130,9 1.915,5 817,4 430,9 206,5 -38,69 125,8 216,1 71,73
8419 Machinery, plant (not domestic), or laboratory equipment; electrically heated or not,
(excluding items in 85.14) for the treatment of materials by a process involving change of
4.592,2 8.033,6 24.553,5 19.691,4 36.048,6 65,16 29.828,0 4.580,4 -84,64
KABIL/PANAU 2.490,6 4.944,5 14.133,4 6.695,0 21.889,9 59,20 21.889,9 2.774,0 -87,33
BATU AMPAR 543,2 700,8 433,9 857,0 10.182,6 83,36 6.175,3 128,6 -97,92
TANJUNG PRIOK 851,6 832,1 1.172,9 1.383,4 2.717,4 32,70 979,7 794,6 -18,89
SEKUPANG 32,3 1,4 4.604,5 16,7 227,2 89,65 0,8 4,9 541,04
TANJUNG PERAK 571,4 502,7 189,0 961,8 747,0 12,58 602,5 668,0 10,87
PELABUHAN LAINNYA/OTHER PORTS 103,1 1.052,2 4.019,7 9.777,6 284,5 53,10 179,8 210,4 17,03
42

Lanjutan/Continued
Volume/Volume : TonNo. 08.05.148
2015 2016
2016 2017
20142012 2013
TABEL 15.1 : VOLUME EKSPOR 100 JENIS BARANG MENURUT PELABUHAN MUAT UTAMA
EXPORT VOLUME OF 100 COMMODITIES BY MAIN PORT OF EMBARKATION
JENIS BARANG
DESCRIPTION OF GOODS
Trend (%)
12-16
Jan-Ags/Jan-Aug Perub. (%)
Change (%)
17-16
8443 Printing machinery; used for printing by means of plates, cylinders and other printing
components of heading 84.42; other printers, copying machines and facsimile machines,
whether or not textile, lea
86.381,8 69.349,3 79.203,2 75.895,8 72.294,9 -2,62 44.075,8 66.828,8 51,62
TANJUNG PRIOK 78.887,4 60.995,6 68.698,3 65.302,6 67.304,7 -2,46 40.755,9 58.797,9 44,27
SEKUPANG 3.097,3 4.563,0 5.622,9 8.893,5 3.890,5 11,89 2.818,1 3.854,0 36,76
SOEKARNO-HATTA (U) 1.855,3 553,2 3.759,0 1.146,1 747,8 -10,32 289,0 3.846,9 1231,19
BATU AMPAR 2.291,0 2.943,8 727,8 263,8 141,3 -55,00 56,6 111,3 96,60
TANJUNG PERAK 149,0 186,7 194,6 206,1 148,7 0,95 105,8 82,4 -22,10
PELABUHAN LAINNYA/OTHER PORTS 101,9 107,0 200,6 83,7 61,9 -11,69 50,3 136,3 171,00
8471 Automatic data processing machines and units thereof, magnetic or optical readers,
machines for transcribing data onto data media in coded form and machines for
12.660,2 9.271,6 11.271,0 7.085,4 6.636,7 -14,45 4.161,6 5.314,1 27,69
SEKUPANG 3.296,3 2.102,7 2.643,0 2.571,6 3.139,2 1,04 1.838,1 2.604,3 41,69
BATU AMPAR 7.367,7 5.697,3 6.909,8 3.011,6 2.550,9 -24,11 1.709,8 1.882,3 10,09
SOEKARNO-HATTA (U) 134,5 327,5 449,8 413,4 355,5 24,31 211,2 304,4 44,09
TANJUNG PRIOK 1.520,5 973,7 858,8 933,0 437,9 -22,37 316,8 398,6 25,82
HANG NADIM (U) 8,3 8,9 42,0 30,4 28,4 44,53 20,3 75,3 271,72
PELABUHAN LAINNYA/OTHER PORTS 332,9 161,7 367,5 125,5 124,9 -19,86 65,4 49,1 -24,86
8504 Electric transformers, static converters (e.g. rectifiers) and inductors 27.654,4 21.835,0 20.298,5 20.819,8 19.030,7 -7,64 11.523,4 33.431,3 190,12
TANJUNG PRIOK 18.757,9 12.822,5 10.691,3 13.461,6 8.331,8 -14,57 5.500,1 7.899,5 43,63
SEKUPANG 2.379,9 3.725,1 4.079,0 4.542,9 3.953,6 12,90 2.639,3 2.689,0 1,88
BATU AMPAR 2.992,1 1.233,5 1.225,3 1.388,3 1.863,3 -7,96 1.224,5 2.213,1 80,73
SOEKARNO-HATTA (U) 853,0 896,8 420,7 450,0 577,0 -13,68 335,5 551,3 64,32
BELAWAN 0,3 12,3 40,0 266,7 984,5 593,99 566,3 154,9 -72,64
PELABUHAN LAINNYA/OTHER PORTS 2.671,2 3.144,8 3.842,2 710,3 3.320,5 -9,99 1.257,6 19.923,5 1484,28
8506 Cells and batteries; primary 62.677,1 62.038,7 64.610,6 67.032,4 59.844,0 -0,15 39.548,8 49.955,4 26,31
TANJUNG PRIOK 61.281,5 60.161,8 61.676,1 63.897,3 56.823,2 -0,90 37.561,5 47.256,7 25,81
BATU AMPAR 65,7 59,8 218,5 817,5 911,0 119,81 635,6 620,8 -2,32
SEKUPANG 692,1 1.365,5 1.754,2 1.428,4 1.444,1 16,37 976,4 1.689,7 73,05
SOEKARNO-HATTA (U) 426,6 343,2 733,0 733,3 347,7 3,56 174,1 122,5 -29,66
BELAWAN 46,7 7,8 5,0 56,7 210,3 64,70 138,5 166,1 19,88
PELABUHAN LAINNYA/OTHER PORTS 164,6 100,6 223,7 99,2 107,6 -8,28 62,6 99,5 58,99
8507 Electric accumulators, including separators therefor; whether or not rectangular (including
square)
100.084,3 84.267,3 76.086,3 86.514,0 94.749,7 -0,83 59.175,6 76.619,5 29,48
TANJUNG PRIOK 81.384,6 68.672,6 62.172,7 72.657,3 80.947,2 0,46 50.231,7 66.771,2 32,93
BATU AMPAR 996,5 1.151,5 984,7 693,9 827,9 -8,40 589,0 38,0 -93,55
TANJUNG PERAK 17.312,3 14.098,8 12.798,8 12.022,1 12.755,8 -7,41 8.204,3 9.741,4 18,73
SEKUPANG 341,9 273,3 65,0 118,5 143,4 -22,69 101,9 9,8 -90,36
SOEKARNO-HATTA (U) 8,6 12,0 13,2 17,7 35,7 38,35 27,1 33,8 25,08
PELABUHAN LAINNYA/OTHER PORTS 40,5 59,0 51,9 1.004,4 39,7 32,22 21,5 25,3 17,24
43
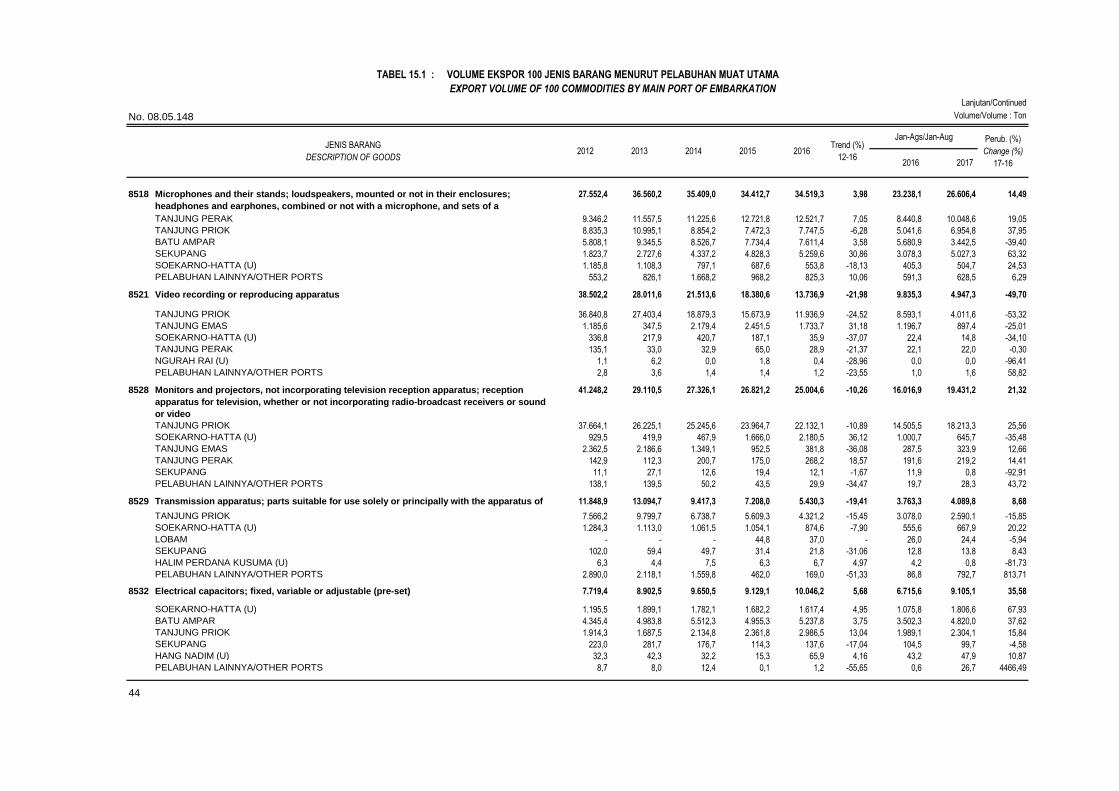
Lanjutan/Continued
Volume/Volume : TonNo. 08.05.148
2015 2016
2016 2017
20142012 2013
TABEL 15.1 : VOLUME EKSPOR 100 JENIS BARANG MENURUT PELABUHAN MUAT UTAMA
EXPORT VOLUME OF 100 COMMODITIES BY MAIN PORT OF EMBARKATION
JENIS BARANG
DESCRIPTION OF GOODS
Trend (%)
12-16
Jan-Ags/Jan-Aug Perub. (%)
Change (%)
17-16
8518 Microphones and their stands; loudspeakers, mounted or not in their enclosures;
headphones and earphones, combined or not with a microphone, and sets of a
microphone and one or more
27.552,4 36.560,2 35.409,0 34.412,7 34.519,3 3,98 23.238,1 26.606,4 14,49
TANJUNG PERAK 9.346,2 11.557,5 11.225,6 12.721,8 12.521,7 7,05 8.440,8 10.048,6 19,05
TANJUNG PRIOK 8.835,3 10.995,1 8.854,2 7.472,3 7.747,5 -6,28 5.041,6 6.954,8 37,95
BATU AMPAR 5.808,1 9.345,5 8.526,7 7.734,4 7.611,4 3,58 5.680,9 3.442,5 -39,40
SEKUPANG 1.823,7 2.727,6 4.337,2 4.828,3 5.259,6 30,86 3.078,3 5.027,3 63,32
SOEKARNO-HATTA (U) 1.185,8 1.108,3 797,1 687,6 553,8 -18,13 405,3 504,7 24,53
PELABUHAN LAINNYA/OTHER PORTS 553,2 826,1 1.668,2 968,2 825,3 10,06 591,3 628,5 6,29
8521 Video recording or reproducing apparatus 38.502,2 28.011,6 21.513,6 18.380,6 13.736,9 -21,98 9.835,3 4.947,3 -49,70
TANJUNG PRIOK 36.840,8 27.403,4 18.879,3 15.673,9 11.936,9 -24,52 8.593,1 4.011,6 -53,32
TANJUNG EMAS 1.185,6 347,5 2.179,4 2.451,5 1.733,7 31,18 1.196,7 897,4 -25,01
SOEKARNO-HATTA (U) 336,8 217,9 420,7 187,1 35,9 -37,07 22,4 14,8 -34,10
TANJUNG PERAK 135,1 33,0 32,9 65,0 28,9 -21,37 22,1 22,0 -0,30
NGURAH RAI (U) 1,1 6,2 0,0 1,8 0,4 -28,96 0,0 0,0 -96,41
PELABUHAN LAINNYA/OTHER PORTS 2,8 3,6 1,4 1,4 1,2 -23,55 1,0 1,6 58,82
8528 Monitors and projectors, not incorporating television reception apparatus; reception
apparatus for television, whether or not incorporating radio-broadcast receivers or sound
or video
41.248,2 29.110,5 27.326,1 26.821,2 25.004,6 -10,26 16.016,9 19.431,2 21,32
TANJUNG PRIOK 37.664,1 26.225,1 25.245,6 23.964,7 22.132,1 -10,89 14.505,5 18.213,3 25,56
SOEKARNO-HATTA (U) 929,5 419,9 467,9 1.666,0 2.180,5 36,12 1.000,7 645,7 -35,48
TANJUNG EMAS 2.362,5 2.186,6 1.349,1 952,5 381,8 -36,08 287,5 323,9 12,66
TANJUNG PERAK 142,9 112,3 200,7 175,0 268,2 18,57 191,6 219,2 14,41
SEKUPANG 11,1 27,1 12,6 19,4 12,1 -1,67 11,9 0,8 -92,91
PELABUHAN LAINNYA/OTHER PORTS 138,1 139,5 50,2 43,5 29,9 -34,47 19,7 28,3 43,72
8529 Transmission apparatus; parts suitable for use solely or principally with the apparatus of
heading no. 8525 to 8528
11.848,9 13.094,7 9.417,3 7.208,0 5.430,3 -19,41 3.763,3 4.089,8 8,68
TANJUNG PRIOK 7.566,2 9.799,7 6.738,7 5.609,3 4.321,2 -15,45 3.078,0 2.590,1 -15,85
SOEKARNO-HATTA (U) 1.284,3 1.113,0 1.061,5 1.054,1 874,6 -7,90 555,6 667,9 20,22
LOBAM - - - 44,8 37,0 - 26,0 24,4 -5,94
SEKUPANG 102,0 59,4 49,7 31,4 21,8 -31,06 12,8 13,8 8,43
HALIM PERDANA KUSUMA (U) 6,3 4,4 7,5 6,3 6,7 4,97 4,2 0,8 -81,73
PELABUHAN LAINNYA/OTHER PORTS 2.890,0 2.118,1 1.559,8 462,0 169,0 -51,33 86,8 792,7 813,71
8532 Electrical capacitors; fixed, variable or adjustable (pre-set) 7.719,4 8.902,5 9.650,5 9.129,1 10.046,2 5,68 6.715,6 9.105,1 35,58
SOEKARNO-HATTA (U) 1.195,5 1.899,1 1.782,1 1.682,2 1.617,4 4,95 1.075,8 1.806,6 67,93
BATU AMPAR 4.345,4 4.983,8 5.512,3 4.955,3 5.237,8 3,75 3.502,3 4.820,0 37,62
TANJUNG PRIOK 1.914,3 1.687,5 2.134,8 2.361,8 2.986,5 13,04 1.989,1 2.304,1 15,84
SEKUPANG 223,0 281,7 176,7 114,3 137,6 -17,04 104,5 99,7 -4,58
HANG NADIM (U) 32,3 42,3 32,2 15,3 65,9 4,16 43,2 47,9 10,87
PELABUHAN LAINNYA/OTHER PORTS 8,7 8,0 12,4 0,1 1,2 -55,65 0,6 26,7 4466,49
44

Lanjutan/Continued
Volume/Volume : TonNo. 08.05.148
2015 2016
2016 2017
20142012 2013
TABEL 15.1 : VOLUME EKSPOR 100 JENIS BARANG MENURUT PELABUHAN MUAT UTAMA
EXPORT VOLUME OF 100 COMMODITIES BY MAIN PORT OF EMBARKATION
JENIS BARANG
DESCRIPTION OF GOODS
Trend (%)
12-16
Jan-Ags/Jan-Aug Perub. (%)
Change (%)
17-16
8536 Electrical apparatus for switching, protecting electrical circuits, for making connections to
or in electrical circuits, for a voltage not exceeding 1000 volts; connectors for optical
fibres, optical
13.395,4 13.752,5 13.021,1 12.792,6 15.567,3 2,31 10.697,1 12.834,1 19,98
TANJUNG PRIOK 4.829,6 4.957,1 5.133,5 5.062,9 6.761,7 7,19 4.392,5 5.721,3 30,25
SEKUPANG 3.189,1 5.905,1 4.170,4 3.593,5 4.985,6 4,05 3.459,3 3.984,6 15,19
SOEKARNO-HATTA (U) 2.048,5 1.266,2 1.025,0 1.201,6 994,8 -13,90 622,0 1.140,8 83,41
LOBAM - - - 592,8 453,9 - 263,6 501,5 90,23
BATU AMPAR 2.463,5 892,9 1.921,2 2.028,2 2.142,9 5,57 1.820,8 1.296,9 -28,77
PELABUHAN LAINNYA/OTHER PORTS 864,7 731,2 771,0 313,6 228,3 -29,60 139,0 189,0 35,99
8542 Electronic integrated circuits 1.793,6 1.757,0 1.458,8 1.223,1 1.117,9 -12,26 753,8 968,9 28,52
BATU AMPAR 563,5 631,0 461,6 452,7 319,0 -13,67 212,4 291,7 37,31
SEKUPANG 198,9 203,6 194,8 303,0 258,0 9,61 161,4 219,2 35,79
LOBAM - - - 155,1 102,2 - 83,1 64,4 -22,46
SOEKARNO-HATTA (U) 231,7 85,7 88,1 87,3 82,4 -18,53 58,4 67,0 14,76
HANG NADIM (U) 646,6 420,4 378,8 170,3 317,8 -20,74 211,1 248,1 17,56
PELABUHAN LAINNYA/OTHER PORTS 152,9 416,4 335,5 54,6 38,5 -38,05 27,4 78,4 185,81
8544 Insulated wire, cable and other electric conductors, connector fitted or not; optical fibre
cables of individually sheathed fibres, whether or not assembled with electric conductors
or fitted with
86.114,0 92.520,9 88.351,4 94.629,5 94.928,7 2,20 63.215,8 75.510,9 19,45
TANJUNG PRIOK 45.184,7 46.176,4 45.364,6 51.526,0 48.986,5 2,75 33.591,9 32.504,0 -3,24
TANJUNG PERAK 15.269,4 18.346,5 16.522,2 18.094,0 19.880,0 5,27 13.092,4 19.305,8 47,46
TANJUNG EMAS 5.683,3 6.034,8 6.827,3 7.970,7 10.373,2 15,97 5.968,2 11.013,2 84,53
BATU AMPAR 16.033,9 15.467,0 10.204,2 12.898,8 12.579,4 -6,45 8.471,5 10.095,6 19,17
SOEKARNO-HATTA (U) 1.458,4 1.393,2 1.276,7 1.074,2 1.031,3 -9,09 604,7 825,5 36,52
PELABUHAN LAINNYA/OTHER PORTS 2.484,3 5.103,0 8.156,3 3.065,7 2.078,4 -8,30 1.487,1 1.766,7 18,81
8703 Motor cars and other motor vehicles; principally designed for the transport of persons
(other than those of heading no. 8702), including station wagons and racing cars
226.361,1 209.046,1 273.825,6 270.594,9 283.160,3 7,31 176.597,3 290.625,1 64,57
TANJUNG PRIOK 225.751,3 207.931,6 271.156,2 266.622,6 280.325,9 7,05 174.335,5 288.958,5 65,75
TANJUNG PERAK 488,9 836,1 1.847,0 3.273,4 2.316,5 56,46 1.923,6 1.262,0 -34,39
BATU AMPAR 3,6 63,2 9,9 18,4 21,3 26,14 12,6 8,0 -36,46
ATAPUPU 27,5 93,7 640,0 564,1 434,6 107,90 296,7 243,7 -17,84
SOEKARNO-HATTA (U) 53,0 62,4 71,9 93,5 28,6 -7,93 15,9 41,4 160,25
PELABUHAN LAINNYA/OTHER PORTS 36,9 59,2 100,6 23,0 33,3 -10,90 13,0 111,4 760,02
8708 Motor vehicles; parts and accessories, of heading no. 8701 to 8705 178.468,4 186.263,0 199.995,6 235.292,4 258.462,4 10,23 168.435,6 222.430,6 32,06
TANJUNG PRIOK 126.779,7 136.475,8 147.255,3 183.024,8 208.571,5 13,76 135.549,4 177.712,4 31,11
TANJUNG PERAK 49.547,1 47.738,7 48.765,5 48.684,5 44.485,6 -1,94 30.716,5 40.825,3 32,91
SOEKARNO-HATTA (U) 1.376,6 1.073,5 2.108,8 1.725,2 2.128,8 14,41 1.202,0 1.455,0 21,05
NGURAH RAI (U) 0,1 0,0 0,1 0,7 1.325,0 1040,84 2,3 260,1 11279,66
JUANDA (U)-SURABAYA 61,3 152,8 160,3 649,9 952,2 100,07 265,0 479,1 80,80
PELABUHAN LAINNYA/OTHER PORTS 703,6 822,2 1.705,5 1.207,2 999,2 11,47 700,4 1.698,5 142,49
45

Lanjutan/Continued
Volume/Volume : TonNo. 08.05.148
2015 2016
2016 2017
20142012 2013
TABEL 15.1 : VOLUME EKSPOR 100 JENIS BARANG MENURUT PELABUHAN MUAT UTAMA
EXPORT VOLUME OF 100 COMMODITIES BY MAIN PORT OF EMBARKATION
JENIS BARANG
DESCRIPTION OF GOODS
Trend (%)
12-16
Jan-Ags/Jan-Aug Perub. (%)
Change (%)
17-16
8711 Motorcycles (including mopeds) and cycles; fitted with an auxiliary motor, with or without
side-cars; side-cars
19.935,9 13.196,7 15.030,8 36.653,9 42.504,6 28,86 27.792,5 55.778,7 100,70
TANJUNG PRIOK 19.329,8 12.557,6 14.343,4 35.527,9 41.093,7 29,03 26.994,9 52.850,1 95,78
TANJUNG PERAK 530,9 531,6 581,0 901,3 1.292,4 25,95 726,0 2.783,7 283,42
SOEKARNO-HATTA (U) 47,3 68,0 76,3 89,3 69,5 10,99 38,3 70,4 83,79
BATU AMPAR 2,1 3,6 0,7 8,6 8,4 43,72 6,6 2,5 -61,32
TANJUNG EMAS 19,2 10,3 6,3 9,9 9,5 -13,45 9,2 60,9 559,35
PELABUHAN LAINNYA/OTHER PORTS 6,6 25,5 23,1 116,8 31,2 58,81 17,6 11,1 -36,71
8714 Vehicles; parts and accessories of heading no. 8711 to 8713 48.281,7 48.609,8 51.403,4 51.504,4 56.918,8 3,95 36.502,1 58.138,9 59,28
TANJUNG PRIOK 23.387,4 30.302,3 27.776,3 30.781,4 39.989,9 11,50 25.299,8 43.315,3 71,21
SEKUPANG 21.352,3 17.175,2 17.091,7 15.890,2 13.502,8 -9,46 8.689,7 13.059,0 50,28
SOEKARNO-HATTA (U) 887,9 705,8 672,0 485,8 927,1 -2,83 605,9 810,7 33,81
BATU AMPAR 1.854,2 16,1 5.367,6 3.870,2 2.052,9 76,57 1.625,8 384,8 -76,33
TANJUNG PERAK 613,6 197,4 241,8 227,7 165,3 -21,96 104,6 108,2 3,43
PELABUHAN LAINNYA/OTHER PORTS 186,3 213,0 254,0 249,2 280,8 10,27 176,4 460,9 161,31
9401 Seats (not those of heading no. 9402), whether or not convertible into beds and parts thereof 134.861,0 120.314,6 113.959,8 110.133,5 108.028,2 -5,18 72.999,2 81.179,1 11,21
TANJUNG EMAS 82.312,3 66.595,5 58.081,5 50.253,2 49.291,9 -12,25 34.236,5 36.803,4 7,50
TANJUNG PRIOK 36.094,6 33.249,9 35.155,3 34.893,6 35.930,9 0,39 23.741,1 30.425,8 28,16
TANJUNG PERAK 13.227,3 16.978,4 17.515,0 21.676,6 19.600,1 10,86 13.037,1 11.669,1 -10,49
BELAWAN 2.056,5 2.502,0 2.193,4 2.534,6 2.255,5 2,00 1.350,6 1.679,2 24,32
SOEKARNO-HATTA (U) 57,7 96,5 167,0 182,5 246,1 42,44 146,7 107,9 -26,44
PELABUHAN LAINNYA/OTHER PORTS 1.112,5 892,3 847,6 593,0 703,8 -12,40 487,0 493,8 1,40
9403 Furniture and parts thereof, n.e.c. in chapter 94 466.104,8 437.318,8 445.423,7 395.785,9 360.964,4 -5,93 238.402,7 297.761,8 24,90
TANJUNG EMAS 105.849,1 118.683,8 134.098,7 134.916,8 127.847,9 5,19 85.613,6 105.773,7 23,55
TANJUNG PERAK 174.644,7 150.143,6 155.119,5 135.889,5 120.450,3 -8,08 79.650,3 101.369,9 27,27
TANJUNG PRIOK 134.410,3 115.759,0 104.488,1 82.915,5 70.702,1 -14,94 45.691,3 61.317,7 34,20
BELAWAN 18.516,1 19.702,0 15.884,5 13.763,4 14.998,9 -7,50 10.065,6 8.904,1 -11,54
BATU AMPAR 27.534,0 27.618,3 24.752,0 24.350,4 22.206,4 -5,41 14.462,4 16.776,0 16,00
PELABUHAN LAINNYA/OTHER PORTS 5.150,6 5.412,2 11.080,8 3.950,4 4.758,8 -4,62 2.919,6 3.620,3 24,00
9503 Tricycles, scooters, pedal cars and similar wheeled toys; dolls' carriages; dolls; other toys;
reduced-size (scale) models and similar recreational models, working or not; puzzles of all
kinds
30.713,5 34.320,9 27.894,8 28.015,6 22.602,1 -7,84 15.210,0 22.615,2 48,69
TANJUNG PRIOK 25.828,1 30.545,1 24.774,2 24.467,5 19.066,1 -7,96 12.959,0 19.273,2 48,72
BATU AMPAR 22,5 203,0 279,7 651,7 710,4 124,18 532,7 478,2 -10,23
TANJUNG PERAK 2.863,2 2.681,4 1.939,1 2.061,0 2.116,5 -8,31 1.299,0 2.040,8 57,10
SEKUPANG 1.175,9 452,4 297,3 173,6 229,9 -34,44 151,2 76,7 -49,30
SOEKARNO-HATTA (U) 697,4 294,2 535,7 558,0 382,6 -5,46 205,9 677,5 229,14
PELABUHAN LAINNYA/OTHER PORTS 126,4 144,8 68,9 103,9 96,6 -8,33 62,2 68,8 10,60
Sumber/Source : Badan Pusat Statistik (diolah, Pusat Data dan Sistem Informasi, Kementerian Perdagangan)/Central Board of Statistics (processed by Trade Data Centre, Ministry of Trade)
46

No. 08.05.148 Nilai/Value : Juta/Million US$
IMPOR 191.689,5 186.628,7 178.178,8 142.694,8 135.652,9 -9,15 87.396,2 99.681,4 14,06
I. BARANG KONSUMSI 13.408,6 13.138,9 12.667,2 10.876,5 12.351,7 -3,47 8.118,1 9.072,7 11,76
1. Makanan dan Minuman (Belum diolah) Untuk Rumah Tangga 1.541,4 1.385,6 1.542,3 1.319,5 1.733,5 1,88 1.108,3 1.409,4 27,17
2. Makanan dan Minuman (Olahan) Untuk Rumah Tangga 2.836,9 2.443,0 2.755,1 2.343,4 3.016,3 0,81 2.029,1 1.886,7 -7,02
3. Bahan Bakar dan Pelumas 1.435,3 1.350,9 1.222,9 579,5 446,1 -27,27 277,2 412,7 48,89
4. Mobil Penumpang 1.515,3 1.192,4 783,7 583,1 595,0 -22,78 420,5 410,8 -2,30
5. Alat Angkutan bukan unt. Industri 350,3 386,1 267,0 243,4 142,2 -20,26 88,5 110,8 25,17
6. Barang Konsumsi tahan lama 1.584,7 1.599,5 1.418,3 1.076,1 1.209,0 -8,95 767,6 871,2 13,49
7. Barang Konsumsi setengah tahan lama 1.953,9 2.164,0 1.993,8 1.974,8 2.229,8 1,74 1.420,2 1.699,4 19,66
8. Barang Konsumsi tidak tahan lama 1.926,5 2.165,1 2.150,6 2.019,9 2.154,3 1,55 1.413,5 1.591,1 12,56
9. Barang yang tidak diklasifikasikan 264,4 452,2 533,6 736,8 825,5 31,86 593,2 680,7 14,75
II. BAHAN BAKU PENOLONG 140.126,0 141.957,9 136.208,6 107.081,0 100.945,9 -8,95 65.084,2 75.124,8 15,43
1. Makanan dan Minuman (Belum diolah) Untuk Industri 4.101,0 4.354,4 4.935,4 4.100,2 4.426,4 0,93 3.055,9 3.434,2 12,38
2. Makanan dan Minuman (Olahan) Untuk Industri 3.349,3 3.685,2 3.247,0 2.730,4 3.460,2 -2,32 1.968,8 2.341,9 18,95
3. Bahan Baku (Belum diolah) Untuk Industri 5.639,7 6.299,3 6.001,7 4.672,8 4.017,8 -9,31 2.636,6 3.154,5 19,64
4. Bahan Baku (Olahan) Untuk Industri 59.437,0 58.353,6 57.171,7 50.845,9 48.621,2 -5,25 31.676,5 35.360,8 11,63
5. Bahan Bakar dan Pelumas (Belum Diolah) 10.853,3 13.673,1 13.369,3 8.350,0 7.054,9 -12,67 4.669,2 4.822,6 3,29
6. Bahan Bakar Motor 14.061,7 14.839,2 15.006,1 8.604,3 5.795,2 -20,69 3.621,4 4.988,6 37,75
7. Bahan Bakar dan Pelumas (Olahan) 15.835,5 14.977,2 13.733,4 7.011,2 5.589,6 -24,74 3.509,1 5.517,0 57,22
8. Suku Cadang dan Perlengkapan Barang Modal 18.126,1 16.803,3 15.679,3 14.598,9 15.590,5 -4,32 9.797,3 10.811,1 10,35
9. Suku Cadang dan Perlengkapan Alat Angkutan 8.722,3 8.972,6 7.064,6 6.167,5 6.390,0 -9,49 4.149,4 4.694,1 13,13
III. BARANG MODAL 38.154,8 31.531,9 29.303,0 24.737,3 22.355,3 -12,29 14.193,9 15.483,8 9,09
1. Barang Modal Kecuali Alat Angkutan 26.659,3 26.128,2 25.661,9 22.326,7 19.896,8 -7,16 12.667,7 13.103,9 3,44
2. Mobil Penumpang 1.515,3 1.192,4 783,7 583,1 595,0 -22,78 420,5 410,8 -2,30
3. Alat Angkutan Untuk Industri 9.980,2 4.211,3 2.857,4 1.827,5 1.863,4 -34,24 1.105,7 1.969,1 78,08
Sumber/Source : Badan Pusat Statistik (diolah, Pusat Data Perdagangan, Dep. Perdagangan)/Central Board of Statistics (processed by Trade Data Centre, Ministry of Trade)
99
2012 2013 2015
TABEL 16 : RINGKASAN PERKEMBANGAN NILAI IMPOR MENURUT GOLONGAN BARANG EKONOMI
2016
Jan-Ags/Jan-Aug
SUMMARY OF IMPORT VALUE DEVELOPMENT BY ECONOMY CATEGORIES
2014JENIS BARANG/
DESCRIPTION OF GOODS
Trend (%)
12-16
Perub. (%)
Change (% )
17-162016 2017

No. 08.05.148 Volume : (000) Ton
IMPOR 136.283,6 141.109,6 147.734,3 147.093,3 152.025,5 2,64 101.031,8 103.894,4 2,83
I. BARANG KONSUMSI 6.966,7 5.285,7 5.599,1 4.929,2 5.899,6 -3,94 4.151,3 3.589,5 -13,53
1. Makanan dan Minuman (Belum diolah) Untuk Rumah Tangga 1.681,5 1.352,9 1.465,2 1.212,0 1.313,6 -5,86 864,4 1.020,6 18,07
2. Makanan dan Minuman (Olahan) Untuk Rumah Tangga 2.519,9 1.279,0 1.697,0 1.670,9 2.374,2 1,49 1.860,9 970,6 -47,84
3. Bahan Bakar dan Pelumas 1.436,2 1.413,3 1.341,7 1.021,2 998,2 -9,99 635,3 770,5 21,28
4. Mobil Penumpang 125,1 108,3 72,8 57,2 56,4 -20,00 40,4 39,0 -3,45
5. Alat Angkutan bukan unt. Industri 66,9 86,0 58,4 35,8 31,0 -21,46 21,9 24,2 10,43
6. Barang Konsumsi tahan lama 283,5 289,0 257,5 229,1 260,7 -3,92 164,4 172,6 5,05
7. Barang Konsumsi setengah tahan lama 430,7 416,1 372,1 371,5 496,7 1,73 322,3 336,5 4,41
8. Barang Konsumsi tidak tahan lama 389,0 331,7 327,9 323,8 360,3 -1,76 235,3 249,2 5,90
9. Barang yang tidak diklasifikasikan 34,0 9,3 6,5 7,7 8,5 -25,73 6,4 6,3 -2,02
II. BAHAN BAKU PENOLONG 124.955,5 132.395,6 138.827,8 139.139,6 142.586,2 3,19 94.936,0 98.063,7 3,29
1. Makanan dan Minuman (Belum diolah) Untuk Industri 8.565,5 9.026,4 10.067,2 10.183,6 13.338,0 10,59 9.288,0 9.694,9 4,38
2. Makanan dan Minuman (Olahan) Untuk Industri 4.558,3 4.935,2 4.502,7 4.818,6 6.468,9 7,00 3.989,4 4.050,4 1,53
3. Bahan Baku (Belum diolah) Untuk Industri 16.528,3 20.431,0 23.163,0 22.644,0 20.463,8 5,44 13.462,5 14.942,0 10,99
4. Bahan Baku (Olahan) Untuk Industri 50.329,5 48.510,5 49.892,0 50.431,7 50.249,2 0,36 33.684,0 33.538,9 -0,43
5. Bahan Bakar dan Pelumas (Belum Diolah) 12.656,7 16.534,6 18.458,8 21.540,8 23.497,8 16,21 15.975,4 14.269,4 -10,68
6. Bahan Bakar Motor 13.276,4 14.649,4 14.934,0 14.150,9 12.502,9 -1,53 8.158,9 9.042,5 10,83
7. Bahan Bakar dan Pelumas (Olahan) 16.169,1 16.091,6 15.654,3 13.413,8 13.996,5 -4,60 9.071,6 11.190,9 23,36
8. Suku Cadang dan Perlengkapan Barang Modal 1.912,4 1.223,7 1.201,3 1.150,5 1.143,2 -10,33 733,7 728,4 -0,72
9. Suku Cadang dan Perlengkapan Alat Angkutan 959,1 993,1 954,4 805,8 925,8 -2,76 572,5 606,3 5,90
III. BARANG MODAL 4.361,4 3.428,2 3.307,3 3.024,5 3.539,8 -5,28 1.944,5 2.241,2 15,26
1. Barang Modal Kecuali Alat Angkutan 2.614,9 2.432,6 2.479,0 2.411,1 2.403,8 -1,76 1.452,7 1.476,3 1,63
2. Mobil Penumpang 125,1 108,3 72,8 57,2 56,4 -20,00 40,4 39,0 -3,45
3. Alat Angkutan Untuk Industri 1.621,4 887,3 755,5 556,3 1.079,6 -12,02 451,4 725,9 60,80
Sumber/Source : Badan Pusat Statistik (diolah, Pusat Data & Informasi Perdagangan, Kem. Perdagangan)/Central Board of Statistics (processed by Trade Information & Data Centre, Ministry of Trade)
100
TABEL 16.1 : RINGKASAN PERKEMBANGAN VOLUME IMPOR MENURUT GOLONGAN BARANG EKONOMI
SUMMARY OF IMPORT VOLUME DEVELOPMENT BY ECONOMY CATEGORIES
JENIS BARANG
DESCRIPTION OF GOODS
Jan-Ags/Jan-Aug Perub. (%)
Change (%)
17-162016 2017
2012 2013 2014 2015 2016Trend (%)
12-16

Lanjutan/Continued
Nilai/Value : Ribu/Thousand US$
0102 Bovine animals; live 285.911,6 341.429,6 682.130,0 545.576,2 601.463,2 21,60 379.743,5 429.271,0 13,04
0202 Meat of bovine animals; frozen 127.714,9 189.415,4 318.469,8 215.119,4 447.061,4 30,12 207.578,7 346.509,6 66,93
0402 Milk and cream; concentrated or containing added sugar or other sweetening matter 710.108,3 851.443,8 896.847,2 511.921,8 459.286,1 -12,89 282.403,8 418.228,3 48,10
0703 Onions, shallots, garlic, leeks and other alliaceous vegetables; fresh or chilled 310.016,0 428.921,0 414.190,7 368.735,1 482.960,0 7,63 295.107,9 504.881,4 71,08
0806 Grapes; fresh or dried 126.866,0 105.192,8 154.776,4 144.296,2 201.573,0 13,23 99.920,2 183.905,7 84,05
0808 Apples, pears and quinces; fresh 275.309,0 284.842,3 278.871,4 235.985,4 373.909,3 4,33 208.539,5 406.337,7 94,85
1001 Wheat and meslin 2.253.850,2 2.439.986,7 2.387.262,2 2.082.767,8 2.408.209,8 -0,26 1.669.479,5 2.221.612,9 33,07
1005 Maize (corn) 501.898,3 918.889,6 810.417,2 696.646,8 230.922,8 -16,72 168.932,0 92.370,6 -45,32
1006 Rice 945.623,2 246.002,1 388.178,5 351.602,1 531.841,6 -7,63 464.186,9 102.435,6 -77,93
1108 Starches; inulin 413.100,8 169.080,0 235.342,1 370.479,9 323.254,3 2,98 242.325,7 196.146,1 -19,06
1201 Soya beans, whether or not broken 1.211.230,0 1.101.562,5 1.176.923,0 1.034.366,6 959.041,1 -5,16 682.673,4 1.013.681,9 48,49
1202 Ground-nuts; not roasted or otherwise cooked, whether or not shelled or broken 218.285,6 332.256,4 284.615,2 204.312,3 193.959,5 -6,97 141.164,3 231.403,9 63,93
1701 Cane or beet sugar and chemically pure sucrose, in solid form 1.662.271,1 1.730.656,9 1.328.935,6 1.256.038,0 2.090.125,5 1,38 1.148.748,6 1.729.271,3 50,54
1702 Sugars, including lactose, maltose, glucose or fructose in solid form; sugar syrups without added flavouring
or colouring matter; artificial honey, whether or not mixed with natural honey; caramel
163.927,9 191.480,6 171.529,1 180.352,0 214.035,0 4,85 138.592,0 181.720,0 31,12
1801 Cocoa beans; whole or broken, raw or roasted 62.977,8 77.422,1 341.437,4 169.734,7 184.667,3 34,13 93.114,3 399.860,1 329,43
1901 Malt extract; flour/groats/meal/starch/malt extract products, no cocoa (or less than 40% by weight) and food
preparations of goods of headings 04.01 to 04.04, no cocoa (or less than 5% by weight),
145.654,3 249.186,8 223.982,4 220.469,9 187.842,9 3,94 118.071,5 164.184,5 39,06
2106 Food preparations not elsewhere specified or included 494.597,5 536.506,9 490.323,2 462.028,4 436.639,3 -3,91 300.959,3 365.251,9 21,36
2303 Residues of starch manufacture, similar residues; beet-pulp, bagasse and other waste of sugar
manufacture, brewing or distilling dregs and waste, whether or not in the form of pellets
250.325,5 267.105,2 310.162,8 249.990,8 251.931,8 -0,53 169.438,8 283.656,5 67,41
2304 Oil-cake and other solid residues; whether or not ground or in the form of pellets, resulting from the
extraction of soya-bean oil
1.828.494,2 1.926.982,0 2.194.934,7 1.814.025,7 1.573.861,9 -3,54 1.031.096,3 1.364.611,9 32,35
2309 Preparations of a kind used in animal feeding 483.952,7 568.401,7 555.738,5 503.577,2 524.962,8 0,42 330.699,8 474.906,2 43,61
2401 Tobacco, unmanufactured; tobacco refuse 658.921,6 627.301,5 569.775,6 412.328,3 477.261,9 -10,10 309.419,4 492.278,2 59,10
2510 Natural calcium phosphates; natural aluminium calcium phosphates and phosphatic chalk 176.542,6 165.242,4 186.831,8 160.737,5 193.490,4 1,57 144.293,6 164.992,8 14,35
2601 Iron ores and concentrates; including roasted iron pyrites 203.791,5 307.797,1 371.127,2 314.568,3 260.562,9 5,27 155.198,6 343.221,0 121,15
2701 Coal; briquettes, ovoids and similar solid fuels manufactured from coal 24.414,1 83.309,5 296.694,2 286.659,5 323.931,0 89,77 182.557,4 502.443,2 175,22
2803 Carbon; carbon blacks and other forms of carbon n.e.c. 201.282,6 223.567,4 238.134,5 176.948,8 176.769,8 -4,82 114.174,9 212.349,3 85,99
2818 Aluminium oxide (including artificial corundum); aluminium 236.079,8 235.616,5 244.960,1 211.227,7 198.648,7 -4,44 134.773,4 152.004,3 12,79
2836 Carbonates; peroxocarbonates (percarbonates); commercial ammonium carbonate containing ammonium
carbamate
301.978,5 281.212,1 299.117,1 303.224,9 261.742,2 -2,08 179.444,0 234.142,8 30,48
2901 Acyclic hydrocarbons 1.451.492,1 1.227.977,4 1.327.335,1 1.196.119,1 869.245,1 -9,98 596.120,1 738.836,9 23,94
2902 Cyclic hydrocarbons 1.491.000,2 1.666.980,6 1.645.020,7 1.053.986,5 700.694,0 -17,87 511.838,6 915.296,4 78,83
107
Perub. (%)
Change (%)
17-162016 2017
2015 2016
TABEL 19 : PERKEMBANGAN NILAI 190 JENIS BARANG IMPOR UTAMA INDONESIA *)
DEVELOPMENT OF INDONESIAN IMPORT VALUE OF 190 MAJOR COMMODITIES
JENIS BARANG
DESCRIPTION OF GOODS
Trend (%)
12-16
Jan-Ags/Jan-Aug
No. 08.05.148
20142012 2013

Lanjutan/Continued
Nilai/Value : Ribu/Thousand US$
Perub. (%)
Change (%)
17-162016 2017
2015 2016
TABEL 19 : PERKEMBANGAN NILAI 190 JENIS BARANG IMPOR UTAMA INDONESIA *)
DEVELOPMENT OF INDONESIAN IMPORT VALUE OF 190 MAJOR COMMODITIES
JENIS BARANG
DESCRIPTION OF GOODS
Trend (%)
12-16
Jan-Ags/Jan-Aug
No. 08.05.148
20142012 2013
2905 Acyclic alcohols and their halogenated, sulphonated, nitrated or nitrosated derivatives 852.800,4 919.555,3 970.831,3 682.102,0 481.016,1 -13,45 329.739,1 619.032,3 87,73
2915 Acids; saturated acyclic monocarboxylic acids and their anhydrides, halides, peroxides and peroxyacids;
their halogenated, sulphonated, nitrated or nitrosated derivatives
277.064,5 255.535,7 275.180,2 257.295,6 230.773,8 -3,52 159.838,8 232.802,8 45,65
2916 Acids; unsaturated acyclic monocarboxylic, cyclic monocarboxylic, their anhydrides, halides, peroxides and
peroxyacids; their halogenated, sulphonated, nitrated or nitrosated derivatives
246.635,7 249.514,9 262.348,5 213.166,0 200.840,3 -5,52 131.768,4 205.799,5 56,18
2930 Organo-sulphur compounds 168.865,1 154.628,6 175.036,0 240.104,7 164.873,7 4,00 104.797,0 145.941,7 39,26
2933 Heterocyclic compounds with nitrogen hetero-atom(s) only 350.843,4 371.508,9 317.499,4 289.332,1 267.218,4 -7,64 177.252,5 245.845,9 38,70
3004 Medicaments; (not goods of heading no. 3002, 3005 or 3006) consisting of mixed or unmixed products for
therapeutic or prophylactic use, put up in measured doses (incl. those in the form
398.464,6 432.742,6 521.901,2 551.070,7 578.484,7 10,38 378.642,9 492.323,7 30,02
3102 Fertilizers; mineral or chemical, nitrogenous 500.755,7 318.587,0 258.565,9 268.883,8 298.190,5 -11,36 205.175,1 159.963,2 -22,04
3103 Fertilizers; mineral or chemical, phosphatic 468.528,8 216.175,2 308.551,3 332.451,6 250.693,5 -7,88 185.693,5 251.348,5 35,36
3104 Fertilizers; mineral or chemical, potassic 1.265.149,1 986.696,9 918.335,3 936.827,6 707.765,5 -11,43 522.864,8 676.716,3 29,42
3105 Fertilizers; mineral or chemical, containing 2 or 3 of the elements nitrogen, phosphorus, potassium; other
fertilisers; goods of chapter 31 in tablets or packages of gross weight not exceeding
381.554,2 222.363,9 331.445,5 470.078,3 295.112,4 2,38 222.149,8 329.942,6 48,52
3204 Synthetic organic colouring matter and preparations based thereon; synthetic organic products used as
fluorescent brightening agents or as luminophores; whether or not chemically
378.054,2 442.519,8 486.218,5 432.304,1 450.403,5 3,32 312.896,5 360.600,2 15,25
3206 Colouring matter and preparations thereof n.e.c. in heading no. 3203, 3204, 3205; inorganic products, kind
used as luminophores whether or not chemically defined
320.035,4 278.834,6 261.947,9 240.915,6 252.898,0 -5,98 162.317,1 283.872,7 74,89
3215 Ink; printing, writing or drawing ink and other inks; whether or not concentrated or solid 161.466,7 168.603,6 164.563,5 163.307,6 180.955,4 1,98 113.954,7 147.916,0 29,80
3302 Odoriferous substances and mixtures (including alcoholic solutions) with a basis of one or more of these
substances, of a kind used as raw materials in industry; other preparations based
353.258,3 422.445,3 421.271,3 394.254,3 425.297,1 3,07 289.977,3 355.234,1 22,50
3304 Cosmetic and toilet preparations; beauty, make-up and skin care preparations (excluding medicaments,
including sunscreen or sun tan preparations), manicure or pedicure preparations
144.110,0 174.399,6 174.094,2 158.118,5 175.490,0 3,00 113.341,6 184.123,5 62,45
3402 Organic surface-active agents (not soap); surface-active, washing (including auxiliary washing) and cleaning
preparations, containing soap or not, excluding those of heading no. 3401
295.513,5 292.146,0 313.323,1 262.551,5 250.095,9 -4,31 166.772,2 224.334,9 34,52
3506 Prepared glues and other prepared adhesives, n.e.c. or included; products suitable for use as glues or
adhesives, put up for retail sale as glues or adhesives, not exceeding 1kg net weight not over 1kg, in
aerosol containers, containing chlorofluorocarbo
174.722,1 189.677,7 193.151,1 182.595,6 181.882,9 0,42 122.709,6 161.084,5 31,27
3808 Insecticides, rodenticides, fungicides, herbicides, anti-sprouting products, plant growth regulators,
disinfectants and the like, put up in forms or packings for retail sale or as preparations or forms or packings
for retail sale or as preparations or ar
292.962,0 409.457,5 396.134,7 381.646,7 413.779,9 6,40 279.635,2 427.290,0 52,80
3811 Anti-knock preparations, oxidation and gum inhibitors, viscosity improvers, anti-corrosive preparations and
the like, for mineral oils (including gasoline) or other liquids used for the same
234.685,1 267.775,3 242.663,7 237.097,0 243.360,3 -0,49 152.378,5 220.128,2 44,46
3812 Prepared rubber accelerators; compound plasticisers for rubber or plastics, n.e.c. or included; anti-oxidising
preparations and other compound stabilisers for rubber or plastics
178.458,7 181.667,0 177.826,4 166.548,4 164.236,5 -2,50 109.095,9 143.779,8 31,79
108

Lanjutan/Continued
Nilai/Value : Ribu/Thousand US$
Perub. (%)
Change (%)
17-162016 2017
2015 2016
TABEL 19 : PERKEMBANGAN NILAI 190 JENIS BARANG IMPOR UTAMA INDONESIA *)
DEVELOPMENT OF INDONESIAN IMPORT VALUE OF 190 MAJOR COMMODITIES
JENIS BARANG
DESCRIPTION OF GOODS
Trend (%)
12-16
Jan-Ags/Jan-Aug
No. 08.05.148
20142012 2013
3824 Prepared binders for foundry moulds or cores; chemical products and preparations of the chemical or allied
industries (including those consisting of mixtures of natural products), not elsewhere
258.553,3 283.479,4 294.189,1 279.219,9 311.426,0 3,63 207.447,8 271.237,4 30,75
3901 Polymers of ethylene, in primary forms 1.143.926,3 1.343.586,3 1.475.864,9 1.410.946,6 1.321.394,0 3,43 870.370,1 1.198.371,8 37,69
3902 Polymers of propylene or of other olefins, in primary forms 1.315.343,7 1.458.528,5 1.548.735,2 1.200.721,0 1.234.290,6 -3,17 774.056,4 1.124.611,0 45,29
3903 Polymers of styrene, in primary forms 430.374,2 446.978,3 449.488,5 314.985,3 317.556,5 -9,14 203.584,1 309.402,9 51,98
3906 Acrylic polymers in primary forms 255.716,6 268.155,6 232.387,3 187.202,9 189.632,9 -9,13 128.242,8 168.404,5 31,32
3907 Polyacetals, other polyethers and epoxide resins, in primary forms; polycarbonates, alkyd resins, polyallyl
esters and other polyesters, in primary forms
830.147,9 851.025,8 847.741,8 763.093,4 732.671,8 -3,53 485.567,2 637.593,3 31,31
3908 Polyamides in primary forms 243.657,0 245.343,8 238.902,8 198.188,8 196.207,8 -6,26 129.046,3 193.220,5 49,73
3909 Amino-resins, phenolic resins and polyurethanes, in primary forms 221.419,1 244.451,5 245.596,6 229.978,9 241.319,0 1,12 158.639,9 218.551,3 37,77
3919 Self-adhesive plates, sheets, film, foil, tape, strip and other flat shapes, of plastics, whether or not in rolls 249.740,4 281.197,3 272.266,5 249.528,2 301.983,1 2,64 198.208,7 283.335,4 42,95
3920 Plastics; plates, sheets, film, foil and strip (not self-adhesive); non-cellular and not reinforced, laminated,
supported or similarly combined with other materials, n.e.c. in chapter 39
409.203,4 440.484,4 438.399,8 404.685,7 474.648,1 2,14 319.632,5 435.512,0 36,25
3921 Plastic plates, sheets, film, foil and strip n.e.c. in chapter 39 221.262,2 223.385,1 235.819,9 223.278,8 249.165,3 2,40 156.075,0 238.789,6 53,00
3923 Plastic articles for the conveyance or packing of goods; stoppers, lids, caps and other closures of plastics 349.155,0 363.694,4 382.868,5 341.543,5 365.325,0 0,28 241.980,2 330.872,3 36,74
3926 Articles of plastics and articles of other materials of heading no. 3901 to 3914, n.e.c. in chapter 39 397.440,5 470.611,4 468.600,8 448.555,1 487.035,8 3,65 310.033,4 441.977,1 42,56
4002 Synthetic rubber and factice derived from oils, in primary forms or in plates, sheets or strip; mixtures of
heading no. 4001 and 4002, in primary forms or in plates, sheets or strip
910.686,2 738.360,8 669.899,3 559.518,5 572.727,2 -11,35 371.963,3 641.091,3 72,35
4011 New pneumatic tyres, of rubber 733.664,4 590.596,2 512.933,8 432.401,0 446.652,3 -12,23 276.968,2 405.630,6 46,45
4016 Articles of vulcanised rubber other than hard rubber, n.e.c. in 364.665,8 356.826,3 317.139,4 264.259,6 270.291,3 -8,60 176.717,2 255.150,3 44,38
4107 Leather further prepared after tanning or crusting, including parchment-dressed leather, of bovine (including
buffalo) or equine animals, without hair on, whether or not split, other than leather of without hair on, other
202.727,3 228.210,7 263.627,3 259.847,3 255.053,9 6,07 176.234,9 196.778,7 11,66
4202 Trunks; suit, camera, jewellery, cutlery cases; travel, tool, similar bags; wholly or mainly covered by leather,
composition leather, plastic sheeting, textile materials, vulcanised fibre, paperboard
180.785,5 202.633,8 161.829,5 148.145,4 209.586,2 -0,18 133.330,8 251.786,1 88,84
4702 Chemical wood pulp, dissolving grades 422.183,7 490.186,0 476.629,0 396.483,0 422.689,9 -2,08 294.441,6 391.598,1 33,00
4703 Chemical wood pulp, soda or sulphate, other than dissolving grades 426.688,7 562.208,6 624.430,7 444.348,8 441.390,6 -1,66 293.140,4 437.566,4 49,27
4707 Waste and scrap of paper and paperboard 500.294,3 473.176,8 475.265,7 321.374,2 365.336,8 -9,66 241.387,6 363.941,2 50,77
4811 Paper, paperboard, cellulose wadding and webs of cellulose fibres, coated, impregnated, covered, surface-
coloured, decorated or printed, rolls or sheets, other than goods of heading no. 4803,
281.082,7 248.996,4 261.753,9 263.743,4 257.626,5 -1,16 167.796,4 196.635,5 17,19
4819 Cartons, boxes, cases, bags and the like, of paper, paperboard, cellulose wadding or fibres; box files, letter
trays and the like, of paper or paperboard, of a kind used in offices, shops or the like
198.964,1 245.468,0 280.712,2 266.585,2 276.492,0 7,69 174.527,4 226.402,0 29,72
5201 Cotton; not carded or combed 1.333.135,1 1.346.306,7 1.400.810,9 1.087.556,8 1.087.200,3 -6,02 681.450,0 1.126.824,1 65,36
5208 Woven fabrics of cotton, containing 85% or more by weight of cotton, weighing not more than 200 g/m2 502.948,2 502.791,0 488.140,6 457.293,0 413.902,3 -4,73 272.922,4 316.574,0 15,99
5209 Woven fabrics of cotton, containing 85% or more by weight of cotton, weighing more than 200g/m2 248.311,0 244.759,9 210.940,4 199.628,6 193.695,4 -6,77 131.420,2 150.464,1 14,49
109

Lanjutan/Continued
Nilai/Value : Ribu/Thousand US$
Perub. (%)
Change (%)
17-162016 2017
2015 2016
TABEL 19 : PERKEMBANGAN NILAI 190 JENIS BARANG IMPOR UTAMA INDONESIA *)
DEVELOPMENT OF INDONESIAN IMPORT VALUE OF 190 MAJOR COMMODITIES
JENIS BARANG
DESCRIPTION OF GOODS
Trend (%)
12-16
Jan-Ags/Jan-Aug
No. 08.05.148
20142012 2013
5210 Woven fabrics of cotton, containing less than 85% by weight of cotton, mixed mainly or solely with man-
made fibres, weighing not more than 200 g/m2
156.108,1 175.685,8 145.875,5 139.397,2 173.657,1 -0,18 116.743,1 133.617,2 14,45
5402 Synthetic filament yarn (other than sewing thread), not put up for retail sale, including synthetic
monofilament of less than 67 decitex
366.740,0 387.850,5 413.120,8 353.459,9 345.633,4 -2,09 233.677,0 304.075,8 30,13
5407 Woven fabrics of synthetic filament yarn, including woven fabrics obtained from materials of heading no.
5404
726.382,0 747.491,9 807.769,9 803.479,9 944.470,6 6,16 643.589,0 783.905,0 21,80
5502 Artificial filament tow 185.990,2 247.977,9 251.121,4 222.278,0 220.039,1 2,29 150.785,6 189.173,4 25,46
5503 Synthetic staple fibres, not carded, combed or otherwise processed for spinning 275.299,3 300.151,8 280.126,3 211.346,2 230.616,8 -6,81 145.811,6 209.551,2 43,71
5504 Artificial staple fibres, not carded, combed or otherwise processed for spinning 255.074,0 145.381,4 171.546,4 165.874,6 195.517,0 -3,92 129.903,7 153.212,8 17,94
5513 Woven fabrics of synthetic staple fibres, containing less than 85% by weight of such fibres, mixed mainly or
solely with cotton, of a weight not exceeding 170g/m2
161.768,6 180.400,5 164.972,3 171.339,4 172.072,4 0,72 116.342,5 141.195,4 21,36
5603 Nonwovens; whether or not impregnated, coated, covered or laminated 237.167,5 256.409,6 279.018,6 274.052,8 295.254,8 5,18 201.135,6 229.665,2 14,18
5903 Textile fabrics impregnated, coated, covered or laminated with plastics, other than those of heading no.
5902
272.636,7 289.524,7 303.595,4 282.229,6 274.679,1 -0,11 186.005,0 265.357,6 42,66
6002 Fabrics; knitted or crocheted, other than those of heading 60.01, of a width not exceeding 30cm, containing
by weight 5% or more of elastomeric yarn or rubber thread
246.506,9 250.791,3 213.928,4 210.739,1 223.148,5 -3,66 145.117,5 172.505,9 18,87
6004 Fabrics; knitted or crocheted fabrics of a width exceeding 30 cm, other than those of heading 60.01,
containing by weight 5% or more of elastomeric yarn or rubber thread
228.170,4 236.920,7 260.902,6 273.960,0 228.459,3 1,49 153.283,9 175.567,5 14,54
6006 Fabrics; knitted or crocheted fabrics, other than those of headings 60.01 to 60.04 613.294,0 597.371,0 627.846,7 598.716,6 602.636,8 -0,33 412.193,8 548.669,2 33,11
6406 Footwear; parts of footwear; removable in-soles, heel cushions and similar articles; gaiters, le.g.ings and
similar articles, and parts thereof
184.190,3 185.968,6 193.725,7 195.711,7 216.445,4 3,81 135.181,5 202.839,7 50,05
6907 Ceramic flags and paving, hearth or wall tiles, unglazed; unglazed ceramic mosaic cubes and the like,
whether or not on a backing
161.132,9 127.808,8 166.457,5 159.176,0 181.199,5 4,65 114.139,7 172.771,2 51,37
7108 Gold (including gold plated with platinum) unwrought or in semi-manufactured forms, or in powder form 40.605,7 28.731,2 23.434,4 703.817,4 830.855,1 151,82 207.121,1 731.098,0 252,98
7204 Ferrous waste and scrap; remelting scrap ingots of iron or steel 854.318,3 963.168,9 808.720,8 272.870,6 238.834,1 -31,68 136.754,8 416.290,1 204,41
7207 Iron or non-alloy steel; semi-finished products thereof 2.292.298,4 2.048.443,2 1.879.768,8 1.469.545,8 1.534.132,2 -10,73 986.400,2 1.328.244,5 34,66
7208 Iron or non-alloy steel; flat-rolled products of a width of 600mm or more, hot-rolled, not clad, plated or coated 1.879.040,5 1.610.153,5 1.218.528,7 830.422,5 621.940,1 -24,98 401.358,9 654.295,4 63,02
7209 Iron or non-alloy steel; flat-rolled products, width 600mm or more, cold-rolled (cold-reduced), not clad, plated
or coated
1.033.546,7 894.074,3 732.019,5 516.527,7 469.560,9 -19,16 283.376,5 455.725,8 60,82
7210 Iron or non-alloy steel; flat-rolled products, width 600mm or more, clad, plated or coated 915.859,6 988.693,7 885.349,2 729.850,9 728.839,7 -7,32 466.976,2 564.428,9 20,87
7212 Iron or non-alloy steel; flat-rolled products, width less than 600mm, clad, plated or coated 77.536,5 71.890,3 118.620,2 211.840,2 209.736,6 35,95 132.451,8 217.094,8 63,90
7219 Stainless steel; flat-rolled products of width of 600mm or more 410.031,3 400.968,1 420.874,9 343.480,9 315.556,5 -6,56 200.881,6 318.097,5 58,35
7225 Alloy steel flat-rolled products, of a width 600mm or more 355.203,2 346.049,7 341.626,4 405.157,7 510.347,6 9,23 308.085,3 833.623,3 170,58
110

Lanjutan/Continued
Nilai/Value : Ribu/Thousand US$
Perub. (%)
Change (%)
17-162016 2017
2015 2016
TABEL 19 : PERKEMBANGAN NILAI 190 JENIS BARANG IMPOR UTAMA INDONESIA *)
DEVELOPMENT OF INDONESIAN IMPORT VALUE OF 190 MAJOR COMMODITIES
JENIS BARANG
DESCRIPTION OF GOODS
Trend (%)
12-16
Jan-Ags/Jan-Aug
No. 08.05.148
20142012 2013
7227 Steel, alloy; bars and rods, hot-rolled, in irregularly wound coils 224.199,6 343.685,3 365.061,0 250.432,8 298.754,7 2,61 176.368,9 236.867,7 34,30
7228 Alloy steel bars, rods, shapes and sections; hollow drill bars and rods, of alloy or non-alloy steel 607.159,2 603.861,7 470.300,1 289.793,3 288.776,5 -19,91 178.355,8 266.578,7 49,46
7304 Tubes, pipes and hollow profiles, seamless, of iron (other than cast iron) or steel 1.354.770,1 1.180.630,0 995.222,8 694.715,5 464.180,3 -23,45 339.001,6 362.978,2 7,07
7307 Tube or pipe fittings (e.g. couplings, elbows, sleeves), of iron or steel 356.531,9 356.350,7 320.572,6 263.205,6 219.209,6 -11,98 155.015,1 112.921,6 -27,15
7308 Structures of iron or steel and parts thereof; plates, rods, angles, shapes, sections, tubes and the like,
prepared for use in structures
386.536,6 371.064,0 477.694,8 516.367,1 283.348,5 -2,86 208.514,8 138.904,6 -33,38
7318 Screws, bolts, nuts, coach screws, screw hooks, rivets, cotters, cotter-pins, washers (including spring
washers) and similar articles, of iron or steel
660.388,8 670.638,7 677.424,0 546.907,1 627.905,8 -3,00 400.244,9 448.906,3 12,16
7326 Iron or steel; articles, n.e.c. in chapter 73 389.952,5 454.736,0 528.442,6 409.283,1 290.283,8 -6,72 190.618,0 202.487,8 6,23
7403 Copper; refined and copper alloys, unwrought 811.934,6 728.442,1 829.980,6 776.954,9 656.944,5 -3,53 442.566,8 653.819,0 47,73
7601 Aluminium; unwrought 997.554,3 860.281,8 573.015,5 566.331,0 553.435,8 -14,75 324.838,1 644.075,0 98,28
7606 Aluminium; plates, sheets and strip, thickness exceeding 0.2mm 402.263,8 403.467,5 502.328,4 341.736,4 308.072,3 -6,76 215.301,7 335.113,3 55,65
7607 Aluminium foil (whether or not printed or backed with paper, paperboard, plastics or similar backing
materials) of a thickness (excluding any backing) not exceeding 0.2mm thickness not exceeding 0.2mm not
exceeding 0.2mm
109.103,3 129.729,8 165.036,6 153.651,6 174.850,8 11,77 115.953,3 184.938,4 59,49
7901 Zinc; unwrought 283.372,7 282.420,5 307.056,6 263.747,2 285.604,5 -0,53 171.363,7 351.250,2 104,97
8207 Tools, interchangeable; for hand tools, whether or not power-operated, or for machine tools (pressing,
stamping, punching, drilling etc), including dies for drawing or extruding
338.867,7 241.770,7 195.594,4 225.712,2 207.925,7 -9,93 134.807,2 235.144,7 74,43
8302 Base metal mountings, fittings and similar articles for furniture, doors, staircases, windows, trunks, chests
etc, castors with mountings of base metal, automatic door closers of base metal trunks, chests, caskets or
the like, of base metal, for suitcase
183.549,1 187.189,3 174.878,0 161.290,4 162.981,2 -3,79 102.951,7 164.465,1 59,75
8402 Boilers; steam or other vapour generating (other than central heating hot water boilers, capable also of
producing low pressure steam), super heated water boilers
409.740,3 379.256,0 518.968,9 366.580,2 230.602,7 -11,16 150.532,3 203.830,8 35,41
8406 Turbines; steam and other vapour turbines 439.706,6 366.283,2 340.259,7 465.431,1 641.491,5 10,46 483.940,2 189.145,3 -60,92
8407 Reciprocating or rotary internal combustion piston engines 265.367,4 264.668,0 279.214,6 287.184,1 158.157,1 -9,09 116.803,9 120.142,9 2,86
8408 Compression-ignition internal combustion piston engines (diesel or semi-diesel engines) 518.414,4 481.453,8 397.370,8 295.439,1 464.261,2 -6,84 293.454,4 500.279,0 70,48
8409 Parts suitable for use solely or principally with the engines of heading no. 8407 or 8408 1.316.143,8 1.132.455,9 955.508,2 630.466,6 561.906,6 -20,45 366.895,0 564.701,9 53,91
8411 Turbo-jets, turbo-propellers and other gas turbines 729.217,8 721.455,4 347.435,3 411.013,5 377.890,0 -17,12 233.853,8 206.028,3 -11,90
8413 Pumps; for liquids, whether or not fitted with measuring device, liquid elevators 1.102.936,8 1.014.914,2 982.271,6 805.636,7 789.684,8 -8,60 526.253,4 712.587,9 35,41
8414 Air or vacuum pumps, air or other gas compressors and fans; ventilating or recycling hoods incorporating a
fan whether or not fitted with filters
785.377,5 1.027.381,1 933.827,8 824.632,2 766.832,1 -2,64 529.742,1 561.867,6 6,06
8415 Air conditioning machines; comprising a motor driven fan and elements for changing the temperature and
humidity, including those machines in which the humidity cannot be separately or split-system
644.906,4 677.198,9 573.248,1 458.361,5 545.829,2 -6,98 375.148,6 369.207,4 -1,58
111

Lanjutan/Continued
Nilai/Value : Ribu/Thousand US$
Perub. (%)
Change (%)
17-162016 2017
2015 2016
TABEL 19 : PERKEMBANGAN NILAI 190 JENIS BARANG IMPOR UTAMA INDONESIA *)
DEVELOPMENT OF INDONESIAN IMPORT VALUE OF 190 MAJOR COMMODITIES
JENIS BARANG
DESCRIPTION OF GOODS
Trend (%)
12-16
Jan-Ags/Jan-Aug
No. 08.05.148
20142012 2013
8417 Furnaces and ovens; industrial or laboratory, including incinerators, non-electric 146.268,4 167.722,7 364.795,7 428.918,9 260.274,3 23,26 188.728,4 178.025,4 -5,67
8418 Refrigerators, freezers and other refrigerating or freezing equipment, electric or other; heat pumps other
than air conditioning machines of heading no. 8415
317.284,9 364.969,9 338.504,3 283.767,9 334.319,0 -1,46 204.732,4 251.546,1 22,87
8419 Machinery, plant (not domestic), or laboratory equipment; electrically heated or not, (excluding items in
85.14) for the treatment of materials by a process involving change of
694.542,5 814.069,3 662.014,0 786.807,0 670.917,0 -1,03 410.793,1 499.902,5 21,69
8421 Centrifuges, including centrifugal dryers; filtering or purifying machinery and apparatus for liquids or gases 653.982,4 722.517,8 692.713,2 727.966,0 763.725,0 3,23 485.156,2 561.845,7 15,81
8422 Dish washing machines; machinery for cleaning, drying, filling, closing, sealing, capsuling or labelling bottles,
cans, boxes, bags, etc, machinery for aerating beverages
428.589,8 520.693,3 654.592,2 495.193,7 447.384,4 0,36 292.810,9 377.747,8 29,01
8426 Derricks, cranes, including cable cranes, mobile lifting frames, straddle carriers and works trucks fitted with a
crane
541.338,5 482.473,3 438.603,0 546.941,0 359.227,1 -6,71 209.820,1 276.691,8 31,87
8428 Lifting, handling, loading or unloading machinery; n.e.c. in heading no. 8425, 8426 or 8427 (e.g. lifts,
escalators, conveyors, teleferics)
355.899,2 494.290,6 569.148,9 560.564,3 477.684,9 7,41 309.790,3 311.148,7 0,44
8429 Bulldozers, graders, levellers, scrapers, angledozers, mechanical shovels, excavators, shovel loaders,
tamping machines and road rollers, self-propelled
2.193.599,3 941.275,0 794.970,6 482.214,5 435.648,3 -32,31 223.721,4 885.563,9 295,83
8431 Machinery parts; used solely or principally with the machinery of heading no. 8425 to 8430 1.659.576,9 1.253.624,6 1.087.703,3 901.674,4 896.641,8 -14,45 581.414,3 674.006,7 15,93
8438 Machinery n.e.c. in this chapter, for the industrial preparation or manufacture of food or drink; other than
machinery for extraction or preparation of animal or fixed vegetable fats or oils products spaghetti or similar
311.740,5 252.435,8 260.507,7 257.087,4 238.540,1 -5,04 151.464,2 206.205,8 36,14
8439 Machinery; for making pulp of fibrous cellulosic material, or for making or finishing paper or paperboard 365.828,5 294.776,2 209.493,8 148.457,1 179.410,1 -19,03 121.501,4 123.855,1 1,94
8441 Machines; for making up paper pulp, paper or paperboard, including cutting machines of all kinds 236.765,3 238.637,5 228.465,5 235.224,3 240.221,5 0,15 184.661,9 104.467,0 -43,43
8443 Printing machinery; used for printing by means of plates, cylinders and other printing components of heading
84.42; other printers, copying machines and facsimile machines, whether or not textile, leather, wallpaper,
wrapping paper, linoleum or other mat
1.257.142,6 1.148.294,0 1.235.391,7 1.086.646,7 1.024.136,2 -4,55 658.547,9 978.088,8 48,52
8455 Metal-rolling mills and rolls therefor 87.373,8 141.453,7 101.963,6 116.559,0 238.087,4 19,86 73.906,4 79.153,1 7,10
8462 Machine-tools; (including presses) for working metal by forging, hammering or die-stamping, for bending,
folding, straightening, flattening, shearing or punching metal
394.208,4 451.385,9 427.920,4 218.672,0 229.941,6 -16,50 145.196,5 155.147,8 6,85
8466 Machine-tools; parts and accessories suitable for use solely or principally with the machines of headings
8456 to 8465, and tool holders for any type of tool for working in the hand
171.915,7 187.070,9 195.029,5 161.673,2 157.792,9 -3,12 107.442,9 138.888,9 29,27
8471 Automatic data processing machines and units thereof, magnetic or optical readers, machines for
transcribing data onto data media in coded form and machines for processing such data, not
2.299.427,5 2.443.779,0 2.106.783,4 1.911.011,7 1.642.269,7 -8,78 979.224,2 1.505.211,4 53,71
8473 Machinery; parts and accessories (not covers, carrying cases and the like) suitable for use solely or
principally with machines of heading no. 8469 to 8472 heading 84.69 (other than covers, carrying cases and
the like) machines of heading 84.69 (other th
307.720,7 327.224,8 387.295,8 335.927,2 496.669,3 10,34 274.820,0 334.628,0 21,76
8474 Machinery for sorting, screening, separating, washing, crushing, grinding, mixing or kneading earth, stone,
ores in solid form, shaping, moulding machinery for solid mineral fuels substances other mineral substances
478.921,5 522.136,4 754.144,2 638.645,0 551.765,6 4,97 373.066,5 340.561,2 -8,71
112

Lanjutan/Continued
Nilai/Value : Ribu/Thousand US$
Perub. (%)
Change (%)
17-162016 2017
2015 2016
TABEL 19 : PERKEMBANGAN NILAI 190 JENIS BARANG IMPOR UTAMA INDONESIA *)
DEVELOPMENT OF INDONESIAN IMPORT VALUE OF 190 MAJOR COMMODITIES
JENIS BARANG
DESCRIPTION OF GOODS
Trend (%)
12-16
Jan-Ags/Jan-Aug
No. 08.05.148
20142012 2013
8477 Machinery; for working rubber or plastics or for the manufacture of products from these materials, n.e.c. in
this chapter
906.599,1 762.365,6 765.510,5 632.143,2 592.300,9 -9,87 385.965,8 458.054,1 18,68
8479 Machinery and mechanical appliances; having individual functions, n.e.c. in this chapter 932.462,1 925.684,8 927.880,0 937.930,4 771.591,3 -3,59 518.122,5 618.982,8 19,47
8480 Moulding boxes for metal foundry, moulding patterns, moulds for metals (excluding ingot moulds), metal
carbides, glass, mineral materials, rubber or plastics
337.603,4 439.425,7 391.809,1 380.737,5 321.366,6 -2,39 201.963,2 361.945,1 79,21
8481 Taps, cocks, valves and similar appliances for pipes, boiler shells, tanks, vats or the like, including pressure-
reducing valves and thermostatically controlled valves
829.963,2 983.844,3 1.016.715,9 896.025,1 742.401,1 -3,12 509.739,1 592.565,7 16,25
8482 Ball or roller bearings 521.449,4 516.125,6 477.882,4 381.274,2 411.522,3 -7,47 270.828,6 407.720,9 50,55
8483 Transmission shafts (including cam and crank) and cranks; bearing housings and plain shaft bearings;
gears and gearing; ball or roller screws; gear boxes and other speed changers; flywheels
1.132.439,7 924.953,5 822.157,0 543.878,8 506.278,7 -19,27 341.529,1 493.219,1 44,41
8501 Electric motors and generators (excluding generating sets) 362.842,7 432.924,4 438.854,7 352.744,5 377.601,0 -1,24 258.766,9 293.865,5 13,56
8502 Electric generating sets and rotary converters 671.004,8 569.500,9 780.726,8 459.875,2 373.993,8 -12,92 252.747,3 655.743,7 159,45
8503 Electric motors and generators; parts suitable for use solely or principally with the machines of heading no.
8501 or 8502
174.786,6 140.859,5 112.411,1 220.329,6 158.306,2 2,52 107.910,7 140.825,6 30,50
8504 Electric transformers, static converters (e.g. rectifiers) and inductors 692.318,7 582.997,4 612.151,0 531.778,6 550.034,1 -5,37 353.192,5 580.767,2 64,43
8507 Electric accumulators, including separators therefor; whether or not rectangular (including square) 217.941,1 162.828,3 171.695,1 183.824,6 227.156,7 2,06 135.454,9 256.422,7 89,30
8511 Ignition or starting equipment; used for spark-ignition or compression-ignition internal combustion engines;
generators and cut outs used in conjunction with such engines
341.056,3 340.595,9 265.736,3 173.133,0 175.134,1 -18,21 113.298,4 159.671,4 40,93
8512 Lighting or visual signalling equipment (excluding articles of heading no. 8539), windscreen wipers,
defrosters and demisters; electrical, of a kind used for cycles or motor vehicles generators
220.746,3 209.275,3 227.127,2 182.541,1 192.501,4 -4,02 130.289,2 181.819,6 39,55
8514 Industrial or laboratory electric furnaces and ovens (including those functioning by induction or dielectric
loss); other industrial or laboratory equipment for the heat treatment of materials by
89.474,0 113.901,2 153.872,3 148.192,4 158.840,7 15,15 100.939,8 66.800,7 -33,82
8515 Electric (electrically heated gas) soldering, brazing, welding machines and apparatus, capable or not of
cutting, electric machines and apparatus for hot spraying of metals or sintered
160.910,0 157.805,0 164.318,7 206.494,3 173.878,0 4,33 114.310,3 102.193,2 -10,60
8516 Electric water, space, soil heaters; electro-thermic hair-dressing apparatus; hand dryers, irons; electro-
thermic appliances for domestic purposes; electro heating resistors, not of heading no.
240.008,0 239.190,6 204.017,8 171.863,4 203.493,7 -6,39 130.232,6 219.772,6 68,75
8517 Telephone sets, including telephones for cellular networks or for other wireless networks; other apparatus
for the transmission or reception of voice, images or other data (including wired/wireless
5.113.405,2 5.291.232,0 4.855.425,1 4.315.535,1 4.185.386,8 -5,86 2.499.257,0 3.720.539,3 48,87
8518 Microphones and their stands; loudspeakers, mounted or not in their enclosures; headphones and
earphones, combined or not with a microphone, and sets of a microphone and one or more
199.532,6 203.798,9 195.713,9 171.755,4 210.302,1 -0,66 126.800,8 236.756,5 86,72
8522 Sound or video recording apparatus; parts and accessories suitable for use solely or principally with the
apparatus of heading 8519 or
186.515,3 233.474,8 233.656,6 166.353,2 169.700,8 -5,14 108.696,2 119.821,9 10,24
8523 Discs, tapes, solid-state non-volatile storage devices, smart cards and other media for the recording of
sound or of other phenomena, whether or not recorded, including matrices and
172.823,5 142.258,5 169.022,9 167.272,2 184.924,1 3,02 105.749,5 221.138,8 109,12
8525 Transmission apparatus for radio-broadcasting or television, whether or not incorporating reception
apparatus or sound recording or reproducing apparatus; television cameras, digital reception apparatus
88.423,2 117.423,0 99.400,1 99.068,4 161.799,0 10,94 79.430,9 233.326,8 193,75
113

Lanjutan/Continued
Nilai/Value : Ribu/Thousand US$
Perub. (%)
Change (%)
17-162016 2017
2015 2016
TABEL 19 : PERKEMBANGAN NILAI 190 JENIS BARANG IMPOR UTAMA INDONESIA *)
DEVELOPMENT OF INDONESIAN IMPORT VALUE OF 190 MAJOR COMMODITIES
JENIS BARANG
DESCRIPTION OF GOODS
Trend (%)
12-16
Jan-Ags/Jan-Aug
No. 08.05.148
20142012 2013
8528 Monitors and projectors, not incorporating television reception apparatus; reception apparatus for television,
whether or not incorporating radio-broadcast receivers or sound or video
304.082,3 334.965,9 303.560,8 216.874,3 282.353,4 -5,66 160.679,9 306.469,7 90,73
8529 Transmission apparatus; parts suitable for use solely or principally with the apparatus of heading no. 8525 to
8528
1.478.726,3 1.130.402,3 1.182.396,3 912.567,8 816.512,1 -13,08 503.910,4 854.680,1 69,61
8532 Electrical capacitors; fixed, variable or adjustable (pre-set) 430.459,5 360.178,6 241.447,9 209.550,3 197.332,6 -18,95 133.181,7 172.274,6 29,35
8533 Electrical resistors (including rheostats and potentiometers), excluding heating resistors 180.722,2 259.320,6 164.179,8 157.754,5 167.737,3 -6,26 113.633,9 109.793,0 -3,38
8534 Circuits; printed 427.061,0 408.891,1 371.334,6 312.507,8 306.475,9 -8,90 204.975,6 322.213,7 57,20
8535 Electrical apparatus for switching, protecting electrical circuits, for making connections to or in electrical
circuits; for a voltage exceeding 1000 volts
203.767,6 176.477,3 160.351,0 229.108,8 216.942,9 3,94 144.200,2 198.018,1 37,32
8536 Electrical apparatus for switching, protecting electrical circuits, for making connections to or in electrical
circuits, for a voltage not exceeding 1000 volts; connectors for optical fibres, optical fibre
1.046.654,0 1.117.033,0 1.086.564,9 1.007.586,8 1.017.187,6 -1,59 688.875,6 888.105,3 28,92
8537 Boards, panels, consoles, desks, cabinets, bases with apparatus of heading no. 8535, 8536 for electricity
control and distribution, (other than switching apparatus of heading no. 8517)
520.901,4 504.867,7 481.588,3 582.055,0 461.660,8 -0,99 271.080,0 324.949,2 19,87
8538 Electrical apparatus; parts suitable for use solely or principally with the apparatus of heading no. 8535, 8536
and 8537
327.600,8 285.226,0 250.633,3 298.718,5 306.205,1 -0,88 199.064,9 240.203,1 20,67
8539 Lamps; electric filament or discharge lamps, including sealed beam lamp units and ultra-violet or infra-red
lamps, arc-lamps
397.297,9 366.320,2 298.389,0 239.603,3 220.362,4 -14,81 131.748,7 182.708,0 38,68
8541 Diodes, transistors, similar semiconductor devices; including photovoltaic cells assembled or not in modules,
panels, light emitting mounted piezo-electric crystals
485.768,7 461.696,4 478.940,6 390.014,3 373.389,9 -6,71 246.581,2 339.508,0 37,69
8542 Electronic integrated circuits 1.841.266,8 1.579.273,9 1.572.506,9 1.453.234,0 1.481.732,6 -5,04 1.003.543,6 1.294.667,2 29,01
8543 Electrical machines and apparatus; having individual functions, not specified or included elsewhere in this
chapter
312.633,0 212.609,3 212.947,5 264.426,7 258.691,9 -1,59 169.862,5 259.750,5 52,92
8544 Insulated wire, cable and other electric conductors, connector fitted or not; optical fibre cables of individually
sheathed fibres, whether or not assembled with electric conductors or fitted with
929.978,5 974.199,4 869.091,1 813.051,7 829.634,0 -4,01 467.336,0 766.215,4 63,95
8703 Motor cars and other motor vehicles; principally designed for the transport of persons (other than those of
heading no. 8702), including station wagons and racing cars
2.728.211,7 2.231.189,6 1.480.891,8 1.165.032,9 1.190.180,3 -20,62 840.894,4 1.004.371,1 19,44
8704 Vehicles; for the transport of goods 2.640.175,0 892.232,1 696.877,5 566.946,8 397.153,8 -34,57 241.125,9 843.920,9 249,99
8708 Motor vehicles; parts and accessories, of heading no. 8701 to 8705 2.982.318,6 3.218.275,6 2.908.464,1 2.456.675,3 2.593.542,7 -5,35 1.701.292,9 2.562.090,7 50,60
8710 Tanks and other armoured fighting vehicles; motorised, whether or not fitted with weapons, and parts of
such vehicles
37.883,4 220.559,5 94.015,3 222.161,7 234.855,0 44,14 181.016,7 127.067,4 -29,80
8714 Vehicles; parts and accessories of heading no. 8711 to 8713 680.276,6 586.724,4 511.962,9 406.008,7 437.527,9 -11,76 290.393,4 391.163,7 34,70
8803 Aircraft; parts of heading no. 8801 or 8802 472.968,3 899.397,2 334.982,3 631.135,9 640.045,1 2,54 411.292,2 511.359,7 24,33
8901 Cruise ships, excursion boats, ferry-boats, cargo ships, barges and similar vessels for the transport of
persons or goods
1.233.384,1 698.269,5 715.646,4 430.365,6 747.836,8 -13,80 395.175,0 538.385,6 36,24
114

Lanjutan/Continued
Nilai/Value : Ribu/Thousand US$
Perub. (%)
Change (%)
17-162016 2017
2015 2016
TABEL 19 : PERKEMBANGAN NILAI 190 JENIS BARANG IMPOR UTAMA INDONESIA *)
DEVELOPMENT OF INDONESIAN IMPORT VALUE OF 190 MAJOR COMMODITIES
JENIS BARANG
DESCRIPTION OF GOODS
Trend (%)
12-16
Jan-Ags/Jan-Aug
No. 08.05.148
20142012 2013
9018 Instruments and appliances used in medical, surgical, dental or veterinary sciences, including scintigraphic
apparatus, other electro-medical apparatus and sight testing instruments
224.001,4 304.596,5 273.212,6 330.956,9 439.994,9 15,41 259.891,3 417.917,7 60,80
9022 X-ray, alpha, beta, gamma radiation apparatus; x-ray tubes, x-ray generators, high tension generators,
control panels and desks, screens, examination or treatment tables, chairs and the like
76.494,4 84.623,5 72.649,0 85.864,9 206.112,6 22,10 97.129,7 113.429,7 16,78
9031 Measuring or checking instruments, appliances and machines, n.e.c. or included in this chapter; profile
projectors
193.154,5 218.422,5 214.078,2 201.035,0 296.068,0 8,02 208.085,0 175.448,9 -15,68
9032 Regulating or controlling instruments and apparatus; automatic type 195.309,7 313.066,0 289.615,1 290.601,6 269.265,0 5,84 184.157,8 227.789,5 23,69
9301 Military weapons; other than revolvers, pistols and arms of heading no. 9307 20.521,3 58.636,0 317.591,2 143.893,3 257.195,9 81,38 236.642,2 47.261,3 -80,03
9401 Seats (not those of heading no. 9402), whether or not convertible into beds and parts thereof 234.002,3 231.426,8 209.423,9 196.197,1 183.680,7 -6,29 117.145,5 183.774,7 56,88
9405 Lamps, light fittings; including searchlights, spotlights and parts thereof, n.e.c.; illuminated signs, name-
plates and the like, having permanently fixed light source and parts thereof n.e.c. or included
107.554,4 138.267,5 138.599,6 153.078,8 200.890,3 14,47 126.971,1 178.451,7 40,55
9801 Deployment goods 2.042.503,6 1.315.953,5 942.902,2 343.161,2 333.349,9 -39,16 210.630,9 455.884,8 116,44
115
Commodities in group HS 4 digit have contribution 75% Total Import Value of Non Oil and Gas in 2016
*) Komoditi pada tahun 2016 berdasarkan kelompok HS 4 digit mempunyai kontribusi sebesar 75% dari nilai total Impor non-migas.

Lanjutan/Continued
Volume/Quantity : Ton
0102 Bovine animals; live 101.410,5 130.524,7 246.835,2 197.604,1 195.764,1 18,89 127.436,1 137.948,9 8,25
0202 Meat of bovine animals; frozen 31.428,9 42.363,8 70.197,6 47.246,5 110.018,1 29,89 48.141,7 91.279,2 89,61
0402 Milk and cream; concentrated or containing added sugar or other sweetening matter 205.858,8 209.916,5 203.934,6 196.712,9 223.610,1 1,01 137.978,2 171.884,5 24,57
0703 Onions, shallots, garlic, leeks and other alliaceous vegetables; fresh or chilled 570.766,0 564.623,1 636.050,4 538.740,7 549.266,0 -1,23 361.067,4 534.529,9 48,04
0806 Grapes; fresh or dried 61.391,2 39.464,4 53.100,7 47.901,4 65.827,4 3,39 34.211,2 60.929,5 78,10
0808 Apples, pears and quinces; fresh 314.993,9 257.895,4 225.575,4 187.204,8 239.598,8 -8,31 135.684,2 259.892,7 91,54
1001 Wheat and meslin 6.250.489,7 6.737.511,6 7.432.597,6 7.412.019,4 10.534.672,3 12,07 7.267.626,8 9.579.791,4 31,81
1005 Maize (corn) 1.692.994,5 3.191.044,8 3.253.618,5 3.267.694,3 1.139.694,5 -7,39 850.265,7 414.573,5 -51,24
1006 Rice 1.810.372,3 472.664,7 844.163,7 861.601,0 1.283.178,5 -0,88 1.128.547,2 216.760,7 -80,79
1108 Starches; inulin 873.434,4 309.972,4 483.302,5 843.192,8 851.752,6 9,97 618.943,8 562.059,7 -9,19
1201 Soya beans, whether or not broken 1.921.206,5 1.785.384,5 1.965.811,2 2.256.931,7 2.261.803,3 5,77 1.636.025,9 2.343.209,5 43,23
1202 Ground-nuts; not roasted or otherwise cooked, whether or not shelled or broken 185.828,1 282.423,3 253.679,2 194.429,7 189.742,6 -3,26 136.707,3 222.344,1 62,64
1701 Cane or beet sugar and chemically pure sucrose, in solid form 2.815.940,2 3.344.303,8 2.965.801,3 3.375.010,4 4.761.885,4 11,18 2.938.067,3 3.638.132,1 23,83
1702 Sugars, including lactose, maltose, glucose or fructose in solid form; sugar syrups without added flavouring
or colouring matter; artificial honey, whether or not mixed with natural honey; caramel
194.687,9 233.872,6 225.365,0 266.304,2 393.453,5 16,61 251.467,0 337.918,9 34,38
1801 Cocoa beans; whole or broken, raw or roasted 23.942,6 30.765,7 109.409,6 53.371,9 61.016,0 27,40 30.764,8 183.440,4 496,27
1901 Malt extract; flour/groats/meal/starch/malt extract products, no cocoa (or less than 40% by weight) and food
preparations of goods of headings 04.01 to 04.04, no cocoa (or less than 5% by weight),
44.429,8 64.326,5 51.786,7 54.461,9 59.917,2 4,41 36.879,5 53.042,2 43,83
2106 Food preparations not elsewhere specified or included 124.218,2 133.748,8 122.187,5 105.582,7 141.814,9 0,29 97.903,5 102.223,8 4,41
2303 Residues of starch manufacture, similar residues; beet-pulp, bagasse and other waste of sugar
manufacture, brewing or distilling dregs and waste, whether or not in the form of pellets
475.780,0 473.259,9 555.330,2 515.441,8 662.918,1 7,78 450.971,8 804.794,3 78,46
2304 Oil-cake and other solid residues; whether or not ground or in the form of pellets, resulting from the
extraction of soya-bean oil
3.479.611,5 3.509.820,0 3.828.672,2 4.110.604,9 4.011.839,1 4,53 2.681.852,8 3.568.274,7 33,05
2309 Preparations of a kind used in animal feeding 578.550,2 665.751,6 622.679,3 614.115,6 725.405,5 3,79 476.305,9 617.930,5 29,73
2401 Tobacco, unmanufactured; tobacco refuse 137.425,7 121.218,2 95.732,0 75.353,0 81.501,9 -14,10 49.247,0 95.763,0 94,45
2510 Natural calcium phosphates; natural aluminium calcium phosphates and phosphatic chalk 1.005.183,2 1.036.859,1 1.387.252,8 1.284.516,6 1.692.794,7 13,39 1.162.218,2 1.847.585,7 58,97
2601 Iron ores and concentrates; including roasted iron pyrites 974.516,1 1.932.961,1 3.871.226,2 5.424.731,5 5.109.636,9 54,43 3.258.535,2 4.562.398,8 40,01
2701 Coal; briquettes, ovoids and similar solid fuels manufactured from coal 82.464,7 510.864,1 2.274.907,3 2.815.324,8 3.565.029,3 151,93 2.301.432,8 3.306.428,8 43,67
2803 Carbon; carbon blacks and other forms of carbon n.e.c. 154.115,4 179.575,6 200.413,4 188.409,7 230.960,0 8,95 152.720,8 215.960,2 41,41
2818 Aluminium oxide (including artificial corundum); aluminium 622.335,3 663.778,3 702.875,6 597.105,8 648.677,4 -0,23 452.161,3 421.300,5 -6,83
2836 Carbonates; peroxocarbonates (percarbonates); commercial ammonium carbonate containing ammonium
carbamate
1.105.085,9 1.122.702,2 1.086.618,2 1.124.221,7 1.057.002,1 -0,87 723.339,9 914.679,1 26,45
2901 Acyclic hydrocarbons 1.105.224,0 899.110,9 946.903,9 1.197.039,3 898.281,1 -1,28 618.018,6 695.665,8 12,56
2902 Cyclic hydrocarbons 1.065.913,8 1.152.591,4 1.316.015,8 1.275.417,1 955.516,4 -1,17 704.618,4 1.096.589,2 55,63
116
Perub. (%)
Change (%)
17-162016 2017
2015 2016
TABEL 19.1 : PERKEMBANGAN VOLUME 190 JENIS BARANG IMPOR UTAMA INDONESIA *)
DEVELOPMENT OF INDONESIAN IMPORT QUANTITY OF 190 MAJOR COMMODITIES
JENIS BARANG
DESCRIPTION OF GOODS
Trend (%)
12-16
Jan-Ags/Jan-Aug
No. 08.05.148
20142012 2013

Lanjutan/Continued
Volume/Quantity : Ton
Perub. (%)
Change (%)
17-162016 2017
2015 2016
TABEL 19.1 : PERKEMBANGAN VOLUME 190 JENIS BARANG IMPOR UTAMA INDONESIA *)
DEVELOPMENT OF INDONESIAN IMPORT QUANTITY OF 190 MAJOR COMMODITIES
JENIS BARANG
DESCRIPTION OF GOODS
Trend (%)
12-16
Jan-Ags/Jan-Aug
No. 08.05.148
20142012 2013
2905 Acyclic alcohols and their halogenated, sulphonated, nitrated or nitrosated derivatives 830.457,5 931.714,3 1.214.848,0 844.339,9 873.993,4 0,04 604.395,8 787.274,6 30,26
2915 Acids; saturated acyclic monocarboxylic acids and their anhydrides, halides, peroxides and peroxyacids;
their halogenated, sulphonated, nitrated or nitrosated derivatives
251.317,3 250.820,4 250.836,0 309.004,1 295.849,3 5,49 209.733,2 250.158,7 19,27
2916 Acids; unsaturated acyclic monocarboxylic, cyclic monocarboxylic, their anhydrides, halides, peroxides and
peroxyacids; their halogenated, sulphonated, nitrated or nitrosated derivatives
97.789,8 104.536,5 106.165,1 102.420,3 107.802,4 1,76 74.038,3 94.589,2 27,76
2930 Organo-sulphur compounds 40.033,7 41.818,7 45.420,1 70.387,3 48.120,3 9,29 29.070,6 50.542,3 73,86
2933 Heterocyclic compounds with nitrogen hetero-atom(s) only 95.613,8 102.960,3 93.722,8 88.099,3 90.273,5 -2,67 62.132,4 74.584,3 20,04
3004 Medicaments; (not goods of heading no. 3002, 3005 or 3006) consisting of mixed or unmixed products for
therapeutic or prophylactic use, put up in measured doses (incl. those in the form
122.535,3 24.883,1 22.258,2 26.352,6 25.360,4 -26,60 16.324,3 22.930,0 40,47
3102 Fertilizers; mineral or chemical, nitrogenous 1.376.007,6 1.099.908,3 1.176.909,2 1.416.193,0 1.663.137,4 6,52 1.087.801,7 1.046.773,0 -3,77
3103 Fertilizers; mineral or chemical, phosphatic 1.971.120,9 1.153.046,4 1.803.616,3 1.920.342,5 1.738.406,5 2,62 1.222.527,8 1.799.624,5 47,21
3104 Fertilizers; mineral or chemical, potassic 2.517.756,9 2.299.330,7 2.950.703,4 2.961.050,0 2.666.330,4 3,74 1.910.077,8 2.850.988,0 49,26
3105 Fertilizers; mineral or chemical, containing 2 or 3 of the elements nitrogen, phosphorus, potassium; other
fertilisers; goods of chapter 31 in tablets or packages of gross weight not exceeding
654.395,4 430.886,4 719.655,9 1.063.861,3 810.321,7 14,24 595.053,7 971.444,7 63,25
3204 Synthetic organic colouring matter and preparations based thereon; synthetic organic products used as
fluorescent brightening agents or as luminophores; whether or not chemically
69.645,9 77.883,3 79.006,5 68.133,6 74.885,9 0,11 52.875,5 62.987,0 19,12
3206 Colouring matter and preparations thereof n.e.c. in heading no. 3203, 3204, 3205; inorganic products, kind
used as luminophores whether or not chemically defined
86.074,8 89.382,1 90.092,4 92.782,5 105.697,9 4,58 69.155,2 97.267,3 40,65
3215 Ink; printing, writing or drawing ink and other inks; whether or not concentrated or solid 13.461,5 14.411,9 14.433,8 14.079,0 16.073,2 3,37 10.638,4 13.831,6 30,02
3302 Odoriferous substances and mixtures (including alcoholic solutions) with a basis of one or more of these
substances, of a kind used as raw materials in industry; other preparations based
22.744,1 27.928,6 29.361,8 24.630,1 26.482,8 1,80 18.320,2 21.863,3 19,34
3304 Cosmetic and toilet preparations; beauty, make-up and skin care preparations (excluding medicaments,
including sunscreen or sun tan preparations), manicure or pedicure preparations
11.032,4 10.611,6 10.932,9 13.724,6 9.629,2 -0,15 6.369,2 9.607,0 50,84
3402 Organic surface-active agents (not soap); surface-active, washing (including auxiliary washing) and cleaning
preparations, containing soap or not, excluding those of heading no. 3401
115.988,7 120.074,4 130.548,2 129.761,9 116.254,6 0,83 78.738,0 105.507,6 34,00
3506 Prepared glues and other prepared adhesives, n.e.c. or included; products suitable for use as glues or
adhesives, put up for retail sale as glues or adhesives, not exceeding 1kg net weight not over 1kg, in
aerosol containers, containing chlorofluorocarbo
47.376,1 55.513,7 57.622,5 59.841,9 60.546,0 5,82 40.636,5 67.330,2 65,69
3808 Insecticides, rodenticides, fungicides, herbicides, anti-sprouting products, plant growth regulators,
disinfectants and the like, put up in forms or packings for retail sale or as preparations or forms or packings
for retail sale or as preparations or ar
58.063,5 69.308,5 71.982,3 72.636,8 99.544,9 11,91 58.379,1 96.321,5 64,99
3811 Anti-knock preparations, oxidation and gum inhibitors, viscosity improvers, anti-corrosive preparations and
the like, for mineral oils (including gasoline) or other liquids used for the same
60.378,9 65.254,7 63.073,8 62.153,2 69.173,5 2,26 43.319,1 66.409,3 53,30
3812 Prepared rubber accelerators; compound plasticisers for rubber or plastics, n.e.c. or included; anti-oxidising
preparations and other compound stabilisers for rubber or plastics
66.132,3 71.259,9 72.759,1 73.181,4 75.243,6 2,89 49.464,8 63.494,5 28,36
117

Lanjutan/Continued
Volume/Quantity : Ton
Perub. (%)
Change (%)
17-162016 2017
2015 2016
TABEL 19.1 : PERKEMBANGAN VOLUME 190 JENIS BARANG IMPOR UTAMA INDONESIA *)
DEVELOPMENT OF INDONESIAN IMPORT QUANTITY OF 190 MAJOR COMMODITIES
JENIS BARANG
DESCRIPTION OF GOODS
Trend (%)
12-16
Jan-Ags/Jan-Aug
No. 08.05.148
20142012 2013
3824 Prepared binders for foundry moulds or cores; chemical products and preparations of the chemical or allied
industries (including those consisting of mixtures of natural products), not elsewhere
103.070,0 106.155,0 144.676,7 116.441,3 131.723,1 6,00 84.550,2 133.636,8 58,06
3901 Polymers of ethylene, in primary forms 773.450,3 840.854,9 883.385,7 1.020.117,2 1.034.921,8 8,07 689.375,6 895.605,2 29,92
3902 Polymers of propylene or of other olefins, in primary forms 854.280,8 916.699,7 946.469,9 908.118,6 1.062.321,5 4,36 674.830,4 899.796,6 33,34
3903 Polymers of styrene, in primary forms 201.355,6 200.517,2 204.940,5 172.458,1 196.888,1 -1,94 126.947,8 166.080,5 30,83
3906 Acrylic polymers in primary forms 97.156,1 105.463,6 100.003,6 84.972,3 101.483,4 -1,28 67.673,2 91.037,8 34,53
3907 Polyacetals, other polyethers and epoxide resins, in primary forms; polycarbonates, alkyd resins, polyallyl
esters and other polyesters, in primary forms
367.696,3 403.274,2 409.861,4 445.953,4 490.351,6 7,00 325.994,2 393.005,4 20,56
3908 Polyamides in primary forms 71.867,9 76.899,8 79.170,2 77.051,8 85.676,4 3,60 56.639,7 74.745,5 31,97
3909 Amino-resins, phenolic resins and polyurethanes, in primary forms 80.372,6 94.958,1 88.857,7 90.031,7 97.257,9 3,34 62.578,4 83.277,6 33,08
3919 Self-adhesive plates, sheets, film, foil, tape, strip and other flat shapes, of plastics, whether or not in rolls 85.878,7 58.015,0 68.735,4 58.372,1 74.480,5 -2,75 48.930,6 64.763,8 32,36
3920 Plastics; plates, sheets, film, foil and strip (not self-adhesive); non-cellular and not reinforced, laminated,
supported or similarly combined with other materials, n.e.c. in chapter 39
178.251,5 189.785,4 170.293,4 181.887,6 242.187,2 5,87 163.279,9 206.495,0 26,47
3921 Plastic plates, sheets, film, foil and strip n.e.c. in chapter 39 127.130,1 126.869,3 135.003,6 126.924,4 154.542,3 3,99 97.829,1 124.666,8 27,43
3923 Plastic articles for the conveyance or packing of goods; stoppers, lids, caps and other closures of plastics 86.383,7 100.365,0 102.292,1 107.224,1 101.422,4 3,95 66.359,5 85.621,9 29,03
3926 Articles of plastics and articles of other materials of heading no. 3901 to 3914, n.e.c. in chapter 39 70.419,7 75.168,6 80.239,4 82.631,2 99.070,6 8,08 65.929,3 76.288,0 15,71
4002 Synthetic rubber and factice derived from oils, in primary forms or in plates, sheets or strip; mixtures of
heading no. 4001 and 4002, in primary forms or in plates, sheets or strip
295.823,8 293.054,9 294.207,3 317.829,6 335.810,1 3,40 223.719,8 296.455,1 32,51
4011 New pneumatic tyres, of rubber 141.642,2 144.226,5 176.308,2 131.223,0 201.664,6 6,31 96.945,6 115.177,2 18,81
4016 Articles of vulcanised rubber other than hard rubber, n.e.c. in 53.883,8 35.304,7 34.788,8 30.210,0 35.012,0 -9,68 22.579,4 32.855,5 45,51
4107 Leather further prepared after tanning or crusting, including parchment-dressed leather, of bovine (including
buffalo) or equine animals, without hair on, whether or not split, other than leather of without hair on, other
than leather of heading 41.14, w
13.054,1 14.831,8 14.963,1 14.853,4 16.081,4 4,27 10.705,6 17.049,2 59,26
4202 Trunks; suit, camera, jewellery, cutlery cases; travel, tool, similar bags; wholly or mainly covered by leather,
composition leather, plastic sheeting, textile materials, vulcanised fibre, paperboard
33.680,7 31.846,1 28.555,7 28.694,1 53.743,8 8,66 33.798,7 46.353,1 37,14
4702 Chemical wood pulp, dissolving grades 432.229,0 517.363,9 523.432,6 475.231,1 486.624,6 1,53 343.656,6 432.546,9 25,87
4703 Chemical wood pulp, soda or sulphate, other than dissolving grades 610.211,4 794.126,2 833.656,7 631.899,9 713.887,6 0,86 473.433,5 669.811,8 41,48
4707 Waste and scrap of paper and paperboard 2.292.488,4 2.216.423,9 2.280.384,2 1.692.350,7 2.021.051,1 -5,08 1.383.730,2 1.590.170,9 14,92
4811 Paper, paperboard, cellulose wadding and webs of cellulose fibres, coated, impregnated, covered, surface-
coloured, decorated or printed, rolls or sheets, other than goods of heading no. 4803,
109.393,1 84.070,1 86.250,4 87.145,0 96.991,5 -2,03 63.682,2 72.941,6 14,54
4819 Cartons, boxes, cases, bags and the like, of paper, paperboard, cellulose wadding or fibres; box files, letter
trays and the like, of paper or paperboard, of a kind used in offices, shops or the like
70.219,5 77.513,3 86.409,4 91.719,5 98.477,6 8,81 62.516,3 82.044,7 31,24
5201 Cotton; not carded or combed 610.773,5 672.197,2 705.135,5 672.925,3 678.248,3 2,13 440.128,2 617.744,5 40,36
5208 Woven fabrics of cotton, containing 85% or more by weight of cotton, weighing not more than 200 g/m2 42.910,0 42.870,3 40.560,7 39.992,6 39.670,2 -2,24 27.157,3 30.622,1 12,76
118

Lanjutan/Continued
Volume/Quantity : Ton
Perub. (%)
Change (%)
17-162016 2017
2015 2016
TABEL 19.1 : PERKEMBANGAN VOLUME 190 JENIS BARANG IMPOR UTAMA INDONESIA *)
DEVELOPMENT OF INDONESIAN IMPORT QUANTITY OF 190 MAJOR COMMODITIES
JENIS BARANG
DESCRIPTION OF GOODS
Trend (%)
12-16
Jan-Ags/Jan-Aug
No. 08.05.148
20142012 2013
5209 Woven fabrics of cotton, containing 85% or more by weight of cotton, weighing more than 200g/m2 28.784,5 27.606,2 23.643,3 23.863,6 24.191,7 -4,81 16.978,7 19.972,6 17,63
5210 Woven fabrics of cotton, containing less than 85% by weight of cotton, mixed mainly or solely with man-
made fibres, weighing not more than 200 g/m2
15.320,8 16.299,5 12.709,1 13.731,1 18.249,9 1,80 12.423,9 14.127,3 13,71
5402 Synthetic filament yarn (other than sewing thread), not put up for retail sale, including synthetic
monofilament of less than 67 decitex
118.000,0 121.906,1 142.741,8 133.214,2 155.090,6 6,56 104.850,1 126.460,5 20,61
5407 Woven fabrics of synthetic filament yarn, including woven fabrics obtained from materials of heading no.
5404
90.254,6 90.240,6 96.267,9 103.021,3 155.997,2 13,05 106.494,3 128.602,9 20,76
5502 Artificial filament tow 33.251,0 41.226,6 40.270,9 36.099,1 38.204,3 1,46 25.875,7 36.373,4 40,57
5503 Synthetic staple fibres, not carded, combed or otherwise processed for spinning 139.897,6 161.097,2 159.272,5 140.211,2 186.159,1 4,42 115.547,2 156.613,9 35,54
5504 Artificial staple fibres, not carded, combed or otherwise processed for spinning 108.313,1 66.481,3 91.466,3 88.686,6 97.949,7 0,87 67.331,2 68.889,5 2,31
5513 Woven fabrics of synthetic staple fibres, containing less than 85% by weight of such fibres, mixed mainly or
solely with cotton, of a weight not exceeding 170g/m2
27.186,8 26.696,3 24.233,4 20.942,6 20.581,5 -7,68 14.330,4 17.652,9 23,18
5603 Nonwovens; whether or not impregnated, coated, covered or laminated 77.527,3 61.743,1 73.089,6 72.085,0 74.409,3 0,73 50.141,1 59.850,5 19,36
5903 Textile fabrics impregnated, coated, covered or laminated with plastics, other than those of heading no.
5902
60.221,6 72.359,4 76.640,2 69.177,8 69.765,3 2,52 47.132,9 65.616,0 39,21
6002 Fabrics; knitted or crocheted, other than those of heading 60.01, of a width not exceeding 30cm, containing
by weight 5% or more of elastomeric yarn or rubber thread
27.897,6 27.321,4 22.855,9 23.534,5 23.723,3 -4,62 15.720,0 17.783,1 13,12
6004 Fabrics; knitted or crocheted fabrics of a width exceeding 30 cm, other than those of heading 60.01,
containing by weight 5% or more of elastomeric yarn or rubber thread
34.293,8 34.119,0 46.436,0 43.656,3 24.473,9 -4,19 17.001,3 20.017,1 17,74
6006 Fabrics; knitted or crocheted fabrics, other than those of headings 60.01 to 60.04 71.013,8 68.766,5 70.373,3 72.423,8 86.277,8 4,51 61.942,4 77.408,9 24,97
6406 Footwear; parts of footwear; removable in-soles, heel cushions and similar articles; gaiters, le.g.ings and
similar articles, and parts thereof
22.852,2 20.601,5 18.737,0 17.934,1 20.557,1 -3,44 13.153,1 18.191,7 38,31
6907 Ceramic flags and paving, hearth or wall tiles, unglazed; unglazed ceramic mosaic cubes and the like,
whether or not on a backing
572.083,6 521.165,9 734.888,5 745.303,9 928.280,0 14,18 572.524,3 922.635,8 61,15
7108 Gold (including gold plated with platinum) unwrought or in semi-manufactured forms, or in powder form 7,3 10,2 7,1 24,0 22,1 35,86 5,8 18,9 226,19
7204 Ferrous waste and scrap; remelting scrap ingots of iron or steel 1.943.844,5 2.398.734,8 2.136.801,8 1.019.586,1 1.019.790,8 -19,31 590.589,0 1.431.077,9 142,31
7207 Iron or non-alloy steel; semi-finished products thereof 3.756.602,2 3.778.901,9 3.575.653,3 4.205.483,3 4.925.750,9 6,70 3.372.458,4 3.079.727,1 -8,68
7208 Iron or non-alloy steel; flat-rolled products of a width of 600mm or more, hot-rolled, not clad, plated or coated 2.369.217,0 2.335.498,7 1.819.638,9 1.534.926,4 1.380.091,8 -13,93 930.972,1 1.111.928,8 19,44
7209 Iron or non-alloy steel; flat-rolled products, width 600mm or more, cold-rolled (cold-reduced), not clad, plated
or coated
1.212.547,6 1.129.075,8 939.930,7 784.941,5 849.139,6 -10,20 523.512,6 683.710,0 30,60
7210 Iron or non-alloy steel; flat-rolled products, width 600mm or more, clad, plated or coated 859.729,0 1.000.677,9 942.736,1 883.169,8 1.061.704,8 3,02 689.280,0 691.725,7 0,35
7212 Iron or non-alloy steel; flat-rolled products, width less than 600mm, clad, plated or coated 52.084,5 47.299,6 114.391,6 269.190,4 318.527,9 70,93 206.951,9 274.799,0 32,78
7219 Stainless steel; flat-rolled products of width of 600mm or more 215.602,9 229.752,1 252.915,8 226.715,7 232.914,2 1,42 152.995,5 203.634,8 33,10
7225 Alloy steel flat-rolled products, of a width 600mm or more 319.839,1 393.209,4 399.687,4 569.077,9 837.846,8 25,81 507.488,3 1.267.360,5 149,73
7227 Steel, alloy; bars and rods, hot-rolled, in irregularly wound coils 319.553,1 567.558,1 634.768,9 548.276,1 758.074,0 18,45 467.005,1 425.191,9 -8,95
119

Lanjutan/Continued
Volume/Quantity : Ton
Perub. (%)
Change (%)
17-162016 2017
2015 2016
TABEL 19.1 : PERKEMBANGAN VOLUME 190 JENIS BARANG IMPOR UTAMA INDONESIA *)
DEVELOPMENT OF INDONESIAN IMPORT QUANTITY OF 190 MAJOR COMMODITIES
JENIS BARANG
DESCRIPTION OF GOODS
Trend (%)
12-16
Jan-Ags/Jan-Aug
No. 08.05.148
20142012 2013
7228 Alloy steel bars, rods, shapes and sections; hollow drill bars and rods, of alloy or non-alloy steel 658.479,0 714.376,9 557.396,2 356.678,8 365.542,8 -17,07 240.981,7 316.313,7 31,26
7304 Tubes, pipes and hollow profiles, seamless, of iron (other than cast iron) or steel 752.599,6 627.916,9 581.447,2 426.523,4 319.287,0 -18,95 208.184,6 271.613,8 30,47
7307 Tube or pipe fittings (e.g. couplings, elbows, sleeves), of iron or steel 71.999,4 127.914,1 74.559,4 60.547,2 56.002,3 -11,75 39.888,6 24.892,7 -37,59
7308 Structures of iron or steel and parts thereof; plates, rods, angles, shapes, sections, tubes and the like,
prepared for use in structures
170.258,6 175.512,1 217.502,1 241.881,3 172.437,0 3,52 121.468,3 102.493,2 -15,62
7318 Screws, bolts, nuts, coach screws, screw hooks, rivets, cotters, cotter-pins, washers (including spring
washers) and similar articles, of iron or steel
99.939,2 112.301,4 120.862,1 107.230,6 111.609,3 1,76 73.515,2 68.575,3 -6,72
7326 Iron or steel; articles, n.e.c. in chapter 73 105.300,8 110.353,9 140.633,2 133.520,4 113.509,4 3,47 75.627,8 72.311,4 -4,39
7403 Copper; refined and copper alloys, unwrought 129.746,9 105.952,9 115.829,8 131.773,1 131.344,6 2,46 89.027,1 107.061,9 20,26
7601 Aluminium; unwrought 440.659,9 386.388,3 249.433,5 271.392,9 312.576,5 -9,88 185.394,8 317.843,7 71,44
7606 Aluminium; plates, sheets and strip, thickness exceeding 0.2mm 114.745,1 124.709,2 174.014,4 124.130,0 117.837,7 0,49 83.728,7 134.652,2 60,82
7607 Aluminium foil (whether or not printed or backed with paper, paperboard, plastics or similar backing
materials) of a thickness (excluding any backing) not exceeding 0.2mm thickness not exceeding 0.2mm not
exceeding 0.2mm
21.815,4 29.297,6 37.541,3 34.362,3 42.004,9 15,83 28.355,2 41.441,2 46,15
7901 Zinc; unwrought 136.196,0 136.278,0 129.714,6 118.828,3 131.879,7 -1,99 86.485,9 120.636,9 39,49
8207 Tools, interchangeable; for hand tools, whether or not power-operated, or for machine tools (pressing,
stamping, punching, drilling etc), including dies for drawing or extruding
15.604,8 16.605,8 8.569,1 15.354,8 13.736,0 -3,28 8.227,7 16.458,2 100,03
8302 Base metal mountings, fittings and similar articles for furniture, doors, staircases, windows, trunks, chests
etc, castors with mountings of base metal, automatic door closers of base metal trunks, chests, caskets or
the like, of base metal, for suitcase
78.448,1 78.468,3 81.184,9 71.813,2 81.042,7 -0,24 51.881,8 60.724,8 17,04
8402 Boilers; steam or other vapour generating (other than central heating hot water boilers, capable also of
producing low pressure steam), super heated water boilers
72.897,8 89.844,8 101.236,5 97.707,2 80.698,4 2,91 53.345,6 57.423,8 7,64
8406 Turbines; steam and other vapour turbines 61.335,1 49.134,8 32.438,8 34.753,4 42.545,7 -10,22 18.048,9 13.571,0 -24,81
8407 Reciprocating or rotary internal combustion piston engines 27.754,1 24.885,1 23.458,7 24.111,9 14.674,7 -12,24 10.614,6 12.591,3 18,62
8408 Compression-ignition internal combustion piston engines (diesel or semi-diesel engines) 77.458,0 75.570,1 58.094,3 45.762,7 61.671,1 -9,13 42.542,1 57.935,8 36,18
8409 Parts suitable for use solely or principally with the engines of heading no. 8407 or 8408 102.334,5 107.375,3 101.984,3 67.345,4 62.308,4 -13,57 41.988,8 55.312,8 31,73
8411 Turbo-jets, turbo-propellers and other gas turbines 7.476,4 12.788,1 8.465,3 4.573,7 3.164,6 -24,02 1.529,8 8.009,5 423,58
8413 Pumps; for liquids, whether or not fitted with measuring device, liquid elevators 100.646,6 99.268,4 93.917,0 86.757,3 94.059,7 -2,66 66.295,4 68.838,4 3,84
8414 Air or vacuum pumps, air or other gas compressors and fans; ventilating or recycling hoods incorporating a
fan whether or not fitted with filters
114.230,3 133.204,5 129.639,2 113.954,8 124.062,3 0,09 80.558,0 93.026,3 15,48
8415 Air conditioning machines; comprising a motor driven fan and elements for changing the temperature and
humidity, including those machines in which the humidity cannot be separately or split-system
94.185,9 100.730,0 86.662,8 69.943,8 89.864,1 -4,48 63.505,8 58.752,5 -7,48
120

Lanjutan/Continued
Volume/Quantity : Ton
Perub. (%)
Change (%)
17-162016 2017
2015 2016
TABEL 19.1 : PERKEMBANGAN VOLUME 190 JENIS BARANG IMPOR UTAMA INDONESIA *)
DEVELOPMENT OF INDONESIAN IMPORT QUANTITY OF 190 MAJOR COMMODITIES
JENIS BARANG
DESCRIPTION OF GOODS
Trend (%)
12-16
Jan-Ags/Jan-Aug
No. 08.05.148
20142012 2013
8417 Furnaces and ovens; industrial or laboratory, including incinerators, non-electric 24.982,1 23.529,6 97.883,5 193.161,1 111.460,0 66,47 78.284,5 68.614,4 -12,35
8418 Refrigerators, freezers and other refrigerating or freezing equipment, electric or other; heat pumps other
than air conditioning machines of heading no. 8415
64.665,1 75.687,9 72.710,5 61.768,2 74.561,2 0,82 45.578,9 55.362,8 21,47
8419 Machinery, plant (not domestic), or laboratory equipment; electrically heated or not, (excluding items in
85.14) for the treatment of materials by a process involving change of
54.130,9 68.690,7 64.884,6 76.895,1 62.678,7 4,14 37.946,0 51.390,6 35,43
8421 Centrifuges, including centrifugal dryers; filtering or purifying machinery and apparatus for liquids or gases 54.215,0 59.874,2 62.576,4 60.060,4 96.755,3 12,32 49.308,3 64.168,8 30,14
8422 Dish washing machines; machinery for cleaning, drying, filling, closing, sealing, capsuling or labelling bottles,
cans, boxes, bags, etc, machinery for aerating beverages
11.581,7 14.198,5 15.278,6 16.916,7 15.510,7 7,89 11.132,3 10.012,6 -10,06
8426 Derricks, cranes, including cable cranes, mobile lifting frames, straddle carriers and works trucks fitted with a
crane
119.938,3 109.195,3 98.130,0 108.348,4 100.482,2 -3,55 44.879,4 83.744,1 86,60
8428 Lifting, handling, loading or unloading machinery; n.e.c. in heading no. 8425, 8426 or 8427 (e.g. lifts,
escalators, conveyors, teleferics)
58.646,2 76.770,2 112.028,0 124.443,0 124.907,9 22,08 87.619,2 71.521,6 -18,37
8429 Bulldozers, graders, levellers, scrapers, angledozers, mechanical shovels, excavators, shovel loaders,
tamping machines and road rollers, self-propelled
354.623,7 182.653,1 146.792,5 133.649,3 102.756,2 -24,34 53.479,0 173.353,6 224,15
8431 Machinery parts; used solely or principally with the machinery of heading no. 8425 to 8430 628.357,4 152.907,4 140.270,4 134.263,0 141.296,2 -26,76 85.666,2 134.827,0 57,39
8438 Machinery n.e.c. in this chapter, for the industrial preparation or manufacture of food or drink; other than
machinery for extraction or preparation of animal or fixed vegetable fats or oils products spaghetti or similar
products
21.983,9 14.537,6 16.454,0 17.806,0 15.513,8 -4,82 10.969,6 12.890,4 17,51
8439 Machinery; for making pulp of fibrous cellulosic material, or for making or finishing paper or paperboard 16.325,0 24.017,4 13.351,0 16.687,2 17.151,8 -2,62 6.108,6 7.461,2 22,14
8441 Machines; for making up paper pulp, paper or paperboard, including cutting machines of all kinds 17.119,9 20.421,1 15.274,3 12.517,2 13.457,3 -9,25 10.136,3 8.480,7 -16,33
8443 Printing machinery; used for printing by means of plates, cylinders and other printing components of heading
84.42; other printers, copying machines and facsimile machines, whether or not textile, leather, wallpaper,
wrapping paper, linoleum or other mat
64.670,6 50.605,1 47.741,0 42.594,0 43.592,9 -9,16 28.732,9 41.558,0 44,64
8455 Metal-rolling mills and rolls therefor 23.067,0 42.493,3 27.791,7 24.848,2 44.205,2 7,94 16.095,6 20.863,0 29,62
8462 Machine-tools; (including presses) for working metal by forging, hammering or die-stamping, for bending,
folding, straightening, flattening, shearing or punching metal
50.262,5 60.104,9 53.335,0 27.714,8 30.284,9 -16,37 19.493,9 22.817,9 17,05
8466 Machine-tools; parts and accessories suitable for use solely or principally with the machines of headings
8456 to 8465, and tool holders for any type of tool for working in the hand
212.066,3 13.124,4 10.604,3 8.744,4 7.293,0 -51,06 5.175,2 7.513,3 45,18
8471 Automatic data processing machines and units thereof, magnetic or optical readers, machines for
transcribing data onto data media in coded form and machines for processing such data, not
44.090,4 40.558,2 34.089,3 36.269,0 32.609,0 -6,90 15.612,6 22.119,5 41,68
8473 Machinery; parts and accessories (not covers, carrying cases and the like) suitable for use solely or
principally with machines of heading no. 8469 to 8472 heading 84.69 (other than covers, carrying cases and
the like) machines of heading 84.69 (other th
36.668,2 11.305,5 11.242,7 9.060,9 11.471,0 -22,47 7.146,9 8.928,1 24,92
8474 Machinery for sorting, screening, separating, washing, crushing, grinding, mixing or kneading earth, stone,
ores in solid form, shaping, moulding machinery for solid mineral fuels substances other mineral substances
86.680,5 96.412,2 136.045,9 129.433,4 133.977,5 12,36 95.859,6 87.810,1 -8,40
121

Lanjutan/Continued
Volume/Quantity : Ton
Perub. (%)
Change (%)
17-162016 2017
2015 2016
TABEL 19.1 : PERKEMBANGAN VOLUME 190 JENIS BARANG IMPOR UTAMA INDONESIA *)
DEVELOPMENT OF INDONESIAN IMPORT QUANTITY OF 190 MAJOR COMMODITIES
JENIS BARANG
DESCRIPTION OF GOODS
Trend (%)
12-16
Jan-Ags/Jan-Aug
No. 08.05.148
20142012 2013
8477 Machinery; for working rubber or plastics or for the manufacture of products from these materials, n.e.c. in
this chapter
82.630,7 70.131,6 67.117,6 52.531,5 60.410,8 -8,75 38.838,5 45.004,8 15,88
8479 Machinery and mechanical appliances; having individual functions, n.e.c. in this chapter 74.859,1 82.303,2 90.023,3 86.933,2 77.736,0 1,31 50.866,5 59.507,3 16,99
8480 Moulding boxes for metal foundry, moulding patterns, moulds for metals (excluding ingot moulds), metal
carbides, glass, mineral materials, rubber or plastics
27.090,5 32.728,4 29.858,3 32.433,5 28.952,0 1,25 18.072,7 40.182,7 122,34
8481 Taps, cocks, valves and similar appliances for pipes, boiler shells, tanks, vats or the like, including pressure-
reducing valves and thermostatically controlled valves
78.558,1 85.068,3 76.161,0 74.501,5 65.239,9 -4,92 44.434,0 48.519,9 9,20
8482 Ball or roller bearings 50.867,5 88.808,7 58.341,4 50.710,6 50.574,6 -5,56 33.378,3 45.571,1 36,53
8483 Transmission shafts (including cam and crank) and cranks; bearing housings and plain shaft bearings;
gears and gearing; ball or roller screws; gear boxes and other speed changers; flywheels
104.203,8 95.836,8 88.998,8 68.401,9 66.997,5 -11,49 45.127,9 66.685,2 47,77
8501 Electric motors and generators (excluding generating sets) 64.592,4 77.969,4 75.864,3 72.487,9 81.456,4 3,99 53.865,5 60.103,3 11,58
8502 Electric generating sets and rotary converters 80.358,6 72.357,2 79.516,5 57.202,0 56.892,7 -8,84 39.135,2 71.885,9 83,69
8503 Electric motors and generators; parts suitable for use solely or principally with the machines of heading no.
8501 or 8502
17.365,6 14.881,3 15.146,7 20.507,4 20.464,4 6,71 12.743,6 19.012,6 49,19
8504 Electric transformers, static converters (e.g. rectifiers) and inductors 68.360,2 50.367,1 55.118,5 46.066,6 49.514,4 -7,08 32.040,4 56.147,1 75,24
8507 Electric accumulators, including separators therefor; whether or not rectangular (including square) 40.788,4 38.045,0 38.479,8 37.450,3 40.568,4 -0,27 25.131,7 44.089,5 75,43
8511 Ignition or starting equipment; used for spark-ignition or compression-ignition internal combustion engines;
generators and cut outs used in conjunction with such engines
25.590,3 27.566,6 22.874,7 17.414,1 18.582,4 -10,41 11.480,9 13.747,6 19,74
8512 Lighting or visual signalling equipment (excluding articles of heading no. 8539), windscreen wipers,
defrosters and demisters; electrical, of a kind used for cycles or motor vehicles generators
14.835,1 15.041,4 15.766,3 13.414,5 14.428,9 -1,69 9.624,2 13.946,4 44,91
8514 Industrial or laboratory electric furnaces and ovens (including those functioning by induction or dielectric
loss); other industrial or laboratory equipment for the heat treatment of materials by
10.036,0 12.817,5 44.030,8 37.028,0 44.442,4 49,73 35.671,2 19.257,5 -46,01
8515 Electric (electrically heated gas) soldering, brazing, welding machines and apparatus, capable or not of
cutting, electric machines and apparatus for hot spraying of metals or sintered
15.250,4 13.544,5 14.071,7 17.307,3 14.792,5 1,86 11.202,7 8.313,8 -25,79
8516 Electric water, space, soil heaters; electro-thermic hair-dressing apparatus; hand dryers, irons; electro-
thermic appliances for domestic purposes; electro heating resistors, not of heading no.
45.024,6 46.153,8 38.492,2 35.218,2 37.637,9 -6,09 24.721,0 35.807,3 44,85
8517 Telephone sets, including telephones for cellular networks or for other wireless networks; other apparatus
for the transmission or reception of voice, images or other data (including wired/wireless
51.030,3 47.760,2 32.328,6 31.026,5 33.123,7 -12,15 21.122,1 30.670,2 45,20
8518 Microphones and their stands; loudspeakers, mounted or not in their enclosures; headphones and
earphones, combined or not with a microphone, and sets of a microphone and one or more
36.847,7 37.192,7 32.769,0 27.854,1 37.019,2 -2,76 24.021,5 31.510,9 31,18
8522 Sound or video recording apparatus; parts and accessories suitable for use solely or principally with the
apparatus of heading 8519 or
10.171,1 8.392,8 9.208,7 7.544,7 9.025,2 -3,40 5.998,6 6.317,3 5,31
8523 Discs, tapes, solid-state non-volatile storage devices, smart cards and other media for the recording of
sound or of other phenomena, whether or not recorded, including matrices and
5.677,5 3.652,6 2.928,3 2.783,0 4.252,3 -8,15 2.723,5 3.833,9 40,77
122

Lanjutan/Continued
Volume/Quantity : Ton
Perub. (%)
Change (%)
17-162016 2017
2015 2016
TABEL 19.1 : PERKEMBANGAN VOLUME 190 JENIS BARANG IMPOR UTAMA INDONESIA *)
DEVELOPMENT OF INDONESIAN IMPORT QUANTITY OF 190 MAJOR COMMODITIES
JENIS BARANG
DESCRIPTION OF GOODS
Trend (%)
12-16
Jan-Ags/Jan-Aug
No. 08.05.148
20142012 2013
8525 Transmission apparatus for radio-broadcasting or television, whether or not incorporating reception
apparatus or sound recording or reproducing apparatus; television cameras, digital reception apparatus
2.209,9 4.072,3 1.782,1 1.436,5 2.390,6 -8,47 1.259,5 2.067,6 64,17
8528 Monitors and projectors, not incorporating television reception apparatus; reception apparatus for television,
whether or not incorporating radio-broadcast receivers or sound or video
12.572,8 14.679,9 13.999,4 10.604,3 13.420,6 -1,93 7.823,7 11.804,9 50,89
8529 Transmission apparatus; parts suitable for use solely or principally with the apparatus of heading no. 8525 to
8528
60.027,4 45.329,2 49.198,3 38.276,4 38.492,8 -10,04 26.778,9 33.180,6 23,91
8532 Electrical capacitors; fixed, variable or adjustable (pre-set) 13.134,6 12.582,0 10.755,3 8.527,2 8.621,2 -11,58 6.161,4 7.114,7 15,47
8533 Electrical resistors (including rheostats and potentiometers), excluding heating resistors 4.772,2 5.341,4 4.105,2 3.886,3 3.081,9 -11,24 2.117,4 2.683,7 26,75
8534 Circuits; printed 9.029,8 9.637,5 10.421,0 8.595,0 8.385,3 -2,59 5.860,6 7.426,0 26,71
8535 Electrical apparatus for switching, protecting electrical circuits, for making connections to or in electrical
circuits; for a voltage exceeding 1000 volts
13.604,6 10.799,8 10.406,9 16.062,3 17.720,5 9,70 13.081,9 11.150,6 -14,76
8536 Electrical apparatus for switching, protecting electrical circuits, for making connections to or in electrical
circuits, for a voltage not exceeding 1000 volts; connectors for optical fibres, optical fibre
50.036,2 49.599,1 46.428,6 40.540,8 44.689,4 -4,19 30.074,2 41.877,4 39,25
8537 Boards, panels, consoles, desks, cabinets, bases with apparatus of heading no. 8535, 8536 for electricity
control and distribution, (other than switching apparatus of heading no. 8517)
25.439,9 28.167,9 40.283,7 104.718,8 74.751,1 41,46 40.809,9 30.305,0 -25,74
8538 Electrical apparatus; parts suitable for use solely or principally with the apparatus of heading no. 8535, 8536
and 8537
12.515,6 12.057,3 11.926,1 14.403,1 13.377,2 3,16 8.728,3 15.258,7 74,82
8539 Lamps; electric filament or discharge lamps, including sealed beam lamp units and ultra-violet or infra-red
lamps, arc-lamps
34.474,1 38.398,2 38.055,2 32.991,6 28.310,1 -5,31 17.897,4 22.915,4 28,04
8541 Diodes, transistors, similar semiconductor devices; including photovoltaic cells assembled or not in modules,
panels, light emitting mounted piezo-electric crystals
7.947,4 11.694,9 7.774,0 8.903,0 8.712,2 -0,89 5.748,0 8.336,9 45,04
8542 Electronic integrated circuits 10.780,4 12.654,0 10.423,9 9.723,7 10.441,3 -3,22 7.723,2 7.909,8 2,42
8543 Electrical machines and apparatus; having individual functions, not specified or included elsewhere in this
chapter
18.302,1 45.014,2 17.020,4 36.755,6 37.679,7 13,22 20.714,1 50.421,4 143,42
8544 Insulated wire, cable and other electric conductors, connector fitted or not; optical fibre cables of individually
sheathed fibres, whether or not assembled with electric conductors or fitted with
131.805,7 113.925,0 103.619,1 96.702,9 104.772,9 -6,04 66.482,3 103.684,1 55,96
8703 Motor cars and other motor vehicles; principally designed for the transport of persons (other than those of
heading no. 8702), including station wagons and racing cars
225.905,1 202.496,1 139.818,8 114.375,0 113.042,6 -17,77 80.887,9 94.734,8 17,12
8704 Vehicles; for the transport of goods 252.286,9 102.928,1 80.331,1 72.505,0 53.528,3 -29,19 33.883,6 112.718,8 232,66
8708 Motor vehicles; parts and accessories, of heading no. 8701 to 8705 294.085,0 338.653,4 295.620,8 287.420,1 273.403,5 -3,05 181.481,0 262.830,7 44,83
8710 Tanks and other armoured fighting vehicles; motorised, whether or not fitted with weapons, and parts of
such vehicles
742,6 1.771,9 2.993,4 3.037,5 5.298,6 56,35 4.056,4 3.055,1 -24,68
8714 Vehicles; parts and accessories of heading no. 8711 to 8713 181.607,4 170.977,3 186.528,0 161.560,9 187.071,5 0,03 128.891,8 121.714,9 -5,57
8803 Aircraft; parts of heading no. 8801 or 8802 1.360,6 1.252,8 1.000,6 849,4 1.430,8 -2,84 956,4 653,1 -31,71
8901 Cruise ships, excursion boats, ferry-boats, cargo ships, barges and similar vessels for the transport of
persons or goods
1.126.852,4 557.309,1 498.107,7 387.322,8 931.279,3 -7,18 357.711,0 670.173,7 87,35
123
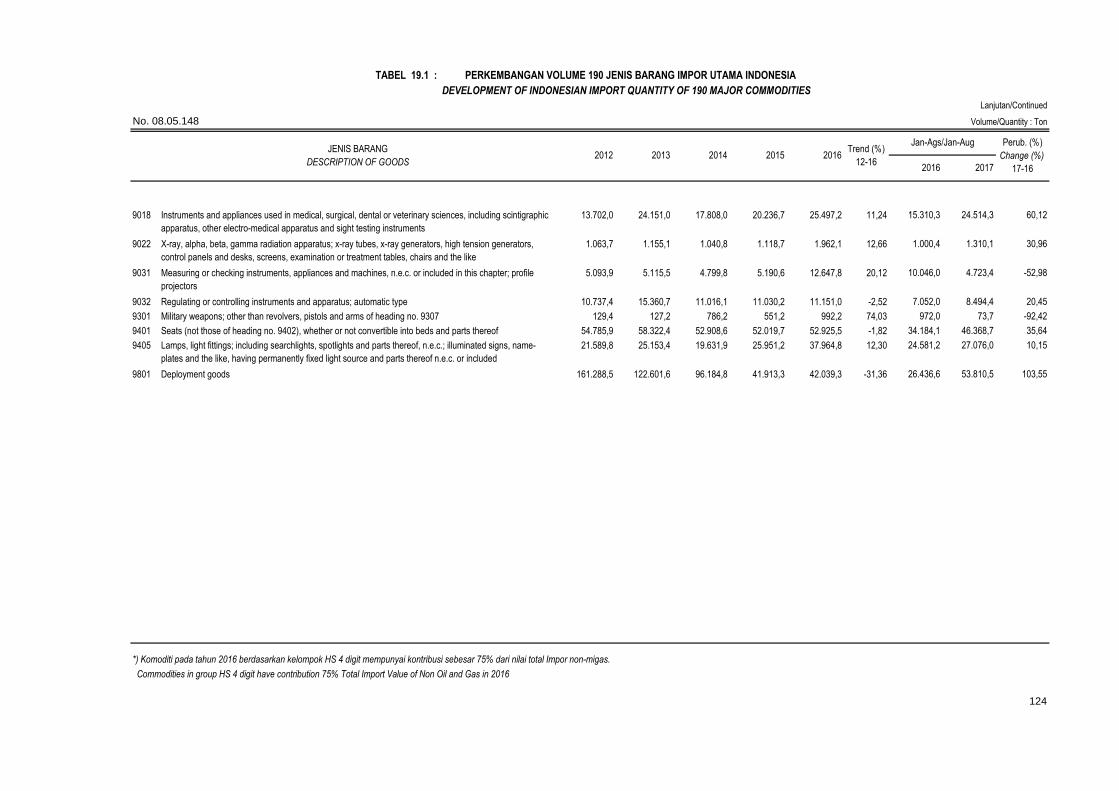
Lanjutan/Continued
Volume/Quantity : Ton
Perub. (%)
Change (%)
17-162016 2017
2015 2016
TABEL 19.1 : PERKEMBANGAN VOLUME 190 JENIS BARANG IMPOR UTAMA INDONESIA *)
DEVELOPMENT OF INDONESIAN IMPORT QUANTITY OF 190 MAJOR COMMODITIES
JENIS BARANG
DESCRIPTION OF GOODS
Trend (%)
12-16
Jan-Ags/Jan-Aug
No. 08.05.148
20142012 2013
9018 Instruments and appliances used in medical, surgical, dental or veterinary sciences, including scintigraphic
apparatus, other electro-medical apparatus and sight testing instruments
13.702,0 24.151,0 17.808,0 20.236,7 25.497,2 11,24 15.310,3 24.514,3 60,12
9022 X-ray, alpha, beta, gamma radiation apparatus; x-ray tubes, x-ray generators, high tension generators,
control panels and desks, screens, examination or treatment tables, chairs and the like
1.063,7 1.155,1 1.040,8 1.118,7 1.962,1 12,66 1.000,4 1.310,1 30,96
9031 Measuring or checking instruments, appliances and machines, n.e.c. or included in this chapter; profile
projectors
5.093,9 5.115,5 4.799,8 5.190,6 12.647,8 20,12 10.046,0 4.723,4 -52,98
9032 Regulating or controlling instruments and apparatus; automatic type 10.737,4 15.360,7 11.016,1 11.030,2 11.151,0 -2,52 7.052,0 8.494,4 20,45
9301 Military weapons; other than revolvers, pistols and arms of heading no. 9307 129,4 127,2 786,2 551,2 992,2 74,03 972,0 73,7 -92,42
9401 Seats (not those of heading no. 9402), whether or not convertible into beds and parts thereof 54.785,9 58.322,4 52.908,6 52.019,7 52.925,5 -1,82 34.184,1 46.368,7 35,64
9405 Lamps, light fittings; including searchlights, spotlights and parts thereof, n.e.c.; illuminated signs, name-
plates and the like, having permanently fixed light source and parts thereof n.e.c. or included
21.589,8 25.153,4 19.631,9 25.951,2 37.964,8 12,30 24.581,2 27.076,0 10,15
9801 Deployment goods 161.288,5 122.601,6 96.184,8 41.913,3 42.039,3 -31,36 26.436,6 53.810,5 103,55
124
Commodities in group HS 4 digit have contribution 75% Total Import Value of Non Oil and Gas in 2016
*) Komoditi pada tahun 2016 berdasarkan kelompok HS 4 digit mempunyai kontribusi sebesar 75% dari nilai total Impor non-migas.

Lanjutan/Continued
Nilai/Value : Ribu/Thousand US$
0102 Bovine animals; live 285.911,6 341.429,6 682.130,0 545.576,2 601.463,2 21,60 379.743,5 429.271,0 13,04
AUSTRALIA/AUSTRALIA 285.911,6 341.421,9 682.097,5 545.576,2 601.463,2 21,61 379.743,5 429.270,9 13,04
JERMAN/GERMANY - - 0,9 - - - - - -
INGGRIS/UNITED KINGDOM - - 27,0 - - - - - -
AMERIKA SERIKAT/UNITED STATES - - 4,6 - - - - - -
REP.AFRIKA SELATAN/SOUTH AFRICA - - - - - - - - -
NEGARA LAINNYA/OTHER COUNTRIES - 7,7 - - - - - - -
0202 Meat of bovine animals; frozen 127.714,9 189.415,4 318.469,8 215.119,4 447.061,4 30,12 207.578,7 346.509,6 66,93
AUSTRALIA/AUSTRALIA 92.297,1 140.727,2 237.411,1 163.201,7 231.810,6 22,02 160.964,4 163.312,6 1,46
INDIA/INDIA - - - - 141.463,1 - 1.274,0 127.310,4 9.892,97
SELANDIA BARU/NEW ZEALAND 29.586,9 38.147,6 65.411,3 41.185,1 50.983,9 12,36 32.169,2 26.590,7 -17,34
AMERIKA SERIKAT/UNITED STATES 5.830,8 10.370,8 15.270,0 10.426,9 21.143,7 29,46 12.382,9 25.717,0 107,68
SPANYOL/SPAIN - - - - 1.270,1 - 464,6 2.809,9 504,80
NEGARA LAINNYA/OTHER COUNTRIES - 169,8 377,5 305,7 390,1 - 324 769 -
0402 Milk and cream; concentrated or containing added sugar or other sweetening matter 710.108,3 851.443,8 896.847,2 511.921,8 459.286,1 -12,89 282.403,8 418.228,3 48,10
SELANDIA BARU/NEW ZEALAND 238.326,2 250.575,7 257.960,5 146.762,9 152.712,9 -13,28 97.301,5 121.144,7 24,50
AMERIKA SERIKAT/UNITED STATES 105.924,7 215.096,8 201.096,6 94.252,4 93.226,0 -10,24 50.068,9 63.199,0 26,22
AUSTRALIA/AUSTRALIA 109.555,1 122.476,2 172.433,0 125.597,7 87.480,8 -4,16 56.117,4 76.140,4 35,68
PERANCIS/FRANCE 31.507,4 22.532,9 74.089,5 37.791,2 32.577,7 6,01 22.413,4 30.793,7 37,39
BELGIA/BELGIUM 33.489,2 53.166,1 53.092,9 41.765,6 27.192,7 -6,37 17.377,7 54.724,4 214,91
NEGARA LAINNYA/OTHER COUNTRIES 191.305,8 187.596,1 138.174,6 65.752,1 66.095,9 -27,20 39.125,0 72.226,0 84,60
0703 Onions, shallots, garlic, leeks and other alliaceous vegetables; fresh or chilled 310.016,0 428.921,0 414.190,7 368.735,1 482.960,0 7,63 295.107,9 504.881,4 71,08
R.R. TIONGKOK/CHINA 241.894,9 363.484,0 351.635,7 344.410,0 435.889,8 11,89 266.418,0 448.990,8 68,53
SELANDIA BARU/NEW ZEALAND 6.555,3 6.539,8 14.519,9 10.404,0 20.379,9 31,43 19.857,5 23.080,3 16,23
INDIA/INDIA 20.264,0 37.893,7 24.560,4 4.844,6 13.688,3 -24,73 6.587,4 28.051,5 325,83
BELANDA/NETHERLANDS 3.298,3 40,3 6.184,4 8.106,6 11.342,5 117,59 1.059,9 4.069,1 283,91
VIETNAM/VIET NAM 14.650,1 8.622,1 5.576,5 24,9 900,0 -68,11 765,0 - -
NEGARA LAINNYA/OTHER COUNTRIES 23.353,5 12.341,1 11.713,7 945,0 759,4 -61,02 420,1 689,7 64,18
0806 Grapes; fresh or dried 126.866,0 105.192,8 154.776,4 144.296,2 201.573,0 13,23 99.920,2 183.905,7 84,05
AMERIKA SERIKAT/UNITED STATES 36.702,5 39.414,2 52.011,9 47.240,5 56.067,8 10,83 8.083,1 27.268,3 237,35
AUSTRALIA/AUSTRALIA 14.215,1 32.400,6 30.650,2 38.799,6 54.231,1 33,08 54.231,1 56.219,6 3,67
R.R. TIONGKOK/CHINA 23.228,0 15.928,6 27.929,2 26.069,9 49.915,9 22,42 17.288,1 53.089,2 207,08
PERU/PERU 15.208,4 5.776,2 23.102,3 20.510,3 29.027,5 29,18 8.390,8 19.209,2 128,93
CHILI/CHILE 20.498,6 6.795,9 12.386,2 7.729,1 10.373,4 -11,60 10.373,4 19.681,7 89,73
NEGARA LAINNYA/OTHER COUNTRIES 17.013,5 4.877,3 8.696,5 3.946,8 1.957,4 -36,47 1.553,6 8.437,7 443,11
125
Perub. (%)
Change (% )
17-162016 2017
2012 2013 2014
TABEL 20 : NILAI IMPOR 190 JENIS BARANG MENURUT NEGARA ASAL UTAMA
IMPORT VALUE OF 190 COMMODITIES BY MAIN COUNTRY OF ORIGIN
KODE
CODE
HS
2016 Trend (%)
'12-16
Jan-Ags/Jan-AugJENIS BARANG DESCRIPTION OF
GOODS2015
No. 08.05.148

Lanjutan/Continued
Nilai/Value : Ribu/Thousand US$
Perub. (%)
Change (% )
17-162016 2017
2012 2013 2014
TABEL 20 : NILAI IMPOR 190 JENIS BARANG MENURUT NEGARA ASAL UTAMA
IMPORT VALUE OF 190 COMMODITIES BY MAIN COUNTRY OF ORIGIN
KODE
CODE
HS
2016 Trend (%)
'12-16
Jan-Ags/Jan-AugJENIS BARANG DESCRIPTION OF
GOODS2015
No. 08.05.148
0808 Apples, pears and quinces; fresh 275.309,0 284.842,3 278.871,4 235.985,4 373.909,3 4,33 208.539,5 406.337,7 94,85
R.R. TIONGKOK/CHINA 214.343,9 222.396,3 202.629,8 171.258,3 261.427,8 1,37 121.064,6 328.506,1 171,35
AMERIKA SERIKAT/UNITED STATES 41.808,6 45.356,1 58.185,0 35.276,3 61.968,2 5,50 45.893,4 40.398,5 -11,97
SELANDIA BARU/NEW ZEALAND 4.786,9 6.618,9 5.576,4 7.728,9 20.311,7 35,60 18.008,2 15.197,4 -15,61
REP.AFRIKA SELATAN/SOUTH AFRICA 6.619,1 5.982,0 6.099,4 5.538,7 12.894,7 13,39 9.583,1 14.020,0 46,30
AUSTRALIA/AUSTRALIA 5.117,4 2.347,9 2.735,4 13.050,5 9.981,8 35,68 8.484,7 5.407,2 -36,27
NEGARA LAINNYA/OTHER COUNTRIES 2.633,1 2.141,1 3.645,4 3.132,8 7.325,1 27,47 5.505,3 2.808,5 -48,99
1001 Wheat and meslin 2.253.850,2 2.439.986,7 2.387.262,2 2.082.767,8 2.408.209,8 -0,26 1.669.479,5 2.221.612,9 33,07
AUSTRALIA/AUSTRALIA 1.482.237,8 1.387.382,5 1.265.747,0 1.197.028,0 852.325,9 -11,79 619.879,8 1.112.903,3 79,54
UKRAINE/UKRAINE 66.027,2 86.709,3 90.732,9 144.089,2 492.965,0 57,28 269.751,8 243.567,3 -9,71
KANADA/CANADA 389.463,6 546.094,2 466.490,4 533.776,7 445.757,7 2,50 303.302,0 422.870,8 39,42
ARGENTINA/ARGENTINA - - - - 243.180,7 - 212.570,3 31.465,1 -85,20
AMERIKA SERIKAT/UNITED STATES 256.394,6 196.189,1 340.382,8 119.178,0 230.932,6 -6,83 134.261,6 224.761,6 67,41
NEGARA LAINNYA/OTHER COUNTRIES 59.726,9 223.611,6 223.909,1 88.695,9 143.047,9 8,57 129.714,1 186.044,8 43,43
1005 Maize (corn) 501.898,3 918.889,6 810.417,2 696.646,8 230.922,8 -16,72 168.932,0 92.370,6 -45,32
BRASILIA/BRAZIL 23.051,7 344.196,5 310.951,5 276.961,5 103.638,7 32,17 92.460,7 4.911,8 -94,69
AMERIKA SERIKAT/UNITED STATES 15.762,1 7.849,2 26.951,2 8.540,0 62.745,8 32,94 14.107,5 41.163,4 191,78
ARGENTINA/ARGENTINA 88.987,6 131.118,0 180.845,9 371.690,3 59.875,0 2,53 59.684,8 26.446,7 -55,69
THAILAND/THAILAND 4.799,1 3.718,4 8.393,5 9.057,3 3.419,3 2,15 1.794,0 10.896,3 507,36
INDIA/INDIA 318.888,0 427.688,3 278.841,6 24.234,5 923,3 -76,68 591,1 2.451,8 314,78
NEGARA LAINNYA/OTHER COUNTRIES 50.409,7 4.319,3 4.433,5 6.163,1 320,7 -62,32 293,8 6.500,5 2.112,37
1006 Rice 945.623,2 246.002,1 388.178,5 351.602,1 531.841,6 -7,63 464.186,9 102.435,6 -77,93
THAILAND/THAILAND 186.171,4 61.787,5 175.387,4 66.772,4 243.131,2 6,31 213.444,4 40.211,1 -81,16
VIETNAM/VIET NAM 564.925,7 97.303,3 143.536,0 202.563,1 212.602,8 -11,50 210.535,0 6.506,0 -96,91
PAKISTAN/PAKISTAN 52.483,4 29.996,9 23.909,3 62.949,2 49.124,1 6,28 21.173,5 17.134,7 -19,07
INDIA/INDIA 122.189,0 44.989,1 34.299,5 13.671,7 15.795,0 -41,04 9.772,0 13.397,0 37,10
MYANMAR/MYANMAR (FORM. BURMA) 4.754,5 6.498,9 5.082,8 2.732,3 6.382,8 -2,74 5.482,5 16.979,0 209,70
NEGARA LAINNYA/OTHER COUNTRIES 15.099,2 5.426,3 5.963,5 2.913,6 4.805,7 -25,26 3.779,6 8.207,8 117,16
1108 Starches; inulin 413.100,8 169.080,0 235.342,1 370.479,9 323.254,3 2,98 242.325,7 196.146,1 -19,06
THAILAND/THAILAND 306.937,3 102.197,8 149.524,0 229.881,1 199.170,5 -0,54 154.936,6 101.227,8 -34,67
VIETNAM/VIET NAM 33.289,2 4.590,1 10.824,7 24.119,4 27.149,6 13,33 21.781,4 16.874,9 -22,53
R.R. TIONGKOK/CHINA 23.816,1 16.845,9 13.315,2 18.555,9 26.017,4 2,77 13.737,6 38.666,0 181,46
BELANDA/NETHERLANDS 16.603,2 11.654,5 14.516,3 14.459,1 11.618,1 -4,86 8.553,5 8.221,8 -3,88
TURKI/TURKEY 0,0 23,1 247,2 11.204,7 10.107,2 4.572,02 7.968,6 885,0 -88,89
NEGARA LAINNYA/OTHER COUNTRIES 32.455,0 33.768,6 46.914,7 72.259,7 49.191,3 17,26 35.348,0 30.270,7 -14,36
126

Lanjutan/Continued
Nilai/Value : Ribu/Thousand US$
Perub. (%)
Change (% )
17-162016 2017
2012 2013 2014
TABEL 20 : NILAI IMPOR 190 JENIS BARANG MENURUT NEGARA ASAL UTAMA
IMPORT VALUE OF 190 COMMODITIES BY MAIN COUNTRY OF ORIGIN
KODE
CODE
HS
2016 Trend (%)
'12-16
Jan-Ags/Jan-AugJENIS BARANG DESCRIPTION OF
GOODS2015
No. 08.05.148
1201 Soya beans, whether or not broken 1.211.230,0 1.101.562,5 1.176.923,0 1.034.366,6 959.041,1 -5,16 682.673,4 1.013.681,9 48,49
AMERIKA SERIKAT/UNITED STATES 1.131.563,3 1.013.111,0 1.120.801,8 1.006.209,7 947.232,5 -3,56 674.246,8 997.914,2 48,00
KANADA/CANADA 4.604,1 2.602,7 13.196,0 13.508,5 3.696,5 12,84 2.889,5 5.441,4 88,32
MALAYSIA/MALAYSIA 47.472,9 14.922,0 10.045,4 8.001,9 3.041,2 -45,77 1.193,9 4.922,8 312,35
R.R. TIONGKOK/CHINA 630,3 270,9 769,8 2.740,6 2.189,5 61,68 1.602,6 - -
ARGENTINA/ARGENTINA 1.438,0 54.674,1 13.646,9 489,3 1.612,1 -36,16 1.612,1 2.104,0 30,51
NEGARA LAINNYA/OTHER COUNTRIES 25.521,3 15.981,9 18.463,1 3.416,6 1.269,4 -52,97 1.128,5 3.299,5 192,37
1202 Ground-nuts; not roasted or otherwise cooked, whether or not shelled or broken 218.285,6 332.256,4 284.615,2 204.312,3 193.959,5 -6,97 141.164,3 231.403,9 63,93
INDIA/INDIA 186.299,5 270.556,1 226.230,4 157.439,6 174.843,7 -6,47 128.527,2 166.171,0 29,29
R.R. TIONGKOK/CHINA 20.882,4 30.820,7 35.011,2 22.558,1 7.992,8 -20,01 4.272,9 24.654,1 476,99
MALAYSIA/MALAYSIA 4.638,1 8.603,6 11.674,8 12.834,5 5.540,2 7,85 4.011,1 4.826,2 20,32
MOZAMBIK/MOZAMBIQUE 1.980,1 10.876,9 9.278,8 6.943,7 2.280,0 -1,65 2.143,0 12.582,5 487,16
SUDAN/SUDAN - 3.445,4 274,8 26,6 1.614,4 - 914,1 16.147,0 1.666,54
NEGARA LAINNYA/OTHER COUNTRIES 4.485,5 7.953,7 2.145,2 4.509,9 1.688,4 -22,29 1.296,1 7.023,1 441,85
1701 Cane or beet sugar and chemically pure sucrose, in solid form 1.662.271,1 1.730.656,9 1.328.935,6 1.256.038,0 2.090.125,5 1,38 1.148.748,6 1.729.271,3 50,54
THAILAND/THAILAND 911.720,7 652.802,3 690.659,0 649.835,4 915.582,8 0,04 748.167,9 1.002.140,6 33,95
BRASILIA/BRAZIL 548.281,5 572.308,5 197.214,2 189.951,0 661.342,7 -7,02 94.884,0 325.173,4 242,71
AUSTRALIA/AUSTRALIA 143.561,0 346.621,9 396.171,9 374.377,7 393.128,9 23,27 206.515,1 238.817,7 15,64
ARGENTINA/ARGENTINA - - - - 50.190,7 - 50.190,7 - -
EL SALVADOR/EL SALVADOR - 54.537,7 - - 23.927,9 - 23.927,9 39.103,1 63,42
NEGARA LAINNYA/OTHER COUNTRIES 58.708,0 104.386,5 44.890,5 41.873,8 45.952,5 -13,09 25.063,0 124.036,5 394,90
1702 Sugars, including lactose, maltose, glucose or fructose in solid form; sugar syrups without
added flavouring or colouring matter; artificial honey, whether or not mixed with natural
honey; caramel
163.927,9 191.480,6 171.529,1 180.352,0 214.035,0 4,85 138.592,0 181.720,0 31,12
R.R. TIONGKOK/CHINA 60.357,2 81.286,0 71.076,3 95.757,7 142.538,5 20,71 90.866,1 121.472,7 33,68
AMERIKA SERIKAT/UNITED STATES 45.374,5 55.167,8 49.014,5 32.085,5 26.455,3 -14,96 16.877,4 22.821,4 35,22
PERANCIS/FRANCE 12.021,6 12.598,9 13.855,1 15.003,4 12.009,8 1,74 8.677,7 7.148,1 -17,63
BELANDA/NETHERLANDS 6.620,6 5.670,3 3.168,0 3.718,0 4.781,9 -10,17 3.299,9 2.384,3 -27,75
MALAYSIA/MALAYSIA 3.701,2 3.404,2 2.498,2 3.844,4 4.403,6 4,80 2.731,3 7.201,9 163,68
NEGARA LAINNYA/OTHER COUNTRIES 35.852,9 33.353,4 31.916,9 29.943,0 23.845,8 -8,82 16.139,6 20.691,6 28,20
1801 Cocoa beans; whole or broken, raw or roasted 62.977,8 77.422,1 341.437,4 169.734,7 184.667,3 34,13 93.114,3 399.860,1 329,43
EKUADOR/ECUADOR 239,3 9.073,2 33.706,9 17.709,1 36.330,2 191,96 19.205,0 55.636,1 189,70
MALAYSIA/MALAYSIA 5.997,5 2.434,9 14.430,8 10.122,3 31.116,7 60,28 13.356,5 104.993,7 686,09
AMERIKA SERIKAT/UNITED STATES - - 2.798,1 - 26.194,7 - 17.218,3 2.346,0 -86,37
PAPUA NUGINI/PAPUA NEW GUINEA 13.206,6 13.782,4 26.621,9 12.854,0 26.028,0 13,74 8.055,9 5.629,8 -30,12
PANTAI GADING/COTE D'IVOIRE 14.115,4 20.612,5 192.494,5 78.891,3 20.737,9 23,51 13.512,1 99.044,8 633,01
NEGARA LAINNYA/OTHER COUNTRIES 29.419,0 31.519,2 71.385,2 50.157,9 44.259,7 13,67 21.766,6 132.209,5 507,40
127

Lanjutan/Continued
Nilai/Value : Ribu/Thousand US$
Perub. (%)
Change (% )
17-162016 2017
2012 2013 2014
TABEL 20 : NILAI IMPOR 190 JENIS BARANG MENURUT NEGARA ASAL UTAMA
IMPORT VALUE OF 190 COMMODITIES BY MAIN COUNTRY OF ORIGIN
KODE
CODE
HS
2016 Trend (%)
'12-16
Jan-Ags/Jan-AugJENIS BARANG DESCRIPTION OF
GOODS2015
No. 08.05.148
1901 Malt extract; flour/groats/meal/starch/malt extract products, no cocoa (or less than 40% by
weight) and food preparations of goods of headings 04.01 to 04.04, no cocoa (or less than 5%
by weight),
145.654,3 249.186,8 223.982,4 220.469,9 187.842,9 3,94 118.071,5 164.184,5 39,06
SINGAPURA/SINGAPORE 41.080,8 73.716,4 71.807,6 53.417,3 43.266,1 -2,16 24.541,3 42.938,1 74,96
THAILAND/THAILAND 11.544,9 13.712,9 17.419,9 42.812,6 33.249,7 38,46 21.694,8 31.555,7 45,45
AUSTRALIA/AUSTRALIA 610,8 11.130,2 17.381,5 34.869,9 31.539,3 146,71 18.085,8 21.211,4 17,28
MALAYSIA/MALAYSIA 67.872,7 90.110,0 56.951,0 32.879,8 19.987,5 -29,20 12.691,1 14.104,7 11,14
POLANDIA/POLAND 168,8 2.893,3 2.071,8 14.571,0 12.923,6 179,89 10.084,4 2.002,8 -80,14
NEGARA LAINNYA/OTHER COUNTRIES 24.376,3 57.624,1 58.350,6 41.919,3 46.876,6 10,40 30.974,1 52.371,8 69,08
2106 Food preparations not elsewhere specified or included 494.597,5 536.506,9 490.323,2 462.028,4 436.639,3 -3,91 300.959,3 365.251,9 21,36
AMERIKA SERIKAT/UNITED STATES 101.263,7 111.062,7 103.735,1 117.604,6 79.105,5 -4,27 52.937,6 71.883,7 35,79
MALAYSIA/MALAYSIA 72.618,4 65.245,2 59.380,8 73.939,6 65.378,6 -0,85 46.591,6 56.173,8 20,57
R.R. TIONGKOK/CHINA 102.306,2 104.721,5 91.640,3 55.393,5 64.006,9 -14,57 47.057,2 59.620,2 26,70
SINGAPURA/SINGAPORE 87.088,1 70.261,4 66.620,7 54.189,9 46.195,6 -14,17 32.273,2 37.218,7 15,32
KOREA SELATAN/SOUTH OF KOREA 38.591,9 46.623,0 40.878,4 40.397,4 42.355,1 0,43 27.368,7 41.201,6 50,54
NEGARA LAINNYA/OTHER COUNTRIES 92.729,4 138.593,1 128.067,9 120.503,5 139.597,7 7,02 94.731,0 99.153,9 4,67
2303 Residues of starch manufacture, similar residues; beet-pulp, bagasse and other waste of sugar manufacture, brewing or distilling dregs and waste, whether or not in the form of pellets250.325,5 267.105,2 310.162,8 249.990,8 251.931,8 -0,53 169.438,8 283.656,5 67,41
AMERIKA SERIKAT/UNITED STATES 195.967,9 249.124,0 232.948,5 171.538,2 183.052,8 -4,97 119.543,6 218.384,3 82,68
R.R. TIONGKOK/CHINA 47.910,1 9.966,2 60.546,5 51.360,8 59.164,0 22,90 42.457,4 59.148,3 39,31
AUSTRALIA/AUSTRALIA 3.807,2 5.129,9 3.179,3 2.924,2 4.431,4 -2,55 3.421,2 3.039,6 -11,15
INDIA/INDIA 1.487,3 1.738,8 2.253,0 2.234,3 1.519,6 2,98 1.372,4 1.788,6 30,32
THAILAND/THAILAND 207,1 96,6 94,6 139,3 1.388,3 51,76 500,6 366,8 -26,73
NEGARA LAINNYA/OTHER COUNTRIES 946,0 1.049,6 11.141,0 21.793,9 2.375,7 62,82 2.143,6 928,9 -56,67
2304 Oil-cake and other solid residues; whether or not ground or in the form of pellets, resulting
from the extraction of soya-bean oil
1.828.494,2 1.926.982,0 2.194.934,7 1.814.025,7 1.573.861,9 -3,54 1.031.096,3 1.364.611,9 32,35
ARGENTINA/ARGENTINA 1.471.838,7 1.388.386,4 1.115.932,0 820.117,3 933.517,9 -13,39 496.180,6 841.456,1 69,59
BRASILIA/BRAZIL 167.582,4 328.141,0 845.838,6 935.260,8 527.152,3 39,65 463.531,8 436.786,5 -5,77
PARAGUAY/PARAGUAY 8.299,8 85.905,8 51.865,7 3.254,7 57.408,5 6,13 47.322,6 34.822,8 -26,41
PANAMA/PANAMA 1.231,7 - - - 16.119,7 - - 17.083,8 -
R.R. TIONGKOK/CHINA 3.569,9 544,4 83.168,9 705,6 15.669,4 37,96 3.730,6 261,5 -92,99
NEGARA LAINNYA/OTHER COUNTRIES 175.971,7 124.004,4 98.129,5 54.687,4 23.994,1 -38,14 20.330,8 34.201,2 68,22
2309 Preparations of a kind used in animal feeding 483.952,7 568.401,7 555.738,5 503.577,2 524.962,8 0,42 330.699,8 474.906,2 43,61
AMERIKA SERIKAT/UNITED STATES 159.373,9 191.405,1 217.209,2 190.800,5 217.767,2 6,41 125.439,8 203.996,6 62,63
AUSTRALIA/AUSTRALIA 81.250,3 109.810,3 82.394,3 68.129,3 57.651,5 -10,98 39.714,4 45.435,2 14,40
THAILAND/THAILAND 23.403,3 29.865,8 34.706,0 44.775,6 45.683,1 19,04 27.325,4 44.222,3 61,84
SELANDIA BARU/NEW ZEALAND 45.292,1 60.900,9 49.935,1 52.216,8 43.577,1 -2,28 31.565,5 32.451,2 2,81
SINGAPURA/SINGAPORE 72.038,8 52.167,9 32.196,4 35.072,8 36.460,9 -16,13 25.822,8 29.200,6 13,08
NEGARA LAINNYA/OTHER COUNTRIES 102.594,3 124.251,6 139.297,4 112.582,2 123.823,0 2,81 80.831,9 119.600,4 47,96
128

Lanjutan/Continued
Nilai/Value : Ribu/Thousand US$
Perub. (%)
Change (% )
17-162016 2017
2012 2013 2014
TABEL 20 : NILAI IMPOR 190 JENIS BARANG MENURUT NEGARA ASAL UTAMA
IMPORT VALUE OF 190 COMMODITIES BY MAIN COUNTRY OF ORIGIN
KODE
CODE
HS
2016 Trend (%)
'12-16
Jan-Ags/Jan-AugJENIS BARANG DESCRIPTION OF
GOODS2015
No. 08.05.148
2401 Tobacco, unmanufactured; tobacco refuse 658.921,6 627.301,5 569.775,6 412.328,3 477.261,9 -10,10 309.419,4 492.278,2 59,10
R.R. TIONGKOK/CHINA 271.829,4 250.488,5 246.812,4 187.262,2 210.060,0 -7,75 126.491,3 202.364,6 59,98
AMERIKA SERIKAT/UNITED STATES 38.648,6 63.702,3 44.825,5 43.549,3 59.094,6 4,80 34.642,6 48.137,6 38,96
TURKI/TURKEY 40.278,3 51.018,4 47.976,7 39.840,1 44.419,8 -0,51 40.217,4 17.544,0 -56,38
BRASILIA/BRAZIL 42.498,9 48.629,7 52.368,0 32.722,0 41.598,0 -4,30 29.576,3 72.672,5 145,71
ZIMBABWE/ZIMBABWE 24.041,1 16.093,1 26.572,6 17.741,6 24.626,7 1,47 17.767,0 24.808,7 39,63
NEGARA LAINNYA/OTHER COUNTRIES 241.625,1 197.369,5 151.220,3 91.213,1 97.462,9 -22,80 60.724,7 126.750,9 108,73
2510 Natural calcium phosphates; natural aluminium calcium phosphates and phosphatic chalk 176.542,6 165.242,4 186.831,8 160.737,5 193.490,4 1,57 144.293,6 164.992,8 14,35
YORDANIA/JORDAN 102.845,6 73.140,0 92.144,4 92.647,0 129.720,4 7,26 87.272,3 105.399,8 20,77
MAROKO/MOROCCO 24.146,7 48.622,8 48.084,2 48.875,6 38.330,1 9,74 38.330,1 37.858,4 -1,23
MESIR/EGYPT 47.326,5 41.203,4 44.246,1 17.450,2 23.370,4 -20,31 17.246,9 20.755,5 20,34
TAIWAN/TAIWAN, PROVINCE OF CHINA 602,2 1.001,1 1.010,1 644,8 999,3 5,90 692,0 - -
INGGRIS/UNITED KINGDOM 745,3 840,4 970,8 1.040,0 754,2 2,40 555,1 819,4 47,62
NEGARA LAINNYA/OTHER COUNTRIES 876,3 434,7 376,2 80,0 315,8 -31,16 197,2 159,8 -18,99
2601 Iron ores and concentrates; including roasted iron pyrites 203.791,5 307.797,1 371.127,2 314.568,3 260.562,9 5,27 155.198,6 343.221,0 121,15
AUSTRALIA/AUSTRALIA 1.373,7 35.775,6 180.584,8 173.991,1 178.066,3 209,91 102.435,8 238.893,2 133,21
BRASILIA/BRAZIL 131.786,4 138.320,2 123.879,9 106.409,0 64.807,2 -15,48 43.616,8 39.723,0 -8,93
KANADA/CANADA - - 43.946,0 15.340,2 15.201,1 - 6.782,5 19.373,1 185,63
MALAYSIA/MALAYSIA 41.257,1 23.225,7 3.517,5 1.862,9 2.010,0 -57,54 2.010,0 393,7 -80,41
SINGAPURA/SINGAPORE 201,4 2.017,5 500,9 273,2 215,0 -17,04 153,3 79,4 -48,22
NEGARA LAINNYA/OTHER COUNTRIES 29.172,9 108.458,1 18.698,2 16.691,9 263,3 -67,65 200,1 44.758,6 22.266,77
2701 Coal; briquettes, ovoids and similar solid fuels manufactured from coal 24.414,1 83.309,5 296.694,2 286.659,5 323.931,0 89,77 182.557,4 502.443,2 175,22
AUSTRALIA/AUSTRALIA 38,5 70.095,1 256.575,3 240.390,4 244.396,8 551,56 131.087,9 307.868,9 134,86
FEDERASI RUSIA/RUSSIA FEDERATION - - 5.471,8 4.555,4 30.650,5 - 17.392,6 52.799,0 203,57
R.R. TIONGKOK/CHINA 2.233,9 589,6 4.483,0 7.694,6 20.661,0 101,73 14.013,4 45.473,9 224,50
SINGAPURA/SINGAPORE 3.581,8 627,9 5.698,0 3.941,9 9.956,8 47,43 9.956,6 14.601,4 46,65
AMERIKA SERIKAT/UNITED STATES 399,7 656,2 562,5 580,4 7.169,2 75,96 116,5 8.737,5 7.398,98
NEGARA LAINNYA/OTHER COUNTRIES 18.160,2 11.340,7 23.903,6 29.496,7 11.096,8 -0,29 9.990,4 72.962,5 630,33
2803 Carbon; carbon blacks and other forms of carbon n.e.c. 201.282,6 223.567,4 238.134,5 176.948,8 176.769,8 -4,82 114.174,9 212.349,3 85,99
R.R. TIONGKOK/CHINA 109.941,6 114.465,2 122.764,9 92.836,8 90.795,5 -5,75 56.501,3 116.740,3 106,62
KOREA SELATAN/SOUTH OF KOREA 24.653,2 38.089,0 42.086,2 35.584,2 43.810,5 11,43 29.795,4 50.775,8 70,41
THAILAND/THAILAND 6.527,8 8.503,8 14.499,8 8.557,6 11.904,4 12,84 7.028,9 14.038,5 99,72
JEPANG/JAPAN 10.294,8 10.758,4 11.352,5 9.983,4 10.887,3 0,37 7.347,9 9.947,5 35,38
INDIA/INDIA 15.488,7 10.497,7 6.198,4 4.030,7 5.450,8 -26,26 4.005,4 6.875,1 71,65
NEGARA LAINNYA/OTHER COUNTRIES 34.376,6 41.253,2 41.232,8 25.956,0 13.921,3 -20,32 9.495,9 13.972,2 47,14
129

Lanjutan/Continued
Nilai/Value : Ribu/Thousand US$
Perub. (%)
Change (% )
17-162016 2017
2012 2013 2014
TABEL 20 : NILAI IMPOR 190 JENIS BARANG MENURUT NEGARA ASAL UTAMA
IMPORT VALUE OF 190 COMMODITIES BY MAIN COUNTRY OF ORIGIN
KODE
CODE
HS
2016 Trend (%)
'12-16
Jan-Ags/Jan-AugJENIS BARANG DESCRIPTION OF
GOODS2015
No. 08.05.148
2818 Aluminium oxide (including artificial corundum); aluminium 236.079,8 235.616,5 244.960,1 211.227,7 198.648,7 -4,44 134.773,4 152.004,3 12,79
AUSTRALIA/AUSTRALIA 197.737,7 179.007,6 199.334,9 166.797,7 142.458,4 -7,01 99.811,7 121.770,6 22,00
INDIA/INDIA 6.659,6 8.479,6 9.025,5 14.942,9 17.878,3 28,94 8.059,2 3.244,9 -59,74
R.R. TIONGKOK/CHINA 8.185,8 9.307,7 9.443,6 8.354,2 11.809,8 6,45 8.906,1 7.036,6 -20,99
JEPANG/JAPAN 8.883,1 7.268,6 9.595,0 4.826,2 6.283,5 -10,43 4.685,5 5.278,4 12,65
KOREA SELATAN/SOUTH OF KOREA 3.795,1 5.831,4 7.192,1 7.365,6 5.304,5 9,45 3.517,5 4.811,9 36,80
NEGARA LAINNYA/OTHER COUNTRIES 10.818,6 25.721,6 10.369,0 8.941,1 14.914,2 -4,06 9.793,3 9.861,8 0,70
2836 Carbonates; peroxocarbonates (percarbonates); commercial ammonium carbonate
containing ammonium carbamate
301.978,5 281.212,1 299.117,1 303.224,9 261.742,2 -2,08 179.444,0 234.142,8 30,48
AMERIKA SERIKAT/UNITED STATES 150.549,3 144.497,1 153.435,2 162.423,4 134.289,3 -1,11 97.325,9 123.848,9 27,25
R.R. TIONGKOK/CHINA 101.011,1 77.931,7 86.288,3 93.668,9 76.194,7 -3,73 47.924,2 55.445,4 15,69
MALAYSIA/MALAYSIA 9.011,5 9.905,5 11.016,7 10.044,3 12.938,7 7,65 8.120,1 13.939,2 71,66
TAIWAN/TAIWAN, PROVINCE OF CHINA 11.004,1 7.265,1 7.602,8 7.511,3 7.488,1 -7,10 4.731,2 7.553,5 59,65
KOREA SELATAN/SOUTH OF KOREA 4.474,8 4.758,4 7.509,2 5.616,3 7.012,3 11,23 4.446,8 5.046,4 13,48
NEGARA LAINNYA/OTHER COUNTRIES 25.927,7 36.854,3 33.264,8 23.960,6 23.819,1 -5,83 16.895,9 28.309,4 67,55
2901 Acyclic hydrocarbons 1.451.492,1 1.227.977,4 1.327.335,1 1.196.119,1 869.245,1 -9,98 596.120,1 738.836,9 23,94
SAUDI ARABIA/SAUDI ARABIA 466.988,7 445.909,9 343.002,5 184.788,8 205.984,7 -22,26 125.954,3 91.762,0 -27,15
MALAYSIA/MALAYSIA 189.551,0 169.677,4 194.378,1 219.273,5 153.100,2 -1,69 115.393,2 152.074,4 31,79
SINGAPURA/SINGAPORE 142.062,7 148.778,2 289.744,8 289.196,3 131.019,8 5,16 86.081,4 191.429,7 122,38
ITALIA/ITALY - - 37,4 26.826,2 97.021,3 - 55.346,4 79.706,7 44,01
THAILAND/THAILAND 114.990,1 94.184,2 72.784,3 151.218,8 53.623,0 -9,99 35.927,4 73.904,0 105,70
NEGARA LAINNYA/OTHER COUNTRIES 537.899,6 369.427,7 427.388,1 324.815,5 228.496,0 -16,81 177.417,4 149.960,1 -15,48
2902 Cyclic hydrocarbons 1.491.000,2 1.666.980,6 1.645.020,7 1.053.986,5 700.694,0 -17,87 511.838,6 915.296,4 78,83
INDIA/INDIA 450.203,2 321.095,9 408.347,9 313.812,5 192.294,9 -15,84 140.841,9 160.847,2 14,20
SINGAPURA/SINGAPORE 406.717,2 488.133,4 560.399,4 321.602,5 181.070,1 -18,42 121.780,6 519.075,6 326,24
THAILAND/THAILAND 201.758,6 363.219,5 224.106,3 117.802,7 127.786,4 -18,45 98.002,7 111.065,7 13,33
MALAYSIA/MALAYSIA 45.171,5 36.817,1 61.046,5 54.932,5 66.283,0 12,38 44.756,0 37.042,0 -17,24
KUWAIT/KUWAIT 201.014,3 185.019,3 152.632,1 101.130,6 53.826,9 -27,67 41.649,3 16.586,7 -60,18
NEGARA LAINNYA/OTHER COUNTRIES 186.135,5 272.695,4 238.488,5 144.705,7 79.432,6 -20,84 64.808,0 70.679,1 9,06
2905 Acyclic alcohols and their halogenated, sulphonated, nitrated or nitrosated derivatives 852.800,4 919.555,3 970.831,3 682.102,0 481.016,1 -13,45 329.739,1 619.032,3 87,73
MALAYSIA/MALAYSIA 172.298,8 171.324,5 189.022,2 114.974,7 170.123,3 -4,15 113.678,8 161.168,9 41,78
SINGAPURA/SINGAPORE 266.532,0 390.193,1 362.272,0 262.062,7 97.824,7 -21,36 51.978,0 146.136,8 181,15
SAUDI ARABIA/SAUDI ARABIA 180.613,9 106.576,5 119.136,5 89.451,3 66.144,4 -19,62 62.600,6 181.354,9 189,70
R.R. TIONGKOK/CHINA 18.775,2 23.284,0 46.116,9 22.729,2 25.672,5 6,20 18.968,2 24.267,2 27,94
JEPANG/JAPAN 41.192,0 48.206,9 34.234,0 23.003,3 17.326,0 -21,90 10.293,3 24.393,4 136,98
NEGARA LAINNYA/OTHER COUNTRIES 173.388,6 179.970,2 220.049,5 169.880,8 103.925,3 -10,25 72.220,1 81.711,1 13,14
130

Lanjutan/Continued
Nilai/Value : Ribu/Thousand US$
Perub. (%)
Change (% )
17-162016 2017
2012 2013 2014
TABEL 20 : NILAI IMPOR 190 JENIS BARANG MENURUT NEGARA ASAL UTAMA
IMPORT VALUE OF 190 COMMODITIES BY MAIN COUNTRY OF ORIGIN
KODE
CODE
HS
2016 Trend (%)
'12-16
Jan-Ags/Jan-AugJENIS BARANG DESCRIPTION OF
GOODS2015
No. 08.05.148
2915 Acids; saturated acyclic monocarboxylic acids and their anhydrides, halides, peroxides and peroxyacids; their halogenated, sulphonated, nitrated or nitrosated derivatives277.064,5 255.535,7 275.180,2 257.295,6 230.773,8 -3,52 159.838,8 232.802,8 45,65
R.R. TIONGKOK/CHINA 67.310,3 56.642,5 66.067,4 75.500,6 79.633,0 6,43 54.556,8 86.430,1 58,42
SINGAPURA/SINGAPORE 51.283,4 60.293,3 63.566,5 77.986,3 71.097,9 9,53 49.918,4 59.805,3 19,81
MALAYSIA/MALAYSIA 63.407,9 55.841,8 75.707,0 46.899,1 25.822,0 -17,89 18.002,3 33.389,4 85,47
JEPANG/JAPAN 10.027,7 11.501,8 12.770,9 8.409,1 10.423,2 -2,33 6.858,8 11.570,1 68,69
INDIA/INDIA 7.501,3 8.040,0 8.826,7 7.386,4 7.826,0 0,00 5.077,6 4.630,9 -8,80
NEGARA LAINNYA/OTHER COUNTRIES 77.533,8 63.216,3 48.241,7 41.114,1 35.971,7 -17,85 25.425,0 36.977,0 45,44
2916 Acids; unsaturated acyclic monocarboxylic, cyclic monocarboxylic, their anhydrides, halides,
peroxides and peroxyacids; their halogenated, sulphonated, nitrated or nitrosated derivatives
246.635,7 249.514,9 262.348,5 213.166,0 200.840,3 -5,52 131.768,4 205.799,5 56,18
THAILAND/THAILAND 38.413,4 30.639,6 32.639,6 41.209,2 53.762,8 10,17 34.392,1 68.782,3 99,99
R.R. TIONGKOK/CHINA 50.088,1 44.991,8 42.940,3 35.679,1 39.761,1 -6,70 26.898,5 33.110,6 23,09
SINGAPURA/SINGAPORE 28.368,9 20.534,0 32.101,9 28.215,4 28.349,1 3,21 16.874,4 27.428,9 62,55
JEPANG/JAPAN 32.719,6 31.559,9 30.712,2 24.686,7 20.719,8 -10,95 14.018,0 21.294,4 51,91
INDIA/INDIA 8.729,7 8.670,4 13.331,1 13.371,6 11.642,1 10,62 8.213,6 9.286,1 13,06
NEGARA LAINNYA/OTHER COUNTRIES 88.315,8 113.119,3 110.623,3 70.004,1 46.605,5 -16,12 31.371,8 45.897,2 46,30
2930 Organo-sulphur compounds 168.865,1 154.628,6 175.036,0 240.104,7 164.873,7 4,00 104.797,0 145.941,7 39,26
R.R. TIONGKOK/CHINA 17.201,8 26.655,6 28.208,9 37.173,9 40.773,7 22,86 25.571,9 38.801,4 51,73
BELGIA/BELGIUM 67.001,5 56.432,7 64.710,0 80.016,0 33.820,3 -9,68 24.779,6 28.380,2 14,53
JEPANG/JAPAN 39.422,5 32.236,1 33.953,2 40.655,2 25.058,3 -6,52 17.611,9 24.540,0 39,34
SINGAPURA/SINGAPORE 1.679,8 3.585,1 3.040,6 12.870,6 21.040,6 88,39 12.248,7 15.431,9 25,99
MALAYSIA/MALAYSIA 2.870,6 3.391,5 3.434,9 36.390,0 16.092,9 78,97 8.438,9 9.447,0 11,95
NEGARA LAINNYA/OTHER COUNTRIES 40.688,8 32.327,5 41.688,3 32.998,9 28.088,0 -6,95 16.145,9 29.341,1 81,72
2933 Heterocyclic compounds with nitrogen hetero-atom(s) only 350.843,4 371.508,9 317.499,4 289.332,1 267.218,4 -7,64 #N/A #N/A -
R.R. TIONGKOK/CHINA 111.021,8 134.418,7 116.586,0 102.115,7 107.815,3 -3,28 75.354,4 91.608,7 21,57
INDIA/INDIA 26.396,9 26.148,3 22.953,7 25.257,7 27.674,3 0,60 16.676,5 21.503,9 28,95
JERMAN/GERMANY 14.808,1 18.367,9 26.599,0 30.252,9 24.625,5 16,37 16.357,4 24.049,6 47,03
JEPANG/JAPAN 29.850,6 25.429,8 21.459,2 18.669,9 24.333,7 -6,93 16.702,1 24.583,3 47,19
PERANCIS/FRANCE 24.701,4 23.087,7 14.585,5 17.154,2 13.544,0 -13,92 6.612,9 17.407,4 163,23
NEGARA LAINNYA/OTHER COUNTRIES 144.064,7 144.056,5 115.316,1 95.881,7 69.225,6 -17,08 #N/A #N/A -
3004 Medicaments; (not goods of heading no. 3002, 3005 or 3006) consisting of mixed or unmixed products for therapeutic or prophylactic use, put up in measured doses (incl. those in the form398.464,6 432.742,6 521.901,2 551.070,7 578.484,7 10,38 #N/A #N/A -
JERMAN/GERMANY 60.458,5 54.583,8 79.917,5 73.694,3 81.115,2 9,29 53.047,8 64.622,9 21,82
AMERIKA SERIKAT/UNITED STATES 30.193,4 28.463,0 40.347,6 49.696,0 60.770,6 21,61 38.606,3 56.031,2 45,14
INGGRIS/UNITED KINGDOM 35.382,0 37.076,2 35.078,8 59.245,9 56.287,2 15,00 39.820,2 40.588,7 1,93
PERANCIS/FRANCE 36.878,7 33.787,3 27.815,2 44.308,9 52.659,5 10,34 32.971,1 34.404,7 4,35
SWISS/SWITZERLAND 45.660,1 29.975,4 85.379,9 59.227,4 50.428,8 9,20 43.228,6 21.724,4 -49,75
NEGARA LAINNYA/OTHER COUNTRIES 189.891,9 248.856,9 253.362,3 264.898,1 277.223,4 8,54 #N/A #N/A -
131

Lanjutan/Continued
Nilai/Value : Ribu/Thousand US$
Perub. (%)
Change (% )
17-162016 2017
2012 2013 2014
TABEL 20 : NILAI IMPOR 190 JENIS BARANG MENURUT NEGARA ASAL UTAMA
IMPORT VALUE OF 190 COMMODITIES BY MAIN COUNTRY OF ORIGIN
KODE
CODE
HS
2016 Trend (%)
'12-16
Jan-Ags/Jan-AugJENIS BARANG DESCRIPTION OF
GOODS2015
No. 08.05.148
3102 Fertilizers; mineral or chemical, nitrogenous 500.755,7 318.587,0 258.565,9 268.883,8 298.190,5 -11,36 #N/A #N/A -
R.R. TIONGKOK/CHINA 174.286,0 138.268,8 143.850,4 207.205,4 267.751,2 13,46 185.367,0 131.009,3 -29,32
KOREA SELATAN/SOUTH OF KOREA 84.791,7 65.083,8 40.203,9 13.066,2 11.075,2 -43,32 7.887,7 10.685,1 35,47
AUSTRALIA/AUSTRALIA 32.845,4 8.242,4 14.632,9 22.215,7 4.092,5 -27,19 2.841,6 236,5 -91,68
FEDERASI RUSIA/RUSSIA FEDERATION 41.364,1 2.824,1 984,8 273,3 3.449,6 -51,83 2.758,4 901,6 -67,31
TAIWAN/TAIWAN, PROVINCE OF CHINA 10.531,0 5.101,3 13,9 932,5 2.732,4 -35,58 1.395,4 2.148,1 53,94
NEGARA LAINNYA/OTHER COUNTRIES 156.937,5 99.066,6 58.879,9 25.190,6 9.089,7 -50,67 #N/A #N/A -
3103 Fertilizers; mineral or chemical, phosphatic 468.528,8 216.175,2 308.551,3 332.451,6 250.693,5 -7,88 #N/A #N/A -
R.R. TIONGKOK/CHINA 289.838,6 115.104,3 196.541,8 226.674,1 154.939,7 -5,59 116.042,8 170.762,6 47,15
MESIR/EGYPT 112.846,7 40.267,7 58.563,6 48.567,4 38.191,6 -17,96 25.658,7 31.839,3 24,09
AUSTRALIA/AUSTRALIA 37.212,0 30.941,7 28.473,6 38.854,4 36.169,2 1,72 23.315,1 29.900,1 28,24
PERU/PERU 17.013,1 18.491,4 11.656,1 11.439,7 11.440,0 -11,96 11.440,0 12.622,5 10,34
SINGAPURA/SINGAPORE - - - - 3.847,8 - 3.847,8 538,0 -86,02
NEGARA LAINNYA/OTHER COUNTRIES 11.618,5 11.370,1 13.316,3 6.916,0 6.105,3 -16,34 #N/A #N/A -
3104 Fertilizers; mineral or chemical, potassic 1.265.149,1 986.696,9 918.335,3 936.827,6 707.765,5 -11,43 #N/A #N/A -
KANADA/CANADA 646.174,4 565.958,9 441.747,9 425.326,2 310.817,6 -16,05 215.140,8 264.906,5 23,13
FEDERASI RUSIA/RUSSIA FEDERATION 293.624,5 50.902,9 173.380,6 206.530,2 172.926,7 3,48 132.304,5 130.153,7 -1,63
BELARUS/BELARUS 69.540,6 121.485,1 182.779,0 207.004,6 137.835,5 20,94 109.411,5 133.085,6 21,64
JERMAN/GERMANY 81.854,6 71.411,1 45.839,4 54.498,0 35.300,9 -17,74 23.947,5 50.577,4 111,20
YORDANIA/JORDAN 135.635,7 157.447,9 53.242,2 35.606,4 27.764,4 -37,24 25.692,9 53.386,3 107,79
NEGARA LAINNYA/OTHER COUNTRIES 38.319,3 19.491,0 21.346,1 7.862,3 23.120,4 -17,46 #N/A #N/A -
3105 Fertilizers; mineral or chemical, containing 2 or 3 of the elements nitrogen, phosphorus,
potassium; other fertilisers; goods of chapter 31 in tablets or packages of gross weight not
exceeding
381.554,2 222.363,9 331.445,5 470.078,3 295.112,4 2,38 #N/A #N/A -
MALAYSIA/MALAYSIA 75.973,7 44.968,3 89.378,1 121.218,3 96.291,0 15,78 66.076,9 71.731,9 8,56
R.R. TIONGKOK/CHINA 130.583,2 59.275,5 103.012,5 169.875,6 93.497,1 3,92 77.364,0 126.958,7 64,11
NORWEGIA/NORWAY 74.074,5 45.999,1 74.395,7 70.549,1 43.411,5 -6,21 32.058,9 5.138,8 -83,97
FEDERASI RUSIA/RUSSIA FEDERATION 34.701,4 22.891,0 21.926,5 13.032,7 25.175,1 -11,35 18.327,0 72.099,0 293,40
BELGIA/BELGIUM 11.661,6 16.362,5 16.226,4 14.877,0 16.507,6 6,18 11.089,9 18.855,8 70,03
NEGARA LAINNYA/OTHER COUNTRIES 54.559,7 32.867,6 26.506,3 80.525,7 20.230,2 -10,31 #N/A #N/A -
3204 Synthetic organic colouring matter and preparations based thereon; synthetic organic
products used as fluorescent brightening agents or as luminophores; whether or not
chemically
378.054,2 442.519,8 486.218,5 432.304,1 450.403,5 3,32 #N/A #N/A -
R.R. TIONGKOK/CHINA 180.906,7 220.882,9 246.113,4 228.452,4 232.540,9 5,50 164.149,2 183.869,9 12,01
INDIA/INDIA 56.060,1 79.705,2 96.018,8 78.105,0 88.926,7 9,44 62.461,2 73.765,8 18,10
KOREA SELATAN/SOUTH OF KOREA 17.865,2 23.111,0 24.450,9 21.719,0 23.256,0 4,76 15.828,0 18.707,0 18,19
TAIWAN/TAIWAN, PROVINCE OF CHINA 22.361,3 23.664,0 22.920,1 20.599,2 21.249,1 -2,38 14.527,9 15.870,2 9,24
JEPANG/JAPAN 29.343,6 21.896,9 22.205,3 19.429,6 21.168,4 -7,44 13.650,8 16.927,9 24,01
NEGARA LAINNYA/OTHER COUNTRIES 71.517,3 73.259,9 74.509,9 63.998,9 63.262,5 -3,73 #N/A #N/A -
132

Lanjutan/Continued
Nilai/Value : Ribu/Thousand US$
Perub. (%)
Change (% )
17-162016 2017
2012 2013 2014
TABEL 20 : NILAI IMPOR 190 JENIS BARANG MENURUT NEGARA ASAL UTAMA
IMPORT VALUE OF 190 COMMODITIES BY MAIN COUNTRY OF ORIGIN
KODE
CODE
HS
2016 Trend (%)
'12-16
Jan-Ags/Jan-AugJENIS BARANG DESCRIPTION OF
GOODS2015
No. 08.05.148
3206 Colouring matter and preparations thereof n.e.c. in heading no. 3203, 3204, 3205; inorganic
products, kind used as luminophores whether or not chemically defined
320.035,4 278.834,6 261.947,9 240.915,6 252.898,0 -5,98 #N/A #N/A -
R.R. TIONGKOK/CHINA 91.316,2 66.122,2 70.192,1 71.379,0 81.656,0 -1,46 50.809,0 100.598,4 97,99
AUSTRALIA/AUSTRALIA 36.854,5 40.702,0 39.563,2 32.337,5 33.533,7 -4,10 21.074,5 32.627,3 54,82
JEPANG/JAPAN 33.340,1 26.205,7 24.837,2 22.863,3 25.755,1 -6,32 17.818,4 39.468,3 121,50
TAIWAN/TAIWAN, PROVINCE OF CHINA 15.709,3 22.783,0 17.934,1 19.251,4 17.390,0 0,35 11.677,1 15.279,8 30,85
JERMAN/GERMANY 19.012,4 20.777,7 17.305,7 14.489,6 14.338,4 -8,83 9.993,5 17.189,7 72,01
NEGARA LAINNYA/OTHER COUNTRIES 123.803,0 102.243,9 92.115,6 80.594,9 80.224,7 -10,47 #N/A #N/A -
3215 Ink; printing, writing or drawing ink and other inks; whether or not concentrated or solid 161.466,7 168.603,6 164.563,5 163.307,6 180.955,4 1,98 #N/A #N/A -
JEPANG/JAPAN 89.236,3 81.147,3 65.796,4 73.138,4 80.354,3 -3,09 48.852,5 54.590,5 11,75
SWISS/SWITZERLAND 12.443,0 14.705,1 19.231,3 24.007,8 20.573,6 16,14 12.399,3 15.341,8 23,73
SINGAPURA/SINGAPORE 7.575,0 10.799,3 13.810,5 16.225,8 17.454,6 23,08 10.815,0 16.353,2 51,21
R.R. TIONGKOK/CHINA 10.908,9 12.306,0 10.699,1 10.325,6 13.085,6 1,90 8.250,7 16.776,1 103,33
AMERIKA SERIKAT/UNITED STATES 4.186,9 3.954,0 4.341,8 2.764,7 7.047,7 7,08 4.307,0 4.326,9 0,46
NEGARA LAINNYA/OTHER COUNTRIES 37.116,8 45.691,9 50.684,4 36.845,3 42.439,7 0,53 #N/A #N/A -
3302 Odoriferous substances and mixtures (including alcoholic solutions) with a basis of one or
more of these substances, of a kind used as raw materials in industry; other preparations
based
353.258,3 422.445,3 421.271,3 394.254,3 425.297,1 3,07 #N/A #N/A -
SINGAPURA/SINGAPORE 125.303,2 171.130,5 185.767,3 193.665,3 214.993,6 12,79 150.398,9 178.929,1 18,97
AMERIKA SERIKAT/UNITED STATES 35.813,3 39.627,1 26.752,5 26.385,4 27.812,1 -8,72 18.941,5 22.708,2 19,89
SWISS/SWITZERLAND 25.774,4 31.435,9 34.653,3 26.807,2 23.905,2 -3,05 15.329,4 13.539,9 -11,67
JEPANG/JAPAN 16.723,4 14.046,8 13.854,3 12.314,3 20.832,5 3,13 12.314,0 15.996,1 29,90
R.R. TIONGKOK/CHINA 50.121,2 44.595,6 33.445,7 20.596,9 19.458,7 -23,39 13.213,2 21.069,4 59,46
NEGARA LAINNYA/OTHER COUNTRIES 99.522,9 121.609,6 126.798,3 114.485,3 118.295,0 2,89 #N/A #N/A -
3304 Cosmetic and toilet preparations; beauty, make-up and skin care preparations (excluding
medicaments, including sunscreen or sun tan preparations), manicure or pedicure
preparations
144.110,0 174.399,6 174.094,2 158.118,5 175.490,0 3,00 #N/A #N/A -
JEPANG/JAPAN 15.668,1 15.243,8 21.061,4 24.580,4 26.450,1 16,47 18.112,3 23.821,7 31,52
AMERIKA SERIKAT/UNITED STATES 18.807,1 22.814,3 23.002,2 25.686,1 22.961,8 5,31 14.483,7 24.904,8 71,95
PERANCIS/FRANCE 11.277,6 19.725,7 20.084,2 21.052,2 18.863,2 11,56 12.715,3 21.175,6 66,54
THAILAND/THAILAND 44.373,4 46.844,6 34.179,5 19.209,4 17.553,8 -24,01 11.050,6 11.472,8 3,82
R.R. TIONGKOK/CHINA 6.964,7 9.323,7 12.263,7 10.255,1 17.156,6 20,90 11.863,4 17.694,7 49,15
NEGARA LAINNYA/OTHER COUNTRIES 47.019,1 60.447,4 63.503,2 57.335,4 72.504,6 8,47 #N/A #N/A -
3402 Organic surface-active agents (not soap); surface-active, washing (including auxiliary
washing) and cleaning preparations, containing soap or not, excluding those of heading no.
3401
295.513,5 292.146,0 313.323,1 262.551,5 250.095,9 -4,31 #N/A #N/A -
R.R. TIONGKOK/CHINA 42.623,4 40.956,7 44.192,5 35.402,1 44.370,1 -0,65 30.563,5 45.966,4 50,40
JEPANG/JAPAN 29.651,6 26.520,4 26.197,1 21.516,4 28.190,6 -3,05 18.721,9 21.563,6 15,18
SINGAPURA/SINGAPORE 40.212,2 37.087,1 43.959,0 38.446,6 25.853,4 -8,13 16.756,7 26.326,2 57,11
AMERIKA SERIKAT/UNITED STATES 30.204,3 26.059,3 25.694,7 19.230,7 20.809,3 -9,96 13.755,9 16.982,8 23,46
JERMAN/GERMANY 30.609,2 30.270,5 39.793,0 32.897,4 20.462,9 -6,97 13.687,0 18.179,0 32,82
NEGARA LAINNYA/OTHER COUNTRIES 122.212,8 131.252,1 133.486,8 115.058,3 110.409,6 -3,29 #N/A #N/A -
133

Lanjutan/Continued
Nilai/Value : Ribu/Thousand US$
Perub. (%)
Change (% )
17-162016 2017
2012 2013 2014
TABEL 20 : NILAI IMPOR 190 JENIS BARANG MENURUT NEGARA ASAL UTAMA
IMPORT VALUE OF 190 COMMODITIES BY MAIN COUNTRY OF ORIGIN
KODE
CODE
HS
2016 Trend (%)
'12-16
Jan-Ags/Jan-AugJENIS BARANG DESCRIPTION OF
GOODS2015
No. 08.05.148
3506 Prepared glues and other prepared adhesives, n.e.c. or included; products suitable for use as
glues or adhesives, put up for retail sale as glues or adhesives, not exceeding 1kg net weight
not over 1k
174.722,1 189.677,7 193.151,1 182.595,6 181.882,9 0,42 #N/A #N/A -
R.R. TIONGKOK/CHINA 24.709,4 33.268,9 35.654,5 33.907,9 41.324,0 11,04 27.484,4 40.005,7 45,56
MALAYSIA/MALAYSIA 23.110,6 25.209,5 25.396,3 28.512,2 28.641,5 5,68 19.807,1 23.614,3 19,22
JEPANG/JAPAN 29.594,6 25.289,2 23.479,9 21.646,9 21.205,9 -7,89 13.609,4 18.585,6 36,56
KOREA SELATAN/SOUTH OF KOREA 17.799,9 17.049,0 16.245,1 19.750,6 19.556,0 3,41 13.287,4 15.965,4 20,15
SINGAPURA/SINGAPORE 20.024,8 21.984,3 24.255,7 21.312,0 17.682,7 -2,76 12.264,1 13.870,9 13,10
NEGARA LAINNYA/OTHER COUNTRIES 59.482,8 66.876,9 68.119,5 57.466,0 53.472,8 -3,58 #N/A #N/A -
3808 Insecticides, rodenticides, fungicides, herbicides, anti-sprouting products, plant growth
regulators, disinfectants and the like, put up in forms or packings for retail sale or as
preparations or form
292.962,0 409.457,5 396.134,7 381.646,7 413.779,9 6,40 #N/A #N/A -
R.R. TIONGKOK/CHINA 75.293,9 128.420,0 142.657,2 151.844,7 157.516,0 17,87 104.716,9 177.783,3 69,78
AMERIKA SERIKAT/UNITED STATES 57.549,3 80.311,2 58.980,8 59.355,4 47.548,1 -6,61 29.909,3 34.409,2 15,05
SINGAPURA/SINGAPORE 13.271,6 15.668,5 22.769,5 31.248,0 37.733,9 32,05 28.761,9 30.027,6 4,40
INDIA/INDIA 21.276,2 31.753,9 30.363,6 30.677,3 36.381,2 10,94 24.688,4 41.480,6 68,02
MALAYSIA/MALAYSIA 23.180,6 33.158,0 30.346,7 27.552,2 36.238,4 7,34 21.515,7 42.174,1 96,02
NEGARA LAINNYA/OTHER COUNTRIES 102.390,3 120.146,0 111.016,8 80.969,1 98.362,4 -4,64 #N/A #N/A -
3811 Anti-knock preparations, oxidation and gum inhibitors, viscosity improvers, anti-corrosive
preparations and the like, for mineral oils (including gasoline) or other liquids used for the
same
234.685,1 267.775,3 242.663,7 237.097,0 243.360,3 -0,49 #N/A #N/A -
AMERIKA SERIKAT/UNITED STATES 124.262,2 130.755,7 105.281,2 99.480,1 90.931,0 -8,59 56.689,1 57.635,8 1,67
SINGAPURA/SINGAPORE 49.854,9 79.903,2 77.210,3 79.527,1 82.144,3 10,45 52.507,3 88.133,8 67,85
JEPANG/JAPAN 11.065,2 9.213,3 19.735,4 17.678,5 22.026,4 22,49 14.326,2 20.572,9 43,60
R.R. TIONGKOK/CHINA 5.307,6 6.330,4 3.345,5 2.684,4 11.532,4 7,19 4.923,7 13.540,8 175,02
INDIA/INDIA 2.755,6 3.632,4 4.724,7 6.746,6 6.802,0 27,46 4.399,4 5.721,9 30,06
NEGARA LAINNYA/OTHER COUNTRIES 41.439,6 37.940,2 32.366,6 30.980,5 29.924,3 -8,18 #N/A #N/A -
3812 Prepared rubber accelerators; compound plasticisers for rubber or plastics, n.e.c. or
included; anti-oxidising preparations and other compound stabilisers for rubber or plastics
178.458,7 181.667,0 177.826,4 166.548,4 164.236,5 -2,50 #N/A #N/A -
R.R. TIONGKOK/CHINA 53.564,1 61.880,8 63.297,0 55.764,5 51.714,5 -1,73 34.660,4 48.047,4 38,62
MALAYSIA/MALAYSIA 15.729,2 18.099,0 22.759,7 26.089,1 25.092,0 13,88 16.408,4 21.024,7 28,13
TAIWAN/TAIWAN, PROVINCE OF CHINA 28.876,8 23.273,3 22.051,9 20.275,3 20.312,1 -8,07 14.035,2 16.148,4 15,06
JEPANG/JAPAN 20.851,0 17.316,9 13.764,7 12.679,8 15.035,8 -9,20 10.010,6 9.609,0 -4,01
KOREA SELATAN/SOUTH OF KOREA 15.734,4 16.676,5 14.960,1 15.924,5 13.316,2 -3,73 9.453,5 13.749,3 45,44
NEGARA LAINNYA/OTHER COUNTRIES 43.703,1 44.420,5 40.993,1 35.815,3 38.765,9 -4,45 #N/A #N/A -
3824 Prepared binders for foundry moulds or cores; chemical products and preparations of the chemical or allied industries (including those consisting of mixtures of natural products), not elsewhere258.553,3 283.479,4 294.189,1 279.219,9 311.426,0 3,63 #N/A #N/A -
R.R. TIONGKOK/CHINA 46.117,9 55.449,1 57.408,1 55.568,1 63.756,7 6,71 41.201,4 55.179,1 33,93
JEPANG/JAPAN 48.796,3 49.022,9 48.267,5 43.419,0 52.965,1 0,43 35.422,4 42.816,5 20,87
SINGAPURA/SINGAPORE 25.013,4 27.987,1 32.674,3 36.546,4 46.673,3 16,35 29.888,9 44.602,3 49,23
THAILAND/THAILAND 18.986,5 17.114,6 15.530,9 19.485,6 21.251,1 3,61 15.325,6 18.245,1 19,05
JERMAN/GERMANY 18.597,4 24.678,5 22.128,0 17.207,0 20.422,8 -1,72 14.351,6 19.462,6 35,61
NEGARA LAINNYA/OTHER COUNTRIES 101.041,8 109.227,2 118.180,4 106.993,8 106.356,8 0,82 #N/A #N/A -
134
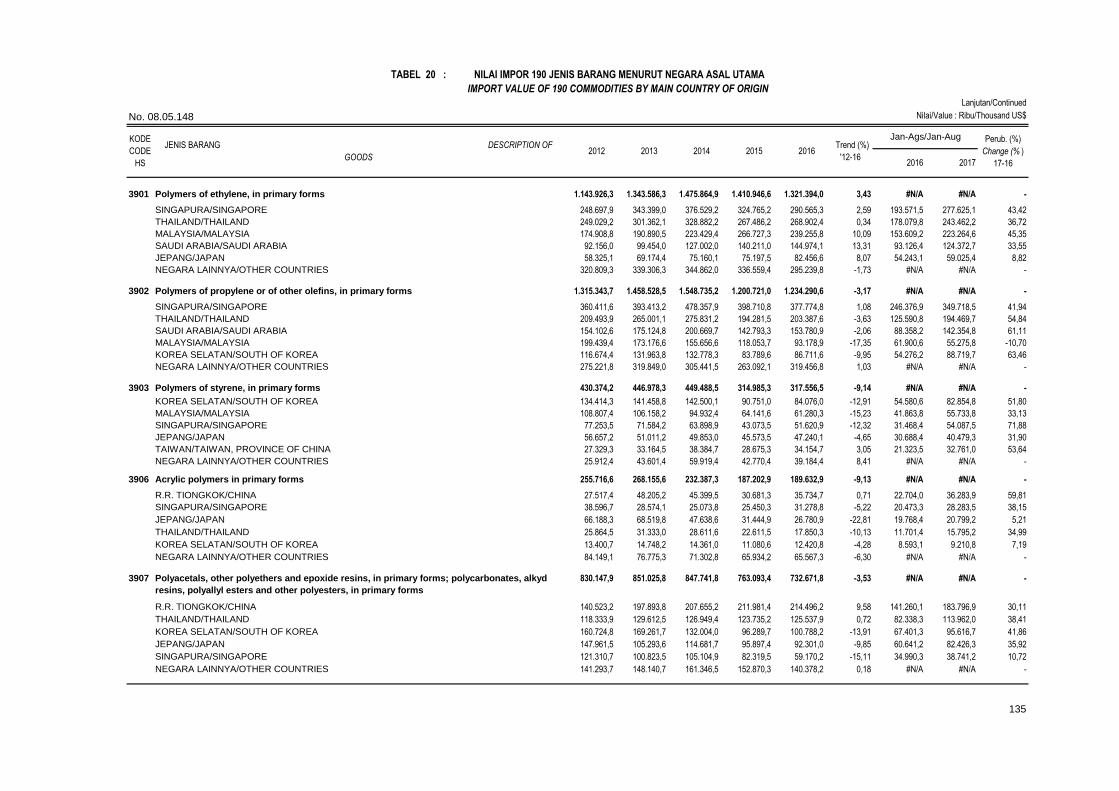
Lanjutan/Continued
Nilai/Value : Ribu/Thousand US$
Perub. (%)
Change (% )
17-162016 2017
2012 2013 2014
TABEL 20 : NILAI IMPOR 190 JENIS BARANG MENURUT NEGARA ASAL UTAMA
IMPORT VALUE OF 190 COMMODITIES BY MAIN COUNTRY OF ORIGIN
KODE
CODE
HS
2016 Trend (%)
'12-16
Jan-Ags/Jan-AugJENIS BARANG DESCRIPTION OF
GOODS2015
No. 08.05.148
3901 Polymers of ethylene, in primary forms 1.143.926,3 1.343.586,3 1.475.864,9 1.410.946,6 1.321.394,0 3,43 #N/A #N/A -
SINGAPURA/SINGAPORE 248.697,9 343.399,0 376.529,2 324.765,2 290.565,3 2,59 193.571,5 277.625,1 43,42
THAILAND/THAILAND 249.029,2 301.362,1 328.882,2 267.486,2 268.902,4 0,34 178.079,8 243.462,2 36,72
MALAYSIA/MALAYSIA 174.908,8 190.890,5 223.429,4 266.727,3 239.255,8 10,09 153.609,2 223.264,6 45,35
SAUDI ARABIA/SAUDI ARABIA 92.156,0 99.454,0 127.002,0 140.211,0 144.974,1 13,31 93.126,4 124.372,7 33,55
JEPANG/JAPAN 58.325,1 69.174,4 75.160,1 75.197,5 82.456,6 8,07 54.243,1 59.025,4 8,82
NEGARA LAINNYA/OTHER COUNTRIES 320.809,3 339.306,3 344.862,0 336.559,4 295.239,8 -1,73 #N/A #N/A -
3902 Polymers of propylene or of other olefins, in primary forms 1.315.343,7 1.458.528,5 1.548.735,2 1.200.721,0 1.234.290,6 -3,17 #N/A #N/A -
SINGAPURA/SINGAPORE 360.411,6 393.413,2 478.357,9 398.710,8 377.774,8 1,08 246.376,9 349.718,5 41,94
THAILAND/THAILAND 209.493,9 265.001,1 275.831,2 194.281,5 203.387,6 -3,63 125.590,8 194.469,7 54,84
SAUDI ARABIA/SAUDI ARABIA 154.102,6 175.124,8 200.669,7 142.793,3 153.780,9 -2,06 88.358,2 142.354,8 61,11
MALAYSIA/MALAYSIA 199.439,4 173.176,6 155.656,6 118.053,7 93.178,9 -17,35 61.900,6 55.275,8 -10,70
KOREA SELATAN/SOUTH OF KOREA 116.674,4 131.963,8 132.778,3 83.789,6 86.711,6 -9,95 54.276,2 88.719,7 63,46
NEGARA LAINNYA/OTHER COUNTRIES 275.221,8 319.849,0 305.441,5 263.092,1 319.456,8 1,03 #N/A #N/A -
3903 Polymers of styrene, in primary forms 430.374,2 446.978,3 449.488,5 314.985,3 317.556,5 -9,14 #N/A #N/A -
KOREA SELATAN/SOUTH OF KOREA 134.414,3 141.458,8 142.500,1 90.751,0 84.076,0 -12,91 54.580,6 82.854,8 51,80
MALAYSIA/MALAYSIA 108.807,4 106.158,2 94.932,4 64.141,6 61.280,3 -15,23 41.863,8 55.733,8 33,13
SINGAPURA/SINGAPORE 77.253,5 71.584,2 63.898,9 43.073,5 51.620,9 -12,32 31.468,4 54.087,5 71,88
JEPANG/JAPAN 56.657,2 51.011,2 49.853,0 45.573,5 47.240,1 -4,65 30.688,4 40.479,3 31,90
TAIWAN/TAIWAN, PROVINCE OF CHINA 27.329,3 33.164,5 38.384,7 28.675,3 34.154,7 3,05 21.323,5 32.761,0 53,64
NEGARA LAINNYA/OTHER COUNTRIES 25.912,4 43.601,4 59.919,4 42.770,4 39.184,4 8,41 #N/A #N/A -
3906 Acrylic polymers in primary forms 255.716,6 268.155,6 232.387,3 187.202,9 189.632,9 -9,13 #N/A #N/A -
R.R. TIONGKOK/CHINA 27.517,4 48.205,2 45.399,5 30.681,3 35.734,7 0,71 22.704,0 36.283,9 59,81
SINGAPURA/SINGAPORE 38.596,7 28.574,1 25.073,8 25.450,3 31.278,8 -5,22 20.473,3 28.283,5 38,15
JEPANG/JAPAN 66.188,3 68.519,8 47.638,6 31.444,9 26.780,9 -22,81 19.768,4 20.799,2 5,21
THAILAND/THAILAND 25.864,5 31.333,0 28.611,6 22.611,5 17.850,3 -10,13 11.701,4 15.795,2 34,99
KOREA SELATAN/SOUTH OF KOREA 13.400,7 14.748,2 14.361,0 11.080,6 12.420,8 -4,28 8.593,1 9.210,8 7,19
NEGARA LAINNYA/OTHER COUNTRIES 84.149,1 76.775,3 71.302,8 65.934,2 65.567,3 -6,30 #N/A #N/A -
3907 Polyacetals, other polyethers and epoxide resins, in primary forms; polycarbonates, alkyd
resins, polyallyl esters and other polyesters, in primary forms
830.147,9 851.025,8 847.741,8 763.093,4 732.671,8 -3,53 #N/A #N/A -
R.R. TIONGKOK/CHINA 140.523,2 197.893,8 207.655,2 211.981,4 214.496,2 9,58 141.260,1 183.796,9 30,11
THAILAND/THAILAND 118.333,9 129.612,5 126.949,4 123.735,2 125.537,9 0,72 82.338,3 113.962,0 38,41
KOREA SELATAN/SOUTH OF KOREA 160.724,8 169.261,7 132.004,0 96.289,7 100.788,2 -13,91 67.401,3 95.616,7 41,86
JEPANG/JAPAN 147.961,5 105.293,6 114.681,7 95.897,4 92.301,0 -9,85 60.641,2 82.426,3 35,92
SINGAPURA/SINGAPORE 121.310,7 100.823,5 105.104,9 82.319,5 59.170,2 -15,11 34.990,3 38.741,2 10,72
NEGARA LAINNYA/OTHER COUNTRIES 141.293,7 148.140,7 161.346,5 152.870,3 140.378,2 0,18 #N/A #N/A -
135

Lanjutan/Continued
Nilai/Value : Ribu/Thousand US$
Perub. (%)
Change (% )
17-162016 2017
2012 2013 2014
TABEL 20 : NILAI IMPOR 190 JENIS BARANG MENURUT NEGARA ASAL UTAMA
IMPORT VALUE OF 190 COMMODITIES BY MAIN COUNTRY OF ORIGIN
KODE
CODE
HS
2016 Trend (%)
'12-16
Jan-Ags/Jan-AugJENIS BARANG DESCRIPTION OF
GOODS2015
No. 08.05.148
3908 Polyamides in primary forms 243.657,0 245.343,8 238.902,8 198.188,8 196.207,8 -6,26 #N/A #N/A -
AMERIKA SERIKAT/UNITED STATES 77.831,5 97.189,2 85.150,7 61.801,1 52.306,7 -11,73 34.988,1 50.129,9 43,28
THAILAND/THAILAND 36.972,9 41.911,8 41.603,2 30.252,4 28.438,7 -8,16 18.140,5 27.496,9 51,58
JEPANG/JAPAN 24.991,0 17.976,1 18.073,5 22.232,1 27.231,9 3,92 16.972,6 23.090,0 36,04
TAIWAN/TAIWAN, PROVINCE OF CHINA 20.759,9 14.049,5 34.859,2 26.304,0 26.388,6 11,71 18.973,8 23.751,5 25,18
R.R. TIONGKOK/CHINA 12.706,0 12.725,9 12.478,7 15.698,6 20.535,7 12,41 10.760,7 27.129,9 152,12
NEGARA LAINNYA/OTHER COUNTRIES 70.395,7 61.491,2 46.737,6 41.900,6 41.306,2 -13,50 #N/A #N/A -
3909 Amino-resins, phenolic resins and polyurethanes, in primary forms 221.419,1 244.451,5 245.596,6 229.978,9 241.319,0 1,12 #N/A #N/A -
R.R. TIONGKOK/CHINA 38.255,5 47.409,9 51.078,0 49.104,5 58.465,7 9,24 37.208,7 61.096,7 64,20
TAIWAN/TAIWAN, PROVINCE OF CHINA 21.206,2 26.260,9 27.753,5 29.677,0 32.341,6 10,15 22.543,2 24.689,2 9,52
KOREA SELATAN/SOUTH OF KOREA 33.165,3 40.918,1 42.096,6 35.853,8 31.982,2 -2,03 20.636,5 22.952,5 11,22
JEPANG/JAPAN 26.375,9 23.760,6 25.169,5 20.999,9 25.360,9 -2,00 16.915,5 26.846,4 58,71
SINGAPURA/SINGAPORE 19.890,2 19.331,3 18.884,9 18.040,6 18.935,9 -1,66 12.481,0 17.689,8 41,73
NEGARA LAINNYA/OTHER COUNTRIES 82.526,0 86.770,8 80.614,1 76.303,1 74.232,7 -3,35 #N/A #N/A -
3919 Self-adhesive plates, sheets, film, foil, tape, strip and other flat shapes, of plastics, whether
or not in rolls
249.740,4 281.197,3 272.266,5 249.528,2 301.983,1 2,64 #N/A #N/A -
R.R. TIONGKOK/CHINA 44.526,5 46.834,5 51.395,4 53.641,2 74.170,0 12,26 48.198,0 58.991,1 22,39
JEPANG/JAPAN 43.281,0 45.344,6 48.726,7 37.161,5 45.664,6 -0,91 29.913,9 46.131,8 54,22
MALAYSIA/MALAYSIA 32.617,3 35.903,3 47.672,1 41.381,6 45.332,6 8,33 30.665,6 41.757,0 36,17
SINGAPURA/SINGAPORE 25.941,4 35.510,1 28.004,3 21.746,8 26.554,7 -4,34 17.353,7 27.361,6 57,67
AMERIKA SERIKAT/UNITED STATES 16.764,1 15.318,4 10.295,0 15.144,0 19.560,9 3,02 11.520,5 17.773,5 54,28
NEGARA LAINNYA/OTHER COUNTRIES 86.610,1 102.286,4 86.172,9 80.453,0 90.700,4 -1,47 #N/A #N/A -
3920 Plastics; plates, sheets, film, foil and strip (not self-adhesive); non-cellular and not
reinforced, laminated, supported or similarly combined with other materials, n.e.c. in chapter
39
409.203,4 440.484,4 438.399,8 404.685,7 474.648,1 2,14 #N/A #N/A -
R.R. TIONGKOK/CHINA 95.397,2 110.180,6 114.501,3 127.861,5 163.570,4 13,06 110.170,1 154.908,0 40,61
THAILAND/THAILAND 48.820,0 85.546,0 85.939,2 83.497,1 84.536,6 11,34 59.708,7 66.771,2 11,83
MALAYSIA/MALAYSIA 48.715,4 48.675,7 45.636,5 45.056,7 52.237,4 0,63 35.763,1 64.517,3 80,40
JEPANG/JAPAN 65.862,6 57.922,2 59.837,1 43.231,1 44.563,9 -10,18 29.264,6 34.915,4 19,31
VIETNAM/VIET NAM 40.431,6 37.684,4 30.983,4 19.683,2 29.812,2 -11,83 20.001,4 26.738,7 33,68
NEGARA LAINNYA/OTHER COUNTRIES 109.976,6 100.475,6 101.502,2 85.356,1 99.927,5 -3,49 #N/A #N/A -
3921 Plastic plates, sheets, film, foil and strip n.e.c. in chapter 39 221.262,2 223.385,1 235.819,9 223.278,8 249.165,3 2,40 #N/A #N/A -
R.R. TIONGKOK/CHINA 91.301,9 91.699,6 83.406,4 91.555,7 120.874,6 5,76 75.819,3 119.799,9 58,01
KOREA SELATAN/SOUTH OF KOREA 16.869,8 18.600,7 25.923,4 24.609,0 28.875,2 14,51 17.509,8 25.068,4 43,17
THAILAND/THAILAND 10.936,8 14.194,1 23.694,7 18.918,4 14.570,7 8,99 9.320,2 10.292,3 10,43
JEPANG/JAPAN 26.119,2 16.069,2 12.308,6 11.210,0 14.461,8 -14,29 8.555,5 14.920,0 74,39
VIETNAM/VIET NAM 6.098,6 7.080,1 10.119,7 12.100,5 14.310,7 25,13 8.646,8 13.813,6 59,76
NEGARA LAINNYA/OTHER COUNTRIES 69.936,0 75.741,4 80.367,1 64.885,2 56.072,4 -5,79 #N/A #N/A -
136

Lanjutan/Continued
Nilai/Value : Ribu/Thousand US$
Perub. (%)
Change (% )
17-162016 2017
2012 2013 2014
TABEL 20 : NILAI IMPOR 190 JENIS BARANG MENURUT NEGARA ASAL UTAMA
IMPORT VALUE OF 190 COMMODITIES BY MAIN COUNTRY OF ORIGIN
KODE
CODE
HS
2016 Trend (%)
'12-16
Jan-Ags/Jan-AugJENIS BARANG DESCRIPTION OF
GOODS2015
No. 08.05.148
3923 Plastic articles for the conveyance or packing of goods; stoppers, lids, caps and other
closures of plastics
349.155,0 363.694,4 382.868,5 341.543,5 365.325,0 0,28 #N/A #N/A -
R.R. TIONGKOK/CHINA 59.343,6 69.046,3 81.836,4 80.019,0 104.207,9 13,58 67.130,0 95.157,5 41,75
MALAYSIA/MALAYSIA 67.467,9 83.662,5 81.273,8 74.435,2 69.099,4 -0,69 44.786,3 58.257,5 30,08
JEPANG/JAPAN 57.079,9 44.794,1 43.081,5 45.221,7 57.915,1 0,39 37.677,0 53.435,0 41,82
SINGAPURA/SINGAPORE 47.702,0 35.250,3 37.837,9 29.594,9 26.721,6 -12,49 17.649,0 26.010,0 47,37
THAILAND/THAILAND 36.363,6 38.769,3 37.550,8 26.664,7 26.505,8 -9,58 17.925,5 21.961,1 22,51
NEGARA LAINNYA/OTHER COUNTRIES 81.198,0 92.171,9 101.288,0 85.607,8 80.875,1 -0,82 #N/A #N/A -
3926 Articles of plastics and articles of other materials of heading no. 3901 to 3914, n.e.c. in
chapter 39
397.440,5 470.611,4 468.600,8 448.555,1 487.035,8 3,65 #N/A #N/A -
R.R. TIONGKOK/CHINA 82.600,8 94.215,5 95.478,0 89.882,3 114.124,4 6,18 66.803,3 124.721,8 86,70
JEPANG/JAPAN 69.924,9 95.232,2 85.733,3 76.329,2 82.923,8 1,20 52.476,0 64.681,9 23,26
SINGAPURA/SINGAPORE 86.186,4 103.089,0 102.681,6 82.372,3 78.687,2 -3,98 53.103,0 79.903,7 50,47
HONGKONG/HONG KONG 38.961,5 30.548,8 33.222,0 40.115,7 39.877,9 3,24 23.785,2 34.234,2 43,93
AMERIKA SERIKAT/UNITED STATES 18.977,0 24.931,5 26.441,5 31.563,1 26.718,8 9,64 17.389,5 21.561,1 23,99
NEGARA LAINNYA/OTHER COUNTRIES 100.789,9 122.594,3 125.044,4 128.292,5 144.703,6 7,99 #N/A #N/A -
4002 Synthetic rubber and factice derived from oils, in primary forms or in plates, sheets or strip;
mixtures of heading no. 4001 and 4002, in primary forms or in plates, sheets or strip
910.686,2 738.360,8 669.899,3 559.518,5 572.727,2 -11,35 #N/A #N/A -
KOREA SELATAN/SOUTH OF KOREA 382.745,3 294.749,5 261.598,3 200.828,5 229.273,8 -13,14 149.958,8 284.865,1 89,96
JEPANG/JAPAN 169.038,1 169.617,6 156.669,8 126.954,6 118.602,4 -9,50 77.697,5 119.556,1 53,87
SINGAPURA/SINGAPORE 15.746,5 9.528,3 9.254,1 18.061,1 36.954,8 26,44 23.557,3 32.972,3 39,97
TAIWAN/TAIWAN, PROVINCE OF CHINA 68.685,9 42.635,6 32.824,4 33.689,4 33.568,3 -15,36 20.908,2 34.571,0 65,35
AMERIKA SERIKAT/UNITED STATES 51.393,9 41.053,6 38.072,2 32.212,0 30.360,4 -12,15 21.749,5 25.308,0 16,36
NEGARA LAINNYA/OTHER COUNTRIES 223.076,5 180.776,1 171.480,5 147.772,9 123.967,6 -12,86 #N/A #N/A -
4011 New pneumatic tyres, of rubber 733.664,4 590.596,2 512.933,8 432.401,0 446.652,3 -12,23 #N/A #N/A -
JEPANG/JAPAN 352.484,5 267.720,7 247.117,6 178.691,8 151.286,1 -18,91 90.166,4 162.369,5 80,08
R.R. TIONGKOK/CHINA 86.033,1 103.065,3 76.526,3 74.851,2 103.385,7 0,48 60.862,1 76.476,9 25,66
THAILAND/THAILAND 44.299,5 49.985,4 69.391,2 62.123,2 67.452,1 11,16 39.252,7 60.846,5 55,01
INDIA/INDIA 21.546,2 22.567,6 18.209,8 16.644,9 38.641,3 9,02 24.761,1 33.445,4 35,07
SINGAPURA/SINGAPORE 47.484,2 39.227,4 34.263,1 33.305,9 30.061,8 -10,22 22.369,5 5.917,7 -73,55
NEGARA LAINNYA/OTHER COUNTRIES 181.816,9 108.029,7 67.425,8 66.784,0 55.825,3 -24,74 #N/A #N/A -
4016 Articles of vulcanised rubber other than hard rubber, n.e.c. in 364.665,8 356.826,3 317.139,4 264.259,6 270.291,3 -8,60 #N/A #N/A -
JEPANG/JAPAN 143.547,8 130.365,4 100.843,4 82.949,6 81.154,8 -14,72 53.252,3 77.280,9 45,12
R.R. TIONGKOK/CHINA 38.659,4 41.532,0 42.801,8 32.540,6 43.370,7 -0,14 27.844,1 41.949,6 50,66
THAILAND/THAILAND 38.284,4 47.839,9 44.820,8 33.687,2 29.979,5 -8,06 20.241,7 32.476,0 60,44
SINGAPURA/SINGAPORE 46.018,2 45.538,9 39.979,4 27.042,7 25.424,1 -15,70 16.591,0 25.292,4 52,45
AMERIKA SERIKAT/UNITED STATES 26.189,5 20.388,4 17.675,0 17.360,5 17.415,8 -9,31 11.846,5 12.602,0 6,38
NEGARA LAINNYA/OTHER COUNTRIES 71.966,5 71.161,7 71.019,0 70.679,0 72.946,3 0,20 #N/A #N/A -
137

Lanjutan/Continued
Nilai/Value : Ribu/Thousand US$
Perub. (%)
Change (% )
17-162016 2017
2012 2013 2014
TABEL 20 : NILAI IMPOR 190 JENIS BARANG MENURUT NEGARA ASAL UTAMA
IMPORT VALUE OF 190 COMMODITIES BY MAIN COUNTRY OF ORIGIN
KODE
CODE
HS
2016 Trend (%)
'12-16
Jan-Ags/Jan-AugJENIS BARANG DESCRIPTION OF
GOODS2015
No. 08.05.148
4107 Leather further prepared after tanning or crusting, including parchment-dressed leather, of
bovine (including buffalo) or equine animals, without hair on, whether or not split, other than
leather of w
202.727,3 228.210,7 263.627,3 259.847,3 255.053,9 6,07 #N/A #N/A -
VIETNAM/VIET NAM 24.962,3 20.657,0 23.986,5 45.037,9 45.500,3 21,90 31.017,6 42.907,9 38,33
KOREA SELATAN/SOUTH OF KOREA 56.221,5 57.778,9 62.295,9 48.510,0 45.049,1 -5,99 32.599,7 36.797,5 12,88
R.R. TIONGKOK/CHINA 21.740,2 28.604,7 40.865,6 38.455,9 39.635,5 16,15 25.341,0 33.391,1 31,77
THAILAND/THAILAND 9.438,1 23.405,3 27.958,1 27.800,2 35.393,7 32,52 24.041,5 16.865,9 -29,85
ITALIA/ITALY 17.332,8 24.573,2 20.502,9 22.390,8 21.461,6 3,40 16.040,4 14.229,8 -11,29
NEGARA LAINNYA/OTHER COUNTRIES 73.032,3 73.191,6 88.018,2 77.652,6 68.013,8 -0,83 #N/A #N/A -
4202 Trunks; suit, camera, jewellery, cutlery cases; travel, tool, similar bags; wholly or mainly
covered by leather, composition leather, plastic sheeting, textile materials, vulcanised fibre,
paperboard
180.785,5 202.633,8 161.829,5 148.145,4 209.586,2 -0,18 #N/A #N/A -
R.R. TIONGKOK/CHINA 125.041,4 131.938,5 117.136,5 101.435,1 152.928,1 1,41 96.713,0 181.220,7 87,38
PERANCIS/FRANCE 15.147,8 13.408,7 12.063,1 11.990,1 17.093,7 1,31 11.076,3 17.016,2 53,63
ITALIA/ITALY 1.959,2 2.414,1 3.890,9 7.798,7 12.891,9 63,90 8.045,2 14.129,0 75,62
VIETNAM/VIET NAM 2.303,0 3.337,9 4.441,7 4.791,6 5.039,9 21,26 2.994,2 6.338,6 111,70
SINGAPURA/SINGAPORE 8.507,0 7.131,0 5.192,3 4.500,6 3.781,3 -18,79 2.653,1 3.527,7 32,97
NEGARA LAINNYA/OTHER COUNTRIES 27.827,0 44.403,5 19.105,0 17.629,3 17.851,4 -16,57 #N/A #N/A -
4702 Chemical wood pulp, dissolving grades 422.183,7 490.186,0 476.629,0 396.483,0 422.689,9 -2,08 #N/A #N/A -
REP.AFRIKA SELATAN/SOUTH AFRICA 240.417,3 236.453,1 158.026,5 109.930,7 121.889,8 -19,14 87.338,5 119.712,6 37,07
AMERIKA SERIKAT/UNITED STATES 774,3 1.709,9 3.073,1 64.101,0 101.727,8 281,15 66.135,5 111.786,0 69,03
KANADA/CANADA 37.471,9 64.216,1 157.239,7 72.518,6 72.843,5 15,62 52.468,3 63.711,7 21,43
REPUBLIK CZECH/CZECH REPUBLIC 29.985,2 83.133,8 79.569,3 63.333,7 54.439,1 9,64 31.605,7 37.560,9 18,84
SWEDIA/SWEDEN 74.828,4 78.455,5 71.749,8 63.821,2 36.927,3 -14,95 28.409,3 53.748,9 89,19
NEGARA LAINNYA/OTHER COUNTRIES 38.706,7 26.217,5 6.970,7 22.777,8 34.862,4 -3,44 #N/A #N/A -
4703 Chemical wood pulp, soda or sulphate, other than dissolving grades 426.688,7 562.208,6 624.430,7 444.348,8 441.390,6 -1,66 #N/A #N/A -
KANADA/CANADA 93.624,1 199.162,9 282.911,8 190.572,8 211.575,8 17,19 137.707,4 218.453,6 58,64
AMERIKA SERIKAT/UNITED STATES 80.698,9 82.784,2 126.043,8 102.072,3 104.427,7 7,52 70.814,2 96.603,2 36,42
PERANCIS/FRANCE 106.228,4 103.686,2 54.738,0 36.145,8 31.458,8 -29,44 20.312,3 25.528,4 25,68
SELANDIA BARU/NEW ZEALAND 25.165,5 32.256,8 28.369,4 25.459,9 23.906,4 -3,34 15.757,7 31.122,8 97,51
BRASILIA/BRAZIL 3.488,8 3.286,5 16.822,7 17.928,6 19.999,6 68,02 14.641,4 18.238,8 24,57
NEGARA LAINNYA/OTHER COUNTRIES 117.482,9 141.032,1 115.545,0 72.169,5 50.022,3 -21,16 #N/A #N/A -
4707 Waste and scrap of paper and paperboard 500.294,3 473.176,8 475.265,7 321.374,2 365.336,8 -9,66 #N/A #N/A -
AMERIKA SERIKAT/UNITED STATES 52.168,1 55.080,0 61.589,7 52.202,0 67.229,1 4,64 42.886,9 61.853,7 44,23
SINGAPURA/SINGAPORE 86.158,7 73.482,2 74.567,6 39.051,6 46.117,9 -17,16 28.705,1 39.381,3 37,19
AUSTRALIA/AUSTRALIA 48.138,8 50.012,6 64.616,7 39.899,1 44.797,7 -3,63 29.921,1 42.489,5 42,01
INGGRIS/UNITED KINGDOM 62.678,1 58.340,6 42.508,7 27.574,4 38.840,9 -15,69 30.254,2 33.446,3 10,55
SELANDIA BARU/NEW ZEALAND 21.077,0 29.448,0 31.455,0 29.041,5 30.957,3 7,84 19.001,5 32.252,6 69,74
NEGARA LAINNYA/OTHER COUNTRIES 230.073,6 206.813,3 200.528,0 133.605,7 137.393,9 -13,65 #N/A #N/A -
138

Lanjutan/Continued
Nilai/Value : Ribu/Thousand US$
Perub. (%)
Change (% )
17-162016 2017
2012 2013 2014
TABEL 20 : NILAI IMPOR 190 JENIS BARANG MENURUT NEGARA ASAL UTAMA
IMPORT VALUE OF 190 COMMODITIES BY MAIN COUNTRY OF ORIGIN
KODE
CODE
HS
2016 Trend (%)
'12-16
Jan-Ags/Jan-AugJENIS BARANG DESCRIPTION OF
GOODS2015
No. 08.05.148
4811 Paper, paperboard, cellulose wadding and webs of cellulose fibres, coated, impregnated,
covered, surface-coloured, decorated or printed, rolls or sheets, other than goods of heading
no. 4803,
281.082,7 248.996,4 261.753,9 263.743,4 257.626,5 -1,16 #N/A #N/A -
SINGAPURA/SINGAPORE 119.924,3 94.112,6 87.594,8 94.783,3 85.723,0 -6,43 56.740,6 57.157,5 0,73
R.R. TIONGKOK/CHINA 23.565,9 23.314,6 22.944,3 22.989,6 25.171,9 1,19 16.308,3 23.986,2 47,08
PAKISTAN/PAKISTAN - - 17,3 381,2 22.911,2 - 11.515,4 20.264,5 75,98
JEPANG/JAPAN 27.406,5 24.750,1 26.649,4 22.385,7 21.855,6 -5,38 14.413,1 15.685,9 8,83
MALAYSIA/MALAYSIA 27.470,4 25.416,8 22.874,0 22.624,8 21.030,0 -6,30 14.416,4 20.523,8 42,36
NEGARA LAINNYA/OTHER COUNTRIES 82.715,7 81.402,3 101.674,1 100.578,8 80.934,8 1,69 #N/A #N/A -
4819 Cartons, boxes, cases, bags and the like, of paper, paperboard, cellulose wadding or fibres;
box files, letter trays and the like, of paper or paperboard, of a kind used in offices, shops or
the like
198.964,1 245.468,0 280.712,2 266.585,2 276.492,0 7,69 #N/A #N/A -
R.R. TIONGKOK/CHINA 40.782,6 54.436,8 65.887,1 66.768,6 91.195,5 19,89 54.466,3 82.181,5 50,88
THAILAND/THAILAND 41.408,3 48.908,0 34.452,1 43.905,5 57.422,4 5,61 33.995,3 43.367,1 27,57
SINGAPURA/SINGAPORE 35.593,6 37.631,4 51.036,7 50.780,5 39.958,3 5,45 27.931,8 19.924,4 -28,67
VIETNAM/VIET NAM 7.974,4 14.109,2 26.262,3 19.638,9 17.172,6 20,50 8.690,0 21.547,7 147,96
MALAYSIA/MALAYSIA 19.390,2 17.298,7 20.982,0 19.609,2 16.229,0 -2,28 9.716,6 14.732,8 51,63
NEGARA LAINNYA/OTHER COUNTRIES 53.815,1 73.084,0 82.092,0 65.882,4 54.514,2 -0,78 #N/A #N/A -
5201 Cotton; not carded or combed 1.333.135,1 1.346.306,7 1.400.810,9 1.087.556,8 1.087.200,3 -6,02 #N/A #N/A -
AMERIKA SERIKAT/UNITED STATES 183.287,6 264.169,5 335.998,6 349.754,2 307.191,8 14,04 187.250,1 489.439,2 161,38
BRASILIA/BRAZIL 359.007,1 263.213,3 289.866,8 255.041,0 278.816,9 -5,23 178.629,5 176.031,9 -1,45
AUSTRALIA/AUSTRALIA 237.238,9 195.027,4 152.957,1 73.075,5 127.648,7 -19,92 62.511,5 134.684,2 115,45
INDIA/INDIA 45.299,8 62.262,5 102.195,9 52.214,1 77.144,1 9,29 62.441,5 102.502,0 64,16
YUNANI/GREECE 69.828,9 40.028,7 38.914,0 33.002,4 44.017,0 -10,56 22.171,9 43.138,0 94,56
NEGARA LAINNYA/OTHER COUNTRIES 438.472,7 521.605,3 480.878,4 324.469,6 252.381,7 -14,61 #N/A #N/A -
5208 Woven fabrics of cotton, containing 85% or more by weight of cotton, weighing not more
than 200 g/m2
502.948,2 502.791,0 488.140,6 457.293,0 413.902,3 -4,73 #N/A #N/A -
R.R. TIONGKOK/CHINA 297.892,9 292.439,5 286.193,0 279.615,1 249.045,6 -3,95 160.252,9 205.766,6 28,40
KOREA SELATAN/SOUTH OF KOREA 64.341,2 60.364,2 63.973,8 58.042,7 66.125,2 0,15 47.051,2 45.292,6 -3,74
HONGKONG/HONG KONG 86.048,4 94.126,9 82.662,2 78.139,7 57.208,0 -9,54 40.785,9 33.149,0 -18,72
TAIWAN/TAIWAN, PROVINCE OF CHINA 14.805,6 15.917,2 9.852,9 10.919,6 10.283,6 -10,47 7.250,0 9.681,3 33,53
INDIA/INDIA 6.864,4 5.001,8 5.505,9 6.609,2 8.794,9 8,05 5.473,2 7.068,0 29,14
NEGARA LAINNYA/OTHER COUNTRIES 32.995,8 34.941,4 39.952,8 23.966,6 22.445,0 -10,84 #N/A #N/A -
5209 Woven fabrics of cotton, containing 85% or more by weight of cotton, weighing more than
200g/m2
248.311,0 244.759,9 210.940,4 199.628,6 193.695,4 -6,77 #N/A #N/A -
R.R. TIONGKOK/CHINA 90.798,1 102.893,6 99.730,8 99.609,9 85.627,4 -1,49 61.658,6 60.362,4 -2,10
KOREA SELATAN/SOUTH OF KOREA 68.517,6 58.717,3 54.323,6 43.110,1 47.883,0 -9,75 32.331,1 23.474,0 -27,40
HONGKONG/HONG KONG 44.182,4 43.187,1 29.498,1 25.639,6 28.979,0 -12,76 16.310,4 30.960,7 89,82
PAKISTAN/PAKISTAN 9.890,1 7.639,1 7.561,3 6.875,2 7.897,4 -5,40 5.405,5 9.720,2 79,82
TAIWAN/TAIWAN, PROVINCE OF CHINA 11.015,9 7.562,2 4.901,3 6.494,4 7.393,8 -9,06 5.353,8 5.631,0 5,18
NEGARA LAINNYA/OTHER COUNTRIES 23.906,8 24.760,6 14.925,3 17.899,5 15.914,9 -10,76 #N/A #N/A -
139

Lanjutan/Continued
Nilai/Value : Ribu/Thousand US$
Perub. (%)
Change (% )
17-162016 2017
2012 2013 2014
TABEL 20 : NILAI IMPOR 190 JENIS BARANG MENURUT NEGARA ASAL UTAMA
IMPORT VALUE OF 190 COMMODITIES BY MAIN COUNTRY OF ORIGIN
KODE
CODE
HS
2016 Trend (%)
'12-16
Jan-Ags/Jan-AugJENIS BARANG DESCRIPTION OF
GOODS2015
No. 08.05.148
5210 Woven fabrics of cotton, containing less than 85% by weight of cotton, mixed mainly or solely
with man-made fibres, weighing not more than 200 g/m2
156.108,1 175.685,8 145.875,5 139.397,2 173.657,1 -0,18 #N/A #N/A -
R.R. TIONGKOK/CHINA 73.546,1 58.631,8 45.610,9 54.312,1 58.679,2 -5,14 36.003,3 61.657,7 71,26
MALAYSIA/MALAYSIA 10.265,2 26.876,5 19.665,0 31.919,1 40.698,8 34,00 26.923,5 27.360,8 1,62
KOREA SELATAN/SOUTH OF KOREA 27.944,4 36.285,1 22.890,5 17.058,9 23.021,0 -10,80 17.725,1 18.462,5 4,16
TAIWAN/TAIWAN, PROVINCE OF CHINA 8.186,9 7.145,3 6.789,4 9.564,9 17.554,4 19,93 13.280,6 4.940,9 -62,80
HONGKONG/HONG KONG 24.664,0 33.435,3 40.221,7 10.606,0 16.591,9 -17,64 10.947,9 7.137,2 -34,81
NEGARA LAINNYA/OTHER COUNTRIES 11.501,4 13.311,6 10.698,0 15.936,2 17.111,7 10,24 #N/A #N/A -
5402 Synthetic filament yarn (other than sewing thread), not put up for retail sale, including
synthetic monofilament of less than 67 decitex
366.740,0 387.850,5 413.120,8 353.459,9 345.633,4 -2,09 #N/A #N/A -
R.R. TIONGKOK/CHINA 117.706,2 130.925,6 157.396,4 135.213,9 150.955,3 5,44 102.845,0 140.896,4 37,00
KOREA SELATAN/SOUTH OF KOREA 50.111,4 54.072,3 52.577,2 42.318,0 40.984,7 -6,27 26.491,1 33.384,4 26,02
VIETNAM/VIET NAM 23.829,8 26.663,8 30.673,8 34.895,9 30.898,1 8,21 22.017,4 25.316,5 14,98
THAILAND/THAILAND 15.510,8 17.811,7 23.987,3 22.611,0 24.925,3 12,61 16.604,6 22.516,3 35,60
JEPANG/JAPAN 31.308,5 30.741,6 21.668,4 20.526,1 19.373,7 -12,75 13.721,1 15.832,2 15,39
NEGARA LAINNYA/OTHER COUNTRIES 128.273,3 127.635,5 126.817,7 97.894,9 78.496,3 -11,73 #N/A #N/A -
5407 Woven fabrics of synthetic filament yarn, including woven fabrics obtained from materials of
heading no. 5404
726.382,0 747.491,9 807.769,9 803.479,9 944.470,6 6,16 #N/A #N/A -
R.R. TIONGKOK/CHINA 313.133,2 343.147,5 343.999,2 343.537,4 471.424,1 8,54 314.059,1 413.217,3 31,57
KOREA SELATAN/SOUTH OF KOREA 179.514,2 174.256,3 209.520,6 188.815,6 193.145,8 2,29 133.256,7 152.343,9 14,32
TAIWAN/TAIWAN, PROVINCE OF CHINA 129.887,0 120.611,5 136.247,4 155.058,0 156.199,2 6,40 110.451,7 118.697,0 7,47
HONGKONG/HONG KONG 35.159,1 45.368,2 49.372,8 46.209,6 40.680,4 3,15 27.840,9 27.198,1 -2,31
JEPANG/JAPAN 19.491,8 24.549,4 21.523,3 24.435,9 27.627,1 7,18 18.030,9 20.686,7 14,73
NEGARA LAINNYA/OTHER COUNTRIES 49.196,8 39.559,0 47.106,6 45.423,3 55.393,9 3,83 #N/A #N/A -
5502 Artificial filament tow 185.990,2 247.977,9 251.121,4 222.278,0 220.039,1 2,29 #N/A #N/A -
AMERIKA SERIKAT/UNITED STATES 88.802,6 121.645,0 101.312,4 84.467,8 69.090,2 -8,30 47.813,7 55.049,4 15,13
KOREA SELATAN/SOUTH OF KOREA 39.935,4 44.364,3 49.188,9 41.104,6 52.175,7 4,69 34.998,0 21.136,0 -39,61
JEPANG/JAPAN 39.226,3 57.472,5 80.527,3 55.242,6 44.709,3 2,25 32.152,9 69.206,8 115,24
BELANDA/NETHERLANDS 355,4 - - 18.206,9 30.650,5 - 19.494,2 27.871,5 42,97
JERMAN/GERMANY 13.224,8 17.794,6 15.298,7 20.651,9 18.315,6 8,33 13.755,5 11.871,2 -13,70
NEGARA LAINNYA/OTHER COUNTRIES 4.445,7 6.701,4 4.794,1 2.604,1 5.097,8 -6,49 #N/A #N/A -
5503 Synthetic staple fibres, not carded, combed or otherwise processed for spinning 275.299,3 300.151,8 280.126,3 211.346,2 230.616,8 -6,81 #N/A #N/A -
R.R. TIONGKOK/CHINA 59.777,3 84.716,3 81.546,3 67.900,7 97.936,6 7,96 57.697,9 97.815,6 69,53
THAILAND/THAILAND 52.483,8 60.796,6 54.506,8 40.604,2 43.631,9 -7,44 28.754,8 36.297,4 26,23
JEPANG/JAPAN 52.080,0 50.106,4 48.838,4 40.075,9 32.634,5 -10,94 21.269,4 30.420,6 43,03
KOREA SELATAN/SOUTH OF KOREA 48.952,1 41.712,8 34.731,6 27.569,0 25.805,8 -15,59 17.473,4 19.222,8 10,01
MALAYSIA/MALAYSIA 24.523,9 19.715,6 14.615,5 10.226,0 9.825,1 -22,01 6.252,4 10.372,6 65,90
NEGARA LAINNYA/OTHER COUNTRIES 37.482,3 43.104,1 45.887,5 24.970,5 20.782,9 (15,85) #N/A #N/A -
140

Lanjutan/Continued
Nilai/Value : Ribu/Thousand US$
Perub. (%)
Change (% )
17-162016 2017
2012 2013 2014
TABEL 20 : NILAI IMPOR 190 JENIS BARANG MENURUT NEGARA ASAL UTAMA
IMPORT VALUE OF 190 COMMODITIES BY MAIN COUNTRY OF ORIGIN
KODE
CODE
HS
2016 Trend (%)
'12-16
Jan-Ags/Jan-AugJENIS BARANG DESCRIPTION OF
GOODS2015
No. 08.05.148
5504 Artificial staple fibres, not carded, combed or otherwise processed for spinning 255.074,0 145.381,4 171.546,4 165.874,6 195.517,0 -3,92 #N/A #N/A -
R.R. TIONGKOK/CHINA 135.664,2 45.233,6 80.579,8 85.038,0 114.415,4 2,95 79.926,9 103.490,4 29,48
THAILAND/THAILAND 58.218,7 45.289,5 30.496,7 25.871,1 25.168,3 -20,05 15.123,3 16.875,2 11,58
HONGKONG/HONG KONG 1.291,0 5.684,2 27.985,2 20.450,5 20.027,6 96,67 9.372,6 8.613,1 -8,10
TAIWAN/TAIWAN, PROVINCE OF CHINA 11.088,0 21.032,5 13.620,9 17.409,9 12.702,1 0,83 11.253,1 5.532,0 -50,84
AUSTRIA/AUSTRIA 4.325,2 6.196,2 6.707,3 7.132,5 11.886,8 24,14 6.680,7 11.287,8 68,96
NEGARA LAINNYA/OTHER COUNTRIES 44.486,9 21.945,4 12.156,6 9.972,6 11.316,8 -29,72 #N/A #N/A -
5513 Woven fabrics of synthetic staple fibres, containing less than 85% by weight of such fibres,
mixed mainly or solely with cotton, of a weight not exceeding 170g/m2
161.768,6 180.400,5 164.972,3 171.339,4 172.072,4 0,72 #N/A #N/A -
R.R. TIONGKOK/CHINA 70.477,8 80.713,0 75.263,3 69.081,6 72.192,3 -1,07 50.954,3 62.671,3 23,00
KOREA SELATAN/SOUTH OF KOREA 31.962,9 33.843,0 34.190,7 34.892,6 35.312,7 2,33 22.108,8 23.012,5 4,09
TAIWAN/TAIWAN, PROVINCE OF CHINA 17.703,9 23.068,7 21.182,6 32.117,1 21.106,4 7,06 13.523,1 23.704,8 75,29
HONGKONG/HONG KONG 11.136,4 13.852,3 11.402,3 14.870,8 16.880,9 9,45 12.468,9 14.769,8 18,45
THAILAND/THAILAND 5.496,3 3.016,3 4.321,8 5.767,1 8.771,2 17,15 6.404,8 4.213,7 -34,21
NEGARA LAINNYA/OTHER COUNTRIES 24.991,3 25.907,0 18.611,6 14.610,2 17.808,9 -11,75 #N/A #N/A -
5603 Nonwovens; whether or not impregnated, coated, covered or laminated 237.167,5 256.409,6 279.018,6 274.052,8 295.254,8 5,18 #N/A #N/A -
R.R. TIONGKOK/CHINA 73.436,7 81.352,6 92.462,0 88.615,9 103.604,3 8,05 70.102,4 79.801,8 13,84
THAILAND/THAILAND 30.744,4 33.600,4 41.594,9 52.273,1 56.662,9 18,11 39.094,7 48.463,6 23,96
KOREA SELATAN/SOUTH OF KOREA 44.727,3 44.034,2 49.317,3 44.770,2 43.880,9 -0,22 31.739,4 28.294,8 -10,85
MALAYSIA/MALAYSIA 8.444,6 11.269,5 15.313,0 15.350,7 15.856,1 16,99 10.401,5 12.769,2 22,76
HONGKONG/HONG KONG 14.782,8 16.719,4 15.712,9 16.222,1 13.611,4 -1,93 9.456,8 7.147,1 -24,42
NEGARA LAINNYA/OTHER COUNTRIES 65.031,7 69.433,5 64.618,4 56.820,8 61.639,4 -3,03 #N/A #N/A -
5903 Textile fabrics impregnated, coated, covered or laminated with plastics, other than those of
heading no. 5902
272.636,7 289.524,7 303.595,4 282.229,6 274.679,1 -0,11 #N/A #N/A -
R.R. TIONGKOK/CHINA 77.913,5 91.267,3 100.034,4 97.330,9 106.196,8 7,08 68.971,6 107.071,3 55,24
KOREA SELATAN/SOUTH OF KOREA 52.259,5 53.867,0 53.774,9 44.059,2 49.129,1 -3,19 34.516,8 51.149,5 48,19
TAIWAN/TAIWAN, PROVINCE OF CHINA 73.481,3 70.414,4 73.843,9 57.058,8 43.303,0 -11,91 28.922,0 37.899,2 31,04
VIETNAM/VIET NAM 6.765,5 4.585,0 6.983,9 29.538,3 25.720,6 57,36 18.930,3 31.306,3 65,38
HONGKONG/HONG KONG 21.605,2 25.794,5 24.810,8 19.517,4 20.037,9 -4,20 13.436,3 10.070,8 -25,05
NEGARA LAINNYA/OTHER COUNTRIES 40.611,6 43.596,5 44.147,5 34.725,1 30.291,8 -7,82 #N/A #N/A -
6002 Fabrics; knitted or crocheted, other than those of heading 60.01, of a width not exceeding
30cm, containing by weight 5% or more of elastomeric yarn or rubber thread
246.506,9 250.791,3 213.928,4 210.739,1 223.148,5 -3,66 #N/A #N/A -
KOREA SELATAN/SOUTH OF KOREA 73.616,7 75.465,7 74.522,4 71.328,3 71.428,3 -1,16 48.491,8 49.989,1 3,09
R.R. TIONGKOK/CHINA 51.968,5 51.429,1 42.742,6 41.385,6 53.934,1 -1,42 32.590,5 64.195,5 96,98
HONGKONG/HONG KONG 55.794,1 58.514,0 39.874,2 43.752,8 39.454,3 -9,37 25.291,7 16.228,4 -35,84
TAIWAN/TAIWAN, PROVINCE OF CHINA 40.202,3 39.964,5 39.864,4 32.802,4 37.661,5 -3,23 25.871,6 27.859,9 7,69
VIETNAM/VIET NAM 14.844,2 14.198,5 8.304,4 8.803,4 6.533,0 -19,10 3.956,9 5.140,1 29,90
NEGARA LAINNYA/OTHER COUNTRIES 10.081,0 11.219,6 8.620,4 12.666,5 14.137,3 8,30 #N/A #N/A -
141

Lanjutan/Continued
Nilai/Value : Ribu/Thousand US$
Perub. (%)
Change (% )
17-162016 2017
2012 2013 2014
TABEL 20 : NILAI IMPOR 190 JENIS BARANG MENURUT NEGARA ASAL UTAMA
IMPORT VALUE OF 190 COMMODITIES BY MAIN COUNTRY OF ORIGIN
KODE
CODE
HS
2016 Trend (%)
'12-16
Jan-Ags/Jan-AugJENIS BARANG DESCRIPTION OF
GOODS2015
No. 08.05.148
6004 Fabrics; knitted or crocheted fabrics of a width exceeding 30 cm, other than those of heading
60.01, containing by weight 5% or more of elastomeric yarn or rubber thread
228.170,4 236.920,7 260.902,6 273.960,0 228.459,3 1,49 #N/A #N/A -
R.R. TIONGKOK/CHINA 60.452,2 69.744,9 104.337,4 108.567,8 81.768,3 11,03 51.687,1 61.357,7 18,71
KOREA SELATAN/SOUTH OF KOREA 81.179,8 85.466,4 76.781,5 70.887,2 73.881,9 -3,68 49.160,4 48.016,9 -2,33
HONGKONG/HONG KONG 37.999,1 34.636,1 32.453,8 44.141,6 28.934,9 -2,98 21.505,6 18.814,2 -12,52
TAIWAN/TAIWAN, PROVINCE OF CHINA 24.820,4 23.688,6 23.548,4 29.362,9 23.190,8 0,79 16.750,2 22.953,5 37,03
VIETNAM/VIET NAM 3.551,9 6.131,9 10.062,7 8.529,4 9.561,6 25,99 6.503,8 11.071,9 70,24
NEGARA LAINNYA/OTHER COUNTRIES 20.167,0 17.252,9 13.718,8 12.471,1 11.121,8 -14,06 #N/A #N/A -
6006 Fabrics; knitted or crocheted fabrics, other than those of headings 60.01 to 60.04 613.294,0 597.371,0 627.846,7 598.716,6 602.636,8 -0,33 #N/A #N/A -
R.R. TIONGKOK/CHINA 135.703,3 145.854,0 167.045,9 200.609,4 205.780,7 12,20 139.487,4 223.603,3 60,30
KOREA SELATAN/SOUTH OF KOREA 244.905,3 214.726,2 233.313,6 180.608,1 164.758,5 -9,21 116.220,0 128.104,2 10,23
HONGKONG/HONG KONG 129.851,8 110.434,3 102.521,2 71.824,2 79.538,6 -13,16 54.596,1 63.786,1 16,83
TAIWAN/TAIWAN, PROVINCE OF CHINA 63.532,6 74.389,5 65.164,9 80.774,1 77.356,1 4,88 52.530,5 75.251,9 43,25
VIETNAM/VIET NAM 9.384,6 15.130,7 13.682,7 24.746,8 24.722,2 27,50 15.177,4 22.857,8 50,60
NEGARA LAINNYA/OTHER COUNTRIES 29.916,3 36.836,3 46.118,3 40.154,0 50.480,7 11,99 #N/A #N/A -
6406 Footwear; parts of footwear; removable in-soles, heel cushions and similar articles; gaiters,
le.g.ings and similar articles, and parts thereof
184.190,3 185.968,6 193.725,7 195.711,7 216.445,4 3,81 #N/A #N/A -
R.R. TIONGKOK/CHINA 67.381,1 59.438,6 58.230,4 50.323,4 58.499,0 -4,39 31.104,5 67.984,8 118,57
VIETNAM/VIET NAM 29.631,2 34.497,1 32.052,7 41.394,0 45.983,9 11,20 29.874,5 37.573,9 25,77
HONGKONG/HONG KONG 19.587,9 25.265,3 34.696,2 32.581,0 32.611,8 13,59 20.516,2 31.101,7 51,60
AMERIKA SERIKAT/UNITED STATES 12.879,0 9.258,5 10.402,6 21.596,1 28.264,1 27,37 18.318,0 18.973,2 3,58
INDIA/INDIA 9.447,3 12.808,3 13.169,6 14.113,3 14.542,8 10,07 9.632,6 11.907,6 23,62
NEGARA LAINNYA/OTHER COUNTRIES 45.263,8 44.700,8 45.174,2 35.703,9 36.543,9 -6,32 #N/A #N/A -
6907 Ceramic flags and paving, hearth or wall tiles, unglazed; unglazed ceramic mosaic cubes and
the like, whether or not on a backing
161.132,9 127.808,8 166.457,5 159.176,0 181.199,5 4,65 #N/A #N/A -
R.R. TIONGKOK/CHINA 146.373,9 116.614,4 158.450,6 153.548,5 178.396,5 6,94 112.012,2 168.342,8 50,29
VIETNAM/VIET NAM 11.763,1 10.155,5 6.455,1 4.161,7 2.183,2 -34,69 1.644,4 3.741,6 127,54
MALAYSIA/MALAYSIA 2.468,4 715,2 1.352,4 1.071,6 266,4 -33,29 179,7 385,0 114,22
ITALIA/ITALY 203,5 102,9 155,0 236,1 192,7 7,48 165,3 158,6 -4,07
HONGKONG/HONG KONG 84,5 1,1 - 23,7 99,0 - 99,0 21,6 -78,16
NEGARA LAINNYA/OTHER COUNTRIES 239,5 219,7 44,3 134,5 61,6 -27,44 #N/A #N/A -
7108 Gold (including gold plated with platinum) unwrought or in semi-manufactured forms, or in
powder form
40.605,7 28.731,2 23.434,4 703.817,4 830.855,1 151,82 #N/A #N/A -
SINGAPURA/SINGAPORE 20.750,6 15.442,5 12.928,3 534.018,1 373.252,9 154,03 91.361,3 97.652,7 6,89
SWISS/SWITZERLAND - - - - 150.197,3 - 4.273,5 229.000,1 5.258,63
HONGKONG/HONG KONG 2.108,5 1.443,7 398,1 123.924,5 113.845,4 246,61 29.190,1 128.442,4 340,02
AMERIKA SERIKAT/UNITED STATES 5,7 1,2 - 36.746,1 80.100,5 - 50.727,5 41.663,7 -17,87
PERSERIKATAN EMIRAT ARAB/UNITED ARAB EMIRATES - - - 878,2 49.730,8 - 21.450,2 33.624,3 56,76
NEGARA LAINNYA/OTHER COUNTRIES 17.740,8 11.843,8 10.108,1 8.250,6 63.728,2 24,56 #N/A #N/A -
142

Lanjutan/Continued
Nilai/Value : Ribu/Thousand US$
Perub. (%)
Change (% )
17-162016 2017
2012 2013 2014
TABEL 20 : NILAI IMPOR 190 JENIS BARANG MENURUT NEGARA ASAL UTAMA
IMPORT VALUE OF 190 COMMODITIES BY MAIN COUNTRY OF ORIGIN
KODE
CODE
HS
2016 Trend (%)
'12-16
Jan-Ags/Jan-AugJENIS BARANG DESCRIPTION OF
GOODS2015
No. 08.05.148
7204 Ferrous waste and scrap; remelting scrap ingots of iron or steel 854.318,3 963.168,9 808.720,8 272.870,6 238.834,1 -31,68 #N/A #N/A -
HONGKONG/HONG KONG 7.505,0 35.280,2 53.041,8 42.392,1 40.946,5 43,00 22.163,4 43.051,5 94,25
JEPANG/JAPAN 25.383,5 34.683,7 20.630,4 34.888,9 35.096,3 6,76 25.531,5 19.553,4 -23,41
INGGRIS/UNITED KINGDOM 45.119,5 40.676,5 13.950,1 2.950,2 31.288,5 -28,51 16.081,1 17.954,9 11,65
SINGAPURA/SINGAPORE 96.774,7 131.770,0 144.134,3 44.080,9 29.556,6 -29,30 14.352,1 44.337,6 208,93
AUSTRALIA/AUSTRALIA 176.032,6 154.143,0 133.962,8 40.704,5 23.949,9 -41,26 15.819,8 61.958,9 291,65
NEGARA LAINNYA/OTHER COUNTRIES 503.503,1 566.615,4 443.001,4 107.854,0 77.996,3 -41,66 #N/A #N/A -
7207 Iron or non-alloy steel; semi-finished products thereof 2.292.298,4 2.048.443,2 1.879.768,8 1.469.545,8 1.534.132,2 -10,73 #N/A #N/A -
R.R. TIONGKOK/CHINA 55.990,0 128.290,2 607.231,4 872.241,8 988.521,9 115,09 672.256,5 295.472,8 -56,05
FEDERASI RUSIA/RUSSIA FEDERATION 1.077.427,0 944.929,1 652.764,3 300.871,4 262.132,6 -32,78 151.129,2 320.163,0 111,85
BRASILIA/BRAZIL 241.666,1 123.105,0 94.529,0 194.129,9 173.138,1 -2,09 115.656,3 117.151,4 1,29
JEPANG/JAPAN 81.513,4 162.525,5 118.723,7 49.478,3 31.858,1 -26,42 21.839,5 12.998,2 -40,48
QATAR/QATAR - - - - 23.924,7 - - 13.494,7 -
NEGARA LAINNYA/OTHER COUNTRIES 835.702,0 689.593,5 406.520,4 52.824,4 54.556,7 -55,19 #N/A #N/A -
7208 Iron or non-alloy steel; flat-rolled products of a width of 600mm or more, hot-rolled, not clad,
plated or coated
1.879.040,5 1.610.153,5 1.218.528,7 830.422,5 621.940,1 -24,98 #N/A #N/A -
JEPANG/JAPAN 611.607,9 604.949,2 408.529,7 369.778,3 326.688,2 -16,02 214.532,3 278.040,4 29,60
KOREA SELATAN/SOUTH OF KOREA 560.924,5 490.760,1 426.887,8 248.148,8 168.061,9 -26,60 110.140,6 224.584,0 103,91
R.R. TIONGKOK/CHINA 122.757,5 45.253,3 68.860,4 71.594,8 50.028,4 -12,51 29.762,4 56.828,9 90,94
TAIWAN/TAIWAN, PROVINCE OF CHINA 166.092,4 176.407,8 161.253,9 83.600,3 39.128,8 -30,50 21.709,4 40.627,3 87,14
SINGAPURA/SINGAPORE 223.520,8 109.157,2 69.268,2 35.577,7 27.177,4 -41,35 18.883,3 33.172,1 75,67
NEGARA LAINNYA/OTHER COUNTRIES 194.137,5 183.625,9 83.728,7 21.722,5 10.855,3 -54,63 #N/A #N/A -
7209 Iron or non-alloy steel; flat-rolled products, width 600mm or more, cold-rolled (cold-reduced),
not clad, plated or coated
1.033.546,7 894.074,3 732.019,5 516.527,7 469.560,9 -19,16 #N/A #N/A -
JEPANG/JAPAN 417.850,8 353.443,2 262.394,8 191.276,6 174.680,1 -21,01 113.631,0 183.447,7 61,44
KOREA SELATAN/SOUTH OF KOREA 241.992,7 233.801,5 232.931,4 158.134,7 151.687,0 -12,41 92.316,1 140.254,4 51,93
TAIWAN/TAIWAN, PROVINCE OF CHINA 148.205,2 99.190,9 84.196,7 56.295,9 44.135,8 -25,84 25.025,3 36.728,6 46,77
INDIA/INDIA 144,0 22.567,3 17.219,5 25.637,3 41.562,0 214,48 21.438,0 40.676,2 89,74
MALAYSIA/MALAYSIA 28.203,9 41.316,5 54.416,2 32.915,3 28.722,1 -1,89 17.561,9 21.540,1 22,65
NEGARA LAINNYA/OTHER COUNTRIES 197.150,0 143.754,9 80.860,8 52.267,8 28.773,9 -38,50 #N/A #N/A -
7210 Iron or non-alloy steel; flat-rolled products, width 600mm or more, clad, plated or coated 915.859,6 988.693,7 885.349,2 729.850,9 728.839,7 -7,32 #N/A #N/A -
JEPANG/JAPAN 263.335,6 257.446,3 254.790,0 206.009,3 204.116,0 -7,06 130.516,0 167.303,3 28,19
R.R. TIONGKOK/CHINA 123.141,3 137.822,4 129.885,4 176.782,1 189.222,5 11,72 127.100,7 100.961,5 -20,57
VIETNAM/VIET NAM 166.473,5 234.879,8 253.876,7 142.288,4 136.180,0 -8,63 85.018,7 118.077,8 38,88
KOREA SELATAN/SOUTH OF KOREA 191.777,9 189.632,1 139.991,3 136.818,1 131.920,4 -10,19 80.595,1 123.445,9 53,17
MALAYSIA/MALAYSIA 17.051,6 16.303,6 19.064,0 17.700,9 24.888,1 8,75 15.669,8 13.676,9 -12,72
NEGARA LAINNYA/OTHER COUNTRIES 154.079,8 152.609,4 87.741,9 50.252,1 42.512,7 -30,83 #N/A #N/A -
143

Lanjutan/Continued
Nilai/Value : Ribu/Thousand US$
Perub. (%)
Change (% )
17-162016 2017
2012 2013 2014
TABEL 20 : NILAI IMPOR 190 JENIS BARANG MENURUT NEGARA ASAL UTAMA
IMPORT VALUE OF 190 COMMODITIES BY MAIN COUNTRY OF ORIGIN
KODE
CODE
HS
2016 Trend (%)
'12-16
Jan-Ags/Jan-AugJENIS BARANG DESCRIPTION OF
GOODS2015
No. 08.05.148
7212 Iron or non-alloy steel; flat-rolled products, width less than 600mm, clad, plated or coated 77.536,5 71.890,3 118.620,2 211.840,2 209.736,6 35,95 #N/A #N/A -
VIETNAM/VIET NAM 3.148,2 850,5 61.764,6 169.170,0 163.112,5 273,89 100.523,2 174.784,2 73,87
KOREA SELATAN/SOUTH OF KOREA 41.530,8 33.723,9 31.306,3 17.909,4 25.014,8 -15,18 17.414,0 19.086,5 9,60
R.R. TIONGKOK/CHINA 11.694,4 10.272,2 8.015,5 12.162,3 11.240,2 0,90 7.152,5 13.956,3 95,12
JEPANG/JAPAN 13.801,9 11.601,1 8.776,7 6.811,2 7.075,6 -17,05 4.773,5 6.690,7 40,16
TAIWAN/TAIWAN, PROVINCE OF CHINA 1.194,8 1.718,0 715,3 965,4 660,4 -16,16 508,8 404,0 -20,60
NEGARA LAINNYA/OTHER COUNTRIES 6.166,5 13.724,6 8.041,8 4.821,8 2.633,2 -24,03 #N/A #N/A -
7219 Stainless steel; flat-rolled products of width of 600mm or more 410.031,3 400.968,1 420.874,9 343.480,9 315.556,5 -6,56 #N/A #N/A -
INDIA/INDIA 121.472,4 97.825,6 81.425,4 64.773,9 97.690,0 -8,13 62.738,6 98.247,2 56,60
R.R. TIONGKOK/CHINA 68.547,2 74.368,9 115.503,7 113.915,2 66.707,2 3,79 37.598,0 71.394,2 89,89
JEPANG/JAPAN 68.685,4 65.876,9 73.732,9 64.641,4 63.773,5 -1,66 43.278,1 59.332,3 37,10
MALAYSIA/MALAYSIA 21.022,4 28.997,0 24.660,8 24.305,4 29.068,0 4,83 15.324,8 33.434,8 118,18
KOREA SELATAN/SOUTH OF KOREA 32.097,7 40.499,4 48.444,4 26.090,9 20.931,1 -12,14 16.418,0 15.481,1 -5,71
NEGARA LAINNYA/OTHER COUNTRIES 98.206,2 93.400,4 77.107,6 49.754,2 37.386,7 -22,60 #N/A #N/A -
7225 Alloy steel flat-rolled products, of a width 600mm or more 355.203,2 346.049,7 341.626,4 405.157,7 510.347,6 9,23 #N/A #N/A -
JEPANG/JAPAN 185.981,8 164.552,6 177.176,8 166.153,8 206.617,7 2,23 125.622,1 245.151,2 95,15
R.R. TIONGKOK/CHINA 52.530,5 83.544,9 56.529,3 78.354,3 123.466,6 17,88 73.659,2 345.946,8 369,66
KOREA SELATAN/SOUTH OF KOREA 17.441,4 21.836,6 44.266,9 70.525,9 69.422,1 48,22 43.151,8 67.958,0 57,49
TAIWAN/TAIWAN, PROVINCE OF CHINA 35.110,5 31.847,1 33.990,1 37.416,0 36.948,2 2,67 23.362,7 49.358,1 111,27
VIETNAM/VIET NAM 5,0 955,0 1.152,1 16.051,0 22.803,7 613,89 16.703,6 22.081,5 32,20
NEGARA LAINNYA/OTHER COUNTRIES 64.133,9 43.313,5 28.511,2 36.656,7 51.089,3 -6,03 #N/A #N/A -
7227 Steel, alloy; bars and rods, hot-rolled, in irregularly wound coils 224.199,6 343.685,3 365.061,0 250.432,8 298.754,7 2,61 #N/A #N/A -
R.R. TIONGKOK/CHINA 197.404,2 321.751,6 328.692,2 223.980,7 266.466,3 2,41 155.626,4 204.908,5 31,67
JEPANG/JAPAN 8.481,9 7.546,1 20.245,4 21.313,5 24.707,7 37,39 16.064,4 21.549,7 34,15
MALAYSIA/MALAYSIA 10.062,3 8.368,4 11.274,4 2.728,2 3.049,2 -29,59 1.502,6 7.155,9 376,23
KOREA SELATAN/SOUTH OF KOREA 2.056,5 2.197,4 1.776,5 1.235,4 2.018,3 -5,95 1.290,0 1.560,0 20,93
TAIWAN/TAIWAN, PROVINCE OF CHINA 1.829,8 1.664,2 1.897,8 894,4 1.770,5 -6,64 1.177,9 1.162,6 -1,30
NEGARA LAINNYA/OTHER COUNTRIES 4.365,0 2.157,5 1.174,8 280,5 742,6 -42,78 #N/A #N/A -
7228 Alloy steel bars, rods, shapes and sections; hollow drill bars and rods, of alloy or non-alloy steel 607.159,2 603.861,7 470.300,1 289.793,3 288.776,5 -19,91 #N/A #N/A -
JEPANG/JAPAN 144.919,8 133.230,6 124.621,4 106.591,0 115.365,5 -6,57 73.217,8 104.909,0 43,28
R.R. TIONGKOK/CHINA 329.767,6 357.162,4 249.706,2 103.775,1 93.057,1 -31,38 63.252,7 104.292,1 64,88
KOREA SELATAN/SOUTH OF KOREA 43.371,6 38.141,5 37.206,4 30.589,5 45.117,8 -1,41 19.358,0 30.134,0 55,67
AUSTRALIA/AUSTRALIA 18.114,4 7.656,7 2.247,8 8.026,3 9.564,5 -11,57 5.445,5 5.506,3 1,12
THAILAND/THAILAND 4.697,6 5.497,1 6.151,7 5.662,1 6.228,1 6,12 4.513,4 5.028,9 11,42
NEGARA LAINNYA/OTHER COUNTRIES 66.288,1 62.173,4 50.366,7 35.149,3 19.443,5 -26,09 #N/A #N/A -
144

Lanjutan/Continued
Nilai/Value : Ribu/Thousand US$
Perub. (%)
Change (% )
17-162016 2017
2012 2013 2014
TABEL 20 : NILAI IMPOR 190 JENIS BARANG MENURUT NEGARA ASAL UTAMA
IMPORT VALUE OF 190 COMMODITIES BY MAIN COUNTRY OF ORIGIN
KODE
CODE
HS
2016 Trend (%)
'12-16
Jan-Ags/Jan-AugJENIS BARANG DESCRIPTION OF
GOODS2015
No. 08.05.148
7304 Tubes, pipes and hollow profiles, seamless, of iron (other than cast iron) or steel 1.354.770,1 1.180.630,0 995.222,8 694.715,5 464.180,3 -23,45 #N/A #N/A -
R.R. TIONGKOK/CHINA 441.955,9 373.323,9 301.339,3 213.999,0 132.100,0 -25,71 90.786,3 102.182,0 12,55
JEPANG/JAPAN 340.656,7 249.104,6 212.480,9 189.320,9 126.695,1 -20,17 84.160,0 149.322,7 77,43
AUSTRALIA/AUSTRALIA 9.629,7 5.776,9 2.063,4 5.286,0 58.039,7 41,96 57.652,0 533,9 -99,07
SINGAPURA/SINGAPORE 107.518,1 104.144,8 82.706,3 50.421,7 27.895,1 -28,99 23.192,1 24.561,7 5,91
KOREA SELATAN/SOUTH OF KOREA 39.287,2 53.934,1 38.659,8 22.940,4 24.726,0 -16,31 16.541,4 18.991,5 14,81
NEGARA LAINNYA/OTHER COUNTRIES 415.722,4 394.345,7 357.973,1 212.747,6 94.724,4 -30,06 #N/A #N/A -
7307 Tube or pipe fittings (e.g. couplings, elbows, sleeves), of iron or steel 356.531,9 356.350,7 320.572,6 263.205,6 219.209,6 -11,98 #N/A #N/A -
SINGAPURA/SINGAPORE 84.897,9 83.545,7 75.701,2 60.287,4 48.186,3 -13,58 33.702,4 16.841,6 -50,03
R.R. TIONGKOK/CHINA 63.281,3 50.818,6 49.310,0 47.780,0 43.175,6 -7,93 29.693,7 21.810,2 -26,55
KOREA SELATAN/SOUTH OF KOREA 32.197,8 55.493,6 56.555,3 25.995,0 26.339,4 -10,95 18.965,6 7.708,2 -59,36
JEPANG/JAPAN 42.889,2 45.146,2 30.577,6 23.456,9 23.525,7 -16,94 15.405,4 21.747,8 41,17
AMERIKA SERIKAT/UNITED STATES 23.710,5 20.527,9 18.125,5 25.137,4 14.556,7 -7,44 9.162,8 5.910,0 -35,50
NEGARA LAINNYA/OTHER COUNTRIES 109.555,1 100.818,8 90.303,1 80.548,8 63.426,0 -12,34 #N/A #N/A -
7308 Structures of iron or steel and parts thereof; plates, rods, angles, shapes, sections, tubes
and the like, prepared for use in structures
386.536,6 371.064,0 477.694,8 516.367,1 283.348,5 -2,86 #N/A #N/A -
R.R. TIONGKOK/CHINA 204.357,8 187.478,5 333.107,2 240.303,5 152.550,1 -3,31 101.800,5 91.264,2 -10,35
PILIPINA/PHILIPPINES - 97,1 70,1 5.998,5 25.772,6 - 25.772,6 3,6 -99,99
SINGAPURA/SINGAPORE 23.499,5 37.562,2 25.335,7 166.867,8 24.353,1 16,91 20.752,4 5.078,0 -75,53
MALAYSIA/MALAYSIA 32.777,9 28.436,7 30.346,1 15.073,5 14.955,7 -19,78 10.838,2 10.027,6 -7,48
AUSTRALIA/AUSTRALIA 16.855,3 14.524,0 11.642,1 12.432,3 14.161,1 -4,91 10.205,3 6.998,2 -31,43
NEGARA LAINNYA/OTHER COUNTRIES 109.046,1 102.965,5 77.193,6 75.691,6 51.555,9 -16,52 #N/A #N/A -
7318 Screws, bolts, nuts, coach screws, screw hooks, rivets, cotters, cotter-pins, washers
(including spring washers) and similar articles, of iron or steel
660.388,8 670.638,7 677.424,0 546.907,1 627.905,8 -3,00 #N/A #N/A -
JEPANG/JAPAN 322.784,1 297.085,2 278.115,5 226.834,1 255.942,8 -7,08 164.740,9 231.970,8 40,81
SINGAPURA/SINGAPORE 79.713,6 88.252,1 100.854,7 79.095,6 103.457,5 4,21 59.737,8 58.177,2 -2,61
R.R. TIONGKOK/CHINA 54.566,7 65.076,6 70.077,3 65.831,9 76.502,0 7,11 49.669,0 39.570,7 -20,33
THAILAND/THAILAND 45.978,6 56.830,6 42.228,6 32.639,1 38.424,1 -8,73 25.102,5 35.726,6 42,32
AUSTRALIA/AUSTRALIA 26.413,3 31.875,0 47.594,8 31.404,8 33.507,4 4,72 22.326,6 18.254,4 -18,24
NEGARA LAINNYA/OTHER COUNTRIES 130.932,5 131.519,2 138.553,1 111.101,5 120.071,9 -3,36 #N/A #N/A -
7326 Iron or steel; articles, n.e.c. in chapter 73 389.952,5 454.736,0 528.442,6 409.283,1 290.283,8 -6,72 #N/A #N/A -
SINGAPURA/SINGAPORE 39.246,3 45.537,4 150.858,0 109.242,2 79.047,1 25,55 53.402,1 65.288,8 22,26
R.R. TIONGKOK/CHINA 65.167,6 90.865,4 97.202,9 83.829,6 61.409,2 -1,97 40.960,6 34.845,6 -14,93
JEPANG/JAPAN 110.171,0 105.541,4 111.211,8 54.297,4 36.303,3 -25,06 24.336,0 23.372,5 -3,96
AUSTRALIA/AUSTRALIA 34.767,4 29.281,8 27.669,7 18.114,8 30.818,9 -6,96 19.721,7 20.677,1 4,84
THAILAND/THAILAND 16.007,3 24.429,4 23.362,6 14.277,9 15.450,4 -5,90 10.038,2 5.563,8 -44,57
NEGARA LAINNYA/OTHER COUNTRIES 124.592,9 159.080,6 118.137,6 129.521,3 67.254,9 -13,40 #N/A #N/A -
145

Lanjutan/Continued
Nilai/Value : Ribu/Thousand US$
Perub. (%)
Change (% )
17-162016 2017
2012 2013 2014
TABEL 20 : NILAI IMPOR 190 JENIS BARANG MENURUT NEGARA ASAL UTAMA
IMPORT VALUE OF 190 COMMODITIES BY MAIN COUNTRY OF ORIGIN
KODE
CODE
HS
2016 Trend (%)
'12-16
Jan-Ags/Jan-AugJENIS BARANG DESCRIPTION OF
GOODS2015
No. 08.05.148
7403 Copper; refined and copper alloys, unwrought 811.934,6 728.442,1 829.980,6 776.954,9 656.944,5 33,77 #N/A #N/A -
JEPANG/JAPAN 399.325,0 392.035,0 354.308,7 221.067,7 186.044,2 171,01 133.960,4 158.167,2 18,07
PILIPINA/PHILIPPINES 9.381,3 41.557,1 3.633,6 45.925,2 135.875,5 26,11 83.201,9 103.877,6 24,85
R.R. TIONGKOK/CHINA 6.762,2 30.971,8 91.356,0 29.636,0 80.984,6 106,60 53.427,9 168.928,6 216,18
MYANMAR/MYANMAR (FORM. BURMA) 4.073,6 12.884,5 47.823,3 113.697,2 54.215,5 - 29.023,8 41.697,7 43,67
AUSTRALIA/AUSTRALIA 252.842,2 70.925,4 112.060,7 118.570,3 49.496,9 9,99 40.126,3 33.645,4 -16,15
NEGARA LAINNYA/OTHER COUNTRIES 139.550,2 180.068,3 220.798,3 248.058,6 150.327,9 0,35 #N/A #N/A -
7601 Aluminium; unwrought 997.554,3 860.281,8 573.015,5 566.331,0 553.435,8 -14,75 #N/A #N/A -
AUSTRALIA/AUSTRALIA 268.730,8 244.699,7 129.416,9 100.503,8 98.153,6 -25,20 54.537,0 106.546,6 95,37
PERSERIKATAN EMIRAT ARAB/UNITED ARAB EMIRATES 96.345,3 102.064,9 112.443,6 81.117,7 96.562,6 -2,23 59.324,6 92.916,9 56,62
MALAYSIA/MALAYSIA 60.642,7 75.687,2 47.933,5 61.320,7 63.190,9 -1,27 43.244,3 56.548,0 30,76
FEDERASI RUSIA/RUSSIA FEDERATION 24.013,1 23.965,6 34.518,5 42.761,5 61.911,6 28,06 42.052,9 66.545,4 58,24
QATAR/QATAR 69.491,5 79.898,9 101.752,3 64.477,3 39.650,5 -12,51 25.718,2 33.711,9 31,08
NEGARA LAINNYA/OTHER COUNTRIES 478.330,9 333.965,5 146.950,7 216.150,0 193.966,5 -20,07 #N/A #N/A -
7606 Aluminium; plates, sheets and strip, thickness exceeding 0.2mm 402.263,8 403.467,5 502.328,4 341.736,4 308.072,3 -6,76 #N/A #N/A -
R.R. TIONGKOK/CHINA 157.546,9 172.846,7 290.052,1 191.835,2 156.065,1 0,86 113.364,3 225.142,9 98,60
KOREA SELATAN/SOUTH OF KOREA 107.042,9 97.512,9 73.071,2 55.786,6 68.080,1 -13,61 42.472,0 43.053,2 1,37
THAILAND/THAILAND 6.336,5 6.761,3 8.158,8 12.063,8 19.909,3 33,23 12.306,5 20.495,6 66,54
JEPANG/JAPAN 36.946,6 33.612,9 15.318,0 11.283,9 15.531,1 -24,61 10.134,6 13.981,9 37,96
AMERIKA SERIKAT/UNITED STATES 9.410,2 8.993,2 13.919,7 13.335,6 13.048,1 11,05 10.369,2 3.770,7 -63,64
NEGARA LAINNYA/OTHER COUNTRIES 84.980,7 83.740,6 101.808,5 57.431,3 35.438,6 -19,16 #N/A #N/A -
7607 Aluminium foil (whether or not printed or backed with paper, paperboard, plastics or similar
backing materials) of a thickness (excluding any backing) not exceeding 0.2mm thickness
not exceeding 0.2mm
109.103,3 129.729,8 165.036,6 153.651,6 174.850,8 11,77 #N/A #N/A -
R.R. TIONGKOK/CHINA 53.747,3 73.361,5 98.492,5 98.107,3 111.140,1 19,05 75.154,3 117.715,1 56,63
JEPANG/JAPAN 23.235,3 24.789,3 30.885,9 28.189,5 28.858,2 5,78 18.749,9 26.875,9 43,34
KOREA SELATAN/SOUTH OF KOREA 12.982,6 12.490,1 14.127,4 10.938,5 10.899,3 -4,71 6.496,9 15.324,9 135,88
MALAYSIA/MALAYSIA 5.018,2 5.679,8 6.298,1 4.746,3 6.924,9 4,75 4.528,9 5.537,2 22,26
BELANDA/NETHERLANDS 1.779,9 2.088,9 1.304,4 1.151,7 6.010,7 20,19 3.822,0 7.342,3 92,11
NEGARA LAINNYA/OTHER COUNTRIES 12.340,0 11.320,3 13.928,2 10.518,3 11.017,6 -2,96 #N/A #N/A -
7901 Zinc; unwrought 283.372,7 282.420,5 307.056,6 263.747,2 285.604,5 -0,53 #N/A #N/A -
KOREA SELATAN/SOUTH OF KOREA 110.192,5 105.345,3 105.784,1 88.496,9 92.400,4 -5,13 53.386,9 107.811,5 101,94
AUSTRALIA/AUSTRALIA 36.084,1 64.039,0 62.502,5 50.998,4 59.578,6 8,06 36.193,1 87.388,8 141,45
INDIA/INDIA 38.295,9 25.323,2 30.449,4 27.547,8 34.025,5 -1,51 22.438,9 43.423,3 93,52
JEPANG/JAPAN 49.724,3 46.135,9 31.625,6 37.708,9 28.073,3 -12,59 16.944,7 38.580,6 127,69
SPANYOL/SPAIN - - 1.363,6 8.762,0 19.281,8 - 9.989,4 15.915,5 59,32
NEGARA LAINNYA/OTHER COUNTRIES 49.076,0 41.577,2 75.331,4 50.233,3 52.244,9 3,19 #N/A #N/A -
146

Lanjutan/Continued
Nilai/Value : Ribu/Thousand US$
Perub. (%)
Change (% )
17-162016 2017
2012 2013 2014
TABEL 20 : NILAI IMPOR 190 JENIS BARANG MENURUT NEGARA ASAL UTAMA
IMPORT VALUE OF 190 COMMODITIES BY MAIN COUNTRY OF ORIGIN
KODE
CODE
HS
2016 Trend (%)
'12-16
Jan-Ags/Jan-AugJENIS BARANG DESCRIPTION OF
GOODS2015
No. 08.05.148
8207 Tools, interchangeable; for hand tools, whether or not power-operated, or for machine tools
(pressing, stamping, punching, drilling etc), including dies for drawing or extruding
338.867,7 241.770,7 195.594,4 225.712,2 207.925,7 -9,93 #N/A #N/A -
JEPANG/JAPAN 146.809,0 89.200,4 68.003,2 116.602,2 89.372,3 -6,99 62.894,3 113.112,8 79,85
R.R. TIONGKOK/CHINA 33.930,5 36.182,9 18.213,0 22.282,3 31.844,4 -5,93 16.168,7 38.429,3 137,68
SINGAPURA/SINGAPORE 27.813,0 31.613,8 25.221,9 13.087,9 18.059,5 -16,02 11.039,4 16.404,8 48,60
THAILAND/THAILAND 18.411,2 8.741,8 5.592,3 20.145,4 12.444,5 0,52 7.530,4 14.625,4 94,22
SWEDIA/SWEDEN 1.710,1 2.472,4 6.563,2 8.516,8 11.372,2 65,30 7.821,6 6.032,9 -22,87
NEGARA LAINNYA/OTHER COUNTRIES 110.193,9 73.559,6 72.000,7 45.077,6 44.832,8 -20,45 #N/A #N/A -
8302 Base metal mountings, fittings and similar articles for furniture, doors, staircases, windows,
trunks, chests etc, castors with mountings of base metal, automatic door closers of base
metal trunks, ch
183.549,1 187.189,3 174.878,0 161.290,4 162.981,2 -3,79 #N/A #N/A -
R.R. TIONGKOK/CHINA 91.257,1 86.455,7 88.243,3 90.743,2 98.434,3 2,02 60.730,6 100.849,6 66,06
JEPANG/JAPAN 17.212,8 26.697,6 30.530,5 23.620,9 23.260,4 4,91 15.010,1 21.117,7 40,69
THAILAND/THAILAND 40.680,7 33.283,4 26.093,6 18.578,1 8.010,2 -31,84 5.209,1 6.438,1 23,59
SINGAPURA/SINGAPORE 4.888,2 6.887,5 6.450,3 6.035,6 7.608,7 7,82 4.939,6 7.437,5 50,57
TAIWAN/TAIWAN, PROVINCE OF CHINA 4.259,5 10.321,4 3.562,4 3.842,3 4.811,4 -7,17 3.122,9 5.294,5 69,54
NEGARA LAINNYA/OTHER COUNTRIES 25.250,8 23.543,6 19.997,9 18.470,3 20.856,3 -6,06 #N/A #N/A -
8402 Boilers; steam or other vapour generating (other than central heating hot water boilers,
capable also of producing low pressure steam), super heated water boilers
409.740,3 379.256,0 518.968,9 366.580,2 230.602,7 -11,16 #N/A #N/A -
R.R. TIONGKOK/CHINA 267.226,3 208.399,7 217.838,4 202.586,4 149.650,2 -11,20 88.745,3 88.868,4 0,14
MALAYSIA/MALAYSIA 41.488,2 59.526,8 61.085,3 48.870,5 32.003,0 -6,91 25.719,2 19.398,7 -24,58
INDIA/INDIA 9.404,9 12.851,2 55.406,4 18.531,6 31.570,9 32,15 25.710,6 8.677,1 -66,25
JERMAN/GERMANY 12.937,5 18.347,8 20.343,2 8.815,4 3.513,5 -28,39 2.841,5 2.939,2 3,44
JEPANG/JAPAN 23.326,6 2.918,5 26.159,3 11.275,4 3.338,3 -22,41 1.634,5 27.904,2 1.607,21
NEGARA LAINNYA/OTHER COUNTRIES 55.356,8 77.211,9 138.136,4 76.500,9 10.526,7 -28,32 #N/A #N/A -
8406 Turbines; steam and other vapour turbines 439.706,6 366.283,2 340.259,7 465.431,1 641.491,5 10,46 #N/A #N/A -
AMERIKA SERIKAT/UNITED STATES 10.482,0 16.591,2 6.383,4 81.417,1 320.677,7 132,39 229.180,6 12.914,8 -94,36
R.R. TIONGKOK/CHINA 256.513,4 224.222,8 234.085,5 237.100,6 134.382,9 -11,64 77.106,3 74.119,8 -3,87
JEPANG/JAPAN 106.786,9 64.357,8 75.158,9 76.095,2 115.792,7 3,35 112.199,6 46.594,8 -58,47
ISRAEL/ISRAEL - - - 12.272,1 18.648,4 - 18.648,4 18.066,5 -3,12
INDIA/INDIA 8.884,2 15.808,5 5.184,1 7.911,9 12.399,1 -0,25 11.050,5 7.193,4 -34,90
NEGARA LAINNYA/OTHER COUNTRIES 57.040,1 45.302,8 19.447,6 50.634,2 39.590,8 -6,00 #N/A #N/A -
8407 Reciprocating or rotary internal combustion piston engines 265.367,4 264.668,0 279.214,6 287.184,1 158.157,1 -9,09 #N/A #N/A -
JEPANG/JAPAN 61.244,0 66.356,0 87.477,5 102.441,6 60.473,8 4,17 45.630,2 47.374,9 3,82
THAILAND/THAILAND 103.042,8 73.613,7 77.763,8 56.633,5 44.653,8 -17,59 33.181,4 18.163,2 -45,26
R.R. TIONGKOK/CHINA 30.007,7 30.708,8 27.269,4 29.125,6 30.532,8 -0,18 22.540,0 38.059,0 68,85
MALAYSIA/MALAYSIA 7.247,8 5.751,5 12.255,6 4.562,9 7.223,3 -2,35 5.880,2 4.190,3 -28,74
JERMAN/GERMANY 20.748,0 24.358,2 10.303,9 10.461,1 5.016,0 -30,82 2.617,4 4.208,8 60,80
NEGARA LAINNYA/OTHER COUNTRIES 43.077,1 63.879,8 64.144,4 83.959,4 10.257,4 -22,87 #N/A #N/A -
147

Lanjutan/Continued
Nilai/Value : Ribu/Thousand US$
Perub. (%)
Change (% )
17-162016 2017
2012 2013 2014
TABEL 20 : NILAI IMPOR 190 JENIS BARANG MENURUT NEGARA ASAL UTAMA
IMPORT VALUE OF 190 COMMODITIES BY MAIN COUNTRY OF ORIGIN
KODE
CODE
HS
2016 Trend (%)
'12-16
Jan-Ags/Jan-AugJENIS BARANG DESCRIPTION OF
GOODS2015
No. 08.05.148
8408 Compression-ignition internal combustion piston engines (diesel or semi-diesel engines) 518.414,4 481.453,8 397.370,8 295.439,1 464.261,2 -6,84 #N/A #N/A -
THAILAND/THAILAND 161.284,8 147.803,1 167.557,7 118.502,5 279.136,2 9,16 191.655,1 286.468,7 49,47
JEPANG/JAPAN 157.007,8 116.486,9 85.366,2 46.475,1 53.665,7 -26,40 27.138,7 97.187,8 258,11
R.R. TIONGKOK/CHINA 45.985,4 52.770,5 33.903,3 35.191,5 45.991,9 -3,97 29.560,7 33.879,8 14,61
JERMAN/GERMANY 20.456,8 8.082,0 3.819,3 6.047,5 25.912,5 1,85 11.167,7 23.879,9 113,83
SINGAPURA/SINGAPORE 39.051,9 61.448,5 38.258,2 36.548,2 18.067,3 -18,63 9.254,6 20.686,1 123,52
NEGARA LAINNYA/OTHER COUNTRIES 94.627,6 94.862,9 68.466,2 52.674,3 41.487,5 -20,05 #N/A #N/A -
8409 Parts suitable for use solely or principally with the engines of heading no. 8407 or 8408 1.316.143,8 1.132.455,9 955.508,2 630.466,6 561.906,6 -20,45 #N/A #N/A -
JEPANG/JAPAN 775.204,8 674.421,8 566.336,2 321.272,3 274.311,3 -24,57 180.216,0 275.533,0 52,89
THAILAND/THAILAND 274.505,7 224.465,9 165.040,1 122.550,8 108.187,2 -21,87 72.190,5 102.617,0 42,15
R.R. TIONGKOK/CHINA 62.967,0 58.546,4 63.041,0 48.688,1 49.058,6 -6,61 32.097,5 60.669,3 89,02
INDIA/INDIA 23.397,4 16.656,7 23.253,7 16.303,6 22.834,3 -0,70 15.316,0 20.883,0 36,35
AMERIKA SERIKAT/UNITED STATES 24.967,0 27.642,2 28.651,3 21.823,2 20.282,9 -6,31 12.860,1 22.676,0 76,33
NEGARA LAINNYA/OTHER COUNTRIES 155.102,0 130.722,9 109.186,0 99.828,7 87.232,3 -13,24 #N/A #N/A -
8411 Turbo-jets, turbo-propellers and other gas turbines 729.217,8 721.455,4 347.435,3 411.013,5 377.890,0 -17,12 #N/A #N/A -
AMERIKA SERIKAT/UNITED STATES 286.222,5 215.418,5 89.738,1 137.856,8 143.726,1 -16,67 55.251,6 41.762,0 -24,41
SWISS/SWITZERLAND 56.277,7 103.442,2 49.640,3 41.061,0 87.776,4 -0,35 82.258,1 9.918,3 -87,94
JEPANG/JAPAN 116.447,1 206.604,7 34.389,7 80.313,5 52.967,0 -22,28 33.752,2 22.747,5 -32,60
ITALIA/ITALY 17.882,1 10.933,2 7.695,4 14.702,6 29.521,3 13,87 25.296,7 44.323,9 75,22
R.R. TIONGKOK/CHINA 4.581,0 13.414,8 16.166,1 11.681,5 18.472,4 30,35 6.368,8 12.435,5 95,26
NEGARA LAINNYA/OTHER COUNTRIES 247.807,3 171.642,0 149.805,8 125.398,1 45.426,7 -30,98 #N/A #N/A -
8413 Pumps; for liquids, whether or not fitted with measuring device, liquid elevators 1.102.936,8 1.014.914,2 982.271,6 805.636,7 789.684,8 -8,60 #N/A #N/A -
R.R. TIONGKOK/CHINA 350.874,9 305.513,3 233.936,1 174.613,3 202.140,7 -15,32 137.056,1 169.641,5 23,78
JEPANG/JAPAN 275.447,7 221.208,8 259.418,8 211.607,0 185.850,7 -7,98 120.569,0 171.224,0 42,01
AMERIKA SERIKAT/UNITED STATES 114.864,1 111.624,5 123.377,1 99.040,0 83.278,9 -7,34 55.773,4 77.379,4 38,74
THAILAND/THAILAND 49.605,6 63.244,1 69.402,5 66.244,3 70.605,0 7,81 47.175,3 55.086,4 16,77
SINGAPURA/SINGAPORE 52.891,7 54.898,8 72.110,6 57.012,6 52.576,4 0,26 38.021,7 32.470,4 -14,60
NEGARA LAINNYA/OTHER COUNTRIES 259.252,9 258.424,7 224.026,4 197.119,5 195.233,0 -8,04 #N/A #N/A -
8414 Air or vacuum pumps, air or other gas compressors and fans; ventilating or recycling hoods
incorporating a fan whether or not fitted with filters
785.377,5 1.027.381,1 933.827,8 824.632,2 766.832,1 -2,64 #N/A #N/A -
R.R. TIONGKOK/CHINA 182.779,5 239.964,0 245.055,2 288.842,1 270.246,0 10,16 172.549,8 235.380,0 36,41
JEPANG/JAPAN 153.828,9 164.455,7 144.696,9 94.884,7 132.912,6 -8,08 94.836,9 89.586,1 -5,54
AMERIKA SERIKAT/UNITED STATES 79.301,4 89.479,7 118.858,3 111.998,4 95.256,9 6,09 78.764,9 32.750,2 -58,42
SINGAPURA/SINGAPORE 88.606,9 142.324,1 85.321,2 107.561,3 90.018,8 -2,45 66.919,1 38.289,4 -42,78
JERMAN/GERMANY 54.066,4 64.314,6 55.395,9 32.840,7 30.249,8 -16,75 20.323,0 30.221,9 48,71
NEGARA LAINNYA/OTHER COUNTRIES 226.794,4 326.843,0 284.500,3 188.504,9 148.148,0 -13,08 #N/A #N/A -
148

Lanjutan/Continued
Nilai/Value : Ribu/Thousand US$
Perub. (%)
Change (% )
17-162016 2017
2012 2013 2014
TABEL 20 : NILAI IMPOR 190 JENIS BARANG MENURUT NEGARA ASAL UTAMA
IMPORT VALUE OF 190 COMMODITIES BY MAIN COUNTRY OF ORIGIN
KODE
CODE
HS
2016 Trend (%)
'12-16
Jan-Ags/Jan-AugJENIS BARANG DESCRIPTION OF
GOODS2015
No. 08.05.148
8415 Air conditioning machines; comprising a motor driven fan and elements for changing the
temperature and humidity, including those machines in which the humidity cannot be
separately or split-system
644.906,4 677.198,9 573.248,1 458.361,5 545.829,2 -6,98 #N/A #N/A -
THAILAND/THAILAND 379.155,1 407.711,3 302.224,1 240.689,4 265.922,3 -11,63 178.272,1 166.226,5 -6,76
R.R. TIONGKOK/CHINA 101.712,0 125.306,1 136.955,7 115.506,6 145.740,2 6,59 109.768,2 111.260,4 1,36
MALAYSIA/MALAYSIA 84.812,6 73.769,4 66.278,2 57.425,8 77.870,0 -4,13 51.671,3 55.495,9 7,40
JEPANG/JAPAN 31.905,9 26.723,9 22.645,6 17.169,9 16.412,0 -16,24 10.711,9 14.833,0 38,47
KOREA SELATAN/SOUTH OF KOREA 12.755,8 15.327,9 11.199,4 6.886,6 10.106,7 -11,89 6.552,2 6.289,4 -4,01
NEGARA LAINNYA/OTHER COUNTRIES 34.565,1 28.360,3 33.945,1 20.683,3 29.778,1 -5,95 #N/A #N/A -
8417 Furnaces and ovens; industrial or laboratory, including incinerators, non-electric 146.268,4 167.722,7 364.795,7 428.918,9 260.274,3 23,26 #N/A #N/A -
R.R. TIONGKOK/CHINA 51.834,6 60.390,2 237.827,1 361.164,5 205.838,3 57,56 162.490,7 145.828,4 -10,25
ITALIA/ITALY 11.699,2 14.873,5 20.973,2 7.440,5 18.502,8 2,27 2.112,5 4.747,2 124,72
JEPANG/JAPAN 28.161,9 42.469,3 40.034,6 17.846,7 9.544,3 -26,15 6.259,5 6.292,1 0,52
JERMAN/GERMANY 12.340,5 5.221,9 17.609,6 3.961,4 6.254,3 -15,09 3.511,5 8.598,3 144,86
DENMARK/DENMARK 148,7 1.116,4 195,2 4.667,4 4.412,3 127,30 4.370,7 13,6 -99,69
NEGARA LAINNYA/OTHER COUNTRIES 42.083,5 43.651,4 48.156,0 33.838,3 15.722,4 -19,94 #N/A #N/A -
8418 Refrigerators, freezers and other refrigerating or freezing equipment, electric or other; heat
pumps other than air conditioning machines of heading no. 8415
317.284,9 364.969,9 338.504,3 283.767,9 334.319,0 -1,46 #N/A #N/A -
R.R. TIONGKOK/CHINA 161.012,9 170.931,2 163.298,5 145.207,7 178.202,1 0,40 102.498,6 141.967,8 38,51
THAILAND/THAILAND 63.840,4 90.703,3 74.704,9 66.056,1 78.197,6 0,89 51.388,4 47.647,2 -7,28
MALAYSIA/MALAYSIA 13.662,1 11.294,0 10.090,0 9.771,6 18.830,5 5,09 13.650,1 9.393,7 -31,18
KOREA SELATAN/SOUTH OF KOREA 23.185,3 26.621,2 21.738,9 20.453,9 9.582,7 -18,38 6.000,5 8.699,8 44,98
LUKSEMBURG/LUXEMBOURG 1.065,7 2.344,0 471,4 4.252,9 8.419,6 60,47 5.848,2 6.288,6 7,53
NEGARA LAINNYA/OTHER COUNTRIES 54.518,5 63.076,3 68.200,6 38.025,7 41.086,6 -10,16 #N/A #N/A -
8419 Machinery, plant (not domestic), or laboratory equipment; electrically heated or not,
(excluding items in 85.14) for the treatment of materials by a process involving change of
694.542,5 814.069,3 662.014,0 786.807,0 670.917,0 -1,03 #N/A #N/A -
R.R. TIONGKOK/CHINA 143.549,5 212.229,8 178.249,0 200.440,3 154.758,6 0,94 78.835,8 107.774,6 36,71
MALAYSIA/MALAYSIA 66.205,0 42.204,4 78.050,1 56.058,5 73.627,2 5,09 57.733,8 45.473,0 -21,24
JEPANG/JAPAN 67.179,0 53.527,0 58.064,7 27.089,2 71.652,6 -5,37 28.427,2 34.541,8 21,51
JERMAN/GERMANY 66.444,3 54.761,4 69.229,2 67.839,8 55.192,7 -1,56 34.578,9 33.712,0 -2,51
ISRAEL/ISRAEL 0,0 - - 28.425,3 52.472,7 - 32.676,4 41.973,2 28,45
NEGARA LAINNYA/OTHER COUNTRIES 351.164,8 451.346,6 278.421,0 406.953,9 263.213,1 -6,58 #N/A #N/A -
8421 Centrifuges, including centrifugal dryers; filtering or purifying machinery and apparatus for
liquids or gases
653.982,4 722.517,8 692.713,2 727.966,0 763.725,0 3,23 #N/A #N/A -
R.R. TIONGKOK/CHINA 125.609,3 132.234,3 144.357,8 235.136,8 293.838,1 25,55 173.235,2 154.256,6 -10,96
AMERIKA SERIKAT/UNITED STATES 73.325,2 64.352,4 68.484,5 62.735,6 76.831,2 0,68 48.806,7 41.991,0 -13,96
JEPANG/JAPAN 89.112,8 89.436,8 77.365,4 67.909,5 67.450,1 -7,99 45.620,2 53.314,1 16,87
THAILAND/THAILAND 69.404,9 94.469,6 68.768,9 50.566,7 52.595,6 -11,13 36.082,6 54.052,7 49,80
MALAYSIA/MALAYSIA 46.902,2 50.309,1 59.685,0 58.943,6 39.563,5 -1,80 27.397,4 33.373,3 21,81
NEGARA LAINNYA/OTHER COUNTRIES 249.628,0 291.715,6 274.051,6 252.673,8 233.446,6 -2,74 #N/A #N/A -
149

Lanjutan/Continued
Nilai/Value : Ribu/Thousand US$
Perub. (%)
Change (% )
17-162016 2017
2012 2013 2014
TABEL 20 : NILAI IMPOR 190 JENIS BARANG MENURUT NEGARA ASAL UTAMA
IMPORT VALUE OF 190 COMMODITIES BY MAIN COUNTRY OF ORIGIN
KODE
CODE
HS
2016 Trend (%)
'12-16
Jan-Ags/Jan-AugJENIS BARANG DESCRIPTION OF
GOODS2015
No. 08.05.148
8422 Dish washing machines; machinery for cleaning, drying, filling, closing, sealing, capsuling or
labelling bottles, cans, boxes, bags, etc, machinery for aerating beverages
428.589,8 520.693,3 654.592,2 495.193,7 447.384,4 0,36 #N/A #N/A -
JERMAN/GERMANY 128.193,3 177.221,5 217.748,3 147.429,6 116.499,6 -3,68 70.682,0 76.490,5 8,22
ITALIA/ITALY 100.348,1 115.007,5 221.523,4 109.540,4 94.138,3 -1,75 64.828,2 93.889,9 44,83
R.R. TIONGKOK/CHINA 41.413,4 51.752,2 52.135,5 68.741,3 78.770,7 17,00 61.462,6 49.920,0 -18,78
JEPANG/JAPAN 45.505,3 48.126,3 34.100,9 34.995,5 42.042,5 -4,66 27.921,6 38.618,3 38,31
SPANYOL/SPAIN 5.741,0 8.185,9 6.631,6 11.546,5 15.287,3 25,89 3.743,9 11.821,8 215,76
NEGARA LAINNYA/OTHER COUNTRIES 107.388,6 120.399,8 122.452,5 122.940,3 100.646,2 -1,08 #N/A #N/A -
8426 Derricks, cranes, including cable cranes, mobile lifting frames, straddle carriers and works
trucks fitted with a crane
541.338,5 482.473,3 438.603,0 546.941,0 359.227,1 -6,71 #N/A #N/A -
R.R. TIONGKOK/CHINA 179.498,9 180.580,9 220.077,5 310.770,7 151.724,9 2,09 77.773,0 148.784,4 91,31
JEPANG/JAPAN 94.058,3 90.185,5 75.245,2 109.641,6 96.234,8 2,44 54.794,5 29.320,3 -46,49
ITALIA/ITALY 11.815,4 10.157,5 6.846,2 8.294,1 30.333,0 18,33 19.855,5 4.875,0 -75,45
SINGAPURA/SINGAPORE 62.992,4 57.758,2 37.490,3 35.281,8 28.453,4 -18,80 17.742,4 17.170,2 -3,23
JERMAN/GERMANY 94.071,7 44.752,3 14.994,7 21.957,2 19.291,9 -32,16 16.807,7 34.377,2 104,53
NEGARA LAINNYA/OTHER COUNTRIES 98.901,8 99.038,8 83.949,1 60.995,7 33.189,1 -23,42 #N/A #N/A -
8428 Lifting, handling, loading or unloading machinery; n.e.c. in heading no. 8425, 8426 or 8427
(e.g. lifts, escalators, conveyors, teleferics)
355.899,2 494.290,6 569.148,9 560.564,3 477.684,9 7,41 #N/A #N/A -
R.R. TIONGKOK/CHINA 134.715,8 170.915,3 284.799,2 279.147,9 311.035,8 24,16 205.525,0 177.386,7 -13,69
JEPANG/JAPAN 36.121,4 62.239,0 51.660,2 30.630,2 29.212,0 -10,72 21.272,9 15.753,9 -25,94
KOREA SELATAN/SOUTH OF KOREA 24.540,5 45.219,2 35.138,9 56.813,9 21.406,4 -0,45 12.333,8 17.265,5 39,99
JERMAN/GERMANY 51.191,8 52.934,7 68.292,0 50.759,7 18.465,0 -18,79 10.437,6 15.971,0 53,01
THAILAND/THAILAND 9.014,5 18.930,9 25.700,4 16.161,9 17.123,6 11,91 8.952,2 21.131,5 136,05
NEGARA LAINNYA/OTHER COUNTRIES 100.315,2 144.051,5 103.558,1 127.050,7 80.442,0 -5,51 #N/A #N/A -
8429 Bulldozers, graders, levellers, scrapers, angledozers, mechanical shovels, excavators,
shovel loaders, tamping machines and road rollers, self-propelled
2.193.599,3 941.275,0 794.970,6 482.214,5 435.648,3 -32,31 #N/A #N/A -
THAILAND/THAILAND 426.641,1 292.016,7 276.110,9 85.377,2 110.756,2 -32,48 48.749,9 189.257,1 288,22
R.R. TIONGKOK/CHINA 216.119,7 181.065,1 106.693,2 104.497,1 105.273,8 -18,03 58.535,8 206.919,0 253,49
JEPANG/JAPAN 831.977,1 244.982,7 260.008,9 124.701,4 102.778,8 -38,48 49.922,0 289.981,1 480,87
JERMAN/GERMANY 31.949,1 6.720,0 1.878,7 28.426,8 27.338,4 11,97 14.957,6 15.614,5 4,39
KOREA SELATAN/SOUTH OF KOREA 173.942,1 73.733,0 44.034,6 29.945,3 23.903,8 -38,56 12.121,4 76.043,2 527,35
NEGARA LAINNYA/OTHER COUNTRIES 512.970,1 142.757,4 106.244,3 109.266,7 65.597,3 -35,47 #N/A #N/A -
8431 Machinery parts; used solely or principally with the machinery of heading no. 8425 to 8430 1.659.576,9 1.253.624,6 1.087.703,3 901.674,4 896.641,8 -14,45 #N/A #N/A -
MALAYSIA/MALAYSIA 10.069,1 27.629,1 27.098,1 89.059,8 136.217,6 89,27 71.081,0 13.926,4 -80,41
JEPANG/JAPAN 476.610,9 259.618,0 187.054,8 121.803,1 134.601,7 -28,00 80.932,4 149.962,8 85,29
R.R. TIONGKOK/CHINA 201.053,2 180.392,1 170.340,5 134.461,6 126.374,2 -11,51 78.681,1 144.417,4 83,55
AMERIKA SERIKAT/UNITED STATES 248.946,0 225.788,7 182.615,5 165.532,4 107.949,5 -17,98 75.762,0 79.807,9 5,34
SINGAPURA/SINGAPORE 223.051,9 206.788,1 211.796,5 145.112,6 88.644,4 -19,75 66.007,4 68.654,9 4,01
NEGARA LAINNYA/OTHER COUNTRIES 499.845,7 353.408,7 308.798,0 245.704,9 302.854,4 -12,76 #N/A #N/A -
150

Lanjutan/Continued
Nilai/Value : Ribu/Thousand US$
Perub. (%)
Change (% )
17-162016 2017
2012 2013 2014
TABEL 20 : NILAI IMPOR 190 JENIS BARANG MENURUT NEGARA ASAL UTAMA
IMPORT VALUE OF 190 COMMODITIES BY MAIN COUNTRY OF ORIGIN
KODE
CODE
HS
2016 Trend (%)
'12-16
Jan-Ags/Jan-AugJENIS BARANG DESCRIPTION OF
GOODS2015
No. 08.05.148
8438 Machinery n.e.c. in this chapter, for the industrial preparation or manufacture of food or
drink; other than machinery for extraction or preparation of animal or fixed vegetable fats or
oils products
311.740,5 252.435,8 260.507,7 257.087,4 238.540,1 -5,04 #N/A #N/A -
R.R. TIONGKOK/CHINA 54.010,9 41.893,6 50.782,6 44.366,9 49.457,0 -1,18 34.028,8 36.004,8 5,81
AUSTRIA/AUSTRIA 3.740,4 4.671,9 24.604,1 23.222,5 48.458,4 95,94 26.289,2 58.118,6 121,07
PERANCIS/FRANCE 7.526,0 2.923,1 12.822,0 5.074,0 20.669,9 29,33 10.413,4 2.449,6 -76,48
ITALIA/ITALY 24.788,7 26.060,1 16.295,3 20.441,0 19.121,7 -7,34 12.696,3 15.539,7 22,40
THAILAND/THAILAND 29.033,7 6.583,0 4.401,7 38.616,8 15.590,2 5,40 13.545,8 2.257,4 -83,34
NEGARA LAINNYA/OTHER COUNTRIES 192.640,7 170.304,1 151.602,1 125.366,2 85.243,0 -17,61 #N/A #N/A -
8439 Machinery; for making pulp of fibrous cellulosic material, or for making or finishing paper or
paperboard
365.828,5 294.776,2 209.493,8 148.457,1 179.410,1 -19,03 #N/A #N/A -
ITALIA/ITALY 3.695,5 31.291,9 58.454,3 29.755,0 54.490,8 70,43 26.084,5 33.801,9 29,59
R.R. TIONGKOK/CHINA 77.728,2 137.926,9 64.344,2 61.343,6 50.498,2 -15,40 41.286,6 29.130,3 -29,44
FINLANDIA/FINLAND 138.808,9 11.785,2 11.036,0 6.967,9 19.415,5 -35,98 17.203,5 8.833,7 -48,65
JERMAN/GERMANY 29.811,0 18.524,4 7.096,5 3.581,4 13.324,4 -27,78 11.215,9 4.667,8 -58,38
JEPANG/JAPAN 6.334,9 16.036,8 8.435,8 4.062,7 11.314,8 -2,11 8.760,2 7.762,8 -11,39
NEGARA LAINNYA/OTHER COUNTRIES 109.450,0 79.211,0 60.127,1 42.746,4 30.366,4 -27,25 #N/A #N/A -
8441 Machines; for making up paper pulp, paper or paperboard, including cutting machines of all
kinds
236.765,3 238.637,5 228.465,5 235.224,3 240.221,5 0,15 #N/A #N/A -
R.R. TIONGKOK/CHINA 52.146,0 57.813,4 59.061,6 37.979,7 84.682,3 5,65 76.825,3 33.438,5 -56,47
FINLANDIA/FINLAND 2.500,0 15,3 1.780,8 124,0 43.345,1 118,13 43.311,0 3.755,8 -91,33
JEPANG/JAPAN 69.884,8 50.257,2 65.013,2 74.421,5 35.420,1 -9,21 19.431,4 9.732,5 -49,91
JERMAN/GERMANY 15.049,0 33.121,3 18.138,4 51.234,2 26.772,7 17,21 8.349,3 8.876,0 6,31
TAIWAN/TAIWAN, PROVINCE OF CHINA 47.912,3 38.501,0 46.366,9 37.568,1 14.652,2 -21,29 10.285,3 11.919,1 15,88
NEGARA LAINNYA/OTHER COUNTRIES 49.273,3 58.929,2 38.104,6 33.896,8 35.349,0 -11,46 #N/A #N/A -
8443 Printing machinery; used for printing by means of plates, cylinders and other printing
components of heading 84.42; other printers, copying machines and facsimile machines,
whether or not textile, lea
1.257.142,6 1.148.294,0 1.235.391,7 1.086.646,7 1.024.136,2 -4,55 #N/A #N/A -
R.R. TIONGKOK/CHINA 511.933,6 398.050,7 400.055,8 347.077,5 331.161,4 -9,59 209.602,8 281.895,9 34,49
JEPANG/JAPAN 278.351,7 278.952,1 416.958,0 351.007,2 318.675,3 5,13 211.576,4 329.141,4 55,57
SINGAPURA/SINGAPORE 136.126,5 107.066,7 109.894,2 102.115,8 91.941,3 -7,99 61.584,5 79.908,0 29,75
VIETNAM/VIET NAM 64.242,5 67.405,4 66.433,9 41.136,9 53.799,6 -8,14 34.783,8 50.128,2 44,11
PILIPINA/PHILIPPINES 24.014,9 26.290,9 40.263,0 46.715,0 49.710,0 22,51 32.568,1 32.568,8 0,00
NEGARA LAINNYA/OTHER COUNTRIES 242.473,4 270.528,2 201.786,8 198.594,6 178.848,6 -8,77 #N/A #N/A -
8455 Metal-rolling mills and rolls therefor 87.373,8 141.453,7 101.963,6 116.559,0 238.087,4 19,86 #N/A #N/A -
R.R. TIONGKOK/CHINA 43.436,0 44.365,6 40.828,0 42.396,4 174.396,0 31,45 35.860,0 38.375,4 7,01
JEPANG/JAPAN 8.306,0 19.711,0 20.511,1 13.141,1 23.250,0 17,98 14.011,0 11.734,0 -16,25
KOREA SELATAN/SOUTH OF KOREA 6.172,0 46.347,9 8.024,8 5.240,8 11.118,0 -9,54 3.882,0 4.760,7 22,64
ITALIA/ITALY 4.898,8 7.133,2 6.129,1 20.029,7 6.147,8 16,03 5.194,9 3.566,4 -31,35
JERMAN/GERMANY 3.371,8 2.862,9 6.334,2 3.761,0 4.170,7 7,23 2.516,7 8.660,5 244,12
NEGARA LAINNYA/OTHER COUNTRIES 21.189,3 21.033,0 20.136,4 31.990,0 19.004,9 2,04 #N/A #N/A -
151

Lanjutan/Continued
Nilai/Value : Ribu/Thousand US$
Perub. (%)
Change (% )
17-162016 2017
2012 2013 2014
TABEL 20 : NILAI IMPOR 190 JENIS BARANG MENURUT NEGARA ASAL UTAMA
IMPORT VALUE OF 190 COMMODITIES BY MAIN COUNTRY OF ORIGIN
KODE
CODE
HS
2016 Trend (%)
'12-16
Jan-Ags/Jan-AugJENIS BARANG DESCRIPTION OF
GOODS2015
No. 08.05.148
8462 Machine-tools; (including presses) for working metal by forging, hammering or die-stamping,
for bending, folding, straightening, flattening, shearing or punching metal
394.208,4 451.385,9 427.920,4 218.672,0 229.941,6 -16,50 #N/A #N/A -
JEPANG/JAPAN 212.764,0 234.707,0 233.782,3 82.545,6 105.650,8 -21,69 67.581,7 60.236,2 -10,87
R.R. TIONGKOK/CHINA 50.425,9 43.361,0 47.982,9 39.922,0 45.909,7 -2,67 29.916,3 29.759,1 -0,53
TAIWAN/TAIWAN, PROVINCE OF CHINA 39.272,7 46.601,4 39.073,1 30.701,9 19.978,6 -16,21 13.472,1 15.991,7 18,70
KOREA SELATAN/SOUTH OF KOREA 18.214,7 34.312,0 39.288,0 11.587,8 12.841,6 -16,34 6.501,9 6.227,1 -4,23
BELANDA/NETHERLANDS 419,0 1.291,1 2.955,1 11,2 8.398,4 13,30 8.379,4 37,4 -99,55
NEGARA LAINNYA/OTHER COUNTRIES 73.112,1 91.113,4 64.839,1 53.903,6 37.162,3 -17,12 #N/A #N/A -
8466 Machine-tools; parts and accessories suitable for use solely or principally with the machines
of headings 8456 to 8465, and tool holders for any type of tool for working in the hand
171.915,7 187.070,9 195.029,5 161.673,2 157.792,9 -3,12 #N/A #N/A -
JEPANG/JAPAN 105.122,8 110.281,3 125.641,9 102.308,5 88.009,7 -4,21 61.033,3 58.649,5 -3,91
R.R. TIONGKOK/CHINA 11.626,2 15.850,2 11.929,8 9.271,1 17.069,7 2,35 10.309,8 27.280,3 164,60
TAIWAN/TAIWAN, PROVINCE OF CHINA 11.178,1 11.858,7 15.825,9 12.126,6 12.147,6 1,90 8.415,6 8.561,9 1,74
SINGAPURA/SINGAPORE 8.892,5 6.867,0 9.069,7 7.127,3 8.840,9 0,26 5.342,5 10.077,4 88,63
KOREA SELATAN/SOUTH OF KOREA 8.196,3 7.578,4 5.324,7 4.831,6 4.540,4 -15,05 3.253,2 4.582,4 40,86
NEGARA LAINNYA/OTHER COUNTRIES 26.899,8 34.635,4 27.237,5 26.008,2 27.184,6 -2,62 #N/A #N/A -
8471 Automatic data processing machines and units thereof, magnetic or optical readers,
machines for transcribing data onto data media in coded form and machines for processing
such data, not
2.299.427,5 2.443.779,0 2.106.783,4 1.911.011,7 1.642.269,7 -8,78 #N/A #N/A -
R.R. TIONGKOK/CHINA 1.600.774,8 1.541.510,7 1.383.797,1 1.323.088,1 1.135.301,8 -8,06 667.619,4 1.048.527,9 57,05
SINGAPURA/SINGAPORE 130.242,2 151.639,8 137.511,6 187.008,6 174.370,8 8,26 115.591,0 161.745,7 39,93
THAILAND/THAILAND 19.160,1 42.569,7 47.345,7 42.348,6 89.353,9 35,99 45.773,1 61.598,4 34,57
MALAYSIA/MALAYSIA 134.539,7 134.556,7 104.262,4 81.077,1 59.118,5 -19,36 38.996,5 63.191,0 62,04
AMERIKA SERIKAT/UNITED STATES 52.534,2 58.067,0 40.207,4 66.593,6 48.853,0 -0,08 28.289,1 45.168,7 59,67
NEGARA LAINNYA/OTHER COUNTRIES 362.176,6 515.435,1 393.659,2 210.895,7 135.271,5 -24,90 #N/A #N/A -
8473 Machinery; parts and accessories (not covers, carrying cases and the like) suitable for use
solely or principally with machines of heading no. 8469 to 8472 heading 84.69 (other than
covers, carrying c
307.720,7 327.224,8 387.295,8 335.927,2 496.669,3 10,34 #N/A #N/A -
R.R. TIONGKOK/CHINA 56.872,5 62.860,5 70.119,5 126.004,0 274.645,6 46,88 124.023,7 200.343,0 61,54
SINGAPURA/SINGAPORE 105.929,6 99.822,3 172.643,2 85.274,6 85.927,8 -5,60 61.158,9 54.679,7 -10,59
BELANDA/NETHERLANDS 25.997,0 36.183,1 29.267,9 27.478,3 29.769,7 -0,04 17.678,1 13.874,9 -21,51
TAIWAN/TAIWAN, PROVINCE OF CHINA 11.360,0 15.550,8 25.113,1 13.105,0 21.372,8 11,55 13.698,6 15.117,6 10,36
MALAYSIA/MALAYSIA 10.851,6 12.846,2 10.363,1 14.185,0 13.749,6 5,89 9.227,4 9.872,4 6,99
NEGARA LAINNYA/OTHER COUNTRIES 96.710,0 99.962,0 79.789,1 69.880,4 71.203,8 -9,25 #N/A #N/A -
8474 Machinery for sorting, screening, separating, washing, crushing, grinding, mixing or
kneading earth, stone, ores in solid form, shaping, moulding machinery for solid mineral
fuels substances other min
478.921,5 522.136,4 754.144,2 638.645,0 551.765,6 4,97 #N/A #N/A -
R.R. TIONGKOK/CHINA 208.114,7 191.744,7 306.471,3 216.420,6 336.534,5 11,43 219.201,2 182.329,5 -16,82
AUSTRALIA/AUSTRALIA 41.474,8 38.985,1 49.626,8 47.189,4 48.400,2 5,13 33.280,0 34.075,1 2,39
JERMAN/GERMANY 61.811,2 65.681,5 203.870,9 139.228,9 28.582,8 -7,61 20.156,7 28.274,9 40,28
AMERIKA SERIKAT/UNITED STATES 27.111,3 26.705,9 25.977,9 39.927,1 22.663,0 0,44 18.502,4 13.664,0 -26,15
ITALIA/ITALY 18.799,3 37.871,3 30.569,3 22.039,6 16.176,7 -8,07 7.480,1 13.846,1 85,10
NEGARA LAINNYA/OTHER COUNTRIES 121.610,2 161.147,9 137.628,1 173.839,3 99.408,4 -3,22 #N/A #N/A -
152

Lanjutan/Continued
Nilai/Value : Ribu/Thousand US$
Perub. (%)
Change (% )
17-162016 2017
2012 2013 2014
TABEL 20 : NILAI IMPOR 190 JENIS BARANG MENURUT NEGARA ASAL UTAMA
IMPORT VALUE OF 190 COMMODITIES BY MAIN COUNTRY OF ORIGIN
KODE
CODE
HS
2016 Trend (%)
'12-16
Jan-Ags/Jan-AugJENIS BARANG DESCRIPTION OF
GOODS2015
No. 08.05.148
8477 Machinery; for working rubber or plastics or for the manufacture of products from these
materials, n.e.c. in this chapter
906.599,1 762.365,6 765.510,5 632.143,2 592.300,9 -9,87 #N/A #N/A -
R.R. TIONGKOK/CHINA 182.188,2 181.504,1 147.072,7 121.557,3 168.266,1 -5,44 107.154,6 123.898,8 15,63
JEPANG/JAPAN 211.708,8 146.342,6 154.304,8 103.829,4 108.202,8 -15,51 76.493,2 81.990,0 7,19
TAIWAN/TAIWAN, PROVINCE OF CHINA 93.806,3 81.834,6 90.577,5 76.643,7 71.428,3 -5,92 49.129,5 70.981,8 44,48
JERMAN/GERMANY 122.583,9 95.954,3 98.994,1 117.788,0 61.591,8 -11,05 42.907,3 38.100,3 -11,20
ITALIA/ITALY 46.942,2 41.048,6 74.675,8 41.184,4 28.769,9 -9,30 21.875,2 17.819,9 -18,54
NEGARA LAINNYA/OTHER COUNTRIES 249.369,6 215.681,3 199.885,5 171.140,4 154.042,0 -11,26 #N/A #N/A -
8479 Machinery and mechanical appliances; having individual functions, n.e.c. in this chapter 932.462,1 925.684,8 927.880,0 937.930,4 771.591,3 -3,59 #N/A #N/A -
R.R. TIONGKOK/CHINA 107.419,2 103.375,5 111.676,2 201.410,2 248.993,9 26,47 170.749,8 191.119,0 11,93
MALAYSIA/MALAYSIA 200.713,1 227.218,1 219.992,5 161.024,3 126.412,9 -11,92 81.325,7 77.578,6 -4,61
JEPANG/JAPAN 243.073,2 175.427,0 197.536,6 188.091,7 120.761,3 -12,45 89.162,5 84.324,3 -5,43
JERMAN/GERMANY 62.112,7 75.159,7 76.621,4 73.878,8 56.100,4 -2,18 32.801,0 56.857,0 73,34
AMERIKA SERIKAT/UNITED STATES 63.021,6 60.734,9 70.944,7 66.550,1 35.643,3 -9,95 24.667,0 22.760,5 -7,73
NEGARA LAINNYA/OTHER COUNTRIES 256.122,2 283.769,7 251.108,6 246.975,3 183.679,6 -7,72 #N/A #N/A -
8480 Moulding boxes for metal foundry, moulding patterns, moulds for metals (excluding ingot
moulds), metal carbides, glass, mineral materials, rubber or plastics
337.603,4 439.425,7 391.809,1 380.737,5 321.366,6 -2,39 #N/A #N/A -
JEPANG/JAPAN 109.371,8 153.443,9 125.938,4 122.011,3 87.998,8 -6,43 53.235,2 97.489,9 83,13
R.R. TIONGKOK/CHINA 60.682,4 97.145,8 71.364,1 82.753,0 76.520,5 3,08 46.699,4 99.447,2 112,95
KOREA SELATAN/SOUTH OF KOREA 59.636,1 57.755,3 60.735,8 51.408,4 47.374,4 -5,60 27.885,7 63.250,8 126,82
TAIWAN/TAIWAN, PROVINCE OF CHINA 25.145,7 27.356,6 26.637,0 24.588,9 17.645,6 -7,83 11.861,5 23.073,9 94,53
SINGAPURA/SINGAPORE 19.432,0 21.935,2 20.911,7 16.271,0 16.732,2 -5,80 11.211,8 17.438,1 55,53
NEGARA LAINNYA/OTHER COUNTRIES 63.335,3 81.788,8 86.222,1 83.704,9 75.095,1 3,70 #N/A #N/A -
8481 Taps, cocks, valves and similar appliances for pipes, boiler shells, tanks, vats or the like,
including pressure-reducing valves and thermostatically controlled valves
829.963,2 983.844,3 1.016.715,9 896.025,1 742.401,1 -3,12 #N/A #N/A -
R.R. TIONGKOK/CHINA 178.453,8 200.736,0 202.219,6 202.912,9 171.912,8 -0,64 108.670,5 160.908,2 48,07
SINGAPURA/SINGAPORE 83.435,9 122.323,1 162.419,8 119.588,7 111.887,4 5,80 82.669,7 50.438,3 -38,99
JEPANG/JAPAN 175.917,0 154.070,2 130.356,2 104.149,6 109.030,0 -12,61 69.170,3 110.108,4 59,18
AMERIKA SERIKAT/UNITED STATES 68.100,5 100.279,2 85.733,5 84.797,6 57.941,1 -4,79 39.346,8 48.178,6 22,45
THAILAND/THAILAND 35.036,4 52.108,1 59.154,4 49.393,6 54.279,7 8,57 35.448,7 42.333,2 19,42
NEGARA LAINNYA/OTHER COUNTRIES 289.019,6 354.327,7 376.832,4 335.182,7 237.350,2 -4,40 #N/A #N/A -
8482 Ball or roller bearings 521.449,4 516.125,6 477.882,4 381.274,2 411.522,3 -7,47 #N/A #N/A -
JEPANG/JAPAN 229.383,6 223.272,6 180.222,6 136.892,0 148.794,7 -12,67 99.924,5 152.293,1 52,41
R.R. TIONGKOK/CHINA 73.831,6 79.016,5 87.082,0 71.666,8 75.858,8 -0,43 49.467,8 76.645,3 54,94
THAILAND/THAILAND 43.685,8 53.419,1 60.790,8 59.122,4 69.227,1 10,76 45.945,0 58.056,8 26,36
AMERIKA SERIKAT/UNITED STATES 31.226,8 26.786,8 25.395,4 17.814,5 19.884,6 -12,28 13.445,9 15.510,9 15,36
SINGAPURA/SINGAPORE 49.330,1 35.601,8 27.269,8 23.566,8 19.105,1 -20,62 11.821,0 18.256,3 54,44
NEGARA LAINNYA/OTHER COUNTRIES 93.991,5 98.028,6 97.121,8 72.211,7 78.652,0 -6,41 #N/A #N/A -
153

Lanjutan/Continued
Nilai/Value : Ribu/Thousand US$
Perub. (%)
Change (% )
17-162016 2017
2012 2013 2014
TABEL 20 : NILAI IMPOR 190 JENIS BARANG MENURUT NEGARA ASAL UTAMA
IMPORT VALUE OF 190 COMMODITIES BY MAIN COUNTRY OF ORIGIN
KODE
CODE
HS
2016 Trend (%)
'12-16
Jan-Ags/Jan-AugJENIS BARANG DESCRIPTION OF
GOODS2015
No. 08.05.148
8483 Transmission shafts (including cam and crank) and cranks; bearing housings and plain shaft
bearings; gears and gearing; ball or roller screws; gear boxes and other speed changers;
flywheels
1.132.439,7 924.953,5 822.157,0 543.878,8 506.278,7 -19,27 #N/A #N/A -
JEPANG/JAPAN 624.663,1 448.980,4 363.560,4 218.007,8 197.789,1 -26,08 131.606,1 189.309,4 43,85
R.R. TIONGKOK/CHINA 75.705,2 100.930,8 98.309,8 75.269,8 79.369,6 -1,97 52.725,6 87.339,8 65,65
AMERIKA SERIKAT/UNITED STATES 64.996,6 46.048,6 41.248,7 40.182,1 38.098,0 -11,35 26.884,3 26.288,3 -2,22
THAILAND/THAILAND 80.377,0 80.007,4 82.441,6 42.531,2 35.596,8 -20,23 25.295,8 29.364,5 16,08
JERMAN/GERMANY 52.654,7 41.525,7 30.096,8 29.194,4 24.816,8 -16,95 14.981,5 33.022,3 120,42
NEGARA LAINNYA/OTHER COUNTRIES 234.043,1 207.460,5 206.499,7 138.693,5 130.608,4 -14,52 #N/A #N/A -
8501 Electric motors and generators (excluding generating sets) 362.842,7 432.924,4 438.854,7 352.744,5 377.601,0 -1,24 #N/A #N/A -
R.R. TIONGKOK/CHINA 128.586,5 173.421,3 187.451,5 160.082,3 172.088,4 5,16 112.500,7 143.447,8 27,51
JEPANG/JAPAN 57.838,0 53.381,5 50.654,8 38.744,2 64.215,4 -1,11 51.015,2 34.547,5 -32,28
VIETNAM/VIET NAM 12.739,7 17.705,3 18.219,6 18.272,9 24.693,9 14,51 14.890,9 19.469,6 30,75
SINGAPURA/SINGAPORE 51.323,0 60.555,7 44.882,7 26.363,0 15.877,5 -27,23 10.925,2 14.796,7 35,44
AMERIKA SERIKAT/UNITED STATES 18.644,5 16.568,2 24.547,3 10.648,5 13.421,4 -10,41 9.366,2 7.193,9 -23,19
NEGARA LAINNYA/OTHER COUNTRIES 93.711,0 111.292,4 113.098,7 98.633,6 87.304,4 -2,59 #N/A #N/A -
8502 Electric generating sets and rotary converters 671.004,8 569.500,9 780.726,8 459.875,2 373.993,8 -12,92 #N/A #N/A -
R.R. TIONGKOK/CHINA 239.404,7 243.884,1 361.611,3 198.804,7 212.062,4 -4,37 149.107,8 176.004,0 18,04
JEPANG/JAPAN 73.856,9 20.651,6 23.128,9 19.305,4 44.108,8 -10,40 32.055,4 55.944,4 74,52
SINGAPURA/SINGAPORE 43.564,4 65.368,2 38.342,5 31.364,8 18.890,2 -21,38 8.481,1 21.050,0 148,20
INGGRIS/UNITED KINGDOM 49.757,1 31.241,8 30.803,0 17.868,0 17.247,8 -23,49 12.180,8 35.331,8 190,06
JERMAN/GERMANY 18.920,4 31.984,8 35.980,4 29.987,3 16.413,4 -3,43 12.657,7 24.878,0 96,55
NEGARA LAINNYA/OTHER COUNTRIES 245.501,3 176.370,3 290.860,7 162.545,1 65.271,2 -23,90 #N/A #N/A -
8503 Electric motors and generators; parts suitable for use solely or principally with the machines
of heading no. 8501 or 8502
174.786,6 140.859,5 112.411,1 220.329,6 158.306,2 2,52 #N/A #N/A -
JEPANG/JAPAN 37.497,9 20.076,2 18.905,9 41.187,0 51.662,1 14,56 37.816,1 33.624,7 -11,08
R.R. TIONGKOK/CHINA 72.192,2 45.603,8 42.873,8 72.944,0 50.696,4 -2,34 30.978,6 56.789,1 83,32
INDIA/INDIA 1.818,9 1.779,7 1.519,6 3.803,7 11.036,4 54,73 5.620,9 7.317,3 30,18
FINLANDIA/FINLAND 4.440,6 1.767,3 572,4 18.880,2 10.506,7 50,55 10.452,2 6.962,3 -33,39
THAILAND/THAILAND 775,0 1.082,2 3.069,8 6.293,2 7.220,7 86,34 4.722,2 6.495,4 37,55
NEGARA LAINNYA/OTHER COUNTRIES 58.061,9 70.550,3 45.469,6 77.221,5 27.183,9 -13,30 #N/A #N/A -
8504 Electric transformers, static converters (e.g. rectifiers) and inductors 692.318,7 582.997,4 612.151,0 531.778,6 550.034,1 -5,37 #N/A #N/A -
R.R. TIONGKOK/CHINA 285.083,2 217.074,0 261.381,8 234.974,3 233.124,6 -3,18 146.821,8 260.957,9 77,74
SINGAPURA/SINGAPORE 86.751,7 62.102,9 69.848,8 56.148,7 56.551,4 -9,12 39.091,0 48.359,7 23,71
JEPANG/JAPAN 43.370,2 58.334,4 42.729,2 26.928,6 38.653,3 -9,55 24.337,0 45.021,5 84,99
KOREA SELATAN/SOUTH OF KOREA 54.652,6 63.808,3 34.879,5 22.343,8 22.691,0 -24,48 16.012,6 57.541,2 259,35
VIETNAM/VIET NAM 6.964,6 4.936,6 5.591,4 18.527,9 22.061,6 43,74 15.316,6 17.630,8 15,11
NEGARA LAINNYA/OTHER COUNTRIES 215.496,4 176.741,2 197.720,2 172.855,4 176.952,2 -4,08 #N/A #N/A -
154

Lanjutan/Continued
Nilai/Value : Ribu/Thousand US$
Perub. (%)
Change (% )
17-162016 2017
2012 2013 2014
TABEL 20 : NILAI IMPOR 190 JENIS BARANG MENURUT NEGARA ASAL UTAMA
IMPORT VALUE OF 190 COMMODITIES BY MAIN COUNTRY OF ORIGIN
KODE
CODE
HS
2016 Trend (%)
'12-16
Jan-Ags/Jan-AugJENIS BARANG DESCRIPTION OF
GOODS2015
No. 08.05.148
8507 Electric accumulators, including separators therefor; whether or not rectangular (including
square)
217.941,1 162.828,3 171.695,1 183.824,6 227.156,7 2,06 #N/A #N/A -
R.R. TIONGKOK/CHINA 102.865,6 80.638,9 99.463,8 99.047,6 126.081,8 6,32 72.999,0 147.398,0 101,92
KOREA SELATAN/SOUTH OF KOREA 13.936,7 14.386,6 9.501,1 13.601,6 16.242,1 2,53 9.245,2 20.278,2 119,34
JEPANG/JAPAN 32.098,6 10.970,9 8.328,6 7.871,7 15.928,8 -15,91 11.974,9 9.712,8 -18,89
VIETNAM/VIET NAM 606,0 488,0 632,7 18.015,7 14.874,6 172,10 9.122,2 19.301,4 111,59
THAILAND/THAILAND 12.773,7 14.974,0 15.162,4 13.697,8 13.509,1 0,23 8.052,1 17.664,2 119,37
NEGARA LAINNYA/OTHER COUNTRIES 55.660,5 41.369,9 38.606,4 31.590,3 40.520,4 -8,65 #N/A #N/A -
8511 Ignition or starting equipment; used for spark-ignition or compression-ignition internal combustion engines; generators and cut outs used in conjunction with such engines341.056,3 340.595,9 265.736,3 173.133,0 175.134,1 -18,21 #N/A #N/A -
JEPANG/JAPAN 161.040,3 161.223,8 113.670,5 68.501,1 64.665,2 -23,52 43.895,3 60.923,9 38,79
THAILAND/THAILAND 103.355,4 94.278,5 75.363,8 43.053,5 52.181,7 -19,35 33.060,9 48.258,3 45,97
R.R. TIONGKOK/CHINA 29.750,6 27.527,6 28.506,3 16.742,0 26.689,5 -6,90 15.285,4 17.366,0 13,61
AMERIKA SERIKAT/UNITED STATES 5.545,6 7.670,2 5.210,6 5.559,6 6.684,9 0,52 4.471,9 8.618,1 92,72
SINGAPURA/SINGAPORE 7.786,4 7.612,1 6.911,2 11.544,8 3.710,7 -10,11 2.544,9 3.728,2 46,49
NEGARA LAINNYA/OTHER COUNTRIES 33.578,0 42.283,7 36.073,9 27.732,1 21.202,1 -12,55 #N/A #N/A -
8512 Lighting or visual signalling equipment (excluding articles of heading no. 8539), windscreen
wipers, defrosters and demisters; electrical, of a kind used for cycles or motor vehicles
generators
220.746,3 209.275,3 227.127,2 182.541,1 192.501,4 -4,02 #N/A #N/A -
JEPANG/JAPAN 79.339,0 64.624,8 68.493,8 52.756,9 61.882,4 -6,76 42.129,0 49.944,6 18,55
R.R. TIONGKOK/CHINA 28.218,3 30.948,2 45.050,4 41.808,5 51.936,0 16,43 35.546,4 48.345,8 36,01
THAILAND/THAILAND 56.349,7 55.507,9 53.062,4 40.425,8 29.280,2 -15,01 20.246,3 34.186,4 68,85
MALAYSIA/MALAYSIA 16.240,3 20.369,8 20.278,3 15.576,0 18.968,8 0,42 11.745,1 17.779,3 51,38
TAIWAN/TAIWAN, PROVINCE OF CHINA 16.548,6 14.321,6 11.277,0 9.204,5 8.068,4 -17,13 5.645,7 8.235,2 45,87
NEGARA LAINNYA/OTHER COUNTRIES 24.050,3 23.503,0 28.965,2 22.769,4 22.365,6 -1,75 #N/A #N/A -
8514 Industrial or laboratory electric furnaces and ovens (including those functioning by induction
or dielectric loss); other industrial or laboratory equipment for the heat treatment of materials
by
89.474,0 113.901,2 153.872,3 148.192,4 158.840,7 15,15 #N/A #N/A -
R.R. TIONGKOK/CHINA 19.207,7 23.128,4 70.899,6 107.122,2 129.978,3 70,86 83.609,7 31.300,5 -62,56
JEPANG/JAPAN 43.866,6 44.759,0 42.160,2 21.528,7 15.332,0 -24,68 9.317,5 15.425,5 65,55
AMERIKA SERIKAT/UNITED STATES 1.919,7 4.315,8 2.075,4 2.436,8 2.016,6 -4,62 1.571,7 2.182,0 38,83
SINGAPURA/SINGAPORE 926,0 4.546,5 6.904,4 2.401,6 1.702,6 5,97 1.079,3 3.563,6 230,18
JERMAN/GERMANY 5.826,2 6.600,9 8.713,8 1.286,1 1.325,4 -36,85 999,3 1.285,8 28,67
NEGARA LAINNYA/OTHER COUNTRIES 17.727,8 30.550,5 23.118,9 13.416,9 8.485,8 -20,52 #N/A #N/A -
8515 Electric (electrically heated gas) soldering, brazing, welding machines and apparatus,
capable or not of cutting, electric machines and apparatus for hot spraying of metals or
sintered
160.910,0 157.805,0 164.318,7 206.494,3 173.878,0 4,33 #N/A #N/A -
R.R. TIONGKOK/CHINA 37.729,9 44.932,6 49.109,2 57.404,8 57.481,7 11,48 40.046,4 38.708,7 -3,34
JEPANG/JAPAN 48.455,6 52.612,5 67.963,4 48.536,8 40.982,1 -4,07 24.922,4 26.851,9 7,74
SINGAPURA/SINGAPORE 10.657,9 11.099,1 11.804,8 25.277,5 19.856,4 22,97 17.121,7 7.542,4 -55,95
KOREA SELATAN/SOUTH OF KOREA 12.998,9 5.258,7 6.552,2 3.928,7 14.765,2 -0,37 2.278,0 3.319,9 45,74
AMERIKA SERIKAT/UNITED STATES 18.951,2 11.352,1 10.313,0 7.794,3 6.488,0 -22,27 5.165,3 6.543,4 26,68
NEGARA LAINNYA/OTHER COUNTRIES 32.116,5 32.550,1 18.576,1 63.552,1 34.304,5 8,34 #N/A #N/A -
155

Lanjutan/Continued
Nilai/Value : Ribu/Thousand US$
Perub. (%)
Change (% )
17-162016 2017
2012 2013 2014
TABEL 20 : NILAI IMPOR 190 JENIS BARANG MENURUT NEGARA ASAL UTAMA
IMPORT VALUE OF 190 COMMODITIES BY MAIN COUNTRY OF ORIGIN
KODE
CODE
HS
2016 Trend (%)
'12-16
Jan-Ags/Jan-AugJENIS BARANG DESCRIPTION OF
GOODS2015
No. 08.05.148
8516 Electric water, space, soil heaters; electro-thermic hair-dressing apparatus; hand dryers,
irons; electro-thermic appliances for domestic purposes; electro heating resistors, not of
heading no.
240.008,0 239.190,6 204.017,8 171.863,4 203.493,7 -6,39 #N/A #N/A -
R.R. TIONGKOK/CHINA 131.673,4 160.358,0 136.705,2 121.259,3 142.115,1 -1,26 89.927,7 157.163,9 74,77
VIETNAM/VIET NAM 28.762,1 22.974,2 15.957,7 16.714,0 18.095,7 -11,71 13.679,0 19.071,4 39,42
SINGAPURA/SINGAPORE 48.424,0 8.828,3 13.779,0 8.858,6 14.942,7 -20,93 7.697,9 15.485,8 101,17
KOREA SELATAN/SOUTH OF KOREA 4.640,9 4.868,1 5.073,7 4.271,2 4.045,8 -3,97 2.408,3 2.560,3 6,31
MALAYSIA/MALAYSIA 5.118,5 3.830,2 5.284,8 3.280,8 3.909,0 -6,70 2.919,5 4.465,5 52,96
NEGARA LAINNYA/OTHER COUNTRIES 21.389,1 38.331,7 27.217,5 17.479,5 20.385,4 -8,44 #N/A #N/A -
8517 Telephone sets, including telephones for cellular networks or for other wireless networks;
other apparatus for the transmission or reception of voice, images or other data (including
wired/wireless
5.113.405,2 5.291.232,0 4.855.425,1 4.315.535,1 4.185.386,8 -5,86 #N/A #N/A -
R.R. TIONGKOK/CHINA 2.507.445,7 2.937.704,8 3.028.319,5 2.618.970,9 2.461.154,0 -1,51 1.503.544,4 2.313.558,0 53,87
VIETNAM/VIET NAM 295.408,5 616.223,1 951.312,4 881.711,3 929.862,1 30,36 508.565,2 693.905,4 36,44
SINGAPURA/SINGAPORE 44.927,8 83.408,8 103.515,9 235.335,6 236.109,1 54,58 181.050,8 150.086,4 -17,10
SWEDIA/SWEDEN 579.611,0 330.446,3 150.049,7 171.739,2 89.224,5 -35,58 69.069,5 27.134,4 -60,71
MALAYSIA/MALAYSIA 119.344,2 41.997,3 32.688,1 31.689,9 86.269,7 -8,89 21.821,8 99.422,0 355,61
NEGARA LAINNYA/OTHER COUNTRIES 1.566.668,0 1.281.451,9 589.539,4 376.088,3 382.767,4 -33,27 #N/A #N/A -
8518 Microphones and their stands; loudspeakers, mounted or not in their enclosures;
headphones and earphones, combined or not with a microphone, and sets of a microphone
and one or more
199.532,6 203.798,9 195.713,9 171.755,4 210.302,1 -0,66 #N/A #N/A -
R.R. TIONGKOK/CHINA 118.373,9 118.376,1 105.668,7 94.624,7 117.437,6 -2,37 75.075,4 142.307,9 89,55
SINGAPURA/SINGAPORE 31.370,6 20.732,3 25.382,4 21.928,1 29.146,0 -0,91 11.401,7 25.182,7 120,87
KOREA SELATAN/SOUTH OF KOREA 10.574,2 13.949,1 12.886,6 11.424,6 12.012,7 0,56 8.498,4 6.810,2 -19,86
VIETNAM/VIET NAM 4.697,1 3.026,6 7.997,8 6.868,0 11.506,4 29,84 6.153,6 18.371,4 198,55
MALAYSIA/MALAYSIA 3.294,4 6.151,4 5.215,0 8.618,7 11.258,4 32,25 6.961,4 13.415,9 92,72
NEGARA LAINNYA/OTHER COUNTRIES 31.222,5 41.563,4 38.563,3 28.291,2 28.940,9 -5,22 #N/A #N/A -
8522 Sound or video recording apparatus; parts and accessories suitable for use solely or
principally with the apparatus of heading 8519 or
186.515,3 233.474,8 233.656,6 166.353,2 169.700,8 -5,14 #N/A #N/A -
R.R. TIONGKOK/CHINA 56.135,7 56.556,5 49.960,3 26.984,8 36.998,1 -14,56 22.499,2 35.261,2 56,72
HONGKONG/HONG KONG 28.688,4 35.097,6 31.913,7 29.342,1 36.344,2 2,98 23.706,6 15.638,0 -34,04
JEPANG/JAPAN 21.050,3 9.032,9 35.326,6 21.883,7 22.340,8 10,56 11.220,3 27.757,0 147,38
KOREA SELATAN/SOUTH OF KOREA 31.970,8 38.323,0 35.505,0 26.005,3 20.327,4 -12,13 18.166,8 5.490,3 -69,78
THAILAND/THAILAND 19.941,0 25.308,8 21.535,6 19.573,9 18.120,2 -4,39 11.528,7 13.994,7 21,39
NEGARA LAINNYA/OTHER COUNTRIES 28.729,0 69.156,0 59.415,4 42.563,3 35.570,1 -0,58 #N/A #N/A -
8523 Discs, tapes, solid-state non-volatile storage devices, smart cards and other media for the
recording of sound or of other phenomena, whether or not recorded, including matrices and
172.823,5 142.258,5 169.022,9 167.272,2 184.924,1 3,02 #N/A #N/A -
R.R. TIONGKOK/CHINA 59.368,3 50.714,9 59.458,9 54.942,8 91.959,8 10,02 55.242,3 108.298,4 96,04
SINGAPURA/SINGAPORE 24.374,2 15.608,2 16.067,9 16.188,6 23.064,8 -0,74 12.590,7 29.376,6 133,32
BELANDA/NETHERLANDS 17.971,7 23.708,1 40.612,3 42.710,1 16.233,5 3,93 4.527,1 10.006,4 121,03
TAIWAN/TAIWAN, PROVINCE OF CHINA 8.806,6 6.929,5 7.367,3 8.992,5 8.742,9 2,49 5.524,7 14.232,1 157,61
JEPANG/JAPAN 2.747,4 2.443,2 2.650,1 1.635,2 8.275,1 19,76 2.555,2 4.778,6 87,02
NEGARA LAINNYA/OTHER COUNTRIES 59.555,3 42.854,6 42.866,3 42.803,0 36.648,0 -9,27 #N/A #N/A -
156

Lanjutan/Continued
Nilai/Value : Ribu/Thousand US$
Perub. (%)
Change (% )
17-162016 2017
2012 2013 2014
TABEL 20 : NILAI IMPOR 190 JENIS BARANG MENURUT NEGARA ASAL UTAMA
IMPORT VALUE OF 190 COMMODITIES BY MAIN COUNTRY OF ORIGIN
KODE
CODE
HS
2016 Trend (%)
'12-16
Jan-Ags/Jan-AugJENIS BARANG DESCRIPTION OF
GOODS2015
No. 08.05.148
8525 Transmission apparatus for radio-broadcasting or television, whether or not incorporating reception apparatus or sound recording or reproducing apparatus; television cameras, digital reception apparat88.423,2 117.423,0 99.400,1 99.068,4 161.799,0 10,94 #N/A #N/A -
R.R. TIONGKOK/CHINA 40.355,0 42.168,9 29.562,6 35.704,7 35.264,5 -4,27 14.102,6 68.404,3 385,05
SINGAPURA/SINGAPORE 11.637,9 17.290,2 25.459,6 8.216,7 32.620,9 14,08 13.876,9 7.880,1 -43,21
JEPANG/JAPAN 9.588,5 22.256,6 12.749,5 14.132,5 26.971,3 17,52 9.867,5 41.908,6 324,71
THAILAND/THAILAND 9.600,4 11.259,5 10.851,4 14.564,3 19.284,4 17,97 12.116,4 22.340,3 84,38
HONGKONG/HONG KONG 1.160,7 1.311,8 817,6 1.620,4 18.906,3 78,47 15.617,8 13.240,6 -15,22
NEGARA LAINNYA/OTHER COUNTRIES 16.080,8 23.135,9 19.959,4 24.829,8 28.751,6 13,12 #N/A #N/A -
8528 Monitors and projectors, not incorporating television reception apparatus; reception
apparatus for television, whether or not incorporating radio-broadcast receivers or sound or
video
304.082,3 334.965,9 303.560,8 216.874,3 282.353,4 -5,66 #N/A #N/A -
R.R. TIONGKOK/CHINA 82.732,7 74.626,7 64.141,5 65.781,1 108.746,0 4,30 62.217,2 121.846,7 95,84
MALAYSIA/MALAYSIA 170.166,7 189.805,5 179.541,5 107.520,8 68.121,5 -21,33 50.554,9 38.540,9 -23,76
VIETNAM/VIET NAM 231,3 122,9 6.820,3 3.271,4 65.052,4 328,86 21.797,1 99.696,3 357,38
PILIPINA/PHILIPPINES 4.437,6 5.221,9 11.167,3 10.278,1 14.024,3 34,70 9.422,2 16.247,4 72,44
KOREA SELATAN/SOUTH OF KOREA 14.610,9 11.997,7 5.794,9 4.775,0 6.275,1 -22,98 3.827,9 7.317,2 91,15
NEGARA LAINNYA/OTHER COUNTRIES 31.903,1 53.191,2 36.095,3 25.247,9 20.134,1 -15,34 #N/A #N/A -
8529 Transmission apparatus; parts suitable for use solely or principally with the apparatus of
heading no. 8525 to 8528
1.478.726,3 1.130.402,3 1.182.396,3 912.567,8 816.512,1 -13,08 #N/A #N/A -
R.R. TIONGKOK/CHINA 812.415,4 677.288,0 664.013,8 519.744,0 495.950,4 -11,77 320.902,8 574.809,4 79,12
KOREA SELATAN/SOUTH OF KOREA 115.595,3 122.598,9 225.414,4 146.997,8 72.761,6 -7,17 45.923,7 73.682,1 60,44
HONGKONG/HONG KONG 136.535,9 62.609,9 35.247,5 43.690,9 61.991,1 -17,63 40.083,4 35.167,2 -12,26
JEPANG/JAPAN 134.117,4 94.757,7 56.469,1 21.037,9 41.419,4 -31,99 16.291,0 34.883,7 114,13
SINGAPURA/SINGAPORE 61.167,2 54.593,2 62.166,1 42.336,8 28.932,6 -16,07 17.966,5 23.857,9 32,79
NEGARA LAINNYA/OTHER COUNTRIES 218.895,1 118.554,6 139.085,4 138.760,3 115.457,0 -10,61 #N/A #N/A -
8532 Electrical capacitors; fixed, variable or adjustable (pre-set) 430.459,5 360.178,6 241.447,9 209.550,3 197.332,6 -18,95 #N/A #N/A -
SINGAPURA/SINGAPORE 160.057,5 119.124,5 82.222,1 64.070,6 51.302,4 -25,14 35.263,8 54.710,8 55,15
JEPANG/JAPAN 83.047,7 53.706,3 34.373,0 38.345,3 44.875,2 -14,51 30.201,0 30.532,1 1,10
R.R. TIONGKOK/CHINA 43.637,6 64.319,5 43.167,6 35.035,9 39.185,4 -7,90 25.408,3 37.351,7 47,01
KOREA SELATAN/SOUTH OF KOREA 34.319,5 21.499,1 18.849,9 18.091,7 17.772,6 -13,83 12.394,4 16.339,2 31,83
MALAYSIA/MALAYSIA 48.513,4 50.875,1 25.860,5 22.911,7 17.025,2 -25,11 12.058,8 14.164,4 17,46
NEGARA LAINNYA/OTHER COUNTRIES 60.883,8 50.654,2 36.974,8 31.095,1 27.171,8 -18,95 #N/A #N/A -
8533 Electrical resistors (including rheostats and potentiometers), excluding heating resistors 180.722,2 259.320,6 164.179,8 157.754,5 167.737,3 -6,26 #N/A #N/A -
SINGAPURA/SINGAPORE 90.480,9 171.351,9 102.285,8 80.797,8 83.040,3 -8,82 55.814,0 51.005,4 -8,62
KOREA SELATAN/SOUTH OF KOREA 4.391,9 11.606,9 4.690,7 17.345,6 20.175,8 41,22 15.539,8 7.951,6 -48,83
JEPANG/JAPAN 34.582,7 29.884,5 18.446,8 17.662,2 19.022,1 -15,81 11.746,7 17.855,3 52,00
R.R. TIONGKOK/CHINA 10.797,3 9.418,2 8.518,5 11.198,5 12.503,5 4,78 8.648,4 8.469,1 -2,07
MALAYSIA/MALAYSIA 15.607,1 6.464,5 5.015,2 4.600,3 7.936,3 -15,57 5.103,7 3.654,9 -28,39
NEGARA LAINNYA/OTHER COUNTRIES 24.862,4 30.594,5 25.222,9 26.150,1 25.059,4 -1,40 #N/A #N/A -
157
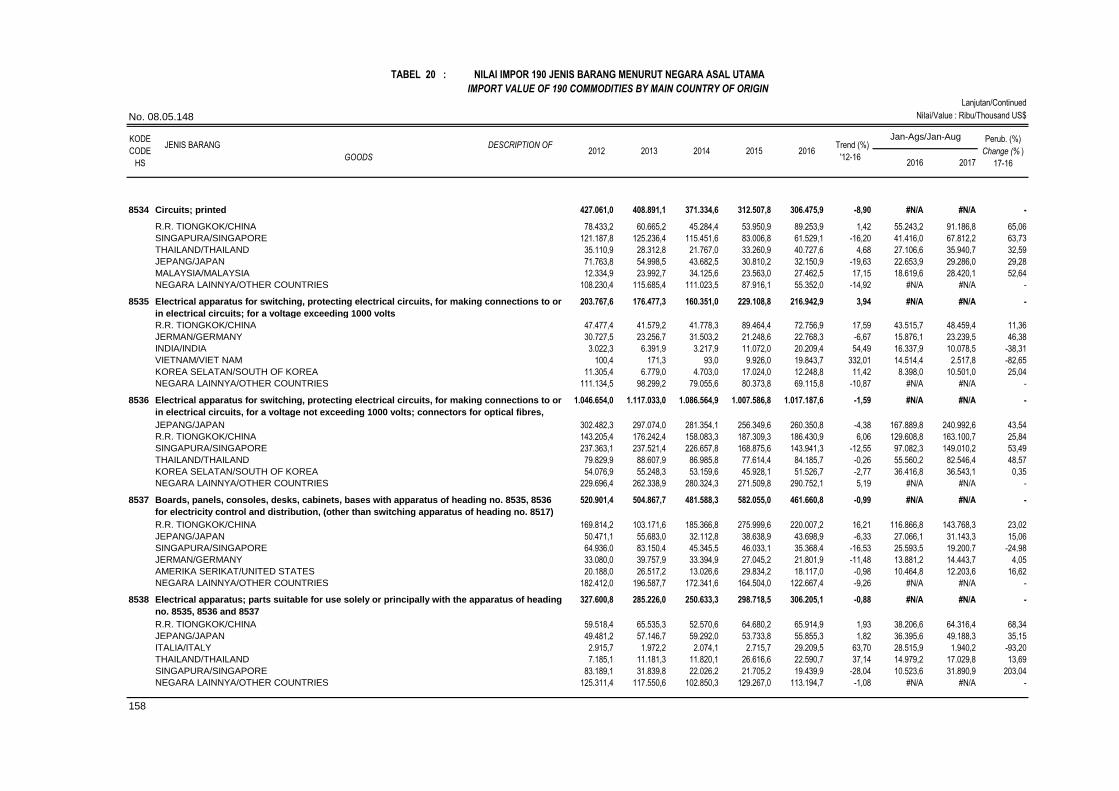
Lanjutan/Continued
Nilai/Value : Ribu/Thousand US$
Perub. (%)
Change (% )
17-162016 2017
2012 2013 2014
TABEL 20 : NILAI IMPOR 190 JENIS BARANG MENURUT NEGARA ASAL UTAMA
IMPORT VALUE OF 190 COMMODITIES BY MAIN COUNTRY OF ORIGIN
KODE
CODE
HS
2016 Trend (%)
'12-16
Jan-Ags/Jan-AugJENIS BARANG DESCRIPTION OF
GOODS2015
No. 08.05.148
8534 Circuits; printed 427.061,0 408.891,1 371.334,6 312.507,8 306.475,9 -8,90 #N/A #N/A -
R.R. TIONGKOK/CHINA 78.433,2 60.665,2 45.284,4 53.950,9 89.253,9 1,42 55.243,2 91.186,8 65,06
SINGAPURA/SINGAPORE 121.187,8 125.236,4 115.451,6 83.006,8 61.529,1 -16,20 41.416,0 67.812,2 63,73
THAILAND/THAILAND 35.110,9 28.312,8 21.767,0 33.260,9 40.727,6 4,68 27.106,6 35.940,7 32,59
JEPANG/JAPAN 71.763,8 54.998,5 43.682,5 30.810,2 32.150,9 -19,63 22.653,9 29.286,0 29,28
MALAYSIA/MALAYSIA 12.334,9 23.992,7 34.125,6 23.563,0 27.462,5 17,15 18.619,6 28.420,1 52,64
NEGARA LAINNYA/OTHER COUNTRIES 108.230,4 115.685,4 111.023,5 87.916,1 55.352,0 -14,92 #N/A #N/A -
8535 Electrical apparatus for switching, protecting electrical circuits, for making connections to or
in electrical circuits; for a voltage exceeding 1000 volts
203.767,6 176.477,3 160.351,0 229.108,8 216.942,9 3,94 #N/A #N/A -
R.R. TIONGKOK/CHINA 47.477,4 41.579,2 41.778,3 89.464,4 72.756,9 17,59 43.515,7 48.459,4 11,36
JERMAN/GERMANY 30.727,5 23.256,7 31.503,2 21.248,6 22.768,3 -6,67 15.876,1 23.239,5 46,38
INDIA/INDIA 3.022,3 6.391,9 3.217,9 11.072,0 20.209,4 54,49 16.337,9 10.078,5 -38,31
VIETNAM/VIET NAM 100,4 171,3 93,0 9.926,0 19.843,7 332,01 14.514,4 2.517,8 -82,65
KOREA SELATAN/SOUTH OF KOREA 11.305,4 6.779,0 4.703,0 17.024,0 12.248,8 11,42 8.398,0 10.501,0 25,04
NEGARA LAINNYA/OTHER COUNTRIES 111.134,5 98.299,2 79.055,6 80.373,8 69.115,8 -10,87 #N/A #N/A -
8536 Electrical apparatus for switching, protecting electrical circuits, for making connections to or
in electrical circuits, for a voltage not exceeding 1000 volts; connectors for optical fibres,
optical
1.046.654,0 1.117.033,0 1.086.564,9 1.007.586,8 1.017.187,6 -1,59 #N/A #N/A -
JEPANG/JAPAN 302.482,3 297.074,0 281.354,1 256.349,6 260.350,8 -4,38 167.889,8 240.992,6 43,54
R.R. TIONGKOK/CHINA 143.205,4 176.242,4 158.083,3 187.309,3 186.430,9 6,06 129.608,8 163.100,7 25,84
SINGAPURA/SINGAPORE 237.363,1 237.521,4 226.657,8 168.875,6 143.941,3 -12,55 97.082,3 149.010,2 53,49
THAILAND/THAILAND 79.829,9 88.607,9 86.985,8 77.614,4 84.185,7 -0,26 55.560,2 82.546,4 48,57
KOREA SELATAN/SOUTH OF KOREA 54.076,9 55.248,3 53.159,6 45.928,1 51.526,7 -2,77 36.416,8 36.543,1 0,35
NEGARA LAINNYA/OTHER COUNTRIES 229.696,4 262.338,9 280.324,3 271.509,8 290.752,1 5,19 #N/A #N/A -
8537 Boards, panels, consoles, desks, cabinets, bases with apparatus of heading no. 8535, 8536
for electricity control and distribution, (other than switching apparatus of heading no. 8517)
520.901,4 504.867,7 481.588,3 582.055,0 461.660,8 -0,99 #N/A #N/A -
R.R. TIONGKOK/CHINA 169.814,2 103.171,6 185.366,8 275.999,6 220.007,2 16,21 116.866,8 143.768,3 23,02
JEPANG/JAPAN 50.471,1 55.683,0 32.112,8 38.638,9 43.698,9 -6,33 27.066,1 31.143,3 15,06
SINGAPURA/SINGAPORE 64.936,0 83.150,4 45.345,5 46.033,1 35.368,4 -16,53 25.593,5 19.200,7 -24,98
JERMAN/GERMANY 33.080,0 39.757,9 33.394,9 27.045,2 21.801,9 -11,48 13.881,2 14.443,7 4,05
AMERIKA SERIKAT/UNITED STATES 20.188,0 26.517,2 13.026,6 29.834,2 18.117,0 -0,98 10.464,8 12.203,6 16,62
NEGARA LAINNYA/OTHER COUNTRIES 182.412,0 196.587,7 172.341,6 164.504,0 122.667,4 -9,26 #N/A #N/A -
8538 Electrical apparatus; parts suitable for use solely or principally with the apparatus of heading
no. 8535, 8536 and 8537
327.600,8 285.226,0 250.633,3 298.718,5 306.205,1 -0,88 #N/A #N/A -
R.R. TIONGKOK/CHINA 59.518,4 65.535,3 52.570,6 64.680,2 65.914,9 1,93 38.206,6 64.316,4 68,34
JEPANG/JAPAN 49.481,2 57.146,7 59.292,0 53.733,8 55.855,3 1,82 36.395,6 49.188,3 35,15
ITALIA/ITALY 2.915,7 1.972,2 2.074,1 2.715,7 29.209,5 63,70 28.515,9 1.940,2 -93,20
THAILAND/THAILAND 7.185,1 11.181,3 11.820,1 26.616,6 22.590,7 37,14 14.979,2 17.029,8 13,69
SINGAPURA/SINGAPORE 83.189,1 31.839,8 22.026,2 21.705,2 19.439,9 -28,04 10.523,6 31.890,9 203,04
NEGARA LAINNYA/OTHER COUNTRIES 125.311,4 117.550,6 102.850,3 129.267,0 113.194,7 -1,08 #N/A #N/A -
158

Lanjutan/Continued
Nilai/Value : Ribu/Thousand US$
Perub. (%)
Change (% )
17-162016 2017
2012 2013 2014
TABEL 20 : NILAI IMPOR 190 JENIS BARANG MENURUT NEGARA ASAL UTAMA
IMPORT VALUE OF 190 COMMODITIES BY MAIN COUNTRY OF ORIGIN
KODE
CODE
HS
2016 Trend (%)
'12-16
Jan-Ags/Jan-AugJENIS BARANG DESCRIPTION OF
GOODS2015
No. 08.05.148
8539 Lamps; electric filament or discharge lamps, including sealed beam lamp units and ultra-
violet or infra-red lamps, arc-lamps
397.297,9 366.320,2 298.389,0 239.603,3 220.362,4 -14,81 #N/A #N/A -
R.R. TIONGKOK/CHINA 291.689,0 269.109,0 198.799,8 172.597,5 152.998,3 -15,93 87.514,9 128.958,9 47,36
THAILAND/THAILAND 13.718,7 14.492,3 15.944,6 12.511,9 12.987,3 -2,53 8.747,1 9.860,7 12,73
JEPANG/JAPAN 28.199,8 20.443,4 19.215,8 9.691,6 12.570,6 -21,04 8.024,2 12.329,0 53,65
JERMAN/GERMANY 9.862,8 9.050,3 7.384,5 8.038,3 7.243,8 -7,09 4.877,0 6.278,6 28,74
AMERIKA SERIKAT/UNITED STATES 6.034,8 3.195,7 4.750,1 5.324,5 5.184,4 2,09 3.444,6 4.291,9 24,60
NEGARA LAINNYA/OTHER COUNTRIES 47.792,6 50.029,4 52.294,1 31.439,5 29.378,1 -13,39 #N/A #N/A -
8541 Diodes, transistors, similar semiconductor devices; including photovoltaic cells assembled
or not in modules, panels, light emitting mounted piezo-electric crystals
485.768,7 461.696,4 478.940,6 390.014,3 373.389,9 -6,71 #N/A #N/A -
JEPANG/JAPAN 190.511,3 161.296,0 158.626,9 118.474,6 93.932,8 -15,83 59.533,2 92.833,5 55,94
R.R. TIONGKOK/CHINA 57.456,8 57.908,2 66.758,7 68.174,3 80.159,1 8,65 52.001,0 71.189,5 36,90
SINGAPURA/SINGAPORE 123.831,8 123.936,8 136.628,1 87.033,8 61.577,3 -16,06 44.922,0 63.828,6 42,09
KOREA SELATAN/SOUTH OF KOREA 33.377,0 30.141,3 37.503,9 39.110,8 30.899,7 1,07 23.223,6 22.472,3 -3,24
MALAYSIA/MALAYSIA 13.286,7 16.618,4 21.067,2 20.466,4 21.516,4 12,44 13.062,9 18.461,9 41,33
NEGARA LAINNYA/OTHER COUNTRIES 67.305,1 71.795,7 58.355,9 56.754,4 85.304,6 2,42 #N/A #N/A -
8542 Electronic integrated circuits 1.841.266,8 1.579.273,9 1.572.506,9 1.453.234,0 1.481.732,6 -5,04 #N/A #N/A -
SINGAPURA/SINGAPORE 575.374,0 457.047,6 475.027,0 396.030,0 331.552,7 -11,71 222.559,2 246.510,2 10,76
KOREA SELATAN/SOUTH OF KOREA 192.470,2 173.503,4 157.722,8 167.227,3 202.169,5 0,62 132.084,9 214.173,7 62,15
TAIWAN/TAIWAN, PROVINCE OF CHINA 128.655,9 135.576,6 127.503,7 136.368,0 186.983,1 7,83 130.831,5 167.947,9 28,37
JEPANG/JAPAN 221.184,7 172.828,7 152.633,2 145.588,0 168.927,0 -6,86 108.343,2 134.220,3 23,88
JERMAN/GERMANY 120.673,4 131.922,1 147.999,7 123.077,4 143.859,7 2,86 108.534,0 88.046,7 -18,88
NEGARA LAINNYA/OTHER COUNTRIES 602.908,4 508.395,6 511.620,4 484.943,3 448.240,5 -6,20 #N/A #N/A -
8543 Electrical machines and apparatus; having individual functions, not specified or included
elsewhere in this chapter
312.633,0 212.609,3 212.947,5 264.426,7 258.691,9 -1,59 #N/A #N/A -
R.R. TIONGKOK/CHINA 96.031,2 86.648,9 89.862,4 130.751,0 128.083,1 10,38 81.166,4 180.524,8 122,41
JEPANG/JAPAN 132.198,9 24.461,4 24.467,8 32.289,5 32.467,6 -22,36 18.656,1 25.091,4 34,49
SINGAPURA/SINGAPORE 11.728,9 7.922,7 23.968,8 33.200,1 18.108,1 25,88 13.965,2 6.719,0 -51,89
KOREA SELATAN/SOUTH OF KOREA 11.298,0 39.856,2 28.082,6 14.695,4 17.982,4 -0,68 12.265,6 9.488,2 -22,64
MEKSIKO/MEXICO 46,5 99,6 122,0 344,0 12.696,7 247,62 7.267,9 346,2 -95,24
NEGARA LAINNYA/OTHER COUNTRIES 61.329,6 53.620,5 46.443,9 53.146,6 49.354,0 -4,34 #N/A #N/A -
8544 Insulated wire, cable and other electric conductors, connector fitted or not; optical fibre
cables of individually sheathed fibres, whether or not assembled with electric conductors or
fitted with
929.978,5 974.199,4 869.091,1 813.051,7 829.634,0 -4,01 #N/A #N/A -
R.R. TIONGKOK/CHINA 298.910,0 357.446,8 283.441,5 316.240,9 295.497,6 -1,44 188.357,4 352.752,7 87,28
SINGAPURA/SINGAPORE 84.321,7 89.975,2 93.282,9 93.205,9 125.094,1 8,59 49.937,1 67.100,4 34,37
JEPANG/JAPAN 90.133,3 89.039,2 82.039,5 90.283,5 87.526,5 -0,45 60.207,1 84.874,0 40,97
KOREA SELATAN/SOUTH OF KOREA 52.902,5 45.355,9 36.426,9 57.664,3 51.329,3 1,81 36.032,5 52.861,2 46,70
INGGRIS/UNITED KINGDOM 7.139,5 9.034,3 22.578,2 2.945,2 49.928,0 31,90 914,8 3.269,5 257,41
NEGARA LAINNYA/OTHER COUNTRIES 396.571,4 383.348,0 351.322,0 252.711,8 220.258,6 -14,72 #N/A #N/A -
159

Lanjutan/Continued
Nilai/Value : Ribu/Thousand US$
Perub. (%)
Change (% )
17-162016 2017
2012 2013 2014
TABEL 20 : NILAI IMPOR 190 JENIS BARANG MENURUT NEGARA ASAL UTAMA
IMPORT VALUE OF 190 COMMODITIES BY MAIN COUNTRY OF ORIGIN
KODE
CODE
HS
2016 Trend (%)
'12-16
Jan-Ags/Jan-AugJENIS BARANG DESCRIPTION OF
GOODS2015
No. 08.05.148
8703 Motor cars and other motor vehicles; principally designed for the transport of persons (other
than those of heading no. 8702), including station wagons and racing cars
2.728.211,7 2.231.189,6 1.480.891,8 1.165.032,9 1.190.180,3 -20,62 #N/A #N/A -
THAILAND/THAILAND 1.507.521,2 1.112.968,9 719.972,5 452.004,3 634.272,0 -23,15 455.377,8 321.278,5 -29,45
JEPANG/JAPAN 796.977,5 560.340,1 380.643,5 445.118,5 290.390,6 -20,14 218.345,5 309.500,6 41,75
JERMAN/GERMANY 104.445,0 157.436,4 129.488,1 102.674,8 84.371,3 -8,19 50.651,5 68.865,9 35,96
KOREA SELATAN/SOUTH OF KOREA 57.303,5 157.427,6 110.347,8 74.911,9 80.634,6 -0,59 57.370,0 118.063,8 105,79
INDIA/INDIA 60.876,4 54.625,3 32.381,0 22.222,6 33.899,4 -18,70 12.499,3 148.124,5 1.085,06
NEGARA LAINNYA/OTHER COUNTRIES 201.088,2 188.391,3 108.059,1 68.100,8 66.612,4 -27,58 #N/A #N/A -
8704 Vehicles; for the transport of goods 2.640.175,0 892.232,1 696.877,5 566.946,8 397.153,8 -34,57 #N/A #N/A -
THAILAND/THAILAND 512.706,5 362.511,4 277.462,3 281.072,1 202.635,4 -19,03 141.656,2 271.490,6 91,65
INDIA/INDIA 286.796,5 28.329,2 100.598,9 121.366,0 67.463,5 -13,41 34.575,1 116.349,7 236,51
SWEDIA/SWEDEN 245.005,7 57.280,0 21.108,4 17.221,9 23.405,0 -44,56 14.990,9 62.804,8 318,95
JEPANG/JAPAN 744.475,1 204.201,6 131.401,4 75.482,7 22.618,9 -54,99 10.427,0 203.437,2 1.851,06
BELARUS/BELARUS 1.503,7 1.263,0 - - 19.273,1 - 9.251,1 - -
NEGARA LAINNYA/OTHER COUNTRIES 849.687,5 238.647,0 166.306,3 71.804,1 61.757,9 -47,50 #N/A #N/A -
8708 Motor vehicles; parts and accessories, of heading no. 8701 to 8705 2.982.318,6 3.218.275,6 2.908.464,1 2.456.675,3 2.593.542,7 -5,35 #N/A #N/A -
JEPANG/JAPAN 1.181.393,8 1.333.272,4 1.191.961,5 1.032.075,7 1.189.924,9 -2,39 777.564,5 1.164.032,5 49,70
THAILAND/THAILAND 1.021.072,2 1.111.223,5 974.632,4 802.199,1 722.818,3 -9,67 477.272,4 732.048,2 53,38
R.R. TIONGKOK/CHINA 122.781,3 118.381,8 123.309,5 129.734,2 147.449,1 4,68 98.290,6 151.114,2 53,74
INDIA/INDIA 29.471,7 75.042,8 109.133,7 79.727,5 85.690,4 24,55 60.341,3 62.305,1 3,25
PILIPINA/PHILIPPINES 71.636,2 89.674,6 105.323,6 51.156,3 81.205,9 -3,06 54.202,8 73.974,4 36,48
NEGARA LAINNYA/OTHER COUNTRIES 555.963,3 490.680,6 404.103,4 361.782,5 366.454,1 -10,76 #N/A #N/A -
8710 Tanks and other armoured fighting vehicles; motorised, whether or not fitted with weapons,
and parts of such vehicles
37.883,4 220.559,5 94.015,3 222.161,7 234.855,0 44,14 #N/A #N/A -
JERMAN/GERMANY 2.973,2 2.897,3 39.324,2 36.918,5 116.088,5 168,44 76.566,7 46.022,8 -39,89
KOREA SELATAN/SOUTH OF KOREA 9.566,1 72.754,9 14.056,6 2.402,8 35.691,6 -7,48 35.599,6 22.647,4 -36,38
BRASILIA/BRAZIL - - - - 32.787,9 - 32.787,9 - -
BELGIA/BELGIUM - 1,4 4,0 9,7 20.697,6 - 18.560,3 41.876,9 125,63
REPUBLIK CZECH/CZECH REPUBLIC 0,0 547,5 - 110,2 13.005,9 - 13.005,9 9,3 -99,93
NEGARA LAINNYA/OTHER COUNTRIES 25.344,1 144.358,3 40.630,6 182.720,5 16.583,5 -5,94 #N/A #N/A -
8714 Vehicles; parts and accessories of heading no. 8711 to 8713 680.276,6 586.724,4 511.962,9 406.008,7 437.527,9 -11,76 #N/A #N/A -
R.R. TIONGKOK/CHINA 248.386,1 239.149,7 245.699,4 210.639,1 247.184,8 -1,36 163.735,9 202.164,1 23,47
THAILAND/THAILAND 95.376,2 91.804,6 84.532,7 50.232,8 52.143,2 -16,56 33.159,5 53.956,5 62,72
JEPANG/JAPAN 65.953,5 39.344,4 46.789,0 34.764,6 32.900,6 -14,06 22.051,3 36.163,3 64,00
TAIWAN/TAIWAN, PROVINCE OF CHINA 34.931,0 26.119,6 29.319,9 26.967,2 29.561,6 -2,97 19.990,9 32.080,6 60,48
INDIA/INDIA 5.410,3 7.641,5 25.258,8 29.441,8 25.071,4 55,51 17.334,7 19.363,3 11,70
NEGARA LAINNYA/OTHER COUNTRIES 230.219,4 182.664,6 80.363,2 53.963,3 50.666,3 -34,60 - #N/A -
160

Lanjutan/Continued
Nilai/Value : Ribu/Thousand US$
Perub. (%)
Change (% )
17-162016 2017
2012 2013 2014
TABEL 20 : NILAI IMPOR 190 JENIS BARANG MENURUT NEGARA ASAL UTAMA
IMPORT VALUE OF 190 COMMODITIES BY MAIN COUNTRY OF ORIGIN
KODE
CODE
HS
2016 Trend (%)
'12-16
Jan-Ags/Jan-AugJENIS BARANG DESCRIPTION OF
GOODS2015
No. 08.05.148
8803 Aircraft; parts of heading no. 8801 or 8802 472.968,3 899.397,2 334.982,3 631.135,9 640.045,1 2,54 #N/A #N/A -
PERANCIS/FRANCE 33.505,3 34.907,3 24.567,2 165.021,7 161.051,4 59,89 115.975,2 106.295,2 -8,35
AMERIKA SERIKAT/UNITED STATES 161.276,2 163.360,6 121.120,7 171.064,3 144.661,9 -1,70 89.659,6 122.318,4 36,43
SINGAPURA/SINGAPORE 78.416,5 52.345,1 27.496,5 47.874,0 84.001,8 0,48 31.226,9 91.943,5 194,44
FEDERASI RUSIA/RUSSIA FEDERATION 1.827,2 387.442,7 6.105,6 124.672,7 65.669,7 82,76 62.198,9 31.249,8 -49,76
SPANYOL/SPAIN 14.568,3 82.884,1 34.381,7 18.603,7 49.623,4 10,04 28.241,5 7.701,7 -72,73
NEGARA LAINNYA/OTHER COUNTRIES 183.374,8 178.457,3 121.310,6 103.899,4 135.036,9 -10,89 #N/A #N/A -
8901 Cruise ships, excursion boats, ferry-boats, cargo ships, barges and similar vessels for the
transport of persons or goods
1.233.384,1 698.269,5 715.646,4 430.365,6 747.836,8 -13,80 #N/A #N/A -
SINGAPURA/SINGAPORE 300.610,2 132.369,5 91.390,0 50.178,2 191.350,7 -17,08 110.074,6 76.113,4 -30,85
JEPANG/JAPAN 184.992,5 68.947,5 167.781,6 134.961,6 182.862,9 6,70 125.370,5 117.908,8 -5,95
R.R. TIONGKOK/CHINA 294.726,8 312.612,7 200.428,4 115.698,2 162.654,9 -19,61 109.598,5 123.815,1 12,97
JERMAN/GERMANY 17.100,0 10.200,0 - - 60.342,6 - - 20.750,0 -
PANAMA/PANAMA 181.275,1 9.015,0 13.250,0 43.900,0 34.502,6 -15,93 4.250,0 4.250,0 0,00
NEGARA LAINNYA/OTHER COUNTRIES 254.679,4 165.124,8 242.796,4 85.627,7 116.123,2 -19,97 #N/A #N/A -
9018 Instruments and appliances used in medical, surgical, dental or veterinary sciences,
including scintigraphic apparatus, other electro-medical apparatus and sight testing
instruments
224.001,4 304.596,5 273.212,6 330.956,9 439.994,9 15,41 #N/A #N/A -
JERMAN/GERMANY 33.228,6 44.815,8 41.201,5 51.585,6 76.286,9 19,76 41.871,1 71.799,3 71,48
AMERIKA SERIKAT/UNITED STATES 30.868,7 35.964,7 37.773,6 45.058,5 56.278,2 15,33 31.900,4 63.507,3 99,08
R.R. TIONGKOK/CHINA 27.792,4 37.557,7 32.820,5 42.619,0 55.704,8 16,38 32.830,4 58.195,1 77,26
JEPANG/JAPAN 31.100,6 37.828,5 41.576,4 45.178,4 54.717,3 13,97 33.923,1 46.017,0 35,65
SINGAPURA/SINGAPORE 20.629,6 24.337,9 30.113,0 35.620,5 40.133,3 18,67 24.671,0 31.759,8 28,73
NEGARA LAINNYA/OTHER COUNTRIES 80.381,6 124.091,9 89.727,6 110.894,8 156.874,5 13,03 #N/A #N/A -
9022 X-ray, alpha, beta, gamma radiation apparatus; x-ray tubes, x-ray generators, high tension
generators, control panels and desks, screens, examination or treatment tables, chairs and
the like
76.494,4 84.623,5 72.649,0 85.864,9 206.112,6 22,10 #N/A #N/A -
JERMAN/GERMANY 10.912,7 12.623,3 12.407,4 14.109,4 40.763,0 31,61 16.485,3 17.070,6 3,55
R.R. TIONGKOK/CHINA 9.478,3 9.850,4 14.260,3 18.626,6 28.561,1 32,89 13.684,6 16.255,6 18,79
SINGAPURA/SINGAPORE 2.730,5 10.055,0 4.158,1 2.527,3 24.393,4 34,97 8.283,8 1.030,0 -87,57
LUKSEMBURG/LUXEMBOURG - - - - 21.462,4 - 21.462,4 - -
AMERIKA SERIKAT/UNITED STATES 8.758,2 10.025,8 10.093,0 8.304,1 20.889,0 16,77 8.303,2 13.351,0 60,79
NEGARA LAINNYA/OTHER COUNTRIES 44.614,7 42.069,1 31.730,1 42.297,6 70.043,6 9,50 #N/A #N/A -
9031 Measuring or checking instruments, appliances and machines, n.e.c. or included in this
chapter; profile projectors
193.154,5 218.422,5 214.078,2 201.035,0 296.068,0 8,02 #N/A #N/A -
R.R. TIONGKOK/CHINA 19.295,9 16.420,9 15.830,3 16.652,2 73.393,6 30,81 60.379,8 27.324,6 -54,75
JEPANG/JAPAN 89.431,1 118.056,3 108.760,3 76.451,3 72.332,9 -8,23 44.154,8 52.995,1 20,02
JERMAN/GERMANY 13.489,1 21.092,1 14.552,2 16.304,4 23.048,1 8,48 11.628,5 15.027,5 29,23
SWEDIA/SWEDEN 1.163,4 812,3 1.249,1 705,8 17.469,4 69,51 16.883,3 718,9 -95,74
AMERIKA SERIKAT/UNITED STATES 14.297,6 11.864,0 15.361,9 15.095,4 14.575,1 2,83 8.082,7 10.401,3 28,69
NEGARA LAINNYA/OTHER COUNTRIES 55.477,4 50.176,9 58.324,3 75.825,9 95.249,0 16,11 #N/A #N/A -
161

Lanjutan/Continued
Nilai/Value : Ribu/Thousand US$
Perub. (%)
Change (% )
17-162016 2017
2012 2013 2014
TABEL 20 : NILAI IMPOR 190 JENIS BARANG MENURUT NEGARA ASAL UTAMA
IMPORT VALUE OF 190 COMMODITIES BY MAIN COUNTRY OF ORIGIN
KODE
CODE
HS
2016 Trend (%)
'12-16
Jan-Ags/Jan-AugJENIS BARANG DESCRIPTION OF
GOODS2015
No. 08.05.148
9032 Regulating or controlling instruments and apparatus; automatic type 195.309,7 313.066,0 289.615,1 290.601,6 269.265,0 5,84 #N/A #N/A -
JEPANG/JAPAN 49.224,4 75.568,9 85.341,8 90.600,3 83.774,3 13,26 55.112,0 68.928,7 25,07
THAILAND/THAILAND 5.776,1 36.636,9 48.430,2 39.229,0 50.890,6 55,59 33.358,3 49.628,6 48,77
R.R. TIONGKOK/CHINA 26.961,5 26.038,8 27.290,2 28.401,7 28.895,7 2,28 20.737,7 30.996,4 49,47
MALAYSIA/MALAYSIA 47.462,6 46.183,0 43.378,9 39.402,5 24.865,2 -13,51 16.564,8 19.411,5 17,19
AMERIKA SERIKAT/UNITED STATES 13.087,7 12.417,1 10.714,7 11.082,3 18.604,6 6,07 14.119,1 8.922,5 -36,80
NEGARA LAINNYA/OTHER COUNTRIES 52.797,4 116.221,2 74.459,3 81.885,8 62.234,5 -0,21 #N/A #N/A -
9301 Military weapons; other than revolvers, pistols and arms of heading no. 9307 20.521,3 58.636,0 317.591,2 143.893,3 257.195,9 81,38 #N/A #N/A -
BRASILIA/BRAZIL - - 196.316,8 99.625,2 167.232,7 - 167.232,7 - -
R.R. TIONGKOK/CHINA 2,4 28.068,7 17.749,4 - 23.789,9 - 23.789,9 - -
PERANCIS/FRANCE 4.725,6 13.696,1 62.702,1 9.920,6 17.990,9 26,51 16.592,4 15.413,7 -7,10
JERMAN/GERMANY 498,1 1.102,6 7.083,3 10.910,6 15.765,0 150,97 11.363,3 2.466,7 -78,29
AMERIKA SERIKAT/UNITED STATES 475,5 782,4 76,3 10.215,3 14.710,2 156,85 5.386,1 15.986,5 196,81
NEGARA LAINNYA/OTHER COUNTRIES 14.819,7 14.986,3 33.663,4 13.221,6 17.707,3 2,33 #N/A #N/A -
9401 Seats (not those of heading no. 9402), whether or not convertible into beds and parts thereof 234.002,3 231.426,8 209.423,9 196.197,1 183.680,7 -6,29 #N/A #N/A -
R.R. TIONGKOK/CHINA 105.446,0 108.528,0 98.294,3 95.318,3 95.172,0 -3,29 59.920,5 88.959,2 48,46
JEPANG/JAPAN 61.687,3 50.643,1 32.336,5 33.510,4 32.535,4 -15,57 21.333,3 25.333,3 18,75
THAILAND/THAILAND 32.978,4 45.004,9 43.591,0 35.012,4 25.113,2 -7,65 17.244,2 38.589,9 123,79
JERMAN/GERMANY 10.223,1 6.772,3 7.207,0 11.339,7 6.921,3 -2,61 4.051,1 5.620,1 38,73
MALAYSIA/MALAYSIA 4.157,7 4.273,9 5.084,4 4.138,8 4.524,0 1,38 2.662,7 3.875,6 45,56
NEGARA LAINNYA/OTHER COUNTRIES 19.509,8 16.204,8 22.910,8 16.877,5 19.414,7 0,31 #N/A #N/A -
9405 Lamps, light fittings; including searchlights, spotlights and parts thereof, n.e.c.; illuminated
signs, name-plates and the like, having permanently fixed light source and parts thereof
n.e.c. or incl
107.554,4 138.267,5 138.599,6 153.078,8 200.890,3 14,47 #N/A #N/A -
R.R. TIONGKOK/CHINA 72.972,3 92.687,7 89.426,5 104.440,4 143.753,0 15,90 92.943,1 126.755,0 36,38
SINGAPURA/SINGAPORE 3.535,8 5.426,7 9.231,5 4.267,5 9.102,3 17,95 7.650,4 4.586,7 -40,05
JERMAN/GERMANY 3.099,4 5.112,7 4.684,2 6.755,2 8.598,4 26,10 4.710,7 4.206,8 -10,70
MALAYSIA/MALAYSIA 4.999,9 8.697,5 5.899,3 8.666,3 7.167,1 7,43 3.583,9 4.616,5 28,81
JEPANG/JAPAN 1.652,3 3.486,7 4.388,5 3.040,6 4.842,6 22,31 2.746,7 4.052,6 47,55
NEGARA LAINNYA/OTHER COUNTRIES 21.294,6 22.856,2 24.969,4 25.908,8 27.426,9 6,52 #N/A #N/A -
9801 Deployment goods 2.042.503,6 1.315.953,5 942.902,2 343.161,2 333.349,9 -39,16 #N/A #N/A -
JEPANG/JAPAN 1.952.311,9 1.257.438,6 922.994,2 340.660,7 321.428,4 -38,82 208.480,7 422.532,7 102,67
THAILAND/THAILAND 9.239,5 2.943,8 - - 11.355,6 - 1.905,1 33.244,2 1.645,04
SINGAPURA/SINGAPORE 2,7 2,8 3,6 1,5 395,1 154,43 79,4 32,7 -58,86
AMERIKA SERIKAT/UNITED STATES 75,5 127,1 108,8 25,8 165,3 -0,25 162,9 74,7 -54,16
DENMARK/DENMARK - - - - 2,7 - 2,7 - -
NEGARA LAINNYA/OTHER COUNTRIES 80.873,9 55.441,2 19.795,7 2.473,1 2,7 -90,65 #N/A #N/A -
Sumber/Source : Badan Pusat Statistik (diolah, Pusat Data dan Sistem Informasi, Kementerian Perdagangan)/Central Board of Statistics (processed by Trade Information & Data Centre, Ministry of Trade)
162

Lanjutan/Continued
Volume/Volume : Ton
0102 Bovine animals; live 101.410,5 130.524,7 246.835,2 197.604,1 195.764,1 18,89 127.436,1 137.948,9 8,25
AUSTRALIA/AUSTRALIA 101.410,5 130.524,5 246.834,4 197.604,1 195.764,1 18,89 127.436,1 137.948,9 8,25
JERMAN/GERMANY - - 0,1 - - - - - -
INGGRIS/UNITED KINGDOM - - 0,8 - - - - - -
AMERIKA SERIKAT/UNITED STATES - - 0,0 - - - - - -
REP.AFRIKA SELATAN/SOUTH AFRICA - - - - - - - - -
NEGARA LAINNYA/OTHER COUNTRIES - 0,2 - - - - - 0 -
0202 Meat of bovine animals; frozen 31.428,9 42.363,8 70.197,6 47.246,5 110.018,1 29,89 48.141,7 91.279,2 89,61
AUSTRALIA/AUSTRALIA 23.142,1 32.316,2 54.031,5 36.899,0 55.459,2 20,69 38.434,8 44.579,9 15,99
INDIA/INDIA - - - - 39.524,4 - 364,0 35.364,0 9.615,38
SELANDIA BARU/NEW ZEALAND 7.321,8 8.589,0 14.028,1 8.260,3 10.764,2 7,59 6.851,5 6.338,9 -7,48
AMERIKA SERIKAT/UNITED STATES 965,0 1.419,4 2.064,7 1.950,1 3.899,2 36,49 2.306,4 4.258,1 84,62
SPANYOL/SPAIN - - - - 306,8 - 121,9 605,6 396,87
NEGARA LAINNYA/OTHER COUNTRIES - 39,1 73,3 137,1 64,5 - 63 133 -
0402 Milk and cream; concentrated or containing added sugar or other sweetening matter 205.858,8 209.916,5 203.934,6 196.712,9 223.610,1 1,01 137.978,2 171.884,5 24,57
SELANDIA BARU/NEW ZEALAND 68.846,3 58.274,8 56.595,3 54.896,4 68.961,2 -0,56 44.145,8 42.106,9 -4,62
AMERIKA SERIKAT/UNITED STATES 34.920,7 57.381,9 47.131,8 37.249,1 48.902,5 2,44 26.645,2 29.481,3 10,64
AUSTRALIA/AUSTRALIA 32.917,6 29.013,8 36.721,3 44.432,9 39.664,9 8,32 25.990,7 30.667,6 17,99
PERANCIS/FRANCE 10.661,4 6.162,0 17.444,3 15.637,6 15.957,6 18,98 10.872,8 13.248,5 21,85
BELGIA/BELGIUM 11.319,7 14.590,0 12.391,0 15.843,9 12.766,8 3,28 8.049,6 23.746,1 195,00
NEGARA LAINNYA/OTHER COUNTRIES 47.193,2 44.494,0 33.651,0 28.653,0 37.357,2 -8,68 22.274,3 32.634,1 46,51
0703 Onions, shallots, garlic, leeks and other alliaceous vegetables; fresh or chilled 570.766,0 564.623,1 636.050,4 538.740,7 549.266,0 -1,23 361.067,4 534.529,9 48,04
R.R. TIONGKOK/CHINA 415.469,9 445.609,0 494.481,0 483.181,4 444.912,3 2,20 304.844,0 405.755,8 33,10
SELANDIA BARU/NEW ZEALAND 17.122,0 12.558,0 24.143,7 20.905,6 32.666,5 19,74 31.897,3 37.148,3 16,46
INDIA/INDIA 51.355,4 63.199,5 68.081,3 16.146,2 46.350,4 -14,53 20.868,3 83.020,6 297,83
BELANDA/NETHERLANDS 8.997,2 88,0 13.125,1 16.714,6 23.154,3 104,16 2.179,8 7.840,0 259,66
VIETNAM/VIET NAM 32.607,4 17.911,0 11.455,9 45,0 1.000,0 -72,63 850,0 - -
NEGARA LAINNYA/OTHER COUNTRIES 45.214,0 25.257,6 24.763,4 1.747,8 1.182,5 -63,06 428,1 765,2 78,77
0806 Grapes; fresh or dried 61.391,2 39.464,4 53.100,7 47.901,4 65.827,4 3,39 34.211,2 60.929,5 78,10
AMERIKA SERIKAT/UNITED STATES 18.255,7 13.122,5 15.624,8 14.222,7 15.548,7 -2,38 2.706,2 7.638,6 182,26
AUSTRALIA/AUSTRALIA 6.902,3 11.115,1 11.142,2 12.549,3 16.907,7 21,08 16.907,7 15.274,2 -9,66
R.R. TIONGKOK/CHINA 12.449,5 7.279,2 11.948,4 10.773,4 20.581,0 15,00 7.224,7 21.841,0 202,31
PERU/PERU 6.908,1 2.678,3 5.854,0 5.155,8 7.390,4 8,22 2.235,6 4.819,6 115,58
CHILI/CHILE 8.997,0 3.038,7 4.819,1 3.191,8 4.347,0 -13,11 4.347,0 8.131,9 87,07
NEGARA LAINNYA/OTHER COUNTRIES 7.878,5 2.230,5 3.712,2 2.008,3 1.052,6 -33,84 790,1 3.224,2 308,09
125
2016 Trend (%)
12-16
Jan-Ags/Jan-AugJENIS BARANG DESCRIPTION OF
GOODS2015
No. 08.05.148
Perub. (%)
Change (%)
16-172016 2017
2012 2013 2014
TABEL 20.1 : VOLUME IMPOR 190 JENIS BARANG MENURUT NEGARA ASAL UTAMA
IMPORT VOLUME OF 190 COMMODITIES BY MAIN COUNTRY OF ORIGIN
KODE
CODE
HS

Lanjutan/Continued
Volume/Volume : Ton
2016 Trend (%)
12-16
Jan-Ags/Jan-AugJENIS BARANG DESCRIPTION OF
GOODS2015
No. 08.05.148
Perub. (%)
Change (%)
16-172016 2017
2012 2013 2014
TABEL 20.1 : VOLUME IMPOR 190 JENIS BARANG MENURUT NEGARA ASAL UTAMA
IMPORT VOLUME OF 190 COMMODITIES BY MAIN COUNTRY OF ORIGIN
KODE
CODE
HS
0808 Apples, pears and quinces; fresh 314.993,9 257.895,4 225.575,4 187.204,8 239.598,8 -8,31 135.684,2 259.892,7 91,54
R.R. TIONGKOK/CHINA 249.985,0 214.263,5 176.111,3 144.548,5 173.477,4 -10,63 84.104,9 217.488,6 158,59
AMERIKA SERIKAT/UNITED STATES 49.928,0 32.117,9 37.369,9 22.639,4 38.678,7 -8,24 28.755,8 23.760,0 -17,37
SELANDIA BARU/NEW ZEALAND 3.835,7 3.841,4 3.120,1 3.840,4 9.378,1 19,58 8.571,3 6.380,5 -25,56
REP.AFRIKA SELATAN/SOUTH AFRICA 5.971,5 5.029,5 4.974,6 4.547,8 9.105,6 7,71 6.964,2 8.792,8 26,26
AUSTRALIA/AUSTRALIA 3.118,2 1.498,8 1.651,4 9.730,2 4.850,7 31,71 4.206,0 2.058,5 -51,06
NEGARA LAINNYA/OTHER COUNTRIES 2.155,5 1.144,2 2.348,1 1.898,4 4.108,2 19,68 3.081,8 1.412,4 -54,17
1001 Wheat and meslin 6.250.489,7 6.737.511,6 7.432.597,6 7.412.019,4 10.534.672,3 12,07 7.267.626,8 9.579.791,4 31,81
AUSTRALIA/AUSTRALIA 4.420.922,0 3.808.898,2 4.000.378,6 4.268.553,5 3.499.715,3 -3,47 2.523.005,4 4.880.107,5 93,42
UKRAINE/UKRAINE 30.506,2 304.850,0 333.084,4 664.056,2 2.469.436,9 160,29 1.337.120,4 1.193.039,8 -10,78
KANADA/CANADA 930.618,9 1.372.007,2 1.364.031,8 1.715.020,2 1.658.441,1 14,78 1.124.150,7 1.486.441,6 32,23
ARGENTINA/ARGENTINA - - - - 1.289.197,9 - 1.136.137,9 152.312,3 -86,59
AMERIKA SERIKAT/UNITED STATES 686.380,4 535.334,6 989.394,4 389.708,3 938.665,0 3,13 532.343,7 936.794,8 75,98
NEGARA LAINNYA/OTHER COUNTRIES 182.062,3 716.421,7 745.708,4 374.681,3 679.216,1 21,96 614.868,6 931.095,5 51,43
1005 Maize (corn) 1.692.994,5 3.191.044,8 3.253.618,5 3.267.694,3 1.139.694,5 -7,39 850.265,7 414.573,5 -51,24
BRASILIA/BRAZIL 74.375,2 1.277.442,6 1.308.856,1 1.331.411,4 519.246,8 48,11 465.246,8 23.065,1 -95,04
AMERIKA SERIKAT/UNITED STATES 44.153,8 24.548,5 96.530,9 33.831,9 303.690,5 51,85 69.321,2 197.990,2 185,61
ARGENTINA/ARGENTINA 286.307,9 442.790,7 723.338,4 1.776.082,3 307.863,7 16,58 307.536,1 134.478,0 -56,27
THAILAND/THAILAND 1.401,2 6.989,5 10.634,9 11.590,3 7.030,7 45,23 6.605,2 31.542,7 377,55
INDIA/INDIA 1.125.763,3 1.426.872,2 1.100.174,8 96.892,8 815,4 -82,00 515,1 1.554,0 201,72
NEGARA LAINNYA/OTHER COUNTRIES 160.993,1 12.401,3 14.083,5 17.885,7 1.047,4 -62,11 1.041,3 25.943,5 2.391,46
1006 Rice 1.810.372,3 472.664,7 844.163,7 861.601,0 1.283.178,5 -0,88 1.128.547,2 216.760,7 -80,79
THAILAND/THAILAND 315.352,7 94.633,9 366.203,5 126.745,7 557.890,0 15,41 500.090,0 69.846,0 -86,03
VIETNAM/VIET NAM 1.084.782,8 171.286,6 306.418,1 509.374,2 535.577,0 -3,17 530.377,0 16.099,9 -96,96
PAKISTAN/PAKISTAN 133.078,0 75.813,0 61.715,0 180.099,5 134.832,5 9,32 60.492,5 45.000,0 -25,61
INDIA/INDIA 259.022,6 107.538,0 90.653,8 34.167,5 36.142,0 -39,86 22.035,1 32.209,7 46,17
MYANMAR/MYANMAR (FORM. BURMA) 11.819,6 18.450,0 15.616,0 8.775,0 16.650,0 -0,58 13.775,0 51.225,0 271,87
NEGARA LAINNYA/OTHER COUNTRIES 6.316,6 4.943,2 3.557,3 2.439,1 2.087,1 -25,33 1.777,7 2.380,2 33,89
1108 Starches; inulin 873.434,4 309.972,4 483.302,5 843.192,8 851.752,6 9,97 618.943,8 562.059,7 -9,19
THAILAND/THAILAND 673.582,8 208.772,0 339.488,8 532.915,2 553.529,0 5,60 414.533,5 308.367,6 -25,61
VIETNAM/VIET NAM 77.647,7 9.961,0 25.085,2 56.861,0 75.803,7 18,46 59.758,7 52.610,2 -11,96
R.R. TIONGKOK/CHINA 45.751,8 32.465,1 25.822,6 44.955,3 75.162,3 14,09 37.216,5 126.516,7 239,95
BELANDA/NETHERLANDS 22.989,3 6.727,5 9.518,4 14.185,4 8.932,6 -10,82 6.624,0 6.114,1 -7,70
TURKI/TURKEY 0,0 45,0 539,0 29.257,0 29.445,0 5.858,05 23.325,0 2.920,0 -87,48
NEGARA LAINNYA/OTHER COUNTRIES 53.462,9 52.001,9 82.848,4 165.019,0 108.880,0 29,40 77.486,1 65.531,1 -15,43
126

Lanjutan/Continued
Volume/Volume : Ton
2016 Trend (%)
12-16
Jan-Ags/Jan-AugJENIS BARANG DESCRIPTION OF
GOODS2015
No. 08.05.148
Perub. (%)
Change (%)
16-172016 2017
2012 2013 2014
TABEL 20.1 : VOLUME IMPOR 190 JENIS BARANG MENURUT NEGARA ASAL UTAMA
IMPORT VOLUME OF 190 COMMODITIES BY MAIN COUNTRY OF ORIGIN
KODE
CODE
HS
1201 Soya beans, whether or not broken 1.921.206,5 1.785.384,5 1.965.811,2 2.256.931,7 2.261.803,3 5,77 1.636.025,9 2.343.209,5 43,23
AMERIKA SERIKAT/UNITED STATES 1.810.357,2 1.643.126,6 1.874.725,6 2.206.443,8 2.236.864,1 7,44 1.616.403,7 2.310.397,5 42,93
KANADA/CANADA 7.632,5 3.834,6 22.003,4 26.117,2 7.404,9 20,42 5.909,9 11.409,3 93,05
MALAYSIA/MALAYSIA 56.037,6 19.195,1 13.573,2 13.079,3 5.647,3 -39,18 2.366,1 8.223,2 247,54
R.R. TIONGKOK/CHINA 596,9 240,0 620,0 2.225,4 1.520,4 50,64 1.120,4 - -
ARGENTINA/ARGENTINA 2.551,5 90.687,7 23.087,5 1.000,3 7.498,3 -20,95 7.498,3 5.000,0 -33,32
NEGARA LAINNYA/OTHER COUNTRIES 44.030,8 28.300,5 31.801,4 8.065,7 2.868,2 -48,92 2.727,5 8.179,6 199,90
1202 Ground-nuts; not roasted or otherwise cooked, whether or not shelled or broken 185.828,1 282.423,3 253.679,2 194.429,7 189.742,6 -3,26 136.707,3 222.344,1 62,64
INDIA/INDIA 157.973,1 229.216,3 202.586,0 148.790,6 166.955,6 -3,16 121.255,7 161.260,2 32,99
R.R. TIONGKOK/CHINA 16.342,7 21.172,0 24.661,4 16.665,8 6.235,6 -19,48 3.343,8 17.953,9 436,94
MALAYSIA/MALAYSIA 5.137,1 10.283,5 14.046,2 17.614,3 10.844,6 22,54 7.581,9 8.422,7 11,09
MOZAMBIK/MOZAMBIQUE 1.929,7 10.681,8 8.830,1 6.402,5 2.520,6 0,22 2.362,1 11.934,2 405,24
SUDAN/SUDAN - 3.512,5 370,0 40,0 1.520,9 - 877,0 16.263,8 1.754,49
NEGARA LAINNYA/OTHER COUNTRIES 4.445,5 7.557,2 3.185,5 4.916,5 1.665,3 -21,29 1.286,9 6.509,2 405,82
1701 Cane or beet sugar and chemically pure sucrose, in solid form 2.815.940,2 3.344.303,8 2.965.801,3 3.375.010,4 4.761.885,4 11,18 2.938.067,3 3.638.132,1 23,83
THAILAND/THAILAND 1.512.378,9 1.252.276,0 1.554.215,2 1.794.338,0 2.267.029,0 12,40 1.933.629,1 2.098.160,9 8,51
BRASILIA/BRAZIL 984.568,2 1.137.249,7 427.492,3 458.167,7 1.311.232,5 -3,31 233.315,0 718.638,6 208,01
AUSTRALIA/AUSTRALIA 230.293,9 671.112,8 887.888,1 1.020.214,0 896.430,5 36,85 521.974,5 506.850,0 -2,90
ARGENTINA/ARGENTINA - - - - 123.620,0 - 123.620,0 - -
EL SALVADOR/EL SALVADOR - 95.500,0 - - 66.633,0 - 66.633,0 71.959,0 7,99
NEGARA LAINNYA/OTHER COUNTRIES 88.699,1 188.165,2 96.205,7 102.290,7 96.940,4 -4,23 58.895,8 242.523,6 311,78
1702 Sugars, including lactose, maltose, glucose or fructose in solid form; sugar syrups without
added flavouring or colouring matter; artificial honey, whether or not mixed with natural
honey; caramel
194.687,9 233.872,6 225.365,0 266.304,2 393.453,5 16,61 251.467,0 337.918,9 34,38
R.R. TIONGKOK/CHINA 103.862,2 139.670,7 113.109,5 171.437,0 316.777,9 27,57 198.863,8 280.361,4 40,98
AMERIKA SERIKAT/UNITED STATES 37.196,6 48.298,6 58.655,3 31.670,8 29.349,3 -8,57 19.608,7 19.804,7 1,00
PERANCIS/FRANCE 13.904,7 13.610,7 14.289,9 16.169,2 12.083,7 -1,08 8.780,7 6.678,2 -23,94
BELANDA/NETHERLANDS 4.891,6 2.105,2 1.400,8 2.175,1 2.584,9 -11,69 1.700,4 1.380,1 -18,83
MALAYSIA/MALAYSIA 4.275,6 3.974,8 2.839,0 4.618,6 5.622,6 7,23 3.445,5 9.477,1 175,06
NEGARA LAINNYA/OTHER COUNTRIES 30.557,2 26.212,5 35.070,6 40.233,5 27.035,0 1,85 19.067,9 20.217,3 6,03
1801 Cocoa beans; whole or broken, raw or roasted 23.942,6 30.765,7 109.409,6 53.371,9 61.016,0 27,40 30.764,8 183.440,4 496,27
EKUADOR/ECUADOR 100,1 3.457,1 11.009,4 5.602,8 11.197,8 169,58 5.946,8 24.893,0 318,59
MALAYSIA/MALAYSIA 2.070,7 976,3 5.231,9 2.839,3 10.500,4 53,95 4.507,9 47.022,7 943,11
AMERIKA SERIKAT/UNITED STATES - - 977,2 - 9.914,0 - 6.519,8 1.438,8 -77,93
PAPUA NUGINI/PAPUA NEW GUINEA 5.250,0 5.427,6 8.586,6 4.058,6 8.190,7 6,17 2.383,8 2.763,9 15,95
PANTAI GADING/COTE D'IVOIRE 5.514,1 8.241,0 60.069,0 25.169,0 6.550,2 15,73 4.151,3 47.181,9 1.036,57
NEGARA LAINNYA/OTHER COUNTRIES 11.007,6 12.663,5 23.535,4 15.702,1 14.662,8 8,20 7.255,2 60.140,0 728,93
127

Lanjutan/Continued
Volume/Volume : Ton
2016 Trend (%)
12-16
Jan-Ags/Jan-AugJENIS BARANG DESCRIPTION OF
GOODS2015
No. 08.05.148
Perub. (%)
Change (%)
16-172016 2017
2012 2013 2014
TABEL 20.1 : VOLUME IMPOR 190 JENIS BARANG MENURUT NEGARA ASAL UTAMA
IMPORT VOLUME OF 190 COMMODITIES BY MAIN COUNTRY OF ORIGIN
KODE
CODE
HS
1901 Malt extract; flour/groats/meal/starch/malt extract products, no cocoa (or less than 40% by
weight) and food preparations of goods of headings 04.01 to 04.04, no cocoa (or less than 5%
by weight),
44.429,8 64.326,5 51.786,7 54.461,9 59.917,2 4,41 36.879,5 53.042,2 43,83
SINGAPURA/SINGAPORE 10.339,8 18.423,8 15.932,9 14.990,7 17.248,2 8,52 10.479,5 15.176,8 44,82
THAILAND/THAILAND 3.276,7 4.803,1 6.151,3 10.988,1 10.286,0 36,55 6.570,5 8.952,0 36,25
AUSTRALIA/AUSTRALIA 186,1 2.623,0 3.477,0 7.828,4 8.940,7 142,00 5.135,2 6.040,9 17,64
MALAYSIA/MALAYSIA 23.690,3 26.065,1 11.804,8 9.047,3 8.657,2 -26,45 4.873,8 9.291,5 90,64
POLANDIA/POLAND 66,4 1.169,6 884,0 2.036,9 2.653,1 120,98 1.831,0 1.171,4 -36,02
NEGARA LAINNYA/OTHER COUNTRIES 6.870,5 11.241,9 13.536,8 9.570,5 12.132,0 10,26 7.989,5 12.409,5 55,32
2106 Food preparations not elsewhere specified or included 124.218,2 133.748,8 122.187,5 105.582,7 141.814,9 0,29 97.903,5 102.223,8 4,41
AMERIKA SERIKAT/UNITED STATES 9.111,6 9.941,2 9.018,3 11.495,6 6.998,3 -3,75 4.335,6 6.820,5 57,31
MALAYSIA/MALAYSIA 32.042,0 23.519,6 19.129,9 23.493,6 22.756,7 -6,63 16.265,1 20.039,2 23,20
R.R. TIONGKOK/CHINA 38.634,3 38.507,3 43.639,9 21.333,0 27.784,9 -11,75 21.490,7 26.484,9 23,24
SINGAPURA/SINGAPORE 7.235,1 8.222,2 7.542,4 7.076,1 5.232,4 -7,67 3.751,0 4.169,8 11,16
KOREA SELATAN/SOUTH OF KOREA 15.316,9 20.874,3 16.867,7 16.830,0 17.710,8 0,75 11.460,0 17.241,5 50,45
NEGARA LAINNYA/OTHER COUNTRIES 21.878,5 32.684,2 25.989,5 25.354,5 61.331,8 19,81 40.601,0 27.467,9 -32,35
2303 Residues of starch manufacture, similar residues; beet-pulp, bagasse and other waste of
sugar manufacture, brewing or distilling dregs and waste, whether or not in the form of
pellets
475.780,0 473.259,9 555.330,2 515.441,8 662.918,1 7,78 450.971,8 804.794,3 78,46
AMERIKA SERIKAT/UNITED STATES 385.571,0 436.944,4 447.479,8 381.172,1 505.600,8 4,14 337.142,9 681.187,4 102,05
R.R. TIONGKOK/CHINA 69.250,1 13.161,5 76.508,0 76.731,2 108.138,2 30,40 77.563,8 99.418,0 28,18
AUSTRALIA/AUSTRALIA 16.859,8 18.480,3 11.937,8 12.600,9 27.078,3 5,81 21.266,1 16.745,2 -21,26
INDIA/INDIA 2.237,8 2.275,2 2.721,2 3.032,8 2.567,8 5,79 2.347,8 2.963,9 26,24
THAILAND/THAILAND 90,0 42,0 42,5 62,7 10.028,0 167,17 3.514,0 2.501,5 -28,81
NEGARA LAINNYA/OTHER COUNTRIES 1.771,2 2.356,5 16.641,0 41.842,0 9.505,0 86,58 9.137,1 1.978,2 -78,35
2304 Oil-cake and other solid residues; whether or not ground or in the form of pellets, resulting
from the extraction of soya-bean oil
3.479.611,5 3.509.820,0 3.828.672,2 4.110.604,9 4.011.839,1 4,53 2.681.852,8 3.568.274,7 33,05
ARGENTINA/ARGENTINA 2.797.028,8 2.542.317,7 1.978.059,0 1.905.588,5 2.419.702,1 -5,62 1.338.953,3 2.234.201,2 66,86
BRASILIA/BRAZIL 299.883,9 596.357,9 1.456.767,7 2.088.336,7 1.318.390,0 52,42 1.169.780,9 1.116.909,6 -4,52
PARAGUAY/PARAGUAY 16.070,0 148.637,1 89.644,8 7.958,7 142.760,5 15,50 117.706,4 91.261,3 -22,47
PANAMA/PANAMA 3.290,5 - - - 39.665,3 - - 42.797,8 -
R.R. TIONGKOK/CHINA 6.376,3 492,5 137.973,9 963,8 36.986,7 52,01 7.925,6 350,2 -95,58
NEGARA LAINNYA/OTHER COUNTRIES 356.962,0 222.014,7 166.226,9 107.757,2 54.334,4 -36,16 47.486,5 82.754,6 74,27
2309 Preparations of a kind used in animal feeding 578.550,2 665.751,6 622.679,3 614.115,6 725.405,5 3,79 476.305,9 617.930,5 29,73
AMERIKA SERIKAT/UNITED STATES 219.968,7 202.643,3 247.736,7 257.017,4 362.743,8 13,18 224.051,9 319.423,8 42,57
AUSTRALIA/AUSTRALIA 119.612,6 151.080,5 123.966,7 122.276,5 107.559,0 -4,15 79.192,1 71.281,2 -9,99
THAILAND/THAILAND 22.194,1 25.894,6 31.329,1 41.178,4 40.434,6 18,10 24.358,6 39.706,2 63,01
SELANDIA BARU/NEW ZEALAND 72.730,9 83.580,7 75.641,1 93.327,6 91.733,3 5,91 70.353,9 62.491,3 -11,18
SINGAPURA/SINGAPORE 62.142,1 57.115,2 43.229,0 43.821,5 45.090,1 -8,67 30.747,2 35.489,8 15,42
NEGARA LAINNYA/OTHER COUNTRIES 81.901,8 145.437,3 100.776,7 56.494,2 77.844,7 -9,94 47.602,3 89.538,1 88,10
128
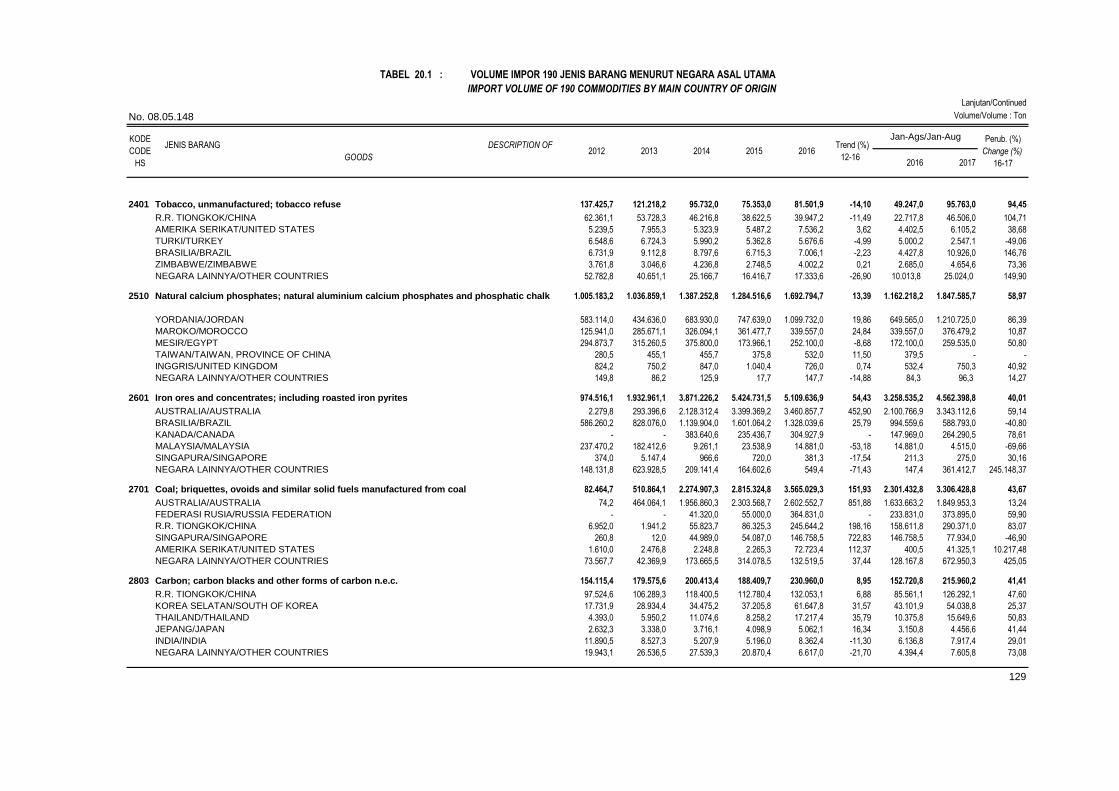
Lanjutan/Continued
Volume/Volume : Ton
2016 Trend (%)
12-16
Jan-Ags/Jan-AugJENIS BARANG DESCRIPTION OF
GOODS2015
No. 08.05.148
Perub. (%)
Change (%)
16-172016 2017
2012 2013 2014
TABEL 20.1 : VOLUME IMPOR 190 JENIS BARANG MENURUT NEGARA ASAL UTAMA
IMPORT VOLUME OF 190 COMMODITIES BY MAIN COUNTRY OF ORIGIN
KODE
CODE
HS
2401 Tobacco, unmanufactured; tobacco refuse 137.425,7 121.218,2 95.732,0 75.353,0 81.501,9 -14,10 49.247,0 95.763,0 94,45
R.R. TIONGKOK/CHINA 62.361,1 53.728,3 46.216,8 38.622,5 39.947,2 -11,49 22.717,8 46.506,0 104,71
AMERIKA SERIKAT/UNITED STATES 5.239,5 7.955,3 5.323,9 5.487,2 7.536,2 3,62 4.402,5 6.105,2 38,68
TURKI/TURKEY 6.548,6 6.724,3 5.990,2 5.362,8 5.676,6 -4,99 5.000,2 2.547,1 -49,06
BRASILIA/BRAZIL 6.731,9 9.112,8 8.797,6 6.715,3 7.006,1 -2,23 4.427,8 10.926,0 146,76
ZIMBABWE/ZIMBABWE 3.761,8 3.046,6 4.236,8 2.748,5 4.002,2 0,21 2.685,0 4.654,6 73,36
NEGARA LAINNYA/OTHER COUNTRIES 52.782,8 40.651,1 25.166,7 16.416,7 17.333,6 -26,90 10.013,8 25.024,0 149,90
2510 Natural calcium phosphates; natural aluminium calcium phosphates and phosphatic chalk 1.005.183,2 1.036.859,1 1.387.252,8 1.284.516,6 1.692.794,7 13,39 1.162.218,2 1.847.585,7 58,97
YORDANIA/JORDAN 583.114,0 434.636,0 683.930,0 747.639,0 1.099.732,0 19,86 649.565,0 1.210.725,0 86,39
MAROKO/MOROCCO 125.941,0 285.671,1 326.094,1 361.477,7 339.557,0 24,84 339.557,0 376.479,2 10,87
MESIR/EGYPT 294.873,7 315.260,5 375.800,0 173.966,1 252.100,0 -8,68 172.100,0 259.535,0 50,80
TAIWAN/TAIWAN, PROVINCE OF CHINA 280,5 455,1 455,7 375,8 532,0 11,50 379,5 - -
INGGRIS/UNITED KINGDOM 824,2 750,2 847,0 1.040,4 726,0 0,74 532,4 750,3 40,92
NEGARA LAINNYA/OTHER COUNTRIES 149,8 86,2 125,9 17,7 147,7 -14,88 84,3 96,3 14,27
2601 Iron ores and concentrates; including roasted iron pyrites 974.516,1 1.932.961,1 3.871.226,2 5.424.731,5 5.109.636,9 54,43 3.258.535,2 4.562.398,8 40,01
AUSTRALIA/AUSTRALIA 2.279,8 293.396,6 2.128.312,4 3.399.369,2 3.460.857,7 452,90 2.100.766,9 3.343.112,6 59,14
BRASILIA/BRAZIL 586.260,2 828.076,0 1.139.904,0 1.601.064,2 1.328.039,6 25,79 994.559,6 588.793,0 -40,80
KANADA/CANADA - - 383.640,6 235.436,7 304.927,9 - 147.969,0 264.290,5 78,61
MALAYSIA/MALAYSIA 237.470,2 182.412,6 9.261,1 23.538,9 14.881,0 -53,18 14.881,0 4.515,0 -69,66
SINGAPURA/SINGAPORE 374,0 5.147,4 966,6 720,0 381,3 -17,54 211,3 275,0 30,16
NEGARA LAINNYA/OTHER COUNTRIES 148.131,8 623.928,5 209.141,4 164.602,6 549,4 -71,43 147,4 361.412,7 245.148,37
2701 Coal; briquettes, ovoids and similar solid fuels manufactured from coal 82.464,7 510.864,1 2.274.907,3 2.815.324,8 3.565.029,3 151,93 2.301.432,8 3.306.428,8 43,67
AUSTRALIA/AUSTRALIA 74,2 464.064,1 1.956.860,3 2.303.568,7 2.602.552,7 851,88 1.633.663,2 1.849.953,3 13,24
FEDERASI RUSIA/RUSSIA FEDERATION - - 41.320,0 55.000,0 364.831,0 - 233.831,0 373.895,0 59,90
R.R. TIONGKOK/CHINA 6.952,0 1.941,2 55.823,7 86.325,3 245.644,2 198,16 158.611,8 290.371,0 83,07
SINGAPURA/SINGAPORE 260,8 12,0 44.989,0 54.087,0 146.758,5 722,83 146.758,5 77.934,0 -46,90
AMERIKA SERIKAT/UNITED STATES 1.610,0 2.476,8 2.248,8 2.265,3 72.723,4 112,37 400,5 41.325,1 10.217,48
NEGARA LAINNYA/OTHER COUNTRIES 73.567,7 42.369,9 173.665,5 314.078,5 132.519,5 37,44 128.167,8 672.950,3 425,05
2803 Carbon; carbon blacks and other forms of carbon n.e.c. 154.115,4 179.575,6 200.413,4 188.409,7 230.960,0 8,95 152.720,8 215.960,2 41,41
R.R. TIONGKOK/CHINA 97.524,6 106.289,3 118.400,5 112.780,4 132.053,1 6,88 85.561,1 126.292,1 47,60
KOREA SELATAN/SOUTH OF KOREA 17.731,9 28.934,4 34.475,2 37.205,8 61.647,8 31,57 43.101,9 54.038,8 25,37
THAILAND/THAILAND 4.393,0 5.950,2 11.074,6 8.258,2 17.217,4 35,79 10.375,8 15.649,6 50,83
JEPANG/JAPAN 2.632,3 3.338,0 3.716,1 4.098,9 5.062,1 16,34 3.150,8 4.456,6 41,44
INDIA/INDIA 11.890,5 8.527,3 5.207,9 5.196,0 8.362,4 -11,30 6.136,8 7.917,4 29,01
NEGARA LAINNYA/OTHER COUNTRIES 19.943,1 26.536,5 27.539,3 20.870,4 6.617,0 -21,70 4.394,4 7.605,8 73,08
129

Lanjutan/Continued
Volume/Volume : Ton
2016 Trend (%)
12-16
Jan-Ags/Jan-AugJENIS BARANG DESCRIPTION OF
GOODS2015
No. 08.05.148
Perub. (%)
Change (%)
16-172016 2017
2012 2013 2014
TABEL 20.1 : VOLUME IMPOR 190 JENIS BARANG MENURUT NEGARA ASAL UTAMA
IMPORT VOLUME OF 190 COMMODITIES BY MAIN COUNTRY OF ORIGIN
KODE
CODE
HS
2818 Aluminium oxide (including artificial corundum); aluminium 622.335,3 663.778,3 702.875,6 597.105,8 648.677,4 -0,23 452.161,3 421.300,5 -6,83
AUSTRALIA/AUSTRALIA 557.480,4 540.467,2 619.114,4 502.799,3 513.683,2 -2,33 366.080,2 372.031,3 1,63
INDIA/INDIA 19.495,5 24.928,7 27.273,8 48.077,6 60.386,9 33,88 30.481,9 8.634,2 -71,67
R.R. TIONGKOK/CHINA 13.966,6 15.656,3 14.574,1 11.642,3 25.549,7 9,55 21.111,3 10.247,0 -51,46
JEPANG/JAPAN 9.958,1 8.510,0 13.843,4 5.833,7 7.617,4 -8,73 5.737,4 6.491,5 13,14
KOREA SELATAN/SOUTH OF KOREA 7.040,7 11.769,4 11.333,4 14.632,0 8.126,9 5,18 5.788,1 7.319,7 26,46
NEGARA LAINNYA/OTHER COUNTRIES 14.394,1 62.446,8 16.736,5 14.120,9 33.313,4 1,93 22.962,4 16.576,8 -27,81
2836 Carbonates; peroxocarbonates (percarbonates); commercial ammonium carbonate
containing ammonium carbamate
1.105.085,9 1.122.702,2 1.086.618,2 1.124.221,7 1.057.002,1 -0,87 723.339,9 914.679,1 26,45
AMERIKA SERIKAT/UNITED STATES 596.907,5 646.417,3 637.328,3 655.152,8 610.906,4 0,60 439.400,6 556.013,0 26,54
R.R. TIONGKOK/CHINA 405.641,6 316.138,7 307.282,6 355.485,6 324.818,1 -3,22 201.633,4 201.422,1 -0,10
MALAYSIA/MALAYSIA 22.884,0 25.409,8 25.964,3 26.915,9 35.638,5 9,90 22.111,7 43.235,0 95,53
TAIWAN/TAIWAN, PROVINCE OF CHINA 26.649,4 21.568,9 19.449,1 20.688,2 18.544,7 -7,38 12.527,1 17.779,3 41,93
KOREA SELATAN/SOUTH OF KOREA 3.978,1 4.343,0 7.104,0 5.505,5 7.414,2 15,98 4.731,2 5.981,5 26,43
NEGARA LAINNYA/OTHER COUNTRIES 49.025,4 108.824,5 89.489,9 60.473,8 59.680,1 -1,92 42.935,8 90.248,1 110,19
2901 Acyclic hydrocarbons 1.105.224,0 899.110,9 946.903,9 1.197.039,3 898.281,1 -1,28 618.018,6 695.665,8 12,56
SAUDI ARABIA/SAUDI ARABIA 382.367,7 334.459,8 249.490,4 215.875,8 225.524,0 -13,88 144.834,3 96.640,6 -33,28
MALAYSIA/MALAYSIA 149.567,7 123.651,6 136.359,7 202.582,7 145.619,6 4,50 107.599,8 145.383,7 35,12
SINGAPURA/SINGAPORE 100.280,4 107.152,8 204.952,5 273.077,6 126.783,1 15,08 81.634,1 169.004,2 107,03
ITALIA/ITALY - - 0,0 26.735,3 96.309,3 - 54.926,9 78.462,1 42,85
THAILAND/THAILAND 74.968,2 66.355,2 54.218,4 156.360,4 65.551,6 6,06 43.779,2 69.569,6 58,91
NEGARA LAINNYA/OTHER COUNTRIES 398.040,0 267.491,5 301.882,8 322.407,6 238.493,4 -8,04 185.244,4 136.605,5 -26,26
2902 Cyclic hydrocarbons 1.065.913,8 1.152.591,4 1.316.015,8 1.275.417,1 955.516,4 -1,17 704.618,4 1.096.589,2 55,63
INDIA/INDIA 301.994,7 216.035,5 327.149,2 372.884,6 254.454,9 2,05 186.172,8 195.460,0 4,99
SINGAPURA/SINGAPORE 301.676,6 343.602,5 451.642,4 398.890,3 250.355,2 -2,21 171.248,1 630.898,5 268,41
THAILAND/THAILAND 163.933,6 267.952,7 178.763,0 157.804,7 195.630,4 -1,74 151.347,4 138.864,6 -8,25
MALAYSIA/MALAYSIA 34.465,5 27.035,2 50.837,4 72.645,4 95.866,3 35,45 66.381,4 42.619,5 -35,80
KUWAIT/KUWAIT 133.334,1 120.795,5 119.983,3 117.736,0 68.347,2 -12,73 53.095,2 19.690,0 -62,92
NEGARA LAINNYA/OTHER COUNTRIES 130.509,3 177.170,0 187.640,5 155.456,1 90.862,4 -8,19 76.373,5 69.056,6 -9,58
2905 Acyclic alcohols and their halogenated, sulphonated, nitrated or nitrosated derivatives 830.457,5 931.714,3 1.214.848,0 844.339,9 873.993,4 0,04 604.395,8 787.274,6 30,26
MALAYSIA/MALAYSIA 233.442,3 221.655,8 254.805,2 224.805,4 461.352,0 14,76 312.863,5 332.335,8 6,22
SINGAPURA/SINGAPORE 217.290,9 318.698,5 321.733,4 282.980,4 124.251,8 -11,63 65.675,8 153.358,6 133,51
SAUDI ARABIA/SAUDI ARABIA 171.973,3 146.561,9 154.216,4 104.195,4 122.813,5 -9,65 109.553,6 188.284,0 71,86
R.R. TIONGKOK/CHINA 10.352,6 23.748,6 59.827,7 11.997,5 17.989,5 4,31 14.403,4 15.577,8 8,15
JEPANG/JAPAN 23.030,0 28.857,7 20.869,4 21.008,6 17.446,1 -8,36 10.498,6 19.898,1 89,53
NEGARA LAINNYA/OTHER COUNTRIES 174.368,3 192.191,8 403.395,9 199.352,6 130.140,5 -5,34 91.400,9 77.820,3 -14,86
130

Lanjutan/Continued
Volume/Volume : Ton
2016 Trend (%)
12-16
Jan-Ags/Jan-AugJENIS BARANG DESCRIPTION OF
GOODS2015
No. 08.05.148
Perub. (%)
Change (%)
16-172016 2017
2012 2013 2014
TABEL 20.1 : VOLUME IMPOR 190 JENIS BARANG MENURUT NEGARA ASAL UTAMA
IMPORT VOLUME OF 190 COMMODITIES BY MAIN COUNTRY OF ORIGIN
KODE
CODE
HS
2915 Acids; saturated acyclic monocarboxylic acids and their anhydrides, halides, peroxides and
peroxyacids; their halogenated, sulphonated, nitrated or nitrosated derivatives
251.317,3 250.820,4 250.836,0 309.004,1 295.849,3 5,49 209.733,2 250.158,7 19,27
R.R. TIONGKOK/CHINA 59.981,0 44.419,7 49.660,3 73.355,0 89.987,8 14,03 61.281,4 93.437,4 52,47
SINGAPURA/SINGAPORE 59.264,7 72.363,6 63.268,3 97.181,5 109.816,1 16,51 75.237,1 83.278,3 10,69
MALAYSIA/MALAYSIA 71.587,6 83.169,5 103.207,4 105.683,1 69.111,6 1,71 54.984,7 46.308,1 -15,78
JEPANG/JAPAN 4.970,2 5.928,6 5.622,5 4.949,2 6.167,2 2,54 4.182,8 3.907,2 -6,59
INDIA/INDIA 3.461,6 3.866,1 3.488,7 4.482,9 3.033,7 -1,15 1.852,0 2.038,0 10,04
NEGARA LAINNYA/OTHER COUNTRIES 52.052,2 41.073,0 25.588,9 23.352,4 17.733,0 -23,80 12.195,2 21.189,6 73,75
2916 Acids; unsaturated acyclic monocarboxylic, cyclic monocarboxylic, their anhydrides, halides,
peroxides and peroxyacids; their halogenated, sulphonated, nitrated or nitrosated derivatives
97.789,8 104.536,5 106.165,1 102.420,3 107.802,4 1,76 74.038,3 94.589,2 27,76
THAILAND/THAILAND 18.299,2 14.672,7 15.627,1 22.860,1 35.937,0 19,64 24.687,6 33.051,8 33,88
R.R. TIONGKOK/CHINA 14.921,1 15.604,3 13.460,9 12.945,8 14.787,3 -2,03 9.858,8 14.157,2 43,60
SINGAPURA/SINGAPORE 12.504,6 8.406,4 13.796,2 13.883,0 16.850,5 11,61 10.736,7 12.182,3 13,46
JEPANG/JAPAN 11.328,8 10.803,7 9.906,8 8.524,8 6.245,9 -13,31 4.691,6 5.982,8 27,52
INDIA/INDIA 209,9 1.806,3 804,4 1.091,1 922,7 27,85 597,8 963,5 61,16
NEGARA LAINNYA/OTHER COUNTRIES 40.526,2 53.243,2 52.569,6 43.115,6 33.058,9 -6,00 23.465,7 28.251,6 20,40
2930 Organo-sulphur compounds 40.033,7 41.818,7 45.420,1 70.387,3 48.120,3 9,29 29.070,6 50.542,3 73,86
R.R. TIONGKOK/CHINA 4.723,7 6.441,5 6.909,0 8.430,2 11.678,5 23,11 6.892,7 12.292,9 78,35
BELGIA/BELGIUM 15.947,3 15.752,9 17.806,0 16.266,9 10.556,3 -7,62 7.516,4 11.308,5 50,45
JEPANG/JAPAN 10.089,4 9.311,0 9.804,4 8.151,9 7.128,2 -7,94 4.792,3 9.708,3 102,58
SINGAPURA/SINGAPORE 355,6 1.045,0 674,6 22.647,4 6.185,3 140,80 3.300,8 6.002,8 81,86
MALAYSIA/MALAYSIA 435,4 571,8 550,0 8.058,9 6.018,0 120,30 2.774,3 4.302,0 55,07
NEGARA LAINNYA/OTHER COUNTRIES 8.482,3 8.696,4 9.676,0 6.832,0 6.554,0 -7,29 3.794,1 6.927,8 82,59
2933 Heterocyclic compounds with nitrogen hetero-atom(s) only 95.613,8 102.960,3 93.722,8 88.099,3 90.273,5 -2,67 62.132,4 74.584,3 20,04
R.R. TIONGKOK/CHINA 38.386,0 45.699,2 40.632,0 36.611,1 39.241,2 -1,76 27.574,6 32.929,7 19,42
INDIA/INDIA 927,4 1.122,5 1.102,9 1.167,4 1.000,8 1,93 630,0 802,5 27,39
JERMAN/GERMANY 5.768,1 6.410,1 9.926,6 13.392,2 10.125,5 20,47 6.689,7 8.882,2 32,77
JEPANG/JAPAN 8.914,7 6.934,7 7.032,1 5.957,2 12.783,3 5,85 8.579,4 12.833,2 49,58
PERANCIS/FRANCE 363,1 320,3 239,5 306,8 251,7 -7,47 180,2 269,3 49,43
NEGARA LAINNYA/OTHER COUNTRIES 41.254,5 42.473,4 34.789,7 30.664,6 26.871,0 -11,16 18.478,4 18.867,3 2,10
3004 Medicaments; (not goods of heading no. 3002, 3005 or 3006) consisting of mixed or unmixed products for therapeutic or prophylactic use, put up in measured doses (incl. those in the form122.535,3 24.883,1 22.258,2 26.352,6 25.360,4 -26,60 16.324,3 22.930,0 40,47
JERMAN/GERMANY 6.162,2 2.098,2 634,5 1.639,5 1.353,5 -27,95 981,3 960,9 -2,08
AMERIKA SERIKAT/UNITED STATES 239,4 249,8 176,4 208,0 1.302,6 37,78 694,8 1.443,9 107,82
INGGRIS/UNITED KINGDOM 67.120,4 330,5 333,9 483,7 410,0 -62,53 283,6 287,7 1,42
PERANCIS/FRANCE 33.609,0 323,3 440,4 396,7 510,9 -55,82 359,9 363,9 1,12
SWISS/SWITZERLAND 201,5 239,8 243,7 431,4 439,1 23,93 384,4 222,5 -42,13
NEGARA LAINNYA/OTHER COUNTRIES 15.202,8 21.641,7 20.429,4 23.193,4 21.344,3 7,77 13.620,3 19.651,1 44,28
131

Lanjutan/Continued
Volume/Volume : Ton
2016 Trend (%)
12-16
Jan-Ags/Jan-AugJENIS BARANG DESCRIPTION OF
GOODS2015
No. 08.05.148
Perub. (%)
Change (%)
16-172016 2017
2012 2013 2014
TABEL 20.1 : VOLUME IMPOR 190 JENIS BARANG MENURUT NEGARA ASAL UTAMA
IMPORT VOLUME OF 190 COMMODITIES BY MAIN COUNTRY OF ORIGIN
KODE
CODE
HS
3102 Fertilizers; mineral or chemical, nitrogenous 1.376.007,6 1.099.908,3 1.176.909,2 1.416.193,0 1.663.137,4 6,52 1.087.801,7 1.046.773,0 -3,77
R.R. TIONGKOK/CHINA 430.700,7 546.828,3 754.641,0 1.241.979,4 1.567.909,6 40,56 1.030.834,4 927.687,9 -10,01
KOREA SELATAN/SOUTH OF KOREA 326.675,2 318.216,0 239.121,9 47.192,0 27.658,8 -49,57 20.980,0 50.927,4 142,74
AUSTRALIA/AUSTRALIA 45.950,4 12.679,2 25.811,3 40.668,2 7.769,8 -21,25 5.222,2 636,3 -87,81
FEDERASI RUSIA/RUSSIA FEDERATION 128.109,6 3.968,8 1.225,0 350,0 7.937,5 -55,03 6.367,5 1.449,0 -77,24
TAIWAN/TAIWAN, PROVINCE OF CHINA 42.371,3 29.376,7 10,7 6.175,0 25.020,0 -23,00 12.080,0 18.628,0 54,21
NEGARA LAINNYA/OTHER COUNTRIES 402.200,4 188.839,5 156.099,3 79.828,4 26.841,6 -46,61 12.317,6 47.444,4 285,18
3103 Fertilizers; mineral or chemical, phosphatic 1.971.120,9 1.153.046,4 1.803.616,3 1.920.342,5 1.738.406,5 2,62 1.222.527,8 1.799.624,5 47,21
R.R. TIONGKOK/CHINA 711.691,9 378.541,2 690.772,3 822.885,5 642.054,1 5,87 473.702,0 729.445,7 53,99
MESIR/EGYPT 862.297,8 378.624,9 707.114,0 644.279,4 624.756,9 -1,12 395.714,4 580.625,2 46,73
AUSTRALIA/AUSTRALIA 233.900,0 195.362,0 197.617,0 292.804,0 291.525,0 8,82 179.345,0 267.172,0 48,97
PERU/PERU 106.829,3 134.436,0 109.963,0 107.173,7 110.000,0 -1,67 110.000,0 165.000,0 50,00
SINGAPURA/SINGAPORE - - - - 15.000,0 - 15.000,0 2.000,0 -86,67
NEGARA LAINNYA/OTHER COUNTRIES 56.402,0 66.082,3 98.150,0 53.200,0 55.070,5 -2,61 48.766,3 55.381,6 13,57
3104 Fertilizers; mineral or chemical, potassic 2.517.756,9 2.299.330,7 2.950.703,4 2.961.050,0 2.666.330,4 3,74 1.910.077,8 2.850.988,0 49,26
KANADA/CANADA 1.323.428,0 1.335.025,9 1.407.044,1 1.399.367,8 1.219.708,0 -1,15 827.686,0 1.115.624,0 34,79
FEDERASI RUSIA/RUSSIA FEDERATION 572.765,4 135.397,6 574.711,2 633.498,4 622.535,6 18,65 450.895,5 567.340,6 25,83
BELARUS/BELARUS 132.332,4 271.951,3 624.232,9 652.280,5 517.638,9 43,37 403.564,5 563.332,2 39,59
JERMAN/GERMANY 161.680,9 166.617,3 135.083,4 158.284,4 118.350,9 -6,53 75.756,4 196.515,3 159,40
YORDANIA/JORDAN 268.747,0 359.180,1 170.285,2 107.102,6 105.034,4 -26,57 96.915,8 224.350,0 131,49
NEGARA LAINNYA/OTHER COUNTRIES 58.803,1 31.158,5 39.346,5 10.516,3 83.062,6 -3,88 55.259,6 183.825,9 232,66
3105 Fertilizers; mineral or chemical, containing 2 or 3 of the elements nitrogen, phosphorus,
potassium; other fertilisers; goods of chapter 31 in tablets or packages of gross weight not
exceeding
654.395,4 430.886,4 719.655,9 1.063.861,3 810.321,7 14,24 595.053,7 971.444,7 63,25
MALAYSIA/MALAYSIA 148.619,2 97.389,2 223.612,6 337.323,6 299.064,3 30,22 199.627,7 251.691,2 26,08
R.R. TIONGKOK/CHINA 217.725,4 125.826,8 224.316,4 368.417,1 258.691,9 15,25 208.635,7 356.590,8 70,92
NORWEGIA/NORWAY 126.669,0 85.670,9 148.621,1 144.904,5 96.044,2 -0,28 71.109,9 11.818,4 -83,38
FEDERASI RUSIA/RUSSIA FEDERATION 67.316,2 52.030,5 58.261,8 33.976,0 81.371,0 -0,47 57.850,8 217.285,7 275,60
BELGIA/BELGIUM 22.409,1 32.296,4 36.818,2 30.824,8 41.446,3 12,56 26.254,5 52.450,4 99,78
NEGARA LAINNYA/OTHER COUNTRIES 71.656,5 37.672,7 28.025,9 148.415,5 33.704,1 -1,37 31.575,1 81.608,3 158,46
3204 Synthetic organic colouring matter and preparations based thereon; synthetic organic
products used as fluorescent brightening agents or as luminophores; whether or not
chemically
69.645,9 77.883,3 79.006,5 68.133,6 74.885,9 0,11 52.875,5 62.987,0 19,12
R.R. TIONGKOK/CHINA 37.274,0 42.055,7 41.859,0 37.875,0 41.413,2 1,06 30.016,5 31.806,7 5,96
INDIA/INDIA 10.808,4 14.317,2 15.347,9 13.628,0 16.608,1 8,43 11.648,8 15.676,1 34,57
KOREA SELATAN/SOUTH OF KOREA 3.912,7 4.597,9 4.220,5 3.231,9 3.645,1 -4,82 2.519,1 2.842,3 12,83
TAIWAN/TAIWAN, PROVINCE OF CHINA 4.282,1 4.448,9 3.525,8 2.744,4 3.229,1 -9,95 2.274,3 2.324,6 2,21
JEPANG/JAPAN 1.804,1 1.737,1 1.591,3 1.107,8 1.348,1 -9,81 901,9 1.073,5 19,02
NEGARA LAINNYA/OTHER COUNTRIES 11.564,5 10.726,5 12.462,1 9.546,5 8.642,3 -6,75 5.514,8 9.263,9 67,98
132

Lanjutan/Continued
Volume/Volume : Ton
2016 Trend (%)
12-16
Jan-Ags/Jan-AugJENIS BARANG DESCRIPTION OF
GOODS2015
No. 08.05.148
Perub. (%)
Change (%)
16-172016 2017
2012 2013 2014
TABEL 20.1 : VOLUME IMPOR 190 JENIS BARANG MENURUT NEGARA ASAL UTAMA
IMPORT VOLUME OF 190 COMMODITIES BY MAIN COUNTRY OF ORIGIN
KODE
CODE
HS
3206 Colouring matter and preparations thereof n.e.c. in heading no. 3203, 3204, 3205; inorganic
products, kind used as luminophores whether or not chemically defined
86.074,8 89.382,1 90.092,4 92.782,5 105.697,9 4,58 69.155,2 97.267,3 40,65
R.R. TIONGKOK/CHINA 32.663,0 27.606,4 32.881,7 37.599,0 46.005,0 10,45 29.898,8 42.504,4 42,16
AUSTRALIA/AUSTRALIA 9.803,7 14.677,6 14.406,0 13.182,0 14.399,4 6,84 9.375,8 11.087,6 18,26
JEPANG/JAPAN 6.287,0 5.311,2 5.484,9 5.581,2 6.804,1 2,10 4.598,3 8.188,9 78,09
TAIWAN/TAIWAN, PROVINCE OF CHINA 3.714,6 6.390,3 4.807,3 5.518,4 5.673,5 7,26 3.697,8 4.671,6 26,34
JERMAN/GERMANY 3.752,7 5.181,5 4.411,5 4.561,1 4.525,7 2,50 3.288,3 5.211,3 58,48
NEGARA LAINNYA/OTHER COUNTRIES 29.853,7 30.215,1 28.101,0 26.340,8 28.290,2 -2,42 18.296,3 25.603,7 39,94
3215 Ink; printing, writing or drawing ink and other inks; whether or not concentrated or solid 13.461,5 14.411,9 14.433,8 14.079,0 16.073,2 3,37 10.638,4 13.831,6 30,02
JEPANG/JAPAN 2.731,2 3.159,0 3.125,3 3.697,5 3.548,7 7,05 2.331,9 2.322,9 -0,39
SWISS/SWITZERLAND 118,8 104,5 93,7 54,4 141,2 -3,04 126,2 166,6 32,04
SINGAPURA/SINGAPORE 832,5 1.077,0 1.178,5 1.137,4 1.176,6 7,75 755,7 1.096,1 45,05
R.R. TIONGKOK/CHINA 3.759,9 4.301,8 3.898,3 3.726,5 4.625,0 2,74 2.921,7 3.829,6 31,07
AMERIKA SERIKAT/UNITED STATES 295,9 306,1 227,6 158,7 312,8 -5,31 186,8 206,0 10,27
NEGARA LAINNYA/OTHER COUNTRIES 5.723,2 5.463,4 5.910,4 5.304,5 6.268,9 1,54 4.316,0 6.210,4 43,89
3302 Odoriferous substances and mixtures (including alcoholic solutions) with a basis of one or
more of these substances, of a kind used as raw materials in industry; other preparations
based
22.744,1 27.928,6 29.361,8 24.630,1 26.482,8 1,80 18.320,2 21.863,3 19,34
SINGAPURA/SINGAPORE 9.427,9 13.375,1 13.896,7 13.271,0 14.617,4 9,08 10.165,5 12.473,2 22,70
AMERIKA SERIKAT/UNITED STATES 2.857,3 2.553,7 1.381,7 1.397,1 1.679,1 -15,35 1.166,5 1.210,6 3,78
SWISS/SWITZERLAND 982,1 1.312,9 1.339,3 1.072,1 777,7 -6,47 533,3 417,8 -21,66
JEPANG/JAPAN 653,9 659,0 736,0 597,5 742,9 1,59 455,2 592,2 30,09
R.R. TIONGKOK/CHINA 2.655,8 2.805,5 2.641,4 1.770,6 1.820,9 -11,44 1.205,2 1.895,8 57,30
NEGARA LAINNYA/OTHER COUNTRIES 6.167,2 7.222,4 9.366,7 6.521,8 6.844,8 1,07 4.794,5 5.273,7 10,00
3304 Cosmetic and toilet preparations; beauty, make-up and skin care preparations (excluding
medicaments, including sunscreen or sun tan preparations), manicure or pedicure
preparations
11.032,4 10.611,6 10.932,9 13.724,6 9.629,2 -0,15 6.369,2 9.607,0 50,84
JEPANG/JAPAN 261,6 296,2 265,7 216,5 259,2 -3,26 174,8 282,1 61,38
AMERIKA SERIKAT/UNITED STATES 685,3 645,8 604,2 646,1 740,7 1,57 481,2 722,6 50,16
PERANCIS/FRANCE 246,0 402,1 356,5 5.114,9 519,0 49,72 342,9 592,2 72,74
THAILAND/THAILAND 5.571,9 4.591,0 4.874,0 2.737,3 2.194,2 -21,19 1.259,2 1.462,0 16,11
R.R. TIONGKOK/CHINA 377,1 450,4 494,0 469,3 662,6 12,40 422,2 1.251,8 196,52
NEGARA LAINNYA/OTHER COUNTRIES 3.890,6 4.226,1 4.338,6 4.540,4 5.253,5 6,96 3.688,9 5.296,3 43,57
3402 Organic surface-active agents (not soap); surface-active, washing (including auxiliary
washing) and cleaning preparations, containing soap or not, excluding those of heading no.
3401
115.988,7 120.074,4 130.548,2 129.761,9 116.254,6 0,83 78.738,0 105.507,6 34,00
R.R. TIONGKOK/CHINA 16.445,7 19.605,1 20.763,8 19.146,7 25.506,7 8,92 17.888,7 24.484,8 36,87
JEPANG/JAPAN 4.574,3 4.837,5 5.387,0 4.836,8 5.442,6 3,54 3.666,1 4.907,1 33,85
SINGAPURA/SINGAPORE 13.443,0 12.077,3 15.592,8 14.632,1 10.345,4 -3,26 6.694,9 10.325,2 54,23
AMERIKA SERIKAT/UNITED STATES 11.189,6 8.075,0 7.209,1 5.808,9 6.425,3 -13,40 4.322,9 5.381,4 24,49
JERMAN/GERMANY 10.610,8 10.301,7 15.734,7 15.543,1 8.228,5 -0,97 5.901,0 6.259,1 6,07
NEGARA LAINNYA/OTHER COUNTRIES 59.725,4 65.177,7 65.860,9 69.794,3 60.306,1 0,88 40.264,4 54.150,1 34,49
133

Lanjutan/Continued
Volume/Volume : Ton
2016 Trend (%)
12-16
Jan-Ags/Jan-AugJENIS BARANG DESCRIPTION OF
GOODS2015
No. 08.05.148
Perub. (%)
Change (%)
16-172016 2017
2012 2013 2014
TABEL 20.1 : VOLUME IMPOR 190 JENIS BARANG MENURUT NEGARA ASAL UTAMA
IMPORT VOLUME OF 190 COMMODITIES BY MAIN COUNTRY OF ORIGIN
KODE
CODE
HS
3506 Prepared glues and other prepared adhesives, n.e.c. or included; products suitable for use as
glues or adhesives, put up for retail sale as glues or adhesives, not exceeding 1kg net weight
not over 1k
47.376,1 55.513,7 57.622,5 59.841,9 60.546,0 5,82 40.636,5 67.330,2 65,69
R.R. TIONGKOK/CHINA 9.460,3 12.009,5 13.146,8 12.917,4 18.363,0 15,02 11.958,7 16.345,1 36,68
MALAYSIA/MALAYSIA 8.777,7 11.071,6 10.055,0 11.062,8 12.349,5 7,06 8.372,2 11.005,6 31,46
JEPANG/JAPAN 3.501,0 3.555,3 3.380,0 5.288,0 2.446,2 -3,15 1.634,5 2.676,4 63,75
KOREA SELATAN/SOUTH OF KOREA 3.909,4 4.466,9 4.255,6 5.066,8 4.172,1 2,59 2.845,2 3.340,3 17,40
SINGAPURA/SINGAPORE 3.169,1 3.590,3 5.559,7 4.912,8 4.194,3 9,13 2.909,7 2.643,2 -9,16
NEGARA LAINNYA/OTHER COUNTRIES 18.558,5 20.820,2 21.225,4 20.594,2 19.020,9 0,38 12.916,3 31.319,5 142,48
3808 Insecticides, rodenticides, fungicides, herbicides, anti-sprouting products, plant growth
regulators, disinfectants and the like, put up in forms or packings for retail sale or as
preparations or form
58.063,5 69.308,5 71.982,3 72.636,8 99.544,9 11,91 58.379,1 96.321,5 64,99
R.R. TIONGKOK/CHINA 21.011,2 32.833,5 35.236,9 39.127,9 57.298,4 24,38 31.061,5 53.212,0 71,31
AMERIKA SERIKAT/UNITED STATES 2.850,2 3.223,1 2.955,7 2.580,3 2.203,4 -7,11 1.431,8 2.239,0 56,38
SINGAPURA/SINGAPORE 1.356,2 1.288,0 2.516,7 2.365,8 2.657,7 21,58 2.062,2 2.477,3 20,13
INDIA/INDIA 4.020,4 5.448,2 6.872,1 5.977,4 7.233,5 13,51 4.444,1 9.708,4 118,46
MALAYSIA/MALAYSIA 16.924,7 16.756,8 15.517,6 13.148,9 18.314,4 -0,84 11.390,1 16.141,2 41,71
NEGARA LAINNYA/OTHER COUNTRIES 11.900,7 9.758,9 8.883,3 9.436,6 11.837,5 -0,44 7.989,5 12.543,7 57,00
3811 Anti-knock preparations, oxidation and gum inhibitors, viscosity improvers, anti-corrosive
preparations and the like, for mineral oils (including gasoline) or other liquids used for the
same
60.378,9 65.254,7 63.073,8 62.153,2 69.173,5 2,26 43.319,1 66.409,3 53,30
AMERIKA SERIKAT/UNITED STATES 30.250,0 30.548,4 25.604,4 24.037,6 22.856,0 -7,69 14.597,3 14.189,2 -2,80
SINGAPURA/SINGAPORE 12.382,4 19.931,2 21.856,3 23.083,6 27.266,2 18,83 17.468,7 29.238,8 67,38
JEPANG/JAPAN 1.569,4 1.323,0 3.532,5 3.422,2 4.161,3 33,65 2.781,5 3.854,4 38,57
R.R. TIONGKOK/CHINA 1.475,1 1.590,3 916,5 922,7 3.681,3 13,71 1.625,2 4.371,3 168,97
INDIA/INDIA 1.042,9 1.088,9 1.287,5 2.122,9 2.443,8 26,75 1.559,7 2.066,2 32,47
NEGARA LAINNYA/OTHER COUNTRIES 13.659,0 10.772,9 9.876,5 8.564,1 8.764,9 -10,57 5.286,7 12.689,4 140,02
3812 Prepared rubber accelerators; compound plasticisers for rubber or plastics, n.e.c. or
included; anti-oxidising preparations and other compound stabilisers for rubber or plastics
66.132,3 71.259,9 72.759,1 73.181,4 75.243,6 2,89 49.464,8 63.494,5 28,36
R.R. TIONGKOK/CHINA 22.610,5 26.205,4 28.213,0 26.035,2 26.171,9 2,90 17.785,1 21.337,8 19,98
MALAYSIA/MALAYSIA 7.539,5 7.999,4 10.115,6 12.089,7 11.832,8 14,05 7.721,1 9.115,1 18,05
TAIWAN/TAIWAN, PROVINCE OF CHINA 10.965,1 9.829,9 9.763,2 9.963,4 10.779,1 -0,21 7.063,7 8.980,0 27,13
JEPANG/JAPAN 3.321,2 2.817,8 3.001,5 3.101,8 3.819,5 3,83 2.446,4 2.720,9 11,22
KOREA SELATAN/SOUTH OF KOREA 5.615,9 5.829,3 5.403,9 5.364,2 4.812,4 -3,84 3.550,0 4.191,6 18,07
NEGARA LAINNYA/OTHER COUNTRIES 16.080,0 18.578,2 16.261,9 16.627,1 17.827,9 0,96 10.898,4 17.149,2 57,35
3824 Prepared binders for foundry moulds or cores; chemical products and preparations of the
chemical or allied industries (including those consisting of mixtures of natural products), not
elsewhere
103.070,0 106.155,0 144.676,7 116.441,3 131.723,1 6,00 84.550,2 133.636,8 58,06
R.R. TIONGKOK/CHINA 34.013,3 40.237,1 45.276,6 40.357,7 55.134,4 10,18 34.017,2 55.504,3 63,17
JEPANG/JAPAN 7.040,5 7.597,3 43.379,4 14.058,0 6.230,5 3,78 4.324,5 5.435,9 25,70
SINGAPURA/SINGAPORE 8.673,4 9.136,1 10.056,6 14.150,0 20.659,0 24,27 13.746,6 19.684,7 43,20
THAILAND/THAILAND 8.532,6 8.112,8 5.968,8 6.037,7 5.962,8 -9,63 4.010,9 6.620,9 65,07
JERMAN/GERMANY 3.804,9 4.338,4 3.792,0 3.772,7 4.639,0 2,60 3.346,3 4.122,7 23,20
NEGARA LAINNYA/OTHER COUNTRIES 41.005,2 36.733,3 36.203,3 38.065,2 39.097,3 -0,59 25.104,8 42.268,4 68,37
134

Lanjutan/Continued
Volume/Volume : Ton
2016 Trend (%)
12-16
Jan-Ags/Jan-AugJENIS BARANG DESCRIPTION OF
GOODS2015
No. 08.05.148
Perub. (%)
Change (%)
16-172016 2017
2012 2013 2014
TABEL 20.1 : VOLUME IMPOR 190 JENIS BARANG MENURUT NEGARA ASAL UTAMA
IMPORT VOLUME OF 190 COMMODITIES BY MAIN COUNTRY OF ORIGIN
KODE
CODE
HS
3901 Polymers of ethylene, in primary forms 773.450,3 840.854,9 883.385,7 1.020.117,2 1.034.921,8 8,07 689.375,6 895.605,2 29,92
SINGAPURA/SINGAPORE 174.373,2 207.726,5 228.427,1 243.578,5 235.472,6 7,90 157.984,7 216.928,3 37,31
THAILAND/THAILAND 168.845,0 193.744,0 195.847,0 192.298,9 218.657,5 5,23 148.849,0 185.710,8 24,76
MALAYSIA/MALAYSIA 127.820,6 128.870,1 139.430,9 208.732,7 204.810,2 15,32 133.168,8 181.743,3 36,48
SAUDI ARABIA/SAUDI ARABIA 74.164,8 70.602,3 87.023,7 111.614,9 125.638,3 16,33 81.182,9 105.010,6 29,35
JEPANG/JAPAN 26.946,9 35.068,2 33.401,2 38.586,8 43.092,6 10,90 28.789,3 29.999,2 4,20
NEGARA LAINNYA/OTHER COUNTRIES 201.299,7 204.843,8 199.255,8 225.305,4 207.250,6 1,55 139.401,0 176.213,0 26,41
3902 Polymers of propylene or of other olefins, in primary forms 854.280,8 916.699,7 946.469,9 908.118,6 1.062.321,5 4,36 674.830,4 899.796,6 33,34
SINGAPURA/SINGAPORE 232.358,8 247.051,6 284.236,7 286.490,2 315.385,3 7,89 205.982,7 271.097,3 31,61
THAILAND/THAILAND 134.820,8 163.693,5 161.336,9 143.305,3 168.269,9 3,15 105.044,5 152.748,7 45,41
SAUDI ARABIA/SAUDI ARABIA 112.321,7 121.176,9 143.860,8 126.397,5 153.742,0 6,93 90.730,8 128.843,1 42,01
MALAYSIA/MALAYSIA 134.290,5 112.344,5 95.922,9 91.280,9 83.620,3 -10,91 56.984,8 46.149,3 -19,01
KOREA SELATAN/SOUTH OF KOREA 76.523,5 84.814,9 83.342,0 64.249,7 72.865,3 -3,69 46.809,1 71.281,6 52,28
NEGARA LAINNYA/OTHER COUNTRIES 163.965,6 187.618,3 177.770,6 196.395,0 268.438,7 10,87 169.278,5 229.676,5 35,68
3903 Polymers of styrene, in primary forms 201.355,6 200.517,2 204.940,5 172.458,1 196.888,1 -1,94 126.947,8 166.080,5 30,83
KOREA SELATAN/SOUTH OF KOREA 68.507,9 68.022,7 67.315,6 52.510,4 54.489,6 -6,92 36.344,6 44.491,3 22,41
MALAYSIA/MALAYSIA 50.072,7 48.338,4 44.100,1 36.920,2 41.747,8 -6,14 29.019,8 30.671,9 5,69
SINGAPURA/SINGAPORE 39.020,1 30.652,3 26.659,5 22.967,0 30.542,8 -7,49 18.737,2 29.605,4 58,00
JEPANG/JAPAN 17.532,4 17.293,3 17.726,5 18.607,4 20.529,6 3,97 13.029,2 17.739,8 36,15
TAIWAN/TAIWAN, PROVINCE OF CHINA 14.880,9 17.092,8 19.907,5 18.705,5 24.863,1 11,82 15.717,6 19.373,2 23,26
NEGARA LAINNYA/OTHER COUNTRIES 11.341,4 19.117,7 29.231,4 22.747,6 24.715,3 18,91 14.099,3 24.199,1 71,63
3906 Acrylic polymers in primary forms 97.156,1 105.463,6 100.003,6 84.972,3 101.483,4 -1,28 67.673,2 91.037,8 34,53
R.R. TIONGKOK/CHINA 12.576,0 21.995,3 23.525,6 17.324,6 25.300,7 12,29 15.926,1 26.806,4 68,32
SINGAPURA/SINGAPORE 19.100,0 13.695,7 10.794,6 12.887,8 18.971,3 -0,74 12.283,0 17.233,8 40,31
JEPANG/JAPAN 25.571,9 26.146,7 17.465,9 13.131,4 11.695,0 -20,18 9.054,1 7.778,0 -14,09
THAILAND/THAILAND 9.787,4 12.088,5 14.571,4 10.180,4 9.583,6 -2,12 5.784,7 9.314,8 61,03
KOREA SELATAN/SOUTH OF KOREA 5.099,7 5.745,2 6.235,0 5.324,8 6.320,4 3,60 4.559,9 4.325,4 -5,14
NEGARA LAINNYA/OTHER COUNTRIES 25.021,1 25.792,1 27.411,2 26.123,3 29.612,3 3,56 20.065,4 25.579,4 27,48
3907 Polyacetals, other polyethers and epoxide resins, in primary forms; polycarbonates, alkyd
resins, polyallyl esters and other polyesters, in primary forms
367.696,3 403.274,2 409.861,4 445.953,4 490.351,6 7,00 325.994,2 393.005,4 20,56
R.R. TIONGKOK/CHINA 70.415,1 119.529,6 131.295,1 167.831,8 197.165,5 27,11 130.428,5 149.799,1 14,85
THAILAND/THAILAND 52.118,8 55.471,8 54.503,2 56.284,1 63.131,6 4,06 40.875,7 57.853,1 41,53
KOREA SELATAN/SOUTH OF KOREA 99.354,6 98.305,0 79.665,7 71.245,0 82.119,4 -6,79 55.798,9 68.996,3 23,65
JEPANG/JAPAN 23.702,3 23.307,3 26.320,4 27.134,3 29.790,8 6,28 19.780,2 28.142,5 42,28
SINGAPURA/SINGAPORE 65.521,3 44.150,3 43.441,1 40.596,7 36.683,2 -11,70 20.556,5 21.789,6 6,00
NEGARA LAINNYA/OTHER COUNTRIES 56.584,1 62.510,2 74.635,9 82.861,4 81.461,1 10,63 58.554,4 66.424,8 13,44
135

Lanjutan/Continued
Volume/Volume : Ton
2016 Trend (%)
12-16
Jan-Ags/Jan-AugJENIS BARANG DESCRIPTION OF
GOODS2015
No. 08.05.148
Perub. (%)
Change (%)
16-172016 2017
2012 2013 2014
TABEL 20.1 : VOLUME IMPOR 190 JENIS BARANG MENURUT NEGARA ASAL UTAMA
IMPORT VOLUME OF 190 COMMODITIES BY MAIN COUNTRY OF ORIGIN
KODE
CODE
HS
3908 Polyamides in primary forms 71.867,9 76.899,8 79.170,2 77.051,8 85.676,4 3,60 56.639,7 74.745,5 31,97
AMERIKA SERIKAT/UNITED STATES 25.447,1 34.705,7 32.073,3 28.981,7 29.358,9 1,06 19.879,9 23.115,4 16,27
THAILAND/THAILAND 11.037,2 12.512,4 13.319,7 12.203,5 13.027,8 3,11 8.550,3 11.014,2 28,82
JEPANG/JAPAN 3.373,8 2.579,4 2.774,9 3.839,5 4.827,7 11,79 2.996,4 4.039,8 34,82
TAIWAN/TAIWAN, PROVINCE OF CHINA 7.252,2 4.884,7 12.896,3 12.124,3 14.825,5 26,35 10.929,5 10.493,6 -3,99
R.R. TIONGKOK/CHINA 3.628,8 3.464,9 3.587,6 5.552,3 9.094,2 25,97 4.096,9 11.363,3 177,36
NEGARA LAINNYA/OTHER COUNTRIES 21.128,8 18.752,7 14.518,3 14.350,6 14.542,4 -9,65 10.186,6 14.719,2 44,50
3909 Amino-resins, phenolic resins and polyurethanes, in primary forms 80.372,6 94.958,1 88.857,7 90.031,7 97.257,9 3,34 62.578,4 83.277,6 33,08
R.R. TIONGKOK/CHINA 16.405,7 22.327,0 20.514,6 23.083,5 28.949,7 12,40 18.207,0 26.485,7 45,47
TAIWAN/TAIWAN, PROVINCE OF CHINA 7.601,8 11.276,9 8.260,2 9.896,7 10.356,1 5,00 7.169,0 7.429,6 3,64
KOREA SELATAN/SOUTH OF KOREA 10.337,2 13.348,4 13.160,8 11.950,0 10.601,8 -0,60 6.815,6 6.781,8 -0,50
JEPANG/JAPAN 4.800,0 4.877,3 6.368,6 6.514,1 7.609,7 12,87 4.960,6 7.847,4 58,19
SINGAPURA/SINGAPORE 6.402,8 6.067,7 6.433,4 6.486,4 6.985,9 2,44 4.575,1 6.798,9 48,61
NEGARA LAINNYA/OTHER COUNTRIES 34.825,1 37.060,7 34.120,1 32.100,9 32.754,7 -2,63 20.851,0 27.934,1 33,97
3919 Self-adhesive plates, sheets, film, foil, tape, strip and other flat shapes, of plastics, whether
or not in rolls
85.878,7 58.015,0 68.735,4 58.372,1 74.480,5 -2,75 48.930,6 64.763,8 32,36
R.R. TIONGKOK/CHINA 21.796,7 19.249,6 21.235,1 21.343,7 31.766,1 8,94 20.565,1 24.476,7 19,02
JEPANG/JAPAN 2.378,0 2.190,2 8.799,7 2.590,4 3.033,7 6,77 2.092,6 3.086,3 47,49
MALAYSIA/MALAYSIA 23.818,1 15.187,1 18.510,0 16.812,5 19.574,1 -2,87 12.689,1 19.159,0 50,99
SINGAPURA/SINGAPORE 1.994,6 2.175,1 2.551,6 2.354,8 3.610,1 13,50 2.496,0 2.734,8 9,56
AMERIKA SERIKAT/UNITED STATES 932,8 895,7 564,9 942,4 672,0 -5,87 425,3 790,5 85,87
NEGARA LAINNYA/OTHER COUNTRIES 34.958,3 18.317,5 17.074,0 14.328,2 15.824,4 -16,73 10.662,3 14.516,4 36,15
3920 Plastics; plates, sheets, film, foil and strip (not self-adhesive); non-cellular and not reinforced, laminated, supported or similarly combined with other materials, n.e.c. in chapter 39178.251,5 189.785,4 170.293,4 181.887,6 242.187,2 5,87 163.279,9 206.495,0 26,47
R.R. TIONGKOK/CHINA 62.436,2 63.882,8 65.228,0 86.640,5 123.138,3 18,09 80.989,4 99.371,1 22,70
THAILAND/THAILAND 19.429,8 35.035,8 33.971,6 35.313,8 39.501,9 15,34 28.723,2 28.693,0 -0,11
MALAYSIA/MALAYSIA 21.685,6 20.760,7 19.526,2 20.613,4 24.389,3 2,30 16.783,0 32.278,6 92,33
JEPANG/JAPAN 7.439,2 5.134,3 8.797,0 4.345,2 4.658,8 -10,44 3.116,7 4.092,8 31,32
VIETNAM/VIET NAM 20.769,6 19.662,8 15.732,2 11.322,7 20.317,5 -5,79 13.775,8 17.077,4 23,97
NEGARA LAINNYA/OTHER COUNTRIES 46.491,1 45.308,9 27.038,3 23.652,1 30.181,4 -14,05 19.891,8 24.982,0 25,59
3921 Plastic plates, sheets, film, foil and strip n.e.c. in chapter 39 127.130,1 126.869,3 135.003,6 126.924,4 154.542,3 3,99 97.829,1 124.666,8 27,43
R.R. TIONGKOK/CHINA 96.321,2 95.703,8 99.538,8 94.935,5 121.270,6 4,63 76.758,4 98.211,0 27,95
KOREA SELATAN/SOUTH OF KOREA 3.604,1 5.005,4 6.528,3 6.185,3 8.579,7 21,49 5.453,4 6.697,1 22,81
THAILAND/THAILAND 2.421,4 3.872,0 3.183,9 3.356,3 4.525,7 11,72 2.482,6 2.227,1 -10,29
JEPANG/JAPAN 1.626,3 1.267,6 1.110,3 1.016,7 1.267,2 -6,94 762,2 1.082,7 42,06
VIETNAM/VIET NAM 875,9 1.016,6 3.269,8 2.308,3 2.294,7 31,60 1.519,9 1.835,2 20,74
NEGARA LAINNYA/OTHER COUNTRIES 22.281,1 20.003,8 21.372,6 19.122,2 16.604,4 -6,14 10.852,6 14.613,7 34,66
136

Lanjutan/Continued
Volume/Volume : Ton
2016 Trend (%)
12-16
Jan-Ags/Jan-AugJENIS BARANG DESCRIPTION OF
GOODS2015
No. 08.05.148
Perub. (%)
Change (%)
16-172016 2017
2012 2013 2014
TABEL 20.1 : VOLUME IMPOR 190 JENIS BARANG MENURUT NEGARA ASAL UTAMA
IMPORT VOLUME OF 190 COMMODITIES BY MAIN COUNTRY OF ORIGIN
KODE
CODE
HS
3923 Plastic articles for the conveyance or packing of goods; stoppers, lids, caps and other
closures of plastics
86.383,7 100.365,0 102.292,1 107.224,1 101.422,4 3,95 66.359,5 85.621,9 29,03
R.R. TIONGKOK/CHINA 16.051,9 17.169,0 21.902,2 21.810,0 29.885,2 15,98 18.931,8 21.935,8 15,87
MALAYSIA/MALAYSIA 24.690,2 31.681,0 30.939,3 37.660,1 28.678,4 4,84 18.382,0 23.632,4 28,56
JEPANG/JAPAN 14.953,5 16.040,1 17.480,9 18.819,6 19.281,0 6,91 12.803,5 17.504,9 36,72
SINGAPURA/SINGAPORE 4.960,4 7.511,0 7.146,6 6.243,1 4.560,4 -3,47 3.196,2 3.600,1 12,64
THAILAND/THAILAND 10.067,9 10.838,1 9.479,1 6.203,4 5.894,2 -15,03 3.934,3 5.276,3 34,11
NEGARA LAINNYA/OTHER COUNTRIES 15.659,9 17.125,8 15.344,0 16.487,8 13.123,2 -3,84 9.111,7 13.672,4 50,05
3926 Articles of plastics and articles of other materials of heading no. 3901 to 3914, n.e.c. in
chapter 39
70.419,7 75.168,6 80.239,4 82.631,2 99.070,6 8,08 65.929,3 76.288,0 15,71
R.R. TIONGKOK/CHINA 36.047,4 37.450,4 39.623,3 42.192,3 56.815,2 10,84 37.356,2 43.610,6 16,74
JEPANG/JAPAN 4.081,8 6.716,7 6.728,9 6.523,0 7.338,6 12,12 4.838,5 5.697,9 17,76
SINGAPURA/SINGAPORE 8.021,7 8.272,2 9.134,3 9.237,9 8.632,9 2,61 6.341,7 8.115,6 27,97
HONGKONG/HONG KONG 3.436,6 3.282,1 3.619,6 4.802,6 4.350,4 8,90 2.848,4 3.837,1 34,71
AMERIKA SERIKAT/UNITED STATES 2.600,7 3.246,3 5.190,3 2.542,8 2.176,9 -5,82 1.589,4 1.040,1 -34,56
NEGARA LAINNYA/OTHER COUNTRIES 16.231,5 16.200,8 15.943,0 17.332,6 19.756,7 4,71 12.955,1 13.986,7 7,96
4002 Synthetic rubber and factice derived from oils, in primary forms or in plates, sheets or strip;
mixtures of heading no. 4001 and 4002, in primary forms or in plates, sheets or strip
295.823,8 293.054,9 294.207,3 317.829,6 335.810,1 3,40 223.719,8 296.455,1 32,51
KOREA SELATAN/SOUTH OF KOREA 131.860,2 132.250,5 130.780,2 131.157,9 163.809,9 4,35 111.109,0 141.243,3 27,12
JEPANG/JAPAN 48.072,1 53.242,0 55.250,3 62.366,3 48.670,8 1,85 32.388,7 45.798,5 41,40
SINGAPURA/SINGAPORE 4.029,5 2.399,4 2.507,1 6.962,9 15.342,3 45,34 9.816,0 12.916,0 31,58
TAIWAN/TAIWAN, PROVINCE OF CHINA 26.540,6 22.071,2 16.687,2 21.769,5 21.804,7 -3,99 13.726,5 17.928,6 30,61
AMERIKA SERIKAT/UNITED STATES 12.362,4 11.568,8 12.186,7 11.834,8 12.875,7 1,05 8.951,7 9.474,0 5,83
NEGARA LAINNYA/OTHER COUNTRIES 72.959,1 71.523,1 76.795,8 83.738,4 73.306,7 1,69 47.727,8 69.094,7 44,77
4011 New pneumatic tyres, of rubber 141.642,2 144.226,5 176.308,2 131.223,0 201.664,6 6,31 96.945,6 115.177,2 18,81
JEPANG/JAPAN 41.347,8 33.293,9 37.509,6 29.638,8 28.992,4 -7,93 16.200,7 31.967,7 97,32
R.R. TIONGKOK/CHINA 47.387,9 61.271,0 54.996,6 53.956,1 114.942,2 17,88 42.701,1 38.063,4 -10,86
THAILAND/THAILAND 10.206,4 12.352,6 36.525,3 18.216,2 23.678,1 23,02 14.839,9 20.280,8 36,66
INDIA/INDIA 14.548,2 16.881,1 14.484,3 12.591,0 17.643,7 0,93 11.608,6 12.485,7 7,56
SINGAPURA/SINGAPORE 4.193,4 4.184,7 4.103,0 4.366,5 4.563,3 2,14 3.343,4 760,3 -77,26
NEGARA LAINNYA/OTHER COUNTRIES 23.958,5 16.243,2 28.689,4 12.454,3 11.844,9 -15,42 8.252,0 11.619,4 40,81
4016 Articles of vulcanised rubber other than hard rubber, n.e.c. in 53.883,8 35.304,7 34.788,8 30.210,0 35.012,0 -9,68 22.579,4 32.855,5 45,51
JEPANG/JAPAN 6.858,2 6.409,8 5.741,2 4.843,4 4.171,7 -11,97 2.689,5 3.748,3 39,37
R.R. TIONGKOK/CHINA 9.509,1 9.515,5 12.774,1 10.046,7 14.855,7 9,93 9.872,8 11.830,5 19,83
THAILAND/THAILAND 3.136,6 4.666,6 3.738,7 3.014,5 2.433,2 -9,02 1.688,2 3.348,0 98,32
SINGAPURA/SINGAPORE 10.744,6 5.039,5 4.062,3 2.933,8 4.400,5 -20,76 2.620,0 3.248,5 23,99
AMERIKA SERIKAT/UNITED STATES 13.062,1 788,0 588,9 585,2 794,2 -44,56 412,7 373,6 -9,47
NEGARA LAINNYA/OTHER COUNTRIES 10.573,2 8.885,3 7.883,7 8.786,5 8.356,7 -4,70 5.296,1 10.306,5 94,61
137

Lanjutan/Continued
Volume/Volume : Ton
2016 Trend (%)
12-16
Jan-Ags/Jan-AugJENIS BARANG DESCRIPTION OF
GOODS2015
No. 08.05.148
Perub. (%)
Change (%)
16-172016 2017
2012 2013 2014
TABEL 20.1 : VOLUME IMPOR 190 JENIS BARANG MENURUT NEGARA ASAL UTAMA
IMPORT VOLUME OF 190 COMMODITIES BY MAIN COUNTRY OF ORIGIN
KODE
CODE
HS
4107 Leather further prepared after tanning or crusting, including parchment-dressed leather, of
bovine (including buffalo) or equine animals, without hair on, whether or not split, other than
leather of w
13.054,1 14.831,8 14.963,1 14.853,4 16.081,4 4,27 10.705,6 17.049,2 59,26
VIETNAM/VIET NAM 1.516,4 1.486,5 1.678,6 3.415,9 3.352,0 27,36 2.190,3 3.813,2 74,10
KOREA SELATAN/SOUTH OF KOREA 4.173,8 3.977,4 4.401,6 3.038,1 2.832,3 -9,92 1.999,3 2.235,3 11,80
R.R. TIONGKOK/CHINA 1.995,7 3.180,9 2.827,9 2.595,0 3.875,0 11,89 2.307,0 6.238,4 170,42
THAILAND/THAILAND 403,8 1.131,0 977,5 1.015,8 1.520,4 28,97 1.037,3 847,1 -18,34
ITALIA/ITALY 536,6 736,4 688,5 711,6 730,2 5,99 504,5 751,7 49,01
NEGARA LAINNYA/OTHER COUNTRIES 4.427,7 4.319,3 4.389,0 4.077,0 3.771,4 -3,72 2.667,3 3.163,5 18,61
4202 Trunks; suit, camera, jewellery, cutlery cases; travel, tool, similar bags; wholly or mainly
covered by leather, composition leather, plastic sheeting, textile materials, vulcanised fibre,
paperboard
33.680,7 31.846,1 28.555,7 28.694,1 53.743,8 8,66 33.798,7 46.353,1 37,14
R.R. TIONGKOK/CHINA 28.912,2 28.517,1 25.916,0 26.362,3 49.383,2 10,43 30.608,9 43.172,5 41,05
PERANCIS/FRANCE 40,4 21,7 23,6 17,0 27,1 -9,92 16,5 33,6 103,10
ITALIA/ITALY 73,5 20,0 18,4 35,9 985,6 78,21 969,3 52,9 -94,54
VIETNAM/VIET NAM 147,9 191,3 230,7 257,6 698,5 40,53 400,7 413,9 3,29
SINGAPURA/SINGAPORE 1.611,1 1.105,9 816,8 732,6 740,6 -17,85 400,1 1.266,9 216,62
NEGARA LAINNYA/OTHER COUNTRIES 2.895,6 1.990,1 1.550,2 1.288,7 1.908,8 -11,91 1.403,1 1.413,4 0,74
4702 Chemical wood pulp, dissolving grades 432.229,0 517.363,9 523.432,6 475.231,1 486.624,6 1,53 343.656,6 432.546,9 25,87
REP.AFRIKA SELATAN/SOUTH AFRICA 256.474,2 256.072,6 175.816,9 132.613,4 140.055,8 -17,04 102.543,3 134.989,3 31,64
AMERIKA SERIKAT/UNITED STATES 418,8 1.787,3 3.368,4 76.381,0 116.719,0 348,86 76.188,6 122.430,9 60,69
KANADA/CANADA 37.710,1 67.274,8 172.325,7 87.979,0 85.734,2 21,06 61.804,3 69.935,3 13,16
REPUBLIK CZECH/CZECH REPUBLIC 35.521,4 93.857,9 90.459,2 77.508,4 62.150,7 9,72 37.483,3 42.646,8 13,78
SWEDIA/SWEDEN 61.202,0 70.450,7 73.546,4 73.352,9 41.291,3 -7,19 31.819,2 57.340,1 80,21
NEGARA LAINNYA/OTHER COUNTRIES 40.902,6 27.920,7 7.915,9 27.396,4 40.673,8 -0,30 33.817,8 5.204,5 -84,61
4703 Chemical wood pulp, soda or sulphate, other than dissolving grades 610.211,4 794.126,2 833.656,7 631.899,9 713.887,6 0,86 473.433,5 669.811,8 41,48
KANADA/CANADA 135.333,3 273.066,5 361.924,0 263.439,7 339.333,5 19,75 221.254,4 330.650,1 49,44
AMERIKA SERIKAT/UNITED STATES 110.840,4 115.038,6 170.812,8 136.613,4 154.945,3 8,78 104.494,2 141.690,2 35,60
PERANCIS/FRANCE 146.954,6 144.583,9 72.059,2 53.601,8 50.806,5 -26,78 33.008,8 39.731,7 20,37
SELANDIA BARU/NEW ZEALAND 38.765,2 48.117,7 39.336,6 39.665,7 40.665,8 -0,97 26.821,8 48.146,8 79,51
BRASILIA/BRAZIL 6.023,8 4.847,1 27.449,8 27.688,3 38.551,1 72,55 27.485,7 31.167,3 13,39
NEGARA LAINNYA/OTHER COUNTRIES 172.294,0 208.472,6 162.074,3 110.891,0 89.585,3 -17,63 60.368,5 78.425,8 29,91
4707 Waste and scrap of paper and paperboard 2.292.488,4 2.216.423,9 2.280.384,2 1.692.350,7 2.021.051,1 -5,08 1.383.730,2 1.590.170,9 14,92
AMERIKA SERIKAT/UNITED STATES 209.724,2 231.105,3 265.201,6 250.195,7 350.249,0 11,68 231.835,9 246.317,4 6,25
SINGAPURA/SINGAPORE 391.856,5 349.068,4 356.091,3 195.935,5 252.151,4 -13,58 161.425,3 172.380,2 6,79
AUSTRALIA/AUSTRALIA 218.659,5 239.194,9 317.722,2 220.611,6 263.158,8 2,94 183.443,2 197.481,8 7,65
INGGRIS/UNITED KINGDOM 316.981,6 285.679,8 216.974,5 156.565,8 226.103,5 -11,99 181.565,4 154.576,5 -14,86
SELANDIA BARU/NEW ZEALAND 93.819,2 129.615,1 150.406,3 156.065,9 169.528,5 14,67 108.098,1 143.460,2 32,71
NEGARA LAINNYA/OTHER COUNTRIES 1.061.447,5 981.760,4 973.988,4 712.976,2 759.860,0 -9,41 517.362,2 675.954,8 30,65
138

Lanjutan/Continued
Volume/Volume : Ton
2016 Trend (%)
12-16
Jan-Ags/Jan-AugJENIS BARANG DESCRIPTION OF
GOODS2015
No. 08.05.148
Perub. (%)
Change (%)
16-172016 2017
2012 2013 2014
TABEL 20.1 : VOLUME IMPOR 190 JENIS BARANG MENURUT NEGARA ASAL UTAMA
IMPORT VOLUME OF 190 COMMODITIES BY MAIN COUNTRY OF ORIGIN
KODE
CODE
HS
4811 Paper, paperboard, cellulose wadding and webs of cellulose fibres, coated, impregnated,
covered, surface-coloured, decorated or printed, rolls or sheets, other than goods of heading
no. 4803,
109.393,1 84.070,1 86.250,4 87.145,0 96.991,5 -2,03 63.682,2 72.941,6 14,54
SINGAPURA/SINGAPORE 34.984,1 23.912,0 22.147,2 26.105,4 28.480,8 -3,18 20.072,7 16.823,0 -16,19
R.R. TIONGKOK/CHINA 15.875,3 13.699,5 12.528,6 12.826,9 15.298,6 -1,39 9.777,1 13.755,6 40,69
PAKISTAN/PAKISTAN - - 5,4 120,0 6.677,8 - 3.379,1 6.534,6 93,38
JEPANG/JAPAN 4.279,8 3.296,7 2.900,8 3.287,4 3.450,7 -4,24 2.349,7 1.942,9 -17,31
MALAYSIA/MALAYSIA 13.474,1 9.754,5 8.684,6 8.958,2 9.755,3 -7,05 6.632,6 9.921,8 49,59
NEGARA LAINNYA/OTHER COUNTRIES 40.779,9 33.407,4 39.983,8 35.847,1 33.328,2 -3,28 21.470,8 23.963,8 11,61
4819 Cartons, boxes, cases, bags and the like, of paper, paperboard, cellulose wadding or fibres;
box files, letter trays and the like, of paper or paperboard, of a kind used in offices, shops or
the like
70.219,5 77.513,3 86.409,4 91.719,5 98.477,6 8,81 62.516,3 82.044,7 31,24
R.R. TIONGKOK/CHINA 16.139,3 20.649,1 27.253,2 28.976,6 39.372,6 23,65 23.465,5 33.790,3 44,00
THAILAND/THAILAND 9.963,7 12.359,3 9.247,2 10.679,9 14.565,9 6,33 8.736,9 10.824,1 23,89
SINGAPURA/SINGAPORE 19.717,9 13.618,1 17.046,1 17.366,1 14.211,4 -4,03 10.185,4 9.166,8 -10,00
VIETNAM/VIET NAM 3.161,0 5.895,4 7.203,7 7.216,6 7.117,6 20,03 3.852,1 8.889,0 130,76
MALAYSIA/MALAYSIA 4.474,8 4.954,7 5.090,5 6.249,0 6.384,1 9,89 3.659,6 6.775,3 85,14
NEGARA LAINNYA/OTHER COUNTRIES 16.762,8 20.036,8 20.568,6 21.231,4 16.825,9 0,66 12.616,7 12.599,1 -0,14
5201 Cotton; not carded or combed 610.773,5 672.197,2 705.135,5 672.925,3 678.248,3 2,13 440.128,2 617.744,5 40,36
AMERIKA SERIKAT/UNITED STATES 73.839,2 126.541,4 158.540,1 209.676,4 188.417,9 26,85 117.099,6 264.793,1 126,13
BRASILIA/BRAZIL 152.255,0 131.153,4 145.861,7 153.058,2 175.128,7 4,44 115.917,5 96.753,7 -16,53
AUSTRALIA/AUSTRALIA 100.497,4 89.155,6 72.328,6 39.426,8 71.314,3 -13,95 36.428,2 68.349,2 87,63
INDIA/INDIA 22.872,1 33.159,5 53.814,8 34.903,4 51.383,0 18,18 42.874,7 59.348,4 38,42
YUNANI/GREECE 32.934,9 20.907,6 19.497,8 20.127,5 26.192,0 -4,84 13.709,2 23.416,6 70,81
NEGARA LAINNYA/OTHER COUNTRIES 228.374,9 271.279,7 255.092,6 215.733,2 165.812,4 -8,33 114.099,0 105.083,5 -7,90
5208 Woven fabrics of cotton, containing 85% or more by weight of cotton, weighing not more
than 200 g/m2
42.910,0 42.870,3 40.560,7 39.992,6 39.670,2 -2,24 27.157,3 30.622,1 12,76
R.R. TIONGKOK/CHINA 24.968,0 25.034,5 22.265,4 22.546,7 22.515,2 -3,07 14.991,6 18.727,8 24,92
KOREA SELATAN/SOUTH OF KOREA 6.543,7 5.963,0 6.359,7 5.983,3 7.360,5 2,42 5.389,8 4.990,1 -7,42
HONGKONG/HONG KONG 6.956,1 7.687,1 6.845,3 7.466,3 5.605,9 -4,50 4.137,3 3.433,5 -17,01
TAIWAN/TAIWAN, PROVINCE OF CHINA 1.006,3 1.131,9 711,9 871,7 950,4 -3,69 695,7 844,0 21,32
INDIA/INDIA 954,3 446,9 504,4 833,3 940,5 6,12 599,2 771,5 28,75
NEGARA LAINNYA/OTHER COUNTRIES 2.481,6 2.606,9 3.874,0 2.291,3 2.297,7 -2,79 1.343,7 1.855,3 38,07
5209 Woven fabrics of cotton, containing 85% or more by weight of cotton, weighing more than
200g/m2
28.784,5 27.606,2 23.643,3 23.863,6 24.191,7 -4,81 16.978,7 19.972,6 17,63
R.R. TIONGKOK/CHINA 11.436,6 12.376,4 11.600,5 12.702,0 12.346,8 1,81 8.986,7 8.718,7 -2,98
KOREA SELATAN/SOUTH OF KOREA 7.056,9 6.099,2 5.544,0 4.414,2 4.933,7 -9,87 3.476,7 2.364,7 -31,98
HONGKONG/HONG KONG 4.920,2 4.788,0 3.244,6 2.891,0 3.584,5 -10,76 2.125,1 4.579,3 115,49
PAKISTAN/PAKISTAN 1.453,8 1.103,4 1.221,6 1.180,0 1.256,7 -2,22 876,7 1.653,7 88,64
TAIWAN/TAIWAN, PROVINCE OF CHINA 1.238,0 854,0 594,7 846,3 677,1 -11,45 501,8 582,5 16,08
NEGARA LAINNYA/OTHER COUNTRIES 2.679,0 2.385,3 1.437,9 1.830,1 1.392,9 -14,56 1.011,7 2.073,7 104,97
139

Lanjutan/Continued
Volume/Volume : Ton
2016 Trend (%)
12-16
Jan-Ags/Jan-AugJENIS BARANG DESCRIPTION OF
GOODS2015
No. 08.05.148
Perub. (%)
Change (%)
16-172016 2017
2012 2013 2014
TABEL 20.1 : VOLUME IMPOR 190 JENIS BARANG MENURUT NEGARA ASAL UTAMA
IMPORT VOLUME OF 190 COMMODITIES BY MAIN COUNTRY OF ORIGIN
KODE
CODE
HS
5210 Woven fabrics of cotton, containing less than 85% by weight of cotton, mixed mainly or solely
with man-made fibres, weighing not more than 200 g/m2
15.320,8 16.299,5 12.709,1 13.731,1 18.249,9 1,80 12.423,9 14.127,3 13,71
R.R. TIONGKOK/CHINA 7.812,7 6.025,1 4.083,9 5.221,5 6.168,2 -5,97 3.816,7 6.502,6 70,37
MALAYSIA/MALAYSIA 826,7 2.044,4 1.013,8 3.319,9 4.295,5 45,94 2.876,4 3.124,8 8,63
KOREA SELATAN/SOUTH OF KOREA 2.486,4 2.325,5 1.994,3 1.615,1 2.403,3 -4,23 1.886,7 1.891,7 0,26
TAIWAN/TAIWAN, PROVINCE OF CHINA 606,2 624,4 591,0 1.066,6 1.850,6 31,88 1.438,7 550,9 -61,71
HONGKONG/HONG KONG 2.596,7 3.260,8 3.882,5 1.058,0 2.096,9 -14,38 1.378,2 890,5 -35,38
NEGARA LAINNYA/OTHER COUNTRIES 992,0 2.019,4 1.143,6 1.450,0 1.435,3 4,16 1.027,2 1.166,8 13,59
5402 Synthetic filament yarn (other than sewing thread), not put up for retail sale, including
synthetic monofilament of less than 67 decitex
118.000,0 121.906,1 142.741,8 133.214,2 155.090,6 6,56 104.850,1 126.460,5 20,61
R.R. TIONGKOK/CHINA 39.925,9 47.216,4 65.556,0 65.200,3 89.878,4 21,48 62.074,8 71.289,3 14,84
KOREA SELATAN/SOUTH OF KOREA 13.494,9 12.106,9 12.675,0 10.687,3 11.782,9 -3,88 7.617,4 9.185,5 20,59
VIETNAM/VIET NAM 3.822,2 4.107,4 4.532,3 6.013,2 7.183,3 17,86 4.737,8 6.867,4 44,95
THAILAND/THAILAND 7.409,3 8.172,9 8.960,2 8.152,4 10.338,1 6,86 6.607,7 9.178,5 38,91
JEPANG/JAPAN 3.260,3 2.928,7 2.270,2 2.151,1 2.300,2 -9,57 1.741,3 1.990,6 14,32
NEGARA LAINNYA/OTHER COUNTRIES 50.087,4 47.373,9 48.748,0 41.009,7 33.607,7 -8,99 22.071,1 27.949,3 26,63
5407 Woven fabrics of synthetic filament yarn, including woven fabrics obtained from materials of
heading no. 5404
90.254,6 90.240,6 96.267,9 103.021,3 155.997,2 13,05 106.494,3 128.602,9 20,76
R.R. TIONGKOK/CHINA 54.724,3 58.098,9 61.293,0 66.105,2 114.927,4 17,50 76.760,2 98.603,6 28,46
KOREA SELATAN/SOUTH OF KOREA 14.123,4 12.708,9 14.778,5 15.059,6 16.599,1 5,05 11.587,7 12.440,3 7,36
TAIWAN/TAIWAN, PROVINCE OF CHINA 10.602,1 9.348,1 9.868,1 11.349,3 11.257,4 3,19 8.247,2 8.545,5 3,62
HONGKONG/HONG KONG 3.033,4 4.677,9 4.520,5 3.951,8 3.610,0 1,81 2.575,6 2.059,3 -20,05
JEPANG/JAPAN 596,1 742,4 951,3 1.262,1 1.203,5 21,36 795,1 1.031,9 29,78
NEGARA LAINNYA/OTHER COUNTRIES 7.175,4 4.664,5 4.856,5 5.293,3 8.399,8 4,51 6.528,5 5.922,3 -9,29
5502 Artificial filament tow 33.251,0 41.226,6 40.270,9 36.099,1 38.204,3 1,46 25.875,7 36.373,4 40,57
AMERIKA SERIKAT/UNITED STATES 16.011,0 20.106,3 15.966,2 13.110,0 11.210,6 -10,78 7.694,2 9.691,8 25,96
KOREA SELATAN/SOUTH OF KOREA 7.379,6 7.639,1 7.883,8 7.006,4 9.691,6 4,69 6.407,8 4.321,1 -32,57
JEPANG/JAPAN 7.217,9 9.875,9 13.573,6 9.351,7 8.052,8 1,66 5.757,8 14.087,6 144,67
BELANDA/NETHERLANDS 61,2 - - 3.092,0 5.162,5 - 3.213,4 5.172,2 60,96
JERMAN/GERMANY 1.883,7 2.596,7 2.072,1 3.109,9 3.102,1 12,50 2.304,5 2.331,8 1,18
NEGARA LAINNYA/OTHER COUNTRIES 697,6 1.008,6 775,3 429,0 984,6 -1,64 498,0 769,1 54,44
5503 Synthetic staple fibres, not carded, combed or otherwise processed for spinning 139.897,6 161.097,2 159.272,5 140.211,2 186.159,1 4,42 115.547,2 156.613,9 35,54
R.R. TIONGKOK/CHINA 37.186,0 52.927,1 59.351,6 57.797,4 99.877,5 22,93 57.284,5 87.246,3 52,30
THAILAND/THAILAND 25.732,6 33.124,4 27.416,1 25.153,1 32.881,2 2,17 21.918,6 26.778,8 22,17
JEPANG/JAPAN 16.961,8 17.848,6 16.422,8 13.118,2 11.268,2 -10,65 7.212,0 10.721,9 48,67
KOREA SELATAN/SOUTH OF KOREA 24.947,9 21.779,2 18.250,3 16.777,9 18.397,7 -8,33 12.124,8 12.831,8 5,83
MALAYSIA/MALAYSIA 15.168,4 11.772,1 8.691,2 8.366,3 8.704,0 -13,52 5.664,1 8.382,9 48,00
NEGARA LAINNYA/OTHER COUNTRIES 19.900,9 23.645,8 29.140,4 18.998,3 15.030,6 -7,51 11.343,3 10.652,2 -6,09
140

Lanjutan/Continued
Volume/Volume : Ton
2016 Trend (%)
12-16
Jan-Ags/Jan-AugJENIS BARANG DESCRIPTION OF
GOODS2015
No. 08.05.148
Perub. (%)
Change (%)
16-172016 2017
2012 2013 2014
TABEL 20.1 : VOLUME IMPOR 190 JENIS BARANG MENURUT NEGARA ASAL UTAMA
IMPORT VOLUME OF 190 COMMODITIES BY MAIN COUNTRY OF ORIGIN
KODE
CODE
HS
5504 Artificial staple fibres, not carded, combed or otherwise processed for spinning 108.313,1 66.481,3 91.466,3 88.686,6 97.949,7 0,87 67.331,2 68.889,5 2,31
R.R. TIONGKOK/CHINA 61.480,0 23.478,1 45.470,1 47.015,7 57.920,6 5,92 41.624,6 48.393,7 16,26
THAILAND/THAILAND 25.579,8 22.611,2 17.373,8 15.289,2 14.739,0 -13,88 9.936,7 7.631,4 -23,20
HONGKONG/HONG KONG 604,2 2.655,3 15.812,6 11.558,6 9.216,6 99,78 4.388,5 4.058,9 -7,51
TAIWAN/TAIWAN, PROVINCE OF CHINA 4.460,5 10.840,8 7.442,8 9.413,6 6.700,9 6,96 6.001,5 2.798,6 -53,37
AUSTRIA/AUSTRIA 1.290,4 2.065,7 2.379,6 2.788,3 4.564,3 32,66 2.615,3 4.037,6 54,39
NEGARA LAINNYA/OTHER COUNTRIES 14.898,3 4.830,2 2.987,4 2.621,0 4.808,3 -24,97 2.764,7 1.969,4 -28,77
5513 Woven fabrics of synthetic staple fibres, containing less than 85% by weight of such fibres,
mixed mainly or solely with cotton, of a weight not exceeding 170g/m2
27.186,8 26.696,3 24.233,4 20.942,6 20.581,5 -7,68 14.330,4 17.652,9 23,18
R.R. TIONGKOK/CHINA 14.783,9 16.584,5 14.993,6 10.459,6 9.574,7 -12,45 7.053,5 8.340,9 18,25
KOREA SELATAN/SOUTH OF KOREA 3.377,6 3.591,8 3.460,3 4.016,1 3.624,3 2,56 2.214,0 2.821,8 27,45
TAIWAN/TAIWAN, PROVINCE OF CHINA 2.444,6 2.465,7 2.481,6 2.368,6 2.543,2 0,39 1.644,1 2.928,4 78,12
HONGKONG/HONG KONG 1.009,8 1.162,5 1.116,8 1.359,3 1.352,0 7,68 1.003,6 1.452,6 44,74
THAILAND/THAILAND 487,5 373,9 587,1 847,7 1.557,6 36,91 1.244,8 667,2 -46,41
NEGARA LAINNYA/OTHER COUNTRIES 5.083,4 2.517,9 1.594,1 1.891,3 1.929,7 -19,94 1.170,4 1.442,0 23,21
5603 Nonwovens; whether or not impregnated, coated, covered or laminated 77.527,3 61.743,1 73.089,6 72.085,0 74.409,3 0,73 50.141,1 59.850,5 19,36
R.R. TIONGKOK/CHINA 30.798,2 26.267,1 32.481,7 30.615,3 30.409,0 1,29 20.252,5 23.690,3 16,97
THAILAND/THAILAND 8.884,8 9.773,7 12.539,5 16.574,9 19.935,3 23,92 13.621,0 17.337,4 27,28
KOREA SELATAN/SOUTH OF KOREA 7.588,0 6.870,9 7.978,1 6.760,9 5.355,8 -6,88 3.933,2 3.642,4 -7,39
MALAYSIA/MALAYSIA 15.056,7 3.434,7 4.950,1 5.608,2 6.330,4 -11,69 4.125,4 4.928,6 19,47
HONGKONG/HONG KONG 819,4 1.186,7 1.056,7 1.059,6 832,5 -0,81 593,9 416,2 -29,92
NEGARA LAINNYA/OTHER COUNTRIES 14.380,2 14.209,9 14.083,5 11.466,1 11.546,4 -6,33 7.615,1 9.835,6 29,16
5903 Textile fabrics impregnated, coated, covered or laminated with plastics, other than those of
heading no. 5902
60.221,6 72.359,4 76.640,2 69.177,8 69.765,3 2,52 47.132,9 65.616,0 39,21
R.R. TIONGKOK/CHINA 39.540,2 50.313,8 53.520,1 50.004,1 52.127,3 5,62 34.813,1 48.843,6 40,30
KOREA SELATAN/SOUTH OF KOREA 4.716,1 5.390,0 5.368,9 3.931,0 4.031,7 -6,10 2.837,4 4.701,0 65,68
TAIWAN/TAIWAN, PROVINCE OF CHINA 10.910,8 10.774,2 11.789,5 8.370,5 6.435,9 -12,26 4.436,6 5.284,5 19,11
VIETNAM/VIET NAM 633,0 443,2 619,3 3.103,9 3.123,9 67,18 2.266,5 3.691,3 62,86
HONGKONG/HONG KONG 1.842,2 2.656,9 2.390,6 1.529,6 1.503,9 -9,14 1.010,6 815,2 -19,33
NEGARA LAINNYA/OTHER COUNTRIES 2.579,3 2.781,3 2.951,7 2.238,8 2.542,7 -2,43 1.768,7 2.280,2 28,92
6002 Fabrics; knitted or crocheted, other than those of heading 60.01, of a width not exceeding
30cm, containing by weight 5% or more of elastomeric yarn or rubber thread
27.897,6 27.321,4 22.855,9 23.534,5 23.723,3 -4,62 15.720,0 17.783,1 13,12
KOREA SELATAN/SOUTH OF KOREA 7.522,6 7.782,9 8.010,3 7.789,0 7.654,8 0,36 5.336,8 4.813,5 -9,81
R.R. TIONGKOK/CHINA 6.694,8 5.709,0 4.849,2 4.506,5 5.668,0 -5,54 3.674,7 7.028,8 91,27
HONGKONG/HONG KONG 7.160,3 7.128,2 4.556,9 5.121,0 4.045,7 -13,69 2.603,9 1.883,5 -27,67
TAIWAN/TAIWAN, PROVINCE OF CHINA 3.678,8 3.963,9 3.690,8 3.061,1 3.577,5 -3,09 2.328,8 2.321,9 -0,29
VIETNAM/VIET NAM 1.651,8 1.506,1 1.076,9 1.357,2 1.075,9 -9,17 694,3 788,6 13,58
NEGARA LAINNYA/OTHER COUNTRIES 1.189,3 1.231,3 671,9 1.699,7 1.701,5 10,95 1.081,4 946,7 (12,45)
141

Lanjutan/Continued
Volume/Volume : Ton
2016 Trend (%)
12-16
Jan-Ags/Jan-AugJENIS BARANG DESCRIPTION OF
GOODS2015
No. 08.05.148
Perub. (%)
Change (%)
16-172016 2017
2012 2013 2014
TABEL 20.1 : VOLUME IMPOR 190 JENIS BARANG MENURUT NEGARA ASAL UTAMA
IMPORT VOLUME OF 190 COMMODITIES BY MAIN COUNTRY OF ORIGIN
KODE
CODE
HS
6004 Fabrics; knitted or crocheted fabrics of a width exceeding 30 cm, other than those of heading 60.01, containing by weight 5% or more of elastomeric yarn or rubber thread34.293,8 34.119,0 46.436,0 43.656,3 24.473,9 -4,19 17.001,3 20.017,1 17,74
R.R. TIONGKOK/CHINA 15.109,3 15.188,1 27.242,3 26.063,8 9.286,6 -4,24 6.184,7 8.331,6 34,71
KOREA SELATAN/SOUTH OF KOREA 9.941,2 11.157,3 10.988,2 8.077,7 8.430,6 -6,32 5.763,8 5.423,8 -5,90
HONGKONG/HONG KONG 2.880,2 2.593,6 2.448,1 4.078,8 2.273,7 -0,20 1.824,6 1.392,3 -23,69
TAIWAN/TAIWAN, PROVINCE OF CHINA 2.361,0 2.499,2 2.129,7 2.758,1 2.160,0 -0,79 1.604,3 2.048,7 27,70
VIETNAM/VIET NAM 494,4 894,0 1.158,9 1.378,3 1.451,9 29,53 1.029,1 1.480,4 43,86
NEGARA LAINNYA/OTHER COUNTRIES 3.507,8 1.786,7 2.468,8 1.299,4 871,0 -26,69 594,8 1.340,3 125,33
6006 Fabrics; knitted or crocheted fabrics, other than those of headings 60.01 to 60.04 71.013,8 68.766,5 70.373,3 72.423,8 86.277,8 4,51 61.942,4 77.408,9 24,97
R.R. TIONGKOK/CHINA 16.929,4 18.317,4 21.793,8 28.927,0 40.276,3 24,49 29.437,3 40.243,0 36,71
KOREA SELATAN/SOUTH OF KOREA 25.009,1 22.276,9 22.749,8 19.178,2 19.501,3 -6,27 14.133,1 15.516,8 9,79
HONGKONG/HONG KONG 17.218,7 13.614,9 12.807,0 8.545,4 9.824,9 -14,68 6.889,6 7.908,1 14,78
TAIWAN/TAIWAN, PROVINCE OF CHINA 7.775,0 8.744,8 7.208,2 8.619,5 8.577,7 1,84 5.913,3 7.601,6 28,55
VIETNAM/VIET NAM 1.211,4 2.061,9 1.799,3 3.256,2 3.067,4 26,05 1.951,5 3.119,1 59,82
NEGARA LAINNYA/OTHER COUNTRIES 2.870,1 3.750,5 4.015,2 3.897,5 5.030,2 12,31 3.617,6 3.020,3 -16,51
6406 Footwear; parts of footwear; removable in-soles, heel cushions and similar articles; gaiters,
le.g.ings and similar articles, and parts thereof
22.852,2 20.601,5 18.737,0 17.934,1 20.557,1 -3,44 13.153,1 18.191,7 38,31
R.R. TIONGKOK/CHINA 12.264,2 9.640,2 8.411,8 6.995,8 7.766,6 -11,61 4.703,3 7.082,3 50,58
VIETNAM/VIET NAM 3.131,0 3.138,1 2.855,9 3.725,1 3.802,4 5,76 2.525,9 3.563,3 41,07
HONGKONG/HONG KONG 1.626,0 1.572,1 2.223,9 2.253,2 2.286,5 10,98 1.560,3 2.477,8 58,80
AMERIKA SERIKAT/UNITED STATES 335,3 238,5 285,7 616,7 855,0 32,61 586,4 509,1 -13,19
INDIA/INDIA 666,1 911,5 886,9 963,3 1.170,2 12,55 742,0 1.014,1 36,66
NEGARA LAINNYA/OTHER COUNTRIES 4.829,6 5.101,1 4.072,8 3.379,9 4.676,5 -4,65 3.035,2 3.545,3 16,81
6907 Ceramic flags and paving, hearth or wall tiles, unglazed; unglazed ceramic mosaic cubes and
the like, whether or not on a backing
572.083,6 521.165,9 734.888,5 745.303,9 928.280,0 14,18 572.524,3 922.635,8 61,15
R.R. TIONGKOK/CHINA 525.426,4 486.401,7 711.170,7 729.774,2 919.491,2 16,47 566.064,5 904.500,1 59,79
VIETNAM/VIET NAM 36.597,1 32.652,6 19.318,2 12.071,7 7.269,0 -34,48 5.260,9 16.776,3 218,89
MALAYSIA/MALAYSIA 8.693,9 1.822,7 4.274,0 3.051,3 846,8 -33,92 561,7 1.159,7 106,46
ITALIA/ITALY 519,8 106,1 70,7 194,7 167,9 -15,24 149,7 58,1 -61,15
HONGKONG/HONG KONG 338,7 0,2 - 109,0 467,7 - 467,7 105,4 -77,45
NEGARA LAINNYA/OTHER COUNTRIES 507,7 182,6 55,0 103,0 37,3 -43,96 19,9 36,2 81,54
7108 Gold (including gold plated with platinum) unwrought or in semi-manufactured forms, or in
powder form
7,3 10,2 7,1 24,0 22,1 35,86 5,8 18,9 226,19
SINGAPURA/SINGAPORE 5,1 8,4 6,1 18,9 10,2 24,60 2,8 2,6 -4,32
SWISS/SWITZERLAND - - - - 3,9 - 0,1 5,8 5.685,00
HONGKONG/HONG KONG 0,0 0,0 0,0 3,6 3,0 277,13 0,7 3,2 336,89
AMERIKA SERIKAT/UNITED STATES 0,2 0,0 - 1,0 2,0 - 1,2 1,1 -12,65
PERSERIKATAN EMIRAT ARAB/UNITED ARAB EMIRATES - - - 0,0 1,2 - 0,5 0,8 65,08
NEGARA LAINNYA/OTHER COUNTRIES 2,0 1,7 0,9 0,5 1,9 -13,05 0,5 5,4 1.059,66
142

Lanjutan/Continued
Volume/Volume : Ton
2016 Trend (%)
12-16
Jan-Ags/Jan-AugJENIS BARANG DESCRIPTION OF
GOODS2015
No. 08.05.148
Perub. (%)
Change (%)
16-172016 2017
2012 2013 2014
TABEL 20.1 : VOLUME IMPOR 190 JENIS BARANG MENURUT NEGARA ASAL UTAMA
IMPORT VOLUME OF 190 COMMODITIES BY MAIN COUNTRY OF ORIGIN
KODE
CODE
HS
7204 Ferrous waste and scrap; remelting scrap ingots of iron or steel 1.943.844,5 2.398.734,8 2.136.801,8 1.019.586,1 1.019.790,8 -19,31 590.589,0 1.431.077,9 142,31
HONGKONG/HONG KONG 18.103,9 89.150,0 143.923,8 171.556,1 184.760,0 69,90 105.188,5 157.010,6 49,27
JEPANG/JAPAN 58.952,8 84.728,3 50.203,8 134.905,8 158.735,1 27,71 120.916,4 62.350,9 -48,43
INGGRIS/UNITED KINGDOM 98.867,2 97.784,9 35.599,1 10.188,1 120.964,1 -16,96 56.103,9 66.202,8 18,00
SINGAPURA/SINGAPORE 210.658,2 332.171,4 379.351,3 170.006,1 124.526,1 -15,81 63.063,4 148.562,6 135,58
AUSTRALIA/AUSTRALIA 392.362,8 378.417,1 353.168,9 166.742,1 112.484,2 -28,24 75.738,9 217.987,2 187,81
NEGARA LAINNYA/OTHER COUNTRIES 1.164.899,6 1.416.483,0 1.174.554,9 366.187,9 318.321,3 -32,61 169.577,8 778.963,8 359,35
7207 Iron or non-alloy steel; semi-finished products thereof 3.756.602,2 3.778.901,9 3.575.653,3 4.205.483,3 4.925.750,9 6,70 3.372.458,4 3.079.727,1 -8,68
R.R. TIONGKOK/CHINA 74.643,9 214.515,3 1.213.821,7 2.530.209,7 3.155.317,2 170,63 2.252.201,1 682.979,8 -69,68
FEDERASI RUSIA/RUSSIA FEDERATION 1.839.533,6 1.840.196,2 1.231.118,0 824.593,7 858.933,7 -20,75 545.351,8 772.636,3 41,68
BRASILIA/BRAZIL 399.611,0 227.926,1 181.256,9 576.740,1 582.611,7 18,32 418.367,8 290.536,7 -30,55
JEPANG/JAPAN 130.210,2 294.185,8 222.367,1 144.442,9 108.076,1 -10,27 78.681,9 30.316,9 -61,47
QATAR/QATAR - - - - 66.583,7 - - 30.546,3 -
NEGARA LAINNYA/OTHER COUNTRIES 1.312.603,5 1.202.078,5 727.089,5 129.496,9 154.228,6 -47,85 77.855,8 1.272.711,1 1.534,70
7208 Iron or non-alloy steel; flat-rolled products of a width of 600mm or more, hot-rolled, not clad,
plated or coated
2.369.217,0 2.335.498,7 1.819.638,9 1.534.926,4 1.380.091,8 -13,93 930.972,1 1.111.928,8 19,44
JEPANG/JAPAN 711.462,8 809.443,6 565.644,6 633.707,9 684.518,8 -3,17 466.922,2 453.358,7 -2,90
KOREA SELATAN/SOUTH OF KOREA 837.776,8 762.298,3 679.642,4 499.415,1 412.044,9 -16,82 288.221,8 395.274,8 37,14
R.R. TIONGKOK/CHINA 158.734,4 68.196,0 104.871,4 152.147,9 131.605,1 4,37 84.133,4 105.553,1 25,46
TAIWAN/TAIWAN, PROVINCE OF CHINA 234.644,7 279.853,0 258.234,9 164.731,3 80.790,8 -23,37 44.839,3 68.749,9 53,32
SINGAPURA/SINGAPORE 195.797,8 145.516,1 92.296,9 51.674,8 49.967,1 -31,39 34.487,2 53.109,5 54,00
NEGARA LAINNYA/OTHER COUNTRIES 230.800,4 270.191,7 118.948,8 33.249,3 21.165,1 -49,71 12.368,3 35.882,9 190,12
7209 Iron or non-alloy steel; flat-rolled products, width 600mm or more, cold-rolled (cold-reduced),
not clad, plated or coated
1.212.547,6 1.129.075,8 939.930,7 784.941,5 849.139,6 -10,20 523.512,6 683.710,0 30,60
JEPANG/JAPAN 418.559,1 396.616,6 306.665,6 255.252,3 286.716,9 -11,28 187.002,4 272.634,2 45,79
KOREA SELATAN/SOUTH OF KOREA 294.563,6 304.683,1 301.978,6 259.469,7 283.781,6 -2,32 178.856,9 208.722,5 16,70
TAIWAN/TAIWAN, PROVINCE OF CHINA 186.200,4 134.217,0 119.184,8 89.100,9 82.048,4 -18,52 46.784,3 55.675,7 19,01
INDIA/INDIA 191,7 30.026,4 23.632,7 41.635,3 84.406,8 249,11 47.376,9 61.800,1 30,44
MALAYSIA/MALAYSIA 34.942,7 53.090,0 75.926,6 53.547,3 55.524,9 9,80 35.895,1 32.062,7 -10,68
NEGARA LAINNYA/OTHER COUNTRIES 278.090,2 210.442,6 112.542,5 85.935,9 56.661,0 -33,48 27.596,9 52.814,8 91,38
7210 Iron or non-alloy steel; flat-rolled products, width 600mm or more, clad, plated or coated 859.729,0 1.000.677,9 942.736,1 883.169,8 1.061.704,8 3,02 689.280,0 691.725,7 0,35
JEPANG/JAPAN 237.645,5 256.460,6 270.302,8 234.615,2 271.666,2 1,80 172.397,5 194.365,6 12,74
R.R. TIONGKOK/CHINA 110.014,2 130.445,2 132.661,1 234.852,2 318.062,0 31,14 214.999,0 148.631,3 -30,87
VIETNAM/VIET NAM 173.381,5 260.516,4 298.424,5 184.946,2 210.317,5 0,44 135.056,5 149.893,0 10,99
KOREA SELATAN/SOUTH OF KOREA 175.032,5 183.669,4 134.523,6 149.870,0 172.133,5 -2,34 107.026,6 136.837,3 27,85
MALAYSIA/MALAYSIA 14.673,7 14.115,6 20.122,6 23.871,9 37.695,7 27,28 24.938,1 15.307,7 -38,62
NEGARA LAINNYA/OTHER COUNTRIES 148.981,6 155.470,8 86.701,3 55.014,2 51.829,9 -27,03 34.862,4 46.690,8 33,93
143

Lanjutan/Continued
Volume/Volume : Ton
2016 Trend (%)
12-16
Jan-Ags/Jan-AugJENIS BARANG DESCRIPTION OF
GOODS2015
No. 08.05.148
Perub. (%)
Change (%)
16-172016 2017
2012 2013 2014
TABEL 20.1 : VOLUME IMPOR 190 JENIS BARANG MENURUT NEGARA ASAL UTAMA
IMPORT VOLUME OF 190 COMMODITIES BY MAIN COUNTRY OF ORIGIN
KODE
CODE
HS
7212 Iron or non-alloy steel; flat-rolled products, width less than 600mm, clad, plated or coated 52.084,5 47.299,6 114.391,6 269.190,4 318.527,9 70,93 206.951,9 274.799,0 32,78
VIETNAM/VIET NAM 3.198,0 885,7 76.557,3 240.918,5 280.575,0 328,64 180.870,4 241.814,4 33,69
KOREA SELATAN/SOUTH OF KOREA 26.045,8 21.339,3 18.738,3 10.899,2 17.230,3 -13,91 12.001,1 13.630,8 13,58
R.R. TIONGKOK/CHINA 12.560,5 10.549,4 9.360,4 10.290,8 15.037,1 3,41 9.851,4 15.292,4 55,23
JEPANG/JAPAN 3.540,3 3.194,3 2.857,0 2.514,4 2.755,2 -7,14 1.842,9 2.458,6 33,41
TAIWAN/TAIWAN, PROVINCE OF CHINA 1.596,4 1.804,7 685,1 1.109,3 1.106,3 -11,49 930,6 536,8 -42,32
NEGARA LAINNYA/OTHER COUNTRIES 5.143,5 9.526,2 6.193,4 3.458,3 1.824,1 -26,56 1.455,6 1.065,9 -26,77
7219 Stainless steel; flat-rolled products of width of 600mm or more 215.602,9 229.752,1 252.915,8 226.715,7 232.914,2 1,42 152.995,5 203.634,8 33,10
INDIA/INDIA 74.601,7 62.960,1 58.128,8 48.239,1 81.222,2 -0,96 54.548,9 66.666,9 22,21
R.R. TIONGKOK/CHINA 35.433,2 38.750,8 63.168,2 80.459,8 54.338,1 17,18 32.231,5 49.908,2 54,84
JEPANG/JAPAN 32.550,7 34.117,1 45.136,7 42.148,9 42.150,8 7,55 28.986,6 35.073,2 21,00
MALAYSIA/MALAYSIA 8.293,5 11.473,8 9.615,2 11.218,8 15.958,1 13,73 8.645,5 17.676,4 104,46
KOREA SELATAN/SOUTH OF KOREA 15.850,7 24.715,3 30.914,4 16.966,2 14.837,1 -4,96 11.941,2 11.604,9 -2,82
NEGARA LAINNYA/OTHER COUNTRIES 48.873,0 57.735,1 45.952,4 27.682,9 24.407,9 -19,13 16.641,7 22.705,2 36,44
7225 Alloy steel flat-rolled products, of a width 600mm or more 319.839,1 393.209,4 399.687,4 569.077,9 837.846,8 25,81 507.488,3 1.267.360,5 149,73
JEPANG/JAPAN 153.927,3 159.733,2 186.690,3 178.144,4 265.833,0 12,77 155.268,5 336.526,5 116,74
R.R. TIONGKOK/CHINA 76.032,4 137.216,9 92.638,5 164.216,0 284.710,6 32,58 176.335,0 595.461,5 237,69
KOREA SELATAN/SOUTH OF KOREA 16.369,6 24.531,4 53.154,8 113.784,1 124.320,6 74,88 78.508,6 102.663,3 30,77
TAIWAN/TAIWAN, PROVINCE OF CHINA 39.648,3 37.823,7 41.915,9 50.205,8 64.028,6 13,22 41.590,6 66.218,8 59,22
VIETNAM/VIET NAM 4,7 1.169,7 1.591,8 29.984,7 41.018,5 749,66 31.996,7 32.198,1 0,63
NEGARA LAINNYA/OTHER COUNTRIES 33.856,9 32.734,4 23.696,1 32.742,9 57.935,5 11,35 23.788,9 134.292,4 464,52
7227 Steel, alloy; bars and rods, hot-rolled, in irregularly wound coils 319.553,1 567.558,1 634.768,9 548.276,1 758.074,0 18,45 467.005,1 425.191,9 -8,95
R.R. TIONGKOK/CHINA 293.355,2 542.740,0 595.072,0 522.402,5 720.368,1 19,23 442.576,3 388.047,6 -12,32
JEPANG/JAPAN 5.690,8 6.089,4 16.941,3 18.329,7 23.718,8 48,54 15.467,9 19.818,7 28,13
MALAYSIA/MALAYSIA 12.070,3 12.338,3 17.740,6 4.658,5 6.482,0 -19,89 3.288,2 13.368,9 306,57
KOREA SELATAN/SOUTH OF KOREA 2.153,5 2.770,3 1.736,3 1.297,5 2.526,2 -4,30 1.726,3 1.585,9 -8,13
TAIWAN/TAIWAN, PROVINCE OF CHINA 1.719,9 1.762,9 2.144,1 1.105,8 2.705,9 4,50 1.795,0 1.543,3 -14,02
NEGARA LAINNYA/OTHER COUNTRIES 4.563,4 1.857,2 1.134,6 482,1 2.273,0 -23,99 2.151,4 827,5 -61,54
7228 Alloy steel bars, rods, shapes and sections; hollow drill bars and rods, of alloy or non-alloy
steel
658.479,0 714.376,9 557.396,2 356.678,8 365.542,8 -17,07 240.981,7 316.313,7 31,26
JEPANG/JAPAN 87.280,6 91.101,7 92.627,2 86.466,5 99.340,7 2,09 62.000,3 89.573,0 44,47
R.R. TIONGKOK/CHINA 476.619,0 542.543,3 382.109,1 181.188,9 192.667,1 -25,24 133.255,6 172.664,3 29,57
KOREA SELATAN/SOUTH OF KOREA 36.017,8 32.557,8 30.016,5 26.980,6 30.893,8 -4,83 19.210,7 31.419,4 63,55
AUSTRALIA/AUSTRALIA 13.296,2 3.314,5 2.137,9 15.356,0 20.626,4 27,27 12.631,5 8.766,7 -30,60
THAILAND/THAILAND 2.860,4 3.325,3 3.836,3 3.802,2 4.215,0 9,52 3.133,5 3.363,7 7,35
NEGARA LAINNYA/OTHER COUNTRIES 42.404,9 41.534,4 46.669,2 42.884,6 17.799,7 -15,67 10.750,1 10.526,6 -2,08
144

Lanjutan/Continued
Volume/Volume : Ton
2016 Trend (%)
12-16
Jan-Ags/Jan-AugJENIS BARANG DESCRIPTION OF
GOODS2015
No. 08.05.148
Perub. (%)
Change (%)
16-172016 2017
2012 2013 2014
TABEL 20.1 : VOLUME IMPOR 190 JENIS BARANG MENURUT NEGARA ASAL UTAMA
IMPORT VOLUME OF 190 COMMODITIES BY MAIN COUNTRY OF ORIGIN
KODE
CODE
HS
7304 Tubes, pipes and hollow profiles, seamless, of iron (other than cast iron) or steel 752.599,6 627.916,9 581.447,2 426.523,4 319.287,0 -18,95 208.184,6 271.613,8 30,47
R.R. TIONGKOK/CHINA 384.487,7 319.143,0 310.058,3 227.900,2 162.508,7 -18,61 110.697,5 116.668,7 5,39
JEPANG/JAPAN 114.598,0 103.345,1 84.920,2 86.580,5 77.053,7 -9,25 48.379,2 96.720,7 99,92
AUSTRALIA/AUSTRALIA 2.801,6 1.367,8 667,3 1.034,5 6.455,9 14,92 6.359,5 76,5 -98,80
SINGAPURA/SINGAPORE 55.784,4 50.022,0 48.976,3 28.440,2 15.313,2 -27,02 11.929,9 20.114,8 68,61
KOREA SELATAN/SOUTH OF KOREA 18.124,0 23.179,0 16.532,2 12.945,8 13.608,5 -10,91 8.016,2 8.957,7 11,75
NEGARA LAINNYA/OTHER COUNTRIES 176.804,0 130.860,0 120.292,9 69.622,2 44.346,9 -28,80 22.802,3 29.075,4 27,51
7307 Tube or pipe fittings (e.g. couplings, elbows, sleeves), of iron or steel 71.999,4 127.914,1 74.559,4 60.547,2 56.002,3 -11,75 39.888,6 24.892,7 -37,59
SINGAPURA/SINGAPORE 15.588,4 17.711,5 16.658,5 14.007,3 11.618,8 -7,90 8.552,3 3.161,9 -63,03
R.R. TIONGKOK/CHINA 32.018,1 66.557,4 27.962,3 25.587,5 27.898,2 -11,59 19.659,6 11.692,9 -40,52
KOREA SELATAN/SOUTH OF KOREA 4.778,8 17.124,8 8.277,2 5.864,7 4.674,4 -10,56 3.152,6 1.847,4 -41,40
JEPANG/JAPAN 4.443,6 5.774,4 2.863,7 2.253,4 1.938,2 -22,90 1.362,1 1.929,9 41,69
AMERIKA SERIKAT/UNITED STATES 1.240,1 4.421,4 989,0 1.063,1 626,2 -24,36 434,0 195,8 -54,89
NEGARA LAINNYA/OTHER COUNTRIES 13.930,4 16.324,6 17.808,7 11.771,3 9.246,5 -10,83 6.727,9 6.064,8 -9,86
7308 Structures of iron or steel and parts thereof; plates, rods, angles, shapes, sections, tubes
and the like, prepared for use in structures
170.258,6 175.512,1 217.502,1 241.881,3 172.437,0 3,52 121.468,3 102.493,2 -15,62
R.R. TIONGKOK/CHINA 110.711,9 121.294,2 157.833,9 189.559,3 123.885,8 6,94 85.600,1 82.728,1 -3,36
PILIPINA/PHILIPPINES - 126,5 151,1 705,7 4.804,2 - 4.804,2 0,0 -100,00
SINGAPURA/SINGAPORE 10.038,1 14.177,3 11.731,0 8.997,3 8.447,0 -7,69 7.089,7 2.836,7 -59,99
MALAYSIA/MALAYSIA 15.854,0 12.975,6 14.971,7 8.503,3 9.195,1 -14,03 6.350,3 6.422,0 1,13
AUSTRALIA/AUSTRALIA 8.205,8 3.298,4 4.263,1 8.634,3 6.117,7 3,82 2.967,5 2.384,7 -19,64
NEGARA LAINNYA/OTHER COUNTRIES 25.448,7 23.640,1 28.551,3 25.481,4 19.987,2 -4,00 14.656,4 8.121,7 -44,59
7318 Screws, bolts, nuts, coach screws, screw hooks, rivets, cotters, cotter-pins, washers
(including spring washers) and similar articles, of iron or steel
99.939,2 112.301,4 120.862,1 107.230,6 111.609,3 1,76 73.515,2 68.575,3 -6,72
JEPANG/JAPAN 22.119,6 21.592,2 23.138,0 20.345,3 21.759,6 -0,92 14.222,6 19.627,4 38,00
SINGAPURA/SINGAPORE 6.892,4 8.902,0 9.734,6 9.697,4 8.129,5 4,25 5.559,7 6.004,0 7,99
R.R. TIONGKOK/CHINA 31.421,6 42.253,9 43.200,3 44.115,7 45.975,8 8,38 30.231,4 21.062,2 -30,33
THAILAND/THAILAND 6.351,7 7.567,4 5.837,2 4.694,2 6.303,1 -4,81 4.185,7 5.846,3 39,67
AUSTRALIA/AUSTRALIA 7.351,1 9.864,0 15.849,1 10.297,7 10.591,7 8,04 7.049,1 5.990,6 -15,02
NEGARA LAINNYA/OTHER COUNTRIES 25.802,8 22.121,9 23.102,9 18.080,4 18.849,5 -7,96 12.266,7 10.044,8 -18,11
7326 Iron or steel; articles, n.e.c. in chapter 73 105.300,8 110.353,9 140.633,2 133.520,4 113.509,4 3,47 75.627,8 72.311,4 -4,39
SINGAPURA/SINGAPORE 11.983,7 4.757,8 19.918,8 17.811,5 15.117,9 19,54 10.706,2 9.940,1 -7,16
R.R. TIONGKOK/CHINA 34.663,0 46.463,0 59.654,0 72.482,1 52.645,2 13,66 35.260,8 26.434,3 -25,03
JEPANG/JAPAN 6.740,3 10.306,8 16.316,7 7.340,8 4.168,3 -12,20 2.888,1 3.040,2 5,27
AUSTRALIA/AUSTRALIA 22.235,3 18.686,7 20.497,9 12.747,5 24.525,8 -1,85 16.348,7 19.872,9 21,56
THAILAND/THAILAND 2.448,1 3.744,8 4.425,2 3.169,1 3.569,2 6,05 2.272,7 1.354,4 -40,41
NEGARA LAINNYA/OTHER COUNTRIES 27.230,4 26.394,8 19.820,6 19.969,5 13.483,0 -15,50 8.151,3 11.669,5 43,16
145

Lanjutan/Continued
Volume/Volume : Ton
2016 Trend (%)
12-16
Jan-Ags/Jan-AugJENIS BARANG DESCRIPTION OF
GOODS2015
No. 08.05.148
Perub. (%)
Change (%)
16-172016 2017
2012 2013 2014
TABEL 20.1 : VOLUME IMPOR 190 JENIS BARANG MENURUT NEGARA ASAL UTAMA
IMPORT VOLUME OF 190 COMMODITIES BY MAIN COUNTRY OF ORIGIN
KODE
CODE
HS
7403 Copper; refined and copper alloys, unwrought 129.746,9 105.952,9 115.829,8 131.773,1 131.344,6 2,46 89.027,1 107.061,9 20,26
JEPANG/JAPAN 48.742,8 51.538,1 49.484,0 37.148,9 37.606,6 -8,11 27.314,2 25.003,0 -8,46
PILIPINA/PHILIPPINES 1.196,4 5.484,8 497,0 8.213,0 27.482,7 94,88 16.927,4 17.051,6 0,73
R.R. TIONGKOK/CHINA 9.760,8 8.681,7 12.913,5 5.265,0 16.361,6 5,47 10.904,0 28.291,7 159,46
MYANMAR/MYANMAR (FORM. BURMA) 502,0 1.800,2 6.802,3 20.097,0 11.131,8 136,57 6.028,1 6.909,8 14,63
AUSTRALIA/AUSTRALIA 31.529,6 9.400,5 15.686,8 20.565,0 9.987,5 -14,07 8.073,7 5.609,9 -30,52
NEGARA LAINNYA/OTHER COUNTRIES 38.015,4 29.047,6 30.446,1 40.484,2 28.774,4 -2,23 19.779,7 24.195,9 22,33
7601 Aluminium; unwrought 440.659,9 386.388,3 249.433,5 271.392,9 312.576,5 -9,88 185.394,8 317.843,7 71,44
AUSTRALIA/AUSTRALIA 120.921,7 112.651,5 57.305,3 46.682,6 55.933,9 -21,52 31.312,4 51.104,3 63,21
PERSERIKATAN EMIRAT ARAB/UNITED ARAB EMIRATES 43.430,3 43.991,9 48.988,4 37.144,7 54.399,7 2,85 33.858,3 44.650,1 31,87
MALAYSIA/MALAYSIA 26.966,1 35.004,4 21.073,7 28.876,6 36.019,5 3,94 24.798,2 28.634,0 15,47
FEDERASI RUSIA/RUSSIA FEDERATION 11.870,4 12.000,8 16.940,1 22.700,1 36.200,2 33,21 25.139,4 33.648,9 33,85
QATAR/QATAR 29.495,5 34.765,3 43.370,1 28.974,3 21.471,1 -7,85 14.144,0 15.715,2 11,11
NEGARA LAINNYA/OTHER COUNTRIES 207.975,9 147.974,3 61.755,8 107.014,7 108.552,1 -14,99 56.142,6 144.091,1 156,65
7606 Aluminium; plates, sheets and strip, thickness exceeding 0.2mm 114.745,1 124.709,2 174.014,4 124.130,0 117.837,7 0,49 83.728,7 134.652,2 60,82
R.R. TIONGKOK/CHINA 55.520,0 69.798,7 118.041,7 80.405,4 75.066,8 7,73 54.817,2 103.410,1 88,65
KOREA SELATAN/SOUTH OF KOREA 32.248,0 31.086,7 24.376,6 19.264,8 24.290,1 -9,92 15.521,3 16.813,6 8,33
THAILAND/THAILAND 1.354,5 1.503,8 1.837,5 3.119,5 5.556,9 42,66 3.411,7 5.412,2 58,64
JEPANG/JAPAN 2.572,2 2.852,0 1.851,1 3.569,3 2.364,5 0,56 1.780,5 1.284,6 -27,85
AMERIKA SERIKAT/UNITED STATES 1.427,0 1.297,1 1.952,0 1.687,9 1.252,9 0,03 959,3 325,4 -66,08
NEGARA LAINNYA/OTHER COUNTRIES 21.623,5 18.171,0 25.955,6 16.083,0 9.306,6 -16,54 7.238,9 7.406,3 2,31
7607 Aluminium foil (whether or not printed or backed with paper, paperboard, plastics or similar
backing materials) of a thickness (excluding any backing) not exceeding 0.2mm thickness
not exceeding 0.2mm
21.815,4 29.297,6 37.541,3 34.362,3 42.004,9 15,83 28.355,2 41.441,2 46,15
R.R. TIONGKOK/CHINA 14.516,7 21.101,5 28.804,6 27.220,5 33.268,0 21,08 22.612,9 33.761,3 49,30
JEPANG/JAPAN 1.144,8 1.205,1 1.946,3 1.771,6 1.678,7 12,20 1.131,4 1.573,7 39,10
KOREA SELATAN/SOUTH OF KOREA 2.459,0 3.178,5 2.851,1 2.260,0 2.473,5 -3,24 1.636,9 2.339,8 42,94
MALAYSIA/MALAYSIA 1.435,3 1.586,0 1.884,6 1.338,6 2.067,7 5,77 1.305,7 1.522,4 16,60
BELANDA/NETHERLANDS 226,1 257,7 157,2 165,0 588,9 15,82 374,7 643,9 71,83
NEGARA LAINNYA/OTHER COUNTRIES 2.033,5 1.968,8 1.897,5 1.606,6 1.928,2 -3,05 1.293,8 1.600,1 23,68
7901 Zinc; unwrought 136.196,0 136.278,0 129.714,6 118.828,3 131.879,7 -1,99 86.485,9 120.636,9 39,49
KOREA SELATAN/SOUTH OF KOREA 53.531,5 51.355,4 45.476,8 40.204,3 42.850,8 -6,67 27.172,6 37.510,3 38,04
AUSTRALIA/AUSTRALIA 16.792,8 30.724,2 25.841,4 23.126,6 27.079,9 6,95 18.012,1 29.169,2 61,94
INDIA/INDIA 18.686,9 12.423,2 13.033,7 12.485,6 16.258,1 -2,70 11.624,4 14.948,9 28,60
JEPANG/JAPAN 24.424,0 22.678,2 13.761,3 16.876,7 13.373,2 -13,93 8.792,1 13.229,8 50,47
SPANYOL/SPAIN - - 573,6 4.021,2 8.586,2 - 4.953,8 5.293,1 6,85
NEGARA LAINNYA/OTHER COUNTRIES 22.760,9 19.097,0 31.027,8 22.113,8 23.731,4 2,33 15.930,8 20.485,7 28,59
146

Lanjutan/Continued
Volume/Volume : Ton
2016 Trend (%)
12-16
Jan-Ags/Jan-AugJENIS BARANG DESCRIPTION OF
GOODS2015
No. 08.05.148
Perub. (%)
Change (%)
16-172016 2017
2012 2013 2014
TABEL 20.1 : VOLUME IMPOR 190 JENIS BARANG MENURUT NEGARA ASAL UTAMA
IMPORT VOLUME OF 190 COMMODITIES BY MAIN COUNTRY OF ORIGIN
KODE
CODE
HS
8207 Tools, interchangeable; for hand tools, whether or not power-operated, or for machine tools
(pressing, stamping, punching, drilling etc), including dies for drawing or extruding
15.604,8 16.605,8 8.569,1 15.354,8 13.736,0 -3,28 8.227,7 16.458,2 100,03
JEPANG/JAPAN 3.704,6 5.806,1 2.048,0 7.476,7 4.748,5 7,78 3.598,1 7.028,1 95,33
R.R. TIONGKOK/CHINA 3.911,0 4.068,0 2.562,1 3.388,2 4.740,5 2,04 1.871,0 5.581,3 198,31
SINGAPURA/SINGAPORE 1.582,1 1.987,7 1.472,3 968,1 1.172,2 -12,36 777,6 840,0 8,03
THAILAND/THAILAND 1.158,4 582,7 244,1 1.392,5 906,6 3,88 643,7 944,3 46,69
SWEDIA/SWEDEN 58,9 94,1 215,5 309,4 432,2 67,83 289,7 234,6 -19,00
NEGARA LAINNYA/OTHER COUNTRIES 5.189,8 4.067,1 2.027,0 1.820,0 1.735,9 -25,88 1.047,6 1.829,8 74,67
8302 Base metal mountings, fittings and similar articles for furniture, doors, staircases, windows,
trunks, chests etc, castors with mountings of base metal, automatic door closers of base
metal trunks, ch
78.448,1 78.468,3 81.184,9 71.813,2 81.042,7 -0,24 51.881,8 60.724,8 17,04
R.R. TIONGKOK/CHINA 64.929,0 66.801,6 67.828,2 62.364,1 70.753,3 1,04 44.722,5 51.998,4 16,27
JEPANG/JAPAN 1.202,2 1.809,8 3.440,0 1.756,0 1.573,2 5,21 1.065,9 1.397,1 31,08
THAILAND/THAILAND 4.353,5 3.183,5 2.389,9 1.778,4 794,1 -32,87 512,8 699,7 36,44
SINGAPURA/SINGAPORE 1.466,0 1.277,7 1.336,8 979,2 1.973,0 3,33 1.202,3 1.708,0 42,07
TAIWAN/TAIWAN, PROVINCE OF CHINA 1.133,3 1.284,9 1.005,2 969,7 1.485,4 2,63 982,8 1.347,8 37,13
NEGARA LAINNYA/OTHER COUNTRIES 5.364,2 4.110,8 5.184,7 3.965,7 4.463,7 -3,95 3.395,6 3.573,8 5,25
8402 Boilers; steam or other vapour generating (other than central heating hot water boilers,
capable also of producing low pressure steam), super heated water boilers
72.897,8 89.844,8 101.236,5 97.707,2 80.698,4 2,91 53.345,6 57.423,8 7,64
R.R. TIONGKOK/CHINA 45.837,3 56.183,4 58.874,2 68.032,7 59.781,2 7,49 36.805,3 32.406,9 -11,95
MALAYSIA/MALAYSIA 15.607,5 19.008,5 19.265,2 15.785,4 11.944,2 -6,95 9.480,2 7.754,4 -18,20
INDIA/INDIA 2.080,1 2.268,2 8.534,7 3.723,4 6.307,1 31,18 5.389,5 1.839,5 -65,87
JERMAN/GERMANY 1.255,6 2.023,3 1.912,4 1.158,2 520,9 -20,68 471,8 525,9 11,47
JEPANG/JAPAN 578,0 204,7 626,4 466,3 254,0 -7,88 127,2 5.355,1 4.110,14
NEGARA LAINNYA/OTHER COUNTRIES 7.539,5 10.156,7 12.023,7 8.541,1 1.890,9 -25,47 1.071,6 9.542,0 790,42
8406 Turbines; steam and other vapour turbines 61.335,1 49.134,8 32.438,8 34.753,4 42.545,7 -10,22 18.048,9 13.571,0 -24,81
AMERIKA SERIKAT/UNITED STATES 98,9 178,7 123,8 862,3 4.422,9 150,30 3.232,6 221,1 -93,16
R.R. TIONGKOK/CHINA 31.523,5 42.222,3 29.287,2 29.470,7 32.921,5 -2,69 9.870,3 10.852,2 9,95
JEPANG/JAPAN 1.375,5 1.587,9 1.223,5 1.610,8 2.783,4 15,30 2.702,0 1.010,7 -62,60
ISRAEL/ISRAEL - - - 108,0 216,0 - 216,0 70,6 -67,30
INDIA/INDIA 936,6 2.071,1 622,0 502,1 1.288,1 -7,50 1.174,7 264,2 -77,51
NEGARA LAINNYA/OTHER COUNTRIES 27.400,5 3.074,8 1.182,3 2.199,6 913,8 -51,01 853,3 1.152,2 35,03
8407 Reciprocating or rotary internal combustion piston engines 27.754,1 24.885,1 23.458,7 24.111,9 14.674,7 -12,24 10.614,6 12.591,3 18,62
JEPANG/JAPAN 2.963,6 3.161,0 4.846,6 5.671,8 3.135,1 7,22 2.503,1 2.157,4 -13,81
THAILAND/THAILAND 12.518,7 7.934,4 5.492,9 4.285,4 3.328,0 -27,86 2.516,2 1.372,9 -45,44
R.R. TIONGKOK/CHINA 8.996,1 8.795,6 8.829,1 8.412,2 7.353,7 -4,38 5.087,9 8.403,1 65,16
MALAYSIA/MALAYSIA 72,5 21,4 19,2 12,7 8,3 -38,52 4,5 20,8 362,74
JERMAN/GERMANY 1.267,2 1.229,2 655,8 849,6 467,5 -21,05 280,1 286,3 2,22
NEGARA LAINNYA/OTHER COUNTRIES 1.936,0 3.743,5 3.615,0 4.880,1 382,2 -25,77 222,9 350,9 57,44
147

Lanjutan/Continued
Volume/Volume : Ton
2016 Trend (%)
12-16
Jan-Ags/Jan-AugJENIS BARANG DESCRIPTION OF
GOODS2015
No. 08.05.148
Perub. (%)
Change (%)
16-172016 2017
2012 2013 2014
TABEL 20.1 : VOLUME IMPOR 190 JENIS BARANG MENURUT NEGARA ASAL UTAMA
IMPORT VOLUME OF 190 COMMODITIES BY MAIN COUNTRY OF ORIGIN
KODE
CODE
HS
8408 Compression-ignition internal combustion piston engines (diesel or semi-diesel engines) 77.458,0 75.570,1 58.094,3 45.762,7 61.671,1 -9,13 42.542,1 57.935,8 36,18
THAILAND/THAILAND 12.934,3 11.698,5 13.865,7 9.934,0 23.171,9 10,55 15.930,8 23.481,9 47,40
JEPANG/JAPAN 11.775,4 9.827,6 8.129,1 4.961,1 4.962,3 -21,43 3.022,8 9.259,1 206,31
R.R. TIONGKOK/CHINA 38.643,7 40.512,3 27.071,8 24.173,0 27.508,6 -11,27 19.873,3 18.669,6 -6,06
JERMAN/GERMANY 732,8 416,5 330,3 299,6 916,3 1,18 460,5 502,2 9,05
SINGAPURA/SINGAPORE 4.661,6 5.297,7 2.303,6 1.865,4 832,8 -36,16 523,1 1.266,4 142,10
NEGARA LAINNYA/OTHER COUNTRIES 8.710,1 7.817,5 6.393,8 4.529,5 4.279,2 -17,86 2.731,6 4.756,6 74,13
8409 Parts suitable for use solely or principally with the engines of heading no. 8407 or 8408 102.334,5 107.375,3 101.984,3 67.345,4 62.308,4 -13,57 41.988,8 55.312,8 31,73
JEPANG/JAPAN 51.534,0 54.448,6 53.119,8 29.917,8 21.743,3 -20,74 14.718,6 21.398,5 45,38
THAILAND/THAILAND 12.368,4 11.947,7 12.894,2 7.358,1 6.481,4 -16,28 4.342,3 6.360,5 46,48
R.R. TIONGKOK/CHINA 22.899,9 27.077,2 22.041,7 16.042,8 18.356,9 -9,21 12.663,4 15.609,6 23,27
INDIA/INDIA 1.964,7 1.648,5 4.493,1 3.410,4 5.122,1 30,26 3.408,7 4.129,9 21,16
AMERIKA SERIKAT/UNITED STATES 2.886,7 1.311,5 1.194,9 871,6 802,2 -25,69 529,0 837,2 58,26
NEGARA LAINNYA/OTHER COUNTRIES 10.680,8 10.941,9 8.240,6 9.744,8 9.802,6 -2,83 6.326,9 6.977,0 10,27
8411 Turbo-jets, turbo-propellers and other gas turbines 7.476,4 12.788,1 8.465,3 4.573,7 3.164,6 -24,02 1.529,8 8.009,5 423,58
AMERIKA SERIKAT/UNITED STATES 1.753,1 1.670,8 454,4 973,5 1.172,9 -12,58 179,8 214,9 19,50
SWISS/SWITZERLAND 141,6 218,3 52,8 146,9 80,6 -14,12 70,9 99,1 39,81
JEPANG/JAPAN 2.244,1 2.233,6 2.290,7 663,7 589,1 -32,22 427,7 1.899,2 344,06
ITALIA/ITALY 54,9 81,0 48,5 95,3 149,0 24,09 120,9 1.391,4 1.050,79
R.R. TIONGKOK/CHINA 510,5 566,4 1.313,4 1.026,8 916,2 19,30 549,7 1.191,7 116,79
NEGARA LAINNYA/OTHER COUNTRIES 2.772,2 8.018,0 4.305,6 1.667,6 256,8 -46,89 180,7 3.213,2 1.678,06
8413 Pumps; for liquids, whether or not fitted with measuring device, liquid elevators 100.646,6 99.268,4 93.917,0 86.757,3 94.059,7 -2,66 66.295,4 68.838,4 3,84
R.R. TIONGKOK/CHINA 59.500,2 59.886,6 52.832,4 52.718,3 62.711,5 -0,22 45.172,8 42.669,9 -5,54
JEPANG/JAPAN 13.916,9 12.062,1 16.411,1 10.018,6 8.296,7 -11,49 5.673,6 7.265,7 28,06
AMERIKA SERIKAT/UNITED STATES 4.879,4 4.595,4 4.266,0 3.728,8 4.172,6 -5,09 2.908,5 2.982,0 2,53
THAILAND/THAILAND 4.136,7 4.806,7 4.645,8 4.405,4 4.450,9 0,59 2.976,4 3.314,4 11,36
SINGAPURA/SINGAPORE 5.046,2 3.809,4 4.439,8 4.036,6 4.033,3 -3,83 2.772,0 2.269,9 -18,11
NEGARA LAINNYA/OTHER COUNTRIES 13.167,2 14.108,2 11.322,0 11.849,6 10.394,7 -6,27 6.792,2 10.336,5 52,18
8414 Air or vacuum pumps, air or other gas compressors and fans; ventilating or recycling hoods
incorporating a fan whether or not fitted with filters
114.230,3 133.204,5 129.639,2 113.954,8 124.062,3 0,09 80.558,0 93.026,3 15,48
R.R. TIONGKOK/CHINA 55.748,3 67.964,7 69.750,2 70.066,7 86.751,1 9,58 55.258,4 66.029,2 19,49
JEPANG/JAPAN 5.680,0 7.046,6 12.693,7 6.885,8 7.445,2 5,32 5.228,6 6.096,7 16,60
AMERIKA SERIKAT/UNITED STATES 2.814,7 2.840,0 3.334,2 2.778,9 2.322,2 -3,98 1.818,9 1.060,5 -41,70
SINGAPURA/SINGAPORE 16.795,7 20.694,8 12.192,6 10.789,7 10.991,2 -13,92 7.152,5 5.836,1 -18,40
JERMAN/GERMANY 2.965,4 3.074,4 2.810,4 2.085,5 1.938,8 -11,64 1.315,4 1.961,5 49,11
NEGARA LAINNYA/OTHER COUNTRIES 30.226,2 31.584,0 28.858,1 21.348,1 14.613,8 -16,85 9.784,2 12.042,4 23,08
148

Lanjutan/Continued
Volume/Volume : Ton
2016 Trend (%)
12-16
Jan-Ags/Jan-AugJENIS BARANG DESCRIPTION OF
GOODS2015
No. 08.05.148
Perub. (%)
Change (%)
16-172016 2017
2012 2013 2014
TABEL 20.1 : VOLUME IMPOR 190 JENIS BARANG MENURUT NEGARA ASAL UTAMA
IMPORT VOLUME OF 190 COMMODITIES BY MAIN COUNTRY OF ORIGIN
KODE
CODE
HS
8415 Air conditioning machines; comprising a motor driven fan and elements for changing the
temperature and humidity, including those machines in which the humidity cannot be
separately or split-system
94.185,9 100.730,0 86.662,8 69.943,8 89.864,1 -4,48 63.505,8 58.752,5 -7,48
THAILAND/THAILAND 52.544,3 56.974,2 42.230,9 33.083,3 39.523,5 -10,53 26.815,1 22.950,6 -14,41
R.R. TIONGKOK/CHINA 21.818,7 26.340,8 28.817,4 24.542,0 34.542,4 8,85 26.333,2 24.787,2 -5,87
MALAYSIA/MALAYSIA 13.190,5 11.772,1 10.023,5 8.853,8 12.138,2 -4,41 7.963,1 8.509,5 6,86
JEPANG/JAPAN 1.384,7 1.331,5 1.122,1 845,3 776,9 -14,87 533,0 619,8 16,28
KOREA SELATAN/SOUTH OF KOREA 1.355,4 1.550,5 1.179,5 703,9 916,5 -14,55 598,5 603,6 0,85
NEGARA LAINNYA/OTHER COUNTRIES 3.892,2 2.760,9 3.289,3 1.915,4 1.966,5 -15,90 1.262,9 1.281,8 1,50
8417 Furnaces and ovens; industrial or laboratory, including incinerators, non-electric 24.982,1 23.529,6 97.883,5 193.161,1 111.460,0 66,47 78.284,5 68.614,4 -12,35
R.R. TIONGKOK/CHINA 16.791,6 16.615,1 89.005,5 184.196,8 106.522,7 84,06 75.837,1 64.582,0 -14,84
ITALIA/ITALY 590,5 782,1 1.385,0 609,7 1.554,1 18,37 288,4 634,5 119,97
JEPANG/JAPAN 996,8 1.514,8 1.647,4 867,9 269,5 -27,19 178,4 337,8 89,29
JERMAN/GERMANY 957,6 394,6 862,6 546,1 885,2 1,69 732,9 554,2 -24,38
DENMARK/DENMARK 3,1 80,7 1,3 610,9 105,0 147,85 104,8 0,0 -99,97
NEGARA LAINNYA/OTHER COUNTRIES 5.642,6 4.142,3 4.981,6 6.329,8 2.123,6 -14,19 1.142,9 2.506,0 119,27
8418 Refrigerators, freezers and other refrigerating or freezing equipment, electric or other; heat
pumps other than air conditioning machines of heading no. 8415
64.665,1 75.687,9 72.710,5 61.768,2 74.561,2 0,82 45.578,9 55.362,8 21,47
R.R. TIONGKOK/CHINA 37.141,6 38.959,7 38.639,9 35.055,2 46.138,4 3,34 26.621,3 37.215,8 39,80
THAILAND/THAILAND 12.712,5 19.296,1 17.614,0 14.855,4 18.097,7 4,55 11.999,0 10.471,8 -12,73
MALAYSIA/MALAYSIA 1.808,1 1.705,2 1.529,5 1.632,6 3.346,3 12,61 2.350,4 1.645,7 -29,98
KOREA SELATAN/SOUTH OF KOREA 7.336,0 9.600,1 8.687,2 5.876,3 2.024,0 -26,41 1.656,4 827,3 -50,06
LUKSEMBURG/LUXEMBOURG 47,9 90,7 19,3 189,8 455,6 68,94 329,1 313,5 -4,74
NEGARA LAINNYA/OTHER COUNTRIES 5.619,0 6.036,1 6.220,7 4.158,9 4.499,1 -7,85 2.622,7 4.888,8 86,40
8419 Machinery, plant (not domestic), or laboratory equipment; electrically heated or not,
(excluding items in 85.14) for the treatment of materials by a process involving change of
54.130,9 68.690,7 64.884,6 76.895,1 62.678,7 4,14 37.946,0 51.390,6 35,43
R.R. TIONGKOK/CHINA 22.687,0 26.838,1 30.401,7 33.126,0 28.821,2 7,13 15.103,9 21.601,1 43,02
MALAYSIA/MALAYSIA 9.131,4 7.243,2 9.853,8 10.582,2 7.976,5 1,09 6.327,5 9.776,4 54,51
JEPANG/JAPAN 2.277,8 2.808,5 2.759,1 1.276,7 2.661,4 -4,66 979,4 1.285,9 31,29
JERMAN/GERMANY 2.189,4 1.587,6 2.637,7 2.054,0 2.435,3 4,82 1.849,8 1.295,6 -29,96
ISRAEL/ISRAEL 0,0 - - 1.877,5 4.661,8 - 3.447,1 124,6 -96,38
NEGARA LAINNYA/OTHER COUNTRIES 17.845,2 30.213,3 19.232,3 27.978,8 16.122,5 -2,76 10.238,3 17.307,1 69,04
8421 Centrifuges, including centrifugal dryers; filtering or purifying machinery and apparatus for
liquids or gases
54.215,0 59.874,2 62.576,4 60.060,4 96.755,3 12,32 49.308,3 64.168,8 30,14
R.R. TIONGKOK/CHINA 24.472,0 20.690,5 26.316,7 34.593,0 71.590,4 30,48 33.360,4 43.332,4 29,89
AMERIKA SERIKAT/UNITED STATES 3.568,3 3.168,2 2.804,3 2.240,0 2.637,6 -9,07 1.752,7 1.741,2 -0,66
JEPANG/JAPAN 4.279,1 5.582,4 4.137,8 2.556,0 2.369,5 -17,83 1.632,8 1.984,3 21,53
THAILAND/THAILAND 3.725,1 5.764,2 3.763,8 3.126,0 2.695,0 -11,83 1.869,2 2.473,9 32,35
MALAYSIA/MALAYSIA 3.423,5 2.773,7 6.825,3 2.461,9 2.046,6 -10,85 1.244,6 1.804,7 45,00
NEGARA LAINNYA/OTHER COUNTRIES 14.747,0 21.895,3 18.728,5 15.083,4 15.416,3 -2,80 9.448,7 12.832,3 35,81
149

Lanjutan/Continued
Volume/Volume : Ton
2016 Trend (%)
12-16
Jan-Ags/Jan-AugJENIS BARANG DESCRIPTION OF
GOODS2015
No. 08.05.148
Perub. (%)
Change (%)
16-172016 2017
2012 2013 2014
TABEL 20.1 : VOLUME IMPOR 190 JENIS BARANG MENURUT NEGARA ASAL UTAMA
IMPORT VOLUME OF 190 COMMODITIES BY MAIN COUNTRY OF ORIGIN
KODE
CODE
HS
8422 Dish washing machines; machinery for cleaning, drying, filling, closing, sealing, capsuling or
labelling bottles, cans, boxes, bags, etc, machinery for aerating beverages
11.581,7 14.198,5 15.278,6 16.916,7 15.510,7 7,89 11.132,3 10.012,6 -10,06
JERMAN/GERMANY 2.014,8 2.313,0 3.003,1 2.148,2 1.258,8 -9,65 593,4 1.170,2 97,22
ITALIA/ITALY 1.127,1 1.611,2 2.402,4 1.323,9 1.185,8 -0,94 730,8 1.115,2 52,60
R.R. TIONGKOK/CHINA 4.449,7 5.687,9 6.254,5 9.517,0 9.652,7 22,92 7.547,1 4.829,7 -36,01
JEPANG/JAPAN 522,1 747,7 559,4 666,9 537,8 -0,55 370,0 446,0 20,52
SPANYOL/SPAIN 91,7 101,7 107,7 175,7 163,9 18,64 56,4 179,7 218,94
NEGARA LAINNYA/OTHER COUNTRIES 3.376,4 3.737,1 2.951,6 3.084,9 2.711,7 -6,11 1.834,6 2.271,7 23,82
8426 Derricks, cranes, including cable cranes, mobile lifting frames, straddle carriers and works
trucks fitted with a crane
119.938,3 109.195,3 98.130,0 108.348,4 100.482,2 -3,55 44.879,4 83.744,1 86,60
R.R. TIONGKOK/CHINA 49.327,7 56.240,4 55.830,6 64.068,7 65.801,4 7,32 22.327,6 54.852,5 145,67
JEPANG/JAPAN 22.757,0 22.018,4 19.241,5 18.417,2 17.206,7 -7,11 10.432,6 9.033,6 -13,41
ITALIA/ITALY 1.359,5 1.185,6 768,2 824,0 3.805,3 18,47 2.364,5 510,2 -78,42
SINGAPURA/SINGAPORE 10.239,0 9.052,2 7.963,5 7.749,3 5.168,0 -14,13 4.135,0 3.435,1 -16,93
JERMAN/GERMANY 16.936,5 5.994,1 1.504,7 5.906,0 4.178,3 -24,53 2.485,5 7.622,0 206,66
NEGARA LAINNYA/OTHER COUNTRIES 19.318,6 14.704,7 12.821,6 11.383,2 4.322,6 -27,75 3.134,2 8.290,6 164,52
8428 Lifting, handling, loading or unloading machinery; n.e.c. in heading no. 8425, 8426 or 8427
(e.g. lifts, escalators, conveyors, teleferics)
58.646,2 76.770,2 112.028,0 124.443,0 124.907,9 22,08 87.619,2 71.521,6 -18,37
R.R. TIONGKOK/CHINA 37.187,0 49.026,1 85.654,3 96.314,0 108.332,4 32,50 77.312,8 56.200,3 -27,31
JEPANG/JAPAN 1.396,2 2.582,2 1.614,9 2.072,5 1.498,2 -0,79 1.135,6 849,7 -25,18
KOREA SELATAN/SOUTH OF KOREA 3.148,0 6.181,9 4.595,0 5.061,5 3.854,7 2,07 2.089,2 3.435,2 64,43
JERMAN/GERMANY 2.370,8 3.213,2 4.029,1 2.396,4 1.063,5 -17,28 563,2 1.145,2 103,34
THAILAND/THAILAND 1.399,1 2.531,0 4.122,3 2.646,8 2.380,2 11,71 1.336,0 2.577,3 92,91
NEGARA LAINNYA/OTHER COUNTRIES 13.145,1 13.235,8 12.012,4 15.951,9 7.778,8 -8,26 5.182,4 7.313,9 41,13
8429 Bulldozers, graders, levellers, scrapers, angledozers, mechanical shovels, excavators,
shovel loaders, tamping machines and road rollers, self-propelled
354.623,7 182.653,1 146.792,5 133.649,3 102.756,2 -24,34 53.479,0 173.353,6 224,15
THAILAND/THAILAND 92.633,0 62.833,3 59.082,5 17.609,5 29.616,9 -29,90 13.039,8 40.679,1 211,96
R.R. TIONGKOK/CHINA 49.223,2 40.901,2 25.635,3 60.294,5 31.498,6 -4,92 17.078,0 49.213,8 188,17
JEPANG/JAPAN 116.860,7 39.898,0 37.853,8 22.403,6 21.889,6 -32,48 12.341,6 46.050,5 273,13
JERMAN/GERMANY 3.160,2 1.159,8 238,7 2.956,4 3.390,3 11,36 1.800,6 2.427,2 34,80
KOREA SELATAN/SOUTH OF KOREA 42.999,4 18.745,6 11.005,9 7.426,7 6.588,4 -37,36 3.472,6 19.403,4 458,75
NEGARA LAINNYA/OTHER COUNTRIES 49.747,3 19.115,2 12.976,3 22.958,5 9.772,5 -26,45 5.746,4 15.579,7 171,12
8431 Machinery parts; used solely or principally with the machinery of heading no. 8425 to 8430 628.357,4 152.907,4 140.270,4 134.263,0 141.296,2 -26,76 85.666,2 134.827,0 57,39
MALAYSIA/MALAYSIA 1.640,3 2.339,0 4.780,6 8.622,0 7.845,3 55,81 4.057,6 2.923,6 -27,95
JEPANG/JAPAN 65.283,6 34.900,4 26.369,8 20.743,7 23.674,0 -22,50 12.843,2 26.881,8 109,31
R.R. TIONGKOK/CHINA 63.893,8 48.142,2 50.045,5 47.371,6 51.528,6 -4,36 31.593,3 58.416,7 84,90
AMERIKA SERIKAT/UNITED STATES 13.140,5 11.780,8 9.904,9 7.061,2 5.638,1 -19,78 3.487,9 5.448,0 56,20
SINGAPURA/SINGAPORE 417.280,2 16.911,0 14.532,5 12.518,0 13.811,1 -50,92 11.277,8 8.378,9 -25,70
NEGARA LAINNYA/OTHER COUNTRIES 67.119,0 38.833,9 34.637,1 37.946,5 38.799,0 -10,59 22.406,4 32.778,0 46,29
150

Lanjutan/Continued
Volume/Volume : Ton
2016 Trend (%)
12-16
Jan-Ags/Jan-AugJENIS BARANG DESCRIPTION OF
GOODS2015
No. 08.05.148
Perub. (%)
Change (%)
16-172016 2017
2012 2013 2014
TABEL 20.1 : VOLUME IMPOR 190 JENIS BARANG MENURUT NEGARA ASAL UTAMA
IMPORT VOLUME OF 190 COMMODITIES BY MAIN COUNTRY OF ORIGIN
KODE
CODE
HS
8438 Machinery n.e.c. in this chapter, for the industrial preparation or manufacture of food or
drink; other than machinery for extraction or preparation of animal or fixed vegetable fats or
oils products
21.983,9 14.537,6 16.454,0 17.806,0 15.513,8 -4,82 10.969,6 12.890,4 17,51
R.R. TIONGKOK/CHINA 8.117,2 6.412,7 6.962,7 6.846,3 7.438,4 -1,09 5.334,5 5.093,1 -4,53
AUSTRIA/AUSTRIA 120,5 109,3 474,9 554,0 1.072,4 82,12 599,6 1.215,7 102,76
PERANCIS/FRANCE 130,1 93,7 283,2 99,7 447,3 28,81 205,6 71,6 -65,16
ITALIA/ITALY 1.419,7 883,4 474,7 610,3 537,7 -20,64 358,6 654,6 82,53
THAILAND/THAILAND 2.489,4 772,0 344,0 3.036,2 1.675,7 5,95 1.414,6 180,8 -87,22
NEGARA LAINNYA/OTHER COUNTRIES 9.706,9 6.266,5 7.914,6 6.659,6 4.342,3 -14,34 3.056,7 5.674,6 85,65
8439 Machinery; for making pulp of fibrous cellulosic material, or for making or finishing paper or
paperboard
16.325,0 24.017,4 13.351,0 16.687,2 17.151,8 -2,62 6.108,6 7.461,2 22,14
ITALIA/ITALY 117,5 5.065,7 2.975,5 1.533,2 2.760,2 66,84 1.090,2 1.517,6 39,20
R.R. TIONGKOK/CHINA 5.017,1 8.470,7 5.078,9 3.883,6 3.576,8 -13,56 3.103,5 2.873,7 -7,40
FINLANDIA/FINLAND 2.188,0 346,6 483,0 187,4 388,0 -33,46 329,3 203,0 -38,37
JERMAN/GERMANY 1.215,6 987,3 363,3 131,8 1.548,2 -14,18 255,6 134,5 -47,38
JEPANG/JAPAN 195,6 583,8 508,7 166,5 557,2 8,75 395,5 289,5 -26,80
NEGARA LAINNYA/OTHER COUNTRIES 7.591,2 8.563,4 3.941,5 10.784,6 8.321,5 4,23 934,5 2.443,0 161,43
8441 Machines; for making up paper pulp, paper or paperboard, including cutting machines of all
kinds
17.119,9 20.421,1 15.274,3 12.517,2 13.457,3 -9,25 10.136,3 8.480,7 -16,33
R.R. TIONGKOK/CHINA 7.687,1 8.917,6 6.411,5 4.564,2 7.472,1 -7,01 5.890,7 4.442,1 -24,59
FINLANDIA/FINLAND 146,7 0,2 47,4 2,0 814,5 82,52 809,7 8,5 -98,95
JEPANG/JAPAN 1.662,2 1.262,0 1.835,1 2.446,9 1.156,8 -0,63 710,5 321,1 -54,80
JERMAN/GERMANY 747,2 1.569,2 670,2 1.011,3 441,9 -13,84 319,8 263,5 -17,62
TAIWAN/TAIWAN, PROVINCE OF CHINA 3.928,7 3.291,9 3.631,6 2.790,6 1.613,6 -17,67 1.092,5 1.327,0 21,46
NEGARA LAINNYA/OTHER COUNTRIES 2.948,0 5.380,3 2.678,5 1.702,3 1.958,4 -17,87 1.313,1 2.118,6 61,34
8443 Printing machinery; used for printing by means of plates, cylinders and other printing
components of heading 84.42; other printers, copying machines and facsimile machines,
whether or not textile, lea
64.670,6 50.605,1 47.741,0 42.594,0 43.592,9 -9,16 28.732,9 41.558,0 44,64
R.R. TIONGKOK/CHINA 21.403,2 16.369,8 17.190,3 14.911,7 16.431,3 -6,03 10.831,1 15.819,8 46,06
JEPANG/JAPAN 14.670,1 7.612,4 7.320,1 7.316,5 5.897,3 -16,99 4.235,5 4.873,6 15,06
SINGAPURA/SINGAPORE 6.798,9 5.867,3 5.992,7 5.472,6 5.488,7 -4,86 3.720,9 4.589,0 23,33
VIETNAM/VIET NAM 8.692,9 8.681,5 7.725,0 4.937,0 6.382,3 -11,15 4.086,9 5.504,0 34,68
PILIPINA/PHILIPPINES 1.212,6 1.077,2 1.390,8 2.098,4 2.169,9 20,09 1.487,2 1.430,8 -3,79
NEGARA LAINNYA/OTHER COUNTRIES 11.892,9 10.996,8 8.122,1 7.857,8 7.223,4 -12,48 4.371,3 9.340,8 113,68
8455 Metal-rolling mills and rolls therefor 23.067,0 42.493,3 27.791,7 24.848,2 44.205,2 7,94 16.095,6 20.863,0 29,62
R.R. TIONGKOK/CHINA 17.204,1 18.911,7 17.983,4 14.762,9 35.027,6 12,46 10.386,5 14.718,3 41,71
JEPANG/JAPAN 327,2 1.312,8 1.014,7 1.780,3 1.677,2 42,94 1.015,9 1.156,3 13,82
KOREA SELATAN/SOUTH OF KOREA 814,3 18.277,9 4.202,2 782,5 1.707,7 -15,38 760,4 1.058,8 39,25
ITALIA/ITALY 236,3 317,0 555,6 1.443,5 414,2 30,20 366,2 254,7 -30,46
JERMAN/GERMANY 308,4 277,3 870,2 925,2 774,1 35,61 557,2 738,3 32,50
NEGARA LAINNYA/OTHER COUNTRIES 4.176,7 3.396,5 3.165,7 5.153,8 4.604,3 6,31 3.009,5 2.936,7 -2,42
151

Lanjutan/Continued
Volume/Volume : Ton
2016 Trend (%)
12-16
Jan-Ags/Jan-AugJENIS BARANG DESCRIPTION OF
GOODS2015
No. 08.05.148
Perub. (%)
Change (%)
16-172016 2017
2012 2013 2014
TABEL 20.1 : VOLUME IMPOR 190 JENIS BARANG MENURUT NEGARA ASAL UTAMA
IMPORT VOLUME OF 190 COMMODITIES BY MAIN COUNTRY OF ORIGIN
KODE
CODE
HS
8462 Machine-tools; (including presses) for working metal by forging, hammering or die-stamping,
for bending, folding, straightening, flattening, shearing or punching metal
50.262,5 60.104,9 53.335,0 27.714,8 30.284,9 -16,37 19.493,9 22.817,9 17,05
JEPANG/JAPAN 17.589,7 21.210,5 21.003,4 6.643,9 10.437,2 -19,79 8.183,9 4.968,1 -39,29
R.R. TIONGKOK/CHINA 14.273,7 12.264,5 13.442,6 9.911,1 9.898,8 -9,02 5.297,4 9.752,4 84,10
TAIWAN/TAIWAN, PROVINCE OF CHINA 5.849,7 7.080,3 4.851,8 4.113,9 2.807,0 -18,22 1.856,1 2.325,4 25,29
KOREA SELATAN/SOUTH OF KOREA 2.888,7 4.292,5 6.170,7 1.888,0 1.961,6 -14,75 740,5 788,3 6,46
BELANDA/NETHERLANDS 64,6 24,6 186,8 2,2 220,6 0,46 218,9 2,2 -99,01
NEGARA LAINNYA/OTHER COUNTRIES 9.596,2 15.232,5 7.679,9 5.155,6 4.959,6 -21,36 3.197,1 4.981,4 55,81
8466 Machine-tools; parts and accessories suitable for use solely or principally with the machines
of headings 8456 to 8465, and tool holders for any type of tool for working in the hand
212.066,3 13.124,4 10.604,3 8.744,4 7.293,0 -51,06 5.175,2 7.513,3 45,18
JEPANG/JAPAN 204.361,7 2.183,5 2.012,8 2.189,5 2.027,4 -60,24 1.496,4 1.011,5 -32,41
R.R. TIONGKOK/CHINA 3.271,4 5.681,9 3.752,5 2.630,7 2.517,7 -12,14 1.711,3 3.279,3 91,62
TAIWAN/TAIWAN, PROVINCE OF CHINA 2.268,3 2.162,5 2.387,1 2.001,6 1.091,0 -14,28 766,9 888,1 15,80
SINGAPURA/SINGAPORE 359,7 590,2 767,5 354,0 396,3 -3,12 284,1 693,4 144,05
KOREA SELATAN/SOUTH OF KOREA 481,1 900,9 537,3 294,0 201,9 -24,85 125,5 487,5 288,44
NEGARA LAINNYA/OTHER COUNTRIES 1.324,2 1.605,5 1.147,0 1.274,6 1.058,8 -6,56 791,0 1.153,6 45,85
8471 Automatic data processing machines and units thereof, magnetic or optical readers,
machines for transcribing data onto data media in coded form and machines for processing
such data, not
44.090,4 40.558,2 34.089,3 36.269,0 32.609,0 -6,90 15.612,6 22.119,5 41,68
R.R. TIONGKOK/CHINA 24.985,3 23.251,1 20.380,5 28.049,2 24.852,4 1,79 10.466,9 15.477,9 47,87
SINGAPURA/SINGAPORE 3.392,7 3.661,1 2.409,7 2.376,5 2.310,5 -11,31 1.523,9 2.173,8 42,65
THAILAND/THAILAND 532,5 821,9 848,3 518,2 1.027,3 8,90 532,8 700,4 31,45
MALAYSIA/MALAYSIA 6.066,1 4.988,5 4.581,5 2.558,6 2.805,6 -19,83 1.852,3 2.383,7 28,69
AMERIKA SERIKAT/UNITED STATES 226,4 232,1 132,2 176,5 139,5 -11,68 84,1 115,1 36,88
NEGARA LAINNYA/OTHER COUNTRIES 8.887,4 7.603,4 5.737,1 2.590,0 1.473,6 -37,32 1.152,6 1.268,6 10,07
8473 Machinery; parts and accessories (not covers, carrying cases and the like) suitable for use
solely or principally with machines of heading no. 8469 to 8472 heading 84.69 (other than
covers, carrying c
36.668,2 11.305,5 11.242,7 9.060,9 11.471,0 -22,47 7.146,9 8.928,1 24,92
R.R. TIONGKOK/CHINA 8.108,8 5.724,6 5.596,1 4.480,3 7.659,0 -3,53 4.640,5 5.350,8 15,31
SINGAPURA/SINGAPORE 2.922,1 2.869,0 3.535,0 2.227,4 2.100,6 -8,73 1.331,9 2.653,2 99,20
BELANDA/NETHERLANDS 87,8 88,6 87,6 67,6 74,7 -5,76 45,7 30,8 -32,65
TAIWAN/TAIWAN, PROVINCE OF CHINA 495,4 520,8 532,5 413,2 428,6 -5,08 297,7 263,7 -11,43
MALAYSIA/MALAYSIA 125,4 199,0 205,7 283,3 410,7 31,34 278,6 183,7 -34,06
NEGARA LAINNYA/OTHER COUNTRIES 24.928,6 1.903,6 1.285,7 1.589,1 797,4 -50,67 552,5 445,9 -19,29
8474 Machinery for sorting, screening, separating, washing, crushing, grinding, mixing or
kneading earth, stone, ores in solid form, shaping, moulding machinery for solid mineral
fuels substances other min
86.680,5 96.412,2 136.045,9 129.433,4 133.977,5 12,36 95.859,6 87.810,1 -8,40
R.R. TIONGKOK/CHINA 64.678,8 68.701,3 102.258,8 89.990,9 106.348,3 13,48 74.707,0 69.857,4 -6,49
AUSTRALIA/AUSTRALIA 3.423,7 2.973,3 3.965,7 5.195,4 6.073,7 18,59 3.911,9 4.198,2 7,32
JERMAN/GERMANY 3.247,4 3.459,8 11.227,4 10.967,3 1.765,3 -0,65 1.386,6 1.749,5 26,18
AMERIKA SERIKAT/UNITED STATES 1.874,1 1.563,6 1.427,4 2.456,4 3.036,4 15,22 2.834,5 1.200,4 -57,65
ITALIA/ITALY 1.035,3 2.801,3 2.805,4 2.264,5 1.352,3 3,27 675,1 1.170,8 73,42
NEGARA LAINNYA/OTHER COUNTRIES 12.421,3 16.912,8 14.361,2 18.559,0 15.401,5 5,37 12.344,6 9.633,7 -21,96
152

Lanjutan/Continued
Volume/Volume : Ton
2016 Trend (%)
12-16
Jan-Ags/Jan-AugJENIS BARANG DESCRIPTION OF
GOODS2015
No. 08.05.148
Perub. (%)
Change (%)
16-172016 2017
2012 2013 2014
TABEL 20.1 : VOLUME IMPOR 190 JENIS BARANG MENURUT NEGARA ASAL UTAMA
IMPORT VOLUME OF 190 COMMODITIES BY MAIN COUNTRY OF ORIGIN
KODE
CODE
HS
8477 Machinery; for working rubber or plastics or for the manufacture of products from these
materials, n.e.c. in this chapter
82.630,7 70.131,6 67.117,6 52.531,5 60.410,8 -8,75 38.838,5 45.004,8 15,88
R.R. TIONGKOK/CHINA 34.575,1 30.630,7 25.279,9 22.592,7 30.363,8 -5,49 19.337,2 21.855,9 13,03
JEPANG/JAPAN 12.697,1 9.283,0 9.341,6 6.361,9 5.705,2 -17,95 3.881,4 5.030,1 29,59
TAIWAN/TAIWAN, PROVINCE OF CHINA 14.668,1 11.609,5 12.133,7 8.655,3 8.169,1 -13,62 5.365,6 7.407,2 38,05
JERMAN/GERMANY 3.379,8 2.667,4 2.984,4 3.235,0 3.776,8 4,24 2.820,0 1.227,9 -56,46
ITALIA/ITALY 1.774,4 1.426,6 2.675,4 1.711,7 1.167,9 -6,33 965,2 608,4 -36,96
NEGARA LAINNYA/OTHER COUNTRIES 15.536,3 14.514,5 14.702,7 9.974,9 11.228,1 -9,74 6.469,1 8.875,4 37,20
8479 Machinery and mechanical appliances; having individual functions, n.e.c. in this chapter 74.859,1 82.303,2 90.023,3 86.933,2 77.736,0 1,31 50.866,5 59.507,3 16,99
R.R. TIONGKOK/CHINA 19.871,5 21.063,1 18.556,2 34.517,8 31.521,3 15,22 20.779,2 26.450,4 27,29
MALAYSIA/MALAYSIA 31.033,3 33.992,6 47.476,2 26.941,4 26.848,1 -5,09 17.932,7 14.775,4 -17,61
JEPANG/JAPAN 6.467,3 5.822,9 6.148,0 8.278,1 5.215,9 -0,78 3.918,9 3.692,0 -5,79
JERMAN/GERMANY 1.699,6 2.161,3 2.304,9 3.559,8 2.410,1 12,72 1.572,2 2.368,1 50,62
AMERIKA SERIKAT/UNITED STATES 1.282,1 1.317,2 1.971,7 1.478,8 880,1 -6,17 592,8 1.313,4 121,56
NEGARA LAINNYA/OTHER COUNTRIES 14.505,2 17.946,0 13.566,3 12.157,3 10.860,6 -9,23 6.070,8 10.908,1 79,68
8480 Moulding boxes for metal foundry, moulding patterns, moulds for metals (excluding ingot
moulds), metal carbides, glass, mineral materials, rubber or plastics
27.090,5 32.728,4 29.858,3 32.433,5 28.952,0 1,25 18.072,7 40.182,7 122,34
JEPANG/JAPAN 2.884,7 4.467,4 3.525,4 2.715,1 1.742,4 -13,98 993,5 2.165,2 117,95
R.R. TIONGKOK/CHINA 12.939,9 15.774,6 14.038,8 15.337,3 14.994,9 2,70 8.602,4 18.423,0 114,16
KOREA SELATAN/SOUTH OF KOREA 3.242,3 3.548,5 3.550,8 3.959,7 3.379,1 1,94 2.265,2 4.594,4 102,83
TAIWAN/TAIWAN, PROVINCE OF CHINA 1.604,1 2.231,4 1.540,9 1.476,3 1.139,0 -10,40 815,7 2.082,7 155,32
SINGAPURA/SINGAPORE 1.706,6 1.602,3 1.275,1 1.248,4 1.771,7 -1,73 1.228,1 7.223,8 488,20
NEGARA LAINNYA/OTHER COUNTRIES 4.712,9 5.104,3 5.927,3 7.696,8 5.924,9 9,07 4.167,8 5.693,6 36,61
8481 Taps, cocks, valves and similar appliances for pipes, boiler shells, tanks, vats or the like,
including pressure-reducing valves and thermostatically controlled valves
78.558,1 85.068,3 76.161,0 74.501,5 65.239,9 -4,92 44.434,0 48.519,9 9,20
R.R. TIONGKOK/CHINA 34.375,7 39.936,3 39.638,4 36.135,2 35.773,5 -0,20 23.872,0 27.447,1 14,98
SINGAPURA/SINGAPORE 5.724,5 7.532,3 8.852,9 9.585,1 9.038,1 12,24 6.483,1 3.582,7 -44,74
JEPANG/JAPAN 8.471,8 8.030,7 7.279,1 9.087,8 5.636,3 -6,68 3.568,0 5.396,9 51,26
AMERIKA SERIKAT/UNITED STATES 1.718,4 3.033,1 2.356,9 2.409,5 1.491,7 -5,00 988,1 1.167,5 18,16
THAILAND/THAILAND 3.382,6 3.820,4 3.397,2 2.946,5 2.996,5 -4,90 1.943,4 2.475,8 27,40
NEGARA LAINNYA/OTHER COUNTRIES 24.885,0 22.715,4 14.636,6 14.337,2 10.303,8 -19,94 7.579,4 8.449,9 11,48
8482 Ball or roller bearings 50.867,5 88.808,7 58.341,4 50.710,6 50.574,6 -5,56 33.378,3 45.571,1 36,53
JEPANG/JAPAN 15.394,8 48.814,0 16.732,6 13.175,5 12.768,4 -15,50 8.836,0 12.155,7 37,57
R.R. TIONGKOK/CHINA 20.473,2 22.445,3 24.133,6 19.020,4 21.673,1 -0,52 14.701,1 18.387,5 25,08
THAILAND/THAILAND 3.156,2 3.940,8 4.433,5 8.367,0 5.203,5 19,16 3.432,1 4.540,3 32,29
AMERIKA SERIKAT/UNITED STATES 1.138,5 1.079,5 894,9 598,5 873,0 -10,60 651,7 576,7 -11,51
SINGAPURA/SINGAPORE 3.437,7 2.765,7 2.686,2 2.345,1 1.916,5 -12,48 1.237,0 1.893,5 53,07
NEGARA LAINNYA/OTHER COUNTRIES 7.267,1 9.763,4 9.460,8 7.204,1 8.140,1 -0,77 4.520,4 8.017,4 77,36
153

Lanjutan/Continued
Volume/Volume : Ton
2016 Trend (%)
12-16
Jan-Ags/Jan-AugJENIS BARANG DESCRIPTION OF
GOODS2015
No. 08.05.148
Perub. (%)
Change (%)
16-172016 2017
2012 2013 2014
TABEL 20.1 : VOLUME IMPOR 190 JENIS BARANG MENURUT NEGARA ASAL UTAMA
IMPORT VOLUME OF 190 COMMODITIES BY MAIN COUNTRY OF ORIGIN
KODE
CODE
HS
8483 Transmission shafts (including cam and crank) and cranks; bearing housings and plain shaft
bearings; gears and gearing; ball or roller screws; gear boxes and other speed changers;
flywheels
104.203,8 95.836,8 88.998,8 68.401,9 66.997,5 -11,49 45.127,9 66.685,2 47,77
JEPANG/JAPAN 43.989,5 39.047,2 35.653,3 24.000,1 20.475,5 -18,26 13.818,3 18.830,9 36,27
R.R. TIONGKOK/CHINA 24.711,6 28.854,2 26.608,7 23.828,3 24.755,9 -1,86 16.757,2 25.515,0 52,26
AMERIKA SERIKAT/UNITED STATES 2.792,3 2.067,8 1.624,7 1.370,2 1.783,2 -12,26 1.296,5 1.261,8 -2,67
THAILAND/THAILAND 5.964,8 5.745,0 7.059,3 4.465,7 3.777,8 -11,00 2.737,8 3.012,1 10,02
JERMAN/GERMANY 3.242,3 1.837,2 1.490,5 1.849,3 1.143,6 -18,76 644,8 1.901,5 194,89
NEGARA LAINNYA/OTHER COUNTRIES 23.503,2 18.285,4 16.562,3 12.888,4 15.061,4 -11,66 9.873,3 16.163,9 63,71
8501 Electric motors and generators (excluding generating sets) 64.592,4 77.969,4 75.864,3 72.487,9 81.456,4 3,99 53.865,5 60.103,3 11,58
R.R. TIONGKOK/CHINA 45.574,6 55.540,4 53.456,0 56.134,5 64.088,8 7,17 41.467,7 49.081,9 18,36
JEPANG/JAPAN 2.597,9 2.826,0 2.884,5 2.218,3 2.874,1 -0,40 2.260,1 1.679,4 -25,69
VIETNAM/VIET NAM 1.342,7 2.796,4 2.906,3 1.746,3 3.633,7 16,42 2.149,5 2.396,0 11,47
SINGAPURA/SINGAPORE 3.499,8 4.483,7 2.918,4 2.341,5 1.575,4 -20,12 1.232,2 1.183,9 -3,92
AMERIKA SERIKAT/UNITED STATES 889,5 2.358,5 1.023,3 474,6 568,4 -22,11 407,8 296,8 -27,22
NEGARA LAINNYA/OTHER COUNTRIES 10.687,9 9.964,4 12.675,6 9.572,8 8.716,0 -4,38 6.348,1 5.465,2 -13,91
8502 Electric generating sets and rotary converters 80.358,6 72.357,2 79.516,5 57.202,0 56.892,7 -8,84 39.135,2 71.885,9 83,69
R.R. TIONGKOK/CHINA 49.736,9 50.805,7 58.305,4 39.564,3 45.207,3 -4,31 31.630,8 33.321,5 5,34
JEPANG/JAPAN 6.173,5 1.560,1 1.738,1 1.796,9 2.434,4 -15,80 1.754,0 2.074,0 18,25
SINGAPURA/SINGAPORE 3.732,9 4.247,2 2.294,4 2.785,4 1.577,7 -19,30 806,2 1.207,9 49,82
INGGRIS/UNITED KINGDOM 4.380,6 2.661,7 2.361,3 1.178,7 1.516,0 -25,45 933,6 2.745,8 194,11
JERMAN/GERMANY 3.857,4 5.399,1 1.322,6 1.550,8 1.024,0 -32,29 789,0 1.192,4 51,12
NEGARA LAINNYA/OTHER COUNTRIES 12.477,3 7.683,4 13.494,8 10.325,9 5.133,3 -13,76 3.221,6 31.344,4 872,95
8503 Electric motors and generators; parts suitable for use solely or principally with the machines
of heading no. 8501 or 8502
17.365,6 14.881,3 15.146,7 20.507,4 20.464,4 6,71 12.743,6 19.012,6 49,19
JEPANG/JAPAN 910,9 649,4 1.417,2 3.553,4 4.174,5 60,71 2.848,6 2.711,1 -4,83
R.R. TIONGKOK/CHINA 10.377,8 8.241,4 9.884,8 11.363,3 11.257,3 4,96 7.018,3 12.336,4 75,77
INDIA/INDIA 64,5 104,6 117,2 395,4 691,2 83,56 330,7 426,4 28,94
FINLANDIA/FINLAND 1.366,4 90,8 27,7 683,3 464,8 -1,37 457,9 349,9 -23,60
THAILAND/THAILAND 6,6 9,3 158,9 524,4 605,3 269,23 385,8 531,0 37,64
NEGARA LAINNYA/OTHER COUNTRIES 4.639,4 5.785,8 3.541,0 3.987,5 3.271,3 -10,16 1.702,2 2.657,8 56,14
8504 Electric transformers, static converters (e.g. rectifiers) and inductors 68.360,2 50.367,1 55.118,5 46.066,6 49.514,4 -7,08 32.040,4 56.147,1 75,24
R.R. TIONGKOK/CHINA 38.998,4 27.298,3 35.907,3 28.462,0 30.634,4 -4,31 19.562,0 34.274,3 75,21
SINGAPURA/SINGAPORE 3.356,7 3.391,3 2.188,2 2.613,4 2.741,6 -6,44 1.816,4 2.348,0 29,27
JEPANG/JAPAN 3.652,5 1.199,5 899,7 753,2 758,1 -30,30 523,2 1.735,2 231,65
KOREA SELATAN/SOUTH OF KOREA 3.551,8 3.808,4 2.374,0 1.433,0 1.653,8 -22,17 1.090,5 6.436,6 490,23
VIETNAM/VIET NAM 638,4 620,8 735,0 982,3 954,8 13,47 697,5 699,1 0,22
NEGARA LAINNYA/OTHER COUNTRIES 18.162,6 14.048,6 13.014,3 11.822,7 12.771,7 -8,39 8.350,8 10.653,8 27,58
154

Lanjutan/Continued
Volume/Volume : Ton
2016 Trend (%)
12-16
Jan-Ags/Jan-AugJENIS BARANG DESCRIPTION OF
GOODS2015
No. 08.05.148
Perub. (%)
Change (%)
16-172016 2017
2012 2013 2014
TABEL 20.1 : VOLUME IMPOR 190 JENIS BARANG MENURUT NEGARA ASAL UTAMA
IMPORT VOLUME OF 190 COMMODITIES BY MAIN COUNTRY OF ORIGIN
KODE
CODE
HS
8507 Electric accumulators, including separators therefor; whether or not rectangular (including
square)
40.788,4 38.045,0 38.479,8 37.450,3 40.568,4 -0,27 25.131,7 44.089,5 75,43
R.R. TIONGKOK/CHINA 22.587,1 21.955,2 23.769,3 23.406,8 22.957,2 0,97 13.954,1 22.021,3 57,81
KOREA SELATAN/SOUTH OF KOREA 4.800,8 4.208,2 3.283,2 3.749,2 5.183,6 0,38 3.410,6 6.997,6 105,17
JEPANG/JAPAN 1.135,0 1.013,4 950,0 802,6 1.133,6 -2,33 745,2 1.013,0 35,94
VIETNAM/VIET NAM 184,6 155,1 144,7 638,0 950,8 59,88 553,1 1.259,0 127,64
THAILAND/THAILAND 3.920,2 3.608,9 3.685,8 3.334,2 3.622,3 -2,34 2.148,6 4.544,9 111,53
NEGARA LAINNYA/OTHER COUNTRIES 8.160,7 7.104,2 6.646,8 5.519,5 6.721,0 -6,21 4.320,1 8.253,6 91,05
8511 Ignition or starting equipment; used for spark-ignition or compression-ignition internal combustion engines; generators and cut outs used in conjunction with such engines25.590,3 27.566,6 22.874,7 17.414,1 18.582,4 -10,41 11.480,9 13.747,6 19,74
JEPANG/JAPAN 7.578,9 8.310,0 6.594,8 4.579,3 4.247,3 -16,09 2.954,5 3.785,6 28,13
THAILAND/THAILAND 7.896,2 8.178,1 7.152,9 4.137,9 3.804,0 -19,28 2.473,6 3.450,5 39,49
R.R. TIONGKOK/CHINA 6.762,3 7.003,4 5.587,3 6.184,6 8.170,2 2,57 4.428,3 4.651,2 5,03
AMERIKA SERIKAT/UNITED STATES 410,5 465,3 364,5 203,6 365,7 -10,03 265,5 260,3 -1,95
SINGAPURA/SINGAPORE 400,9 502,8 559,4 381,0 421,0 -1,78 308,0 284,9 -7,51
NEGARA LAINNYA/OTHER COUNTRIES 2.541,6 3.107,1 2.615,8 1.927,6 1.574,1 -13,37 1.051,0 1.315,2 25,13
8512 Lighting or visual signalling equipment (excluding articles of heading no. 8539), windscreen
wipers, defrosters and demisters; electrical, of a kind used for cycles or motor vehicles
generators
14.835,1 15.041,4 15.766,3 13.414,5 14.428,9 -1,69 9.624,2 13.946,4 44,91
JEPANG/JAPAN 3.119,8 2.686,6 2.858,9 2.515,3 2.561,6 -4,50 1.753,8 2.019,1 15,13
R.R. TIONGKOK/CHINA 2.860,8 3.472,0 3.888,7 4.081,3 6.743,3 20,64 4.454,7 6.157,1 38,22
THAILAND/THAILAND 5.211,4 5.316,0 4.786,5 3.766,0 1.940,0 -20,71 1.400,6 2.577,9 84,06
MALAYSIA/MALAYSIA 1.072,8 1.424,5 1.216,4 1.030,4 1.207,6 -0,87 720,1 1.101,6 52,98
TAIWAN/TAIWAN, PROVINCE OF CHINA 725,6 667,2 498,9 513,1 475,1 -10,50 304,8 544,3 78,58
NEGARA LAINNYA/OTHER COUNTRIES 1.844,6 1.475,1 2.516,9 1.508,4 1.501,3 -3,82 990,3 1.546,5 56,17
8514 Industrial or laboratory electric furnaces and ovens (including those functioning by induction
or dielectric loss); other industrial or laboratory equipment for the heat treatment of materials
by
10.036,0 12.817,5 44.030,8 37.028,0 44.442,4 49,73 35.671,2 19.257,5 -46,01
R.R. TIONGKOK/CHINA 6.087,4 6.843,7 40.461,2 34.417,8 43.107,1 73,85 34.777,5 17.313,4 -50,22
JEPANG/JAPAN 1.071,0 1.801,2 1.331,4 735,3 508,7 -21,22 352,8 573,6 62,58
AMERIKA SERIKAT/UNITED STATES 108,6 142,6 99,9 97,2 49,0 -17,91 33,2 53,0 59,62
SINGAPURA/SINGAPORE 98,1 229,4 366,0 219,5 194,1 14,11 137,4 245,6 78,66
JERMAN/GERMANY 155,1 523,1 251,9 74,4 130,7 -20,49 119,6 59,7 -50,13
NEGARA LAINNYA/OTHER COUNTRIES 2.515,8 3.277,5 1.520,4 1.483,8 452,8 -34,44 250,6 1.012,3 303,88
8515 Electric (electrically heated gas) soldering, brazing, welding machines and apparatus,
capable or not of cutting, electric machines and apparatus for hot spraying of metals or
sintered
15.250,4 13.544,5 14.071,7 17.307,3 14.792,5 1,86 11.202,7 8.313,8 -25,79
R.R. TIONGKOK/CHINA 7.664,0 8.459,5 8.337,7 9.474,0 8.514,9 3,29 6.139,2 5.757,2 -6,22
JEPANG/JAPAN 2.489,1 1.061,7 1.663,1 1.434,2 1.096,4 -12,53 804,5 461,0 -42,70
SINGAPURA/SINGAPORE 1.198,3 1.544,8 1.522,8 2.182,5 1.641,3 10,24 1.413,8 728,9 -48,45
KOREA SELATAN/SOUTH OF KOREA 926,3 165,4 253,5 206,3 497,8 -9,71 88,0 154,4 75,42
AMERIKA SERIKAT/UNITED STATES 837,7 620,7 457,3 359,8 210,0 -28,20 168,5 271,8 61,28
NEGARA LAINNYA/OTHER COUNTRIES 2.135,1 1.692,4 1.837,1 3.650,6 2.832,2 14,27 2.588,7 940,5 -63,67
155

Lanjutan/Continued
Volume/Volume : Ton
2016 Trend (%)
12-16
Jan-Ags/Jan-AugJENIS BARANG DESCRIPTION OF
GOODS2015
No. 08.05.148
Perub. (%)
Change (%)
16-172016 2017
2012 2013 2014
TABEL 20.1 : VOLUME IMPOR 190 JENIS BARANG MENURUT NEGARA ASAL UTAMA
IMPORT VOLUME OF 190 COMMODITIES BY MAIN COUNTRY OF ORIGIN
KODE
CODE
HS
8516 Electric water, space, soil heaters; electro-thermic hair-dressing apparatus; hand dryers,
irons; electro-thermic appliances for domestic purposes; electro heating resistors, not of
heading no.
45.024,6 46.153,8 38.492,2 35.218,2 37.637,9 -6,09 24.721,0 35.807,3 44,85
R.R. TIONGKOK/CHINA 32.441,0 36.307,6 30.483,7 27.507,9 29.555,7 -4,53 18.806,6 27.558,4 46,54
VIETNAM/VIET NAM 5.107,7 4.447,6 3.305,3 4.394,3 4.452,0 -2,83 3.609,1 4.818,9 33,52
SINGAPURA/SINGAPORE 3.824,9 689,0 1.117,8 561,8 1.106,1 -23,55 552,7 1.163,0 110,42
KOREA SELATAN/SOUTH OF KOREA 557,9 585,8 649,8 527,4 460,3 -4,78 324,0 285,8 -11,79
MALAYSIA/MALAYSIA 560,4 485,9 628,5 476,3 572,3 0,22 448,2 629,3 40,41
NEGARA LAINNYA/OTHER COUNTRIES 2.532,8 3.638,0 2.307,2 1.750,6 1.491,4 -16,39 980,4 1.351,8 37,88
8517 Telephone sets, including telephones for cellular networks or for other wireless networks;
other apparatus for the transmission or reception of voice, images or other data (including
wired/wireless
51.030,3 47.760,2 32.328,6 31.026,5 33.123,7 -12,15 21.122,1 30.670,2 45,20
R.R. TIONGKOK/CHINA 34.509,1 36.797,6 23.727,4 23.571,1 22.725,4 -12,02 14.144,9 22.323,0 57,82
VIETNAM/VIET NAM 1.391,3 1.509,4 3.034,8 2.688,1 2.262,2 16,76 1.421,2 1.980,1 39,33
SINGAPURA/SINGAPORE 401,6 540,1 651,0 895,2 1.266,2 32,34 995,6 724,3 -27,25
SWEDIA/SWEDEN 1.417,0 912,2 737,3 565,0 704,1 -17,12 628,5 268,7 -57,25
MALAYSIA/MALAYSIA 666,7 522,1 284,4 323,4 301,3 -18,68 149,7 259,6 73,37
NEGARA LAINNYA/OTHER COUNTRIES 12.644,6 7.478,9 3.893,6 2.983,6 5.864,5 -21,77 3.782,2 5.114,5 35,22
8518 Microphones and their stands; loudspeakers, mounted or not in their enclosures;
headphones and earphones, combined or not with a microphone, and sets of a microphone
and one or more
36.847,7 37.192,7 32.769,0 27.854,1 37.019,2 -2,76 24.021,5 31.510,9 31,18
R.R. TIONGKOK/CHINA 30.654,6 31.211,7 26.299,3 22.087,2 29.774,9 -3,96 19.588,6 23.879,0 21,90
SINGAPURA/SINGAPORE 1.970,8 1.366,8 933,6 922,8 819,1 -19,33 518,3 790,3 52,47
KOREA SELATAN/SOUTH OF KOREA 848,2 428,1 485,6 506,8 427,6 -11,32 317,4 340,9 7,39
VIETNAM/VIET NAM 458,9 499,8 1.612,4 1.447,6 1.707,3 44,65 1.067,6 1.583,0 48,28
MALAYSIA/MALAYSIA 334,0 592,2 524,8 855,3 1.398,8 38,15 755,1 1.974,0 161,43
NEGARA LAINNYA/OTHER COUNTRIES 2.581,2 3.094,1 2.913,4 2.034,4 2.891,5 -1,90 1.774,5 2.943,8 65,89
8522 Sound or video recording apparatus; parts and accessories suitable for use solely or
principally with the apparatus of heading 8519 or
10.171,1 8.392,8 9.208,7 7.544,7 9.025,2 -3,40 5.998,6 6.317,3 5,31
R.R. TIONGKOK/CHINA 2.979,1 3.344,5 4.113,4 2.993,7 2.925,2 -1,46 1.926,6 2.720,8 41,22
HONGKONG/HONG KONG 1.350,5 1.278,1 2.012,6 1.728,4 2.811,5 19,34 1.908,7 946,8 -50,40
JEPANG/JAPAN 3.162,7 241,8 115,5 100,2 723,0 -31,83 397,6 1.373,1 245,35
KOREA SELATAN/SOUTH OF KOREA 1.292,5 1.277,6 1.110,4 869,8 738,7 -13,96 677,3 217,4 -67,90
THAILAND/THAILAND 155,4 287,3 167,5 101,9 210,8 -4,17 117,9 251,1 113,00
NEGARA LAINNYA/OTHER COUNTRIES 1.231,0 1.963,5 1.689,4 1.750,7 1.616,0 4,39 970,5 808,1 -16,74
8523 Discs, tapes, solid-state non-volatile storage devices, smart cards and other media for the
recording of sound or of other phenomena, whether or not recorded, including matrices and
5.677,5 3.652,6 2.928,3 2.783,0 4.252,3 -8,15 2.723,5 3.833,9 40,77
R.R. TIONGKOK/CHINA 2.841,4 1.290,8 1.553,5 1.374,2 2.354,8 -3,08 1.632,4 1.676,8 2,72
SINGAPURA/SINGAPORE 478,6 384,0 165,7 124,8 373,7 -14,94 116,2 555,1 377,80
BELANDA/NETHERLANDS 2,0 5,1 2,1 4,7 1,1 -12,67 0,6 1,4 110,23
TAIWAN/TAIWAN, PROVINCE OF CHINA 1.051,3 1.023,3 437,2 611,3 537,0 -16,96 358,2 446,4 24,62
JEPANG/JAPAN 240,6 141,1 53,6 45,6 96,3 -25,62 19,4 31,6 62,56
NEGARA LAINNYA/OTHER COUNTRIES 1.063,5 808,3 716,2 622,4 889,4 -6,00 596,7 1.122,7 88,16
156

Lanjutan/Continued
Volume/Volume : Ton
2016 Trend (%)
12-16
Jan-Ags/Jan-AugJENIS BARANG DESCRIPTION OF
GOODS2015
No. 08.05.148
Perub. (%)
Change (%)
16-172016 2017
2012 2013 2014
TABEL 20.1 : VOLUME IMPOR 190 JENIS BARANG MENURUT NEGARA ASAL UTAMA
IMPORT VOLUME OF 190 COMMODITIES BY MAIN COUNTRY OF ORIGIN
KODE
CODE
HS
8525 Transmission apparatus for radio-broadcasting or television, whether or not incorporating
reception apparatus or sound recording or reproducing apparatus; television cameras,
digital reception apparat
2.209,9 4.072,3 1.782,1 1.436,5 2.390,6 -8,47 1.259,5 2.067,6 64,17
R.R. TIONGKOK/CHINA 803,4 991,1 959,5 610,7 1.128,4 1,97 679,2 1.191,9 75,48
SINGAPURA/SINGAPORE 722,6 1.449,6 359,4 286,8 369,8 -25,62 257,4 259,4 0,78
JEPANG/JAPAN 199,3 174,6 150,4 152,0 158,4 -5,80 71,0 207,6 192,45
THAILAND/THAILAND 40,8 49,5 42,6 61,0 121,6 27,04 79,0 169,1 114,09
HONGKONG/HONG KONG 69,8 34,1 33,6 12,8 44,8 -17,07 29,2 66,2 126,82
NEGARA LAINNYA/OTHER COUNTRIES 374,1 1.373,3 236,7 313,3 567,7 -6,23 143,7 173,5 20,72
8528 Monitors and projectors, not incorporating television reception apparatus; reception
apparatus for television, whether or not incorporating radio-broadcast receivers or sound or
video
12.572,8 14.679,9 13.999,4 10.604,3 13.420,6 -1,93 7.823,7 11.804,9 50,89
R.R. TIONGKOK/CHINA 3.505,4 3.108,1 3.614,9 3.265,7 6.093,9 12,25 3.720,6 5.089,8 36,80
MALAYSIA/MALAYSIA 7.163,6 8.348,7 8.098,0 4.643,4 3.197,2 -19,75 2.312,4 1.819,6 -21,31
VIETNAM/VIET NAM 11,8 3,7 175,6 84,8 2.206,9 289,40 655,7 3.253,5 396,21
PILIPINA/PHILIPPINES 81,5 91,0 151,2 150,0 155,4 19,63 104,5 176,6 69,04
KOREA SELATAN/SOUTH OF KOREA 222,9 259,1 138,0 743,9 462,9 28,61 184,8 401,2 117,08
NEGARA LAINNYA/OTHER COUNTRIES 1.587,7 2.869,2 1.821,7 1.716,5 1.304,3 -8,67 845,7 1.064,2 25,84
8529 Transmission apparatus; parts suitable for use solely or principally with the apparatus of
heading no. 8525 to 8528
60.027,4 45.329,2 49.198,3 38.276,4 38.492,8 -10,04 26.778,9 33.180,6 23,91
R.R. TIONGKOK/CHINA 38.938,0 33.023,5 34.211,3 26.664,3 30.427,8 -6,83 21.260,9 27.970,3 31,56
KOREA SELATAN/SOUTH OF KOREA 4.576,9 3.854,8 6.364,1 5.076,3 2.798,0 -6,84 1.933,9 2.110,0 9,10
HONGKONG/HONG KONG 3.802,4 1.975,3 2.689,4 2.500,2 1.308,7 -17,28 870,4 624,8 -28,22
JEPANG/JAPAN 316,5 138,8 128,3 70,9 203,8 -14,38 97,6 164,6 68,61
SINGAPURA/SINGAPORE 1.517,7 1.113,3 1.117,0 685,6 885,1 -14,47 695,2 374,4 -46,14
NEGARA LAINNYA/OTHER COUNTRIES 10.876,0 5.223,5 4.688,1 3.279,2 2.869,2 -26,88 1.920,9 1.936,6 0,82
8532 Electrical capacitors; fixed, variable or adjustable (pre-set) 13.134,6 12.582,0 10.755,3 8.527,2 8.621,2 -11,58 6.161,4 7.114,7 15,47
SINGAPURA/SINGAPORE 2.665,0 1.881,0 1.784,0 1.115,0 837,8 -24,70 612,2 1.173,2 91,64
JEPANG/JAPAN 1.983,3 1.924,1 1.789,3 1.304,9 1.520,1 -8,79 1.133,4 1.207,3 6,53
R.R. TIONGKOK/CHINA 3.079,0 4.027,2 4.001,4 3.139,2 3.673,2 1,04 2.535,0 2.938,6 15,92
KOREA SELATAN/SOUTH OF KOREA 1.140,2 718,3 499,5 436,4 393,8 -23,09 278,3 327,6 17,72
MALAYSIA/MALAYSIA 2.044,5 2.349,4 1.203,2 1.075,2 908,2 -21,37 686,5 579,7 -15,56
NEGARA LAINNYA/OTHER COUNTRIES 2.222,6 1.681,9 1.477,9 1.456,5 1.288,1 -11,62 916,1 888,4 -3,03
8533 Electrical resistors (including rheostats and potentiometers), excluding heating resistors 4.772,2 5.341,4 4.105,2 3.886,3 3.081,9 -11,24 2.117,4 2.683,7 26,75
SINGAPURA/SINGAPORE 1.562,7 2.364,5 2.176,3 1.980,6 1.292,5 -5,42 906,4 962,6 6,20
KOREA SELATAN/SOUTH OF KOREA 146,4 119,9 93,8 102,7 101,5 -8,50 72,2 101,7 40,81
JEPANG/JAPAN 919,6 1.252,2 352,6 294,2 307,2 -30,52 195,4 468,0 139,45
R.R. TIONGKOK/CHINA 591,8 492,2 490,2 591,2 602,4 2,21 420,1 459,5 9,39
MALAYSIA/MALAYSIA 867,0 460,7 375,9 346,3 222,5 -25,96 149,7 107,0 -28,52
NEGARA LAINNYA/OTHER COUNTRIES 684,6 652,0 616,4 571,3 555,8 -5,34 373,5 584,9 56,60
157

Lanjutan/Continued
Volume/Volume : Ton
2016 Trend (%)
12-16
Jan-Ags/Jan-AugJENIS BARANG DESCRIPTION OF
GOODS2015
No. 08.05.148
Perub. (%)
Change (%)
16-172016 2017
2012 2013 2014
TABEL 20.1 : VOLUME IMPOR 190 JENIS BARANG MENURUT NEGARA ASAL UTAMA
IMPORT VOLUME OF 190 COMMODITIES BY MAIN COUNTRY OF ORIGIN
KODE
CODE
HS
8534 Circuits; printed 9.029,8 9.637,5 10.421,0 8.595,0 8.385,3 -2,59 5.860,6 7.426,0 26,71
R.R. TIONGKOK/CHINA 3.287,6 2.916,9 3.957,3 2.621,3 3.599,8 0,75 2.376,3 3.088,1 29,95
SINGAPURA/SINGAPORE 2.113,2 2.014,1 1.750,1 1.883,9 1.294,6 -9,94 939,5 1.261,7 34,29
THAILAND/THAILAND 902,6 721,0 492,9 854,4 1.098,1 5,78 721,5 1.082,5 50,03
JEPANG/JAPAN 476,7 914,6 562,1 329,4 391,2 -13,21 316,0 317,6 0,51
MALAYSIA/MALAYSIA 344,1 401,0 607,5 577,7 721,0 20,25 545,0 591,4 8,50
NEGARA LAINNYA/OTHER COUNTRIES 1.905,6 2.670,0 3.051,0 2.328,3 1.280,7 -8,90 962,3 1.084,8 12,73
8535 Electrical apparatus for switching, protecting electrical circuits, for making connections to or
in electrical circuits; for a voltage exceeding 1000 volts
13.604,6 10.799,8 10.406,9 16.062,3 17.720,5 9,70 13.081,9 11.150,6 -14,76
R.R. TIONGKOK/CHINA 5.089,2 3.718,2 5.386,2 8.685,5 8.061,5 19,34 6.061,4 4.384,0 -27,67
JERMAN/GERMANY 976,1 1.159,2 671,3 361,9 465,9 -23,23 301,7 556,2 84,32
INDIA/INDIA 266,6 427,8 333,3 871,9 1.023,7 40,54 747,4 855,0 14,40
VIETNAM/VIET NAM 7,1 6,5 2,9 1.351,0 4.064,2 507,62 2.949,0 460,5 -84,38
KOREA SELATAN/SOUTH OF KOREA 816,2 412,3 297,3 1.597,2 1.099,8 21,54 910,5 477,1 -47,60
NEGARA LAINNYA/OTHER COUNTRIES 6.449,5 5.075,9 3.716,0 3.194,9 3.005,4 -18,05 2.111,9 4.417,8 109,18
8536 Electrical apparatus for switching, protecting electrical circuits, for making connections to or
in electrical circuits, for a voltage not exceeding 1000 volts; connectors for optical fibres,
optical
50.036,2 49.599,1 46.428,6 40.540,8 44.689,4 7.516,4 30.074,2 41.877,4 39,25
JEPANG/JAPAN 10.065,9 11.024,0 10.619,6 9.218,9 9.168,9 -3,59 5.978,5 9.916,7 65,87
R.R. TIONGKOK/CHINA 13.806,2 15.592,1 14.041,8 12.464,7 16.171,0 0,93 11.192,7 13.931,9 24,47
SINGAPURA/SINGAPORE 7.021,9 6.605,5 5.873,9 4.781,6 4.342,2 -12,05 2.984,1 5.230,9 75,29
THAILAND/THAILAND 3.827,4 3.977,9 4.145,2 3.838,2 4.238,5 1,70 2.778,7 4.044,0 45,54
KOREA SELATAN/SOUTH OF KOREA 2.234,1 3.650,2 1.958,4 1.167,8 1.194,3 -21,28 873,2 931,2 6,64
NEGARA LAINNYA/OTHER COUNTRIES 13.080,8 8.749,5 9.789,7 9.069,6 9.574,6 -5,71 6.267,1 7.822,7 24,82
8537 Boards, panels, consoles, desks, cabinets, bases with apparatus of heading no. 8535, 8536
for electricity control and distribution, (other than switching apparatus of heading no. 8517)
25.439,9 28.167,9 40.283,7 104.718,8 74.751,1 41,46 40.809,9 30.305,0 -25,74
R.R. TIONGKOK/CHINA 12.293,0 11.690,5 27.554,0 93.623,5 64.756,9 71,66 33.670,8 23.394,5 -30,52
JEPANG/JAPAN 779,7 719,3 1.230,9 928,5 1.017,4 8,19 750,9 1.151,8 53,40
SINGAPURA/SINGAPORE 2.952,4 6.030,4 1.866,8 2.596,5 1.975,9 -15,17 1.497,7 1.271,2 -15,13
JERMAN/GERMANY 539,4 1.968,7 1.046,9 564,8 563,5 -10,96 305,3 283,2 -7,24
AMERIKA SERIKAT/UNITED STATES 512,4 986,4 402,3 567,3 639,2 -1,10 385,3 261,0 -32,27
NEGARA LAINNYA/OTHER COUNTRIES 8.363,0 6.772,6 8.182,8 6.438,0 5.798,0 -7,53 4.199,9 3.943,3 -6,11
8538 Electrical apparatus; parts suitable for use solely or principally with the apparatus of heading
no. 8535, 8536 and 8537
12.515,6 12.057,3 11.926,1 14.403,1 13.377,2 1.835,2 8.728,3 15.258,7 74,82
R.R. TIONGKOK/CHINA 3.793,1 4.636,9 5.013,1 6.905,7 5.706,9 12,92 3.767,9 9.401,9 149,52
JEPANG/JAPAN 1.293,5 1.511,2 1.389,2 1.337,4 1.468,9 1,33 935,2 1.317,9 40,92
ITALIA/ITALY 149,7 83,5 84,8 176,7 417,1 32,30 385,4 127,5 -66,91
THAILAND/THAILAND 291,8 388,2 563,7 522,2 643,1 20,65 417,9 447,7 7,13
SINGAPURA/SINGAPORE 2.298,5 911,2 661,5 990,4 613,4 -22,58 359,1 1.005,5 180,05
NEGARA LAINNYA/OTHER COUNTRIES 4.688,9 4.526,4 4.213,8 4.470,6 4.527,9 -0,82 2.862,7 2.958,1 3,33
158

Lanjutan/Continued
Volume/Volume : Ton
2016 Trend (%)
12-16
Jan-Ags/Jan-AugJENIS BARANG DESCRIPTION OF
GOODS2015
No. 08.05.148
Perub. (%)
Change (%)
16-172016 2017
2012 2013 2014
TABEL 20.1 : VOLUME IMPOR 190 JENIS BARANG MENURUT NEGARA ASAL UTAMA
IMPORT VOLUME OF 190 COMMODITIES BY MAIN COUNTRY OF ORIGIN
KODE
CODE
HS
8539 Lamps; electric filament or discharge lamps, including sealed beam lamp units and ultra-
violet or infra-red lamps, arc-lamps
34.474,1 38.398,2 38.055,2 32.991,6 28.310,1 -5,31 17.897,4 22.915,4 28,04
R.R. TIONGKOK/CHINA 29.485,1 32.797,6 33.322,9 29.186,2 24.502,9 -4,75 15.537,0 19.751,7 27,13
THAILAND/THAILAND 630,5 615,1 673,5 475,9 445,1 -9,09 300,8 310,0 3,06
JEPANG/JAPAN 470,0 1.044,1 373,3 217,0 263,0 -23,91 170,2 242,6 42,55
JERMAN/GERMANY 224,5 198,7 203,6 329,5 202,7 3,06 138,4 157,4 13,73
AMERIKA SERIKAT/UNITED STATES 115,3 109,7 145,0 97,0 134,3 1,85 82,8 84,9 2,60
NEGARA LAINNYA/OTHER COUNTRIES 3.548,7 3.633,0 3.336,9 2.685,9 2.762,1 -7,72 1.668,3 2.368,9 41,99
8541 Diodes, transistors, similar semiconductor devices; including photovoltaic cells assembled
or not in modules, panels, light emitting mounted piezo-electric crystals
7.947,4 11.694,9 7.774,0 8.903,0 8.712,2 -0,89 5.748,0 8.336,9 45,04
JEPANG/JAPAN 1.167,9 4.840,2 1.073,5 832,9 541,7 -28,08 381,4 548,8 43,91
R.R. TIONGKOK/CHINA 2.629,0 3.008,2 3.089,6 4.654,4 5.311,7 20,24 3.378,3 4.225,9 25,09
SINGAPURA/SINGAPORE 2.314,3 2.241,2 1.940,3 1.589,6 1.149,5 -16,00 854,2 1.712,1 100,44
KOREA SELATAN/SOUTH OF KOREA 905,6 478,3 560,4 627,2 316,9 -16,72 245,4 297,5 21,23
MALAYSIA/MALAYSIA 293,2 278,9 319,8 337,5 288,8 1,62 167,6 332,9 98,56
NEGARA LAINNYA/OTHER COUNTRIES 637,6 848,1 790,4 861,4 1.103,6 11,77 721,1 1.219,6 69,12
8542 Electronic integrated circuits 10.780,4 12.654,0 10.423,9 9.723,7 10.441,3 -3,22 7.723,2 7.909,8 2,42
SINGAPURA/SINGAPORE 4.612,7 3.629,7 4.823,7 4.776,0 3.529,6 -2,57 2.601,5 2.320,8 -10,79
KOREA SELATAN/SOUTH OF KOREA 1.270,8 1.129,7 1.207,9 958,4 928,3 -7,62 633,1 991,5 56,60
TAIWAN/TAIWAN, PROVINCE OF CHINA 275,6 241,9 206,7 263,9 317,8 3,79 223,6 320,8 43,48
JEPANG/JAPAN 2.206,8 4.919,7 1.774,6 1.230,4 1.537,8 -19,01 1.010,2 1.633,8 61,73
JERMAN/GERMANY 82,2 107,3 83,8 55,5 33,9 -21,59 23,4 38,9 66,53
NEGARA LAINNYA/OTHER COUNTRIES 2.332,3 2.625,7 2.327,2 2.439,4 4.093,9 11,09 3.231,4 2.604,0 -19,42
8543 Electrical machines and apparatus; having individual functions, not specified or included
elsewhere in this chapter
18.302,1 45.014,2 17.020,4 36.755,6 37.679,7 13,22 20.714,1 50.421,4 143,42
R.R. TIONGKOK/CHINA 10.070,8 40.260,4 13.924,6 32.641,9 34.473,2 25,25 18.452,4 48.104,3 160,69
JEPANG/JAPAN 1.688,1 399,7 545,5 816,1 935,6 -4,56 594,7 638,9 7,43
SINGAPURA/SINGAPORE 244,8 400,1 521,2 667,0 494,1 21,11 365,0 382,5 4,78
KOREA SELATAN/SOUTH OF KOREA 4.127,5 1.835,4 582,0 358,8 496,5 -44,39 313,5 300,4 -4,17
MEKSIKO/MEXICO 1,0 6,0 3,8 4,9 22,0 83,00 11,7 5,3 -54,89
NEGARA LAINNYA/OTHER COUNTRIES 2.169,9 2.112,7 1.443,2 2.266,8 1.258,4 -9,69 976,9 990,1 1,35
8544 Insulated wire, cable and other electric conductors, connector fitted or not; optical fibre
cables of individually sheathed fibres, whether or not assembled with electric conductors or
fitted with
131.805,7 113.925,0 103.619,1 96.702,9 104.772,9 -6,04 66.482,3 103.684,1 55,96
R.R. TIONGKOK/CHINA 69.599,0 55.040,9 52.069,9 48.764,2 59.579,9 -4,23 38.210,8 64.372,6 68,47
SINGAPURA/SINGAPORE 12.974,1 9.129,1 8.245,9 7.465,4 8.485,4 -9,97 5.524,0 6.612,4 19,70
JEPANG/JAPAN 6.313,4 4.492,9 5.297,5 8.757,8 5.519,2 4,07 4.336,0 5.752,2 32,66
KOREA SELATAN/SOUTH OF KOREA 5.003,1 4.718,0 3.827,4 6.370,5 6.904,6 9,91 4.924,2 7.114,2 44,47
INGGRIS/UNITED KINGDOM 243,8 88,7 1.303,1 83,3 2.573,6 59,21 34,6 171,8 397,19
NEGARA LAINNYA/OTHER COUNTRIES 37.672,3 40.455,5 32.875,4 25.261,8 21.710,3 -14,56 13.452,9 19.660,8 46,15
159

Lanjutan/Continued
Volume/Volume : Ton
2016 Trend (%)
12-16
Jan-Ags/Jan-AugJENIS BARANG DESCRIPTION OF
GOODS2015
No. 08.05.148
Perub. (%)
Change (%)
16-172016 2017
2012 2013 2014
TABEL 20.1 : VOLUME IMPOR 190 JENIS BARANG MENURUT NEGARA ASAL UTAMA
IMPORT VOLUME OF 190 COMMODITIES BY MAIN COUNTRY OF ORIGIN
KODE
CODE
HS
8703 Motor cars and other motor vehicles; principally designed for the transport of persons (other
than those of heading no. 8702), including station wagons and racing cars
225.905,1 202.496,1 139.818,8 114.375,0 113.042,6 -17,77 80.887,9 94.734,8 17,12
THAILAND/THAILAND 129.362,9 100.010,1 69.723,1 46.452,9 60.696,0 -20,39 44.652,0 29.550,7 -33,82
JEPANG/JAPAN 57.144,9 49.019,5 32.844,2 41.503,4 25.853,6 -16,08 19.547,5 24.876,8 27,26
JERMAN/GERMANY 5.217,7 11.322,6 8.950,3 8.475,4 7.361,9 4,07 4.479,0 5.518,8 23,21
KOREA SELATAN/SOUTH OF KOREA 7.553,0 18.228,8 14.094,2 7.712,5 9.602,6 -3,73 6.755,2 10.195,9 50,93
INDIA/INDIA 8.508,5 7.368,8 5.457,6 3.822,6 4.358,7 -18,08 1.827,1 20.772,4 1.036,89
NEGARA LAINNYA/OTHER COUNTRIES 18.118,2 16.546,3 8.749,4 6.408,1 5.169,8 -29,23 3.627,1 3.820,4 5,33
8704 Vehicles; for the transport of goods 252.286,9 102.928,1 80.331,1 72.505,0 53.528,3 -29,19 33.883,6 112.718,8 232,66
THAILAND/THAILAND 56.512,4 44.053,4 37.282,3 41.961,7 30.392,2 -12,10 21.552,4 39.898,8 85,12
INDIA/INDIA 21.932,2 2.716,4 10.857,7 12.233,5 7.574,8 -6,02 4.425,7 14.077,2 218,08
SWEDIA/SWEDEN 23.827,9 5.391,3 2.059,4 1.637,1 2.105,3 -45,36 1.307,6 5.855,4 347,79
JEPANG/JAPAN 72.813,0 24.724,2 14.678,3 8.918,1 3.430,1 -50,98 2.000,9 20.666,6 932,87
BELARUS/BELARUS 169,0 135,2 - - 2.816,0 - 1.351,7 - -
NEGARA LAINNYA/OTHER COUNTRIES 77.032,3 25.907,6 15.453,4 7.754,5 7.209,9 -44,81 3.245,3 32.220,9 892,84
8708 Motor vehicles; parts and accessories, of heading no. 8701 to 8705 294.085,0 338.653,4 295.620,8 287.420,1 273.403,5 -3,05 181.481,0 262.830,7 44,83
JEPANG/JAPAN 79.085,7 93.118,7 89.933,0 78.163,9 85.013,3 -0,30 56.728,2 82.101,1 44,73
THAILAND/THAILAND 109.711,5 122.860,3 105.563,9 123.359,3 79.864,4 -6,11 51.854,3 82.857,8 59,79
R.R. TIONGKOK/CHINA 43.291,9 48.720,1 44.485,0 40.420,5 58.600,8 4,28 38.946,0 51.706,4 32,76
INDIA/INDIA 3.884,5 9.754,8 13.823,9 9.806,0 11.490,5 24,29 8.117,5 9.777,5 20,45
PILIPINA/PHILIPPINES 6.063,8 7.802,1 8.740,1 4.254,3 6.263,5 -5,27 4.261,9 5.748,4 34,88
NEGARA LAINNYA/OTHER COUNTRIES 52.047,6 56.397,4 33.075,0 31.416,0 32.171,0 -14,34 21.573,1 30.639,5 42,03
8710 Tanks and other armoured fighting vehicles; motorised, whether or not fitted with weapons,
and parts of such vehicles
742,6 1.771,9 2.993,4 3.037,5 5.298,6 56,35 4.056,4 3.055,1 -24,68
JERMAN/GERMANY 100,7 180,5 2.344,8 2.033,2 2.804,9 147,82 1.785,6 1.300,4 -27,17
KOREA SELATAN/SOUTH OF KOREA 262,0 651,2 151,9 25,1 802,4 -9,67 799,2 595,3 -25,52
BRASILIA/BRAZIL - - - - 75,9 - 75,9 - -
BELGIA/BELGIUM - 0,2 0,0 1,8 1.030,1 - 1.004,0 809,8 -19,34
REPUBLIK CZECH/CZECH REPUBLIC 0,0 0,4 - 1,0 309,4 - 309,4 1,5 -99,53
NEGARA LAINNYA/OTHER COUNTRIES 379,9 939,7 496,6 976,4 275,8 -5,84 82,3 348,2 323,13
8714 Vehicles; parts and accessories of heading no. 8711 to 8713 181.607,4 170.977,3 186.528,0 161.560,9 187.071,5 0,03 128.891,8 121.714,9 -5,57
R.R. TIONGKOK/CHINA 130.297,2 128.596,6 152.437,9 132.797,8 159.189,9 4,42 109.746,9 97.213,0 -11,42
THAILAND/THAILAND 8.717,6 8.924,7 8.375,9 5.666,2 5.391,4 -13,20 3.430,3 5.305,8 54,68
JEPANG/JAPAN 4.723,7 1.849,4 3.322,7 1.852,6 1.402,1 -21,55 924,5 1.694,9 83,34
TAIWAN/TAIWAN, PROVINCE OF CHINA 7.207,1 6.991,3 9.312,6 7.908,4 8.456,9 4,53 6.032,7 7.073,6 17,25
INDIA/INDIA 1.139,7 1.966,7 4.597,1 5.514,6 5.516,2 51,97 3.843,1 4.551,5 18,43
NEGARA LAINNYA/OTHER COUNTRIES 29.522,1 22.648,6 8.481,9 7.821,3 7.114,9 -32,36 4.914,4 5.876,2 19,57
160

Lanjutan/Continued
Volume/Volume : Ton
2016 Trend (%)
12-16
Jan-Ags/Jan-AugJENIS BARANG DESCRIPTION OF
GOODS2015
No. 08.05.148
Perub. (%)
Change (%)
16-172016 2017
2012 2013 2014
TABEL 20.1 : VOLUME IMPOR 190 JENIS BARANG MENURUT NEGARA ASAL UTAMA
IMPORT VOLUME OF 190 COMMODITIES BY MAIN COUNTRY OF ORIGIN
KODE
CODE
HS
8803 Aircraft; parts of heading no. 8801 or 8802 1.360,6 1.252,8 1.000,6 849,4 1.430,8 -2,84 956,4 653,1 -31,71
PERANCIS/FRANCE 88,3 50,9 32,7 117,3 93,8 10,04 65,0 75,1 15,50
AMERIKA SERIKAT/UNITED STATES 441,8 385,7 389,9 416,6 218,1 -12,49 150,9 145,6 -3,54
SINGAPURA/SINGAPORE 425,9 79,1 42,6 49,8 294,2 -11,33 87,0 101,9 17,05
FEDERASI RUSIA/RUSSIA FEDERATION 4,4 333,2 2,7 37,6 31,4 19,07 29,1 22,5 -22,69
SPANYOL/SPAIN 47,8 65,6 175,0 39,4 205,9 27,25 99,8 19,3 -80,69
NEGARA LAINNYA/OTHER COUNTRIES 352,4 338,4 357,8 188,7 587,3 4,48 524,5 288,8 -44,93
8901 Cruise ships, excursion boats, ferry-boats, cargo ships, barges and similar vessels for the
transport of persons or goods
1.126.852,4 557.309,1 498.107,7 387.322,8 931.279,3 -7,18 357.711,0 670.173,7 87,35
SINGAPURA/SINGAPORE 312.153,3 93.829,0 44.465,1 29.986,5 291.159,4 -12,01 131.065,0 171.802,0 31,08
JEPANG/JAPAN 116.297,4 39.826,9 79.898,0 135.301,0 203.946,0 26,44 115.387,0 133.788,0 15,95
R.R. TIONGKOK/CHINA 323.811,2 205.772,0 115.515,3 77.203,0 91.359,2 -29,61 56.106,1 89.849,2 60,14
JERMAN/GERMANY 11.119,0 25.916,0 - - 122.669,0 - - 57.059,0 -
PANAMA/PANAMA 62.979,1 46.071,0 15.267,0 31.572,8 49.707,0 -8,16 9.596,0 4.850,0 -49,46
NEGARA LAINNYA/OTHER COUNTRIES 300.492,4 145.894,1 242.962,4 113.259,6 172.438,8 -12,75 45.556,9 212.825,5 367,16
9018 Instruments and appliances used in medical, surgical, dental or veterinary sciences,
including scintigraphic apparatus, other electro-medical apparatus and sight testing
instruments
13.702,0 24.151,0 17.808,0 20.236,7 25.497,2 11,24 15.310,3 24.514,3 60,12
JERMAN/GERMANY 425,0 10.689,5 1.043,8 1.628,8 2.013,6 13,08 1.296,3 1.909,9 47,34
AMERIKA SERIKAT/UNITED STATES 392,3 419,3 406,4 401,5 524,8 5,54 305,1 544,6 78,48
R.R. TIONGKOK/CHINA 3.919,3 4.911,9 4.917,0 4.611,5 7.608,9 13,47 3.390,1 6.442,1 90,03
JEPANG/JAPAN 819,4 1.252,7 1.040,4 793,1 911,8 -2,40 556,7 1.073,9 92,92
SINGAPURA/SINGAPORE 1.075,7 1.105,0 919,6 1.277,8 1.336,3 5,96 916,2 952,5 3,96
NEGARA LAINNYA/OTHER COUNTRIES 7.070,3 5.772,7 9.480,7 11.523,9 13.101,7 21,23 8.845,9 13.591,3 53,64
9022 X-ray, alpha, beta, gamma radiation apparatus; x-ray tubes, x-ray generators, high tension
generators, control panels and desks, screens, examination or treatment tables, chairs and
the like
1.063,7 1.155,1 1.040,8 1.118,7 1.962,1 12,66 1.000,4 1.310,1 30,96
JERMAN/GERMANY 97,1 101,1 138,0 116,6 311,3 28,04 140,2 146,7 4,68
R.R. TIONGKOK/CHINA 175,9 159,2 258,2 312,9 390,2 25,47 193,4 228,3 18,08
SINGAPURA/SINGAPORE 13,4 91,8 30,1 16,6 28,0 -2,33 16,0 25,9 62,28
LUKSEMBURG/LUXEMBOURG - - - - 104,8 - 104,8 - -
AMERIKA SERIKAT/UNITED STATES 148,9 210,2 176,2 101,7 209,0 -0,48 82,1 131,4 60,07
NEGARA LAINNYA/OTHER COUNTRIES 628,3 592,8 438,3 570,8 918,9 7,49 464,0 777,8 67,62
9031 Measuring or checking instruments, appliances and machines, n.e.c. or included in this
chapter; profile projectors
5.093,9 5.115,5 4.799,8 5.190,6 12.647,8 20,12 10.046,0 4.723,4 -52,98
R.R. TIONGKOK/CHINA 1.680,1 1.323,0 1.278,5 1.286,8 6.837,0 32,04 5.871,9 2.089,6 -64,41
JEPANG/JAPAN 1.691,3 2.235,2 2.097,6 1.774,2 1.612,3 -3,21 864,4 1.100,1 27,26
JERMAN/GERMANY 231,5 262,5 165,0 276,3 225,1 -0,05 132,7 161,9 21,95
SWEDIA/SWEDEN 11,6 6,0 20,5 10,9 281,7 101,02 257,3 9,8 -96,21
AMERIKA SERIKAT/UNITED STATES 196,8 214,3 213,8 151,0 154,1 -8,05 101,4 99,3 -2,02
NEGARA LAINNYA/OTHER COUNTRIES 1.282,6 1.074,7 1.024,5 1.691,4 3.537,7 28,18 2.818,2 1.262,7 -55,19
161

Lanjutan/Continued
Volume/Volume : Ton
2016 Trend (%)
12-16
Jan-Ags/Jan-AugJENIS BARANG DESCRIPTION OF
GOODS2015
No. 08.05.148
Perub. (%)
Change (%)
16-172016 2017
2012 2013 2014
TABEL 20.1 : VOLUME IMPOR 190 JENIS BARANG MENURUT NEGARA ASAL UTAMA
IMPORT VOLUME OF 190 COMMODITIES BY MAIN COUNTRY OF ORIGIN
KODE
CODE
HS
9032 Regulating or controlling instruments and apparatus; automatic type 10.737,4 15.360,7 11.016,1 11.030,2 11.151,0 -2,52 7.052,0 8.494,4 20,45
JEPANG/JAPAN 1.526,3 5.040,1 2.585,9 2.704,1 2.653,2 4,95 1.472,9 1.541,2 4,63
THAILAND/THAILAND 134,5 442,2 886,2 957,3 1.485,2 74,64 972,2 1.572,6 61,76
R.R. TIONGKOK/CHINA 5.333,9 4.571,4 3.823,1 3.312,5 3.780,2 -9,61 2.557,0 3.023,1 18,23
MALAYSIA/MALAYSIA 1.562,7 1.403,4 1.602,3 1.498,1 662,8 -15,21 479,1 433,3 -9,56
AMERIKA SERIKAT/UNITED STATES 167,5 159,4 178,9 168,9 403,8 19,94 324,9 173,8 -46,50
NEGARA LAINNYA/OTHER COUNTRIES 2.012,5 3.744,3 1.939,8 2.389,2 2.165,9 -2,98 1.245,8 1.750,3 40,49
9301 Military weapons; other than revolvers, pistols and arms of heading no. 9307 129,4 127,2 786,2 551,2 992,2 74,03 972,0 73,7 -92,42
BRASILIA/BRAZIL - - 530,1 416,8 654,0 - 654,0 0 -100,00
R.R. TIONGKOK/CHINA 0,1 48,0 25,3 - 180,6 - 180,6 - -
PERANCIS/FRANCE 6,1 27,0 45,3 29,7 23,5 32,05 21,7 6,6 -69,57
JERMAN/GERMANY 0,5 0,6 5,5 68,9 82,6 336,54 78,7 31,6 -59,85
AMERIKA SERIKAT/UNITED STATES 0,6 2,7 1,0 3,4 14,5 93,49 9,1 18,2 99,10
NEGARA LAINNYA/OTHER COUNTRIES 122,0 48,8 178,9 32,3 37,1 -24,38 28,0 17,3 -37,98
9401 Seats (not those of heading no. 9402), whether or not convertible into beds and parts thereof 54.785,9 58.322,4 52.908,6 52.019,7 52.925,5 -1,82 34.184,1 46.368,7 35,64
R.R. TIONGKOK/CHINA 40.287,5 43.274,3 38.793,6 38.094,1 40.287,9 -1,27 26.226,2 33.475,6 27,64
JEPANG/JAPAN 6.332,6 6.340,6 4.466,7 5.478,4 5.274,0 -4,99 3.269,3 4.551,0 39,20
THAILAND/THAILAND 3.109,4 3.979,1 3.840,6 2.999,8 2.355,8 -8,04 1.470,1 3.665,3 149,33
JERMAN/GERMANY 814,0 563,8 655,7 1.086,5 713,9 4,01 468,2 435,7 -6,95
MALAYSIA/MALAYSIA 1.242,2 1.224,5 1.311,1 954,9 984,6 -6,89 582,5 964,1 65,52
NEGARA LAINNYA/OTHER COUNTRIES 3.000,3 2.940,2 3.841,0 3.406,1 3.309,3 3,49 2.167,8 3.277,0 51,17
9405 Lamps, light fittings; including searchlights, spotlights and parts thereof, n.e.c.; illuminated
signs, name-plates and the like, having permanently fixed light source and parts thereof
n.e.c. or incl
21.589,8 25.153,4 19.631,9 25.951,2 37.964,8 12,30 24.581,2 27.076,0 10,15
R.R. TIONGKOK/CHINA 18.317,1 21.031,9 16.099,8 21.677,1 33.635,2 13,27 21.756,2 24.078,0 10,67
SINGAPURA/SINGAPORE 467,0 675,6 827,7 567,7 870,3 11,30 618,8 641,1 3,61
JERMAN/GERMANY 73,0 119,3 118,4 167,1 150,4 19,51 104,2 78,8 -24,35
MALAYSIA/MALAYSIA 1.133,6 1.680,9 1.098,5 1.736,3 1.230,1 1,98 678,9 836,1 23,14
JEPANG/JAPAN 71,4 114,3 53,5 78,0 160,7 13,21 86,4 100,8 16,66
NEGARA LAINNYA/OTHER COUNTRIES 1.527,7 1.531,4 1.433,9 1.724,9 1.918,0 5,91 1.336,7 1.341,2 0,34
9801 Deployment goods 161.288,5 122.601,6 96.184,8 41.913,3 42.039,3 -31,36 26.436,6 53.810,5 103,55
JEPANG/JAPAN 151.410,6 115.769,7 94.073,9 41.625,3 38.574,5 -31,32 25.857,5 46.777,8 80,91
THAILAND/THAILAND 993,2 314,1 - - 3.424,5 - 564,2 7.028,9 1.145,75
SINGAPURA/SINGAPORE 0,0 0,0 0,0 0,1 40,2 440,32 14,8 3,5 -76,63
AMERIKA SERIKAT/UNITED STATES 0,5 0,7 0,2 0,4 0,1 -29,65 0,1 0,3 179,28
DENMARK/DENMARK - - - - 0,0 - 0,0 - -
NEGARA LAINNYA/OTHER COUNTRIES 8.884,2 6.517,1 2.110,7 287,5 0,0 -93,70 0,0 0,0 -
Sumber/Source : Badan Pusat Statistik (diolah, Pusat Data dan Sistem Informasi, Kementerian Perdagangan)/Central Board of Statistics (processed by Trade Information & Data Centre, Ministry of Trade)
162