Embed Size (px)
Citation preview

THE SMAP IN SITU SOIL MOISTURE SENSOR TESTBED:
COMPARING IN SITU SENSORS FOR SATELLITE VALIDATION

• Lead Scientist: Michael Cosh (USDA-ARS-Beltsville)• Local Lead: Tyson Ochsner (Oklahoma State Univ.)• Field Managers: Chris Stansberry (OSU) and Lynn McKee (ARS)• Sensor Leads
o Base Stations: Michael Cosho COSMOS: Marek Zreda (U.Ariz)o GPS Reflectometers: Eric Small (Colorado) & John Braun (UCAR)o Mesonet: Jeff Basara (OU-OCS)o CRN: Michael Palecki and John Kochendorfer (NOAA)o Passive DTS: Susan Steele-Dunne (Delft Univ.), John Selker (Oregon State), o TDR: Steve Evett (USDA-ARS-Bushland) and Tyson Ochsner (OSU)
SMAP In Situ Sensor TestbedTestbed Team

• Managed by OSU Range Research Station
• Local support from OSU Dept. Plant and Soil Science
• Rangeland/Pasture• Co-located with Oklahoma
Mesonet MARE site• Two NOAA CRN stations
nearby (1 additional installed on site)
• Long Term Access ~ 6 years• >700 m Domain for
COSMOS
OSU Range Research
~700 m
SMAP In Situ Sensor TestbedSite Selection
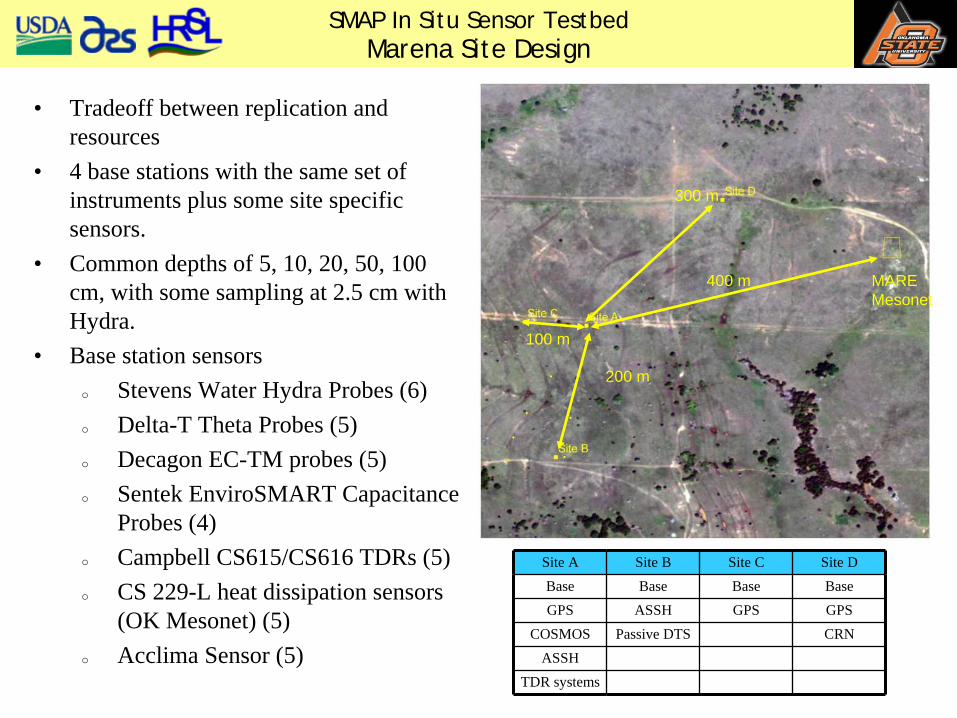
• Tradeoff between replication and resources
• 4 base stations with the same set of instruments plus some site specific sensors.
• Common depths of 5, 10, 20, 50, 100 cm, with some sampling at 2.5 cm with Hydra.
• Base station sensorso Stevens Water Hydra Probes (6)o Delta-T Theta Probes (5)o Decagon EC-TM probes (5)o Sentek EnviroSMART Capacitance
Probes (4)o Campbell CS615/CS616 TDRs (5)o CS 229-L heat dissipation sensors
(OK Mesonet) (5)o Acclima Sensor (5)
300 m
400 m
200 m
100 m
MAREMesonet
Site A Site B Site C Site DBase Base Base BaseGPS ASSH GPS GPS
COSMOS Passive DTS CRNASSH
TDR systems
SMAP In Situ Sensor TestbedMarena Site Design

• Installation in May 2010
Site A
SMAP In Situ Sensor TestbedInstallation

Site Management
OSU Range Research StationChris StansberryStation Superintendent
Grazed at moderate stocking rate3 ha animal-1
Controlled burns for ecological function3 year return interval

Continental Climate
Jan Feb Mar Apr May Jun Jul Aug Sep Oct Nov Dec-5
0
5
10
15
20
25
30
35
40
Air
tem
pera
ture
( C
)
2010
Jan Feb Mar Apr May Jun Jul Aug Sep Oct Nov Dec0
20
40
60
80
100
120
140
160
180
Pre
cipi
tatio
n (m
m)
TmaxTminPrecip.

Heterogeneous Soil

Spatial Variability in Soil Texture
0 10 20 30 40 50 60 700
20
40
60
80
100
Clay content (%)D
epth
(cm
)
Site ASite BSite CSite D

Tallgrass Prairie Vegetation
Little bluestemSchizachyrium scoparium (Michx.) Nash
Big bluestemAndropogon gerardii Vitman
IndiangrassSorghastrum nutans (L.) Nash
Post oakQuercus stellata Wang
Eastern redcedarJuniperus virginiana L.

Routine Vegetation Sampling
• Every 2 weeks April- Oct.
• Measuring– vegetation height– above-ground biomass– vegetation water
content– soil water content, 0-6
cm

Example Vegetation Data

• Theta probe measurements of volumetric water content, 0-6 cm
• 8 radial transects out from Site A
• 8 points per transect• 50 m between points
Routine Soil Moisture Surveys

• Monthly Samplingo Vegetation Collection o Gravimetric Samplingo Theta Probe Sampling
• Intensive Observationso High Density Samplingo Soil Profiles
SMAP In Situ Sensor TestbedValidation Sampling Campaigns

0.00
1.80
3.61
5.41
7.22
0.00 114.39 228.78 343.17
Sem
ivar
ianc
e
Separation Distance h (m)
0.00
1.68
3.37
5.05
6.74
0.00 120.15 240.30 360.45
Sem
ivar
ianc
e
Separation Distance h (m)
October 18, 2010
%9.5
Exponential semivariogramNugget: 0.19Sill: 6.2Range: 36 m
October 19, 2010
%2.24
Exponential semivariogramNugget: 1.53Sill: 5.52Range: 31 m
Rainfall 2.94 cm
Example Soil Moisture Survey Data

Site A – Main Station

Provide replicate sampling of gravimetric soil moisture at sites and over domain
All soil moisture validation is referenced to physically collected soil moisture estimates.
SMAP In Situ Sensor TestbedValidation Campaigns

0
0.1
0.2
0.3
0.4
0.5
0.6
8/10 8/20 8/30 9/9 9/19 9/29 10/9 10/19
Date
Volu
met
ric S
oil M
oist
ure
0
20
40
60
80
100
120
140
Prec
ip in
mm
CS616
Hydra
Theta
Acclima
Sentek
Echo
Trime
Spatial
Rain
SMAP In Situ Sensor TestbedPreliminary Data: Site A 5 cm depth

0
0.1
0.2
0.3
0.4
0.5
0.6
5/12 6/1 6/21 7/11 7/31 8/20 9/9 9/29 10/19
Date
Volu
met
ric S
oil M
oist
ure
0
20
40
60
80
100
120
140
Prec
ip in
mm
CS616
Hydra
Theta
Acclima
Sentek
Echo
Trime
Spatial
Rain
Preliminary Data: Site A 5 cm depthSMAP In Situ Sensor Testbed

SMAP In Situ Sensor TestbedEarly Conclusions
• Installation practices and procedures should be standardized, vertical versus horizontal orientation
• Temperature sensors necessary to correct for low temperature errors in soil moisture signals
• Raingage records are important for erroneous readings and troubleshooting.• Calibration is critical for all sensors.• Diurnal patterns can be significant for some surface sensors ( ~4%) depending
on temperature range
Still to be Finished• Calibrations• Quality Assurance development

• Installation and deployments• COSMOS Rover (June 2011)• Assess Replacement Needs• Sensor Calibrations• Flux and Scintillometer?
• Experiments• Cosmos Rover (future visits)• Intensive Campaigns (ongoing 4 month rotation)• Burn Study (Spring 2012)• Incorporation into large scale field experimentation?
• Additional Testbeds• Regional Network (pending resources)• Sterling (VA) site with Node network• Workshop – Spring 2011
SMAP In Situ Sensor TestbedFuture Plans

Additional Intensive
Monitoring Nearby

SMAP In Situ Sensor TestbedSurrounding Area

Extensive
Monitoring Across the State
Oklahoma Mesonet

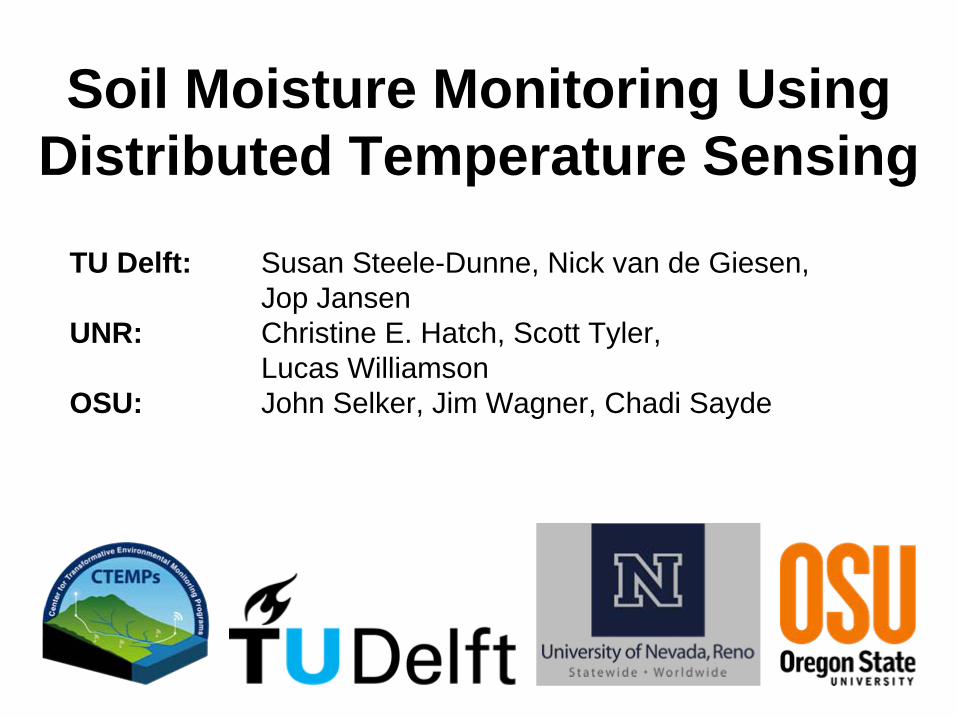
Soil Moisture Monitoring Using Distributed Temperature Sensing
TU Delft: Susan Steele-Dunne, Nick van de Giesen, Jop Jansen
UNR: Christine E. Hatch, Scott Tyler, Lucas Williamson
OSU: John Selker, Jim Wagner, Chadi Sayde
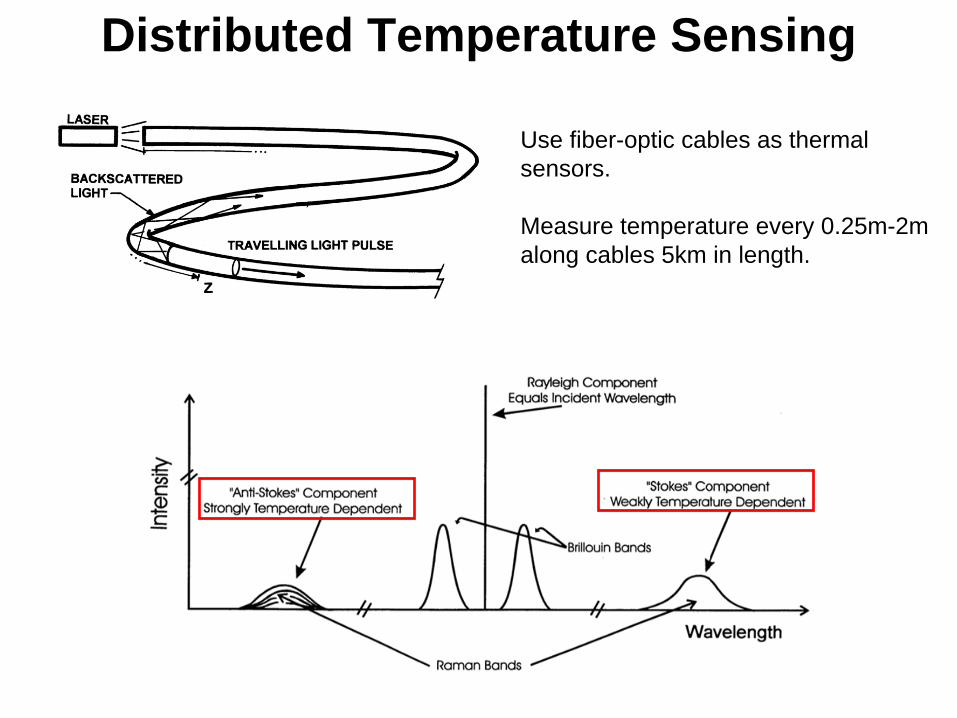
Distributed Temperature Sensing
Use fiber-optic cables as thermal sensors.
Measure temperature every 0.25m-2m along cables 5km in length.

Pulse length=20 minutes
Current, I=3.875A
Resistance, R= 0.18 Ω/m
B
AC
EAST:226 m
WEST:126 m
NORTH:307 m
Soil moisture monitoring using Active DTS at ISST
Cables installed October 2010
5cm Active/Passive
10cm, 15cm Passive
Oryx DTS system, solar panels, calibration baths at Enclosure B

Cable Depths
5cm (Active,Passive)
10cm (Passive),
15cm (Passive)
Minimizing disturbance:
Wheel: Cuts through roots, scores surface
Blade: installs cable
Roller: Flattens surface after cable installed
Soil Moisture using Distributed Temperature Sensing

Solar panels & batteries
DTS Unit & Computer
Jumper cables for Active Measurements
Calibration baths
(~60m each cable, compare to Pt100)
Equipment at Enclosure