Embed Size (px)
Citation preview
Soil Moisture Active Passive (SMAP)
Ancillary Data Report
Precipitation Preliminary, v.1 SMAP Science Document no. 049 R. Scott Dunbar Jet Propulsion Laboratory California Institute of Technology Pasadena, CA January 11, 2013 JPL D-53063 Jet Propulsion Laboratory California Institute of Technology
© 2013 California Institute of Technology. Government sponsorship acknowledged.
ANCILLARY DATA REPORT JANUARY 2013 PRECIPITATION
i
Preface The SMAP Ancillary Data Reports provide descriptions of ancillary data sets used with the science algorithm software in generation of the SMAP science data products. The Ancillary Data Reports may undergo additional updates as new ancillary data sets or processing methods become available. The most recent versions of the ancillary data reports will be made available, along with the Algorithm Theoretical Basis Documents (ATBDs), at the SMAP web site http://smap.jpl.nasa.gov/science/dataproducts/ATBD/.
ANCILLARY DATA REPORT JANUARY 2013 PRECIPITATION
ii
Table of Contents
Preface .................................................................................................................................. i 1 Overview ....................................................................................................................... 1
1.1 Purpose .............................................................................................................................. 1 1.2 Requirement ....................................................................................................................... 1 1.2.1 Measurement Characteristics .......................................................................... 1 1.2.2 Units ................................................................................................................ 2 1.2.3 Further considerations ..................................................................................... 2
2 Datasets Considered ...................................................................................................... 3 2.1 Global Precipitation Mission/Constellation (GPM) .......................................................... 3 2.2 CMORPH .......................................................................................................................... 3 2.3 NWP Precipitation Model Forecasts ................................................................................. 4
3 Selection and Description of Primary and Secondary Datasets .................................... 5 3.1 Primary Dataset: ECMWF Total Precipitation Forecasts .................................................. 5 3.2 Secondary Dataset: GMAO GEOS 5.7.2 Total Precipitation ............................................ 6 3.3 Secondary Dataset: NCEP GFS Surface Flux Total Precipitation .................................... 6
4 Recommended SMAP Usage ........................................................................................ 6 5 Acknowledgments ......................................................................................................... 7 6 References ..................................................................................................................... 7 Appendix A: SMAP Science Data Products and ATBDs .................................................. 9 Appendix B: SMAP Ancillary Data Reports ................................................................... 10 Appendix C: List of Acronyms ........................................................................................ 11
ANCILLARY DATA REPORT JANUARY 2013 PRECIPITATION
1
1 Overview
1.1 Purpose
The purpose of this report is to evaluate options and select a precipitation dataset to be used for generating flags for the SMAP science data products. The precipitation dataset is one of a suite of ancillary datasets required by the SMAP science processing algorithms. The algorithms and ancillary data are described in SMAP algorithm theoretical basis documents (ATBDs) and ancillary data reports. The ATBDs and ancillary data reports are listed in Appendices A and B and are available at the SMAP web site: http://smap.jpl.nasa.gov/science/dataproducts/ATBD/.
This report contains a preliminary assessment of the utility of various sources of precipitation information, and provides a recommendation of a precipitation product to be used in conjunction with the SMAP soil moisture and freeze-thaw algorithms.
1.2 Requirement
1.2.1 Measurement Characteristics
SMAP measurements of brightness temperature and radar backscatter at L-band are less affected by atmospheric attenuation and liquid water content than those of other remote sensing instruments operating at higher frequencies. The primary impact of precipitation on SMAP measurements and soil moisture retrievals is due to short-term surface wetting of vegetation and standing water, which produces transient changes of the observed dielectric constant of the scene. It is desirable to have the ability to flag SMAP observations and retrievals where there is a high probability of recent precipitation in order to characterize the quality of the retrievals.
SMAP soil moisture and freeze-thaw algorithms require some indication or measure of recent precipitation at a given location. It is not necessary to have an instantaneous measure of precipitation in order to correct the instrument observations or the retrievals; for flagging soil moisture and freeze-thaw retrievals knowledge of recent rainfall within the last 6-12 hours would be a useful quality indicator.
The SMAP soil moisture algorithms operate at three fundamental resolutions: • Active (radar): 3 km resolution, limited to the outer 350 km on each side of the 1000 km
instrument swath • Passive (radiometer): 40 km resolution, corresponding to the 3 dB antenna pattern field
of view (FOV) • Active/passive (combined radar/radiometer): 10 km resolution, by using the high-
resolution radar observations to provide information about scene inhomogeneity within the radiometer FOV
The SMAP freeze-thaw algorithms use the 3 km resolution radar observations exclusively.
Rain events are typically spatially compact (< 5-10 km) and temporally transient. Since SMAP will not have the ability to detect rain by an independent means, it is necessary to rely on outside ancillary data sources:
• Collocation with data from other spaceborne instruments capable of detecting rain. Unless the other satellite has similar coverage and is in a similar orbit, “entrained” with
ANCILLARY DATA REPORT JANUARY 2013 PRECIPITATION
2
SMAP, this leads to variable latency and inconsistent availability of information over particular latitude bands. This also implies that the precipitation data from the other satellite must be made available in a timely manner to use in SMAP processing.
• Numerical weather model forecasts. Several agencies produce regional and global precipitation forecasts at various spatial/temporal resolutions and data latencies. Model performance versus actual occurrence of precipitation is variable and needs to be analyzed in any comparison of candidate datasets.
Precipitation dataset spatial resolution should be at least of the order of the size of a SMAP radiometer footprint (~40 km), and preferably should be at the scale of the active-passive retrievals (~10 km). Global precipitation data at the scale of the SMAP radar observations (1 km - 3 km) is unlikely to be available from forecast models in the time frame of the mission; this would only be feasible with contemporaneous spaceborne rain detections.
The dataset should be concurrent with SMAP observations within 1-3 hours or less. Forecast data should be as close to the synoptic analysis time as possible to maximize accuracy. Re-analysis datasets and climatologies are unsuitable for this application.
1.2.2 Units
Measurements of precipitation are usually provided as either an instantaneous precipitation intensity, in terms of rain rate (mm/hr) or columnar rain rate (km-mm/hr), or as an integrated, cumulative precipitation (mm) within a given time period. Cumulative rainfall can be converted to a mean intensity (mm/hr over the time interval) if desired. Direct satellite measurements of precipitation typically provide instantaneous rain intensities, while NWP forecasts and in situ (rain guage) measurements are provided as integrated quantities. Some NWP forecast models for surface fluxes provide precipitation in mass flux units, such as kg/m2/sec.
To flag SMAP soil moisture and freeze-thaw algorithms for rain, we are seeking both a binary indication (rain/no rain) as well as a measure of the intensity of any recent precipitation events at a given location. Collocation with contemporaneous satellite measurements of rain rate might miss rain events of the recent (few hours) past. Cumulative measures as provided by NWP are acceptable for SMAP.
1.2.3 Further considerations
There are various trade-offs to be assessed in selecting an optimal precipitation dataset. Satellite-based rain measurements are limited by the coverage and timeliness of the data relative to SMAP. If measurements from multiple satellites and instrument types are used, the coverage problem is ameliorated, but the calibration consistency of the measurements across the various systems has to be considered. Another factor that is important to SMAP applications is that there are problems with satellite-based precipitation estimates over land. Passive microwave measurements of rainfall do not capture rainfall from warm clouds, a major source of heavy rain over land (Petty and Krajewski, 1996).
Precipitation estimates from numerical weather products (NWP) are only as good as their physical models and data assimilation inputs. Global numerical forecast models have improved considerably in recent years in both spatial resolution and the quality and quantity of observational data that is assimilated.
ANCILLARY DATA REPORT JANUARY 2013 PRECIPITATION
3
2 Datasets Considered
2.1 Global Precipitation Mission/Constellation (GPM)
GPM is a joint mission with the Japan Aerospace Exploration Agency (JAXA) and other international partners. Its science objectives are: to improve ongoing efforts to predict climate by providing near-global measurement of precipitation, its distribution, and physical processes; to improve the accuracy of weather and precipitation forecasts through more accurate measurement of rain rates and latent heating; and to provide more frequent and complete sampling of the Earth's precipitation.
The GPM Core mission consists of the JAXA DPR (Dual-frequency Precipitation Radar) and the NASA GMI (GPM Microwave Imager). The core instruments will serve as a reference platform to cross-calibrate other microwave sensors of the GPM Constellation. This international constellation of NASA and contributed spacecraft will provide frequent precipitation measurements on a global basis, calibration/validation sites distributed globally with a broad array of precipitation-measuring instrumentation, and a global precipitation data system to produce and distribute global rain maps and climate research products.
The GPM project plans to provide precipitation data in near-real time, within 1-3 hours of data collection, 90% of the time (Stocker, 2010). These products will be available for Level 1 brightness temperatures, Level 2 swath-based IFOV retrievals and gridded Level 3 (0.1° x 0.1° hourly for each day).
2.2 CMORPH
CMORPH (NOAA CPC MORPHing technique) produces global precipitation analyses at very high spatial and temporal resolution. This technique uses precipitation estimates that have been derived from low-orbiting satellite microwave observations, and then transports the features of those observations via spatial propagation information that is obtained from geostationary satellite IR data. At present CMORPH uses precipitation estimates derived from the passive microwaves aboard the DMSP 13, 14 & 15 (SSM/I), the NOAA-15, 16, 17 & 18 (AMSU-B), and AMSR-E and TMI aboard NASA's Aqua and TRMM spacecraft, respectively. These estimates are generated by the algorithms of Ferraro (1997) for SSM/I, Ferraro et al. (2000) for AMSU-B and Kummerow et al. (2001) for TMI. Note that this technique is not a precipitation estimation algorithm but a means by which estimates from existing microwave rainfall algorithms can be combined and then spatially and temporally propagated. The method is extremely flexible, such that any precipitation estimates from any microwave satellite source can be incorporated.
With regard to spatial resolution, although the precipitation estimates are available on a grid with a spacing of 8 km (at the equator), the resolution of the individual satellite-derived estimates is coarser than that, of the order of 12 x 15 km or so. The finer "resolution" is obtained via interpolation.
Geostationary IR data are used as a means to transport the microwave-derived precipitation features during periods when microwave data are not available at a location. Computing spatial lag correlations on successive images of geostationary satellite IR produces propagation vector matrices that are then used to propagate the microwave derived precipitation estimates. This process governs the movement of the precipitation features only. At a given location, the shape and intensity of the precipitation features in the intervening half hour periods between microwave scans are determined by performing a time-weighted interpolation between microwave-derived features that have been propagated forward in time from the previous microwave observation and

ANCILLARY DATA REPORT JANUARY 2013 PRECIPITATION
4
those that have been propagated backward in time from the following microwave scan. This latter step is referred to as "morphing" of the features.
In summary, the main features of the CMORPH data set are as follows: • Grid Resolution: 0.07277 degrees lat/lon (8 km at the equator) • Temporal Resolution: 30 minutes • Latency: within ~18 hours past real-time • Domain: Global (60N - 60S) << (NOTE: misses high boreal latitudes) • Period of Record: December 3, 2002 to present • Source URL: ftp://ftp.cpc.ncep.noaa.gov/precip/global_CMORPH/30min_8km/
Figure 1. An example of a CMORPH 8 km precipitation product.
2.3 NWP Precipitation Model Forecasts
Currently, ECMWF forecasts are being downloaded routinely to the SMAP Testbed system. Other available forecast products are those from NCEP and GMAO/MERRA. The NCEP and GMAO products’ characteristics are summarized in section 3.2; these have not been examined up to this point in the selection process, but could be alternative or secondary products in cases where the primary product is not available for SMAP processing. ECMWF has been considered as the primary source, because it is used by SMOS and because it is generally considered to be a superior product. The products provide global coverage, with estimates based on model outputs, using assimilated in situ and satellite observations. Due to the present difficulties with satellite-based retrievals of precipitation over land, NWP precipitation model forecasts are to be preferred over satellite products such as GPM or CMORPH for SMAP applications.
ECMWF precipitation forecasts are time-integrated values from the analysis epoch of the forecast. Forecast sets are provided for analysis epochs at 0z and 12z daily. Forecast fields are
ANCILLARY DATA REPORT JANUARY 2013 PRECIPITATION
5
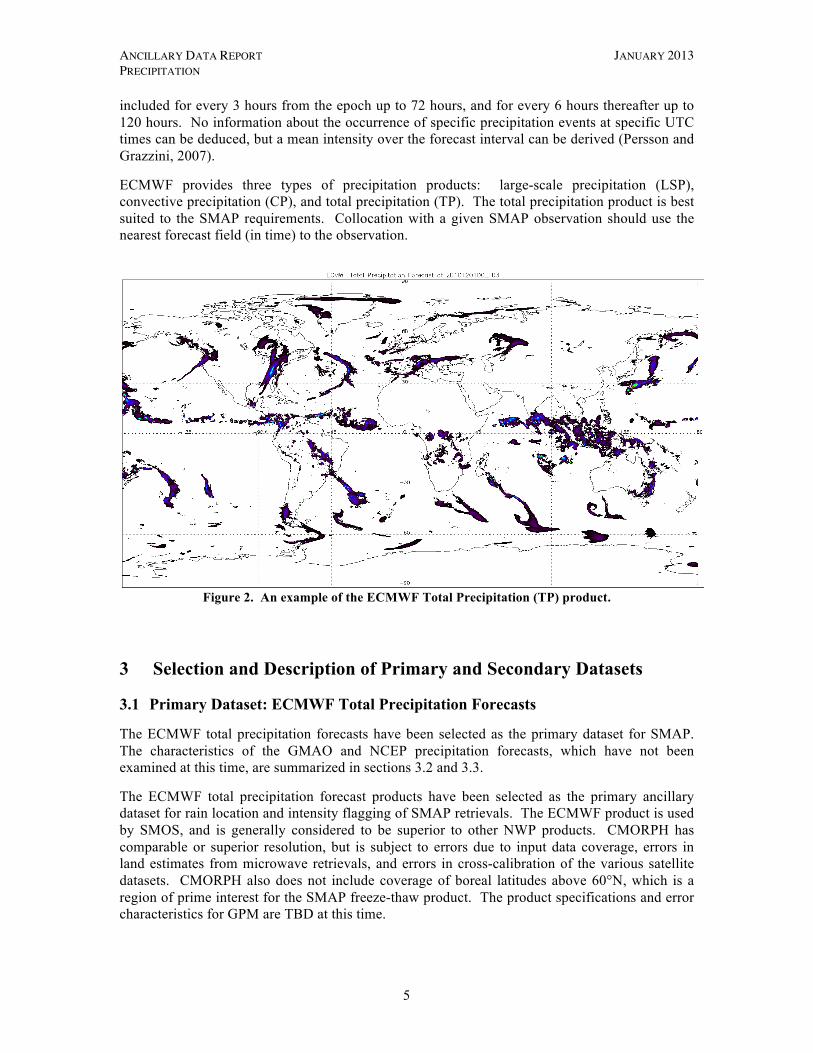
included for every 3 hours from the epoch up to 72 hours, and for every 6 hours thereafter up to 120 hours. No information about the occurrence of specific precipitation events at specific UTC times can be deduced, but a mean intensity over the forecast interval can be derived (Persson and Grazzini, 2007).
ECMWF provides three types of precipitation products: large-scale precipitation (LSP), convective precipitation (CP), and total precipitation (TP). The total precipitation product is best suited to the SMAP requirements. Collocation with a given SMAP observation should use the nearest forecast field (in time) to the observation.
Figure 2. An example of the ECMWF Total Precipitation (TP) product.
3 Selection and Description of Primary and Secondary Datasets
3.1 Primary Dataset: ECMWF Total Precipitation Forecasts
The ECMWF total precipitation forecasts have been selected as the primary dataset for SMAP. The characteristics of the GMAO and NCEP precipitation forecasts, which have not been examined at this time, are summarized in sections 3.2 and 3.3.
The ECMWF total precipitation forecast products have been selected as the primary ancillary dataset for rain location and intensity flagging of SMAP retrievals. The ECMWF product is used by SMOS, and is generally considered to be superior to other NWP products. CMORPH has comparable or superior resolution, but is subject to errors due to input data coverage, errors in land estimates from microwave retrievals, and errors in cross-calibration of the various satellite datasets. CMORPH also does not include coverage of boreal latitudes above 60°N, which is a region of prime interest for the SMAP freeze-thaw product. The product specifications and error characteristics for GPM are TBD at this time.
ANCILLARY DATA REPORT JANUARY 2013 PRECIPITATION
6
The current ECMWF model outputs are provided in GRIB format on the N640 gaussian grid at approximately 16 km resolution. These are interpolated using the ECMWF MARS software suite to 0.125°x0.125° rectangular latitude/longitude grids. The model resolution of the order of the resolution of the planned SMAP active/passive soil moisture retrieval product.
The forecast suite is provided twice daily, for analysis epochs (AE) of 0z and 12z. The latency of reception of the data at JPL is less than 6 hours from the epoch time. Forecasts for AE+3 hrs, AE+6 hrs, AE+9 hrs, and AE+12 hours are extracted for use in the SMAP processing, giving 3-hourly coverage throughout a given day.
The total precipitation estimates are provided in meters of cumulative rainfall since the AE. The precision of the interpolated estimates is of the order of 0.0001 meter (0.1 mm). A mean rain rate over the forecast interval in mm/hr can be derived simply as:
Mean Rain Rate = 1000.*TP(m)/(forecast time) (1)
3.2 Secondary Dataset: GMAO GEOS 5.7.2 Total Precipitation
Primary characteristics of the data product: • 0.3125° x 0.25° rectangular longitude/latitude grid (1152x721) • Hourly forecasts (on the half-hour: 0:30, 1:30, 2:30,… UTC) • Native format: NetCDF4 • Contained in the GEOS572 FP 2d land surface diagnostics product, and the GEOS572 FP
2d surface flux diagnostics product (PRECTOT). • Units: kg/m2/s (mass flux) • Available from http://gmao.gsfc.nasa.gov/forecasts.
3.3 Secondary Dataset: NCEP GFS Surface Flux Total Precipitation
Primary characteristics of the data product: • T574 Gaussian grid (approx. 0.2° resolution, 1760x880) • Forecasts at AE + [0,3,6,9,… hrs], AE at [0,6,12,18] UTC • Native format: GRIB2 • Contained in the GFS surface flux product (PRATE – instantaneous total precipitation
rate). • Units: kg/m2/s (mass flux) • Available from NCEP FTP site:
ftp://ftpprd.ncep.noaa.gov/pub/data/nccf/com/gfs/prod/gfs.<yyyymmddhh>
4 Recommended SMAP Usage One component of the operational SMAP processing system is the reception of dynamic ancillary data from external sources. The ECMWF total precipitation products are in this category. The SMAP SDS will receive the ECMWF products via FTP download or by a “push” from ECMWF (currently it is a “push” process). Upon reception, the TP products will be extracted from the GRIB package files and interpolated to a common grid (for example, 0.125°x0.125° [2880x1441] rectangular lat/lon). The filename convention has not been established, but it is recommended that the filename include at least the following information:
ANCILLARY DATA REPORT JANUARY 2013 PRECIPITATION
7
PRECIP_ECMWF_yyyy_mm_dd_hh_ff
where PRECIP denotes the ancillary precipitation data type, ECMWF denotes the source of the product, yyyy = year, mm = month, dd = day of month, hh = analysis epoch (00 or 12), and ff = forecast time after AE (03, 06, 09, 12). Depending upon what format standard is established for the dynamic ancillary data, other metadata information should include the source filename of the original data package, the date and time of the data (as above), the data units and scale factors.
Within the SMAP soil moisture and freeze-thaw retrieval processors, the precipitation data should be collocated with the SMAP pixel using a nearest-neighbor algorithm, i.e. if the center of the pixel falls in an ECMWF grid cell. A non-zero value of TP in the ECMWF grid cell indicates the presence of rain. The mean rainfall intensity may also be desired, and can be computed via eq. (1). As of this time the precise usage of the ancillary precipitation data by the SMAP algorithms, other than as an additional quality indicator, has not been specified.
5 Acknowledgments The author would like to acknowledge the help of several colleagues in the preparation of this report. SMAP Science Definition Team members Robert Gurney and Yann Kerr provided valuable advice, based on their own experiences with the relative quality of various NWP products and CMORPH. Joseph Turk has kept me posted on the progress of GPM.
This work was carried out at the Jet Propulsion Laboratory, California Institute of Technology, under contract with the National Aeronautics and Space Administration.
6 References Ferraro, R. R. (1997): SSM/I derived global rainfall estimates for climatological applications, J. Geophys. Res., 102, 16715-16735. Ferraro, R. R., F. Weng, N. C. Grody and L. Zhao (2000): Precipitation characteristics over land from the NOAA-15 AMSU sensor, Geophys. Res. Letters, 27, 2669-2672.
Joyce, R. J., J. E. Janowiak, P. A. Arkin, and P. Xie (2004): CMORPH: A method that produces global precipitation estimates from passive microwave and infrared data at high spatial and temporal resolution, J. Hydromet., 5, 487-503.
Kummerow, C., Y. Hong, W. S. Olson, S. Yang, R. F. Adler, J. McCollum, R. Ferraro, G. Petty, D-B Shin, and T. T. Wilheit (2001): Evolution of the Goddard profiling algorithm (GPROF) for rainfall estimation from passive microwave sensors, J. Appl. Meteorol., 40, 1801-1820.
Lucchesi, R. (2011): GEOS-5.7.2 File Specification, Version 1.4. November 30, 2011. Available in PDF at: http://gmao.gsfc.nasa.gov/products/documents/GEOS-5%207%202_File_Specification_v1_4.pdf.
NCEP (2011): The Global Forecast System (GFS) - Global Spectral Model (GSM). Description of GFS surface flux products. http://www.emc.ncep.noaa.gov/GFS/doc.php.
Persson, A. and Grazzini, F. (2007): User Guide to ECMWF forecast products. Meteorological Bulletin M3.2, Version 4, March 2007. Obtainable from ECMWF at http://www.ecmwf.int/products/forecasts/guide/user_guide.pdf.

ANCILLARY DATA REPORT JANUARY 2013 PRECIPITATION
8
Petty, G. W., and Krajewski, W. F., 1996: Satellite estimation of precipitation over land. J. Hydrological Sciences, 41, 4, 433-451.
Stocker, E. F. , 2010: GPM Data Products and Data System Status. Presentation given at the 1st NOAA GPM Users Workshop, August 18, 2010. Available at: http://www.star.nesdis.noaa.gov/star/documents/meetings/GPM2010/dayOne/Stocker.pdf

ANCILLARY DATA REPORT JANUARY 2013 PRECIPITATION
9
Appendix A: SMAP Science Data Products and ATBDs
The SMAP Algorithm Theoretical Basis Documents are available at the SMAP web site http://smap.jpl.nasa.gov/science/dataproducts/ATBD/.
Data Product Description ATBD L1A_Radar Radar raw data in time
order (Joint with L1C_S0_HiRes)
L1A_Radiometer Radiometer raw data in time order
(Joint with L1B_TB)
L1B_S0_LoRes Low resolution radar σo in time order
(Joint with L1C_S0_HiRes)
L1C_S0_HiRes High resolution radar σo (half orbit, gridded)
West, R., L1B & L1C radar products, JPL D-53052, JPL, Pasadena, CA.
L1B_TB Radiometer TB in time order
Piepmeier, J. et al., L1B radiometer product, GSFC SMAP-006, GSFC, Greenbelt, MD.
L1C_TB Radiometer TB (half orbit, gridded)
Chan, S. et al., L1C radiometer product, JPL D-53053, JPL, Pasadena, CA.
L2_SM_A Soil moisture (radar, half orbit)
Kim, S. et al., L2 & L3 radar soil moisture (active) product, JPL D-66479, JPL, Pasadena, CA.
L2_SM_P Soil moisture (radiometer, half orbit)
O’Neill, P. et al., L2 & L3 radiometer soil moisture (passive) product, JPL D-66480, JPL, Pasadena, CA.
L2_SM_AP Soil moisture (radar/radiometer, half orbit)
Entekhabi, D. et al., L2 & L3 radar/radiometer soil moisture (active/passive) products, JPL D-66481, JPL, Pasadena, CA.
L3_FT_A Freeze/thaw state (radar, daily composite)
McDonald, K. et al., L3 radar freeze/thaw (active) product, JPL D-66482, JPL, Pasadena, CA.
L3_SM_A Soil moisture (radar, daily composite)
(Joint with L2_SM_A)
L3_SM_P Soil moisture (radiometer, daily composite)
(Joint with L2_SM_P)
L3_SM_AP Soil moisture (radar/radiometer, daily composite)
(Joint with L2_SM_AP)
L4_SM Soil moisture (surface & root zone)
Reichle, R. et al., L4 surface and root-zone soil moisture product, JPL D-66483, JPL, Pasadena, CA.
L4_C Carbon net ecosystem exchange (NEE)
Kimball, J. et al., L4 carbon product, JPL D-66484, JPL, Pasadena, CA.
ANCILLARY DATA REPORT JANUARY 2013 PRECIPITATION
10
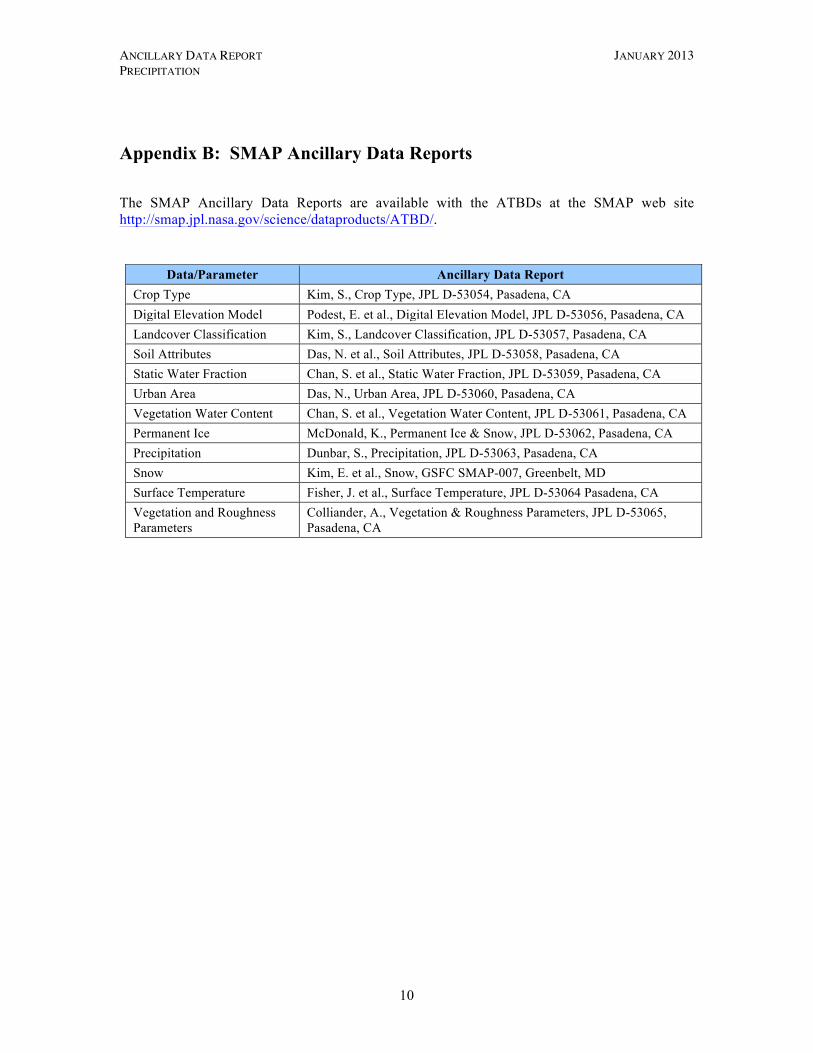
Appendix B: SMAP Ancillary Data Reports
The SMAP Ancillary Data Reports are available with the ATBDs at the SMAP web site http://smap.jpl.nasa.gov/science/dataproducts/ATBD/.
Data/Parameter Ancillary Data Report Crop Type Kim, S., Crop Type, JPL D-53054, Pasadena, CA Digital Elevation Model Podest, E. et al., Digital Elevation Model, JPL D-53056, Pasadena, CA Landcover Classification Kim, S., Landcover Classification, JPL D-53057, Pasadena, CA Soil Attributes Das, N. et al., Soil Attributes, JPL D-53058, Pasadena, CA Static Water Fraction Chan, S. et al., Static Water Fraction, JPL D-53059, Pasadena, CA Urban Area Das, N., Urban Area, JPL D-53060, Pasadena, CA Vegetation Water Content Chan, S. et al., Vegetation Water Content, JPL D-53061, Pasadena, CA Permanent Ice McDonald, K., Permanent Ice & Snow, JPL D-53062, Pasadena, CA Precipitation Dunbar, S., Precipitation, JPL D-53063, Pasadena, CA Snow Kim, E. et al., Snow, GSFC SMAP-007, Greenbelt, MD Surface Temperature Fisher, J. et al., Surface Temperature, JPL D-53064 Pasadena, CA Vegetation and Roughness Parameters
Colliander, A., Vegetation & Roughness Parameters, JPL D-53065, Pasadena, CA
ANCILLARY DATA REPORT JANUARY 2013 PRECIPITATION
11
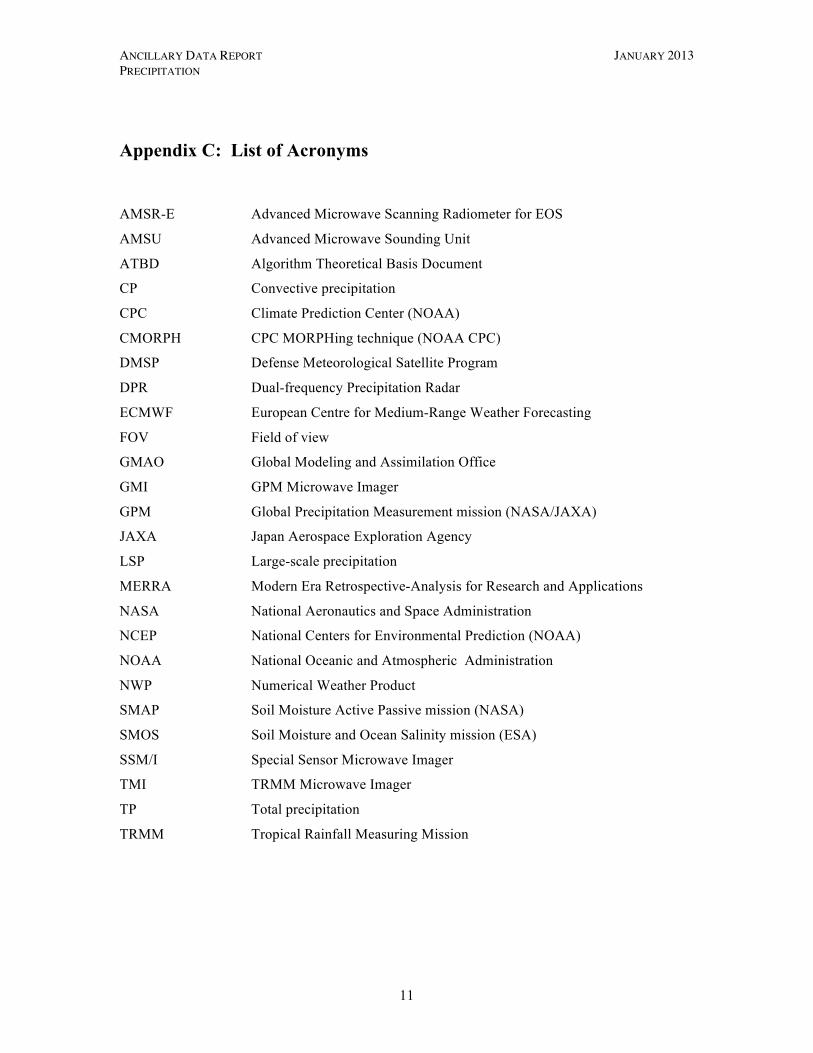
Appendix C: List of Acronyms AMSR-E Advanced Microwave Scanning Radiometer for EOS
AMSU Advanced Microwave Sounding Unit
ATBD Algorithm Theoretical Basis Document
CP Convective precipitation
CPC Climate Prediction Center (NOAA)
CMORPH CPC MORPHing technique (NOAA CPC)
DMSP Defense Meteorological Satellite Program
DPR Dual-frequency Precipitation Radar
ECMWF European Centre for Medium-Range Weather Forecasting
FOV Field of view
GMAO Global Modeling and Assimilation Office
GMI GPM Microwave Imager
GPM Global Precipitation Measurement mission (NASA/JAXA)
JAXA Japan Aerospace Exploration Agency
LSP Large-scale precipitation
MERRA Modern Era Retrospective-Analysis for Research and Applications
NASA National Aeronautics and Space Administration
NCEP National Centers for Environmental Prediction (NOAA)
NOAA National Oceanic and Atmospheric Administration
NWP Numerical Weather Product
SMAP Soil Moisture Active Passive mission (NASA)
SMOS Soil Moisture and Ocean Salinity mission (ESA)
SSM/I Special Sensor Microwave Imager
TMI TRMM Microwave Imager
TP Total precipitation
TRMM Tropical Rainfall Measuring Mission