Embed Size (px)
DESCRIPTION
SMAP Radiometer RFI Study Status Review. Overview. RFI in the SMAP L-band Radiometer is a major concern, being examined by the SMAP radiometer team (J. Piepmeier, NASA GSFC, study lead) Goal of this telecon: Peer review of analysis process and datasets - PowerPoint PPT Presentation
Citation preview
SMAP Radiometer RFI StudyStatus Review
1January 6th 2009 SMAP RFI Review Telecon
Overview
• RFI in the SMAP L-band Radiometer is a major concern, being examined by the SMAP radiometer team – (J. Piepmeier, NASA GSFC, study lead)
• Goal of this telecon: Peer review of analysis process and datasets• is analysis reasonable for forecasting SMAP RFI environment?• anything missing?• is the methodology reasonable?
• Desired outcome: – Feedback from participants during telecon or via email within 24 hours– Progress toward consensus on any recommendations for SMAP
• Invited Participants:– SMAP SDT (Njoku, O’Neill, Jackson, Johnson, Moghaddam, Tsang, Entekhabi,
McDonald)– Instrument team (Piepmeier, Hudson, Medeiros, Spencer)– SMAP RFI WG
(Gasiewski, Camps, Laymon, Ruf, LeVine, DeRoo, Li, Yueh, Dinardo, Skou)
Outline
• SMAP overview + RFI study roadmap and previous forecasts
• Results from SMAPVEX08 campaign– Campaign and hardware description
– RFI examples
– Mapping airborne results to SMAP
– Overall RFI statistics
• Updated forecasts– Second/Third harmonics of TV broadcasts
– Second harmonics of new 700 MHz cellphone allocation
• RFI impact on SMAP error budget
• Discussion
SMAP Overview
• Soil Moisture Active Passive (SMAP) mission designed to measure surface soil moisture and freeze/thaw state– Soil moisture accuracy 4% volumetric, 10 km/3-day resolutions
– Excludes vegetation having VWC> 5 kg/m2
– Binary freeze/thaw transitions >45N latitude
• 80% classification accuracy, 3 km /2-day resolutions
• Previous HYDROS efforts provide baseline design– L-band Radar and Radiometer, radiometer measures H/V/U
– Conically scanned footprint, 40 deg. inc angle, ~ 1000 km swath
• radiometer spatial resolution ~ 40 km
– Approximately 15 msec integration time/ footprint + fore/aft looks
– 15 msec NEDT estimated 0.95 K, 0.67 after fore/aft combination
– Analog baseline sub-samples 15 msec into 64 x 240 usec intervals
• No frequency resolution
Study roadmap and previous forecasts
• An RFI study roadmap has been developed for SMAP
• Study goals:– Characterize RFI threat using forecasts and measured datasets
• SMAPVEX08 provides an important dataset
– Model RFI detection/mitigation performance of possible hardware modifications
– Final outcome: recommendations for radiometer design
• An RFI forecast study was performed previously for HYDROS– Investigated impact of US radar systems on HYDROS
– Impact of “tails” of radar emissions into SMAP bandwidth/filter sidebands
• Similar analyses also performed for SMOS
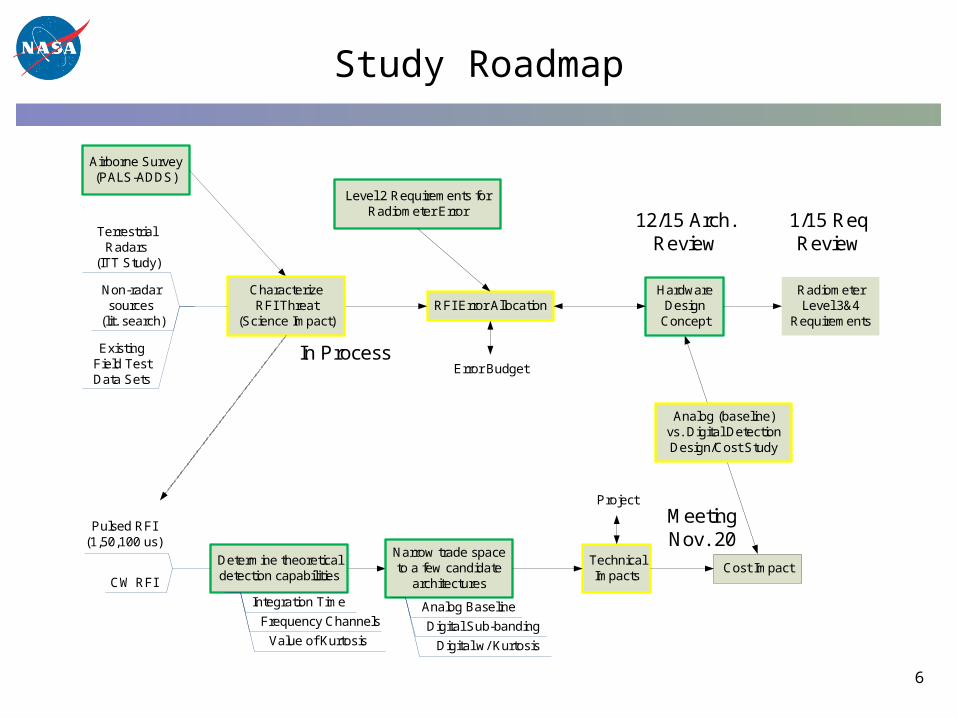
Study Roadmap
6
Level 2 Requirements for Radiometer Error
Radiometer Level 3&4
Requirements
HardwareDesign
Concept
Analog (baseline)vs. Digital DetectionDesign/Cost Study
RFI Error Allocation
Error Budget
Airborne Survey(PALS-ADDS)
Characterize RFI Threat
(Science Impact)
Terrestrial Radars
(ITT Study)
Non-radar sources
(lit. search)
Existing Field TestData Sets
TechnicalImpacts
Cost ImpactNarrow trade spaceto a few candidate
architectures
Determine theoreticaldetection capabilities
Pulsed RFI(1,50,100 us)
CW RFI
Analog Baseline
Digital Sub-banding
Digital w/ Kurtosis
Integration Time
Frequency Channels
Value of Kurtosis
Project
In Process
Meeting Nov. 20
1/15 Req Review
12/15 Arch. Review
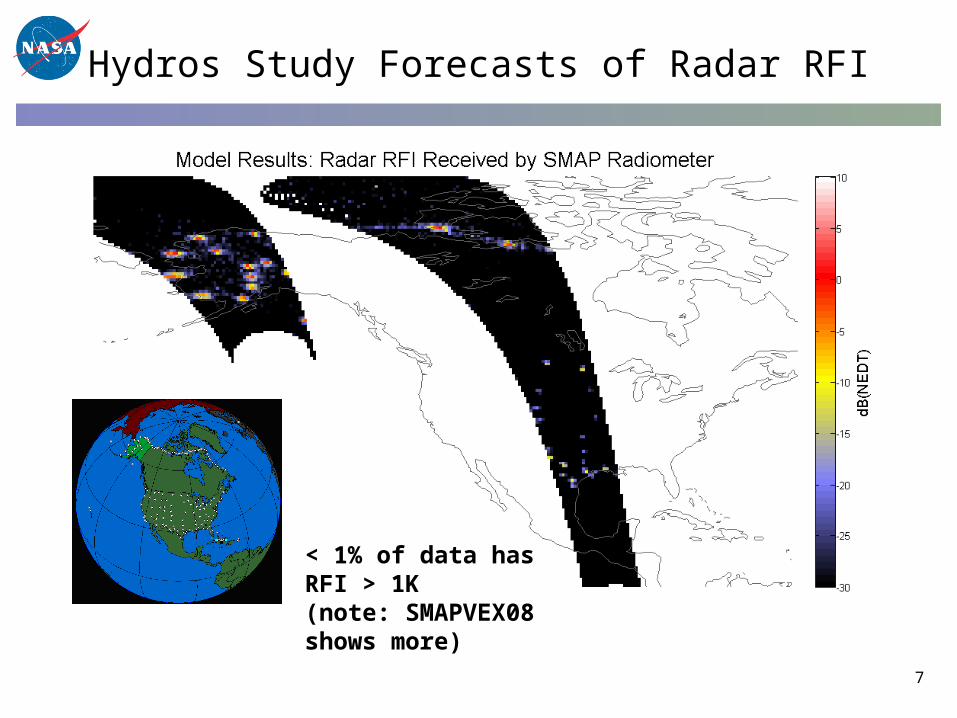
Hydros Study Forecasts of Radar RFI
7
< 1% of data has RFI > 1K(note: SMAPVEX08 shows more)

Including RFI in SMAP Error Budget
• RFI impact on can be separated into two effects– Data Loss caused by detectable RFI (i.e. non-pulsed >~ 10 K*)
• Examine CDF curves to forecast this level ~ 1%• Assume baseline detector catches majority of pulsed RFI
– Error caused by non-detectable RFI (i.e. non pulsed < 10 K*)• Increases data product errors• Need to incorporate into radiometer RFI error budget• Problem: RFI not normally or uniformly distributed
• Working to develop an error analysis to include this in a consistent way– Appears to be only weakly correlated to population density– Unsure of statistics outside CONUS
• Improvement through different hardware– Could improve detectability of CW RFI with sub-banding and kurtosis.– Could mitigate CW RFI by downlinking sub-band and kurtosis data.– ~1 K threshold
Airborne RFI Information
• Numerous airborne and ground-based L-band campaigns have reported RFI – PALS/ESTAR/CoSMOS/ other ground based systems
– Usually (except CoSMOS) unable to mitigate or detect low-level RFI
– Mostly anecdotal evidence, detailed statistics not compiled
• Several groups developing improved RFI detection/mitigation methods in recent years
• Three RFI detecting/mitigating systems combined with JPL PALS in SMAPVEX08 campaign to provide enhanced dataset– Sept 20-Oct 19th, 2008, ~ 92 flight hours
– ~20 deg. beamwidth, 40 deg. inc angle, Twin Otter aircraft
– NASA P-3 also deployed with an RFI detecting radiometer from MSFC
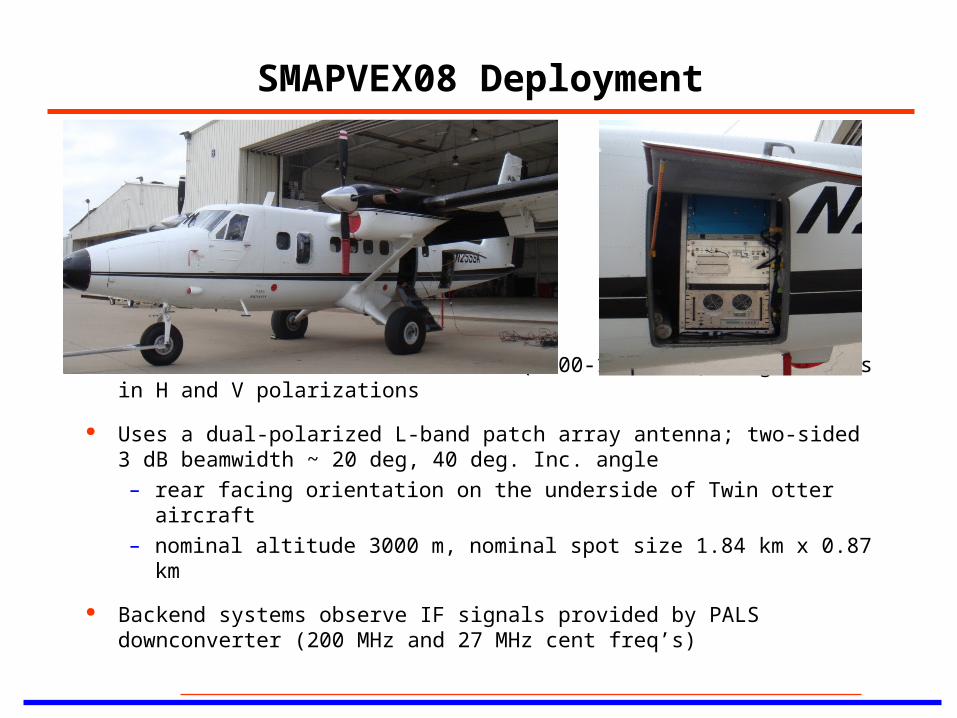
SMAPVEX08 Deployment
PALS radiometer measures L-band (1400-1420 MHz) brightnesses in H and V polarizations
Uses a dual-polarized L-band patch array antenna; two-sided 3 dB beamwidth ~ 20 deg, 40 deg. Inc. angle
– rear facing orientation on the underside of Twin otter aircraft
– nominal altitude 3000 m, nominal spot size 1.84 km x 0.87 km
Backend systems observe IF signals provided by PALS downconverter (200 MHz and 27 MHz cent freq’s)
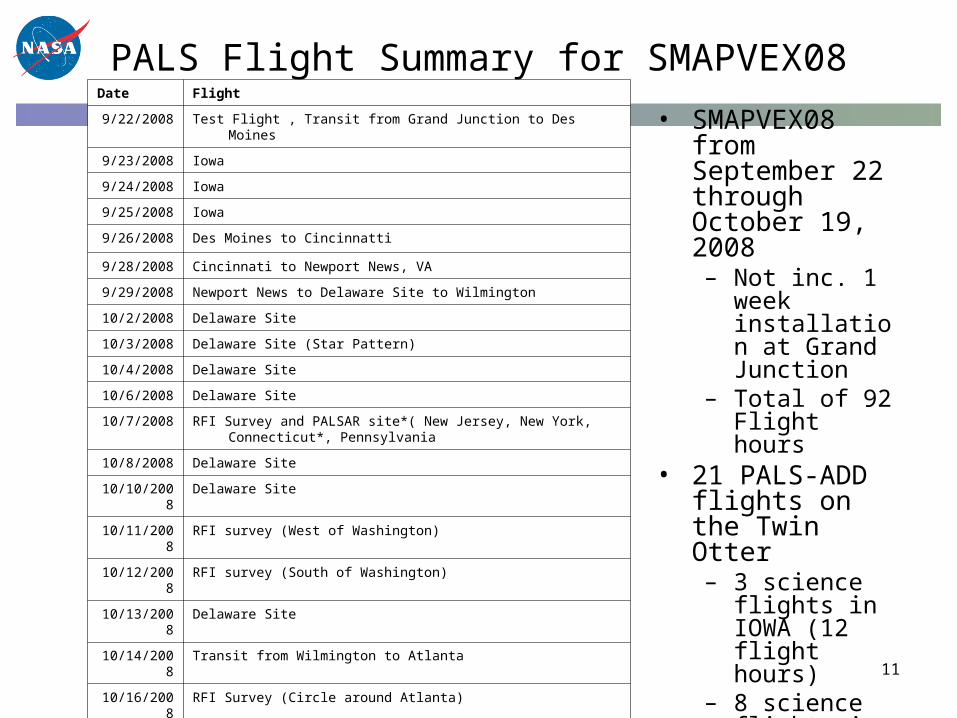
PALS Flight Summary for SMAPVEX08Date Flight
9/22/2008 Test Flight , Transit from Grand Junction to Des Moines
9/23/2008 Iowa
9/24/2008 Iowa
9/25/2008 Iowa
9/26/2008 Des Moines to Cincinnatti
9/28/2008 Cincinnati to Newport News, VA
9/29/2008 Newport News to Delaware Site to Wilmington
10/2/2008 Delaware Site
10/3/2008 Delaware Site (Star Pattern)
10/4/2008 Delaware Site
10/6/2008 Delaware Site
10/7/2008 RFI Survey and PALSAR site*( New Jersey, New York, Connecticut*, Pennsylvania
10/8/2008 Delaware Site
10/10/2008 Delaware Site
10/11/2008 RFI survey (West of Washington)
10/12/2008 RFI survey (South of Washington)
10/13/2008 Delaware Site
10/14/2008 Transit from Wilmington to Atlanta
10/16/2008 RFI Survey (Circle around Atlanta)
10/18/2008 Transit from Atlanta through Pittsburg, Kansas to Fort Collins
10/19/2008 Transit Fort Collins to Grand Junction
• SMAPVEX08 from September 22 through October 19, 2008– Not inc. 1 week
installation at Grand Junction
– Total of 92 Flight hours
• 21 PALS-ADD flights on the Twin Otter– 3 science
flights in IOWA (12 flight hours)
– 8 science flights in Delaware (37 flight hours)
– 10 RFI/Transit flights (~ 20 flight hours)
11
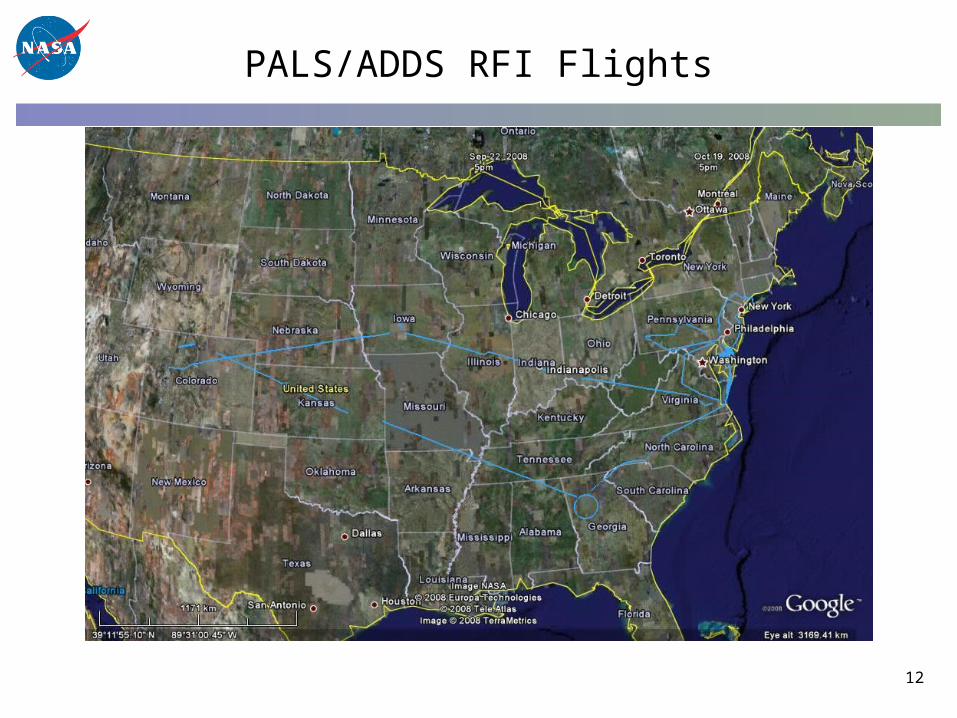
PALS/ADDS RFI Flights
12
RFI Detection and Mitigation in SMAPVEX08
• Three algorithm types: pulse, cross-frequency, kurtosis– Pulse for pulsed sources, cross-freq for narrowband, kurtosis tests for normality
– ~ 20-30 seconds for PALS to traverse one footprint
• PALS: capable of pulse detection at ~ a few msec time scale
• GSFC ADD: pulse detection at 2 usec time resolution– Also has a “pseudo-kurtosis” capability but not yet processed
– No frequency resolution
• U. Mich ADD: kurtosis or pulse detection >= 4 msec res– Has 8 x 2.29 MHz sub-bands, only fullband results presented here
• OSU LISR: Records 350 usec x 0.1 MHz spectrograms– Pulse detection at 350 usec time resolution
– Cross-frequency detection at 0.1 MHz spectral resolution
• Selected RFI examples (among a huge number) follow (initial results)– Other spatial/polarization detection tests remain to be studied
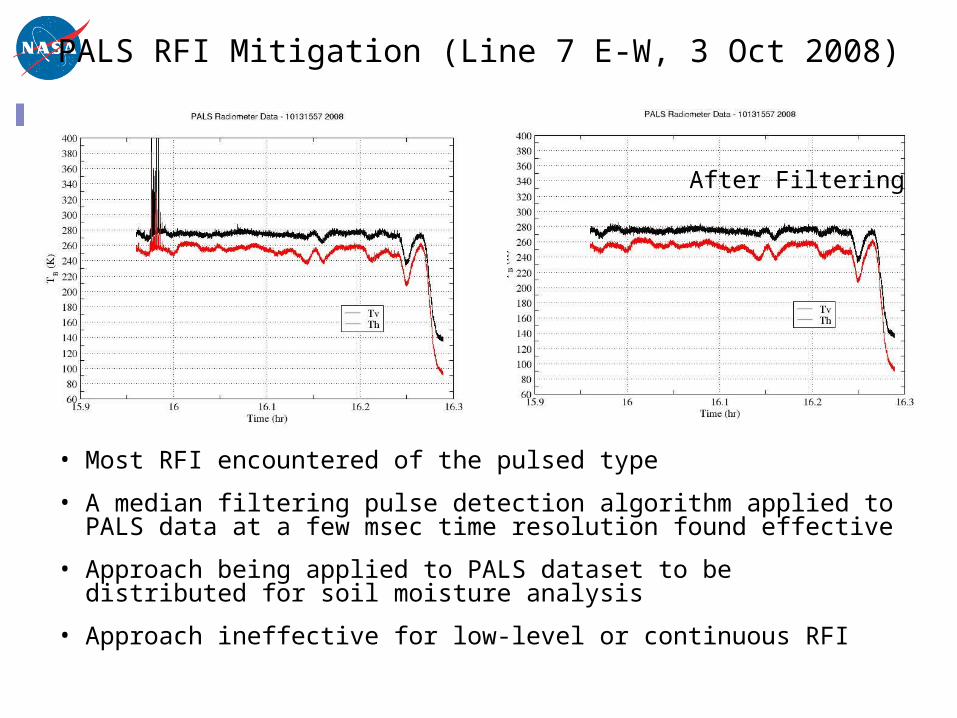
PALS RFI Mitigation (Line 7 E-W, 3 Oct 2008)
• Most RFI encountered of the pulsed type
• A median filtering pulse detection algorithm applied to PALS data at a few msec time resolution found effective
• Approach being applied to PALS dataset to be distributed for soil moisture analysis
• Approach ineffective for low-level or continuous RFI
After Filtering
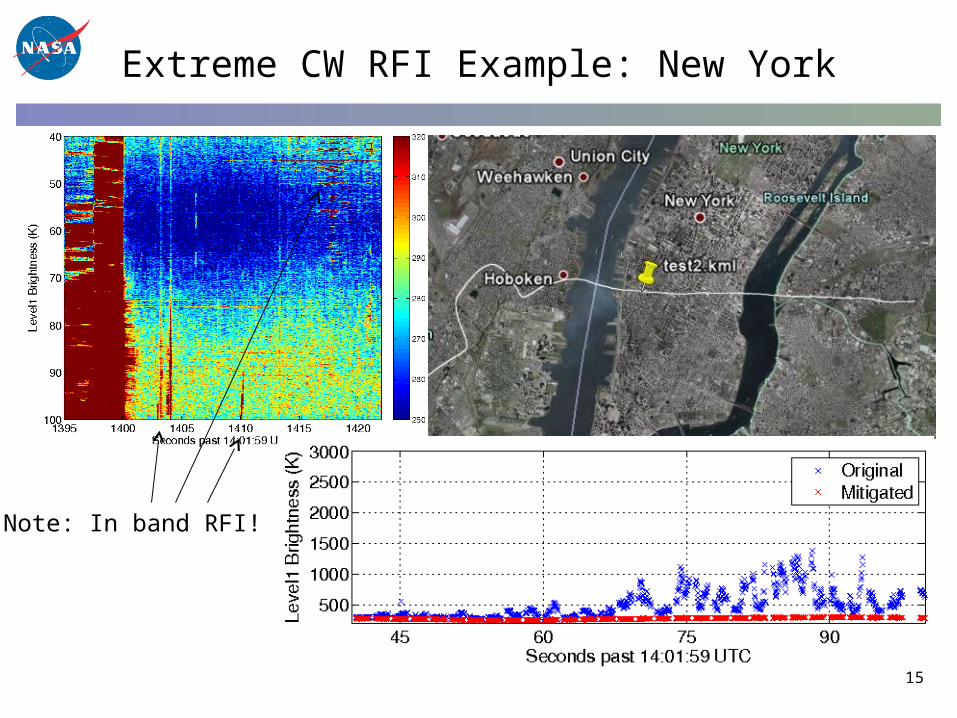
Extreme CW RFI Example: New York
15
Note: In band RFI!
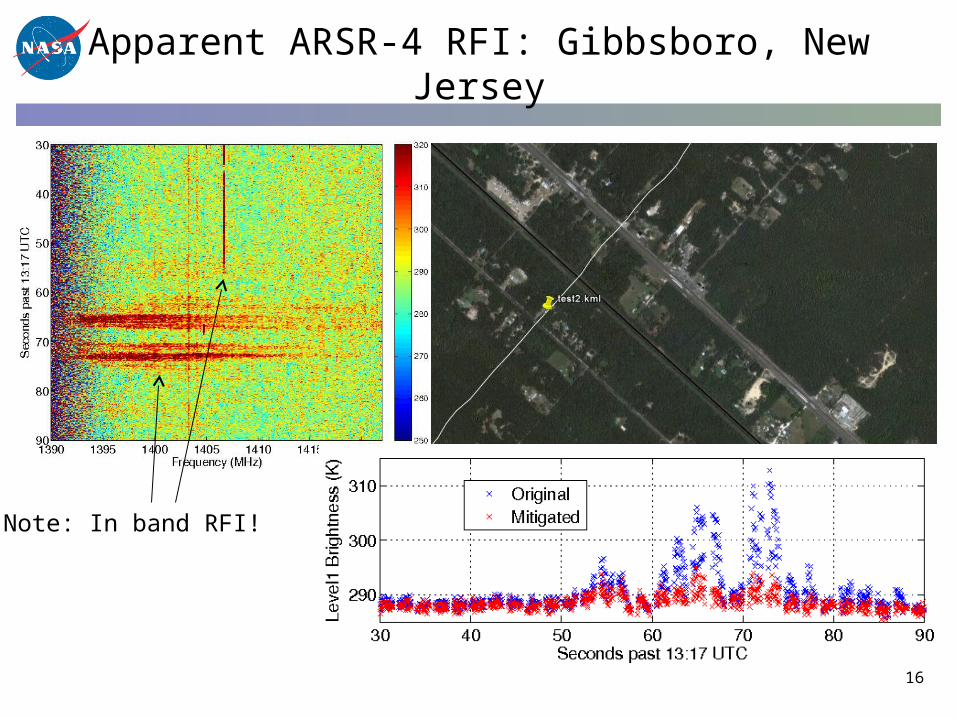
Apparent ARSR-4 RFI: Gibbsboro, New Jersey
16
Note: In band RFI!
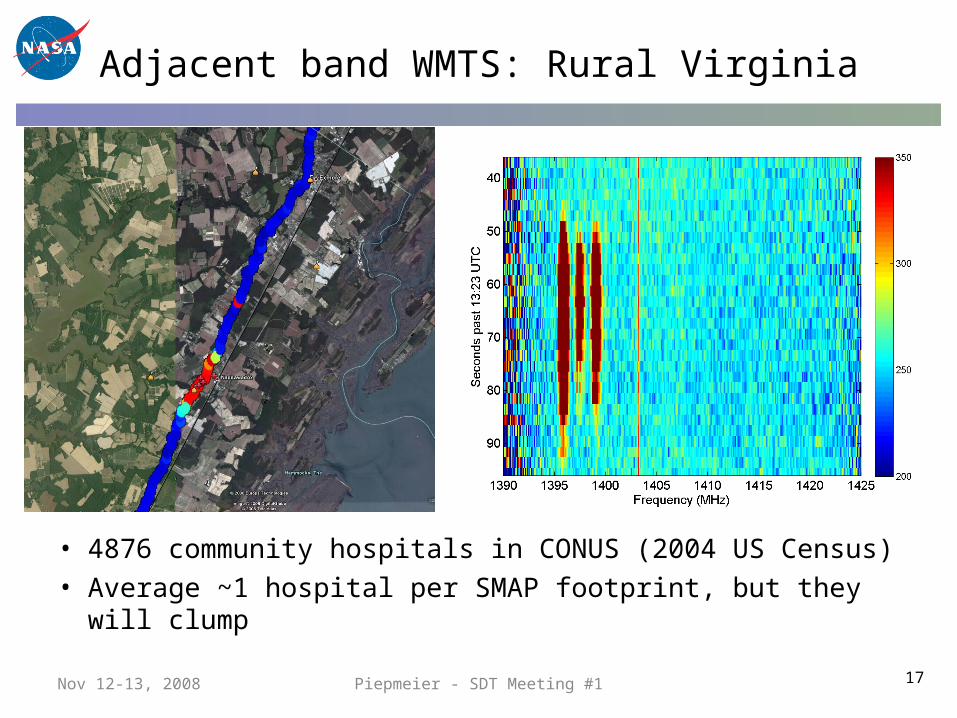
Adjacent band WMTS: Rural Virginia
• 4876 community hospitals in CONUS (2004 US Census)
• Average ~1 hospital per SMAP footprint, but they will clump
17Nov 12-13, 2008 Piepmeier - SDT Meeting #1
Mapping Airborne Observations to SMAP
• Scaling airborne results to SMAP requires consideration of– Larger range to SMAP– Larger antenna gain of SMAP– Larger footprint of SMAP
• A Friis formula analysis shows that problem reduces to the EIRP per footprint area for either system (density of interferers equation)– See document mappingtosmap.pdf
• SMAP forecasting reduces to averaging airborne detected RFI levels over scales comparable to SMAP footprint
• Airborne tracks mostly linear, so compiling a SMAP footprint area would involve disjoint linear regions– Averaging over linear scales comparable to SMAP footprint diameter
preferred?– Statistics compiled for multiple time scales to examine averaging effects
Campaign Statistics
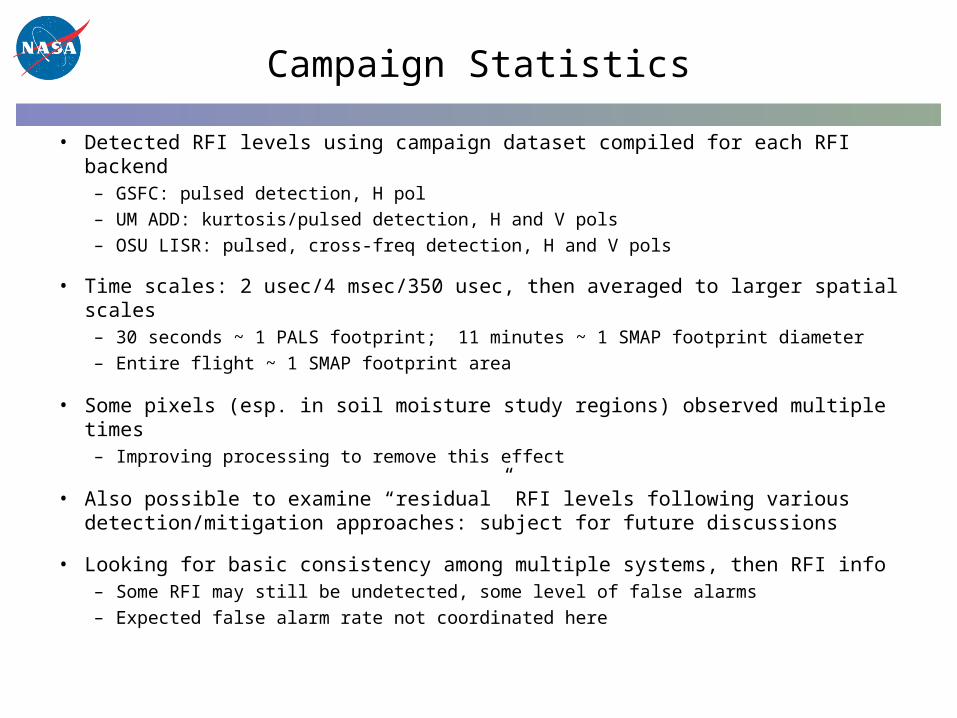
• Detected RFI levels using campaign dataset compiled for each RFI backend– GSFC: pulsed detection, H pol
– UM ADD: kurtosis/pulsed detection, H and V pols
– OSU LISR: pulsed, cross-freq detection, H and V pols
• Time scales: 2 usec/4 msec/350 usec, then averaged to larger spatial scales– 30 seconds ~ 1 PALS footprint; 11 minutes ~ 1 SMAP footprint diameter
– Entire flight ~ 1 SMAP footprint area
• Some pixels (esp. in soil moisture study regions) observed multiple times– Improving processing to remove this effect
• Also possible to examine “residual” RFI levels following various detection/mitigation approaches: subject for future discussions
• Looking for basic consistency among multiple systems, then RFI info– Some RFI may still be undetected, some level of false alarms
– Expected false alarm rate not coordinated here
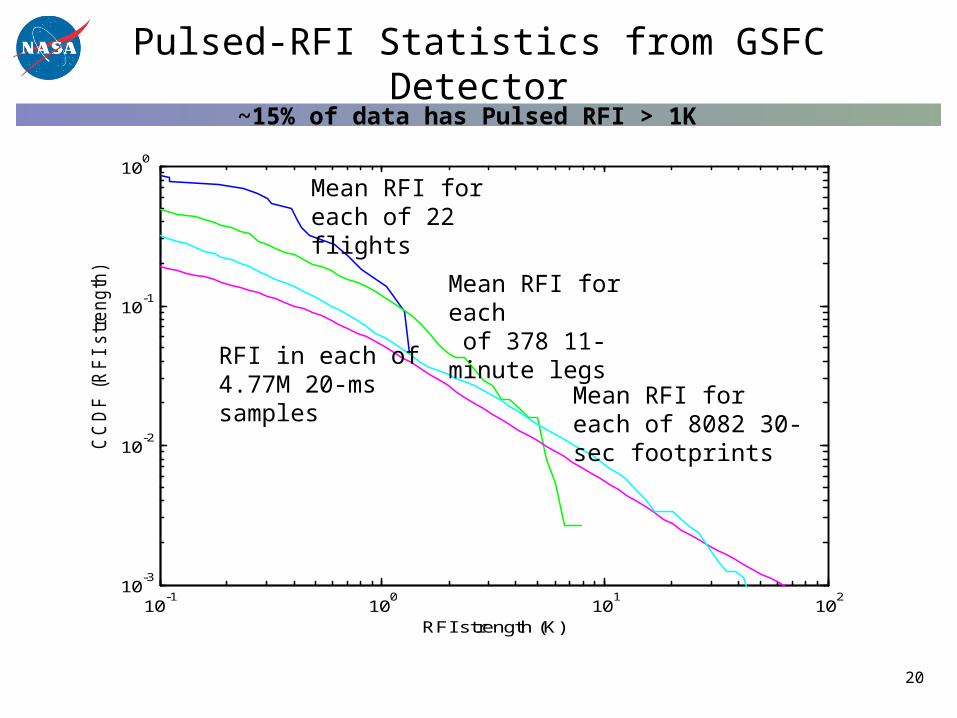
Pulsed-RFI Statistics from GSFC Detector
20
10-1
100
101
102
10-3
10-2
10-1
100
CC
DF
(R
FI
str
ength
)
RFI strength (K)
Mean RFI for each of 22 flights
Mean RFI for each of 378 11-minute legs
RFI in each of 4.77M 20-ms samples
Mean RFI for each of 8082 30-sec footprints
~15% of data has Pulsed RFI > 1K
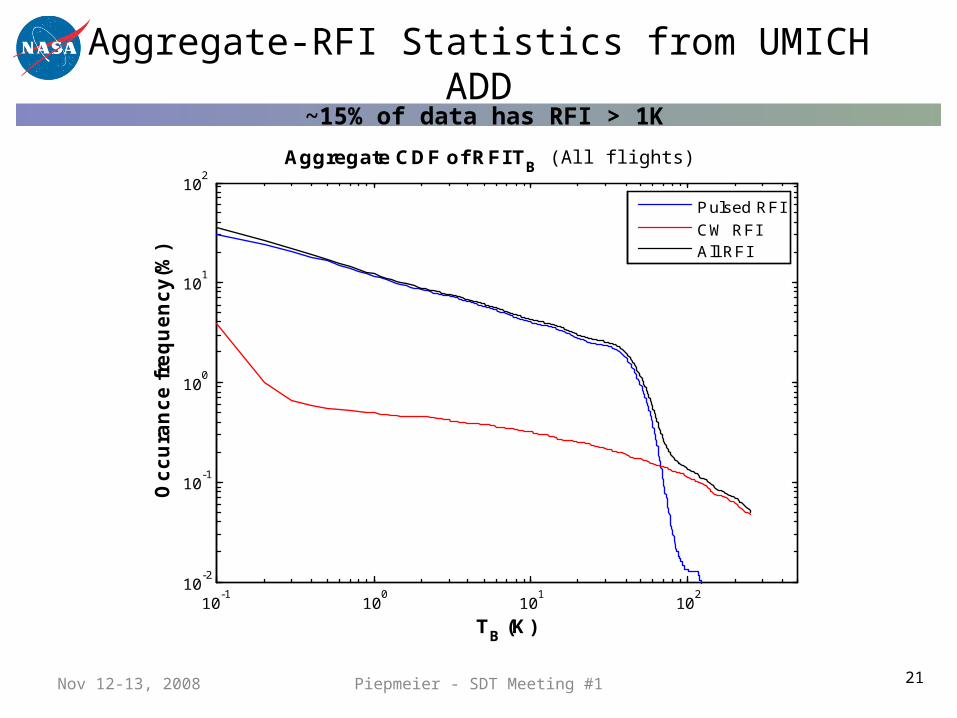
Aggregate-RFI Statistics from UMICH ADD
21Nov 12-13, 2008 Piepmeier - SDT Meeting #1
~15% of data has RFI > 1K
10-1
100
101
102
10-2
10-1
100
101
102
TB (K)
Oc
cu
ran
ce
fre
qu
en
cy
(%)
Aggregate CDF of RFI TB - 2008/10/19 (Hpol)
Pulsed RFI
CW RFIAll RFI
(All flights)
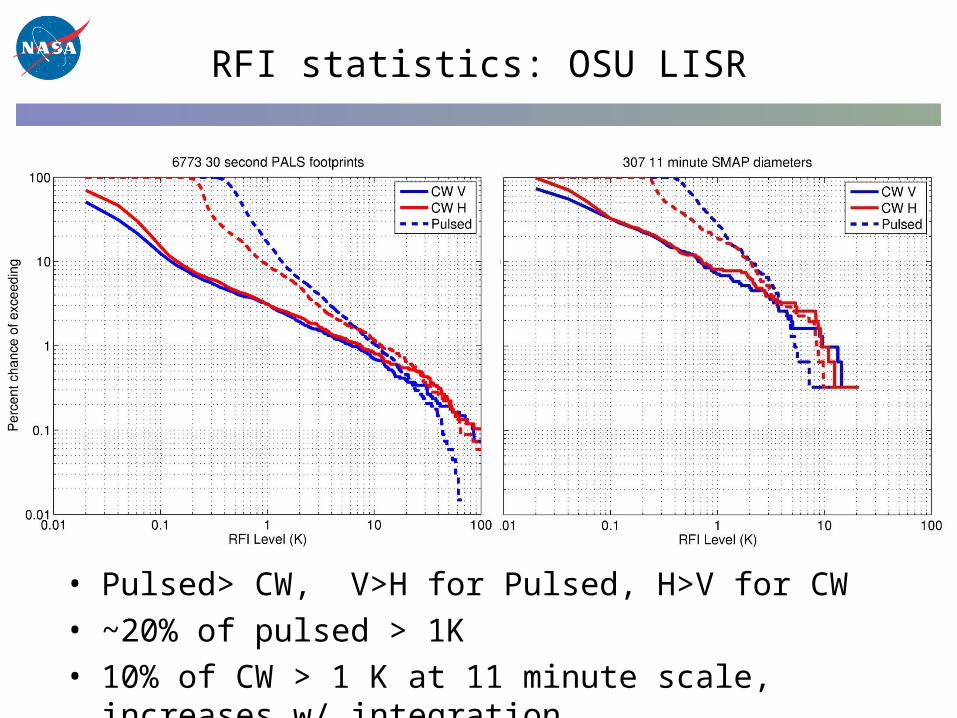
RFI statistics: OSU LISR
• Pulsed> CW, V>H for Pulsed, H>V for CW
• ~20% of pulsed > 1K
• 10% of CW > 1 K at 11 minute scale, increases w/ integration
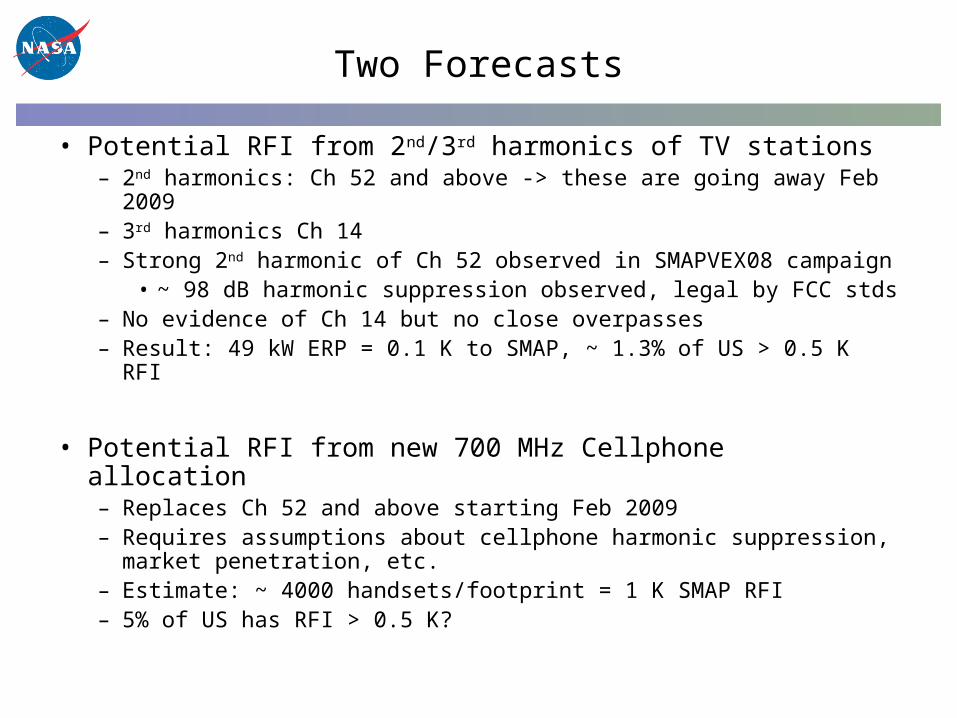
Two Forecasts
• Potential RFI from 2nd/3rd harmonics of TV stations– 2nd harmonics: Ch 52 and above -> these are going away Feb 2009– 3rd harmonics Ch 14– Strong 2nd harmonic of Ch 52 observed in SMAPVEX08 campaign
• ~ 98 dB harmonic suppression observed, legal by FCC stds– No evidence of Ch 14 but no close overpasses– Result: 49 kW ERP = 0.1 K to SMAP, ~ 1.3% of US > 0.5 K RFI
• Potential RFI from new 700 MHz Cellphone allocation– Replaces Ch 52 and above starting Feb 2009– Requires assumptions about cellphone harmonic suppression, market
penetration, etc.– Estimate: ~ 4000 handsets/footprint = 1 K SMAP RFI– 5% of US has RFI > 0.5 K?
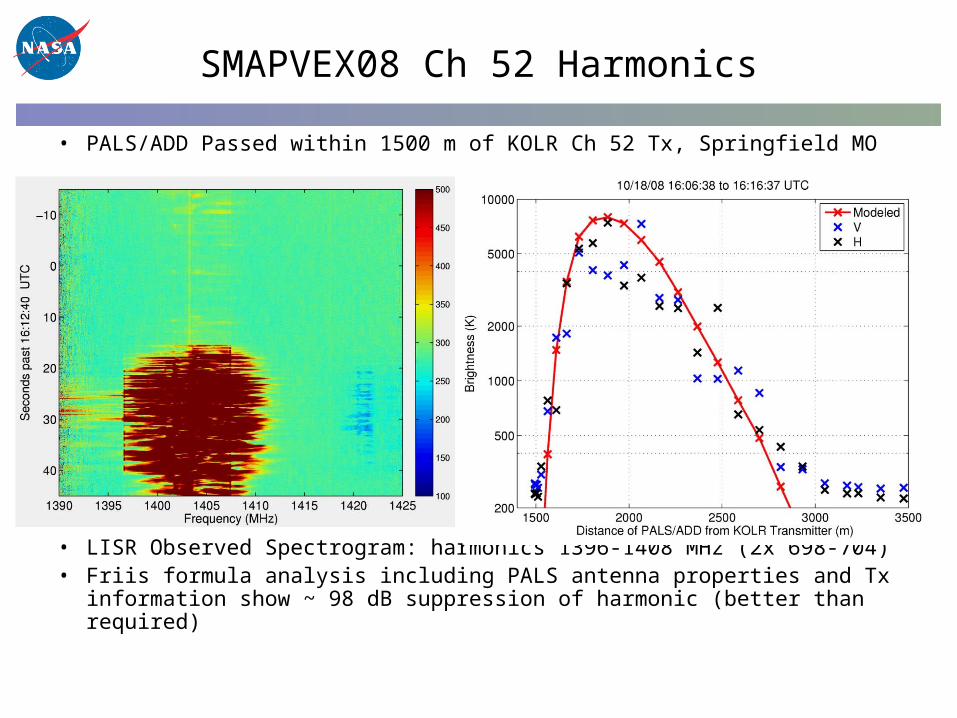
SMAPVEX08 Ch 52 Harmonics
• PALS/ADD Passed within 1500 m of KOLR Ch 52 Tx, Springfield MO
• LISR Observed Spectrogram: harmonics 1396-1408 MHz (2x 698-704)• Friis formula analysis including PALS antenna properties and Tx
information show ~ 98 dB suppression of harmonic (better than required)
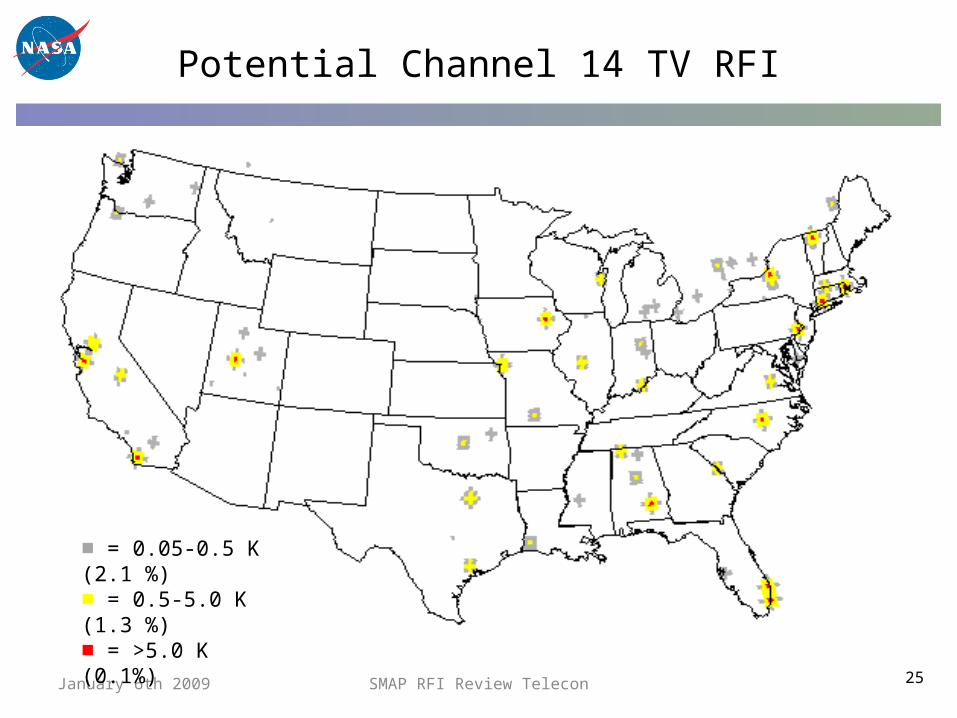
Potential Channel 14 TV RFI
25January 6th 2009 SMAP RFI Review Telecon
■ = 0.05-0.5 K (2.1 %)■ = 0.5-5.0 K (1.3 %)■ = >5.0 K (0.1%)
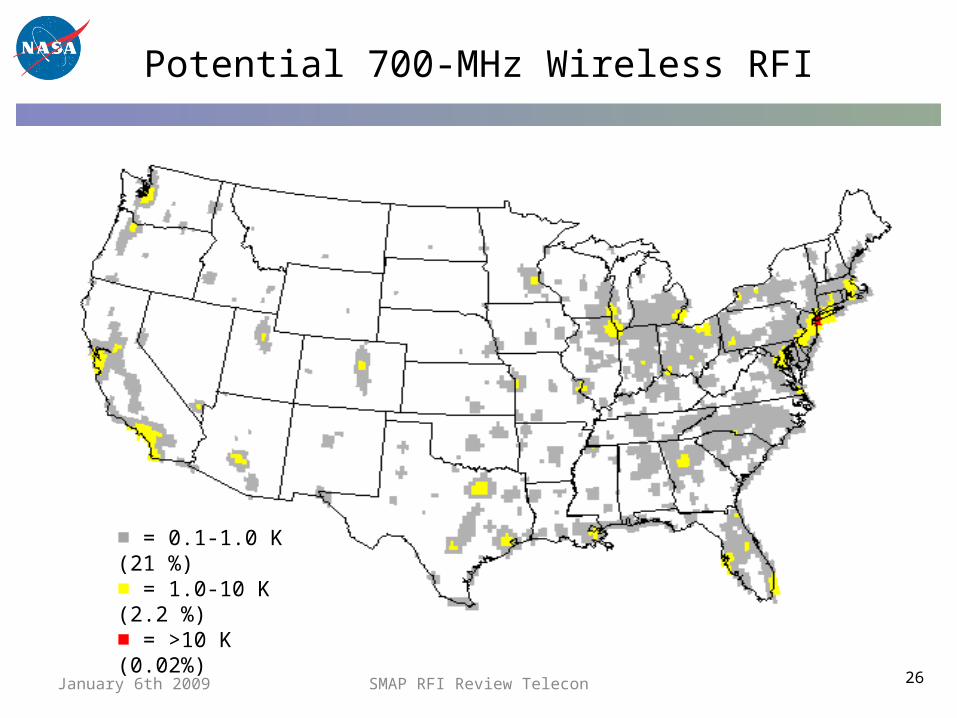
Potential 700-MHz Wireless RFI
26January 6th 2009 SMAP RFI Review Telecon
■ = 0.1-1.0 K (21 %)■ = 1.0-10 K (2.2 %)■ = >10 K (0.02%)
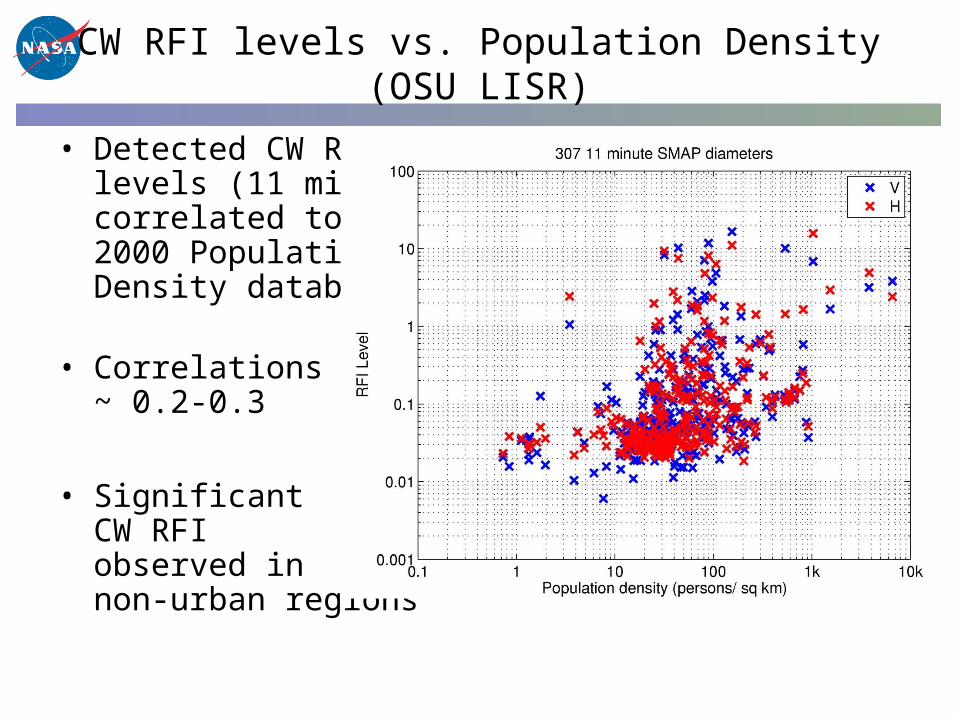
CW RFI levels vs. Population Density (OSU LISR)
• Detected CW RFIlevels (11 minute)correlated to a 2000 PopulationDensity database
• Correlations~ 0.2-0.3
• SignificantCW RFI observed innon-urban regions
Summary and Discussion
• SMAPVEX08 campaign results show:
– A large percent of observations contain negligible RFI
– Pulsed RFI occurs frequently, baseline algorithm can handle much of this
– CW RFI occurs less frequently, but up to 10% of SMAP footprint diameters estimated to have RFI >= 1 K
– Additional analysis of these datasets still in progress
• Measured data show that harmonic emissions are real, potential RFI from new 700 MHz cell phones a concern
• Technical/program impact assessment of alternate hardware strategies against these sources in progress
28
Including RFI in SMAP Error Budget
• RFI impact on can be separated into two effects– Data Loss caused by detectable RFI (i.e. non-pulsed >~ 10 K*)
• Examine CDF curves to forecast this level ~ 1%• Assume baseline detector catches majority of pulsed RFI
– Error caused by non-detectable RFI (i.e. non pulsed < 10 K*)• Increases data product errors• Need to incorporate into radiometer RFI error budget• Problem: RFI not normally or uniformly distributed
• Working to develop an error analysis to include this in a consistent way– Appears to be only weakly correlated to population density– Unsure of statistics outside CONUS
• Improvement through different hardware– Could improve detectability of CW RFI with sub-banding and kurtosis.– Could mitigate CW RFI by downlinking sub-band and kurtosis data.– ~1 K threshold
Summary and Discussion (2)
• Key issue for RFI is the eventual science impact!• To count data loss, RFI must be detectable
– Can detect RFI>10 K without advanced hardware? C-band experience?– With 1-K detection threshold, >5% data might be lost.
• Data loss requirements, repeated denial-of-service in fixed locations?– e.g. is it OK to always lose data over TV transmitters, hospitals, etc?
• If we must go with baseline design– >5% data might have undetected RFI>1K– Would not meet error requirement on point-by-point basis– Would need to consider regional/global averages to meet requirement
• Using a digital backend with sub-banding and kurtosis– CW RFI > 1K would be detectable– Some amount (90%?) would be removable– Could likely meet error requirement on point-by-point basis
Recap
• Goal of this telecon: Peer review of analysis process and datasets• is analysis reasonable for forecasting SMAP RFI environment?• anything missing?• is the methodology reasonable?
• Desired outcome: – Feedback from participants during telecon or via email within 24 hours– Progress toward consensus on any recommendations for SMAP
• Now is the time to act! If SDT feels we won’t meet science needs with baseline design (i.e., must live with CW RFI), please speak up now.
31January 6th 2009 SMAP RFI Review Telecon