Embed Size (px)
Citation preview
Statistik Bisnis
Week 1-2
Collecting, Organizing and Visualizing Data
1
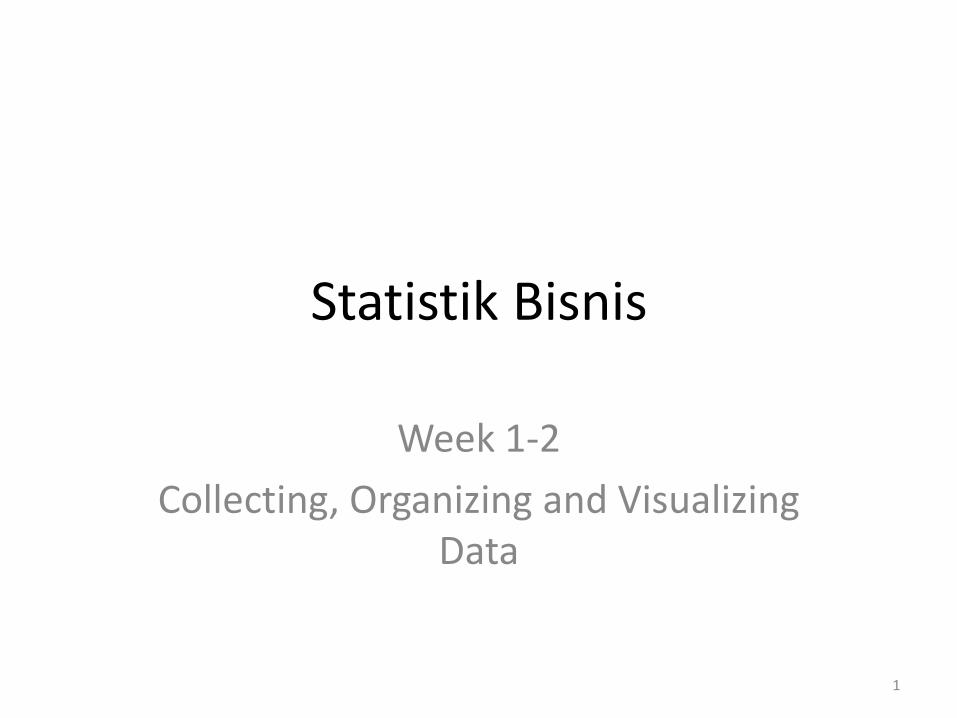
Agenda
Time Activity
First Session
90 minutes Collecting and Organizing Data
Second Session
90 minutes Visualizing Data
2
Objectives
By the end of this class, students will:
• Understand how to collect data in statistic
• Be able to organize categorical and numerical data
• Understand how to read and interpret an organized data (table)
• Be able to visualize categorical and numerical data
• Understand how to make conclusion based on the data visualizations (charts and graphs)
3

REVIEW
4
1.4
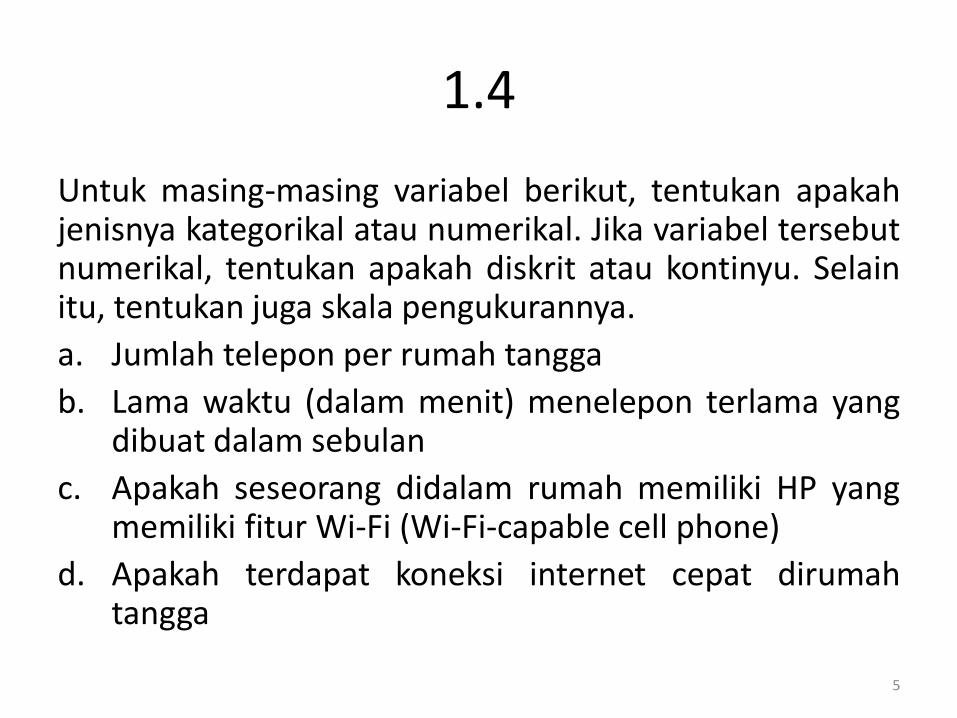
Untuk masing-masing variabel berikut, tentukan apakah jenisnya kategorikal atau numerikal. Jika variabel tersebut numerikal, tentukan apakah diskrit atau kontinyu. Selain itu, tentukan juga skala pengukurannya.
a. Jumlah telepon per rumah tangga
b. Lama waktu (dalam menit) menelepon terlama yang dibuat dalam sebulan
c. Apakah seseorang didalam rumah memiliki HP yang memiliki fitur Wi-Fi (Wi-Fi-capable cell phone)
d. Apakah terdapat koneksi internet cepat dirumah tangga
5
1.5
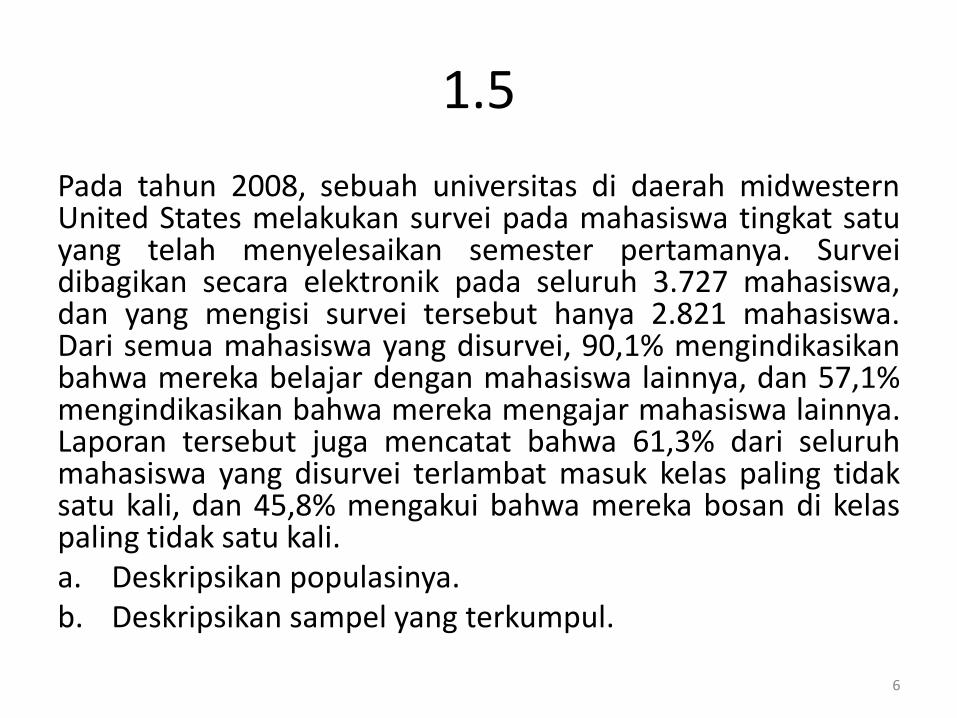
Pada tahun 2008, sebuah universitas di daerah midwestern United States melakukan survei pada mahasiswa tingkat satu yang telah menyelesaikan semester pertamanya. Survei dibagikan secara elektronik pada seluruh 3.727 mahasiswa, dan yang mengisi survei tersebut hanya 2.821 mahasiswa. Dari semua mahasiswa yang disurvei, 90,1% mengindikasikan bahwa mereka belajar dengan mahasiswa lainnya, dan 57,1% mengindikasikan bahwa mereka mengajar mahasiswa lainnya. Laporan tersebut juga mencatat bahwa 61,3% dari seluruh mahasiswa yang disurvei terlambat masuk kelas paling tidak satu kali, dan 45,8% mengakui bahwa mereka bosan di kelas paling tidak satu kali. a. Deskripsikan populasinya. b. Deskripsikan sampel yang terkumpul.
6
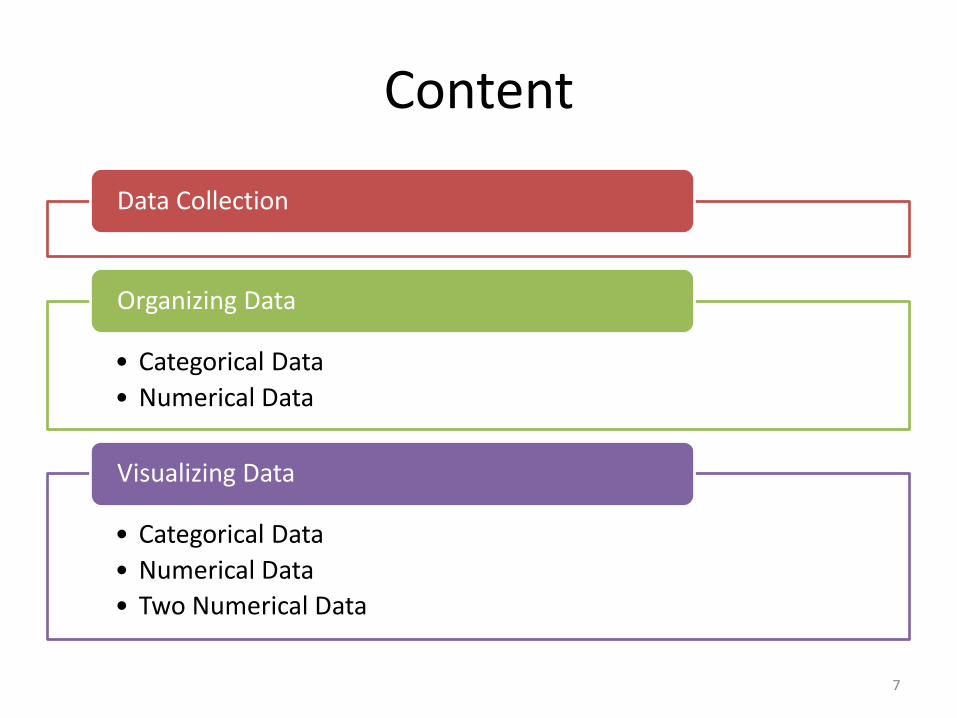
Content
Data Collection
• Categorical Data
• Numerical Data
Organizing Data
• Categorical Data
• Numerical Data
• Two Numerical Data
Visualizing Data
7

DATA COLLECTION
8
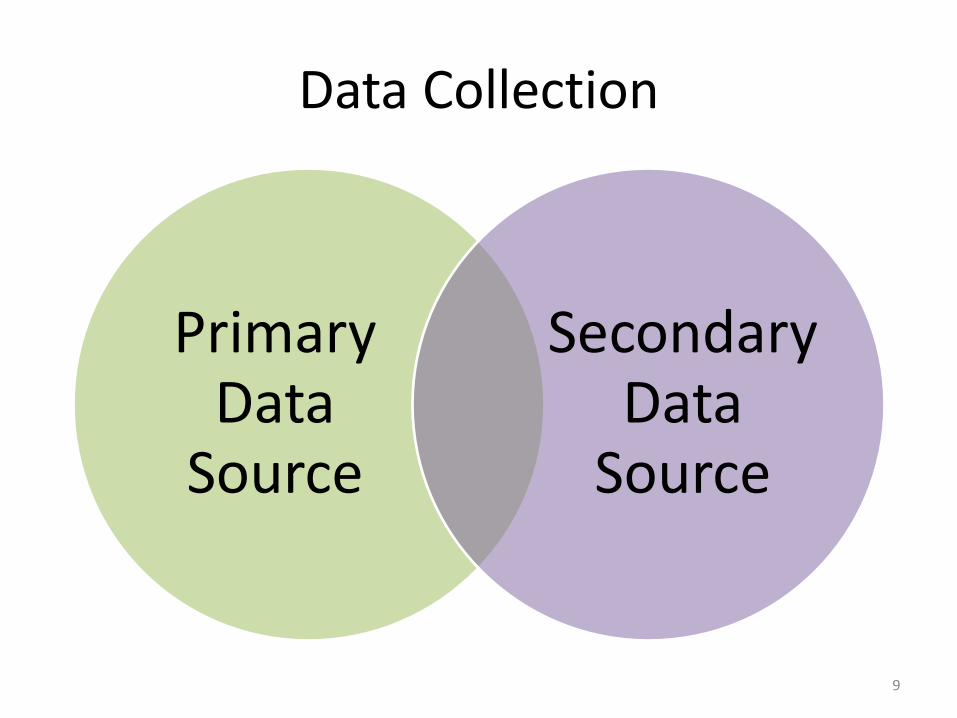
Data Collection
Primary Data
Source
Secondary Data
Source
9
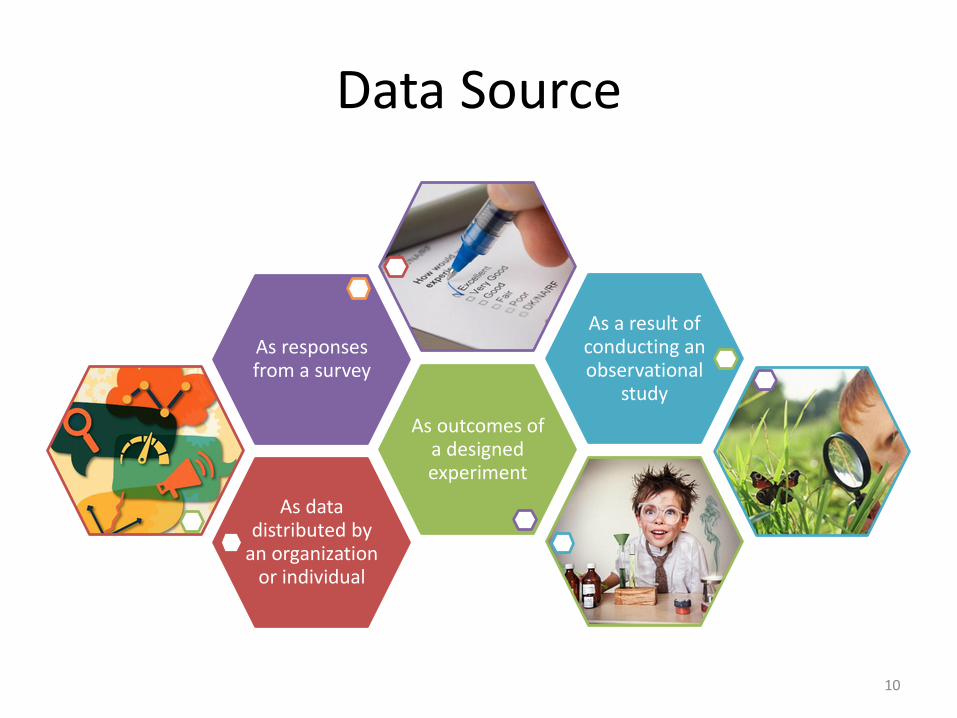
Data Source
As data distributed by
an organization or individual
As outcomes of a designed experiment
As responses from a survey
As a result of conducting an observational
study
10

ORGANIZING DATA
11
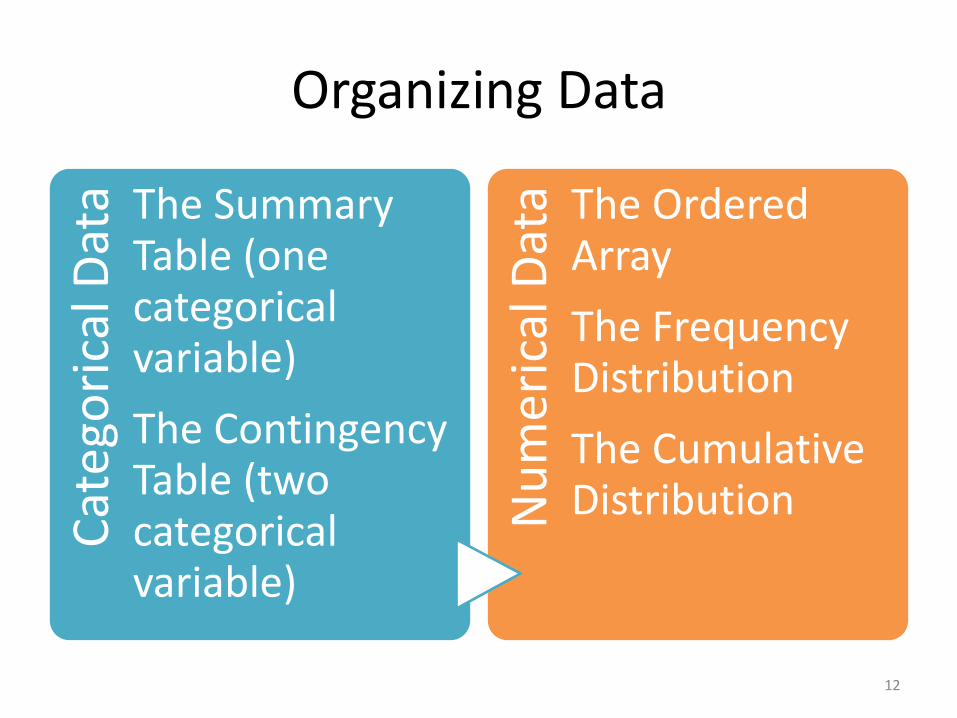
Organizing Data C
ateg
ori
cal D
ata The Summary
Table (one categorical variable)
The Contingency Table (two categorical variable)
Nu
mer
ical
Dat
a The Ordered Array
The Frequency Distribution
The Cumulative Distribution
12
CATEGORICAL DATA
13
Class Survey
What is your hand phone brand?
What is your phone carrier?
14
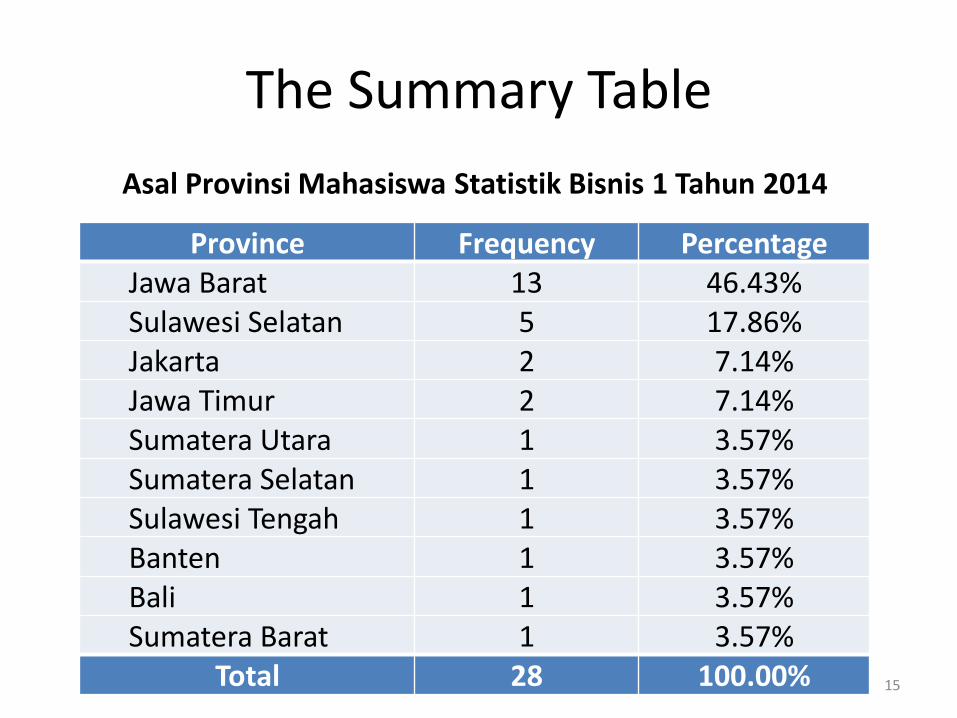
The Summary Table
Province Frequency Percentage
Jawa Barat 13 46.43%
Sulawesi Selatan 5 17.86%
Jakarta 2 7.14%
Jawa Timur 2 7.14%
Sumatera Utara 1 3.57%
Sumatera Selatan 1 3.57%
Sulawesi Tengah 1 3.57%
Banten 1 3.57%
Bali 1 3.57%
Sumatera Barat 1 3.57%
Total 28 100.00%
Asal Provinsi Mahasiswa Statistik Bisnis 1 Tahun 2014
15
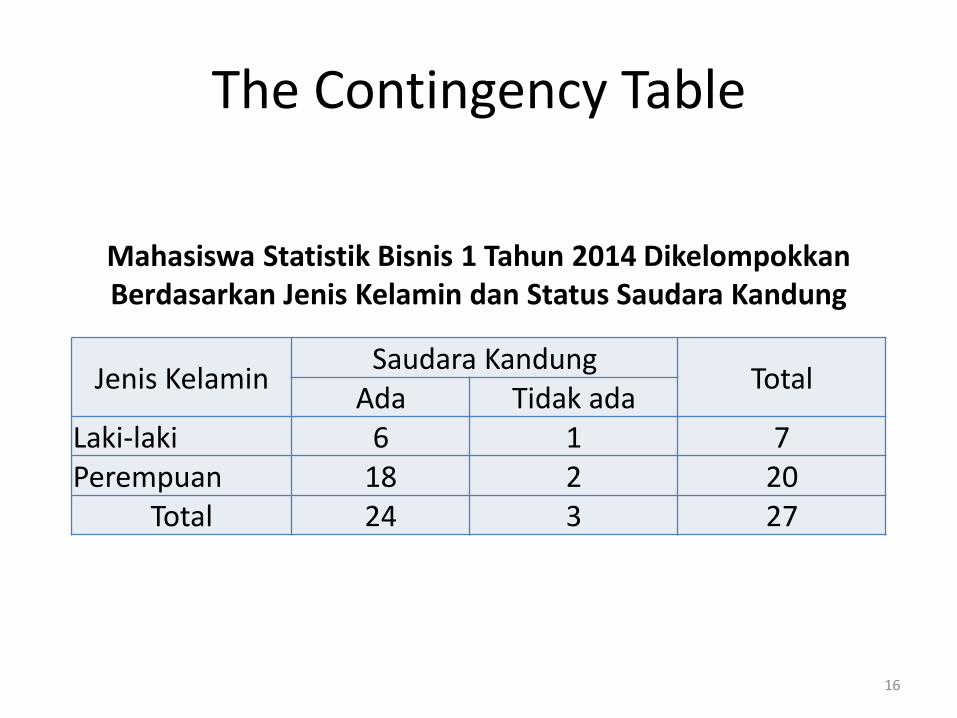
The Contingency Table
Jenis Kelamin Saudara Kandung
Total Ada Tidak ada
Laki-laki 6 1 7 Perempuan 18 2 20
Total 24 3 27
Mahasiswa Statistik Bisnis 1 Tahun 2014 Dikelompokkan Berdasarkan Jenis Kelamin dan Status Saudara Kandung
16
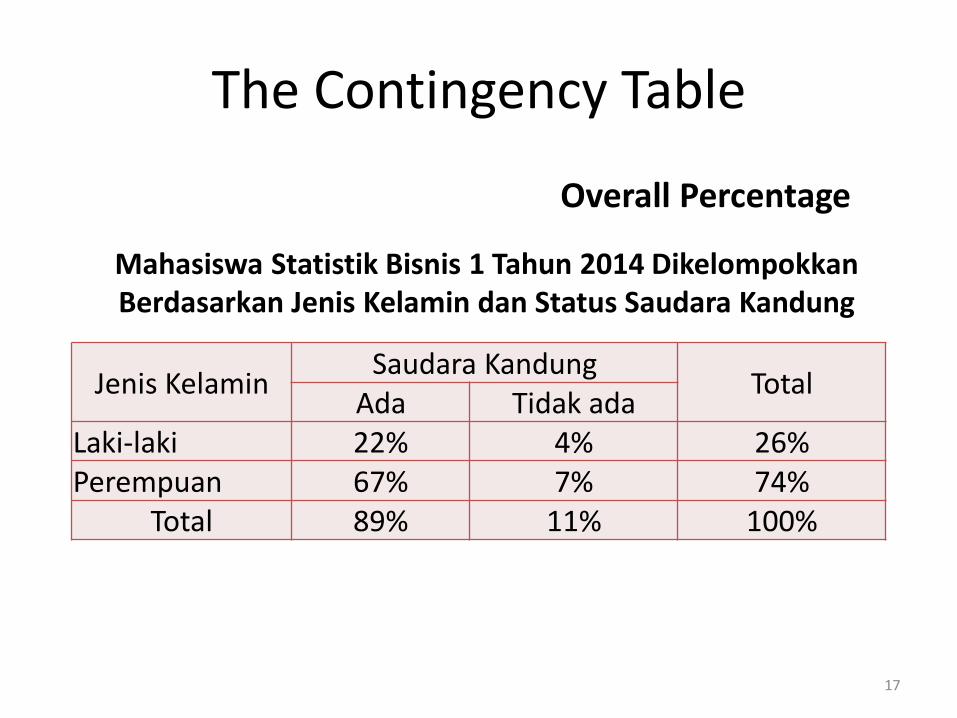
The Contingency Table
Jenis Kelamin Saudara Kandung
Total Ada Tidak ada
Laki-laki 22% 4% 26% Perempuan 67% 7% 74%
Total 89% 11% 100%
Overall Percentage
Mahasiswa Statistik Bisnis 1 Tahun 2014 Dikelompokkan Berdasarkan Jenis Kelamin dan Status Saudara Kandung
17
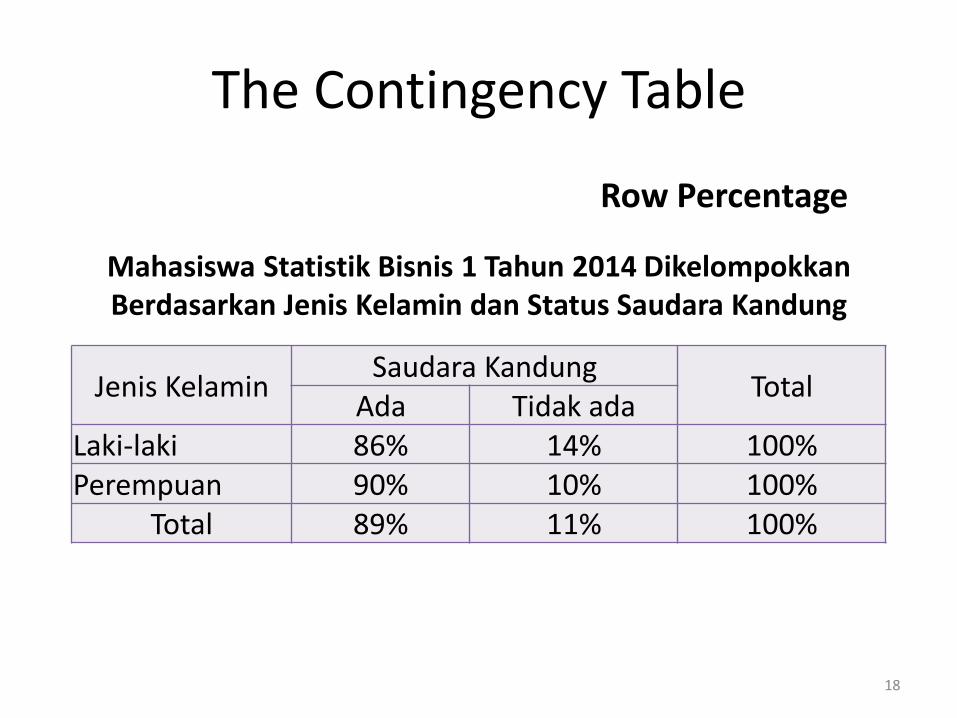
The Contingency Table
Jenis Kelamin Saudara Kandung
Total Ada Tidak ada
Laki-laki 86% 14% 100% Perempuan 90% 10% 100%
Total 89% 11% 100%
Row Percentage
Mahasiswa Statistik Bisnis 1 Tahun 2014 Dikelompokkan Berdasarkan Jenis Kelamin dan Status Saudara Kandung
18
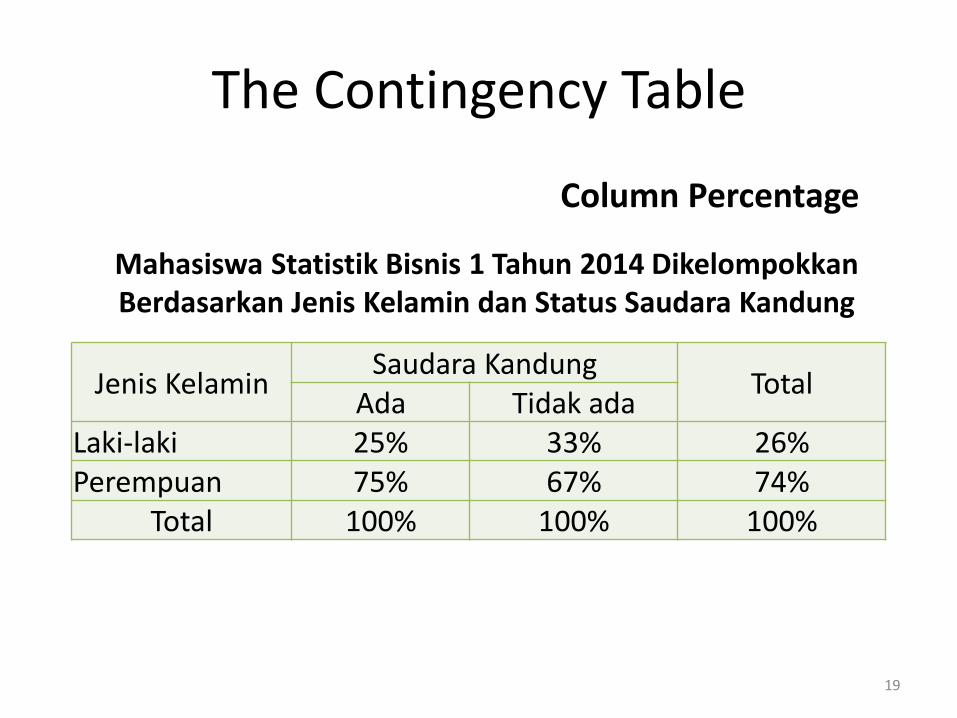
The Contingency Table
Jenis Kelamin Saudara Kandung
Total Ada Tidak ada
Laki-laki 25% 33% 26% Perempuan 75% 67% 74%
Total 100% 100% 100%
Column Percentage
Mahasiswa Statistik Bisnis 1 Tahun 2014 Dikelompokkan Berdasarkan Jenis Kelamin dan Status Saudara Kandung
19
NUMERICAL DATA
20
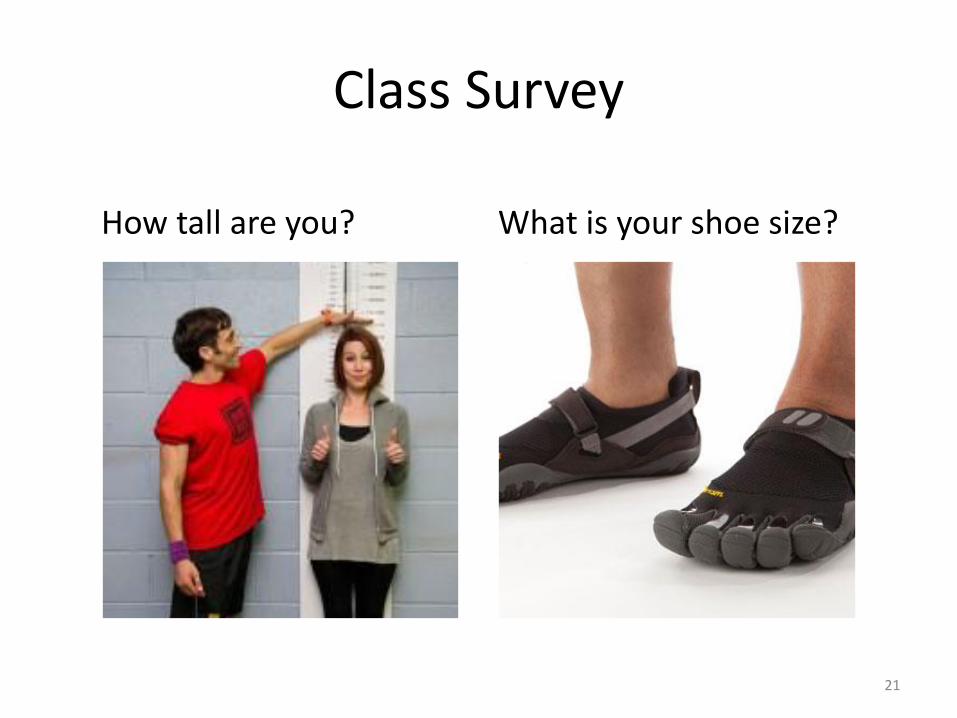
Class Survey
How tall are you? What is your shoe size?
21

The Ordered Array
150 155 155 155 155 156 156 156 156 157
157 160 160 160 160 162 168 168 168 170
170 171 173 173 174 174 175
22
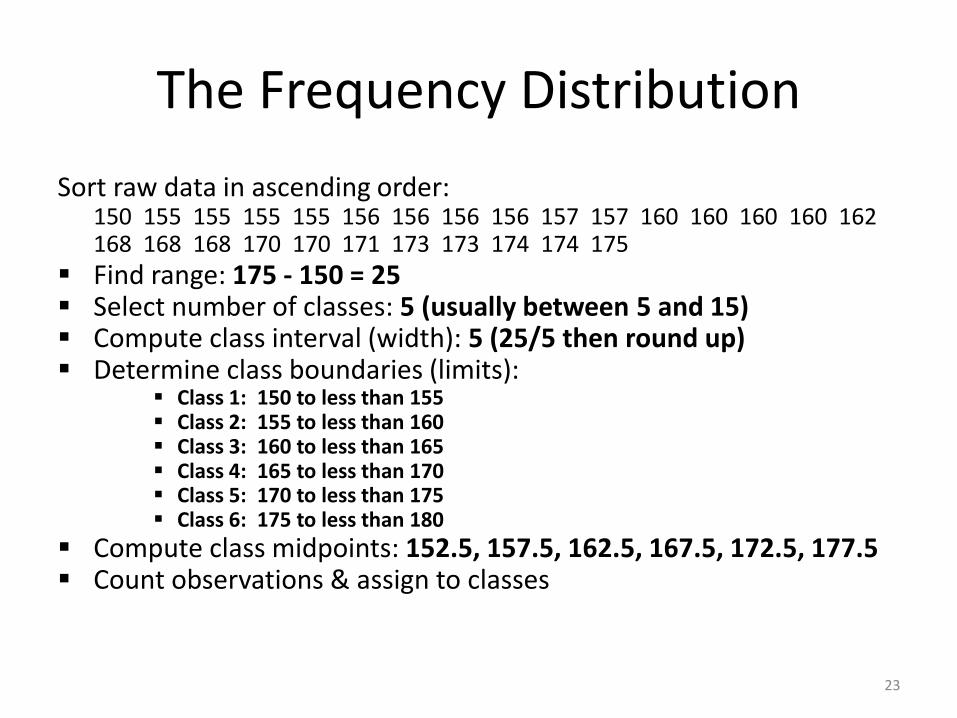
The Frequency Distribution
Sort raw data in ascending order: 150 155 155 155 155 156 156 156 156 157 157 160 160 160 160 162 168 168 168 170 170 171 173 173 174 174 175
Find range: 175 - 150 = 25 Select number of classes: 5 (usually between 5 and 15) Compute class interval (width): 5 (25/5 then round up) Determine class boundaries (limits):
Class 1: 150 to less than 155 Class 2: 155 to less than 160 Class 3: 160 to less than 165 Class 4: 165 to less than 170 Class 5: 170 to less than 175 Class 6: 175 to less than 180
Compute class midpoints: 152.5, 157.5, 162.5, 167.5, 172.5, 177.5 Count observations & assign to classes
23
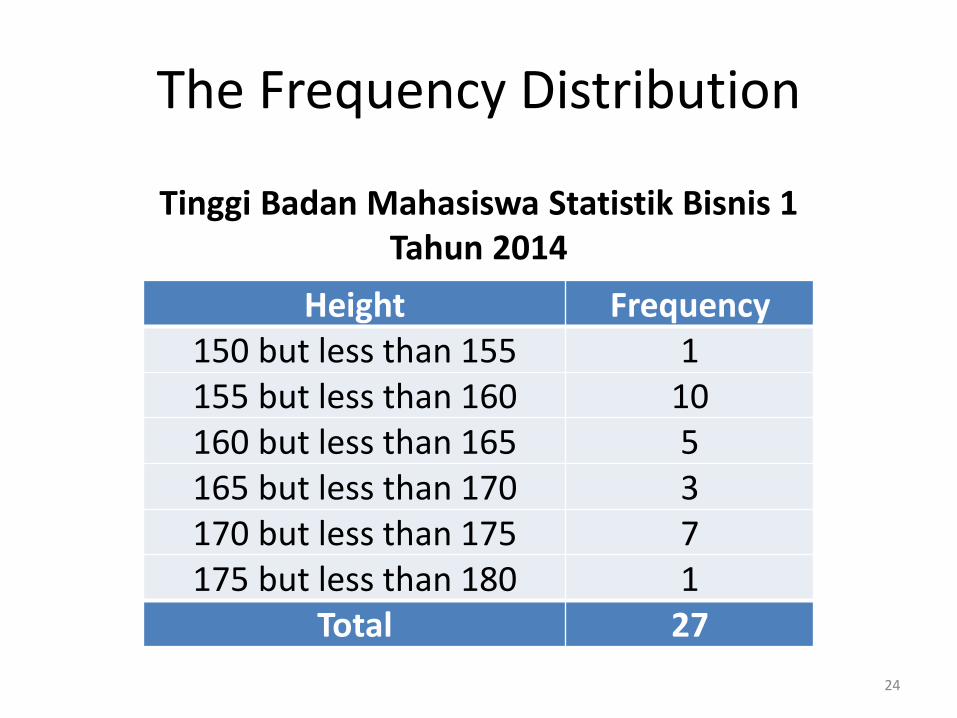
The Frequency Distribution
Height Frequency
150 but less than 155 1
155 but less than 160 10
160 but less than 165 5
165 but less than 170 3
170 but less than 175 7
175 but less than 180 1
Total 27
Tinggi Badan Mahasiswa Statistik Bisnis 1 Tahun 2014
24
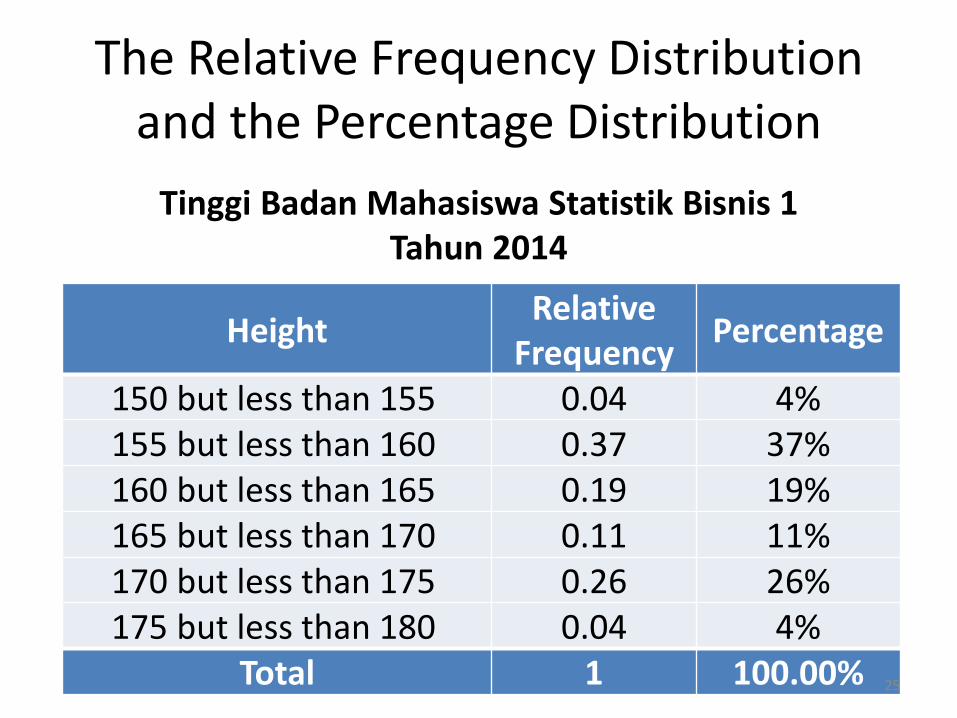
The Relative Frequency Distribution and the Percentage Distribution
Height Relative
Frequency Percentage
150 but less than 155 0.04 4%
155 but less than 160 0.37 37%
160 but less than 165 0.19 19%
165 but less than 170 0.11 11%
170 but less than 175 0.26 26%
175 but less than 180 0.04 4%
Total 1 100.00%
Tinggi Badan Mahasiswa Statistik Bisnis 1 Tahun 2014
25
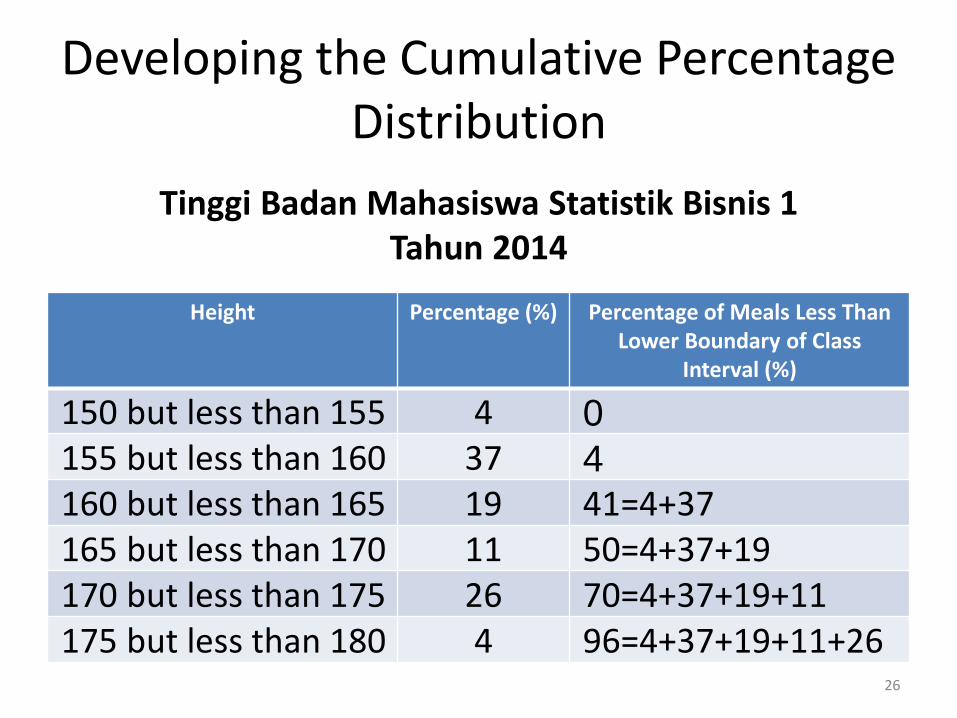
Developing the Cumulative Percentage Distribution
Height Percentage (%)
Percentage of Meals Less Than Lower Boundary of Class
Interval (%)
150 but less than 155 4 0
155 but less than 160 37 4
160 but less than 165 19 41=4+37
165 but less than 170 11 50=4+37+19
170 but less than 175 26 70=4+37+19+11
175 but less than 180 4 96=4+37+19+11+26
Tinggi Badan Mahasiswa Statistik Bisnis 1 Tahun 2014
26
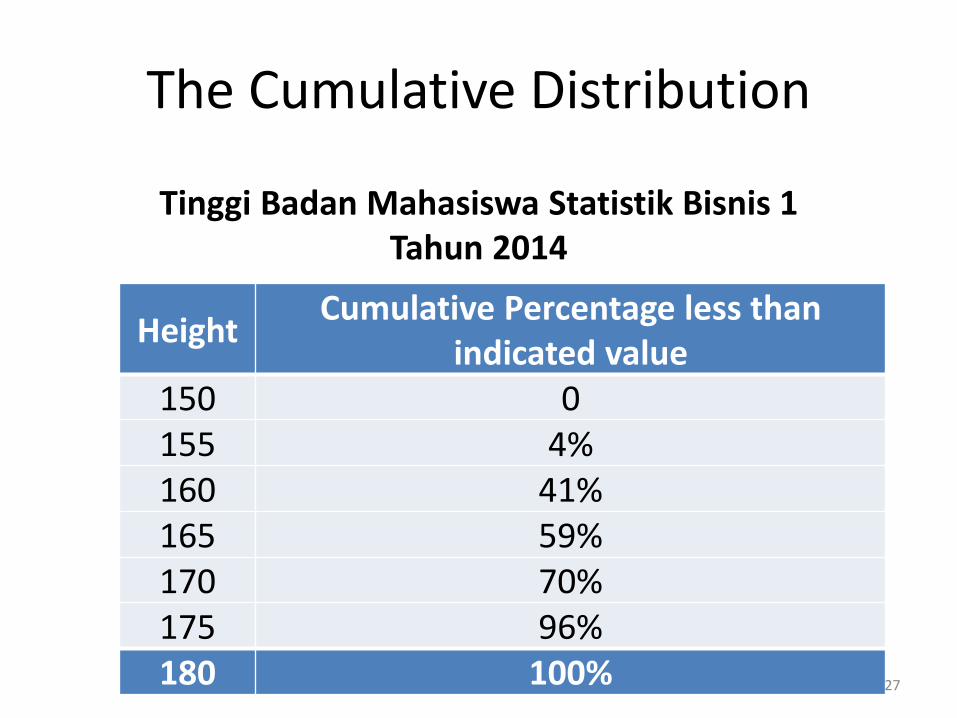
The Cumulative Distribution
Height Cumulative Percentage less than
indicated value
150 0
155 4%
160 41%
165 59%
170 70%
175 96%
180 100%
Tinggi Badan Mahasiswa Statistik Bisnis 1 Tahun 2014
27
VISUALIZING DATA
28
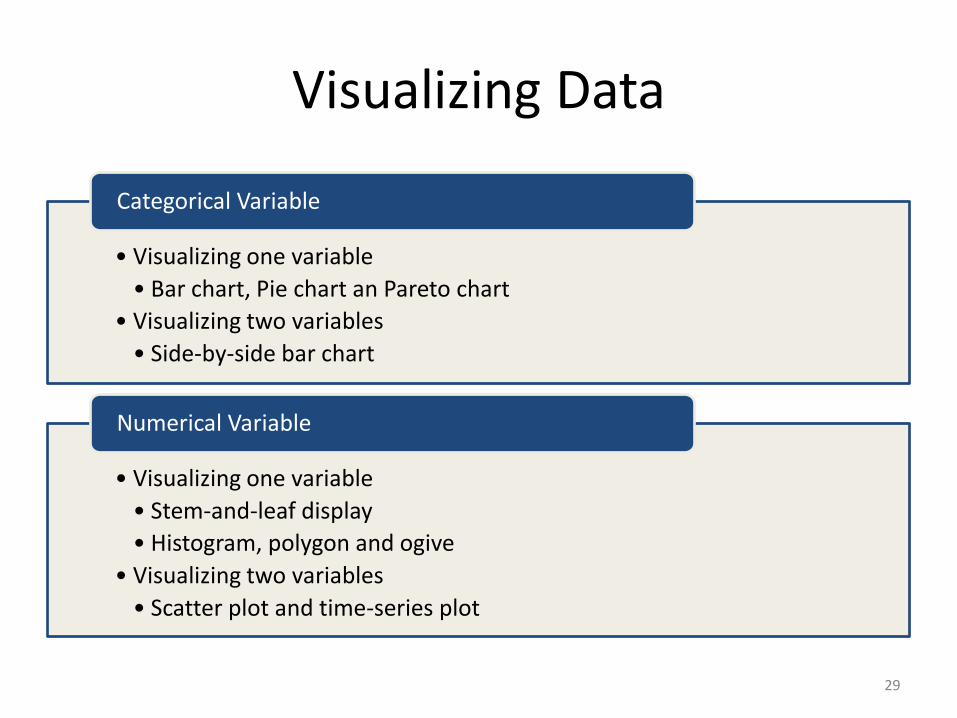
Visualizing Data
• Visualizing one variable
• Bar chart, Pie chart an Pareto chart
• Visualizing two variables
• Side-by-side bar chart
Categorical Variable
• Visualizing one variable
• Stem-and-leaf display
• Histogram, polygon and ogive
• Visualizing two variables
• Scatter plot and time-series plot
Numerical Variable
29
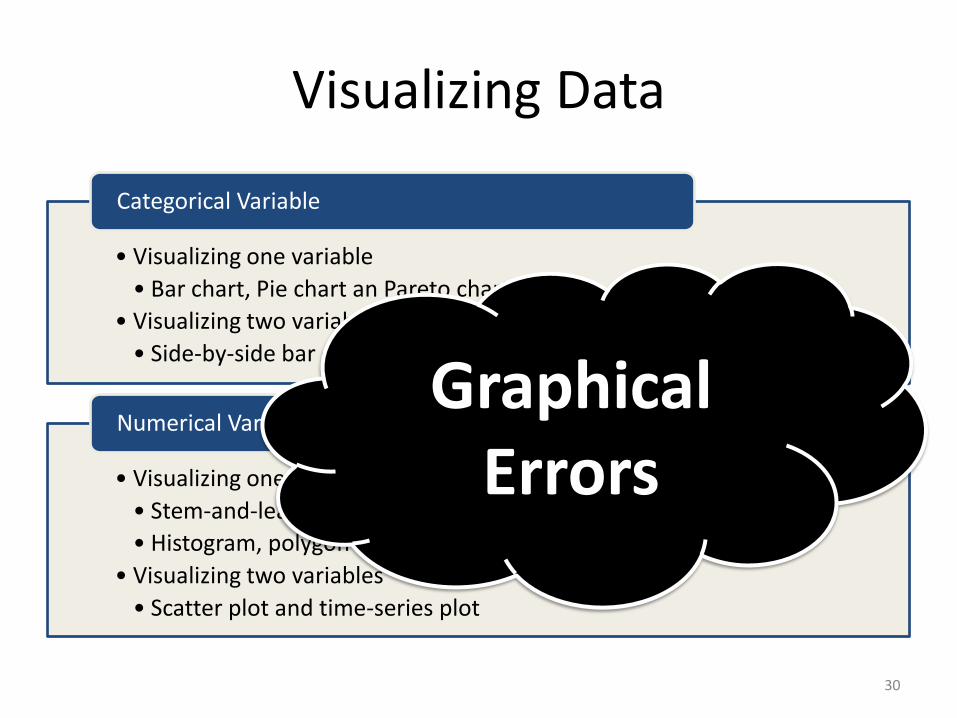
Visualizing Data
• Visualizing one variable
• Bar chart, Pie chart an Pareto chart
• Visualizing two variables
• Side-by-side bar chart
Categorical Variable
• Visualizing one variable
• Stem-and-leaf display
• Histogram, polygon and ogive
• Visualizing two variables
• Scatter plot and time-series plot
Numerical Variable Graphical
Errors
30

CATEGORICAL VARIABLE
31
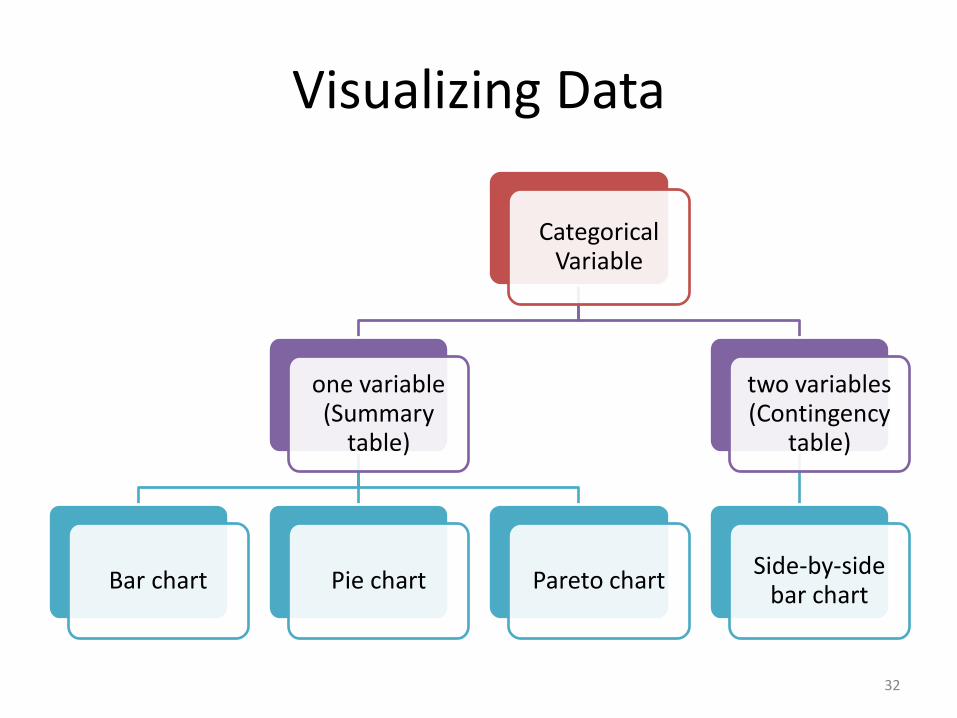
Visualizing Data
Categorical Variable
one variable (Summary
table)
Bar chart Pie chart Pareto chart
two variables (Contingency
table)
Side-by-side bar chart
32
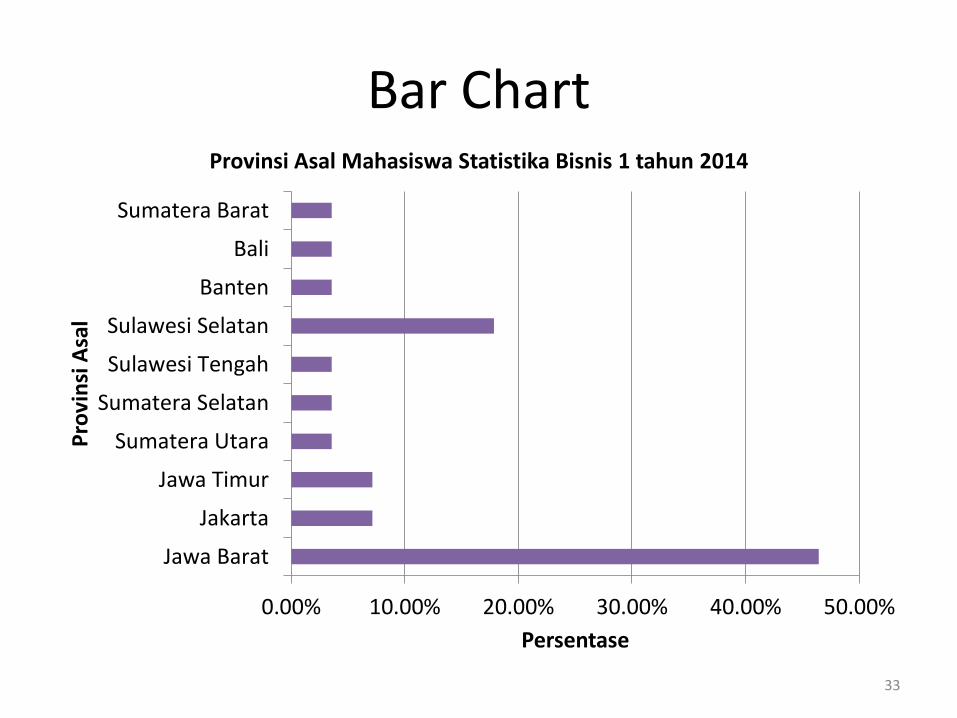
Bar Chart
0.00% 10.00% 20.00% 30.00% 40.00% 50.00%
Jawa Barat
Jakarta
Jawa Timur
Sumatera Utara
Sumatera Selatan
Sulawesi Tengah
Sulawesi Selatan
Banten
Bali
Sumatera Barat
Persentase
Pro
vin
si A
sal
Provinsi Asal Mahasiswa Statistika Bisnis 1 tahun 2014
33
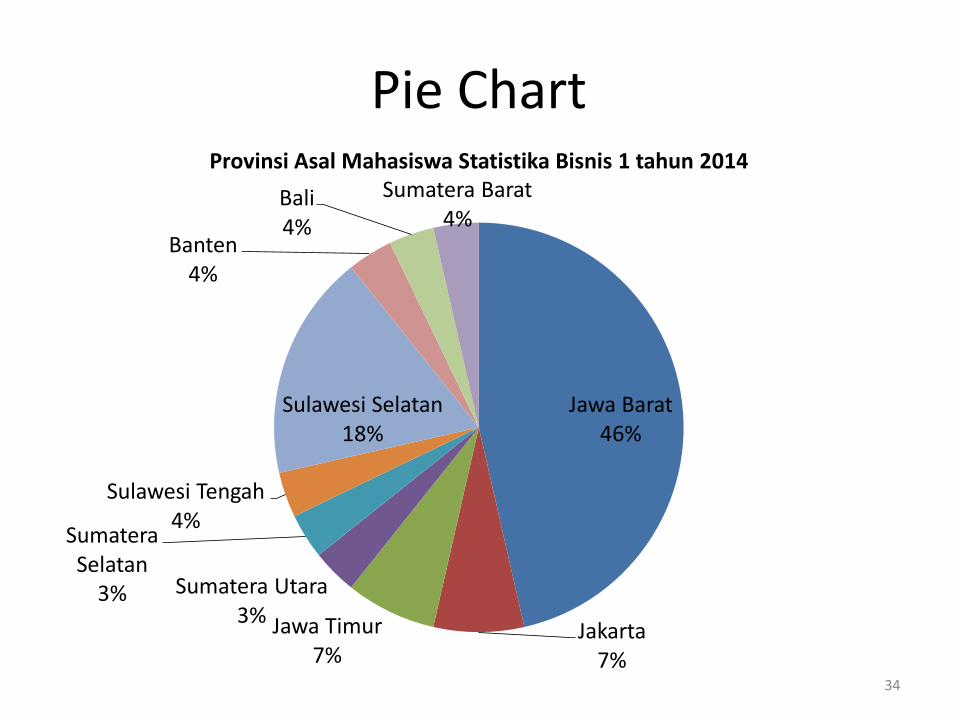
Pie Chart
Jawa Barat 46%
Jakarta 7%
Jawa Timur 7%
Sumatera Utara 3%
Sumatera Selatan
3%
Sulawesi Tengah 4%
Sulawesi Selatan 18%
Banten 4%
Bali 4%
Sumatera Barat 4%
Provinsi Asal Mahasiswa Statistika Bisnis 1 tahun 2014
34
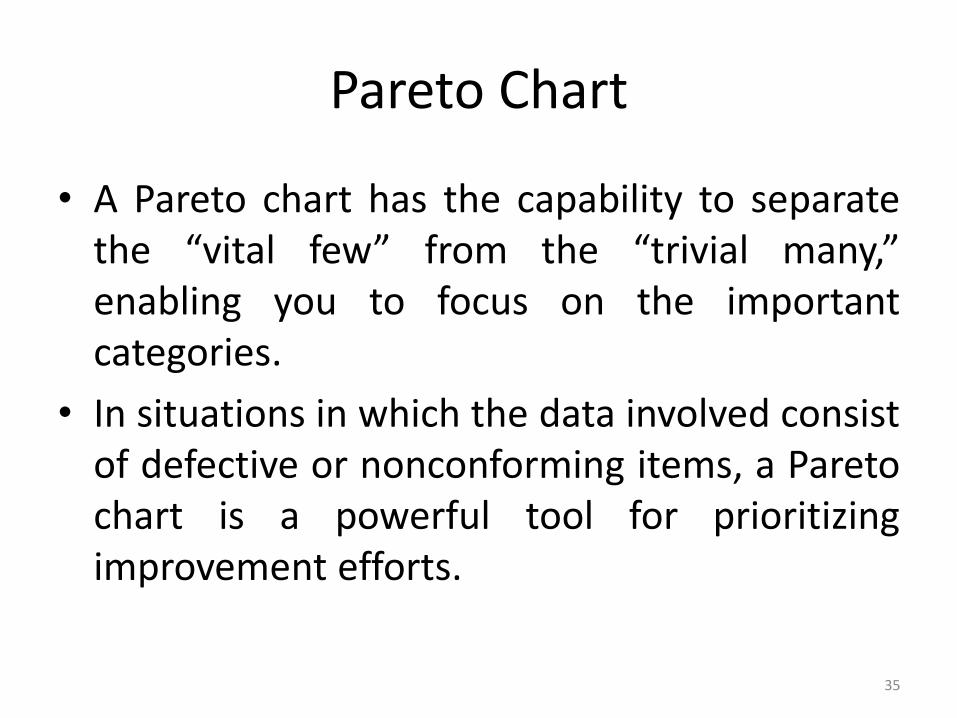
Pareto Chart
• A Pareto chart has the capability to separate the “vital few” from the “trivial many,” enabling you to focus on the important categories.
• In situations in which the data involved consist of defective or nonconforming items, a Pareto chart is a powerful tool for prioritizing improvement efforts.
35
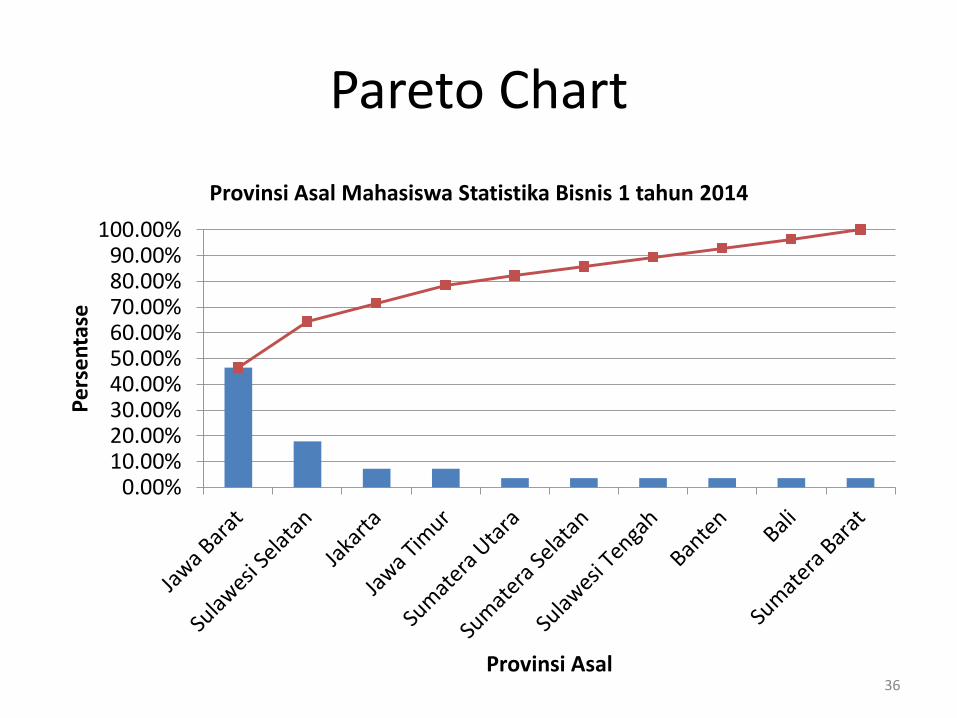
Pareto Chart
0.00%10.00%20.00%30.00%40.00%50.00%60.00%70.00%80.00%90.00%
100.00%
Per
sen
tase
Provinsi Asal
Provinsi Asal Mahasiswa Statistika Bisnis 1 tahun 2014
36
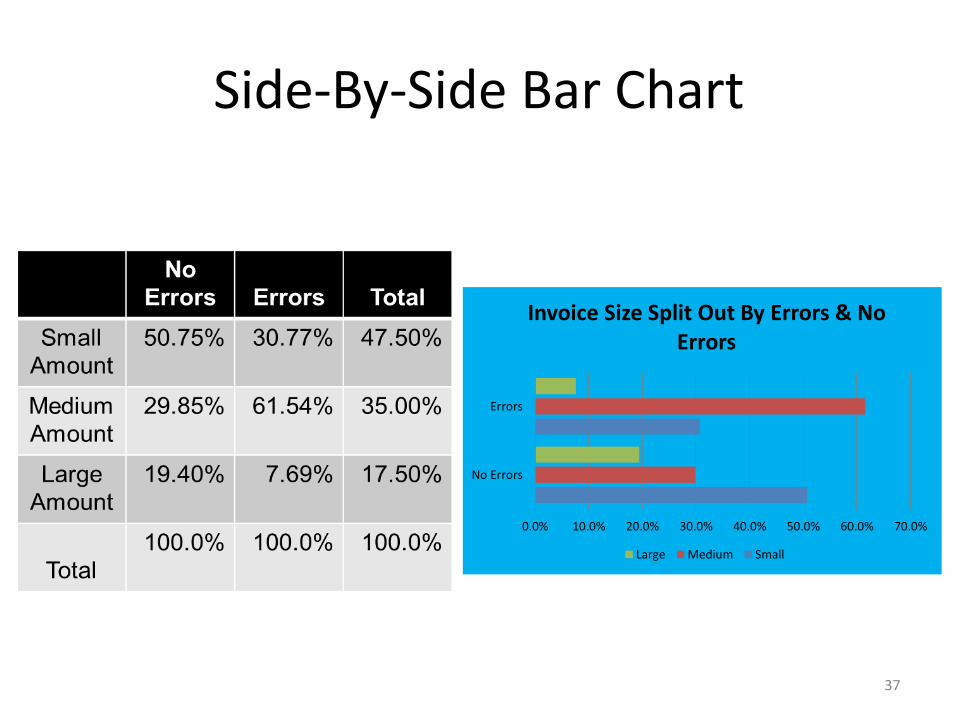
Side-By-Side Bar Chart
0.0% 10.0% 20.0% 30.0% 40.0% 50.0% 60.0% 70.0%
No Errors
Errors
Invoice Size Split Out By Errors & No Errors
Large Medium Small
37
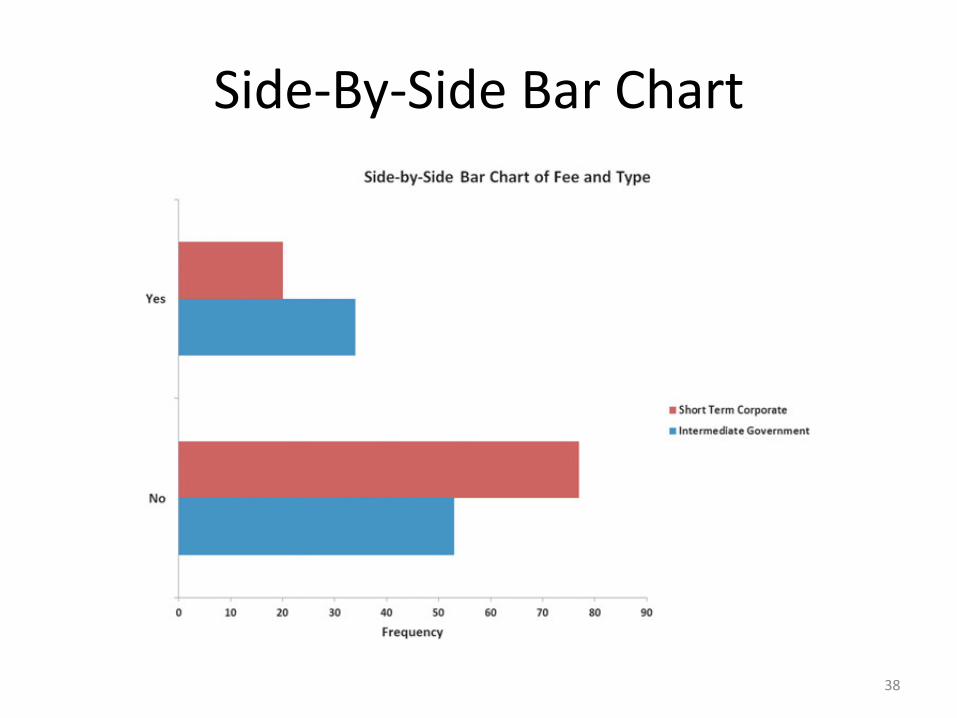
Side-By-Side Bar Chart
38

NUMERICAL VARIABLE
39

Visualizing Data
Numerical Variable
One variable
Ordered Array
Stem-and-Leaf Display
Frequency & Cumulative distribution
Histogram Polygon Ogive
Two variables
Scatter Plot Time-Series
Plot
40
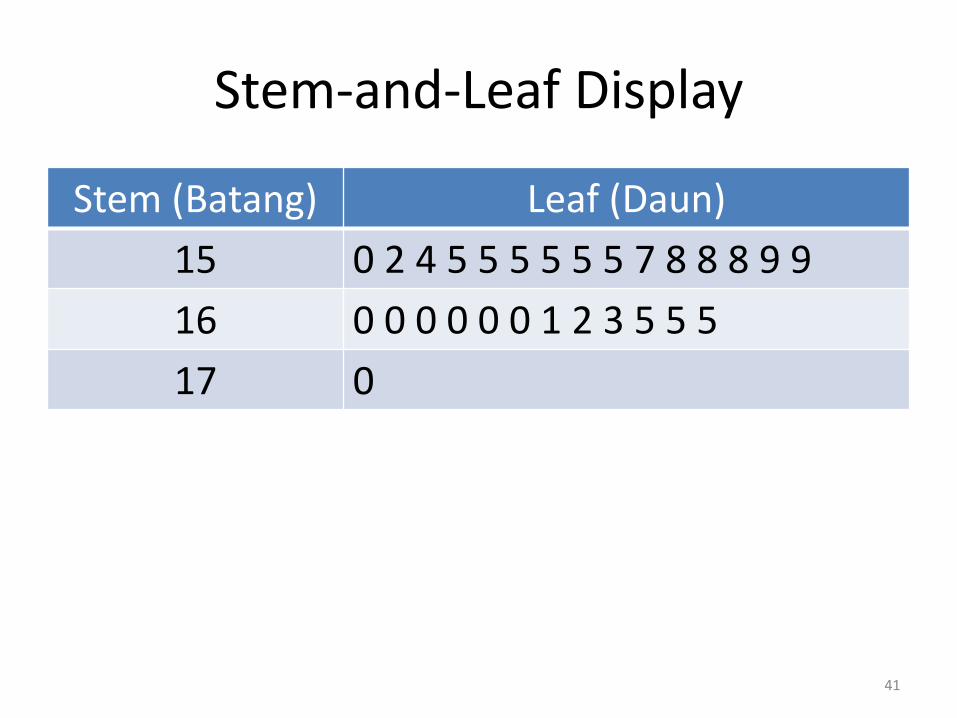
Stem-and-Leaf Display
Stem (Batang) Leaf (Daun)
15 0 2 4 5 5 5 5 5 5 7 8 8 8 9 9
16 0 0 0 0 0 0 1 2 3 5 5 5
17 0
41
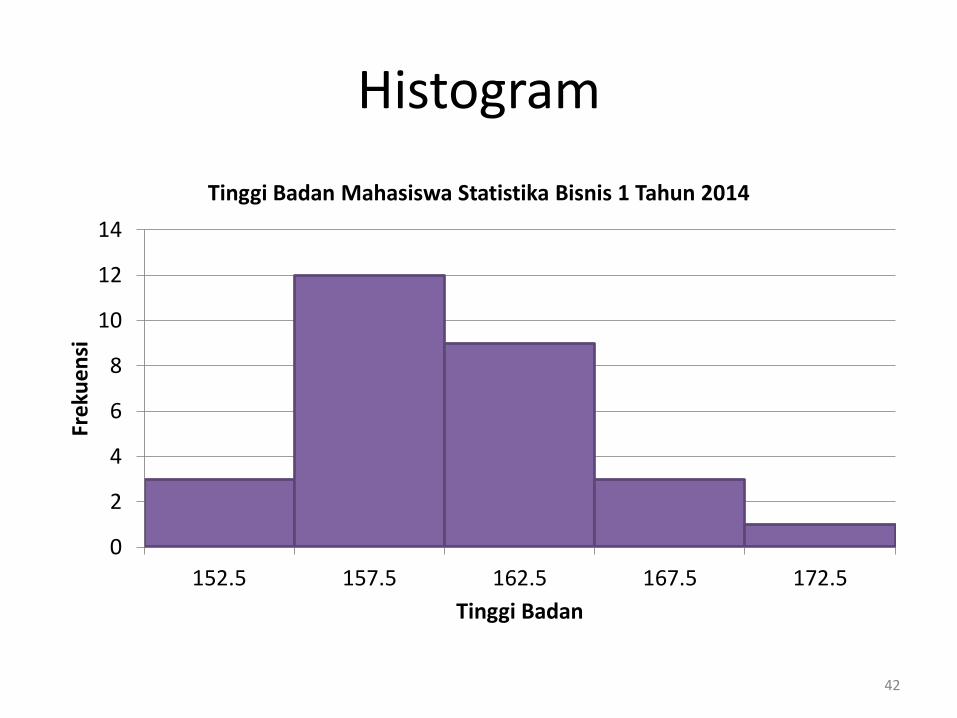
Histogram
0
2
4
6
8
10
12
14
152.5 157.5 162.5 167.5 172.5
Frek
uen
si
Tinggi Badan
Tinggi Badan Mahasiswa Statistika Bisnis 1 Tahun 2014
42
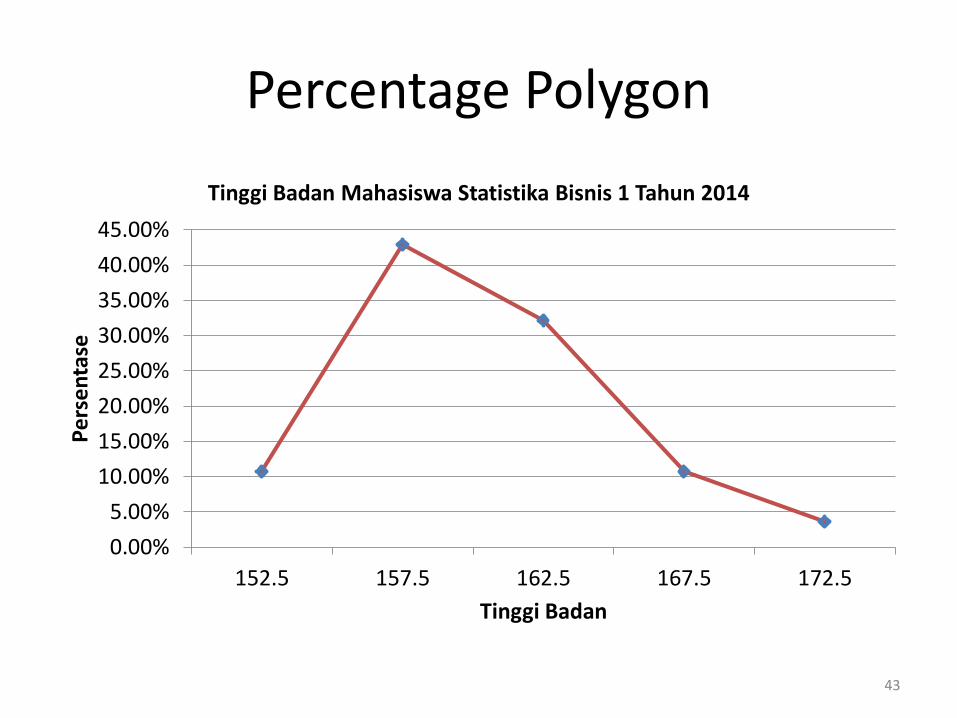
Percentage Polygon
0.00%
5.00%
10.00%
15.00%
20.00%
25.00%
30.00%
35.00%
40.00%
45.00%
152.5 157.5 162.5 167.5 172.5
Per
sen
tase
Tinggi Badan
Tinggi Badan Mahasiswa Statistika Bisnis 1 Tahun 2014
43
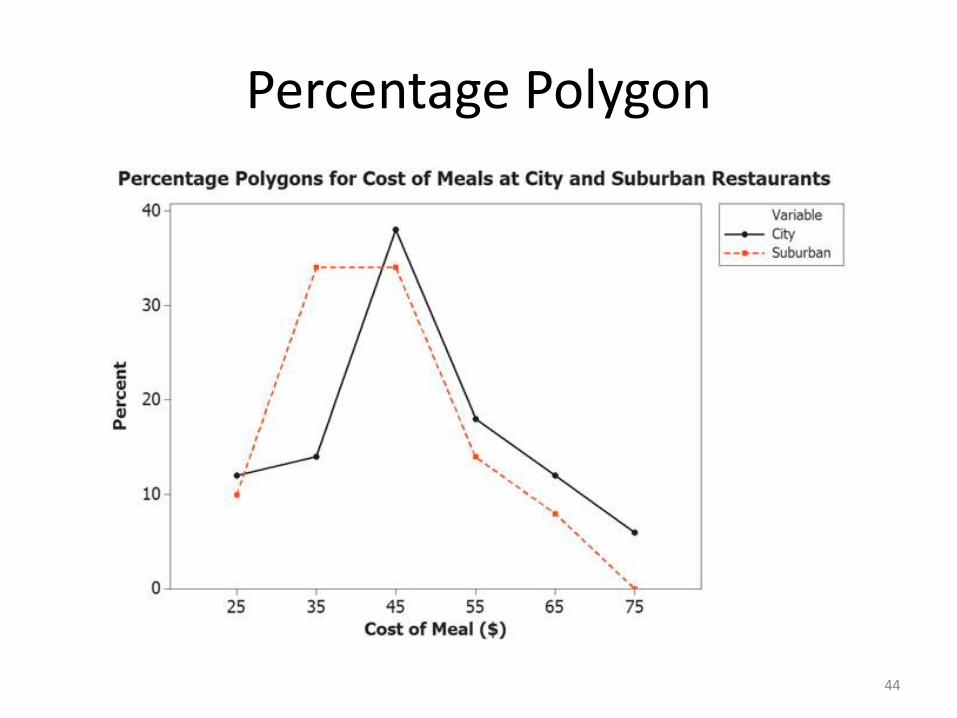
Percentage Polygon
44
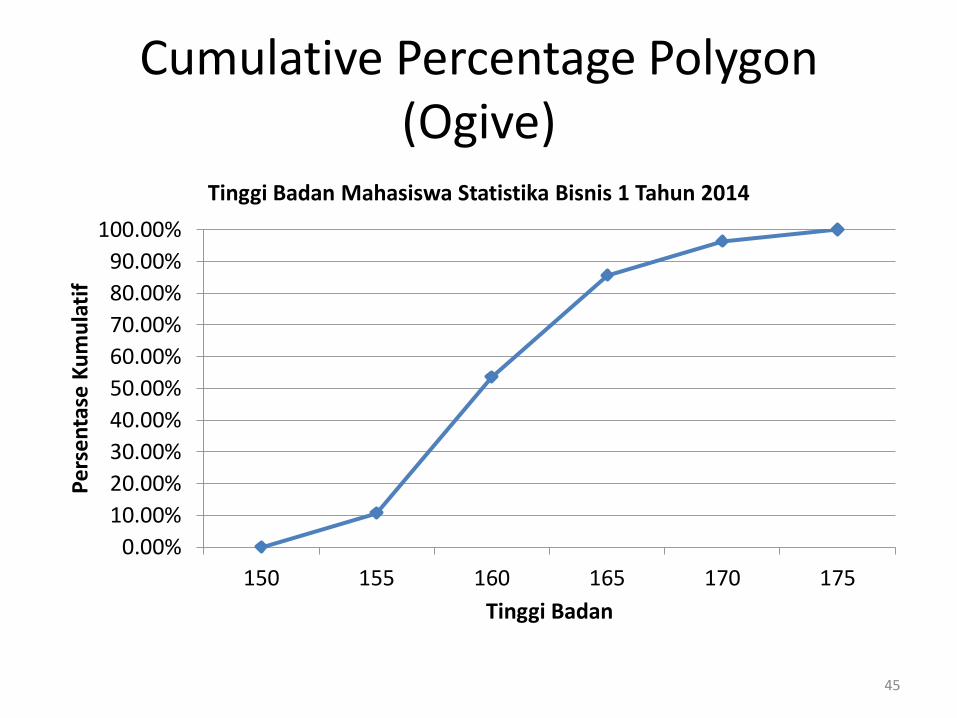
Cumulative Percentage Polygon (Ogive)
0.00%
10.00%
20.00%
30.00%
40.00%
50.00%
60.00%
70.00%
80.00%
90.00%
100.00%
150 155 160 165 170 175
Per
sen
tase
Ku
mu
lati
f
Tinggi Badan
Tinggi Badan Mahasiswa Statistika Bisnis 1 Tahun 2014
45
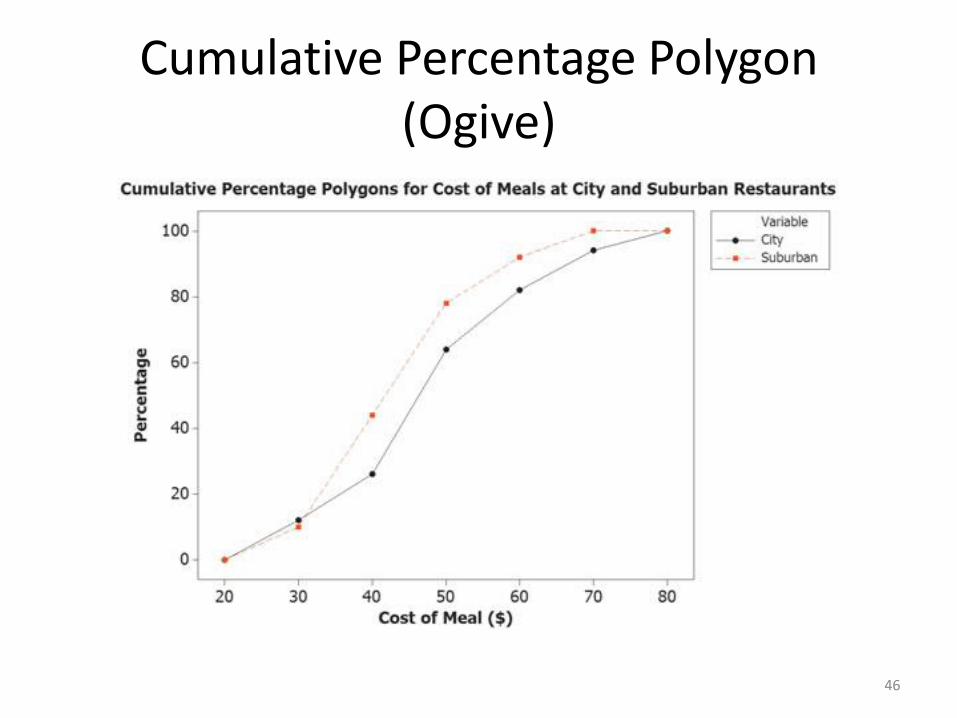
Cumulative Percentage Polygon (Ogive)
46
Note!
When you construct polygons or histograms, the vertical (Y) axis should show the true zero, or “origin,” so as not to distort the character of the data.
47
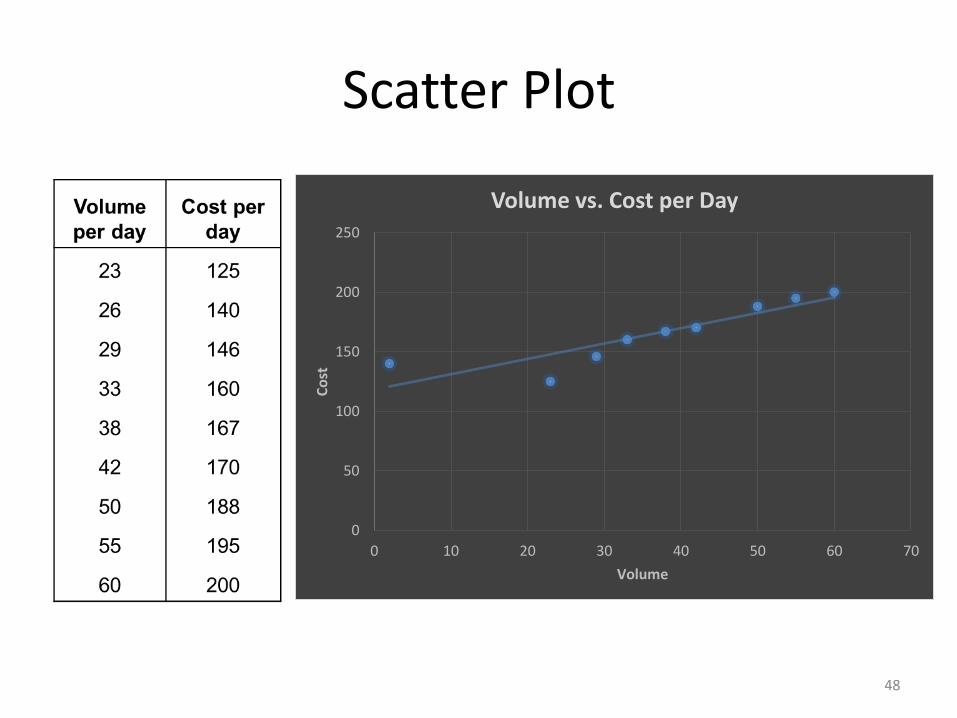
Scatter Plot
0
50
100
150
200
250
0 10 20 30 40 50 60 70
Co
st
Volume
Volume vs. Cost per Day
48
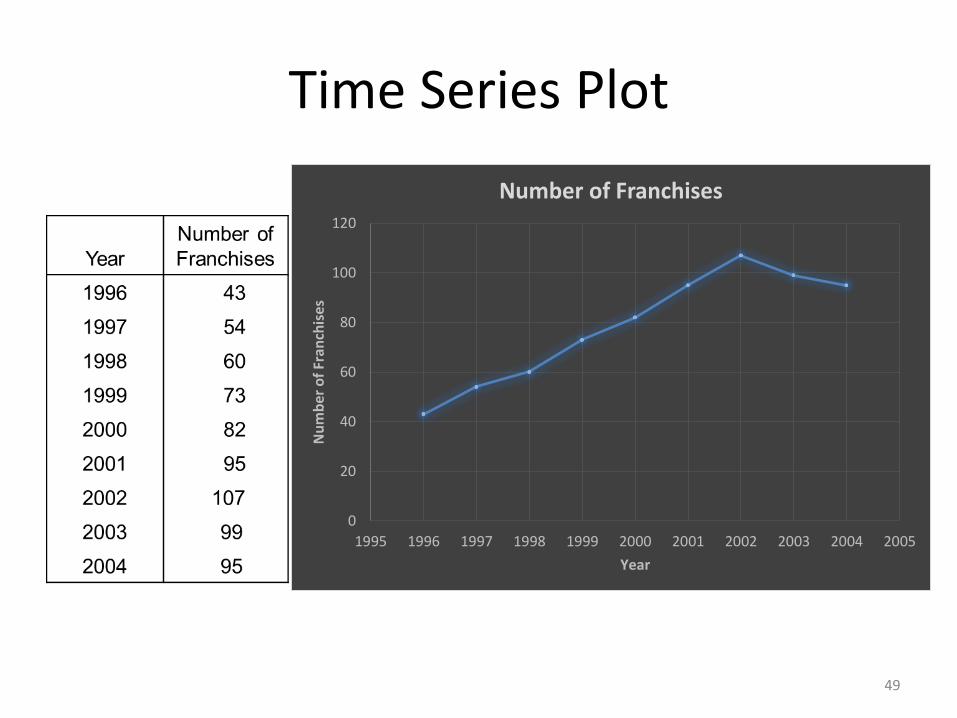
Time Series Plot
0
20
40
60
80
100
120
1995 1996 1997 1998 1999 2000 2001 2002 2003 2004 2005
Nu
mb
er o
f Fr
anch
ise
s
Year
Number of Franchises
49

Principles of Excellent Graphs
The graph should not distort the data.
The graph should not contain unnecessary adornments (sometimes referred to as chart junk).
The scale on the vertical axis should begin at zero.
All axes should be properly labeled.
The graph should contain a title.
The simplest possible graph should be used for a given set of data.
50
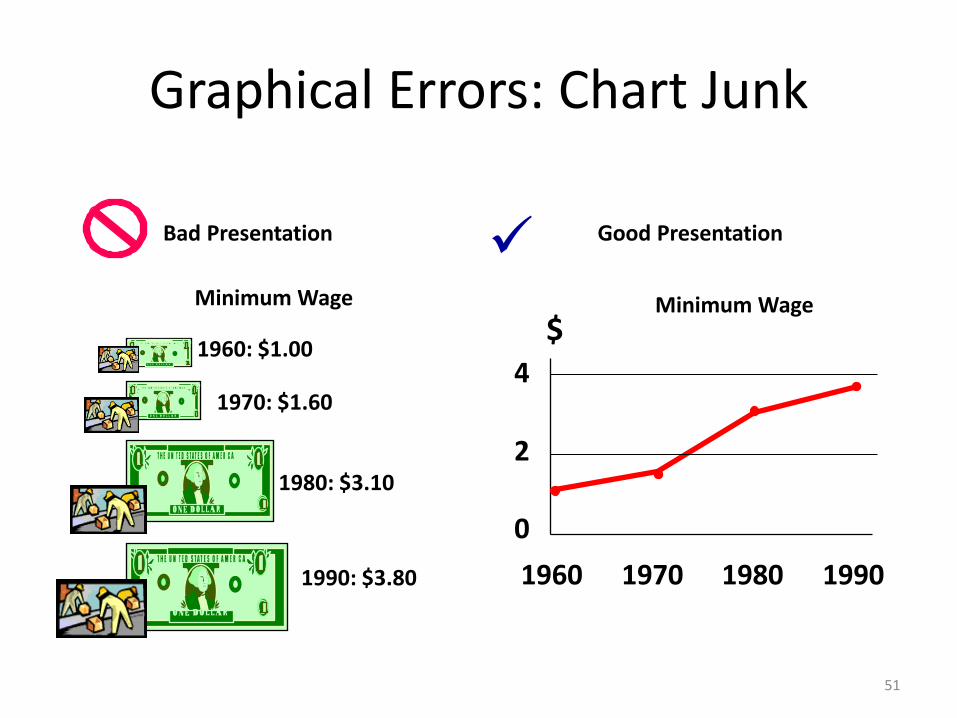
Graphical Errors: Chart Junk
1960: $1.00
1970: $1.60
1980: $3.10
1990: $3.80
Minimum Wage
Bad Presentation
Minimum Wage
0
2
4
1960 1970 1980 1990
$
Good Presentation
51
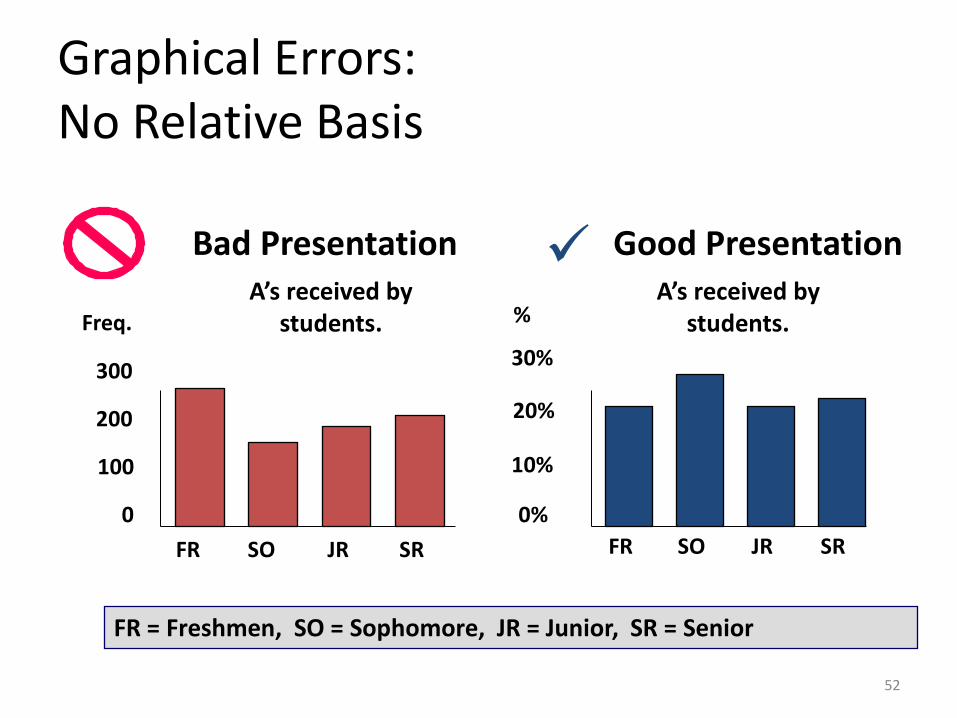
Graphical Errors: No Relative Basis
A’s received by students.
A’s received by students.
Bad Presentation
0
200
300
FR SO JR SR
Freq.
10%
30%
FR SO JR SR
FR = Freshmen, SO = Sophomore, JR = Junior, SR = Senior
100
20%
0%
%
Good Presentation
52
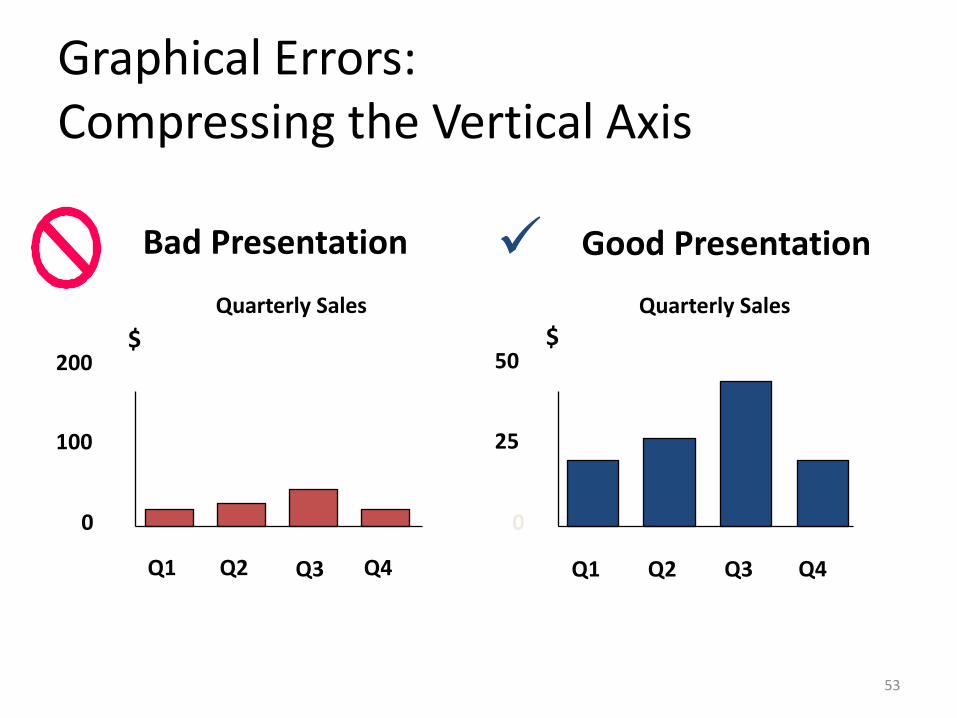
Graphical Errors: Compressing the Vertical Axis
Good Presentation
Quarterly Sales Quarterly Sales
Bad Presentation
0
25
50
Q1 Q2 Q3 Q4
$
0
100
200
Q1 Q2 Q3 Q4
$
53
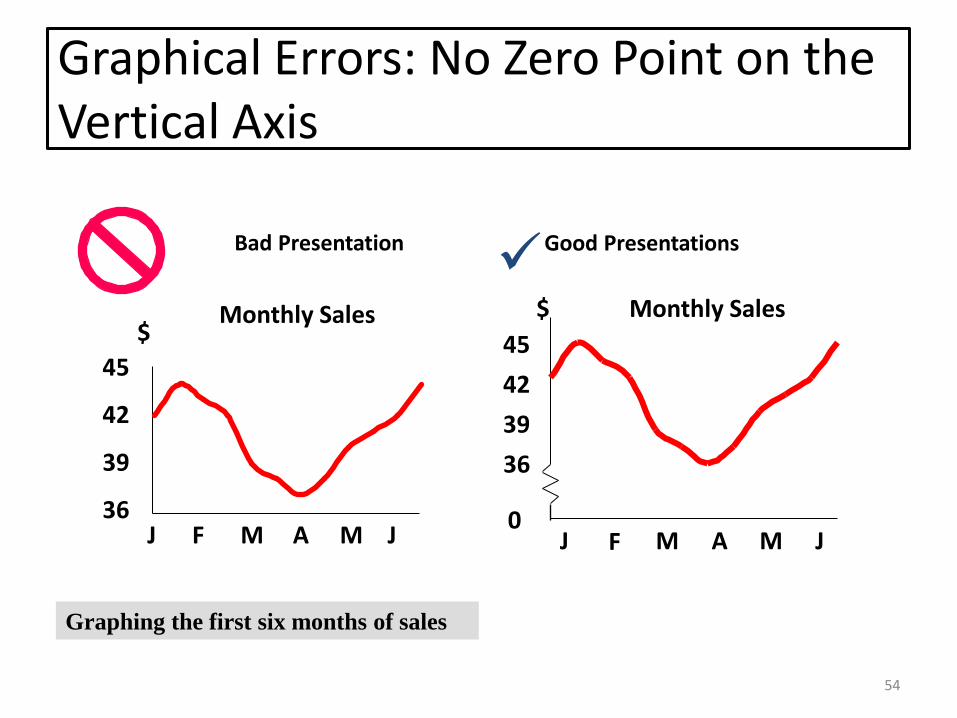
Graphical Errors: No Zero Point on the Vertical Axis
Monthly Sales
36
39
42
45
J F M A M J
$
Graphing the first six months of sales
Monthly Sales
0
39
42
45
J F M A M J
$
36
Good Presentations Bad Presentation
54

EXERCISE
55
2.28
Tabel berikut menunjukkan persentase konsumsi listrik rumah tangga di Amerika Serikat yang disusun berdasarkan jenis alat elektronik pada tahun 2012:
56
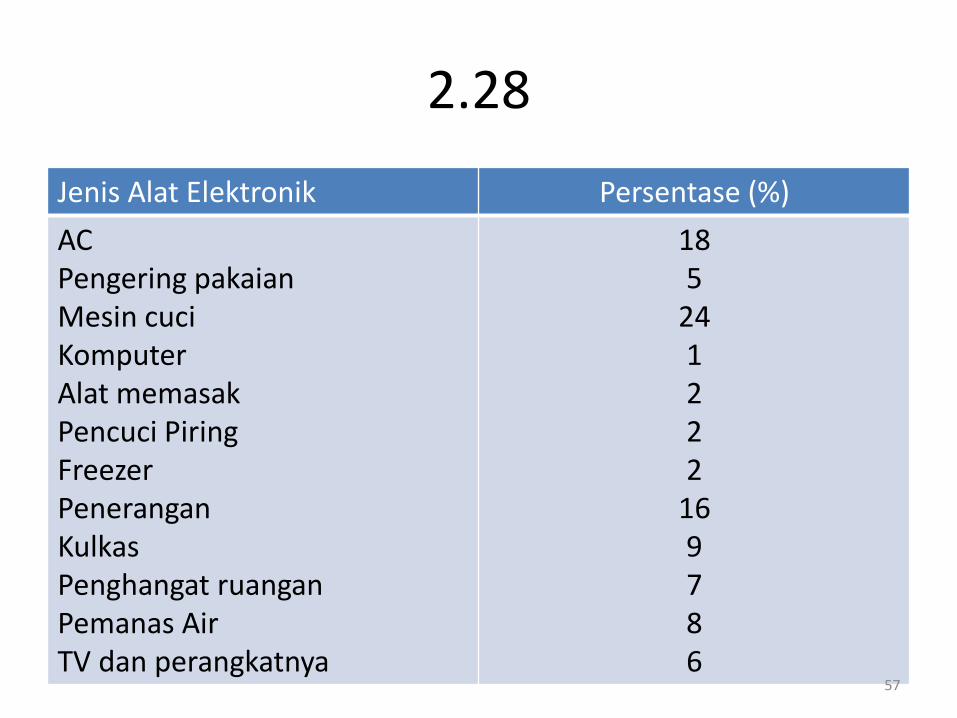
2.28
Jenis Alat Elektronik Persentase (%)
AC Pengering pakaian Mesin cuci Komputer Alat memasak Pencuci Piring Freezer Penerangan Kulkas Penghangat ruangan Pemanas Air TV dan perangkatnya
18 5
24 1 2 2 2
16 9 7 8 6
57
2.28
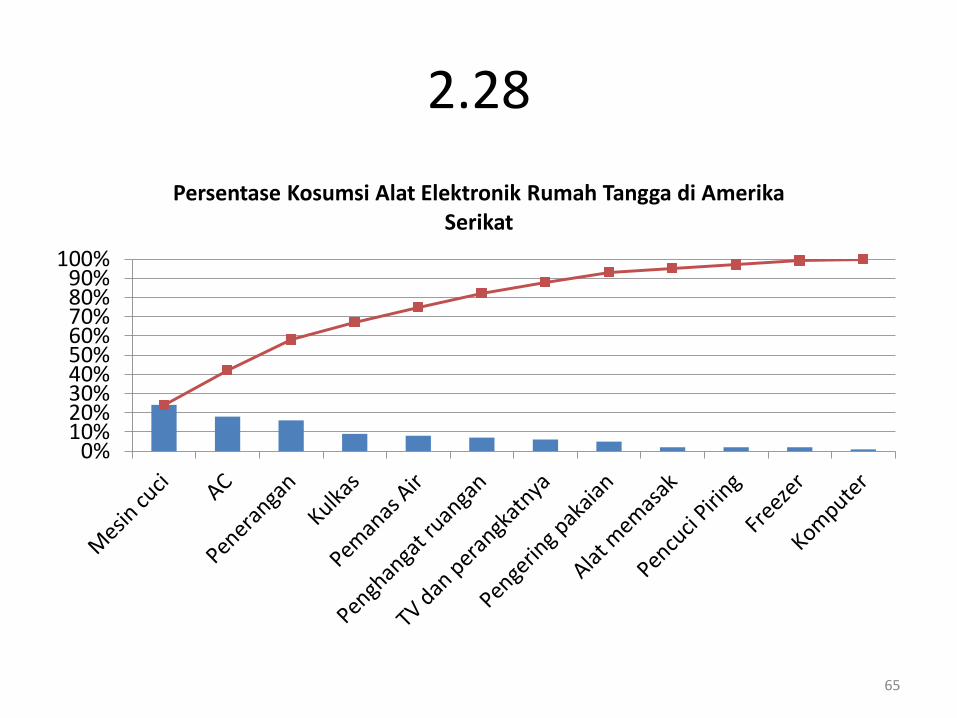
a. Gambarkan bar chart, pie chart, dan Pareto chart untuk data tersebut.
b. Grafik manakah yang paling cocok menurut anda untuk menggambarkan data tersebut?
58
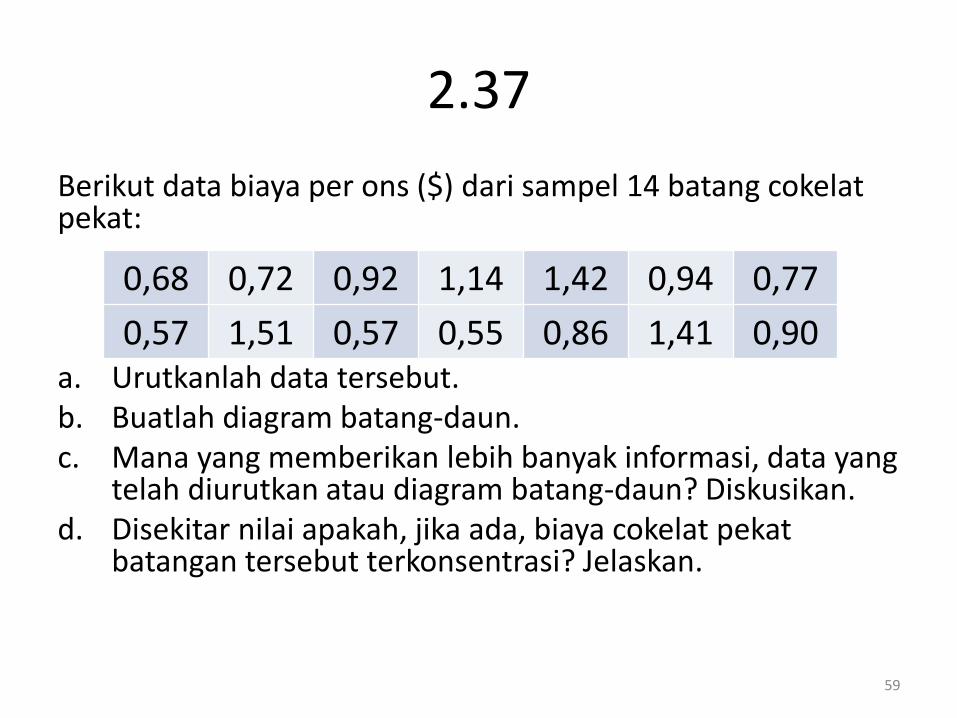
2.37
Berikut data biaya per ons ($) dari sampel 14 batang cokelat pekat: a. Urutkanlah data tersebut. b. Buatlah diagram batang-daun. c. Mana yang memberikan lebih banyak informasi, data yang
telah diurutkan atau diagram batang-daun? Diskusikan. d. Disekitar nilai apakah, jika ada, biaya cokelat pekat
batangan tersebut terkonsentrasi? Jelaskan.
0,68 0,72 0,92 1,14 1,42 0,94 0,77
0,57 1,51 0,57 0,55 0,86 1,41 0,90
59

2.38
Berikut data biaya listrik pada bulan juli 2010 dari sampel acak 50 apartemen dengan satu kamar tidur di kota besar:
96 171 202 178 147 102 153 197 127 82
157 185 90 116 172 111 148 213 130 165
141 149 206 175 123 128 144 168 109 167
95 163 150 154 130 143 187 166 139 149
108 119 183 151 114 135 191 137 129 158
60
2.38
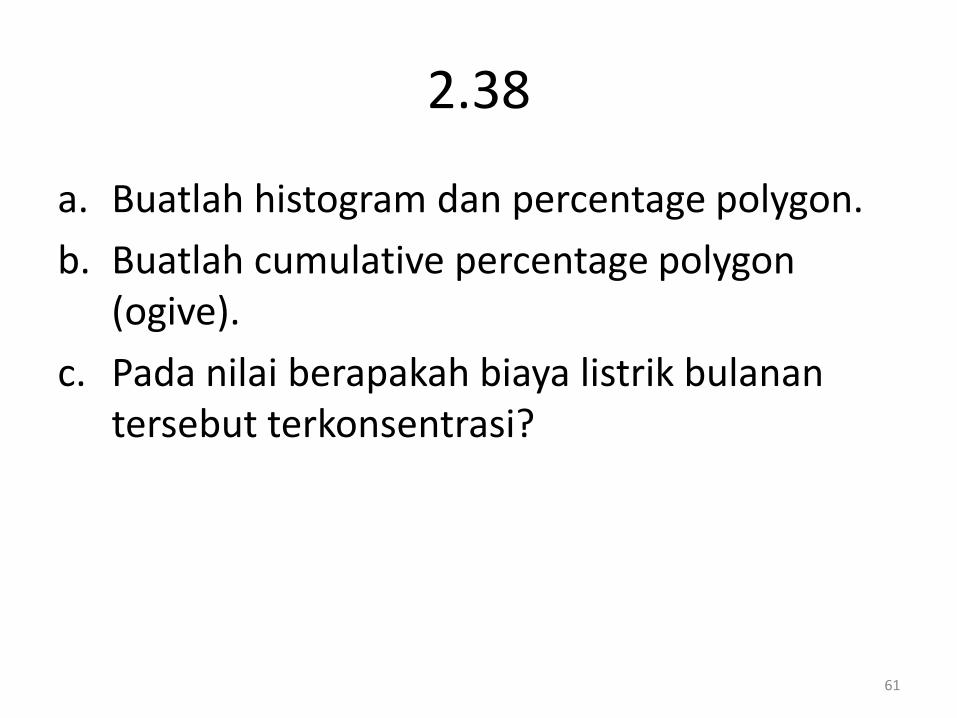
a. Buatlah histogram dan percentage polygon.
b. Buatlah cumulative percentage polygon (ogive).
c. Pada nilai berapakah biaya listrik bulanan tersebut terkonsentrasi?
61

ANSWER
62
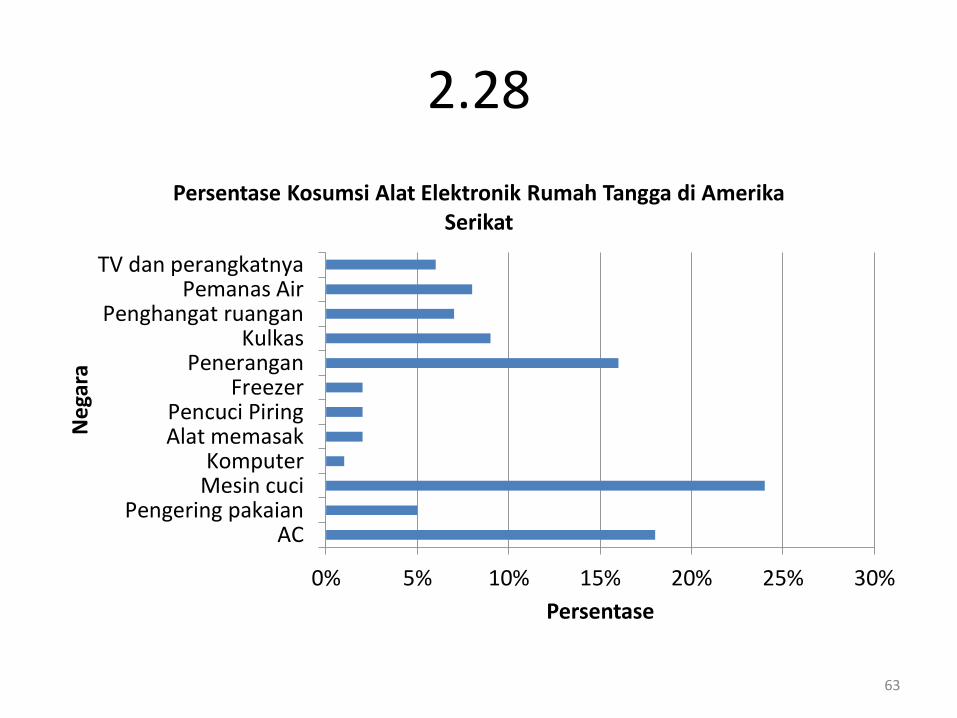
2.28
0% 5% 10% 15% 20% 25% 30%
ACPengering pakaian
Mesin cuciKomputer
Alat memasakPencuci Piring
FreezerPenerangan
KulkasPenghangat ruangan
Pemanas AirTV dan perangkatnya
Persentase
Neg
ara
Persentase Kosumsi Alat Elektronik Rumah Tangga di Amerika Serikat
63
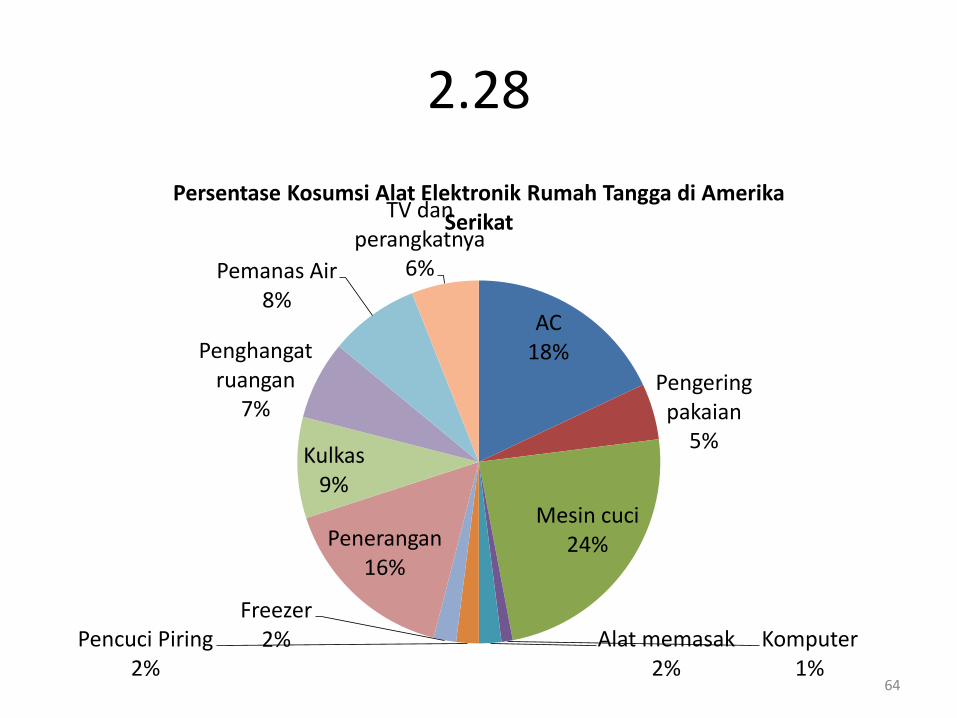
2.28
AC 18%
Pengering pakaian
5%
Mesin cuci 24%
Komputer 1%
Alat memasak 2%
Pencuci Piring 2%
Freezer 2%
Penerangan 16%
Kulkas 9%
Penghangat ruangan
7%
Pemanas Air 8%
TV dan perangkatnya
6%
Persentase Kosumsi Alat Elektronik Rumah Tangga di Amerika Serikat
64
2.28
0%10%20%30%40%50%60%70%80%90%
100%
Persentase Kosumsi Alat Elektronik Rumah Tangga di Amerika Serikat
65
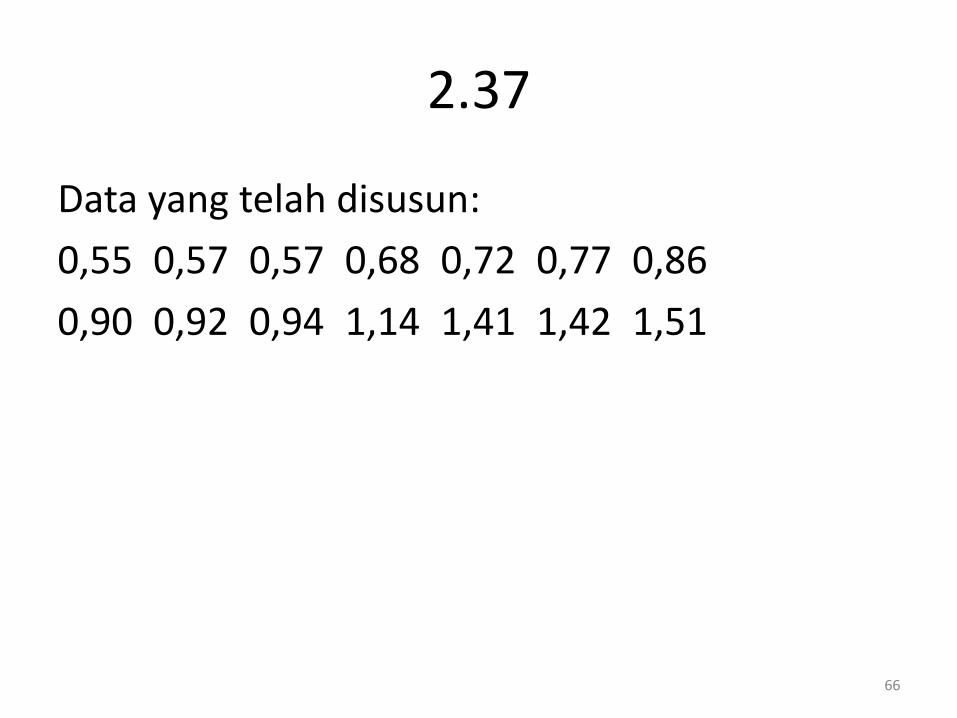
2.37
Data yang telah disusun:
0,55 0,57 0,57 0,68 0,72 0,77 0,86
0,90 0,92 0,94 1,14 1,41 1,42 1,51
66
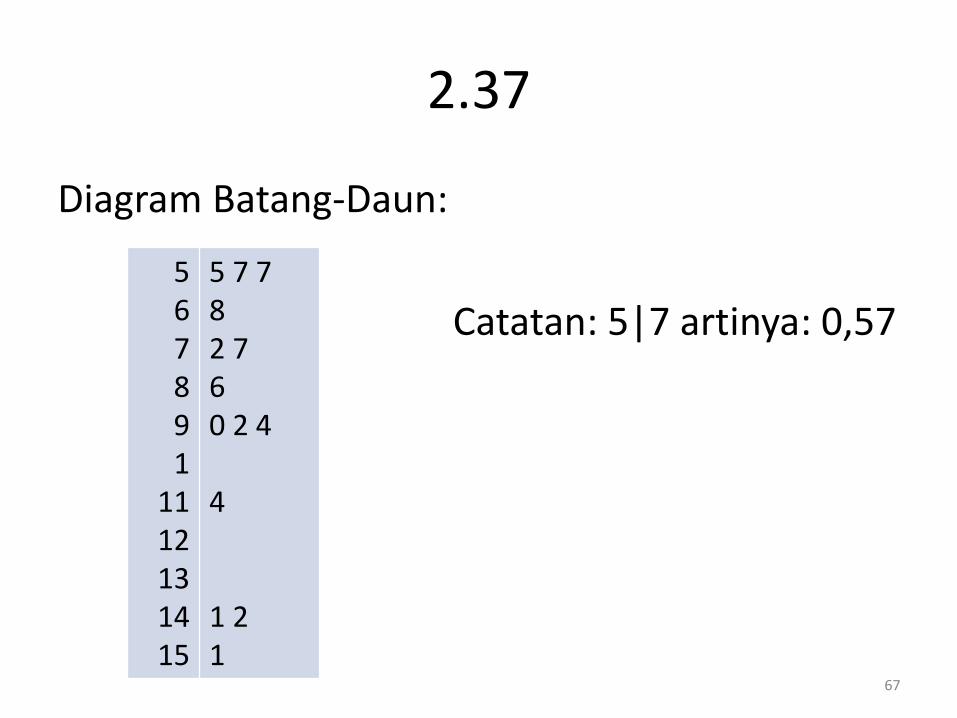
2.37
Diagram Batang-Daun:
Catatan: 5|7 artinya: 0,57
5 6 7 8 9 1
11 12 13 14 15
5 7 7 8 2 7 6 0 2 4 4 1 2 1
67
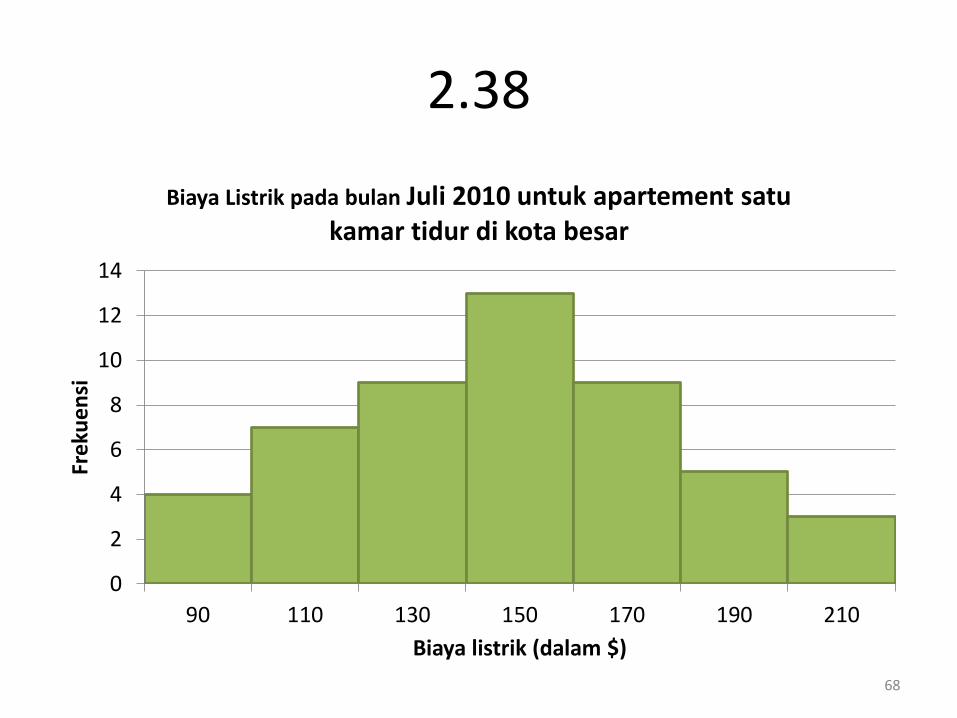
2.38
0
2
4
6
8
10
12
14
90 110 130 150 170 190 210
Frek
uen
si
Biaya listrik (dalam $)
Biaya Listrik pada bulan Juli 2010 untuk apartement satu kamar tidur di kota besar
68
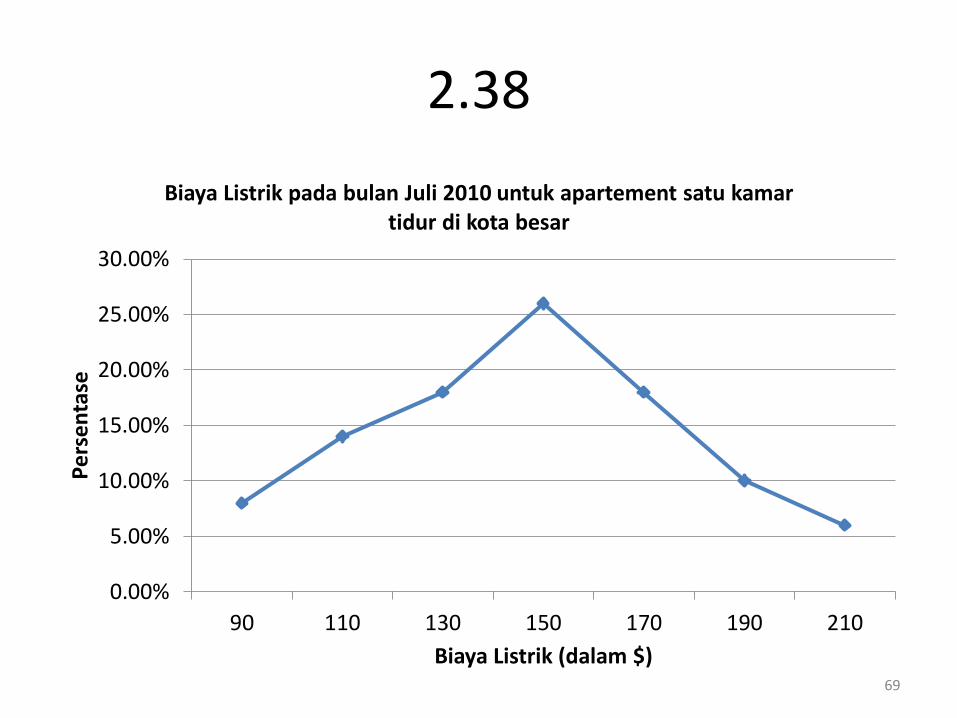
2.38
0.00%
5.00%
10.00%
15.00%
20.00%
25.00%
30.00%
90 110 130 150 170 190 210
Pe
rse
nta
se
Biaya Listrik (dalam $)
Biaya Listrik pada bulan Juli 2010 untuk apartement satu kamar tidur di kota besar
69
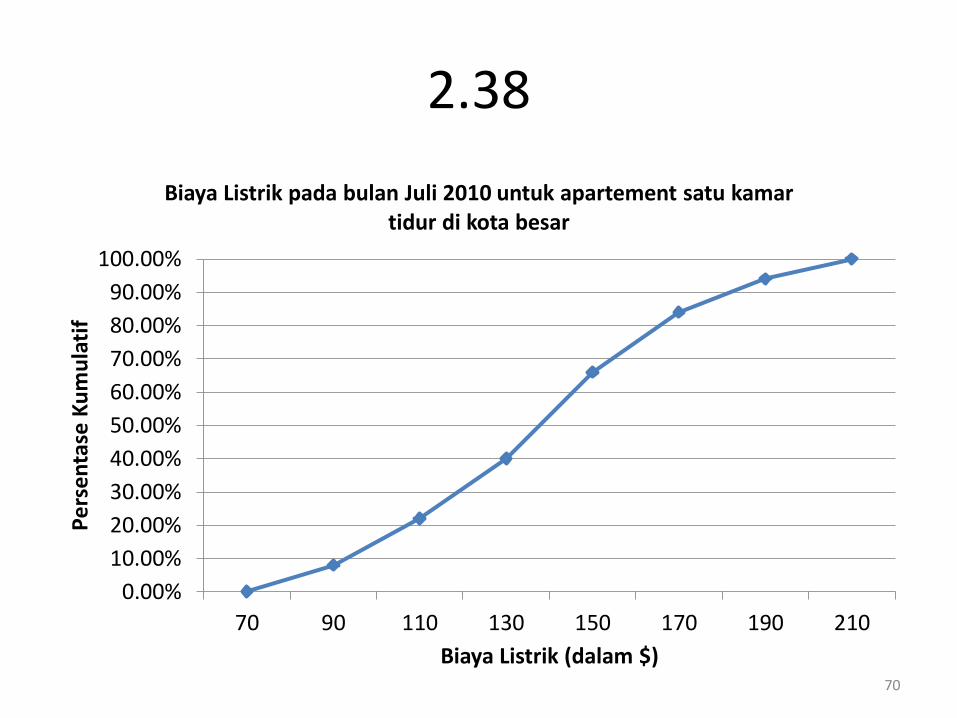
2.38
0.00%
10.00%
20.00%
30.00%
40.00%
50.00%
60.00%
70.00%
80.00%
90.00%
100.00%
70 90 110 130 150 170 190 210
Pe
rse
nta
se K
um
ula
tif
Biaya Listrik (dalam $)
Biaya Listrik pada bulan Juli 2010 untuk apartement satu kamar tidur di kota besar
70

HOMEWORK
71
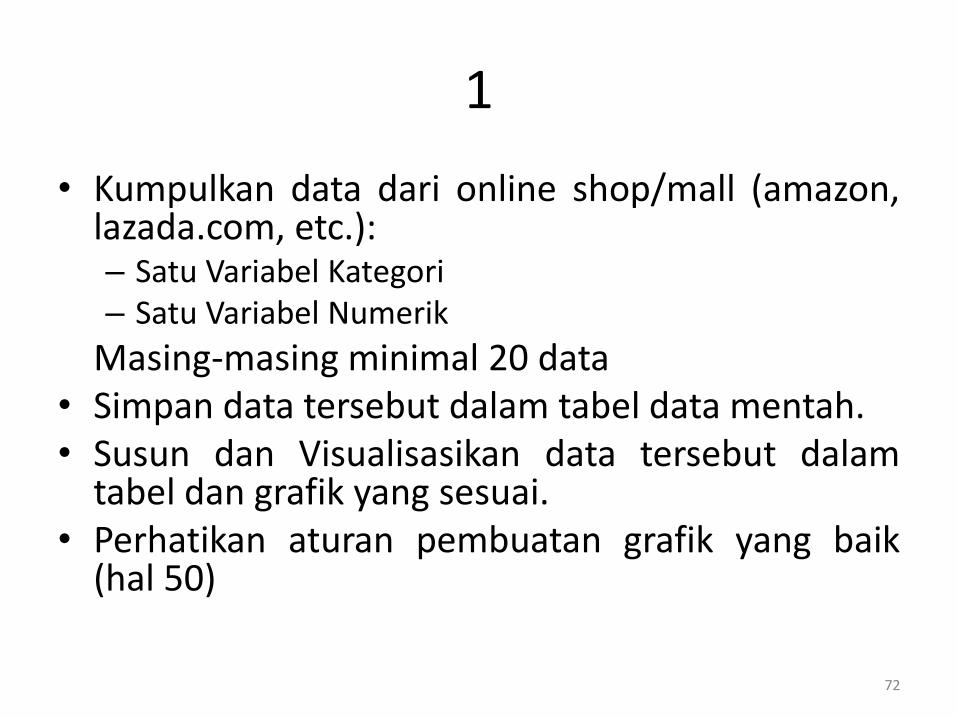
1
• Kumpulkan data dari online shop/mall (amazon, lazada.com, etc.): – Satu Variabel Kategori – Satu Variabel Numerik
Masing-masing minimal 20 data • Simpan data tersebut dalam tabel data mentah. • Susun dan Visualisasikan data tersebut dalam
tabel dan grafik yang sesuai. • Perhatikan aturan pembuatan grafik yang baik
(hal 50)
72

THANK YOU
73