Embed Size (px)
Citation preview
Sanctions and Trade Diversion
Jamal Ibrahim Haidar∗†
Preliminary and incomplete draft: December 4, 2013
Link to the latest version
Abstract
Drawing on a unique customs dataset, this paper uncovers that sanctions triggered Iranian exporters to divert
more than half of their trade to - and create new trade relationships with - other destinations. On the intensive
margin, exporters enhanced their export volumes to other destinations that they were already exporting to when
a certain destination imposed sanctions on them. On the extensive margin, the probability of an exporter to
divert exports to a new destination rised if the exporter was existing in the new market too, suggesting that �xed
costs of exporting matter for trade diversion and creation of new export markets. By exploiting and tracking
the universe of customs daily disaggregated transactions, this paper uncovers how larger and more experienced
exporters were less a�ected by sanctions and more able to divert their exports than smaller and less experienced
peers; exporters diverted �rstly their core and homogeneous products; exporters reduced their product prices as
they diverted trade to new destinations; and the new destinations, which diverting exporters targeted, are more
politically-friendly to Iran.
Key words: sanctions; trade diversion; exporters dynamics; intensive- and extensive- margins; exporter-level
data; economic integration
JEL codes: F10, F13, F14, F15
∗Paris School of Economics, University of Paris 1 Pantheon-Sorbonne ; E-mail: [email protected]†Acknowledgements: To be added.
1
�All in all, economic sanctions are not an e�ective weapon of political warfare.�
(Milton Friedman, Newsweek, 21 January 1980)
�...Those involved in trade and economic activities will �nd other alternatives.�
(Mohammad Nahavandian1, Reuters, 1 January 2012)
1 Introduction
Trade sanctions continue to be a tool used by developed countries to in�uence the behavior of other governments,
and sanctions against Iran are no exception2. Over the last century, di�erent countries imposed 174 international
economic sanctions (Elliott et al., 2007). Despite their importance, we still lack understanding about the impact
of trade sanctions due to an increasingly globalized economy that provides many alternative markets for exporters
from a country under sanctions3. While some studies conclude that sanctions do not always achieve their goal4,
others suggest that sanctions often do succeed5. In this paper, I study empirically whether and how trade sanctions
against Iran caused trade diversion at the exporter-product-destination level.
Following trade sanctions, which mainly increase trade costs to a speci�c location, do exporters divert their
trade to new markets? If yes, how do they do so? By addressing these questions, this paper contributes to the
the burgeoning micro-econometric literature on exporters dynamics and trade costs6. While Prusa (2001) provides
evidence on trade diversion follow US imposition of discriminatory trade policy7, this paper is the �rst to address
and establish empirically whether and how trade diversion happens following the imposition of trade sanctions8.
Iran serves as a suitable country for this study for various reasons. First, I can use the trade sanctions against
Iran in March 2008 as a natural experiment a�ecting trade costs. Second, the trade sanctions that Iranian exporters
faced are unique as they involved many countries. Third, highly disaggregated exporter-level data of Iranian exports
makes Iran an outstanding case for this research.
I begin by presenting a simple theoretical model to illustrate how sanctions can cause trade diversion9. Then,
1Mohammad Nahavandian is the head of Iran's Chamber of Commerce.2Appendix I gives a brief historical outline of the sanctions against Iran, with an emphasis on its trade e�ects, between January 2006
and June 2011.3Doxey (1980), Kaempfer and Lowenberg (1988), Martin (1993), Drezner (1999), Eaton and Engers (1992, 1999), and van Bergeijk
(2009) provide various theoretical frameworks that explain how sanctions work.4See, for example, Levy (1999) and Elliott et al. (2007).5See, for example, Smeets (1990), Elliot and Richardson (1997), Evenett (2002), and Davis and Engerman (2003).6See, for example, Das et al. (2007), Berman et al. (2012), Berthou and Fontagne (2013), Cadot et al. (2013), Ekholm et al. (2012),
Freund and Pierola (2010, 2012), Iacovone and Javorcik (2010), Khandelwal et al. (forthcoming), and Khandelwal and Topalova (2011).Thanks to the recent World Bank Exporters Dynamics Database - Cebeci et al. (2012) - , more studies on exporters dynamics are nowfeasible given data availability.
7A �discriminatory� trade policy is the one in which a country imposes di�erent trade restrictions to imports from di�erent exportingcountries. Examples include trade agreements, sanctions, and antidumping duties. In contrast, a �non-discriminatory� trade policy isone that is applied equally to all importers.
8Dizaji and van Bergeijk (2012) modelled the dynamics of economic sanctions in conjunction with the response of the sanctionstarget, using Iran as a case study. While they looked at the impact of sanctions on Iranian macroeconomic variables, I look at theimpact of sanctions at the most disaggregated micro level, namely on exports at the exporter-product-destination-month level.
9I thank Chad Bown for guiding me to this simple model.
2
relying on a unique dataset covering the universe of Iranian non-oil exporters10 from 2006 to 2011, 3865 exported
products, and more than 1.8 million customs transactions disaggregated at the exporter-product-destination-day
level, I study the responses and behavior of Iranian non-oil exporters in a period of profound disintegration with
the US and EU economies. I present a set of novel stylised facts that I hope will help move forward the theoretical
e�orts to understand the e�ectiveness of trade sanctions and how multi-product heterogenous exporters respond to
sanctions.
This paper adds to the body of knowledge on trade creation, destruction, and diversion. By examining how a
change in trade policy a�ects trade �ows, this empirical analysis �ts broadly into the mirror literature on trade
agreements initiated by Viner (1950). Viner identi�ed that trade agreements have both positive �trade creation�
e�ects due to the enhanced trade between members and negative �trade diversion� e�ects by potentially reducing
trade between members and non-members. In contrast, the analysis in this paper focuses on trade destruction and
trade diversion following sanctions, which push in the opposite directions of trade agreements.
The empirical approach is related to Romalis (2007) which investigates the trade diversion of Canadian and
Mexican exports to the US resulting from CUSFTA and NAFTA. Although it is not the focus of his analysis, Romalis
(2007) documents evidence that is consistent with my results regarding trade diversion. Also, my work builds on
Bown and Crowley (2007) which examines whether a country's imposition of antidumping and safeguard tari�s
causes signi�cant distortions in world trade �ows and distorts a foreign country's exports to third markets. Using
product-level data, Bown and Crowley (2007) showed that US imposition of import restrictions resulted in Japanese
exports surging to non-US countries, suggesting that exporters which su�er discriminatory trade restrictions in a
country strive to �nd alternative markets to sell their products.
The data at the exporter-product-destination-time level allows me to go further beyond Romalis (2007) and
Bown and Crowley (2007) as product-level data limit the ability to study the relationship between trade diversion
and exporters' past export experience across destinations. I explore how trade diversion takes place at the most
disaggregated micro level following the imposition of sanctions by a set of countries on exporters from another
country. It is possible that Iranian exporters which were exporting to more destinations could divert their trade to
alternative destinations. In addition, some Iranian exporters might have diverted their export shipments to some
of their trading partners, which would be hidden when exports are aggregated at product level. In the presence
of destination entry costs, it is di�cult for the exporters to sell their products in alternative markets if they have
not set up ongoing trading relationships in multiple markets. The exporter-level dataset allows disaggregating
exporter-level exports by products and destinations.
10It is worth mentioning four points here. First, sanctions that targeted companies that buy oil from Iran were imposed in late2012, outside the period of this study. Second, unlike non-oil exports, oil exports happen via long-term contracts, making their studyrequire more years following the imposition of sanctions on them. Third, Iranian oil is exported by government (1 exporter) but thereexist 35,953 non-oil exporters who were the ones mainly targeted by the 2008 trade sanctions. Fourth, according to the statisticalmemorandum of the foreign trade regime of Iran, the oil sector account for 80% of exports but capture 0.7% of total employment inIran. Meanwhile, non-oil exports represented 20% of Iranian total exports and the non-oil export sector captured 38% of employmentduring 2006-2011, the period of this study. The remaining employment is mainly in the services sector.
3
Exporter-level data hides a lot of action taking place within �rms and across destinations at the micro level. The
main results are as follows. First, while sanctions reduced Iranian exports of exporters to the US, EU, UK, Canada,
and Australia by a third in response to rising costs of trade due to sanctions imposed by these destinations11,
overall Iranian exports did not decrease. Second, small exporters were more a�ected by sanctions. Third, sanctions
triggered Iranian exporters to destinations imposing sanctions to successfully divert more than half of their trade to -
and create new trade relationships with - destinations not imposing sanctions. Fourth, larger and more experienced
exporters had a higher probability to divert more of their trade than smaller exporters. Fifth, the evidence I present
support the hypothesis that the decision to divert products is not random but that diverting exporters exercise
product selection while diverting trade. Precisely, exporters tended to divert their core-competence products as well
as products that are easier to �nd consumers for � i.e. homogeneous products compared to di�erentiated products.
Sixth, exporters reduce product prices when they divert trade � perhaps due to the fact that they scramble to �nd
buyers upon entry to new market. Finally, there is a trend for exporters to divert trade to destinations that are
�politically-friendly� to Iran. I de�ne politically-friendly countries as ones who have similar positions during votes
on resolutions in the General Assembly of the United Nations12.
This paper is organized into four further sections. The next section presents a simple economic model to
�esh out empirical predictions. Section 3 introduces the unique and disaggregated customs dataset used in this
exporters dynamics study. Section 4 describes the identi�cation strategy and shows the empirical analysis. Section
5 concludes, discusses policy implications, and suggests areas for future research.
2 Basic model
In this section, as Melitz (2003) model does not imply trade diversion, I use a simple version of the theoretical
framework that was proposed by Bown and Crowley (2007) to explain how trade diversion can follow a trade shock.
Assume each export transaction happens by exporter from country of origin e and goes to destination d at time
t. And, assume the world is composed of 3 countries, so e and d ∈ {d1, d2, d3}, where e 6= d. Each country, for
now, has one exporter, which is also indexed e or d and produces a single product, p. So, ped denotes a product
that is exported from e to d. Each country uses same production technology. The marginal cost of production is
increasing, the cost function is c(xe) where c′(xe) > 0 and c′′(xe) > 0 and xe is exporter e's total output. Exporter
e's total output is the sum of its sales in the two foreign markets, xe = Σdped, d ∈ {d1, d2, d3}. Inverse demand in
all countries is given by p(Qe, Ye) where Qe is the total output sold to country i and Ye is national income. Total
output sold in e is the sum of imports from the other two countries, Qe = Σdpde, d ∈ {d1, d2, d3}. The objective of11This result is in line with the empirical predictions in a series of theoretical works (see Ekholm et al. (2012) and Bernard et al.
(2012)), showing that changes in relative trade costs have a signi�cant impact on exports at the exporter-destination level.12 This measurement can also be used to infer �political a�nity� between countries.
4
the exporter in e is to choose a total output level and a level of sales for each market in order to maximize pro�ts,
maxpedπe =∑d
[p (Qd) ped − τedped]− c(xe), (1)
where τed represent a trade cost that increases with d's sanctions on imports from e. The exporter's �rst order
conditions are given by:
∂πe∂ped
= p (Qd) + p′ (Qd) ped − τed − c′(xe) = 0 (2)
Solving the �rst order conditions for each d ∈ {d1, d2, d3} yields exporter e's best responses to the sales decisions
of the other two exporters. A best response function speci�es an amount to sell at each destination, given the sales
at that destination of the exporter's two rivals. Solving the nine best response functions simultaneously yields a
Cournot Nash equilibrium quantities sold by each exporter at each destination.
ped = f (p(Qe, Ye), c(xe), τed) ,∀e, d ∈ {d1, d2, d3} (3)
In the Cournot Nash equilibrium, because the marginal cost of production is increasing, each exporter will
choose to allocate its total output across the three countries so that its pro�t is the same in all three markets.
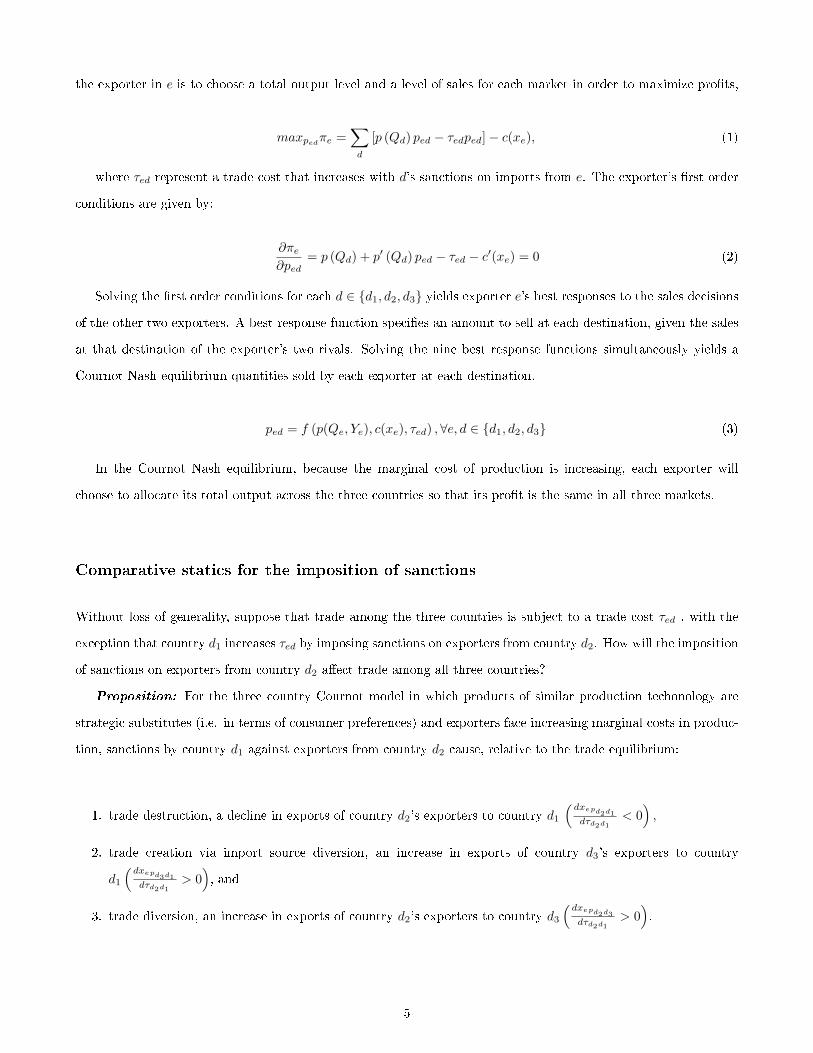
Comparative statics for the imposition of sanctions
Without loss of generality, suppose that trade among the three countries is subject to a trade cost τed , with the
exception that country d1 increases τed by imposing sanctions on exporters from country d2. How will the imposition
of sanctions on exporters from country d2 a�ect trade among all three countries?
Proposition: For the three country Cournot model in which products of similar production techonology are
strategic substitutes (i.e. in terms of consumer preferences) and exporters face increasing marginal costs in produc-
tion, sanctions by country d1 against exporters from country d2 cause, relative to the trade equilibrium:
1. trade destruction, a decline in exports of country d2's exporters to country d1
(dxepd2d1
dτd2d1< 0),
2. trade creation via import source diversion, an increase in exports of country d3's exporters to country
d1
(dxepd3d1
dτd2d1> 0), and
3. trade diversion, an increase in exports of country d2's exporters to country d3
(dxepd2d3
dτd2d1> 0).
5
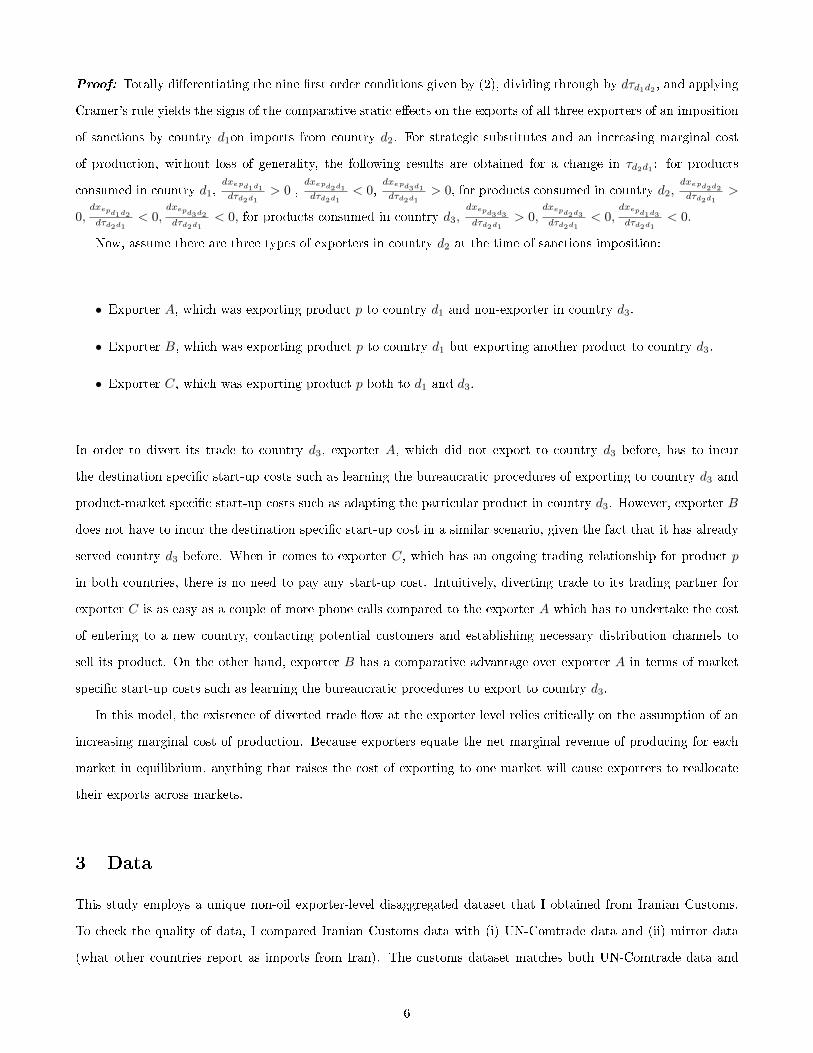
Proof: Totally di�erentiating the nine �rst order conditions given by (2), dividing through by dτd1d2 , and applying
Cramer's rule yields the signs of the comparative static e�ects on the exports of all three exporters of an imposition
of sanctions by country d1on imports from country d2. For strategic substitutes and an increasing marginal cost
of production, without loss of generality, the following results are obtained for a change in τd2d1 : for products
consumed in country d1,dxepd1d1
dτd2d1> 0 ,
dxepd2d1
dτd2d1< 0,
dxepd3d1
dτd2d1> 0, for products consumed in country d2,
dxepd2d2
dτd2d1>
0,dxepd1d2
dτd2d1< 0,
dxepd3d2
dτd2d1< 0, for products consumed in country d3,
dxepd3d3
dτd2d1> 0,
dxepd2d3
dτd2d1< 0,
dxepd1d3
dτd2d1< 0.
Now, assume there are three types of exporters in country d2 at the time of sanctions imposition:
• Exporter A, which was exporting product p to country d1 and non-exporter in country d3.
• Exporter B, which was exporting product p to country d1 but exporting another product to country d3.
• Exporter C, which was exporting product p both to d1 and d3.
In order to divert its trade to country d3, exporter A, which did not export to country d3 before, has to incur
the destination speci�c start-up costs such as learning the bureaucratic procedures of exporting to country d3 and
product-market speci�c start-up costs such as adapting the particular product in country d3. However, exporter B
does not have to incur the destination speci�c start-up cost in a similar scenario, given the fact that it has already
served country d3 before. When it comes to exporter C, which has an ongoing trading relationship for product p
in both countries, there is no need to pay any start-up cost. Intuitively, diverting trade to its trading partner for
exporter C is as easy as a couple of more phone calls compared to the exporter A which has to undertake the cost
of entering to a new country, contacting potential customers and establishing necessary distribution channels to
sell its product. On the other hand, exporter B has a comparative advantage over exporter A in terms of market
speci�c start-up costs such as learning the bureaucratic procedures to export to country d3.
In this model, the existence of diverted trade �ow at the exporter level relies critically on the assumption of an
increasing marginal cost of production. Because exporters equate the net marginal revenue of producing for each
market in equilibrium, anything that raises the cost of exporting to one market will cause exporters to reallocate
their exports across markets.
3 Data
This study employs a unique non-oil exporter-level disaggregated dataset that I obtained from Iranian Customs.
To check the quality of data, I compared Iranian Customs data with (i) UN-Comtrade data and (ii) mirror data
(what other countries report as imports from Iran). The customs dataset matches both UN-Comtrade data and
6
mirror data13. However, compared to UN-Comtrade data, this dataset is unique because it includes all customs
daily records for the period January 2006 to June 2011, allowing monitoring short-term trends and dynamics at
the micro-level � such as entry and exit rates, export volumes and distributions, and prices and growth at the
exporter-product-destination-day level. And, this dataset allows distinguishing between the number of products
that are exported by each exporter to each destination - the extensive margin, and the export value per product per
exporter to each destination - the intensive margin. It is worth noting that the use of exporter level data enables the
construction of export margins with exporter-product-destination dimension, which is not the case with product
level databases (i.e. UN-Comtrade). Within country pairs, I de�ne the extensive margin with an exporter-product
dimension rather than with a simple product dimension, since each exporter is likely to export more than one
product. Each Iranian exporting �rm and export transaction are included in the sample. The periodicity of the
dataset is daily, and it includes the following variables for each export transaction: exporter ID, product ID14,
destination of shipment, value of exports15, and date of transaction. Iranian Customs also ask exporters to report
weight - in addition to value - of each exporter-product-destination shipment.
The sample includes 1,814,146 customs daily transactions. The universe of exporters during this period consisted
of 35,953 exporters, among which not all export every month. Particularly important for this study is the fact that
Iranian Customs collects data at the exporter-product-destination level. Information on 3,865 unique products is
included in the dataset. The HS-6 digit level product classi�cation illustrates the narrowness of product de�nitions
and the richness of micro-level information available in the dataset16. I aggregate daily customs data into exporter-
product-destination-month observations17.
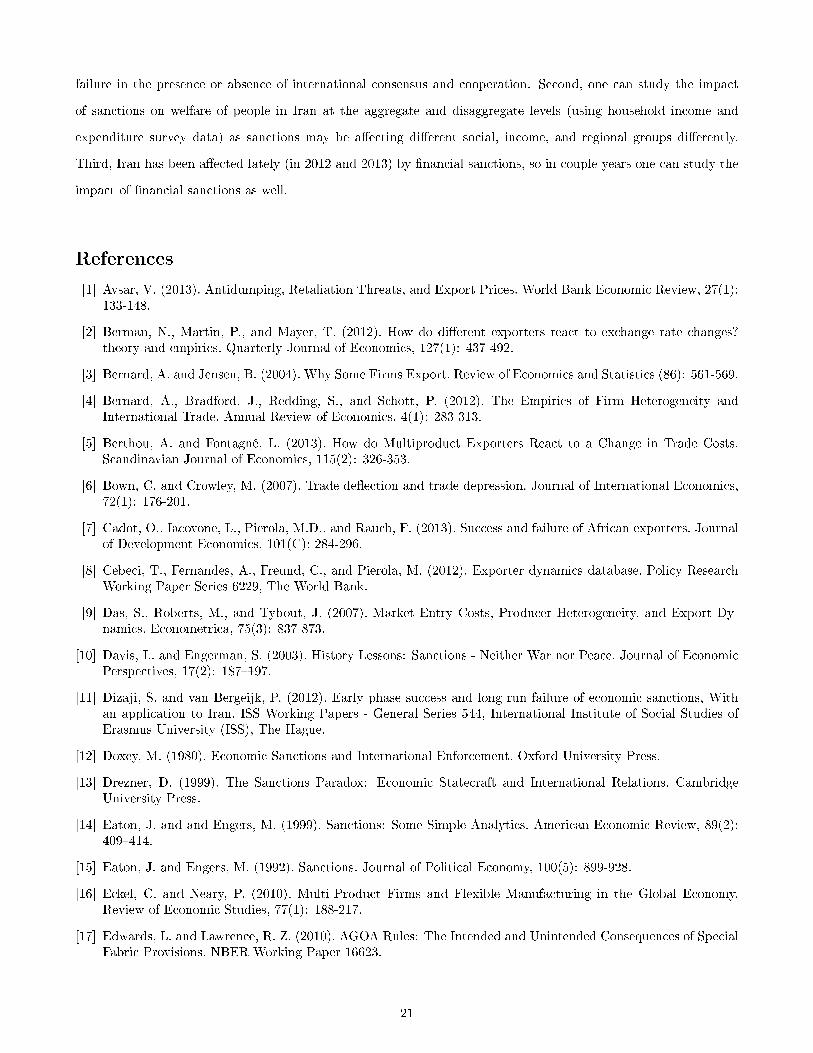
For each quarter, Table 1 reports the number of exporters as well as the average export value per exporter, the
average number of products per exporter18, and the average number of destinations per exporter. For the 9 quarters
before sanctions and 13 quarters after sanctions, the dataset provides exhaustive information on the universe of
Iranian non-oil exporters. The average number of exporters per quarter decreased by 22.6% from 7,359 before
sanctions (2006-Q1 to 2008-Q1) to 6,001 after sanctions (2008-Q2 to 2011-Q2). While the number of exporters
during the period under analysis declined, quarterly average export value per exporter increased from USD 0.48
to 0.93 millions and the quarterly average number of products per exporter increased from 4.08 to 4.26 during the
same period, suggesting that smaller exporters exited.
Table 2 reports the number of exporters and number of products to destinations imposing sanctions and to
13The data quality check shows that Customs reported aggregate exports represent 98.5% of UN-Comtrade data and overlap withmirror data at the destination level.
14Products are disaggregated at the HS-6 digit level.15I de�ated export values to their January 2006 equivalents using the monthly US consumer price index (from Global Financial Data).16A portion of transactions in the dataset includes HS-8 digit level product classi�cation but the majority of transactions uses HS-6
digit level product classi�cation. To ensure consistency in the analysis, I aggregate and use the data at the HS-6 digit level productclassi�cation. For each relevant table and graph in the empirical section, I repeat the analysis using data available at the HS-8 digitlevel product classi�cation, and the results hold. To save space, throughout this paper, I show the results at the HS-6 digit level productclassi�cation.
17To save presentation space, I present the descriptive statistics below at the exporter-product-destination-quarter level.18The top Iranian exported products include prepared food, vinegar, tobacco, chemical products, aluminium, carpets, cement, fertil-
izers, glass, nuts, silk, zink, copper, and �bers.
7
destinations not imposing sanctions. While the number of exporters to destinations imposing sanctions dropped
by 30.65%, during the post-sanctions period, it increased by 12.73% in the destinations not imposing sanctions. A
similar trend exists for exported products. While the number of products to destinations imposing sanctions dropped
by 11.58%, during the post-sanctions period, it increased by 5.04% in the destinations not imposing sanctions19.
While the dataset is extensive enough to study the impact of sanctions against Iran on exporters dynamics and
trade diversion, I should mention two caveats related to it. First the observations in the dataset are likely to be
subject to left and right censoring. In the case of left censoring, I cannot determine whether an exporter with a
positive trade value in January 2006 (in 2006-Q1) started exporting in 2006 or before (i.e. if it is a new exporter
or not). Thus, for accuracy purposes, I only consider exporters that started exporting strictly after 2006-Q1 when
I estimate the e�ect of sanctions on entry rates. Similarly, for right censored observations, I cannot determine
whether exporters reporting a positive trade in June 2011 (in 2011-Q2) exited the next quarter or not. So, I only
consider the exits that took place before 2011-Q2 when I estimate the e�ect of sanctions on exit rates.
A second caveat concerns the period covered by the study. I observe three years after the imposition of sanc-
tions, and thus the empirical exercise considers only the short-term exporters adjustments following the sanctions.
Moreover, this period coincides with the global economic crisis that broke in 2008-Q3, which may have ampli�ed
the e�ects of the sanctions on Iranian exports. I handle this caveat in the below empirical analysis section.
4 Empirical analysis
The empirical analysis proceeds in �ve steps. First, I ask whether sanctions had a negative impact on Iranian
exports at the micro levels and check whether smaller and larger exporters were a�ected di�erently. Second, I
examine whether sanctions caused Iranian exporters to divert their trade into new destinations, and I investigate
the extent of trade diversion at the exporter-level. Third, I learn about the characteristics of destinations that
diverting exporters diverted to. Fourth, I study how the diverting exporters are di�erent from the non-diverting
exporters. Fifth, I analyze the type of products that diverting exporters diverted, and I determine whether exporters
had to reduce their product prices, while looking for new customers, upon diversion to new destinations.
4.1 What is the impact of sanctions on Iranian exports?
To test the model prediction on trade destruction, this subsection identi�es the impact of sanctions on Iranian
non-oil exports at the exporter-destination level. In the following subsections, I explore further dynamic e�ects
19Before sanctions, prepared food, tobacco, and chemical products such as fertilizers accounted for more than half of Iranian non-oilexports to destinations imposing sanctions. Meanwhile, Iran's non-oil exports to destinations not imposing sanctions were relativelymore diversi�ed. For instance, metals, carpets, and textiles accounted for a third of total exports. And, glass, stones, and foodstu�accounted for a quarter of Iranian non-oil exports before sanctions. Plastics and rubbers is another key component of exports todestinations not imposing sanctions.
8
about how exporters behaved following sanctions and whether heterogeneity exists in the adjustment dynamics
across di�erent exporters, products, and destinations.
I treat the imposition of sanctions by 30 countries in 2008 as an increase in trade costs, as discussed in section
2 above. The choice to use sanctions in 2008 as a natural experiment is motivated by this being the largest shock
for Iranian exporters, covered by available exporter-level trade data for Iran. The imposition of trade sanctions in
2008 increased trade costs for Iranian exporters to various - US, UK, EU, Canadian, and Australian - destinations
but not to other destinations20. This feature led possibly to either exit from certain destinations, to entry to new
destinations, or to both, due to the simultaneous hurdle to survive in treated destinations. Using the sanctions
experiment allows identifying a clear point in time when trade costs increased.
I apply a di�erence-in-di�erence approach to compare the evolution of exports to two di�erent types of desti-
nation groups. The �rst group is composed of 30 treated destinations that imposed sanctions in March 2008 on
Iranian exporters. The control group is composed of all other destinations that did not impose sanctions on Iranian
exporters. The below graphs show that the treated and controlled groups had similar trends before sanctions but
di�erent trends following sanctions. Below, I also compare the average growth rates of di�erent measures of �rm
export performance for the treated and control groups, before and after the imposition of sanctions.
I estimate the e�ect of sanctions on exports at the exporter-destination level, using a within �xed-e�ect estimator
for positive trade �ows only, as follows:
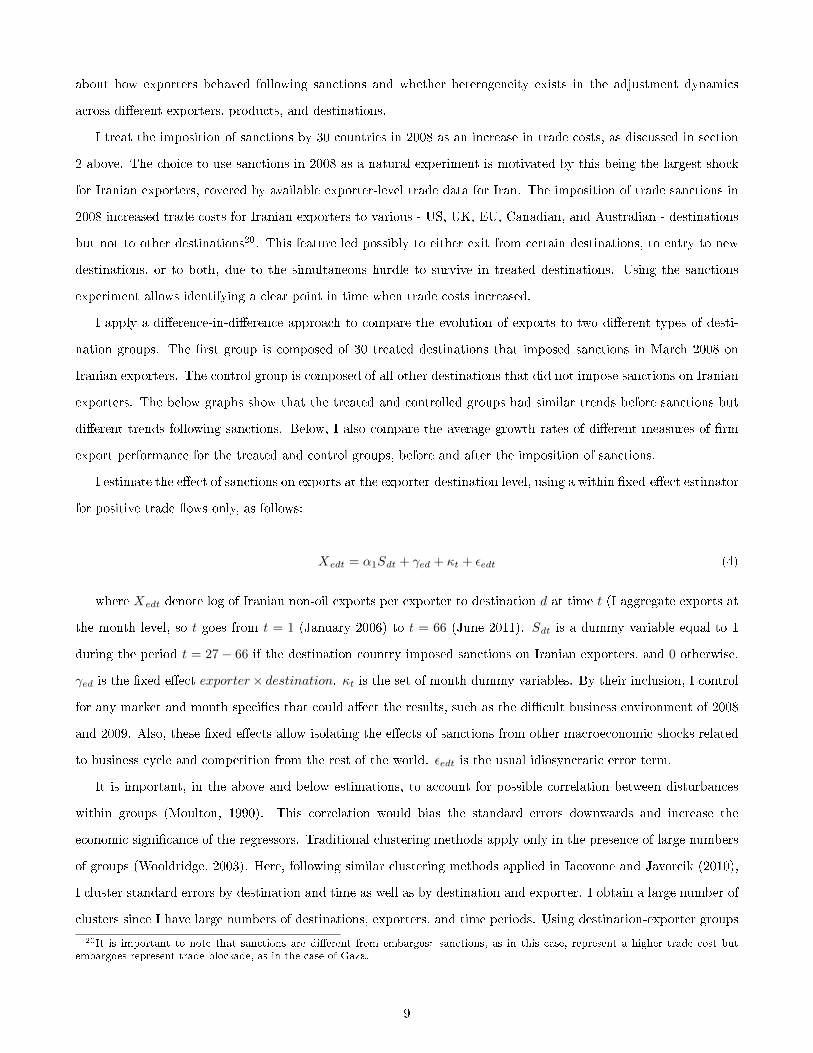
Xedt = α1Sdt + γed + κt + εedt (4)
where Xedt denote log of Iranian non-oil exports per exporter to destination d at time t (I aggregate exports at
the month level, so t goes from t = 1 (January 2006) to t = 66 (June 2011). Sdt is a dummy variable equal to 1
during the period t = 27 − 66 if the destination country imposed sanctions on Iranian exporters, and 0 otherwise.
γed is the �xed e�ect exporter× destination. κt is the set of month dummy variables. By their inclusion, I control
for any market and month speci�cs that could a�ect the results, such as the di�cult business environment of 2008
and 2009. Also, these �xed e�ects allow isolating the e�ects of sanctions from other macroeconomic shocks related
to business cycle and competition from the rest of the world. εedt is the usual idiosyncratic error term.
It is important, in the above and below estimations, to account for possible correlation between disturbances
within groups (Moulton, 1990). This correlation would bias the standard errors downwards and increase the
economic signi�cance of the regressors. Traditional clustering methods apply only in the presence of large numbers
of groups (Wooldridge, 2003). Here, following similar clustering methods applied in Iacovone and Javorcik (2010),
I cluster standard errors by destination and time as well as by destination and exporter. I obtain a large number of
clusters since I have large numbers of destinations, exporters, and time periods. Using destination-exporter groups
20It is important to note that sanctions are di�erent from embargos: sanctions, as in this case, represent a higher trade cost butembargoes represent trade blockade, as in the case of Gaza.
9

allows me to account for the fact that the size of groups changes monthly based on entries and exits of exporters in
each market.
The results are reported in Table 3 and show that the imposition of sanctions had statistically signi�cant negative
e�ect on exports at the exporter-destination level. The exporter-level exports, following sanctions, to destinations
that imposed sanctions on Iranian exporters were lower by 34% compared to exporter-level exports to destinations
that did not impose sanctions on Iranian exporters (column 3, Table 3). All coe�cients in Table 3 are statistically
signi�cant at the 1% level.
Which exporters were a�ected most?
While these results show that the imposition of sanctions had a signi�cant negative impact on the average Iranian
exporter to destinations imposing sanctions, they possibly hide some heterogeneity among exporters. One can
expect larger and more experienced exporters to be a�ected di�erently as they are typically more productive and
can a�ord a higher trade cost. On this basis, I introduce interaction variables between the Sdt variable and the
�ve dummy variables that identify exporters by groups according to their size before March 2008. The Size quintile
dummies are �xed over time and rank exporters from the smallest size group (SizeQ1) to the highest size group
(SizeQ5) . The estimation results are presented in Table 4. Columns (1), (2), and (3) report the estimation results
corresponding to the decomposition of exporter-level exports, showing that the imposition of sanctions a�ected most
severely the small exporters. Exporters in the highest quintile were least a�ected in terms of decrease in exports
to destinations imposing sanctions compared to destinations not imposing sanctions. The bulk of the decline in
the exporter-level exports to destinations imposing sanctions is due more to the decline of the exporters' average
exports per product than to the reduction of number of products.
4.2 Did trade diversion happen?
This subsection tests the model prediction on trade diversion. Figure 1-a shows the evolution of Iranian non-oil
monthly exports. The unexpected increasing trend following sanctions triggers the question about whether Iranian
non-oil exporters diverted their trade following sanctions and if sanctions actually caused trade diversion. I proceed
in three steps. First, I show graphically trade diversion trends at the exporter and product levels. Second, I
test empirically the impact of sanctions on trade diversion. Third, I sketch the extent of trade diversion at the
exporter-level.
Figures 1-b and 1-c show total Iranian monthly exports of selected products between January 2006 and June
2011 to two groups of destinations. They present exports to destinations imposing sanctions and to destinations
not imposing sanctions. They provide examples of how non-oil Iranian monthly exports to destinations imposing
sanctions decreased sharply following sanctions while non-oil Iranian monthly exports to destinations not imposing
10
sanctions increased signi�cantly during the same period21. Figures 2-a and 2-b show non-oil exports from Iran to
selected destinations imposing sanctions as well as to selected destinations not imposing sanctions.
I observe the same trends when I look at the micro-level. Figure 3-a shows total non-oil Iranian monthly export
values per exporter and number of products per exporter between January 2006 and June 2011 to the same two
groups of destinations as above. Following sanctions, the number of exported products per exporter decreased to
destinations imposing sanctions but increased to destinations not imposing sanctions. However, export values per
exporter increased to both groups of destinations. This observation is consistent with the data presented in Table
1, suggesting that smaller exporters exited destinations imposing sanctions. I test this hypothesis later in this
subsection.
Figures 3-b and 3-c look at the entry and exit rates22 of Iranian exporters and exported products to destinations
imposing sanctions and destinations not imposing sanctions. The entry and exit rates of Iranian exporters and
products followed the same trends. While entry rates of exporters and products decreased in destinations imposing
sanctions, they increased in destinations not imposing sanctions. Meanwhile, while exit rates of exporters and
products increased in destinations imposing sanctions, they decreased in destinations not imposing sanctions. I test
below whether the same exporters who exited destinations imposing sanctions have actually entered destinations
not imposing sanctions. And, I also test the dynamics of adding and dropping products at the exporter-destination
level.
As mentioned in section 3, sanctions came along just few months before the global economic crisis that broke
during the fall of 2008. The crisis may have obscured the e�ects of sanctions on Iranian trade diversion given the
countries that imposed sanctions were actually hit more by the crisis than other countries. Given traded goods
sectors are procyclical, one explanation is that Iranian trade with destinations that imposed sanctions fell due to
the recession in those economies. Another explanation is that increasing trade frictions at the international borders,
broadly de�ned, might be the culprit. In other words, if trade reduction and diversion were caused by the recession
and not due to sanctions, then I should expect a similar pattern of imports of destinations imposing sanctions from
Iran and other countries. However, it is not the case. Figure 4 shows the growth rates of US and China's imports
from Iran, total imports, and economic growth. Clearly, the crisis a�ected Iranian exports to both US and China23.
However, following the crisis, I observe that Iranian exports to China rose again, unlike in the case of US although
its imports from other countries rose again, suggesting that the bulk of the decline in Iranian bilateral trade with
speci�c destinations is attributable to the imposition of sanctions.
To capture whether sanctions actually caused trade diversion, I estimate the following speci�cation:
21I present results for selected products in these two �gures for space purposes. Results for other non-oil products are available aswell to show similar trends
22Entry here refers to the �rst time the export or product enters a given destination. Exit refers to the last time the exporter orproduct is seen at destination, so there should be no confusion with exporters and products that exit and then enter.
23I show graphs only for US and China but I observe that similar trends hold for other countries.
11
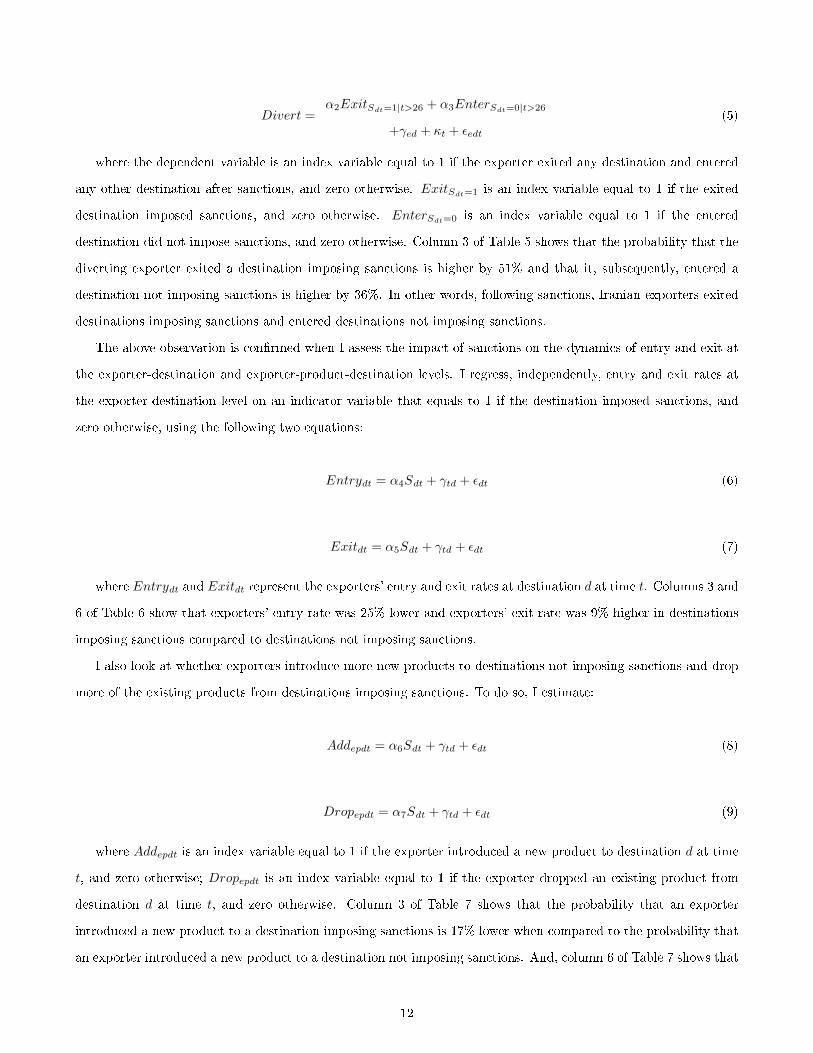
Divert =α2ExitSdt=1|t>26 + α3EnterSdt=0|t>26
+γed + κt + εedt
(5)
where the dependent variable is an index variable equal to 1 if the exporter exited any destination and entered
any other destination after sanctions, and zero otherwise. ExitSdt=1 is an index variable equal to 1 if the exited
destination imposed sanctions, and zero otherwise. EnterSdt=0 is an index variable equal to 1 if the entered
destination did not impose sanctions, and zero otherwise. Column 3 of Table 5 shows that the probability that the
diverting exporter exited a destination imposing sanctions is higher by 51% and that it, subsequently, entered a
destination not imposing sanctions is higher by 36%. In other words, following sanctions, Iranian exporters exited
destinations imposing sanctions and entered destinations not imposing sanctions.
The above observation is con�rmed when I assess the impact of sanctions on the dynamics of entry and exit at
the exporter-destination and exporter-product-destination levels. I regress, independently, entry and exit rates at
the exporter-destination level on an indicator variable that equals to 1 if the destination imposed sanctions, and
zero otherwise, using the following two equations:
Entrydt = α4Sdt + γtd + εdt (6)
Exitdt = α5Sdt + γtd + εdt (7)
where Entrydt and Exitdt represent the exporters' entry and exit rates at destination d at time t. Columns 3 and
6 of Table 6 show that exporters' entry rate was 25% lower and exporters' exit rate was 9% higher in destinations
imposing sanctions compared to destinations not imposing sanctions.
I also look at whether exporters introduce more new products to destinations not imposing sanctions and drop
more of the existing products from destinations imposing sanctions. To do so, I estimate:
Addepdt = α6Sdt + γtd + εdt (8)
Dropepdt = α7Sdt + γtd + εdt (9)
where Addepdt is an index variable equal to 1 if the exporter introduced a new product to destination d at time
t, and zero otherwise; Dropepdt is an index variable equal to 1 if the exporter dropped an existing product from
destination d at time t, and zero otherwise. Column 3 of Table 7 shows that the probability that an exporter
introduced a new product to a destination imposing sanctions is 17% lower when compared to the probability that
an exporter introduced a new product to a destination not imposing sanctions. And, column 6 of Table 7 shows that
12
the probability that an exporter dropped an existing product from a destination imposing sanctions is 27% higher
when compared to the probability that an exporter dropped an existing product from a destination not imposing
sanctions.
I extend the analysis to sketch the extent to which exporters were able to achieve trade diversion. Figure 5 shows
how much of trade volumes diverting exporters were actually able to divert. I divide the exporters into two groups:
small exporters whose monthly export value was below the export value per average exporter and large exporters
whose monthly export value was above the export value per average exporter in the destination imposing sanctions
that they diverted from. Large diverting exporters achieved higher level of trade diversion, on average, than small
diverting exporters. While large exporters diverted on average 75% of their exports, small exporters diverted on
average 40% of their exports from destinations imposing sanctions to destinations not imposing sanctions.
On a related front, Table 8 presents descriptive statistics about the potential Iranian trade transshipment that
happened through United Arab Emirates (UAE) following sanctions. Mainly, the absence of rules of origin, which
are usually imposed along with sanctions to avoid trade transshipment, created a �loophole� that may have helped
Iranian exporters to transship their products through UAE24 to destinations imposing sanctions. First, I look at
the percentage change in exports of exporters that exited or reduced their exports to the US, UK, Canadian, and
French destinations, following sanctions, between the pre- and post- sanctions periods. Second, I track the exports
of the same exporters, at the product-level, to United Arab Emirates (UAE) following their exit from or reduction
of exports to the 4 mentioned destinations. Third, I get an aggregate measure of product-level re-exports from UAE
to the 4 mentioned destinations. While I conduct the �rst two steps using Iranian Customs data as the interest is
primarily in the exporter-level trade transshipment, I used UN-Comtrade data for the third step as, unfortunately,
I do not have access to UAE customs importer-exporter level data25. The results in Table 8 allow observing a trend
of trade transshipment, at the product-level, of Iranian exporters through UAE ports.
4.3 Which destinations did diverting exporters divert to?
Upon trade diversion, exporters do not target destinations randomly. To know which destinations diverting exporters
targeted, I estimate the following equation:
Ndt = α8Zdt + γtd + εdt (10)
where the dependent variable is the log of total number of exporters that exited a treated destination and
entered a new controlled destination following sanctions. And, Zdt is a control variable capturing economic size,
24One can also think about other countries that Iranian exporters may have depended on for the same purpose. I use the case ofUAE and selected destinations imposing sanctions solely for illustrative purposes.
25On a related note, Edwards and Lawrence (2010) and Frazer and Biesebroeck (2010) showed theoretically and empirically how USquotas on Chinese exports served as an implicit subsidy for African apparel exporters led Chinese exporters to transship their trade,following the imposition of US quotas on them, to US through African countries who actually bene�ted from the �African Growth andOpportunity Act�.
13
distance, price competitivenesss, ease of imports, foreign direct investment net in�ows, tari� rate, imports growth,
and the correlation of positions during votes on resolutions in the General Assembly of the United Nations of the
new controlled destination that diverting exporters diverted to. I use the voting similarity index of Strezhnev and
Voeten (2013) dataset on the correlation between positions of countries during UN votes. I control for UN vote
correlation because it is a good measure of ideological, cultural, and historical a�nity between countries that may
a�ect both the probability of sanctions and bilateral trade. The coe�cients in Table 9 show that larger and closer
markets; markets with higher import, income, and FDI growth rates; as well as destinations that have fewer import
restrictions and lower tari� rates, and are �politically-friendly� with Iran (in terms of voting similarities at UN)
attracted more of the diverting exporters. All results are statistically signi�cant at conventional levels. These
results are independent of consumer price index at destination. As expected, the in�ation variable has a positive
coe�cient: an increase in prices at destination creates more demand for imported products. Moreover, time �xed
e�ects control for real exchange rate �uctuations in the Iranian currency vis-a-vis currencies of all destinations.
4.4 How are diverting exporters di�erent from non-diverting exporters?
Exporters are not equal in their ability to divert trade from one destination to another. When trying to understand
the dynamics of trade diversion, one of the �rst questions to ask is whether all or which exporters diverted trade
from destinations imposing sanctions to destinations not imposing sanctions. The size and experience of exporters
are expected to a�ect their ability, willingness, and decision to divert trade from one destination to another. To
test whether this prediction is true, I proceed in two steps.
Do diverting exporters di�er from non-diverting exporters?
I estimate the following equation:
Divertedt = α9Xedt + α10Experienceedt + γed + κt + εedt (11)
where Divertedt is an indicator variable equal to one if an exporter exited a destination imposing sanctions and
entered a destination not imposing sanctions following the imposition of sanctions, and zero otherwise. Xedt and
Experienceedt represent the size and experience of the exporter in the destination imposing sanctions. I measure
the size and experience of the exporter at destination by, respectively, the log of value of its exports and log of
number of months of its export experience in that destination since entry.
Table 10 shows that a 1% increase in the size or age of exporter in a destination imposing sanctions is associated
with, respectively, a 19% and 11% increase in the probability that this exporter actually diverted trade following
sanctions to a destination not imposing sanctions (column 3, Table 10). In other words, small exporters tend
not to divert to new destinations following sanctions as they have lower ability to cover the cost of entering a
14

new market. In all speci�cations, I �nd that larger exporters are more likely to divert to new export markets
following sanctions. As a robustness check (not reported to save space), I also test a linear probability model with
exporter-destinations �xed e�ects and con�rm that smaller exporters are more likely to stop exporting and to exit
export market. These observations are consistent with the assumption of exporter heterogeneity, which suggests
that exporters have speci�c productivities and thus can act in the export market in di�erent ways.
Does past export status matter?
As discussed in the basic model in Section 2, exporter's entry to a new destination requires �xed start-up costs related
to establishing networks, acquiring information about the o�cial procedures, and adapting products (Bernard and
Jensen (2004)). Thus, the current-period export supply depends on past exporting status as exporters continue
exporting without burdening the start-up costs if they already exported to a particular destination before. So, I
estimate the following equation:
lnXepdt = α11Sdt + α12lnXepd,t−1 + α13lnXet + +εepdt (12)
Fixed e�ects (FE) estimator is one way of estimating equation (12) because it eliminates time invariant error
component. However, the greatest econometric concern in FE estimation of equation (12) is that it results in biased
and inconsistent estimates associated with the serial correlation of lnXepd,t−1 with FE transformed residuals. In
order to remedy this autocorrelation, I �rst di�erence equation (12) and estimate it using the two stage least
squares/instrumental variables (IV) approach in which I instrument for using the multiple lags of the levels of this
variable26.
It should be emphasized that there are also two potential problems with the IV estimator used in estimating
equation (12); bias due to the measurement error and bias associated with the use of a weak instrument. If there is
measurement error in (lnXepdt), then the measurement error in the variable, (lnXepd,t−1), will be correlated with
the measurement error in the instrument, (lnXepd,t−2). Therefore, I employ an alternative instrument, (lnXepd,t−3)
in consideration that its measurement error is not correlated with the measurement error in (lnXepd,t−1)27.
In addition, I control for exporter size given, as discussed in Bernard and Jensen (2004), it may control for
several factors; larger �rms have lower average and marginal costs which improve exporting activity and also size
is a proxy for past success by de�nition. The growth in exports can also partially be explained by macroeconomic
factors in the destination market. For instance, trade openness, GDP growth and exchange rate appreciation in a
potential export market can work as an import demand shifter which would help exporters divert their shipments
to that destination. In this regard, I use country-year dummies to control for macroeconomic aggregates.
26Note that direct estimation of the �rst di�erence of equation (12) by OLS also provides biased estimates because lagged di�erenceof exports is correlated with the error term.
27I estimate the �rst-stage model using my instrument to test the quality of the instrument. I �nd that my instruments are strongand conclude that IV approach is appropriate for the above estimation.
15
The �rst column in Table 11 documents the estimates for equation (12). The Sdt variable has the expected sign
and is statistically signi�cant. To examine if past export relationships of the exporters to the destinations imposing
sanctions provide a di�erent outcome in terms of trade diversion, I estimate the following equations:
lnXepdt = α14Sdt + α15lnXepd,t−1 + α16ExporterC + α17Sdt ∗ ExporterC + α18lnXet + εepdt (13)
P (EXP )epdt =α19Sdt + α20lnXepd,t−1 + α21ExporterA+ α22ExporterB
α23Sdt ∗ ExporterA+ α24Sdt ∗ ExporterB + α25lnXet + εepdt
(14)
where ExporterC is a dummy and unity if the exporter in the unit observation was exporting a product to
destination d1 and destination d3before the imposition of sanctions. Equation (14) models the probability of
exporting in an export market when sanctions are imposed in a di�erent market (extensive margin). (EXP )epdt
is a binary variable that equals 1 if the exporter exports product p to destination d in time t and zero otherwise.
ExporterA takes on a value of 1 if the exporter was non-exporter to destination d1 and ExporterB is equal to
1 if the exporter did not export product p but exported another product to destination d1 before the imposition
of sanctions. One concern in equation (14) is the in�uence of unobserved heterogeneity given the existence of
potential permanent �rm characteristics, product attributes, or managerial skills which can a�ect the decision to
start exporting a particular product as a result of imposition of sanctions. Given these variations are not observed in
the dataset, the estimation can overestimate the e�ect of the sanctions interactions. There are di�erent alternatives
to estimate the binary choice model of starting to export a product with unobserved elements including maximum
likelihood techniques such as probit or conditional logit, or linear probability model with random or �xed e�ects.
For the reason that unobserved heterogeneity is correlated with exporter speci�c controls, random e�ect estimation
is not appropriate for our speci�cation. As a result, to model the unobserved heterogeneity as �xed, I chose to work
with linear probability model28.
In addition, it is highly likely that unobserved characteristics in my model are serially correlated with (lnXepd,t−1)
. Therefore, I follow a methodology similar to my earlier estimation to correct for autocorrelation and instrument
for (lnXepd,t−1) using its second lag. Given the potential correlation of FE transformed residuals with the lagged
export value, I estimate the model using IV �rst di�erences in order to avoid the problem of inconsistent estimates
found in the �xed e�ects model.
Column 2 of Table 11 shows the results of equation (13). The e�ect of sanctions remains statistically signi�cant
when it is interacted with the past exporting status (ExporterC). This result suggests that exporters begin to
increase their export values to alternative destinations that they were already exporting the same product when
they face sanctions in a particular export destination (intensive margin). Following Kennedy (1981), I convert the
coe�cient of the dummy variable to its true marginal e�ect to better quantify the magnitude of trade diversion.
28see Avsar (2013) for similar framework
16
So, in terms of the economic interpretation, imposition of trade sanctions results in a 25% increase in the Iranian
exporters' exports to alternative destinations where the exporters previously exported the same product.
Column 3 of Table 11 documents the results for the extensive margin estimation. Similarly, the past exporting
statuses of exporters are interacted with the sanctions variable. The interaction of sanctions variable has a higher
statistical and economic signi�cance for ExporterB than ExporterA. This result suggests that imposition of
sanctions in a particular destination increases the exporters' probability of exporting their product in a di�erent
destination if the �rm already served the destination before. And, it shows that such probability also increases - but
at a lower rate - to the export destinations that �rms did not export before. In terms of the magnitude of the e�ect,
imposition of sanctions in a particular destination increases the probability of exporting in a di�erent destination
by 20 for the destinations that the exporter exported another product before and by only 9% for the destinations
that the exporter exported another product before. Thus, on the extensive margin front, I conclude that, given
the lower statistical and economic signi�cance levels of the coe�cient of ExporterA interaction demonstrate that
market speci�c start-up costs of exporting plays a crucial role in determining the potential export market to divert
trade for the exporters that face sanctions in a particular destination.
4.5 Which products did diverting exporters divert, and at what price?
In this subsection, I look at the characteristics of products that diverting exporters diverted from destinations
imposing sanctions to destinations not imposing sanctions. It is well known that products of a given exporter have
di�erent export volumes in a given destination. And, by no means di�erent products have similar exporting trends
and characteristics. For example, while some products are homogeneous, other products are heterogeneous29. The
heterogeneity of exporters along the dimensions of both characteristics and quality of their products a�ect the
di�erentiation level of products. Precisely, I examine whether exporters tend to divert (i) more of their �core
competence� products30 and (ii) their homogeneous products more than their di�erentiated products.
When modelling trade diversion at the exporter-product level, I �rst check whether there is heterogeneity among
diverted products within the same exporter. One can model heterogeneous diverting exporters producing multiple
products as being equally good in diverting each of their products. Or one can assume that exporters have product-
speci�c competencies and divert some products more e�ciently than others � or that some products are easier to
redirect than others.
The literature emphasizing heterogeneity at the product level predicts that �core products� are the most respon-
sive to new export environments (Eckel and Neary, 2010). This prediction is con�rmed in the dataset. I calculated
the rank of export products (in terms of their export value) within each �rm in each period t at each destination im-
29While homogeneous products (i.e. copper) are traded on organized exchanges, heterogeneous products (i.e. carpets) are not. I willdescribe in more detail below how I split the products in the dataset into two groups: homogeneous and heterogeneous.
30Following Eckel and Neary (2010), I de�ne �core competence� products at the exporter-destination level as the most successfulproducts, products of highest sales volume.
17
posing sanctions before the exporter exited that destination. Then, I calculated the rank of export products within
each �rm at each destination not imposing sanctions after the exporter diverted and entered this new destination.
The statistically signi�cant correlation between the two ranks is 0.32 for diverting exporters (column 3, Table 12).
The results demonstrate that this positive correlation holds if I regress the average rank of the exported product
in treated destination before trade diversion on the average importance (i.e. rank) of the same product that the
exporter diverted and introduced to destination not imposing sanctions following sanctions. These observations
suggest that Iranian exporters, who succeeded to divert their trade following sanctions tend to divert more of their
�core-competence� products.
I also examine whether homogeneous products are more likely to be diverted � by diverting exporters following
sanctions � from destinations imposing sanctions to destinations not imposing sanctions. For this reason, following
Rauch (1999), I split all exported products in the dataset into two groups: homogeneous products, those traded on
organized exchanges, and heterogeneous products, those not traded on organized exchanges31. The conventional
wisdom is that there is a cost to setting up �markets� (organized exchanges) that is independent of the volume of
transactions, and that this non-convexity will not allow a market to open if the expected volume of transactions at
the price expected to prevail in equilibrium is too small.
For the purpose of empirical work, following Rauch (1999) product classi�cation scheme, I consider the existence
of a reference price distinguishes homogeneous from di�erentiated products. Homogeneous commodities can be
further divided into those whose reference prices are quoted on organized exchanges and those whose reference
prices are quoted only in trade publications. It is easier for exporters to divert their homogeneous products as the
cost of searching for consumers for these products is lower given these products are typically standard in terms of
content and quality (i.e. copper) compared to other products (i.e. carpets). Thus, trade diversion is expected to
apply most strongly to homogeneous products and most weakly to products not traded on organized exchanges,
and higher export costs should act as the greatest barrier to trade for di�erentiated products.
I examine these hypotheses using this estimation:
Divertept =α26Xpre−diversion + α27Xsharepre−diversion
+α28Diff + γed + κt + εedt
(15)
where Divertept is a dummy variable equal to one if the exporter dropped a given product from a destination
imposing sanctions and introduced it in a destination not imposing sanctions at a given time, and zero otherwise.
Xpre−diversion is the log of export value of the product at the exporter-destination level before trade diversion
from a given destination; Xshare represent the weight of the product in the portfolio of the exporter before trade
diversion from a given destination; and �Diff � is an dummy variable equal to 1 if the product is di�erentiated,
and zero if the product is homogeneous.
31Rauch (1999) o�ers more details about the motivation of this product classi�cation.
18
Compared to Table 12, the dependent variable in Table 13 shows whether the product has been diverted by
a given exporter following sanctions. The coe�cients show that higher export value and share of exports of a
given product before trade diversion are associated with higher probability of product trade diversion. And, the
probability that di�erentiated products tend to get diverted is 51% lower compared to homogeneous products
(column 3, Table 13). I proxy the importance of a product by the value of the product exports and the share of the
product in the exporter total exports at the exporter-destination level. The results hold at less than 5% signi�cance
levels. These observations are consistent with the assumption of product heterogeneity made by Eckel and Neary
(2010) theoretical model. The existence of product heterogeneity informs about which products are more likely to
be diverted from destinations imposing sanctions to destinations not imposing sanctions.
At what price did exporters divert trade?
If Iranian exporters reduced prices of products that they diverted, the change in product prices should be re�ected
in the unit values of the product exported to destinations not imposing sanctions32. A change in product price
is often used as a change in measure of quality or other dimensions of product characteristics to target di�erent
consumer preferences ( Schott (2004) and Hallak (2006)). Therefore, a change in the unit value of a given product
in the data can be consistent with a combination of (i) change of the product quality, (ii) other changes in product
characteristics that make the product more desirable or a�ordable to consumers in lower income countries, or (iii)
a change in the demand characteristics at the new market.
To examine di�erences between products diverted to new destinations versus products not diverted from des-
tinations imposing sanctions and to search for evidence of changes in product prices following trade diversion, I
estimate a simple model where the dependent variable is the logarithm of the unit value of product p sold by an
exporter e in destination imposing sanctions at month t (equation 14). I obtain unit values (per kg) by dividing
the value of shipment of exports of product p by exporter e at time t by the weight of shipment.
UV (pet|d=treated) = α29Divertpet + α30Post−Divertingpet + γep + κt + +εdt (16)
To compare the unit values of products that were diverted by their exporters to the unit values of the same
products sold by exporters that did not divert, the model includes two variables. The �rst one Divertpet is an
indicator variable that takes the value of one if exporter e diverts product p following sanctions, and zero otherwise.
The second one Post−Divertingpet is the percentage change of product price in the �rst shipment following trade
diversion compared to the product price in the last shipment before trade diversion. To take into account changes
in the average unit value of product p by exporter e, I include month, exporter× product �xed e�ects. These �xed
32In this subsection, I focus mainly on the products that exporters diverted from destinations imposing sanctions to destinationsnot imposing sanctions. If a new product is introduced following trade diversion just to serve the needs of new customers in the newdestination, then no change will be observed.
19
e�ects control for di�erences between average prices of di�erent products. They also take into account di�erences
between the two products in terms of price in�ation. Due to the presence of �xed e�ects, the variables indicate how
the prices of export products in the new destination di�er from the average price of the same product sold in the
destination imposing sanctions before trade diversion.
The results presented in Table 14 indicate that products that were diverted by their exporters had, on average,
10% lower unit prices than the non-diverted products sold by exporters in the destination imposing sanctions
(column 3, Table 14). What's more important for the purpose of this paper is that diverting exporters reduce
the prices of their diverted products once they enter new markets, following sanctions, while they look to new
consumers. Precisely, in the �rst shipment following trade diversion, exporters lower product unit prices at the new
destinations by 6.5% than in the last shipment prior to trade diversion, to the destination imposing sanctions 33.
5 Conclusion
The ability to divert trade may decrease the negative impact of sanctions on trade. This paper examines the
response of Iranian exporters to the trade sanctions imposed on them. Using a new Customs dissaggreted dataset,
it studies whether sanctions triggered exporters to successfully divert trade to destination not imposing sanctions.
The paper uncovers how Iranian trade diversion happened following sanctions and documents how Iranian exporters
were able to divert trade.
The results show that while the trade sanctions reduced exports of Iranian exporters by a third to US, Canadian,
UK, EU, and Australian destinations compared to other destinations, aggregate Iranian exports did not decrease
� mainly because trade diversion happened and caused exports to Asian, Latin American, and African markets
to increase. The paper highlights that: larger and more experienced exporters were less a�ected and more able
to divert their exports than smaller and less experienced exporters; exporters diverted �rstly their core and ho-
mogeneous products; exporters reduced their product prices as they diverted trade to new destinations; and the
new destinations, which diverting exporters targeted, are more politically-friendly to Iran. These �ndings provide
evidence that sanctions may be less e�ective in a globalized world as traders can divert their trade from one trading
partner to another. The idea that one country can impose trade sanctions on another may not necessarily prove
e�ective unless the targeted country depends heavily on trading with the sanctioning country and its exporters
do not have or can not �nd compensating alternatives and new trading partners. The empirical analysis can also
provide potential support to recent theories suggesting that the imposition of sanctions can actually be no more
e�ective than just threatening to impose sanctions.
Further research can go in at least three directions. First, the empirical evidence presented in this paper calls
for further theoretical as well as empirical investigations of the mechanisms by which sanctions achieve success or
33I also compared the product prices of diverting exporters with the product prices of existing exporters. And, I noticed that divertingexporters also sell at lower prices than existing exporters in the destinations that do not impose sanctions.
20
failure in the presence or absence of international consensus and cooperation. Second, one can study the impact
of sanctions on welfare of people in Iran at the aggregate and disaggregate levels (using household income and
expenditure survey data) as sanctions may be a�ecting di�erent social, income, and regional groups di�erently.
Third, Iran has been a�ected lately (in 2012 and 2013) by �nancial sanctions, so in couple years one can study the
impact of �nancial sanctions as well.
References
[1] Avsar, V. (2013). Antidumping, Retaliation Threats, and Export Prices. World Bank Economic Review, 27(1):133-148.
[2] Berman, N., Martin, P., and Mayer, T. (2012). How do di�erent exporters react to exchange rate changes?theory and empirics. Quarterly Journal of Economics, 127(1): 437-492.
[3] Bernard, A. and Jensen, B. (2004). Why Some Firms Export. Review of Economics and Statistics (86): 561-569.
[4] Bernard, A., Bradford, J., Redding, S., and Schott, P. (2012). The Empirics of Firm Heterogeneity andInternational Trade. Annual Review of Economics, 4(1): 283-313.
[5] Berthou, A. and Fontagné, L. (2013). How do Multiproduct Exporters React to a Change in Trade Costs.Scandinavian Journal of Economics, 115(2): 326-353.
[6] Bown, C. and Crowley, M. (2007). Trade de�ection and trade depression. Journal of International Economics,72(1): 176-201.
[7] Cadot, O., Iacovone, L., Pierola, M.D., and Rauch, F. (2013). Success and failure of African exporters. Journalof Development Economics, 101(C): 284-296.
[8] Cebeci, T., Fernandes, A., Freund, C., and Pierola, M. (2012). Exporter dynamics database. Policy ResearchWorking Paper Series 6229, The World Bank.
[9] Das, S., Roberts, M., and Tybout, J. (2007). Market Entry Costs, Producer Heterogeneity, and Export Dy-namics. Econometrica, 75(3): 837-873.
[10] Davis, L. and Engerman, S. (2003). History Lessons: Sanctions - Neither War nor Peace. Journal of EconomicPerspectives, 17(2): 187�197.
[11] Dizaji, S. and van Bergeijk, P. (2012). Early phase success and long run failure of economic sanctions, Withan application to Iran. ISS Working Papers - General Series 544, International Institute of Social Studies ofErasmus University (ISS), The Hague.
[12] Doxey, M. (1980). Economic Sanctions and International Enforcement. Oxford University Press.
[13] Drezner, D. (1999). The Sanctions Paradox: Economic Statecraft and International Relations. CambridgeUniversity Press.
[14] Eaton, J. and and Engers, M. (1999). Sanctions: Some Simple Analytics. American Economic Review, 89(2):409�414.
[15] Eaton, J. and Engers, M. (1992). Sanctions. Journal of Political Economy, 100(5): 899-928.
[16] Eckel, C. and Neary, P. (2010). Multi-Product Firms and Flexible Manufacturing in the Global Economy.Review of Economic Studies, 77(1): 188-217.
[17] Edwards, L. and Lawrence, R. Z. (2010). AGOA Rules: The Intended and Unintended Consequences of SpecialFabric Provisions, NBER Working Paper 16623.
21
[18] Ekholm, K., Moxnes, A., and Ulltveit-Moe, K. (2012). Manufacturing restructuring and the role of real exchangerate shocks. Journal of International Economics, 86(1): 101-117.
[19] Elliott, K. and Hufbauer, G. (1999). Same Song, Same Refrain? Economic Sanctions in the 1990's. AmericanEconomic Review, 89(2): 403�408.
[20] Elliott, K. and Richardson, J. (1997). Determinants and E�ectiveness of �Aggressively Unilateral� U.S. TradeActions. in Robert C. Feenstra, ed., The E�ects of U.S. Trade Protection and Promotion Policies. Universityof Chicago Press (1997), pp., 1125-43.
[21] Elliott, K., Hufbauer, G., Oegg, B., and Schott, J. (2007). Economic Sanctions Reconsidered: 3rd Edition.Peterson Institute for International Economics.
[22] Evenett, S.J. (2002). The Impact of Economic Sanctions on South African Exports. Scottish Journal of PoliticalEconomy, 49(5): 557-73.
[23] Frazer, G., and Biesebroeck, J.V. (2010). Trade Growth under the African Growth and Opportunity Act. TheReview of Economics and Statistics, 92(1): 128-144.
[24] Freund, C. and Pierola, M.D. (2010). Export entrepreneurs: evidence from Peru. Policy Research WorkingPaper Series 5407, The World Bank.
[25] Freund, C. and Pierola, M.D. (2012). Export superstars. Policy Research Working Paper Series 6222, TheWorld Bank.
[26] Hallak, J. (2006). Product quality and the direction of trade. Journal of International Economics, 68(1): 238-265.
[27] Iacovone, L. and Javorcik, B. (2010). Multi-Product Exporters: Product Churning, Uncertainty and ExportDiscoveries. Economic Journal, 120(544): 481-499.
[28] Kaempfer, W. and Lowenberg, A. (1988). The Theory of International Economic Sanctions: A Public ChoiceApproach. American Economic Review, 78(4): 786-793.
[29] Kennedy, P. (1981). Estimation with correctly interpreted dummy variables in semilogarithmic equations.American Economic Review, (71): 801.
[30] Khandelwal, A., Schott, P., and Wei, S.J. (forthcoming). Trade Liberalization and Embedded InstitutionalReform: Evidence from Chinese Exporters. American Economic Review.
[31] Khandelwal, A. and Topalova, P. (2011). Trade Liberalization and Firm Productivity: The Case of India.Review of Economics and Statistics, 93(3): 995-1009.
[32] Levy, P., (1999). Sanctions on South Africa: What Did They Do? American Economic Review, 89(2): 415�420.
[33] Martin, L. (1993). Coercive Cooperation: Explaining Multilateral Economic Sanctions. Princeton UniversityPress.
[34] Melitz, M. (2003). The Impact of Trade on Intra-Industry Reallocations and Aggregate Industry Productivity.Econometrica, 71(6): 1695-1725.
[35] Moulton, B. (1990). An illustration of a pitfall in estimating the e�ects of aggregate variables on micro unit.Review of Economics and Statistics, 72(2): 334-38.
[36] Prusa, T. (2001). On the spread and impact of anti-dumping. Canadian Journal of Economics, (34): 591-611.
[37] Rauch, J. (1999). Networks versus Markets in International Trade. Journal of International Economics, 48(1):7-35.
[38] Romalis, J. (2007). NAFTA's and CUSFTA's Impact on International Trade. Review of Economics and Statis-tics, 89(3): 416-435.
[39] Schott, P. (2004). Across-product versus within-product specialization in international trade. Quarterly Journalof Economics, 119(2): 647-678.
22
[40] Smeets, M. (1990). Economic Sanctions Against Iraq: The Ideal Case? Journal of World Trade, 24(6): 105-20.
[41] Strezhnev, A. and Voeten, E. (2013). United Nations General Assembly Voting Data.
[42] van Bergeijk, P. (2009). Economic Diplomacy and the Geography of Trade. Edward Elgar.
[43] Viner, J. (1950). The Customs Union Issue. Carnegie Endowment for International Peace, New York.
[44] Wooldridge, J. (2003). Cluster-sample methods in applied econometrics. American Economic Review, 93(2):133-138.
23
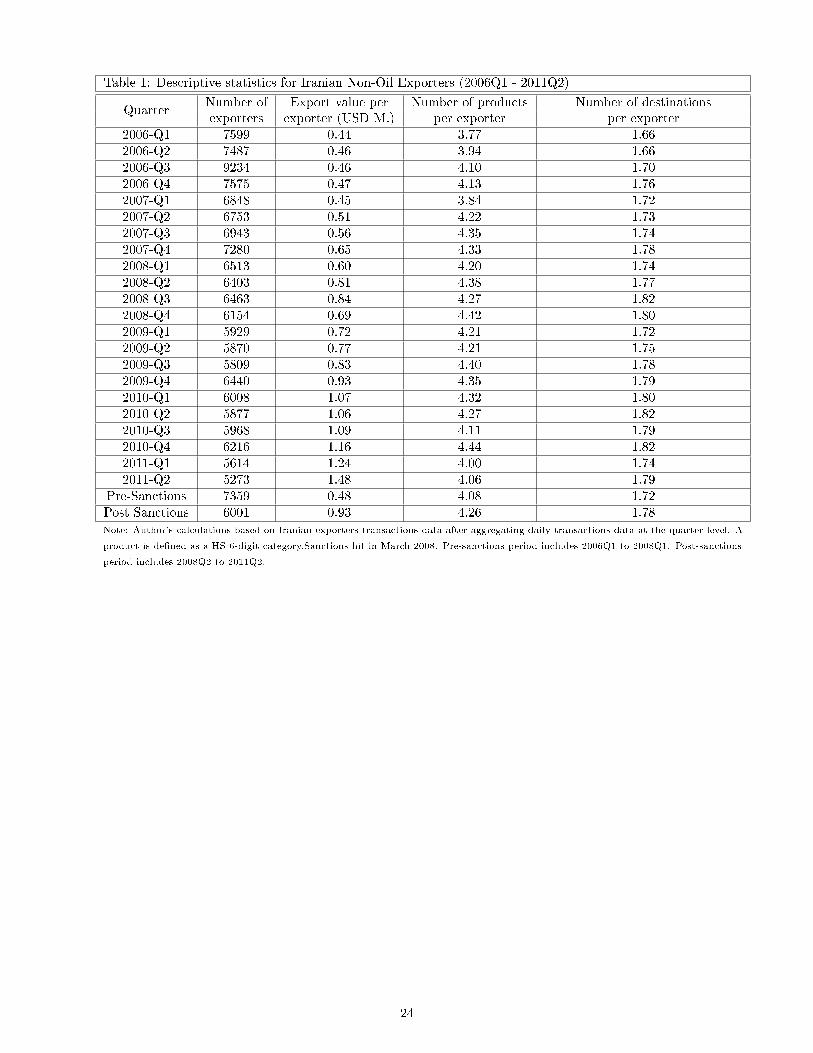
Table 1: Descriptive statistics for Iranian Non-Oil Exporters (2006Q1 - 2011Q2)
QuarterNumber of Export value per Number of products Number of destinationsexporters exporter (USD M.) per exporter per exporter
2006-Q1 7599 0.44 3.77 1.662006-Q2 7487 0.46 3.94 1.662006-Q3 9234 0.46 4.10 1.702006-Q4 7575 0.47 4.13 1.762007-Q1 6848 0.45 3.84 1.722007-Q2 6753 0.51 4.22 1.732007-Q3 6943 0.56 4.35 1.742007-Q4 7280 0.65 4.33 1.782008-Q1 6513 0.60 4.20 1.742008-Q2 6403 0.81 4.38 1.772008-Q3 6463 0.84 4.27 1.822008-Q4 6154 0.69 4.42 1.802009-Q1 5929 0.72 4.21 1.722009-Q2 5870 0.77 4.21 1.752009-Q3 5809 0.83 4.40 1.782009-Q4 6440 0.93 4.35 1.792010-Q1 6008 1.07 4.32 1.802010-Q2 5877 1.06 4.27 1.822010-Q3 5968 1.09 4.11 1.792010-Q4 6216 1.16 4.44 1.822011-Q1 5614 1.24 4.00 1.742011-Q2 5273 1.48 4.06 1.79
Pre-Sanctions 7359 0.48 4.08 1.72Post Sanctions 6001 0.93 4.26 1.78Note: Author's calculations based on Iranian exporters transactions data after aggregating daily transactions data at the quarter level. A
product is de�ned as a HS 6-digit category.Sanctions hit in March 2008. Pre-sanctions period includes 2006Q1 to 2008Q1. Post-sanctions
period includes 2008Q2 to 2011Q2.
24
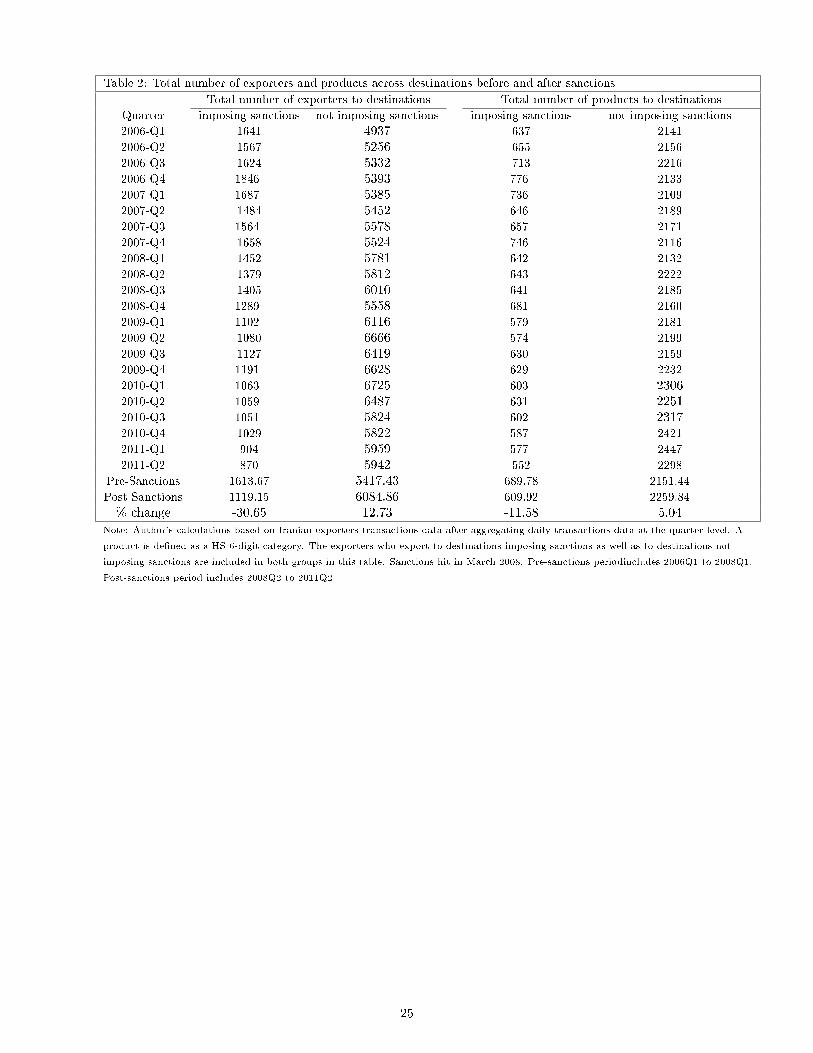
Table 2: Total number of exporters and products across destinations before and after sanctions
Total number of exporters to destinations Total number of products to destinations
Quarter imposing sanctions not imposing sanctions imposing sanctions not imposing sanctions
2006-Q1 1641 4937 637 2141
2006-Q2 1567 5256 655 2156
2006-Q3 1624 5332 713 2216
2006-Q4 1846 5393 776 2133
2007-Q1 1687 5385 736 2109
2007-Q2 1484 5452 646 2189
2007-Q3 1564 5578 657 2171
2007-Q4 1658 5524 746 2116
2008-Q1 1452 5781 642 2132
2008-Q2 1379 5812 643 2222
2008-Q3 1405 6010 641 2185
2008-Q4 1289 5558 681 2160
2009-Q1 1102 6116 579 2181
2009-Q2 1080 6666 574 2199
2009-Q3 1127 6419 630 2159
2009-Q4 1191 6628 629 2232
2010-Q1 1063 6725 603 23062010-Q2 1059 6487 631 22512010-Q3 1051 5824 602 23172010-Q4 1029 5822 587 2421
2011-Q1 904 5959 577 2447
2011-Q2 870 5942 552 2298
Pre-Sanctions 1613.67 5417.43 689.78 2151.44
Post Sanctions 1119.15 6084.86 609.92 2259.84
% change -30.65 12.73 -11.58 5.04Note: Author's calculations based on Iranian exporters transactions data after aggregating daily transactions data at the quarter level. A
product is de�ned as a HS 6-digit category. The exporters who export to destinations imposing sanctions as well as to destinations not
imposing sanctions are included in both groups in this table. Sanctions hit in March 2008. Pre-sanctions periodincludes 2006Q1 to 2008Q1.
Post-sanctions period includes 2008Q2 to 2011Q2.
25
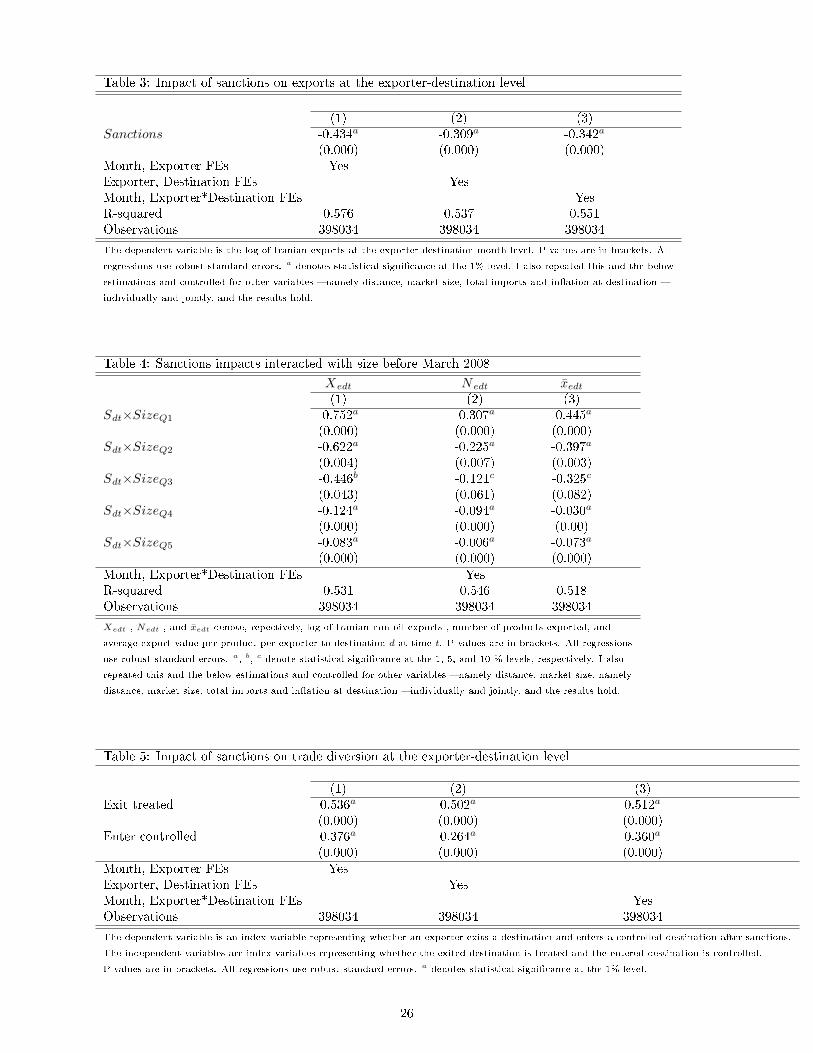
Table 3: Impact of sanctions on exports at the exporter-destination level
(1) (2) (3)Sanctions -0.434a -0.309a -0.342a
(0.000) (0.000) (0.000)Month, Exporter FEs YesExporter, Destination FEs YesMonth, Exporter*Destination FEs YesR-squared 0.576 0.537 0.551Observations 398034 398034 398034
The dependent variable is the log of Iranian exports at the exporter-destination-month level. P-values are in brackets. All
regressions use robust standard errors. a denotes statistical signi�cance at the 1% level. I also repeated this and the below
estimations and controlled for other variables � namely distance, market size, total imports and in�ation at destination �
individually and jointly, and the results hold.
Table 4: Sanctions impacts interacted with size before March 2008
Xedt Nedt x̄edt(1) (2) (3)
Sdt×SizeQ1 -0.752a -0.307a -0.445a
(0.000) (0.000) (0.000)Sdt×SizeQ2 -0.622a -0.225a -0.397a
(0.004) (0.007) (0.003)Sdt×SizeQ3 -0.446b -0.121c -0.325c
(0.043) (0.061) (0.082)Sdt×SizeQ4 -0.124a -0.094a -0.030a
(0.000) (0.000) (0.00)Sdt×SizeQ5 -0.083a -0.006a -0.073a
(0.000) (0.000) (0.000)Month, Exporter*Destination FEs YesR-squared 0.531 0.546 0.518Observations 398034 398034 398034
Xedt , Nedt , and x̄edt denote, repectively, log of Iranian non-oil exports , number of products exported, and
average export value per product per exporter to destination d at time t. P-values are in brackets. All regressions
use robust standard errors. a, b, c denote statistical signi�cance at the 1, 5, and 10 % levels, respectively. I also
repeated this and the below estimations and controlled for other variables � namely distance, market size, namely
distance, market size, total imports and in�ation at destination � individually and jointly, and the results hold.
Table 5: Impact of sanctions on trade diversion at the exporter-destination level
(1) (2) (3)Exit treated 0.536a 0.502a 0.512a
(0.000) (0.000) (0.000)Enter controlled 0.376a 0.264a 0.360a
(0.000) (0.000) (0.000)Month, Exporter FEs YesExporter, Destination FEs YesMonth, Exporter*Destination FEs YesObservations 398034 398034 398034
The dependent variable is an index variable representing whether an exporter exits a destination and enters a controlled destination after sanctions.
The independent variables are index variables representing whether the exited destination is treated and the entered destination is controlled.
P-values are in brackets. All regressions use robust standard errors. a denotes statistical signi�cance at the 1% level.
26
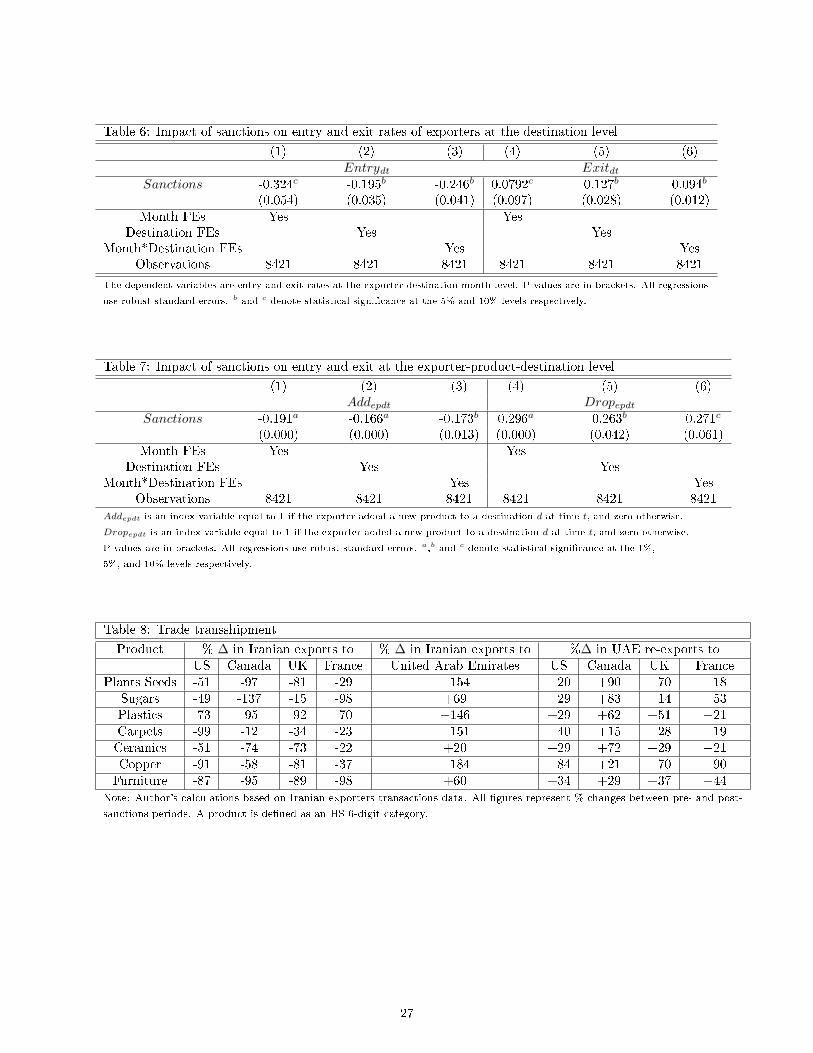
Table 6: Impact of sanctions on entry and exit rates of exporters at the destination level
(1) (2) (3) (4) (5) (6)Entrydt Exitdt
Sanctions -0.324c -0.195b -0.246b 0.0792c 0.127b 0.094b
(0.054) (0.035) (0.041) (0.097) (0.028) (0.012)Month FEs Yes Yes
Destination FEs Yes YesMonth*Destination FEs Yes Yes
Observations 8421 8421 8421 8421 8421 8421
The dependent variables are entry and exit rates at the exporter-destination-month level. P-values are in brackets. All regressions
use robust standard errors. b and c denote statistical signi�cance at the 5% and 10% levels respectively.
Table 7: Impact of sanctions on entry and exit at the exporter-product-destination level
(1) (2) (3) (4) (5) (6)Addepdt Dropepdt
Sanctions -0.191a -0.166a -0.173b 0.296a 0.263b 0.271c
(0.000) (0.000) (0.013) (0.000) (0.042) (0.061)Month FEs Yes Yes
Destination FEs Yes YesMonth*Destination FEs Yes Yes
Observations 8421 8421 8421 8421 8421 8421Addepdt is an index variable equal to 1 if the exporter added a new product to a destination d at time t, and zero otherwise.
Dropepdt is an index variable equal to 1 if the exporter added a new product to a destination d at time t, and zero otherwise.
P-values are in brackets. All regressions use robust standard errors. a,b and c denote statistical signi�cance at the 1%,
5%, and 10% levels respectively.
Table 8: Trade transshipment
Product % ∆ in Iranian exports to % ∆ in Iranian exports to %∆ in UAE re-exports toUS Canada UK France United Arab Emirates US Canada UK France
Plants Seeds -51 -97 -81 -29 +154 +20 +90 +70 +18Sugars -49 -137 -15 -98 +69 +29 +83 +14 +53Plastics -73 -95 -92 -70 +146 +29 +62 +51 +21Carpets -99 -12 -34 -23 +151 +40 +15 +28 +19Ceramics -51 -74 -73 -22 +20 +29 +72 +29 +21Copper -91 -58 -81 -37 +184 +84 +21 +70 +90Furniture -87 -95 -89 -98 +60 +34 +29 +37 +44
Note: Author's calculations based on Iranian exporters transactions data. All �gures represent % changes between pre- and post-
sanctions periods. A product is de�ned as an HS 6-digit category.
27
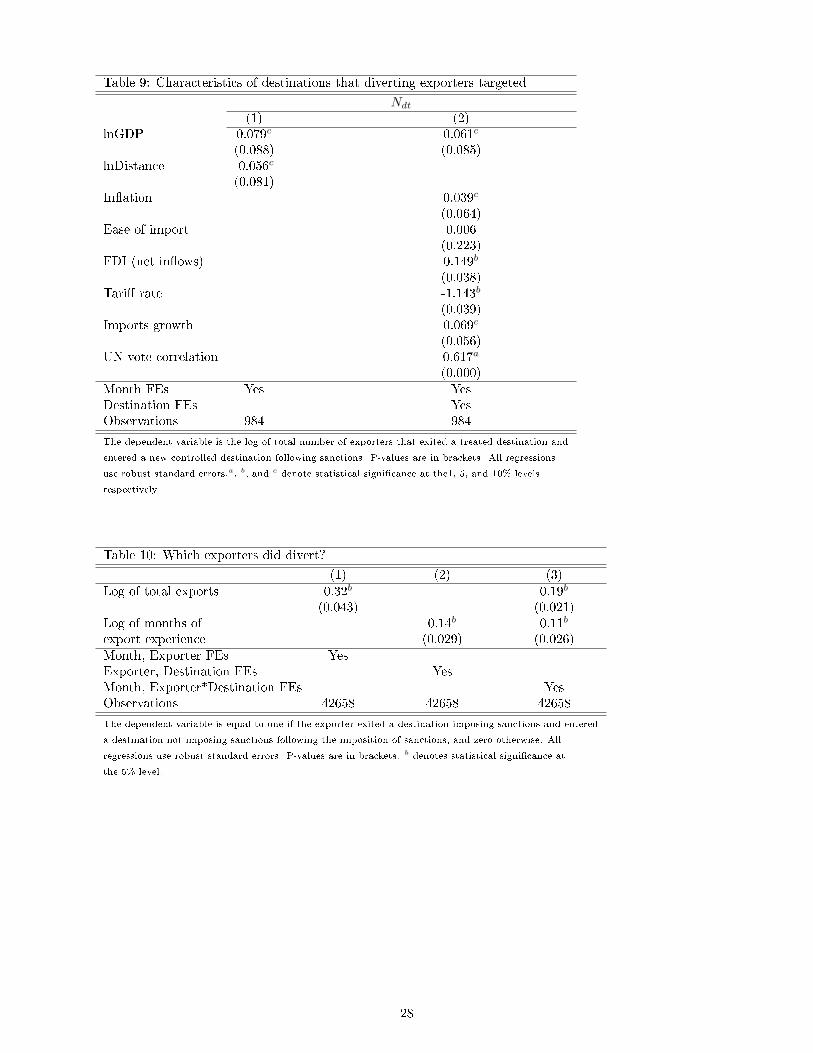
Table 9: Characteristics of destinations that diverting exporters targeted
Ndt(1) (2)
lnGDP 0.079c 0.061c
(0.088) (0.085)lnDistance -0.056c
(0.081)In�ation 0.039c
(0.064)Ease of import 0.006
(0.223)FDI (net in�ows) 0.149b
(0.038)Tari� rate -1.143b
(0.039)Imports growth 0.069c
(0.056)UN vote correlation 0.617a
(0.000)Month FEs Yes YesDestination FEs YesObservations 984 984
The dependent variable is the log of total number of exporters that exited a treated destination and
entered a new controlled destination following sanctions. P-values are in brackets. All regressions
use robust standard errors.a, b, and c denote statistical signi�cance at the1, 5, and 10% levels
respectively.
Table 10: Which exporters did divert?
(1) (2) (3)Log of total exports 0.32b 0.19b
(0.043) (0.021)Log of months of 0.14b 0.11b
export experience (0.029) (0.026)Month, Exporter FEs YesExporter, Destination FEs YesMonth, Exporter*Destination FEs YesObservations 42658 42658 42658
The dependent variable is equal to one if the exporter exited a destination imposing sanctions and entered
a destination not imposing sanctions following the imposition of sanctions, and zero otherwise. All
regressions use robust standard errors. P-values are in brackets. b denotes statistical signi�cance at
the 5% level.
28
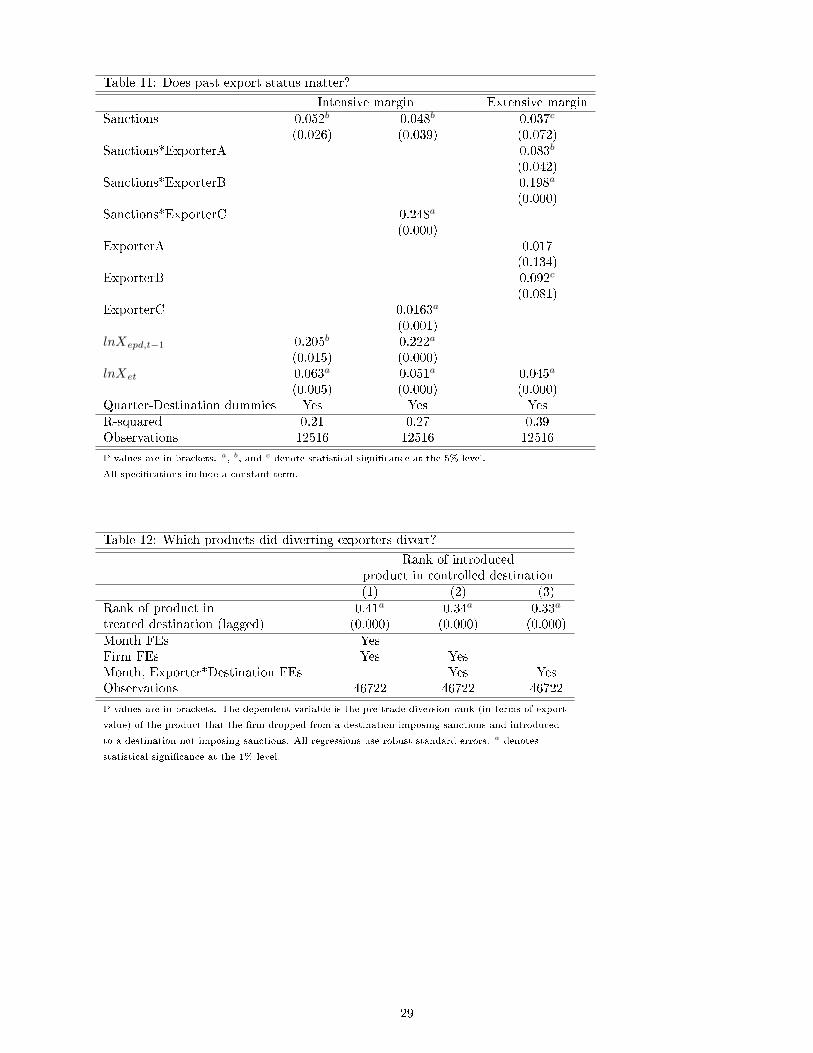
Table 11: Does past export status matter?
Intensive margin Extensive marginSanctions 0.052b 0.048b 0.037c
(0.026) (0.039) (0.072)Sanctions*ExporterA 0.083b
(0.042)Sanctions*ExporterB 0.198a
(0.000)Sanctions*ExporterC 0.248a
(0.000)ExporterA 0.017
(0.134)ExporterB 0.092c
(0.081)ExporterC 0.0163a
(0.001)lnXepd,t−1 0.205b 0.222a
(0.015) (0.000)lnXet 0.063a 0.051a 0.045a
(0.005) (0.000) (0.000)Quarter-Destination dummies Yes Yes YesR-squared 0.21 0.27 0.39Observations 12516 12516 12516
P-values are in brackets. a, b, and c denote statistical signi�cance at the 5% level.
All speci�cations include a constant term.
Table 12: Which products did diverting exporters divert?
Rank of introducedproduct in controlled destination(1) (2) (3)
Rank of product in 0.41a 0.34a 0.33a
treated destination (lagged) (0.000) (0.000) (0.000)Month FEs YesFirm FEs Yes YesMonth, Exporter*Destination FEs Yes YesObservations 46722 46722 46722
P-values are in brackets. The dependent variable is the pre-trade diversion rank (in terms of export
value) of the product that the �rm dropped from a destination imposing sanctions and introduced
to a destination not imposing sanctions. All regressions use robust standard errors. a denotes
statistical signi�cance at the 1% level.
29
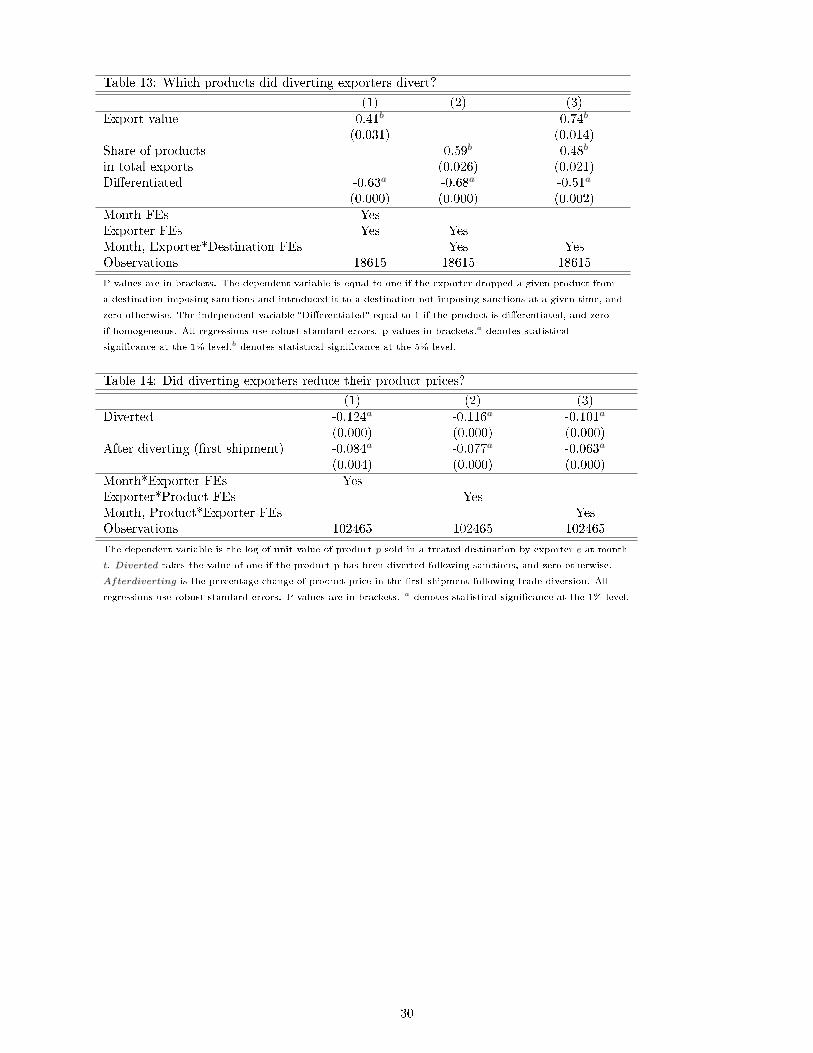
Table 13: Which products did diverting exporters divert?
(1) (2) (3)Export value 0.41b 0.74b
(0.031) (0.014)Share of products 0.59b 0.48b
in total exports (0.026) (0.021)Di�erentiated -0.63a -0.68a -0.51a
(0.000) (0.000) (0.002)Month FEs YesExporter FEs Yes YesMonth, Exporter*Destination FEs Yes YesObservations 18615 18615 18615
P-values are in brackets. The dependent variable is equal to one if the exporter dropped a given product from
a destination imposing sanctions and introduced it to a destination not imposing sanctions at a given time, and
zero otherwise. The independent variable �Di�erentiated� equal to 1 if the product is di�erentiated, and zero
if homogeneous. All regressions use robust standard errors. p-values in brackets.a denotes statistical
signi�cance at the 1% level.b denotes statistical signi�cance at the 5% level.
Table 14: Did diverting exporters reduce their product prices?
(1) (2) (3)Diverted -0.124a -0.116a -0.101a
(0.000) (0.000) (0.000)After diverting (�rst shipment) -0.084a -0.077a -0.063a
(0.004) (0.000) (0.000)Month*Exporter FEs YesExporter*Product FEs YesMonth, Product*Exporter FEs YesObservations 102465 102465 102465
The dependent variable is the log of unit value of product p sold in a treated destination by exporter e at month
t. Diverted takes the value of one if the product p has been diverted following sanctions, and zero otherwise.
Afterdiverting is the percentage change of product price in the �rst shipment following trade diversion. All
regressions use robust standard errors. P-values are in brackets. a denotes statistical signi�cance at the 1% level.
30
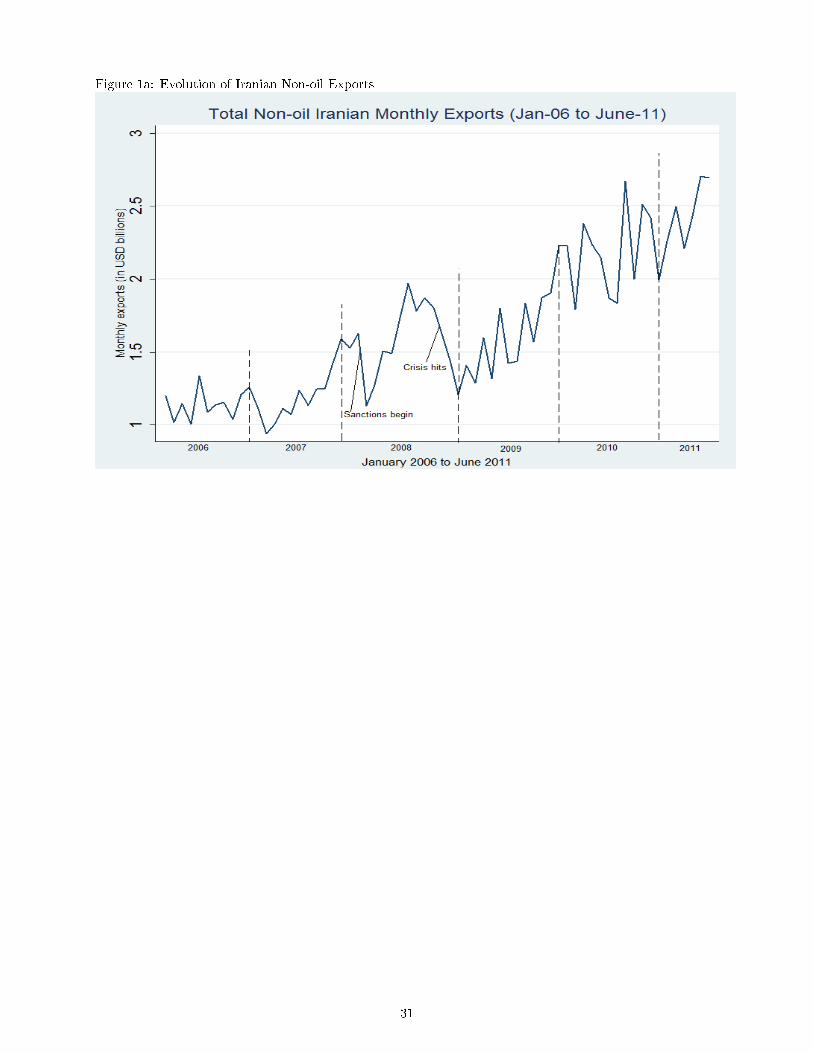
Figure 1a: Evolution of Iranian Non-oil Exports
31
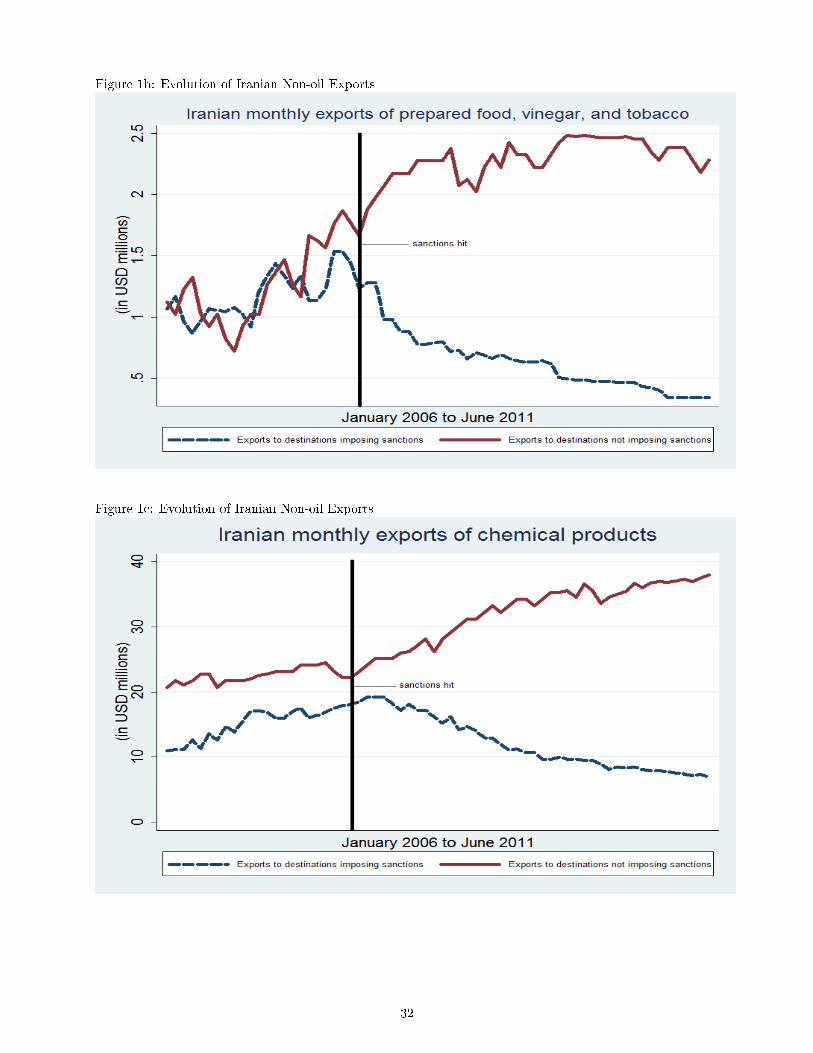
Figure 1b: Evolution of Iranian Non-oil Exports
Figure 1c: Evolution of Iranian Non-oil Exports
32
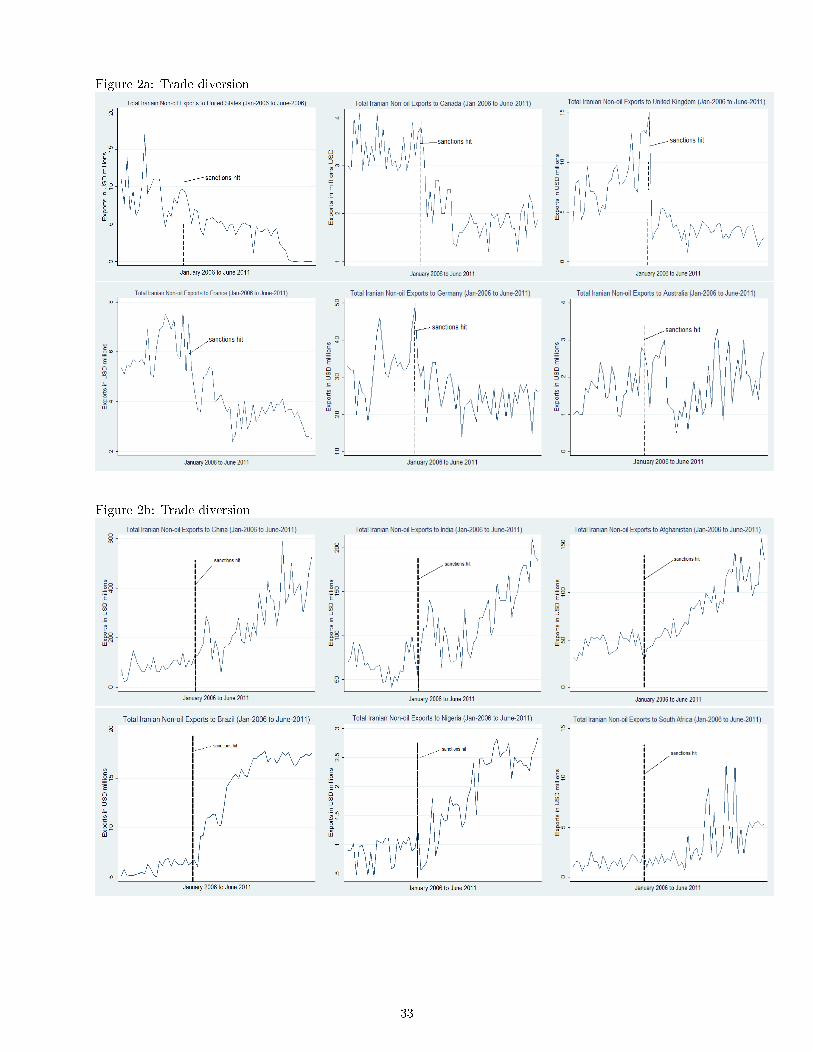
Figure 2a: Trade diversion
Figure 2b: Trade diversion
33

Figure 3a: Export Trends
Figure 3b: Export trends - entry and exit
34
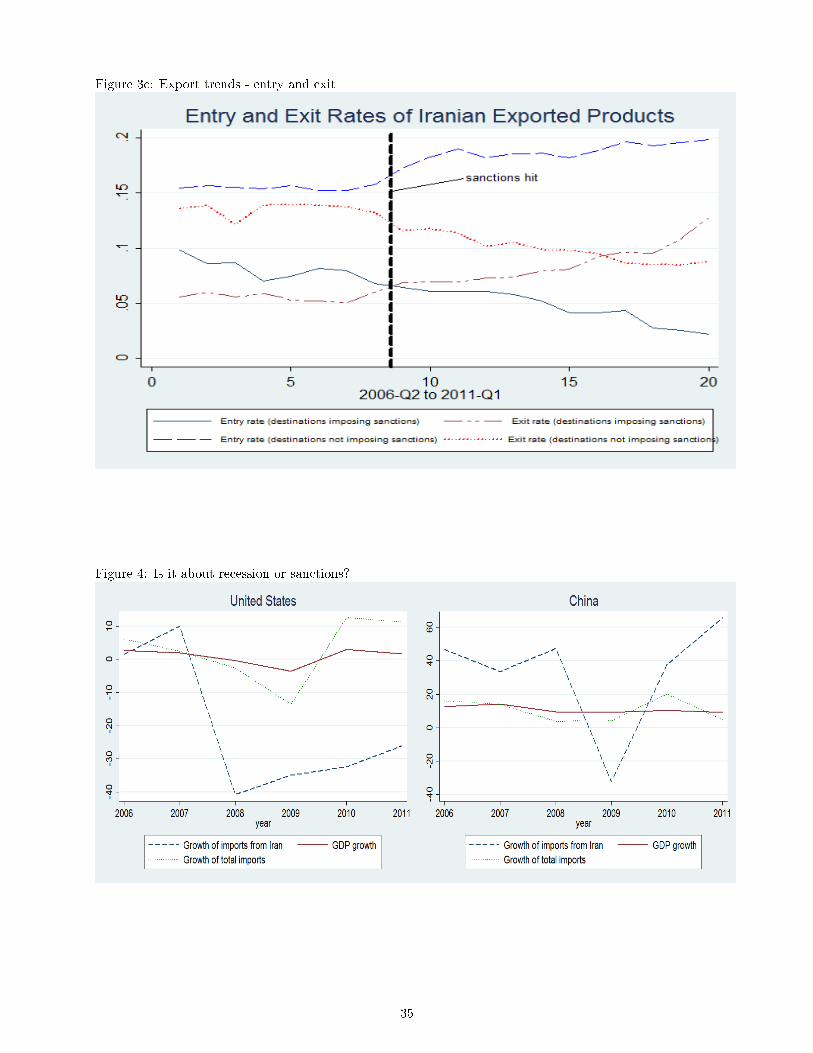
Figure 3c: Export trends - entry and exit
Figure 4: Is it about recession or sanctions?
35
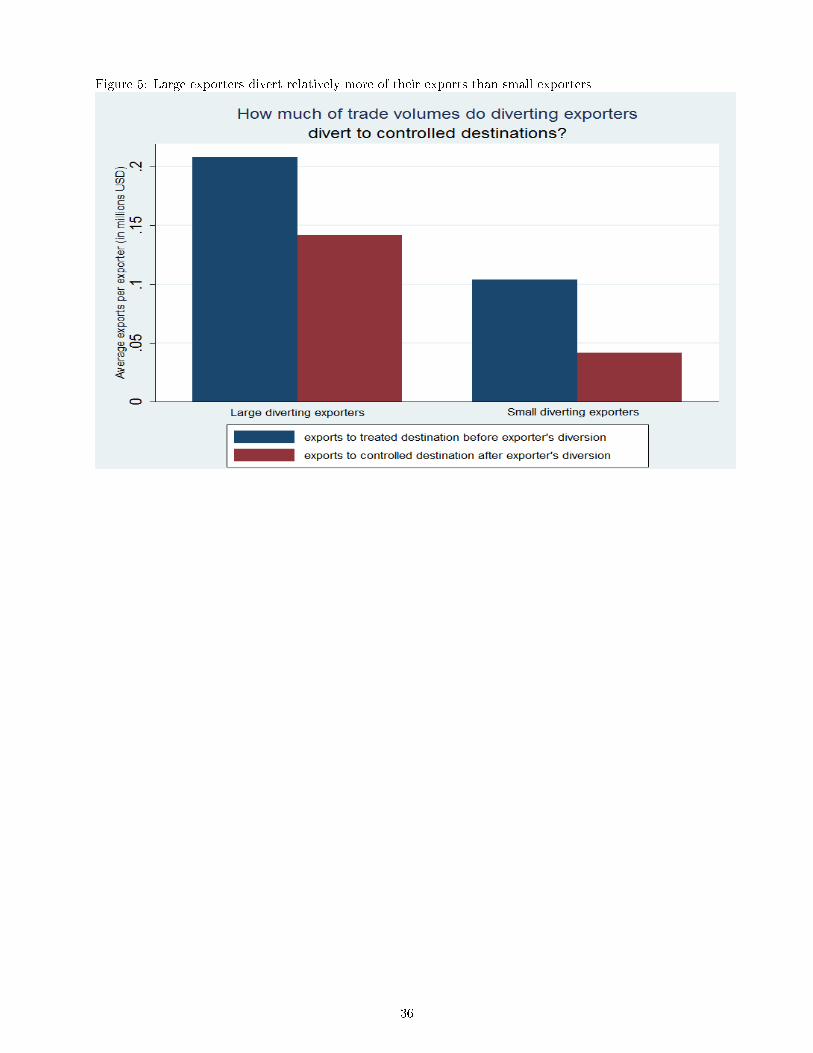
Figure 5: Large exporters divert relatively more of their exports than small exporters
36
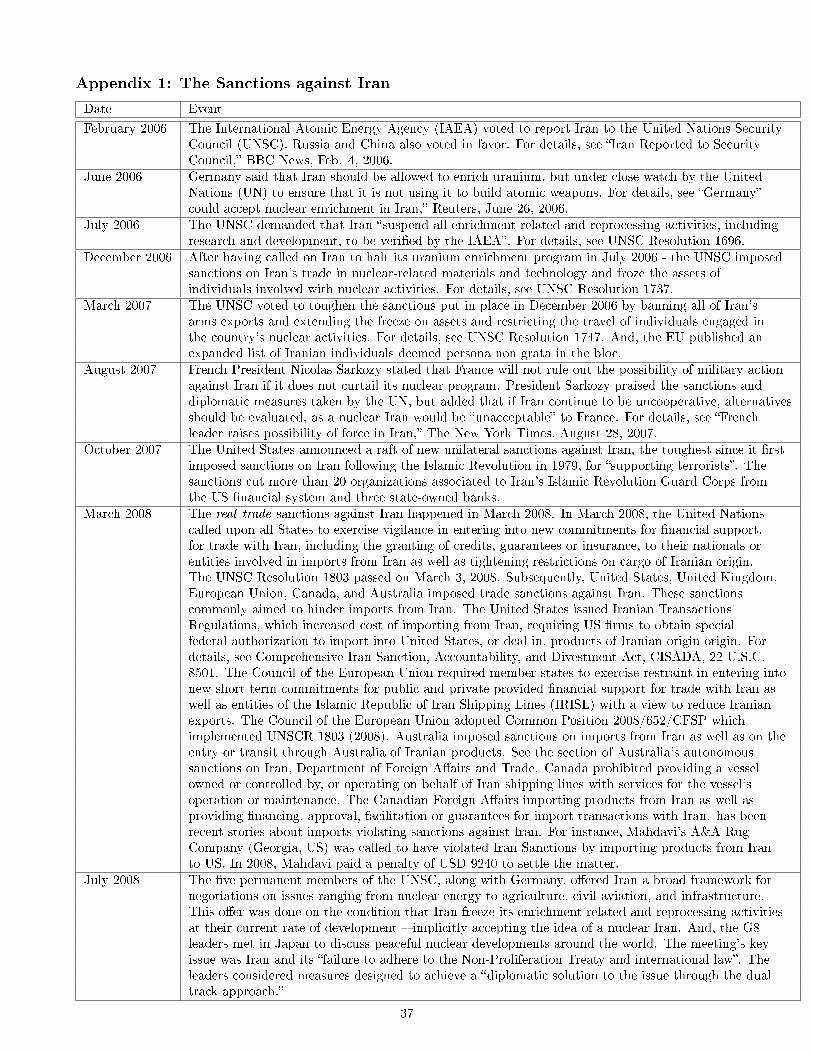
Appendix 1: The Sanctions against Iran
Date Event
February 2006 The International Atomic Energy Agency (IAEA) voted to report Iran to the United Nations SecurityCouncil (UNSC). Russia and China also voted in favor. For details, see �Iran Reported to SecurityCouncil,� BBC News, Feb. 4, 2006.
June 2006 Germany said that Iran should be allowed to enrich uranium, but under close watch by the UnitedNations (UN) to ensure that it is not using it to build atomic weapons. For details, see �Germany�could accept nuclear enrichment in Iran,� Reuters, June 26, 2006.
July 2006 The UNSC demanded that Iran �suspend all enrichment-related and reprocessing activities, includingresearch and development, to be veri�ed by the IAEA�. For details, see UNSC Resolution 1696.
December 2006 After having called on Iran to halt its uranium enrichment program in July 2006 - the UNSC imposedsanctions on Iran's trade in nuclear-related materials and technology and froze the assets ofindividuals involved with nuclear activities. For details, see UNSC Resolution 1737.
March 2007 The UNSC voted to toughen the sanctions put in place in December 2006 by banning all of Iran'sarms exports and extending the freeze on assets and restricting the travel of individuals engaged inthe country's nuclear activities. For details, see UNSC Resolution 1747. And, the EU published anexpanded list of Iranian individuals deemed persona non grata in the bloc.
August 2007 French President Nicolas Sarkozy stated that France will not rule out the possibility of military actionagainst Iran if it does not curtail its nuclear program. President Sarkozy praised the sanctions anddiplomatic measures taken by the UN, but added that if Iran continue to be uncooperative, alternativesshould be evaluated, as a nuclear Iran would be �unacceptable� to France. For details, see �Frenchleader raises possibility of force in Iran,� The New York Times, August 28, 2007.
October 2007 The United States announced a raft of new unilateral sanctions against Iran, the toughest since it �rstimposed sanctions on Iran following the Islamic Revolution in 1979, for �supporting terrorists�. Thesanctions cut more than 20 organizations associated to Iran's Islamic Revolution Guard Corps fromthe US �nancial system and three state-owned banks.
March 2008 The real trade sanctions against Iran happened in March 2008. In March 2008, the United Nationscalled upon all States to exercise vigilance in entering into new commitments for �nancial support.for trade with Iran, including the granting of credits, guarantees or insurance, to their nationals orentities involved in imports from Iran as well as tightening restrictions on cargo of Iranian origin.The UNSC Resolution 1803 passed on March 3, 2008. Subsequently, United States, United Kingdom,European Union, Canada, and Australia imposed trade sanctions against Iran. These sanctionscommonly aimed to hinder imports from Iran. The United States issued Iranian TransactionsRegulations, which increased cost of importing from Iran, requiring US �rms to obtain specialfederal authorization to import into United States, or deal in, products of Iranian origin origin. Fordetails, see Comprehensive Iran Sanction, Accountability, and Divestment Act, CISADA, 22 U.S.C.8501. The Council of the European Union required member states to exercise restraint in entering intonew short term commitments for public and private provided �nancial support for trade with Iran aswell as entities of the Islamic Republic of Iran Shipping Lines (IRISL) with a view to reduce Iranianexports. The Council of the European Union adopted Common Position 2008/652/CFSP whichimplemented UNSCR 1803 (2008). Australia imposed sanctions on imports from Iran as well as on theentry or transit through Australia of Iranian products. See the section of Australia's autonomoussanctions on Iran, Department of Foreign A�airs and Trade. Canada prohibited providing a vesselowned or controlled by, or operating on behalf of Iran shipping lines with services for the vessel'soperation or maintenance. The Canadian Foreign A�airs importing products from Iran as well asproviding �nancing, approval, facilitation or guarantees for import transactions with Iran. has beenrecent stories about imports violating sanctions against Iran. For instance, Mahdavi's A&A RugCompany (Georgia, US) was called to have violated Iran Sanctions by importing products from Iranto US. In 2008, Mahdavi paid a penalty of USD 9240 to settle the matter.
July 2008 The �ve permanent members of the UNSC, along with Germany, o�ered Iran a broad framework fornegotiations on issues ranging from nuclear energy to agriculture, civil aviation, and infrastructure.This o�er was done on the condition that Iran freeze its enrichment-related and reprocessing activitiesat their current rate of development � implicitly accepting the idea of a nuclear Iran. And, the G8leaders met in Japan to discuss peaceful nuclear developments around the world. The meeting's keyissue was Iran and its �failure to adhere to the Non-Proliferation Treaty and international law�. Theleaders considered measures designed to achieve a �diplomatic solution to the issue through the dualtrack approach.�
37
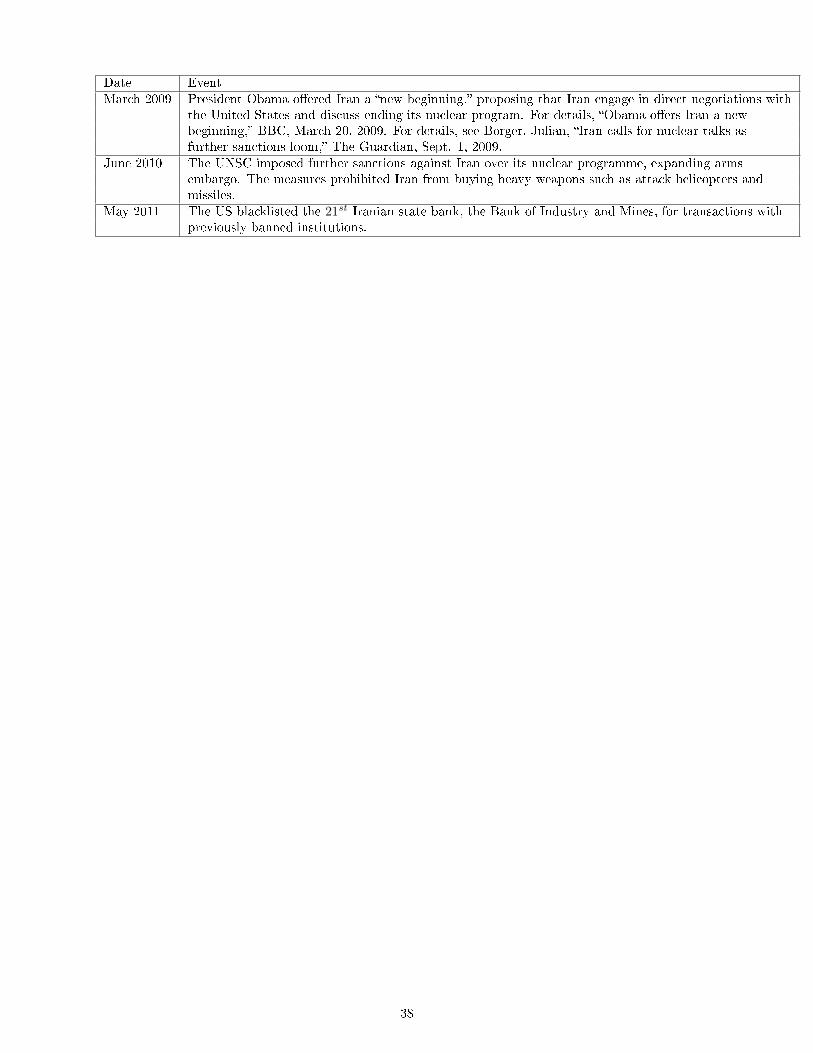
Date EventMarch 2009 President Obama o�ered Iran a �new beginning,� proposing that Iran engage in direct negotiations with
the United States and discuss ending its nuclear program. For details, �Obama o�ers Iran a newbeginning,� BBC, March 20, 2009. For details, see Borger, Julian, �Iran calls for nuclear talks asfurther sanctions loom,� The Guardian, Sept. 1, 2009.
June 2010 The UNSC imposed further sanctions against Iran over its nuclear programme, expanding armsembargo. The measures prohibited Iran from buying heavy weapons such as attack helicopters andmissiles.
May 2011 The US blacklisted the 21st Iranian state bank, the Bank of Industry and Mines, for transactions withpreviously banned institutions.
38