Embed Size (px)
Citation preview
Trade, Foreign Direct Investment and Development
in the Middle East and North Africa*
Farrukh Iqbal and Mustapha Kamel Nabli The World Bank
* Paper prepared for Conference entitled: The Middle East and North Africa Region: The Challenges of Growth and Globalization, organized by the International Monetary Fund and to be held in Washington DC on April 7-8, 2004.
2
Trade, Foreign Direct Investment and Development in the Middle East and North Africa1
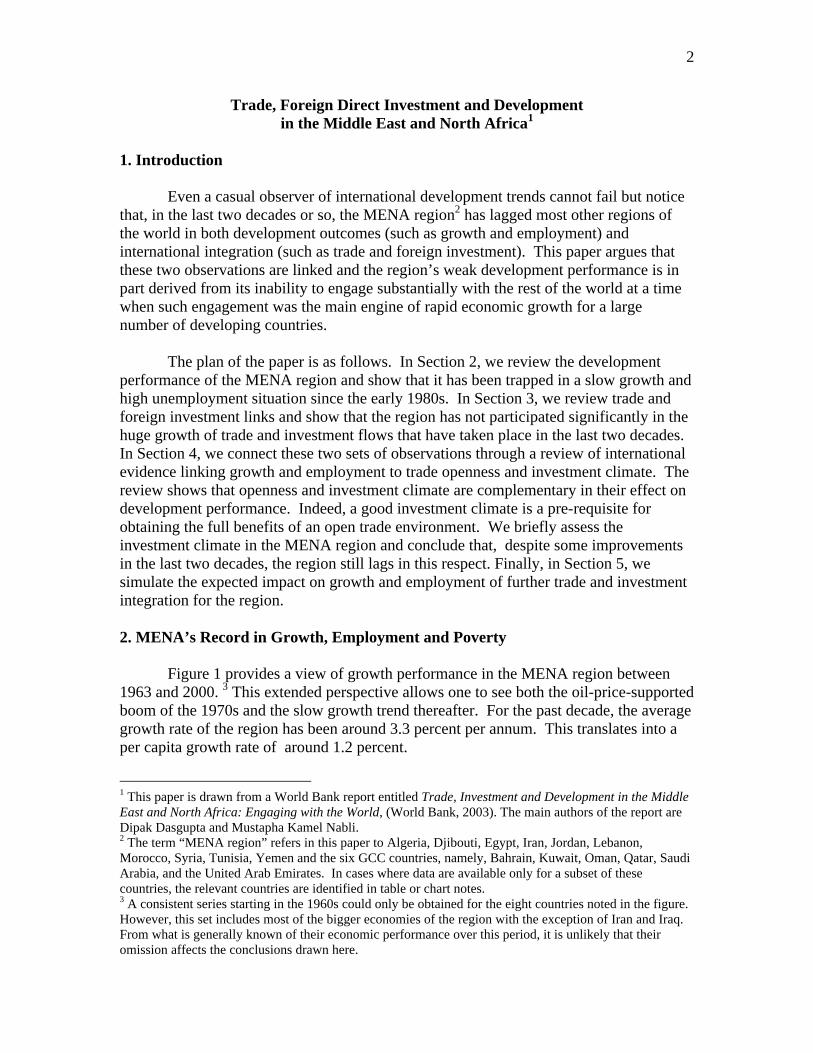
1. Introduction Even a casual observer of international development trends cannot fail but notice that, in the last two decades or so, the MENA region2 has lagged most other regions of the world in both development outcomes (such as growth and employment) and international integration (such as trade and foreign investment). This paper argues that these two observations are linked and the region’s weak development performance is in part derived from its inability to engage substantially with the rest of the world at a time when such engagement was the main engine of rapid economic growth for a large number of developing countries. The plan of the paper is as follows. In Section 2, we review the development performance of the MENA region and show that it has been trapped in a slow growth and high unemployment situation since the early 1980s. In Section 3, we review trade and foreign investment links and show that the region has not participated significantly in the huge growth of trade and investment flows that have taken place in the last two decades. In Section 4, we connect these two sets of observations through a review of international evidence linking growth and employment to trade openness and investment climate. The review shows that openness and investment climate are complementary in their effect on development performance. Indeed, a good investment climate is a pre-requisite for obtaining the full benefits of an open trade environment. We briefly assess the investment climate in the MENA region and conclude that, despite some improvements in the last two decades, the region still lags in this respect. Finally, in Section 5, we simulate the expected impact on growth and employment of further trade and investment integration for the region. 2. MENA’s Record in Growth, Employment and Poverty Figure 1 provides a view of growth performance in the MENA region between 1963 and 2000. 3 This extended perspective allows one to see both the oil-price-supported boom of the 1970s and the slow growth trend thereafter. For the past decade, the average growth rate of the region has been around 3.3 percent per annum. This translates into a per capita growth rate of around 1.2 percent.
1 This paper is drawn from a World Bank report entitled Trade, Investment and Development in the Middle East and North Africa: Engaging with the World, (World Bank, 2003). The main authors of the report are Dipak Dasgupta and Mustapha Kamel Nabli. 2 The term “MENA region” refers in this paper to Algeria, Djibouti, Egypt, Iran, Jordan, Lebanon, Morocco, Syria, Tunisia, Yemen and the six GCC countries, namely, Bahrain, Kuwait, Oman, Qatar, Saudi Arabia, and the United Arab Emirates. In cases where data are available only for a subset of these countries, the relevant countries are identified in table or chart notes. 3 A consistent series starting in the 1960s could only be obtained for the eight countries noted in the figure. However, this set includes most of the bigger economies of the region with the exception of Iran and Iraq. From what is generally known of their economic performance over this period, it is unlikely that their omission affects the conclusions drawn here.
3
Figure 1: GDP growth rates for selected MENA countries (1963-2000)
Figure 2 provides a comparison of MENA’s growth during the 1990s with that of
other regions. The MENA region’s per capita growth rate of 1.2 percent is worse than that of such regions as Latin America, South Asia and East Asia. It is better only than that of sub-Saharan Africa and the Europe/Central Asia region. The latter spent most the decade in the throes of a wrenching transition away from state-dominated economies. In recent years, however, several Eastern European countries have posted high growth rates and appear set to become much more integrated into the world trading and investment system. This observation applies in particular to such countries as Hungary, Poland and the Czech Republic that have been granted accession to the European Union.
Figure 2: Comparative per capita growth rates (1990-2000)
-2-101234567
Eas
t Asi
a
Eur
ope/
Cen
tral
Asi
a
Latin
Am
eric
a
ME
NA
Sou
th A
sia
Afr
ica
Source: World Bank, 2003, Appendix Table 1, p. 228.
GDP Grow th Rate, MENA 1963-2000(Algeria, Egypt, Kuwait, Oman, Morocco, Saudi Arabia, Syria,Tunisia)
-2
0
2
4
6
8
10
12
14
16
1963
1964
1965
1966
1967
1968
1969
1970
1971
1972
1973
1974
1975
1976
1977
1978
1979
1980
1981
1982
1983
1984
1985
1986
1987
1988
1989
1990
1991
1992
1993
1994
1995
1996
1997
1998
1999
2000
Year
perc
ent
4
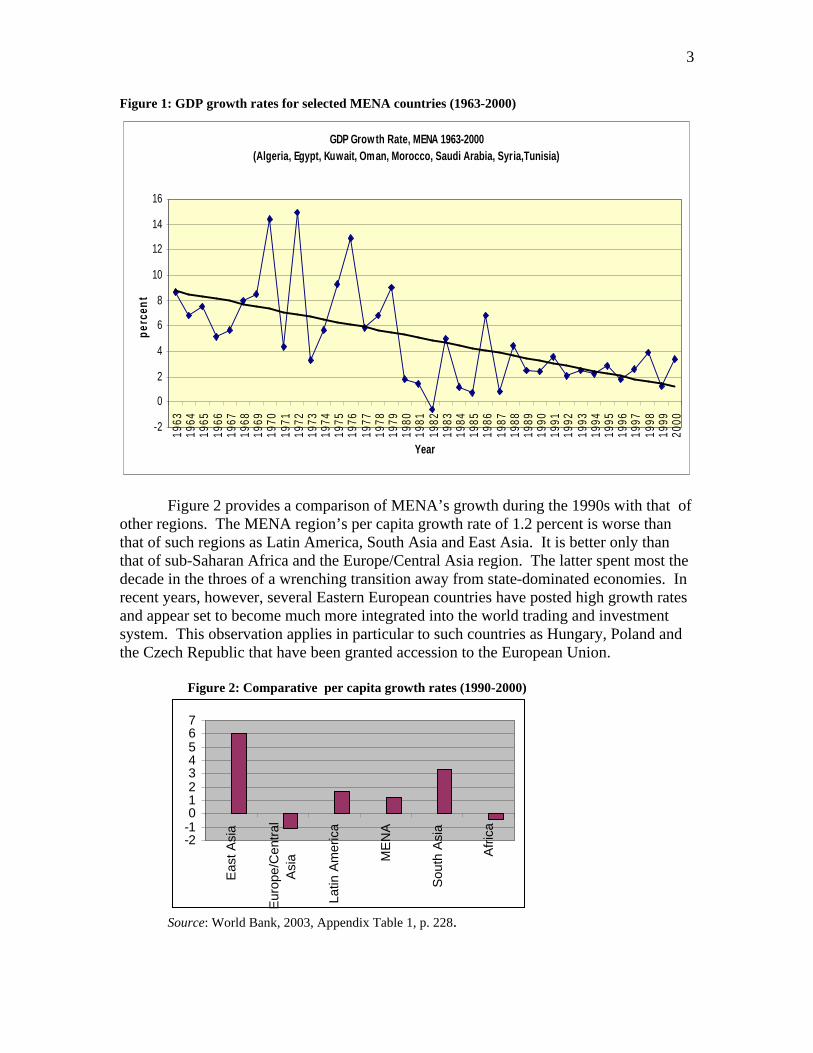
Figure 3: Unemployment rates in MENA (1980-2000)
Weak growth has been reflected as well in high unemployment. While there is a demographic aspect to this, in that the region’s fertility rates have been relatively high, there is no denying that slow overall economic growth has meant that the demand for labor, especially in the private sector, has failed to keep pace with the large numbers of people joining the labor force. Figure 3 shows how serious the problem of unemployment has become in the region. The average unemployment rate is over 14 percent currently with some countries, such as Algeria, featuring rates as high as 29 percent. Finally, it is instructive to consider the region’s performance in poverty reduction. Here the region appears to have done much better than its growth and employment situation would suggest (see table 1). Measured by the $1 per person per day criterion, the region’s poverty rate is around 2.8 percent currently. This is the lowest in comparison with other regions. Measured by the $2 criterion as well, MENA fares comparatively well although the absolute rate of poverty jumps to around 24 percent. However, the trend over time is not comforting. Between 1990 and 2000, there was an increase in poverty (by both criteria). If weak growth persists over the next decade or so, the poverty rate will continue to increase and the region will begin to look much worse in comparison with its own past as well as with several other regions. Table 1: Comparative poverty reduction performance (1990-2000) $1 poverty index $2 poverty index 1990 2000 1990 2000East Asia 29.4 14.5 68.5 48.3Europe/Central Asia 1.4 4.2 6.8 21.3Latin America 11 10.8 27.6 26.3MENA 2.1 2.8 21 24.4South Asia 41.5 31.9 86.3 77.7Africa 47.4 49 76 76.5Source: Global Economic Prospects, World Bank, 2004.
0
2
4
6
8
10
12
14
16
1980 1990 2000
per
cen
t o
f la
bo
r fo
rce
High-income countries
Middle-income countries
MENA
5
3. Trade and Foreign Investment Performance Trade performance
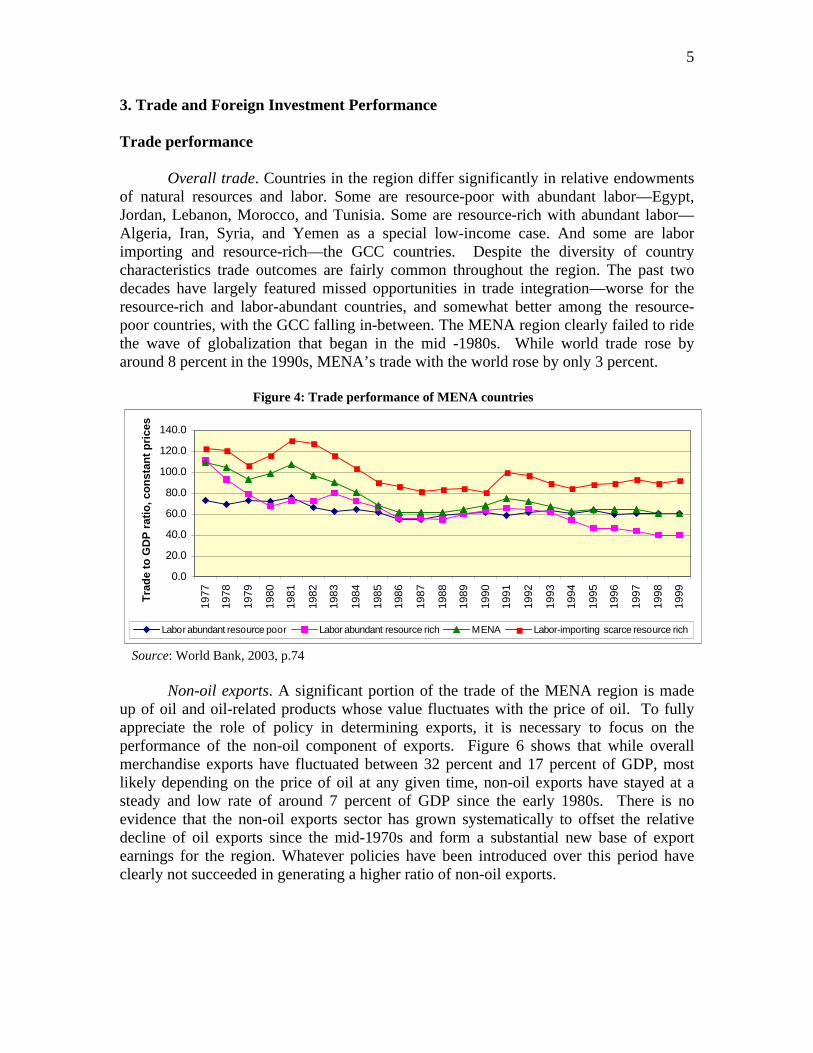
Overall trade. Countries in the region differ significantly in relative endowments of natural resources and labor. Some are resource-poor with abundant labor—Egypt, Jordan, Lebanon, Morocco, and Tunisia. Some are resource-rich with abundant labor—Algeria, Iran, Syria, and Yemen as a special low-income case. And some are labor importing and resource-rich—the GCC countries. Despite the diversity of country characteristics trade outcomes are fairly common throughout the region. The past two decades have largely featured missed opportunities in trade integration—worse for the resource-rich and labor-abundant countries, and somewhat better among the resource-poor countries, with the GCC falling in-between. The MENA region clearly failed to ride the wave of globalization that began in the mid -1980s. While world trade rose by around 8 percent in the 1990s, MENA’s trade with the world rose by only 3 percent. Figure 4: Trade performance of MENA countries
0.0
20.0
40.0
60.0
80.0
100.0
120.0
140.0
1977
1978
1979
1980
1981
1982
1983
1984
1985
1986
1987
1988
1989
1990
1991
1992
1993
1994
1995
1996
1997
1998
1999Tra
de
to G
DP
rat
io, c
on
stan
t p
rice
s
Labor abundant resource poor Labor abundant resource rich MENA Labor-importing scarce resource rich
Source: World Bank, 2003, p.74
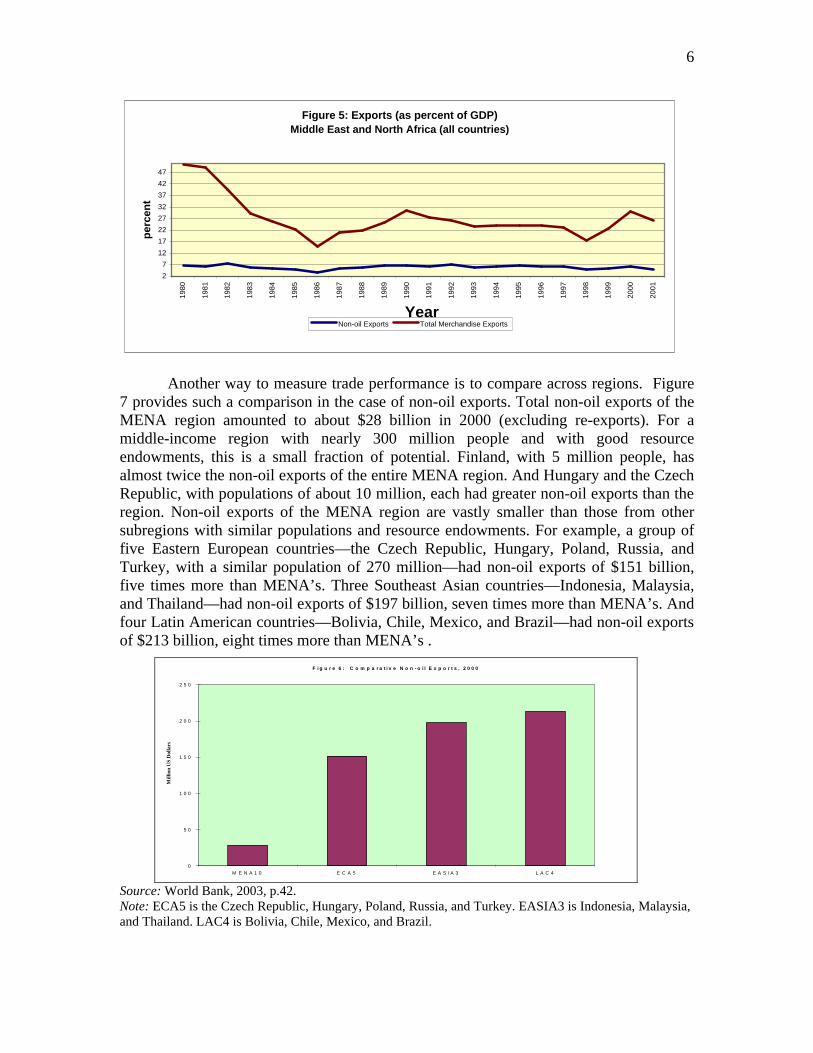
Non-oil exports. A significant portion of the trade of the MENA region is made up of oil and oil-related products whose value fluctuates with the price of oil. To fully appreciate the role of policy in determining exports, it is necessary to focus on the performance of the non-oil component of exports. Figure 6 shows that while overall merchandise exports have fluctuated between 32 percent and 17 percent of GDP, most likely depending on the price of oil at any given time, non-oil exports have stayed at a steady and low rate of around 7 percent of GDP since the early 1980s. There is no evidence that the non-oil exports sector has grown systematically to offset the relative decline of oil exports since the mid-1970s and form a substantial new base of export earnings for the region. Whatever policies have been introduced over this period have clearly not succeeded in generating a higher ratio of non-oil exports.
6
Another way to measure trade performance is to compare across regions. Figure 7 provides such a comparison in the case of non-oil exports. Total non-oil exports of the MENA region amounted to about $28 billion in 2000 (excluding re-exports). For a middle-income region with nearly 300 million people and with good resource endowments, this is a small fraction of potential. Finland, with 5 million people, has almost twice the non-oil exports of the entire MENA region. And Hungary and the Czech Republic, with populations of about 10 million, each had greater non-oil exports than the region. Non-oil exports of the MENA region are vastly smaller than those from other subregions with similar populations and resource endowments. For example, a group of five Eastern European countries—the Czech Republic, Hungary, Poland, Russia, and Turkey, with a similar population of 270 million—had non-oil exports of $151 billion, five times more than MENA’s. Three Southeast Asian countries—Indonesia, Malaysia, and Thailand—had non-oil exports of $197 billion, seven times more than MENA’s. And four Latin American countries—Bolivia, Chile, Mexico, and Brazil—had non-oil exports of $213 billion, eight times more than MENA’s .
F i g u r e 6 : C o m p a r a t i v e N o n - o i l E x p o r t s , 2 0 0 0
0
5 0
1 0 0
1 5 0
2 0 0
2 5 0
M E N A 1 0 E C A 5 E A S I A 3 L A C 4
Mill
ion
US
Dol
lars
Source: World Bank, 2003, p.42. Note: ECA5 is the Czech Republic, Hungary, Poland, Russia, and Turkey. EASIA3 is Indonesia, Malaysia, and Thailand. LAC4 is Bolivia, Chile, Mexico, and Brazil.
Figure 5: Exports (as percent of GDP)Middle East and North Africa (all countries)
2
7
12
17
22
27
32
37
42
4719
80
1981
1982
1983
1984
1985
1986
1987
1988
1989
1990
1991
1992
1993
1994
1995
1996
1997
1998
1999
2000
2001
Year
per
cen
t
Non-oil Exports Total Merchandise Exports
7
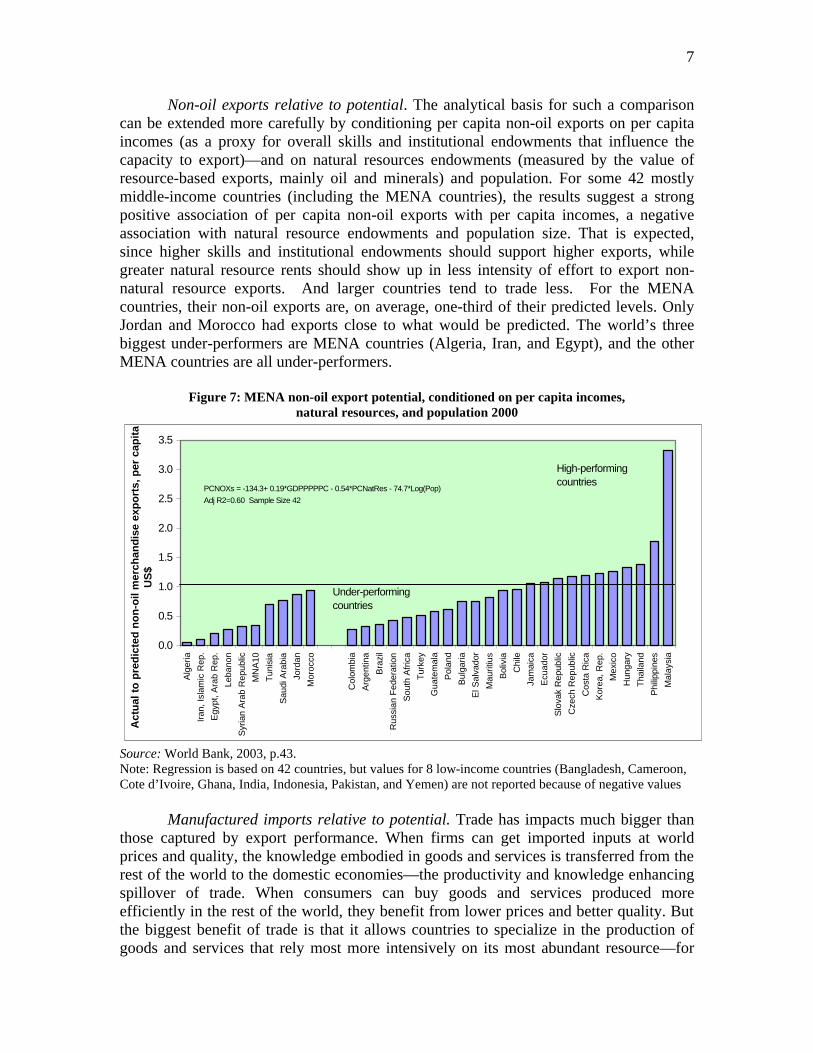
Non-oil exports relative to potential. The analytical basis for such a comparison can be extended more carefully by conditioning per capita non-oil exports on per capita incomes (as a proxy for overall skills and institutional endowments that influence the capacity to export)—and on natural resources endowments (measured by the value of resource-based exports, mainly oil and minerals) and population. For some 42 mostly middle-income countries (including the MENA countries), the results suggest a strong positive association of per capita non-oil exports with per capita incomes, a negative association with natural resource endowments and population size. That is expected, since higher skills and institutional endowments should support higher exports, while greater natural resource rents should show up in less intensity of effort to export non-natural resource exports. And larger countries tend to trade less. For the MENA countries, their non-oil exports are, on average, one-third of their predicted levels. Only Jordan and Morocco had exports close to what would be predicted. The world’s three biggest under-performers are MENA countries (Algeria, Iran, and Egypt), and the other MENA countries are all under-performers.
Figure 7: MENA non-oil export potential, conditioned on per capita incomes, natural resources, and population 2000
0.0
0.5
1.0
1.5
2.0
2.5
3.0
3.5
Alg
eria
Iran
, Isl
amic
Rep
.
Egy
pt, A
rab
Rep
.
Leba
non
Syr
ian
Ara
b R
epub
lic
MN
A10
Tun
isia
Sau
di A
rabi
a
Jord
an
Mor
occo
Col
ombi
a
Arg
entin
a
Bra
zil
Rus
sian
Fed
erat
ion
Sou
th A
fric
a
Tur
key
Gua
tem
ala
Pol
and
Bul
garia
El S
alva
dor
Mau
ritiu
s
Bol
ivia
Chi
le
Jam
aica
Ecu
ador
Slo
vak
Rep
ublic
Cze
ch R
epub
lic
Cos
ta R
ica
Kor
ea, R
ep.
Mex
ico
Hun
gary
Tha
iland
Phi
lippi
nes
Mal
aysi
a
Act
ual
to
pre
dic
ted
no
n-o
il m
erch
and
ise
exp
ort
s, p
er c
apit
a U
S$
PCNOXs = -134.3+ 0.19*GDPPPPPC - 0.54*PCNatRes - 74.7*Log(Pop)Adj R2=0.60 Sample Size 42
High-performing countries
Under-performing countries
Source: World Bank, 2003, p.43. Note: Regression is based on 42 countries, but values for 8 low-income countries (Bangladesh, Cameroon, Cote d’Ivoire, Ghana, India, Indonesia, Pakistan, and Yemen) are not reported because of negative values
Manufactured imports relative to potential. Trade has impacts much bigger than those captured by export performance. When firms can get imported inputs at world prices and quality, the knowledge embodied in goods and services is transferred from the rest of the world to the domestic economies—the productivity and knowledge enhancing spillover of trade. When consumers can buy goods and services produced more efficiently in the rest of the world, they benefit from lower prices and better quality. But the biggest benefit of trade is that it allows countries to specialize in the production of goods and services that rely most more intensively on its most abundant resource—for
8
MENA, labor—and import more of its least abundant resource—for MENA, capital and, increasingly, knowledge-intensive goods and services. Barriers that impede trade therefore impede potential gains in knowledge, consumer welfare, and labor productivity.
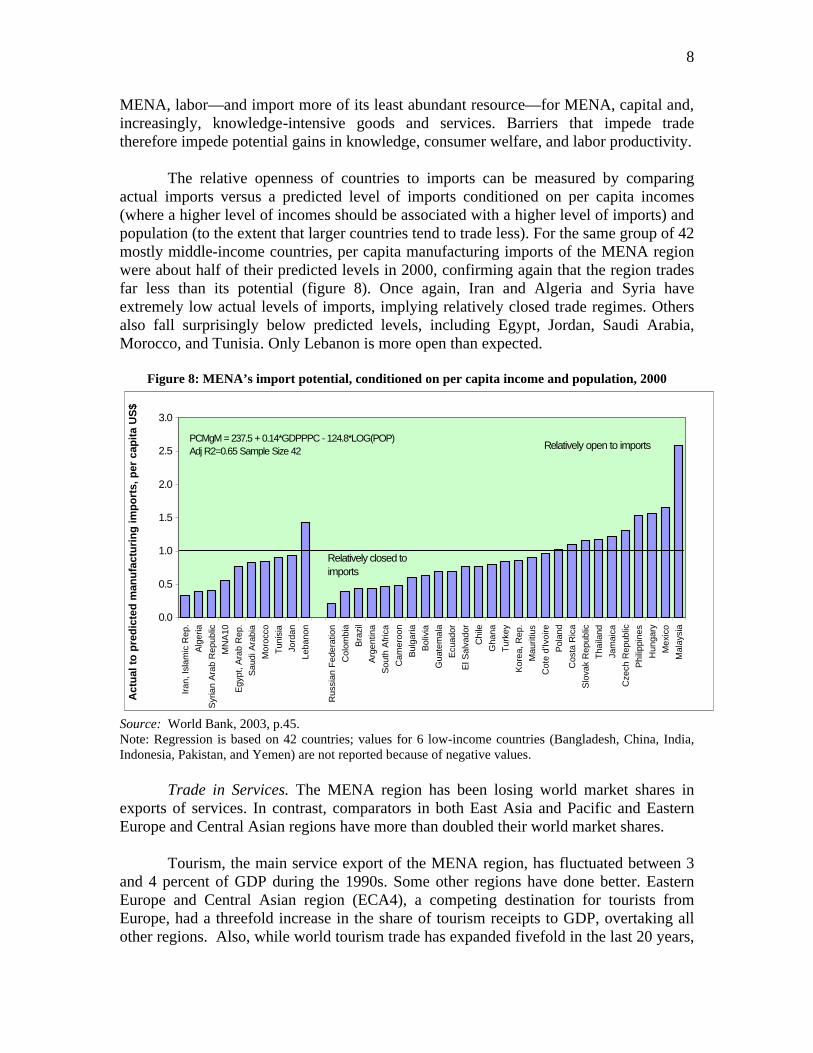
The relative openness of countries to imports can be measured by comparing actual imports versus a predicted level of imports conditioned on per capita incomes (where a higher level of incomes should be associated with a higher level of imports) and population (to the extent that larger countries tend to trade less). For the same group of 42 mostly middle-income countries, per capita manufacturing imports of the MENA region were about half of their predicted levels in 2000, confirming again that the region trades far less than its potential (figure 8). Once again, Iran and Algeria and Syria have extremely low actual levels of imports, implying relatively closed trade regimes. Others also fall surprisingly below predicted levels, including Egypt, Jordan, Saudi Arabia, Morocco, and Tunisia. Only Lebanon is more open than expected.
Figure 8: MENA’s import potential, conditioned on per capita income and population, 2000
0.0
0.5
1.0
1.5
2.0
2.5
3.0
Iran
, Isl
amic
Rep
.A
lger
iaS
yria
n A
rab
Rep
ublic
MN
A10
Egy
pt, A
rab
Rep
.S
audi
Ara
bia
Mor
occo
Tun
isia
Jord
anLe
bano
n
Rus
sian
Fed
erat
ion
Col
ombi
aB
razi
lA
rgen
tina
Sou
th A
fric
a
Cam
eroo
nB
ulga
riaB
oliv
iaG
uate
mal
aE
cuad
orE
l Sal
vado
rC
hile
Gha
naT
urke
yK
orea
, Rep
.M
aurit
ius
Cot
e d'
Ivoi
reP
olan
dC
osta
Ric
aS
lova
k R
epub
licT
haila
ndJa
mai
caC
zech
Rep
ublic
Phi
lippi
nes
Hun
gary
Mex
ico
Mal
aysi
a
Act
ual
to
pre
dic
ted
man
ufa
ctu
rin
g im
po
rts,
per
cap
ita
US
$
PCMgM = 237.5 + 0.14*GDPPPC - 124.8*LOG(POP)Adj R2=0.65 Sample Size 42 Relatively open to imports
Relatively closed to imports
Source: World Bank, 2003, p.45. Note: Regression is based on 42 countries; values for 6 low-income countries (Bangladesh, China, India, Indonesia, Pakistan, and Yemen) are not reported because of negative values.
Trade in Services. The MENA region has been losing world market shares in exports of services. In contrast, comparators in both East Asia and Pacific and Eastern Europe and Central Asian regions have more than doubled their world market shares.
Tourism, the main service export of the MENA region, has fluctuated between 3
and 4 percent of GDP during the 1990s. Some other regions have done better. Eastern Europe and Central Asian region (ECA4), a competing destination for tourists from Europe, had a threefold increase in the share of tourism receipts to GDP, overtaking all other regions. Also, while world tourism trade has expanded fivefold in the last 20 years,
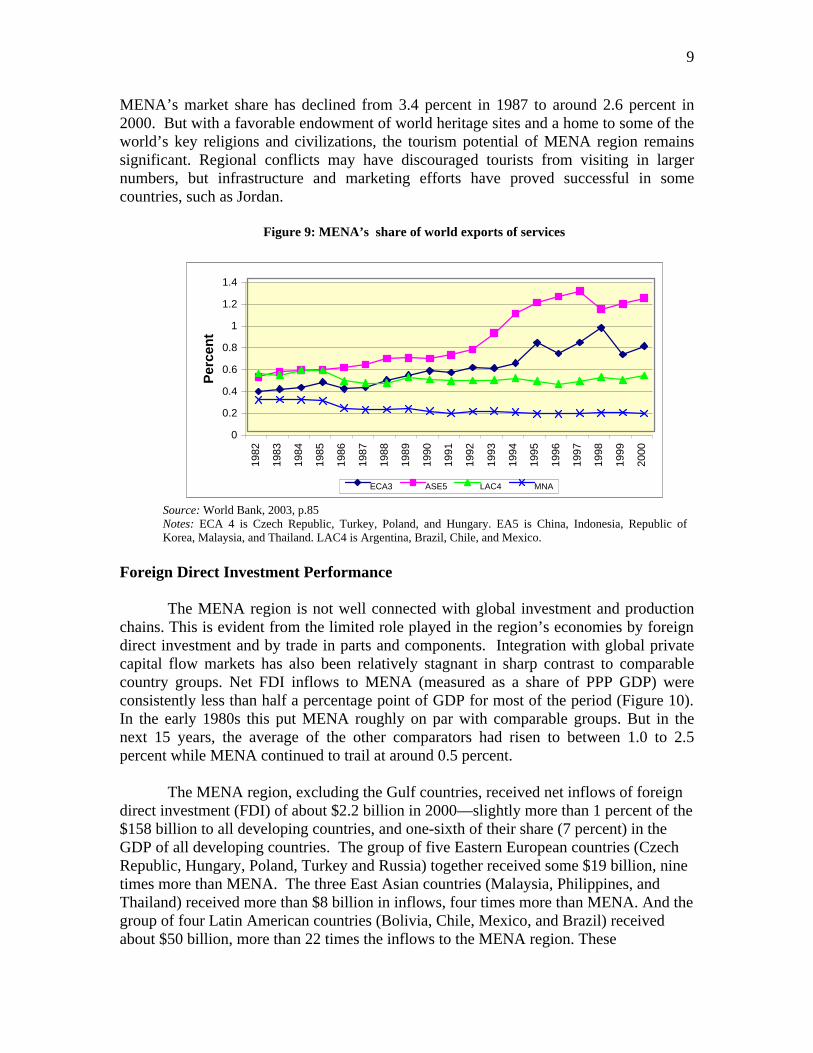
9
MENA’s market share has declined from 3.4 percent in 1987 to around 2.6 percent in 2000. But with a favorable endowment of world heritage sites and a home to some of the world’s key religions and civilizations, the tourism potential of MENA region remains significant. Regional conflicts may have discouraged tourists from visiting in larger numbers, but infrastructure and marketing efforts have proved successful in some countries, such as Jordan.
Figure 9: MENA’s share of world exports of services
0
0.2
0.4
0.6
0.8
1
1.2
1.4
1982
1983
1984
1985
1986
1987
1988
1989
1990
1991
1992
1993
1994
1995
1996
1997
1998
1999
2000
Per
cen
t
ECA3 ASE5 LAC4 MNA
Source: World Bank, 2003, p.85 Notes: ECA 4 is Czech Republic, Turkey, Poland, and Hungary. EA5 is China, Indonesia, Republic of Korea, Malaysia, and Thailand. LAC4 is Argentina, Brazil, Chile, and Mexico.
Foreign Direct Investment Performance
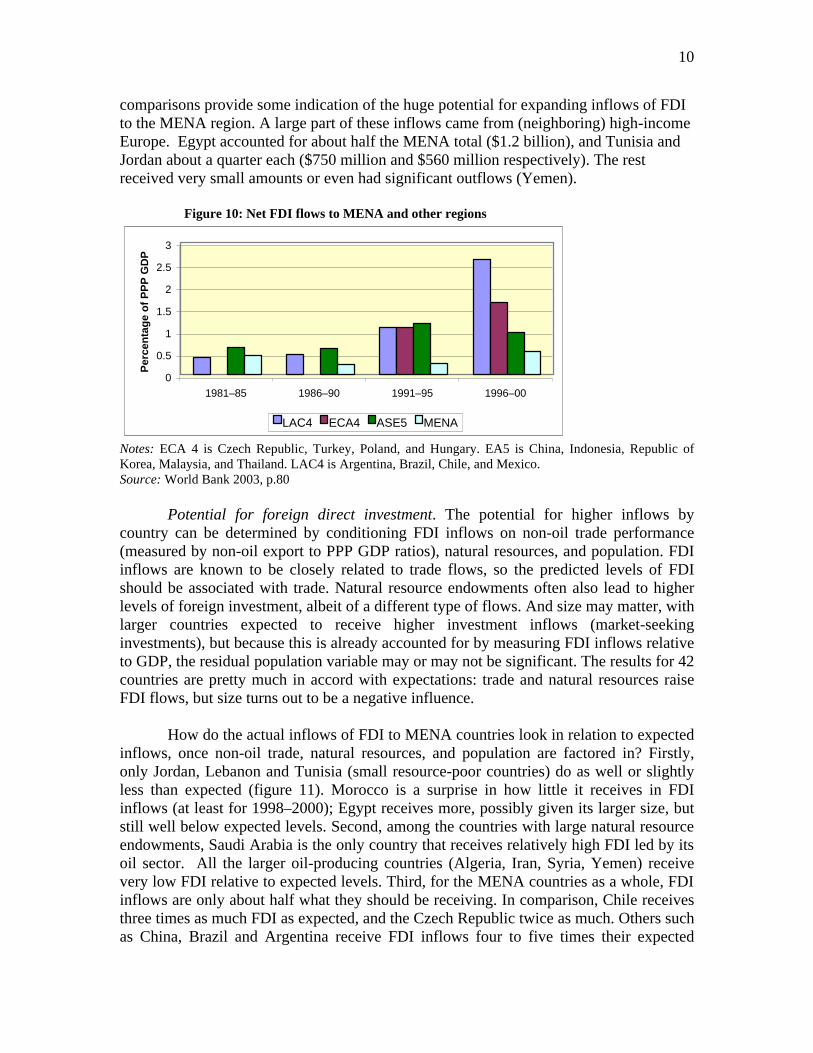
The MENA region is not well connected with global investment and production chains. This is evident from the limited role played in the region’s economies by foreign direct investment and by trade in parts and components. Integration with global private capital flow markets has also been relatively stagnant in sharp contrast to comparable country groups. Net FDI inflows to MENA (measured as a share of PPP GDP) were consistently less than half a percentage point of GDP for most of the period (Figure 10). In the early 1980s this put MENA roughly on par with comparable groups. But in the next 15 years, the average of the other comparators had risen to between 1.0 to 2.5 percent while MENA continued to trail at around 0.5 percent.
The MENA region, excluding the Gulf countries, received net inflows of foreign direct investment (FDI) of about $2.2 billion in 2000—slightly more than 1 percent of the $158 billion to all developing countries, and one-sixth of their share (7 percent) in the GDP of all developing countries. The group of five Eastern European countries (Czech Republic, Hungary, Poland, Turkey and Russia) together received some $19 billion, nine times more than MENA. The three East Asian countries (Malaysia, Philippines, and Thailand) received more than $8 billion in inflows, four times more than MENA. And the group of four Latin American countries (Bolivia, Chile, Mexico, and Brazil) received about $50 billion, more than 22 times the inflows to the MENA region. These
10
comparisons provide some indication of the huge potential for expanding inflows of FDI to the MENA region. A large part of these inflows came from (neighboring) high-income Europe. Egypt accounted for about half the MENA total ($1.2 billion), and Tunisia and Jordan about a quarter each ($750 million and $560 million respectively). The rest received very small amounts or even had significant outflows (Yemen).
Figure 10: Net FDI flows to MENA and other regions
0
0.5
1
1.5
2
2.5
3
1981–85 1986–90 1991–95 1996–00
Per
cen
tag
e o
f P
PP
GD
P
LAC4 ECA4 ASE5 MENA
Notes: ECA 4 is Czech Republic, Turkey, Poland, and Hungary. EA5 is China, Indonesia, Republic of Korea, Malaysia, and Thailand. LAC4 is Argentina, Brazil, Chile, and Mexico. Source: World Bank 2003, p.80
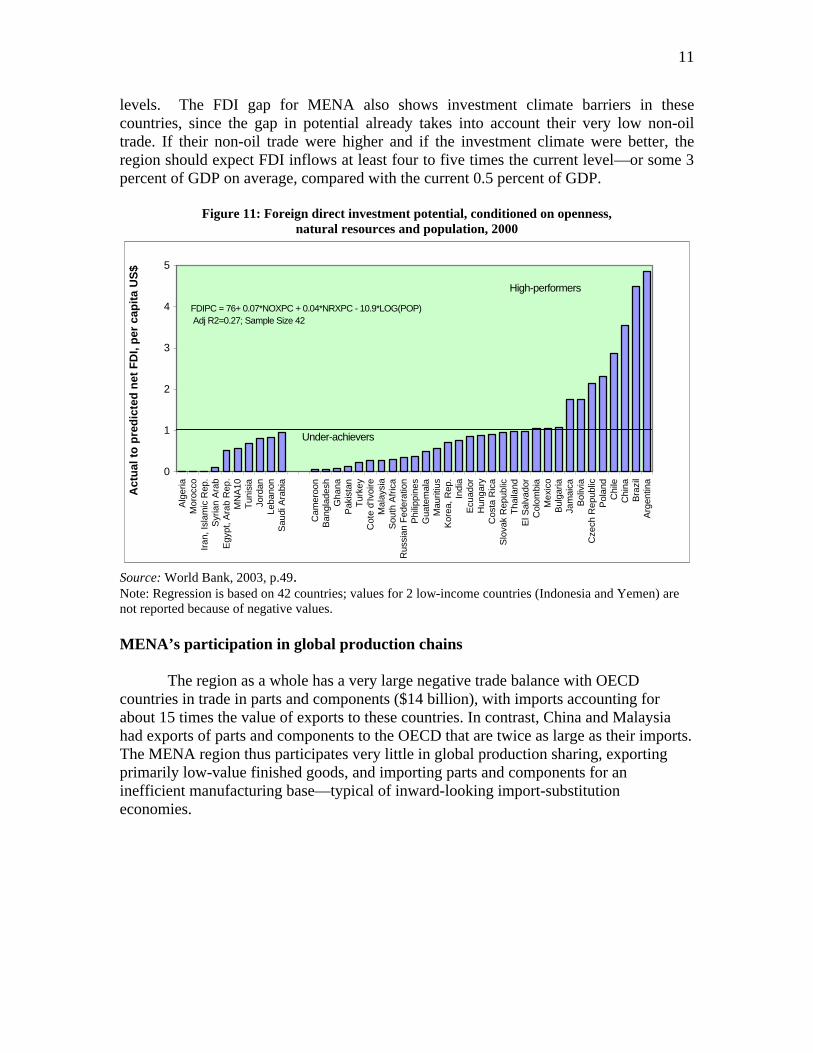
Potential for foreign direct investment. The potential for higher inflows by country can be determined by conditioning FDI inflows on non-oil trade performance (measured by non-oil export to PPP GDP ratios), natural resources, and population. FDI inflows are known to be closely related to trade flows, so the predicted levels of FDI should be associated with trade. Natural resource endowments often also lead to higher levels of foreign investment, albeit of a different type of flows. And size may matter, with larger countries expected to receive higher investment inflows (market-seeking investments), but because this is already accounted for by measuring FDI inflows relative to GDP, the residual population variable may or may not be significant. The results for 42 countries are pretty much in accord with expectations: trade and natural resources raise FDI flows, but size turns out to be a negative influence.
How do the actual inflows of FDI to MENA countries look in relation to expected inflows, once non-oil trade, natural resources, and population are factored in? Firstly, only Jordan, Lebanon and Tunisia (small resource-poor countries) do as well or slightly less than expected (figure 11). Morocco is a surprise in how little it receives in FDI inflows (at least for 1998–2000); Egypt receives more, possibly given its larger size, but still well below expected levels. Second, among the countries with large natural resource endowments, Saudi Arabia is the only country that receives relatively high FDI led by its oil sector. All the larger oil-producing countries (Algeria, Iran, Syria, Yemen) receive very low FDI relative to expected levels. Third, for the MENA countries as a whole, FDI inflows are only about half what they should be receiving. In comparison, Chile receives three times as much FDI as expected, and the Czech Republic twice as much. Others such as China, Brazil and Argentina receive FDI inflows four to five times their expected
11
levels. The FDI gap for MENA also shows investment climate barriers in these countries, since the gap in potential already takes into account their very low non-oil trade. If their non-oil trade were higher and if the investment climate were better, the region should expect FDI inflows at least four to five times the current level—or some 3 percent of GDP on average, compared with the current 0.5 percent of GDP.
Figure 11: Foreign direct investment potential, conditioned on openness, natural resources and population, 2000
0
1
2
3
4
5
Alg
eria
Mor
occo
Iran
, Isl
amic
Rep
.S
yria
n A
rab
Egy
pt, A
rab
Rep
.M
NA
10T
unis
iaJo
rdan
Leba
non
Sau
di A
rabi
a
Cam
eroo
nB
angl
ades
hG
hana
Pak
ista
nT
urke
yC
ote
d'Iv
oire
Mal
aysi
aS
outh
Afr
ica
Rus
sian
Fed
erat
ion
Phi
lippi
nes
Gua
tem
ala
Mau
ritiu
sK
orea
, Rep
.In
dia
Ecu
ador
Hun
gary
Cos
ta R
ica
Slo
vak
Rep
ublic
Tha
iland
El S
alva
dor
Col
ombi
aM
exic
oB
ulga
riaJa
mai
caB
oliv
iaC
zech
Rep
ublic
Pol
and
Chi
leC
hina
Bra
zil
Arg
entin
a
Act
ual
to
pre
dic
ted
net
FD
I, p
er c
apit
a U
S$
FDIPC = 76+ 0.07*NOXPC + 0.04*NRXPC - 10.9*LOG(POP) Adj R2=0.27; Sample Size 42
High-performers
Under-achievers
Source: World Bank, 2003, p.49. Note: Regression is based on 42 countries; values for 2 low-income countries (Indonesia and Yemen) are not reported because of negative values. MENA’s participation in global production chains
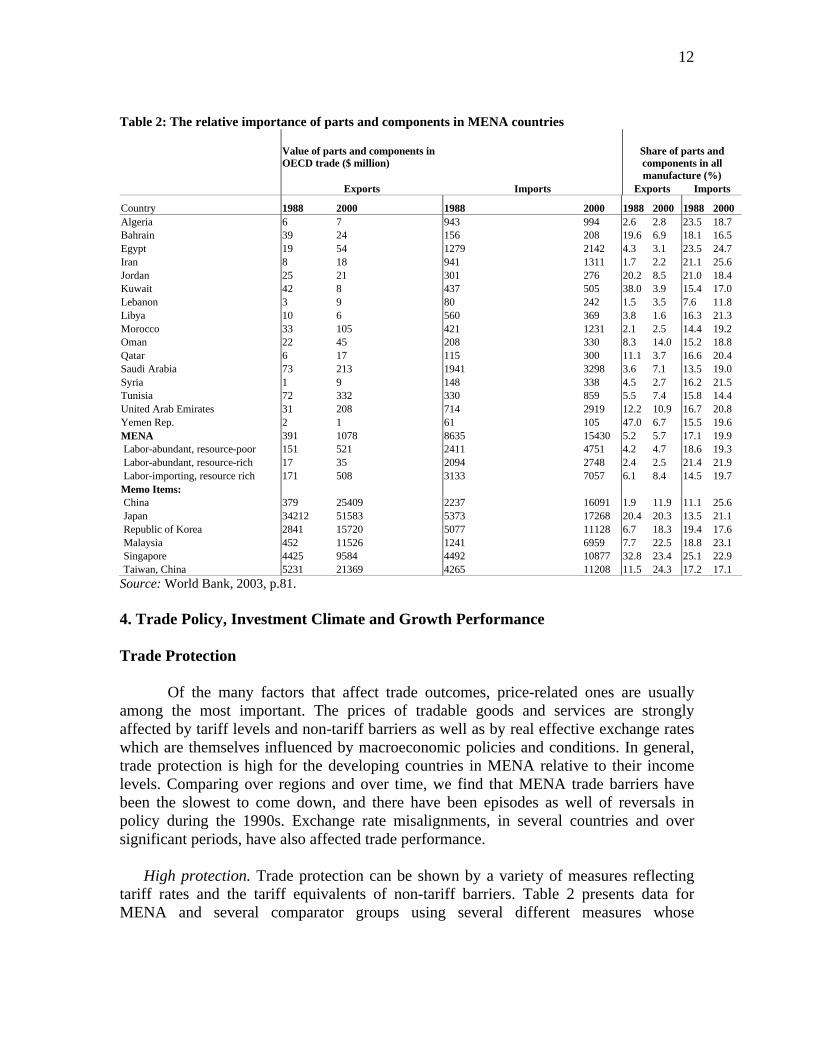
The region as a whole has a very large negative trade balance with OECD countries in trade in parts and components ($14 billion), with imports accounting for about 15 times the value of exports to these countries. In contrast, China and Malaysia had exports of parts and components to the OECD that are twice as large as their imports. The MENA region thus participates very little in global production sharing, exporting primarily low-value finished goods, and importing parts and components for an inefficient manufacturing base—typical of inward-looking import-substitution economies.
12
Table 2: The relative importance of parts and components in MENA countries
Value of parts and components in OECD trade ($ million)
Share of parts and components in all manufacture (%)
Exports Imports Exports Imports
Country 1988 2000 1988 2000 1988 2000 1988 2000 Algeria 6 7 943 994 2.6 2.8 23.5 18.7 Bahrain 39 24 156 208 19.6 6.9 18.1 16.5 Egypt 19 54 1279 2142 4.3 3.1 23.5 24.7 Iran 8 18 941 1311 1.7 2.2 21.1 25.6 Jordan 25 21 301 276 20.2 8.5 21.0 18.4 Kuwait 42 8 437 505 38.0 3.9 15.4 17.0 Lebanon 3 9 80 242 1.5 3.5 7.6 11.8 Libya 10 6 560 369 3.8 1.6 16.3 21.3 Morocco 33 105 421 1231 2.1 2.5 14.4 19.2 Oman 22 45 208 330 8.3 14.0 15.2 18.8 Qatar 6 17 115 300 11.1 3.7 16.6 20.4 Saudi Arabia 73 213 1941 3298 3.6 7.1 13.5 19.0 Syria 1 9 148 338 4.5 2.7 16.2 21.5 Tunisia 72 332 330 859 5.5 7.4 15.8 14.4 United Arab Emirates 31 208 714 2919 12.2 10.9 16.7 20.8 Yemen Rep. 2 1 61 105 47.0 6.7 15.5 19.6 MENA 391 1078 8635 15430 5.2 5.7 17.1 19.9 Labor-abundant, resource-poor 151 521 2411 4751 4.2 4.7 18.6 19.3 Labor-abundant, resource-rich 17 35 2094 2748 2.4 2.5 21.4 21.9 Labor-importing, resource rich 171 508 3133 7057 6.1 8.4 14.5 19.7 Memo Items: China 379 25409 2237 16091 1.9 11.9 11.1 25.6 Japan 34212 51583 5373 17268 20.4 20.3 13.5 21.1 Republic of Korea 2841 15720 5077 11128 6.7 18.3 19.4 17.6 Malaysia 452 11526 1241 6959 7.7 22.5 18.8 23.1 Singapore 4425 9584 4492 10877 32.8 23.4 25.1 22.9 Taiwan, China 5231 21369 4265 11208 11.5 24.3 17.2 17.1 Source: World Bank, 2003, p.81. 4. Trade Policy, Investment Climate and Growth Performance Trade Protection
Of the many factors that affect trade outcomes, price-related ones are usually among the most important. The prices of tradable goods and services are strongly affected by tariff levels and non-tariff barriers as well as by real effective exchange rates which are themselves influenced by macroeconomic policies and conditions. In general, trade protection is high for the developing countries in MENA relative to their income levels. Comparing over regions and over time, we find that MENA trade barriers have been the slowest to come down, and there have been episodes as well of reversals in policy during the 1990s. Exchange rate misalignments, in several countries and over significant periods, have also affected trade performance.
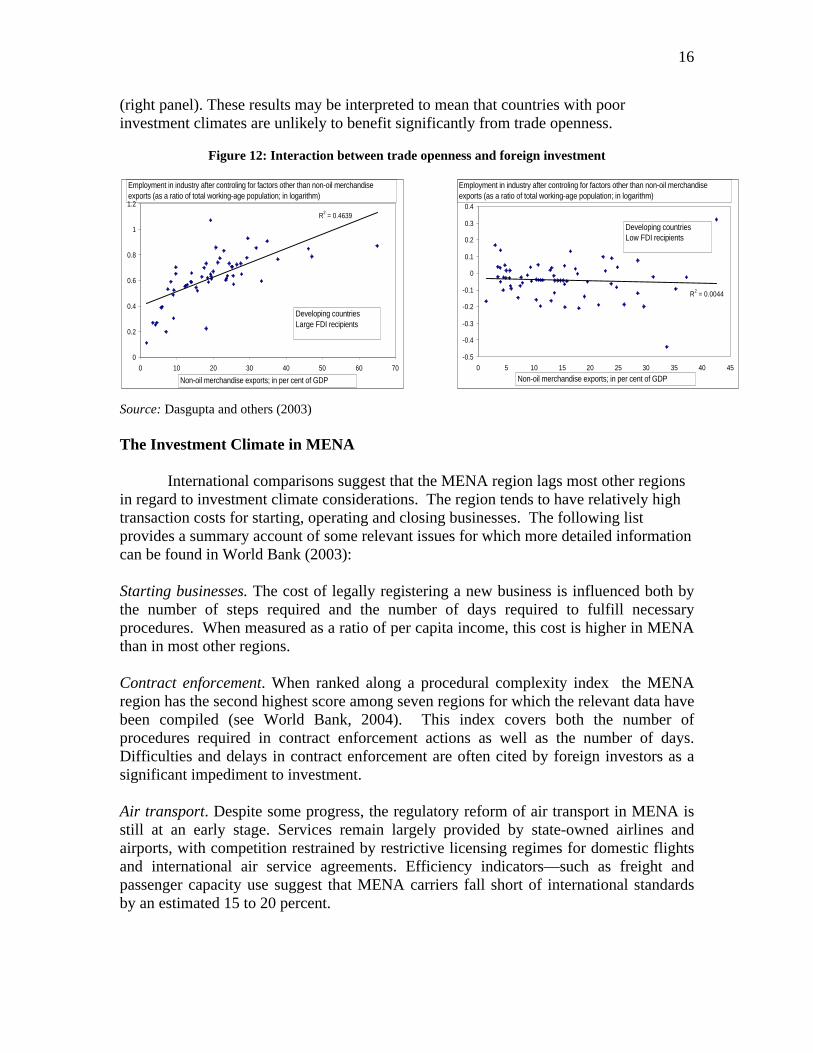
High protection. Trade protection can be shown by a variety of measures reflecting tariff rates and the tariff equivalents of non-tariff barriers. Table 2 presents data for MENA and several comparator groups using several different measures whose
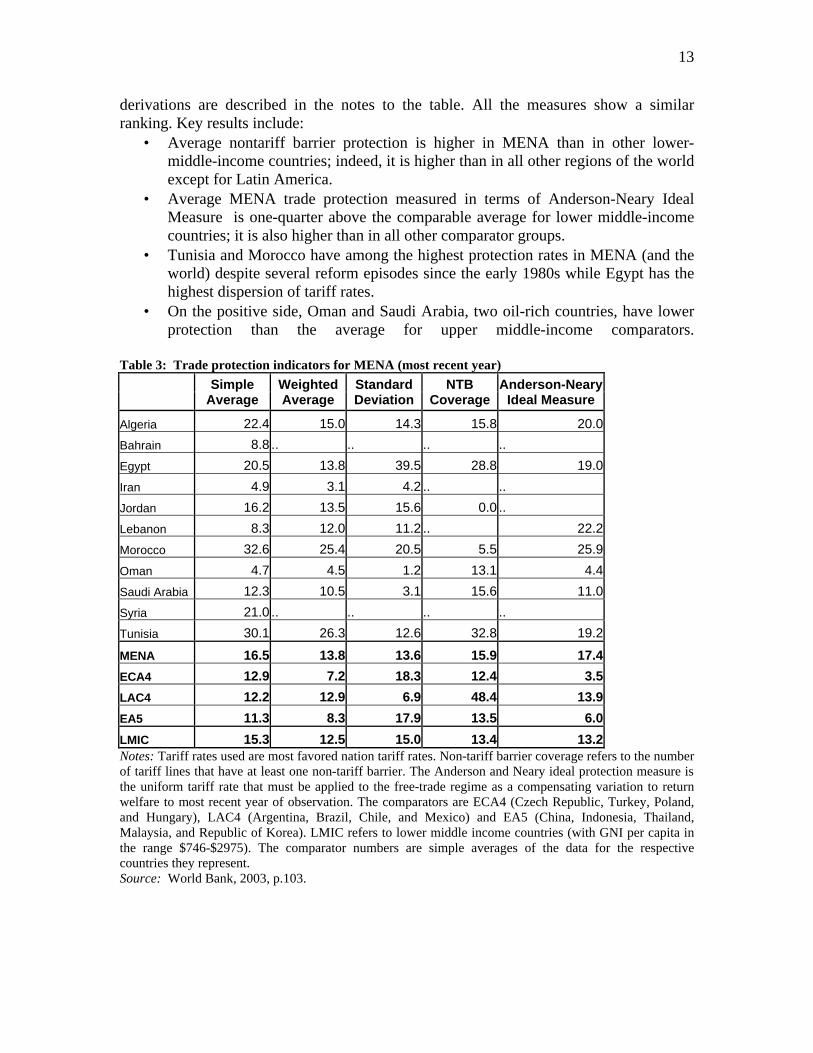
13
derivations are described in the notes to the table. All the measures show a similar ranking. Key results include:
• Average nontariff barrier protection is higher in MENA than in other lower-middle-income countries; indeed, it is higher than in all other regions of the world except for Latin America.
• Average MENA trade protection measured in terms of Anderson-Neary Ideal Measure is one-quarter above the comparable average for lower middle-income countries; it is also higher than in all other comparator groups.
• Tunisia and Morocco have among the highest protection rates in MENA (and the world) despite several reform episodes since the early 1980s while Egypt has the highest dispersion of tariff rates.
• On the positive side, Oman and Saudi Arabia, two oil-rich countries, have lower protection than the average for upper middle-income comparators.
Table 3: Trade protection indicators for MENA (most recent year)
Simple
Average Weighted Average
Standard Deviation
NTB Coverage
Anderson-Neary Ideal Measure
Algeria 22.4 15.0 14.3 15.8 20.0
Bahrain 8.8 .. .. .. ..
Egypt 20.5 13.8 39.5 28.8 19.0
Iran 4.9 3.1 4.2 .. ..
Jordan 16.2 13.5 15.6 0.0 ..
Lebanon 8.3 12.0 11.2 .. 22.2
Morocco 32.6 25.4 20.5 5.5 25.9
Oman 4.7 4.5 1.2 13.1 4.4
Saudi Arabia 12.3 10.5 3.1 15.6 11.0
Syria 21.0 .. .. .. ..
Tunisia 30.1 26.3 12.6 32.8 19.2
MENA 16.5 13.8 13.6 15.9 17.4
ECA4 12.9 7.2 18.3 12.4 3.5
LAC4 12.2 12.9 6.9 48.4 13.9
EA5 11.3 8.3 17.9 13.5 6.0
LMIC 15.3 12.5 15.0 13.4 13.2 Notes: Tariff rates used are most favored nation tariff rates. Non-tariff barrier coverage refers to the number of tariff lines that have at least one non-tariff barrier. The Anderson and Neary ideal protection measure is the uniform tariff rate that must be applied to the free-trade regime as a compensating variation to return welfare to most recent year of observation. The comparators are ECA4 (Czech Republic, Turkey, Poland, and Hungary), LAC4 (Argentina, Brazil, Chile, and Mexico) and EA5 (China, Indonesia, Thailand, Malaysia, and Republic of Korea). LMIC refers to lower middle income countries (with GNI per capita in the range $746-$2975). The comparator numbers are simple averages of the data for the respective countries they represent. Source: World Bank, 2003, p.103.
14
With respect to non-tariff barriers, the typical experience in recent years is one of improvement. In Tunisia, extensive quantitative restrictions (affecting some 90 percent of domestic output) have progressively been reduced (textiles, passenger cars, agricultural products) in the 1990s. In Morocco, most quantitative restrictions have been eliminated. In Algeria, quantitative restrictions have been reduced although temporary reversals occur and prior authorization lists still exist for some items. In Jordan, removal of quantitative restrictions was the main item of trade liberalization in 1988 and reduced coverage from 40 percent to 7 percent of production; most remaining quantitative restrictions have been eliminated since 1995. In Egypt, import licensing was eliminated in 1993 and the scope of quantitative restrictions progressively reduced. In Lebanon, some import licensing and multiple authorizations remain. Syria has several lists of goods with import eligibility requirements (public sector, private sector, and 2 negative or banned lists) with a general licensing requirement for all imports. Exchange Rate Management
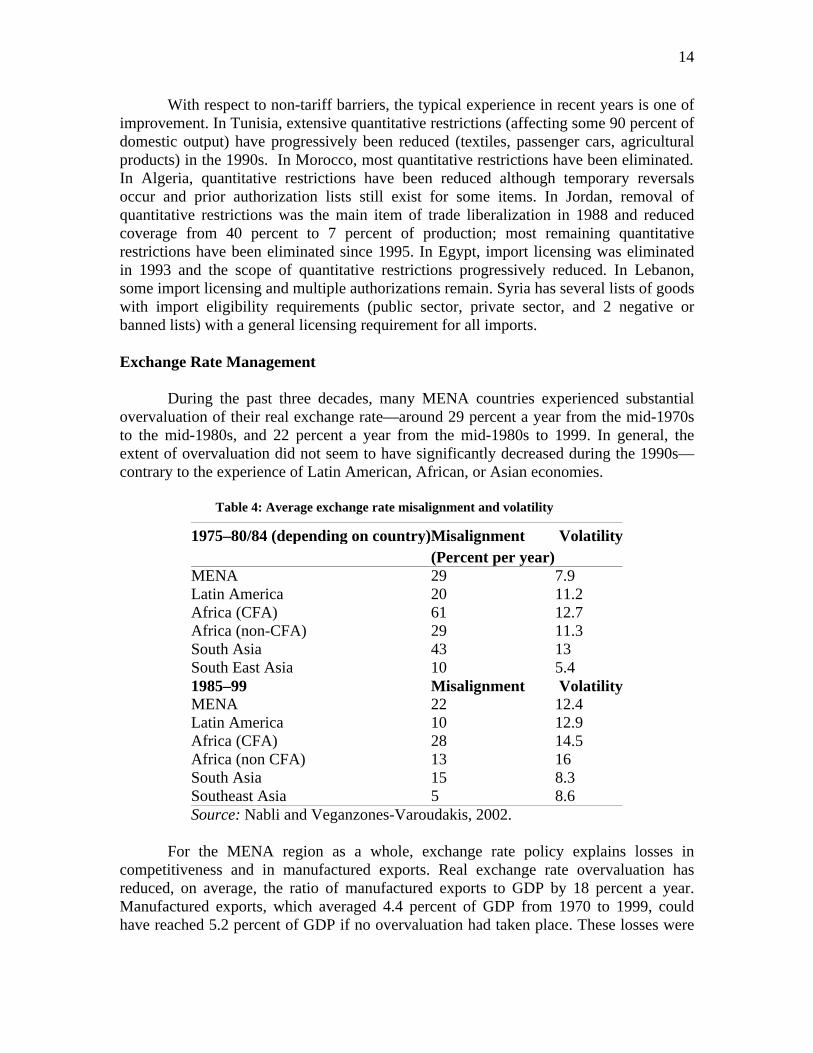
During the past three decades, many MENA countries experienced substantial overvaluation of their real exchange rate—around 29 percent a year from the mid-1970s to the mid-1980s, and 22 percent a year from the mid-1980s to 1999. In general, the extent of overvaluation did not seem to have significantly decreased during the 1990s—contrary to the experience of Latin American, African, or Asian economies.
Table 4: Average exchange rate misalignment and volatility
1975–80/84 (depending on country) Misalignment Volatility (Percent per year) MENA 29 7.9 Latin America 20 11.2 Africa (CFA) 61 12.7 Africa (non-CFA) 29 11.3 South Asia 43 13 South East Asia 10 5.4 1985–99 Misalignment VolatilityMENA 22 12.4 Latin America 10 12.9 Africa (CFA) 28 14.5 Africa (non CFA) 13 16 South Asia 15 8.3 Southeast Asia 5 8.6 Source: Nabli and Veganzones-Varoudakis, 2002.
For the MENA region as a whole, exchange rate policy explains losses in
competitiveness and in manufactured exports. Real exchange rate overvaluation has reduced, on average, the ratio of manufactured exports to GDP by 18 percent a year. Manufactured exports, which averaged 4.4 percent of GDP from 1970 to 1999, could have reached 5.2 percent of GDP if no overvaluation had taken place. These losses were
15
more concentrated in the 1970s and 1980s than in the 1990s, due to the higher overvaluation of the currencies during those two sub-periods.
Finally, a significant reason for the persistent misalignment and over-valuation of exchange rates is the prevalence of pegged or fixed exchange rate practices. Most MENA countries have had de facto or formal pegged nominal exchange rates, with only some recent changes towards floating exchange rates (as in Egypt in 2003). This is related to a general fear of floating. While there may have been gains in terms of reduced inflation, the trade-off clearly has been to hurt GDP growth and exports. The Critical Role of the Investment Climate Trade barriers and overvalued exchange rates impede growth in part by restricting domestic expansion into potential export areas and in part by constraining the inward flow of knowledge embodied in new products and services. However, they are not the only such impediments. The process of growth via trade expansion involves a phase of investment supply response that is influenced by a broad range of considerations that are sometimes grouped together under the label of “investment climate.” They include the transaction costs encountered in trade-related business activities such as clearing goods from customs and shipping goods overseas, the expenses involved in routine business operations for telecommunications and electricity, and the burden of regulations involved in starting a business, hiring and firing labor, and closing down a business. They can also refer to aspects of governance, such as corruption, the strength of property rights and adherence to the rule of law.4
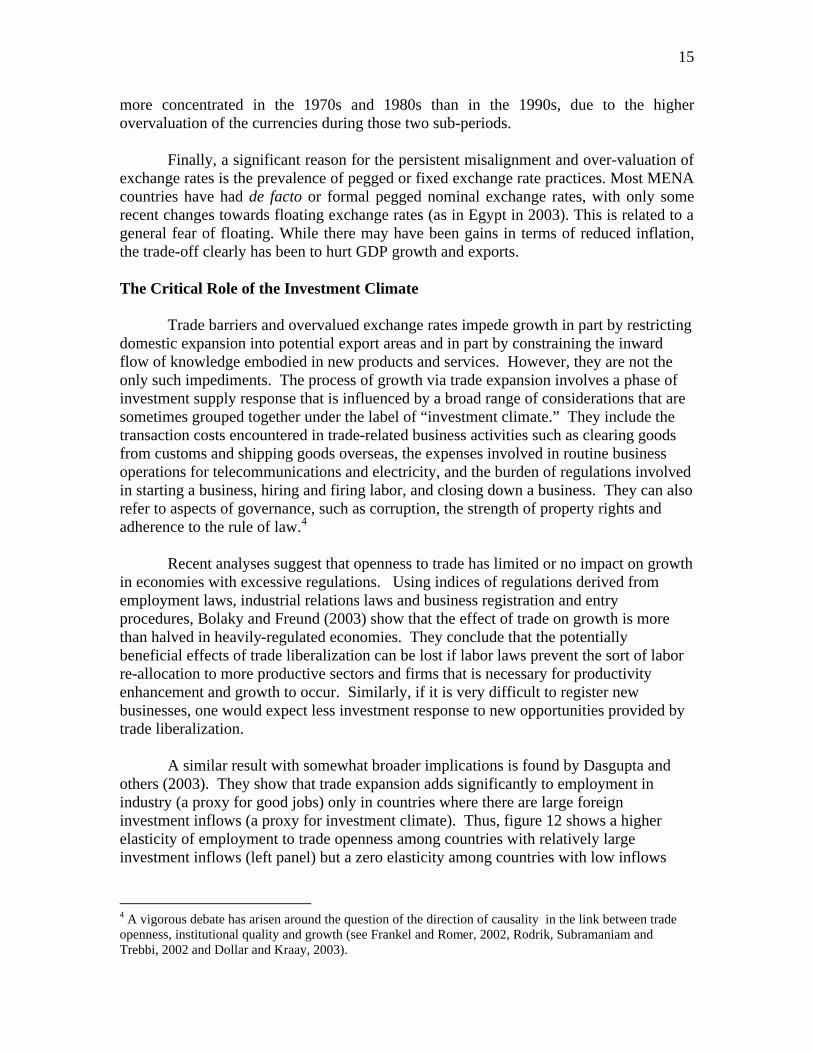
Recent analyses suggest that openness to trade has limited or no impact on growth in economies with excessive regulations. Using indices of regulations derived from employment laws, industrial relations laws and business registration and entry procedures, Bolaky and Freund (2003) show that the effect of trade on growth is more than halved in heavily-regulated economies. They conclude that the potentially beneficial effects of trade liberalization can be lost if labor laws prevent the sort of labor re-allocation to more productive sectors and firms that is necessary for productivity enhancement and growth to occur. Similarly, if it is very difficult to register new businesses, one would expect less investment response to new opportunities provided by trade liberalization. A similar result with somewhat broader implications is found by Dasgupta and others (2003). They show that trade expansion adds significantly to employment in industry (a proxy for good jobs) only in countries where there are large foreign investment inflows (a proxy for investment climate). Thus, figure 12 shows a higher elasticity of employment to trade openness among countries with relatively large investment inflows (left panel) but a zero elasticity among countries with low inflows
4 A vigorous debate has arisen around the question of the direction of causality in the link between trade openness, institutional quality and growth (see Frankel and Romer, 2002, Rodrik, Subramaniam and Trebbi, 2002 and Dollar and Kraay, 2003).
16
(right panel). These results may be interpreted to mean that countries with poor investment climates are unlikely to benefit significantly from trade openness.
Figure 12: Interaction between trade openness and foreign investment Source: Dasgupta and others (2003) The Investment Climate in MENA
International comparisons suggest that the MENA region lags most other regions in regard to investment climate considerations. The region tends to have relatively high transaction costs for starting, operating and closing businesses. The following list provides a summary account of some relevant issues for which more detailed information can be found in World Bank (2003): Starting businesses. The cost of legally registering a new business is influenced both by the number of steps required and the number of days required to fulfill necessary procedures. When measured as a ratio of per capita income, this cost is higher in MENA than in most other regions. Contract enforcement. When ranked along a procedural complexity index the MENA region has the second highest score among seven regions for which the relevant data have been compiled (see World Bank, 2004). This index covers both the number of procedures required in contract enforcement actions as well as the number of days. Difficulties and delays in contract enforcement are often cited by foreign investors as a significant impediment to investment. Air transport. Despite some progress, the regulatory reform of air transport in MENA is still at an early stage. Services remain largely provided by state-owned airlines and airports, with competition restrained by restrictive licensing regimes for domestic flights and international air service agreements. Efficiency indicators—such as freight and passenger capacity use suggest that MENA carriers fall short of international standards by an estimated 15 to 20 percent.
R2 = 0.4639
0
0.2
0.4
0.6
0.8
1
1.2
0 10 20 30 40 50 60 70
Non-oil merchandise exports; in per cent of GDP
Employment in industry after controling for factors other than non-oil merchandise exports (as a ratio of total working-age population; in logarithm)
Developing countriesLarge FDI recipients
R2 = 0.0044
-0.5
-0.4
-0.3
-0.2
-0.1
0
0.1
0.2
0.3
0.4
0 5 10 15 20 25 30 35 40 45
Non-oil merchandise exports; in per cent of GDP
Employment in industry after controling for factors other than non-oil merchandise exports (as a ratio of total working-age population; in logarithm)
Developing countriesLow FDI recipients
17
Telecommunications. Many developing countries have liberalized their telecommunications sectors in the last two decades, with Latin America in the lead, closely followed by South Asia and East Asia and the Pacific. But regulatory reform in telecommunications has been slow in MENA, where markets remain on average less competitive than in other developing countries. Lower-cost telecommunications could help improve the weak position of MENA countries in global production networks, boosting the region’s participation in global trade. Evidence from developing countries over the 1990s suggests that the share of manufactured exports in GDP increases with improvements in the overall quality of telecommunications. Power. In MENA the power sector is still dominated by vertically integrated public monopolies with poor financial health, low operating efficiency, and extensive government interference. Regulatory frameworks are not characterized by independence, transparency, and accountability. Regulatory and operational functions are not sufficiently separated to assure potential private investors and new entrants that the future policy developments in the sector will be fair and competitively neutral. Until the end of the 1990s MENA’s reform scorecard in the industry was very low, ahead only of Africa.5 Financial Services. Most MENA countries embarked on financial sector reform only in the 1990s, almost two decades after East Asia and Latin America. Banking systems were state-dominated and excessively regulated—and they remain so in Algeria, Iran, and Syria, where state-owned banks still account for more than 95 percent of domestic bank assets. In some cases state-owned banks have extended soft loans to loss-making public enterprises, creating contingent liabilities for the public sector and credit bottlenecks to private sector investment. Foreign bank presence remains limited. Conflict and the Investment Climate The investment climate of a country, or region, for that matter, is clearly affected not just by the domestic policy context discussed in the preceding sections but also by what one might call the geopolitical context. This is reflected most directly in the incidence of conflicts, wars, and politically-inspired trade and investment barriers such as sanctions. The geopolitical context is likely to have been very important in shaping the manner and extent to which the MENA region has been able to participate in world trade and investment.
Persistent conflict reduces the scope for trade and investment and thus lowers growth. In the MENA region, frequent conflicts and militarization are related to the absence of a lasting peace settlement in the region, but also to several interstate and intrastate conflicts.6 These events raise the risk perceptions and willingness to invest in 5 The ranking is based on the following six criteria: Is the existing electric utility functioning on commercial principles? Have laws been passed which would permit unbundling and/or privatization in part or in all of the industry? Is a regulatory body in place that is separate from the utility and ministry? Is there any private sector investment in the industry? Has the core state owned utility been restructured? Have any of the existing state-owned enterprises been privatized? 6 The MENA region has seen a large number of conflicts in recent decades, including some 14 years of civil conflict affecting 8 major countries and some 15 years of cross-border regional and international
18
the region from both domestic and foreign sources. A recent comparative study of conflict-affected developing countries and a control group on countries not affected (Gupta and others 2002) suggests that the numerous effects include slower GDP growth, falling trade, sharply reduced tourism, macroeconomic instability, large security expenditures, higher fiscal deficits and inflation, and the crowding out of education and health spending. The compounded effects appear to be a sharp slowdown in GDP growth in the pre-conflict stage (–1% GDP growth change) and an even sharper decline during conflict (–2%). Given the extent and duration of conflict in the MENA region, the effects are possibly even greater. Other research suggests strong contemporaneous negative spillover effects of conflict on neighbors, with such effects as high as those of the conflict within a country, with the contiguity or nearness (length of common border) a key factor. These appear to work through general contagion as much as through other channels (such as trade or labor migration or capital flows). When conflict does end, there is a sharp rebound in economic activity (+3% GDP change)—signaling the positive effects that end of persistent conflict might have in the MENA region. 5. Potential Gains from Trade and Investment Climate Reforms
We have seen in earlier sections that the MENA region exhibits trade and investment integration ratios that are substantially below the potential levels estimated on the basis of their income and population levels. We have also seen that growth and employment can rise significantly if the investment climate is improved and more trade is enabled. In this section, we simulate the effect of the region’s moving from its current level of trade and investment integration to a higher level.
We start with the assumption that the region achieves about half its trade and
investment potential over 10 years. This would raise the non-oil export ratio of the region from about 6 percent of GDP to about 13 percent by the end of 10 years--reaching roughly half the average ratio of non-oil exports to GDP of all developing countries today. The non-oil export growth rate underlying this scenario is about 15% a year, nearly twice the expected world export growth, but the increase in MENA’s share of that market remains very small because of the very low starting levels. Merchandise imports, now 20 percent of GDP, would also be expected to rise by about 7 percentage points over the decade (with incremental financing of additional imports from higher non-oil exports and higher FDI).
The effect would be to raise merchandise trade ratio from about 46 percent of GDP (2003) to about 58 percent over a decade (2013)—and non-oil merchandise trade from about 26 percent of GDP to about 39 percent. The 50 percentage gain in non-oil merchandise trade ratio over the decade would be a substantial gain and about half of the average (100 percent) increase for fast-integrating developing countries in the 1990s. FDI inflows are correspondingly assumed to rise by some 2.5 percentage points of GDP, and private productive investment rates (inclusive of FDI) by some 7 percentage points of GDP (from the current 12.5 percent of GDP to about 20 percent of GDP). conflicts affecting 14 countries. Between 1945 and 1999, it had the second highest number of violent conflicts compared with other regions (World Bank, 2003, p.91).
19
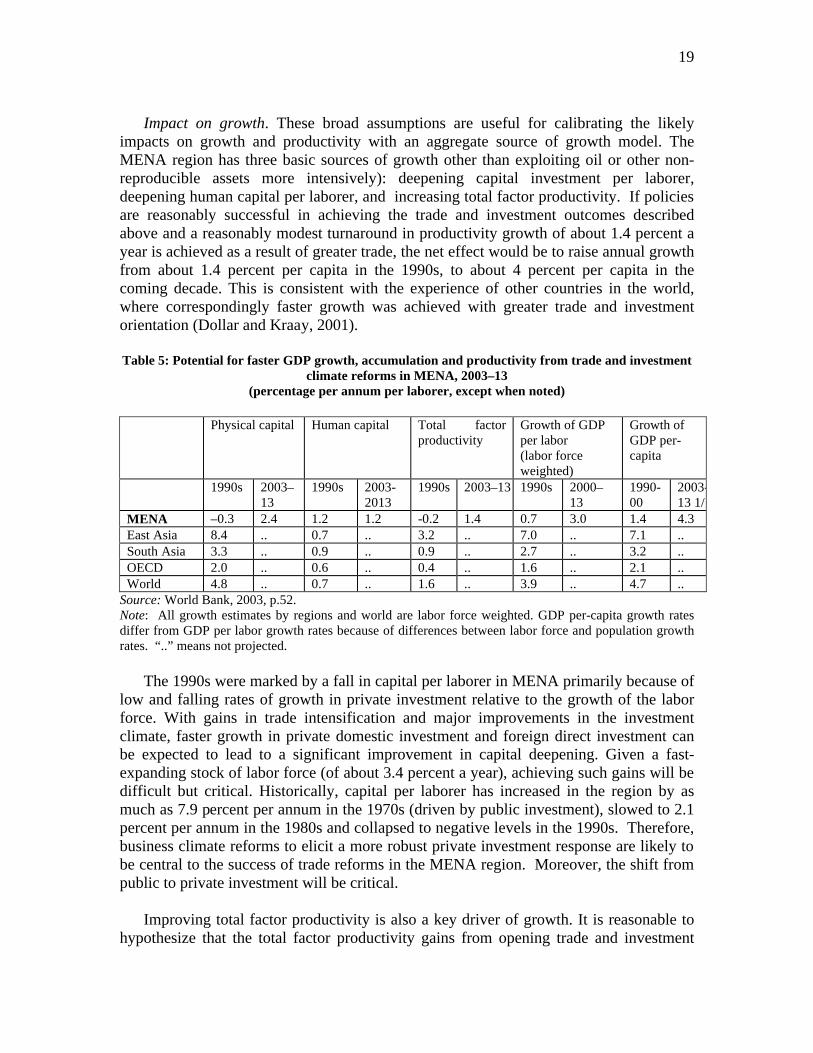
Impact on growth. These broad assumptions are useful for calibrating the likely
impacts on growth and productivity with an aggregate source of growth model. The MENA region has three basic sources of growth other than exploiting oil or other non-reproducible assets more intensively): deepening capital investment per laborer, deepening human capital per laborer, and increasing total factor productivity. If policies are reasonably successful in achieving the trade and investment outcomes described above and a reasonably modest turnaround in productivity growth of about 1.4 percent a year is achieved as a result of greater trade, the net effect would be to raise annual growth from about 1.4 percent per capita in the 1990s, to about 4 percent per capita in the coming decade. This is consistent with the experience of other countries in the world, where correspondingly faster growth was achieved with greater trade and investment orientation (Dollar and Kraay, 2001). Table 5: Potential for faster GDP growth, accumulation and productivity from trade and investment
climate reforms in MENA, 2003–13 (percentage per annum per laborer, except when noted)
Physical capital Human capital Total factor
productivity Growth of GDP per labor (labor force weighted)
Growth of GDP per-capita
1990s 2003–13
1990s 2003-2013
1990s 2003–13 1990s 2000–13
1990- 00
2003-13 1/
MENA –0.3 2.4 1.2 1.2 -0.2 1.4 0.7 3.0 1.4 4.3 East Asia 8.4 .. 0.7 .. 3.2 .. 7.0 .. 7.1 .. South Asia 3.3 .. 0.9 .. 0.9 .. 2.7 .. 3.2 .. OECD 2.0 .. 0.6 .. 0.4 .. 1.6 .. 2.1 .. World 4.8 .. 0.7 .. 1.6 .. 3.9 .. 4.7 ..
Source: World Bank, 2003, p.52. Note: All growth estimates by regions and world are labor force weighted. GDP per-capita growth rates differ from GDP per labor growth rates because of differences between labor force and population growth rates. “..” means not projected.
The 1990s were marked by a fall in capital per laborer in MENA primarily because of low and falling rates of growth in private investment relative to the growth of the labor force. With gains in trade intensification and major improvements in the investment climate, faster growth in private domestic investment and foreign direct investment can be expected to lead to a significant improvement in capital deepening. Given a fast-expanding stock of labor force (of about 3.4 percent a year), achieving such gains will be difficult but critical. Historically, capital per laborer has increased in the region by as much as 7.9 percent per annum in the 1970s (driven by public investment), slowed to 2.1 percent per annum in the 1980s and collapsed to negative levels in the 1990s. Therefore, business climate reforms to elicit a more robust private investment response are likely to be central to the success of trade reforms in the MENA region. Moreover, the shift from public to private investment will be critical.
Improving total factor productivity is also a key driver of growth. It is reasonable to hypothesize that the total factor productivity gains from opening trade and investment
20
would be significant. Opening trade would improve productivity by encouraging shifts in resources to more productive and internationally competitive activities (the stock effect), by improving the access to higher quality inputs, and by spillovers from foreign direct investment and greater competition. World Bank staff estimates suggest, for example, that fast-integrating countries obtained an additional 1 percent of GDP from productivity gains compared to only 0.6 percent among slow-integrating countries (World Bank, 2003, p.53). For the next decade, therefore, it is reasonable to assume that TFP gain of 1.4 percent per laborer will be achieved in the MENA region, reversing the negative TFP growth of the previous two decades, as the region’s economies open up to trade and private investment.
Impact on employment. The employment effects of GDP growth at about 6 percent annual rate resulting from faster trade integration and improvement in investment climate are likely to be substantial. Faster GDP growth will itself generate equivalently faster growth in employment. However, technological progress and productivity growth assumed will mean that the gains will be distributed more widely, and that employment growth will therefore be at a slower pace. Moreover, likely real wage increases will also dampen employment growth as firms respond to higher wages. Offsetting these pressures will be greater labor-intensity of production driven by greater trade-orientation of the production structure. The net effects of these factors is employment growth of up to 4.5 percent a year. This would be adequate to absorb the new entrants to the labor force and cut unemployment rates by half over the next decade.7
Exporting more merchandise goods and manufactures will create new jobs. Just over the next five years, if the MENA region can achieve15 percent real annual non-oil export growth for the region with improved policies, this would boost the region’s non-oil exports to about $60 billion, from the present level of $28 billion (excluding re-exports). And this could generate some 2 million additional jobs directly in such non-oil export activities, and another 2 million indirectly, as domestic goods and services supply inputs to these activities, and from the multiplier effects on domestic final demand. So closing even a small part of the export gap could generate some 4 million jobs over five years from direct trade effects alone. This simplified projection abstracts from a much more complex set of factors, but the magnitude is indicative of the potential.
Examples abound of the effects of expanding trade on jobs. For Mexico, thanks to the NAFTA and radical economic reforms, trade more than tripled, from $82 billion in 1990 to about $280 billion in 1999, making it the seventh largest trading nation in the world and resulting in a rapid pace of job creation in manufacturing. From 1994 to 1999, manufacturing employment grew at almost 16 percent per annum, at almost twice the pace recorded in the pre-NAFTA years of 1985-1993. Job creation has also been strong in export processing zones in Mauritius, the Dominican Republic, and El Salvador (Rama 2001). Indonesia is another country that had a major trade and investment policy reform produce employment benefits in the mid-1980s. Manufactured exports and FDI boomed, 7 Note that this is consistent with an implied employment elasticity of about 0.7 with respect to GDP which is also fairly uniformly noted in other regions such as Latin America and East Asia.
21
as did manufacturing employment. Indonesia is especially relevant to some MENA countries in that it was a resource-dependent economy until the mid-1980s, when it found a new engine of growth in manufactured exports (Iqbal 2002). Within the MENA region, Tunisian exports of textiles and clothing have boomed in “off-shore companies” supplying foreign markets, and employment in these industries increased steeply. Morocco is another example of a country that gained significantly from an initial burst of economic reforms in the early 1980s. Manufacturing sector employment and exports rose sharply in the early 1980s in response to a series of trade and investment liberalization measures (World Bank, 2003, p.59). But the Moroccan boom faltered in the 1990s as the impact of the initial reforms package dissipated and macroeconomic policies allowed the real effective exchange rate to appreciate, hurting both exports and employment in manufacturing.
Conclusions
The MENA region has been traveling along a slow growth and high unemployment trajectory over the past two decades. To pull out of this path, the region needs to make three shifts in its sources of growth: from oil to non-oil sectors, from public state-dominated to private market-oriented investment, and from protected import-substitution to export-oriented activities. Intensifying trade and private investment is at the core of all three shifts.
The region has good potential for expanding trade. Exports other than oil are a third of what they could be given the characteristics of the region. Openness to manufacturing imports is half of what would be expected. Increasing its share of world trade be possible for at least three reasons. The present level of the region’s presence in world markets is small and an increase is unlikely to be resisted among major trading partners. Competitiveness based on low wages is possible, since wages in the region are fairly low, in the bottom half of world wages. However, for competitiveness to be sustainable, overall trade policy and investment climate considerations will have to be improved. And finally the region is close to a high-income region, across the Mediterranean to the EU, which can potentially be a source of high demand for certain regional products.
MENA countries also have great potential for attracting more investment from abroad and encouraging more private investment at home, both crucial in trade and development. If exports other than oil were higher, and in a better investment climate, domestic private investment in traded goods and services would be much higher. And the FDI inflows that the region could expect would be four to five times what they are today—some 3 percent of GDP, up from an average of 0.6 percent. On the other hand, the region remains subject to a geopolitical context featuring high levels of tension and conflict which can discourage foreign investment and even trade.
Nevertheless, if only half the region’s trade and private investment potential were realized over the next ten years, that would be enough to raise its per capita GDP growth
22
from about 1 percent to about 4 percent a year—half from more private investment and half from the greater productivity that openness would encourage.
Expanding trade also holds the promise of substantial dividends in job creation,
for export opportunities would add millions of jobs. For example, if the region can achieve faster non-oil export growth of about 15% a year over the next 5 years, this would probably be sufficient to generate some 4 million jobs or 4 percent of the labor force, directly and indirectly in the export sectors alone. The employment effects are however, conditional on there being a more favorable investment climate in the region.
23
References Bolaky, B. and C. Freund, 2003. “Trade, Regulations and Growth.” Unpublished paper, World Bank, Washington D.C. Dasgupta, D., J. Keller, and T.G. Srinivasan. 2002. “Reforms and Elusive Growth in the Middle East—What Has Happened in the 1990s?” MENA Working Paper 25, World Bank, Washington, D.C. Dasgupta, D., M. Nabli, C. Pissarides, and A. Varoudakis. 2003. “Making Trade Work for Jobs: International Evidence and Lessons for MENA.” MENA Working Paper 32, World Bank, Washington, D.C. Dollar, D., and Kraay, A. 2001. “Trade, Growth and Poverty.” World Bank Policy Research Working Paper 2615, World Bank, Washington, D.C. Dollar, D., and Kraay, A. 2003. “Institutions, Trade and Growth.” World Bank Policy Research Working Paper 3004, World Bank, Washington, D.C. Frankel, J. and D. Romer. 2002. “Does Trade Cause Growth?” American Economic Review 89(3):379-99. Gupta, S., B. J. Clements, R. Bhattacharya, and S. Chakravarti, 2002. “Fiscal Consequences of Armed Conflict and Terrorism in Law and Middle Income Countries.” Working Paper 02/142, International Monetary Fund, Washington D.C. Iqbal, F. 2002. “Deregulation and Development in Indonesia: An Introductory Overview.” In F. Iqbal and W.E. James, eds., Deregulation and Development in Indonesia. Westport, Connecticut: Praeger Publishers. Nabli, M., and M.Veganzones-Varoudakis. 2002. “Exchange Rate Regime and Competitiveness of Manufactured Exports: The Case of MENA Countries.” MENA Working Paper 27, World Bank, Washington, D.C. Rama, M. 2001. “Globalization, Inequality and Labor Market Policies.” Paper for Annual Bank Conference in Development Economics (ABCDE-Europe), Washington. Rodrik, D., A. Subramaniam, and F. Trebbi, 2002. “Institutions Rule: The Primacy of Institutions over Geography and Integration in Economic Development.” Processed, International Monetary Fund. World Bank, 2003. Trade, Investment and Development in the Middle East and North Africa: Engaging with the World. World Bank, Washington, D.C.

24
World Bank, 2004. Doing Business in 2004: Understanding Regulation. World Bank, Washington, D.C.