Embed Size (px)
Citation preview
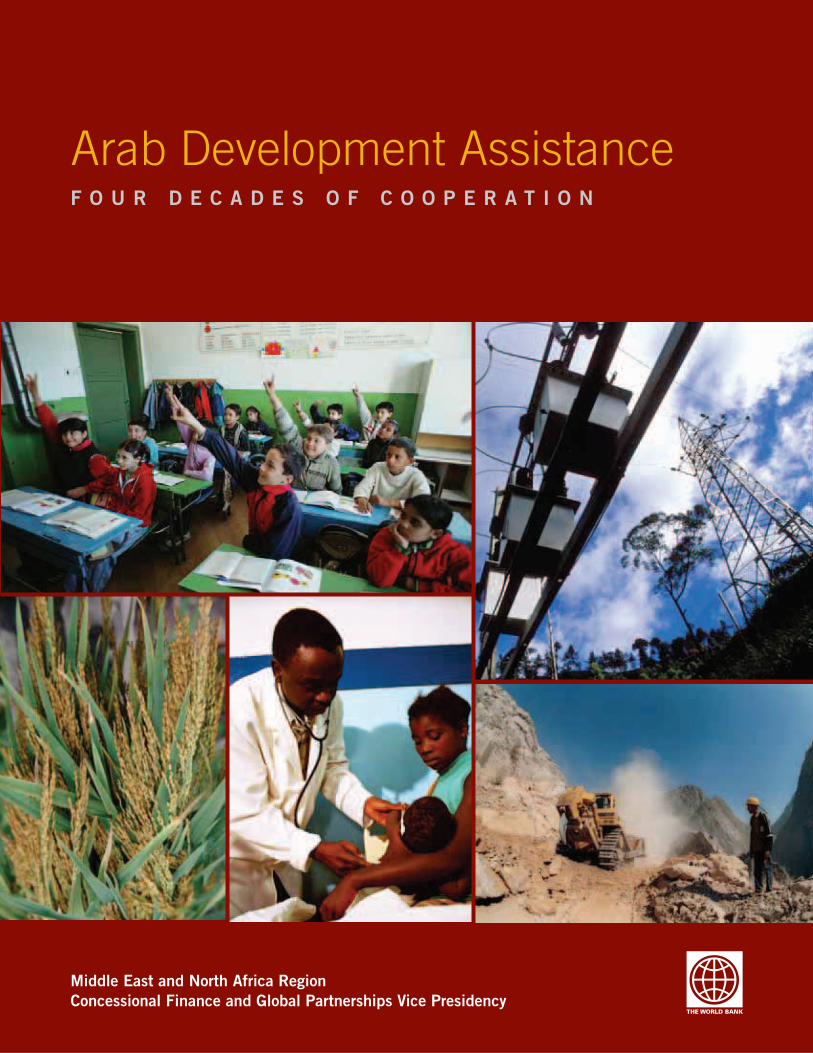
Arab Development AssistanceF O U R D E C A D E S O F C O O P E R A T I O N
Middle East and North Africa RegionConcessional Finance and Global Partnerships Vice Presidency

Arab Development Assistance F O U R D E C A D E S O F C O O P E R A T I O N
Middle East and North Africa Region Concessional Finance and Global Partnerships Vice Presidency
Document of the World Bank
June 2010
© 2010 The International Bank for Reconstruction and Development/The World Bank1818 H Street, NWWashington, DC 20433Telephone: 202-473-1000Internet: www.worldbank.orgE-mail: [email protected]
All rights reserved.
This volume is a product of the Chief Economist’s Office of the Middle East and North Africa Region and the Concessional Finance and Global Partnerships Vice Presidency of the World Bank. The findings, interpretations, and conclusions expressed herein are those of the author (s) and do not necessarily reflect the views of the Board of Executive Directors of the World Bank or the governments they represent. The World Bank does not guarantee the accuracy of the data included in this work. The boundaries, colors, denominations, and other information shown on any map in this work do not imply any judgment on the part of the World Bank concerning the legal status of any territory or the endorsement or acceptance of such boundaries.
Rights and Permissions
The material in this work is copyrighted. Copying and/or transmitting portions or all of this work without permission may be a violation of applicable law. The World Bank encourages dissemination of its work and will normally grant permission promptly. For permission to photocopy or reprint any part of this work, please send a request with complete information to the Copyright Clearance Center, Inc, 222 Rosewood Drive, Danvers, MA. 09123, USA, telephone 978-750-8400, fax: 978-750-4470, www.copyright.com. All other queries on rights and licenses, including subsidiary rights, should be addressed to the Office of the Publisher, World Bank, 1818 H Street, NW, Washington, DC 20433, USA, fax: 202-522-2422, e-mail: [email protected].
Cover photo: © World Bank/Curt Carnemark; Dominic Sansoni; Yosef Hadar; Eric Miller; Gennadiy Ratushenko
A FREE PUBLICATION
v
AAD Arab Accounting Dinar ADB Asian Development BankADFD Abu Dhabi Fund for DevelopmentAED United Arab Emirates DirhamAfDB African Development BankAFESD Arab Fund for Economic and Social DevelopmentAGFUND Arab Gulf Programme for United Nations Development OrganizationsAMF Arab Monetary FundATFP Arab Trade Financing ProgramBADEA Arab Bank for Economic Development in AfricaBOAD Banque Ouest Africaine de Développement / West African Development BankCOMPAS Common Performance Assessment SystemDAC Development Assistance CommitteeDFID Department for International DevelopmentEBRD European Bank for Reconstruction and DevelopmentECOWAS Economic Community of West African StatesEIB European Investment BankEU European UnionGCC Gulf Cooperation CouncilGDP Gross Domestic ProductGNI Gross National IncomeHIPC Highly Indebted Poor CountriesHIV/AIDS Human Immunodeficiency Virus / Acquired Immune Deficiency SyndromeIATIN Intra-Arab Trade Information NetworkICD Islamic Cooperation for the Development of the Private SectorICIEC Islamic Cooperation for the Insurance of Investments and Export CreditsIDA International Development AssociationIFAD International Fund for Agriculture DevelopmentIMF International Monetary FundIRTI Islamic Research and Training InstituteIsDB Islamic Development BankITFC International Islamic Trade Finance Corporation
Abbreviations and Acronyms
vi ARAB DEVELOPMENT ASSISTANCE
KD Kuwait DinarKFAED Kuwait Fund for Arab Economic DevelopmentKSA Kingdom of Saudi ArabiaLAS League of Arab StatesLIBOR London Interbank Offered RateLIC Low-Income CountryMDG Millennium Development GoalMDRI Multilateral Debt Relief InitiativeMENA Middle East and North AfricaMIC Middle-Income CountryNEPAD New Partnership for African DevelopmentNGO Non-governmental OrganizationOCFA Office for the Coordination of Foreign AidOCR Ordinary Capital ResourcesODA Official Development AssistanceODF Official Development FinanceOECD Organisation for Economic Co-operation and DevelopmentOFID OPEC Fund for International DevelopmentOIC Organisation of the Islamic ConferenceOPEC Organization of the Petroleum Exporting CountriesSAAFA Special Arab Aid Fund for AfricaSDR Special Drawing RightsSEP Saudi Export ProgramSESRIC Statistical, Economic, and Social Research and Training Centre for Islamic CountriesSFD Saudi Fund for DevelopmentSME Small and Medium EnterprisesSR Saudi RiyalSSA Sub-Saharan AfricaTA Technical AssistanceUAE United Arab EmiratesUN United NationsUS United StatesUNDP United Nations Development ProgrammeWBG West Bank and GazaY-SFD Yemen Social Fund for Development
vii
Executive Summary . . . . . . . . . . . . . . . . . . . . . . . . . . . . . . . . . . . . . . . . . . . . . . . . . . . . . . . . . . . . . . . xi
Chapter 1: Introduction . . . . . . . . . . . . . . . . . . . . . . . . . . . . . . . . . . . . . . . . . . . . . . . . . . . . . . . . . . . . 1
Chapter 2: Overview and Trends in Arab Official Development Assistance . . . . . . . . . . . . . . . . . . . . 3
Tracking Arab Official Development Assistance . . . . . . . . . . . . . . . . . . . . . . . . . . . . . . . . . . . . . . . . 3Aggregate Trends in the Volume of Arab ODA . . . . . . . . . . . . . . . . . . . . . . . . . . . . . . . . . . . . . . . . . 5Main Sources of Arab ODA . . . . . . . . . . . . . . . . . . . . . . . . . . . . . . . . . . . . . . . . . . . . . . . . . . . . . . . 8Channels and Modalities . . . . . . . . . . . . . . . . . . . . . . . . . . . . . . . . . . . . . . . . . . . . . . . . . . . . . . . . 10Recipients and Uses . . . . . . . . . . . . . . . . . . . . . . . . . . . . . . . . . . . . . . . . . . . . . . . . . . . . . . . . . . . . 11
Chapter 3: Institutional Framework for Arab Financial Assistance . . . . . . . . . . . . . . . . . . . . . . . . . 17
Strategic Orientation of Arab Financial Assistance Institutions . . . . . . . . . . . . . . . . . . . . . . . . . . . . 17Activities of Arab Financial Assistance Institutions . . . . . . . . . . . . . . . . . . . . . . . . . . . . . . . . . . . . . 20Aid Coordination . . . . . . . . . . . . . . . . . . . . . . . . . . . . . . . . . . . . . . . . . . . . . . . . . . . . . . . . . . . . . . 31Predictability and Sustainability of Arab Financial Assistance . . . . . . . . . . . . . . . . . . . . . . . . . . . . . 33
Chapter 4: Conclusions . . . . . . . . . . . . . . . . . . . . . . . . . . . . . . . . . . . . . . . . . . . . . . . . . . . . . . . . . . . 37
References . . . . . . . . . . . . . . . . . . . . . . . . . . . . . . . . . . . . . . . . . . . . . . . . . . . . . . . . . . . . . . . . . . . . . . 39
Annex 1 An Overview of Arab Financial Institutions . . . . . . . . . . . . . . . . . . . . . . . . . . . . . . . . . . . . . 41Annex 2 Statistical Tables . . . . . . . . . . . . . . . . . . . . . . . . . . . . . . . . . . . . . . . . . . . . . . . . . . . . . . . . . . 59
BOXES
Box 2.1 New Directions in Tracking and Coordinating Aid – UAE’s Office for the Coordination of Foreign Aid . . . . . . . . . . . . . . . . . . . . . . . . . . . . . . . . . . . . . . . . . . . . . . 4
Box 3.1 IsDB Capacity Building Programme – Fostering South-South Cooperation . . . . . . . . . . 23Box 3.2 Specialized Funds of Arab Aid Agencies . . . . . . . . . . . . . . . . . . . . . . . . . . . . . . . . . . . . . 25Box 3.3 Research Initiative for Arab Development – An Illustration of World Bank-AFESD
Cooperation . . . . . . . . . . . . . . . . . . . . . . . . . . . . . . . . . . . . . . . . . . . . . . . . . . . . . . . . . . 27Box A1-1 SFD Co-Financiers, 1975–2007 . . . . . . . . . . . . . . . . . . . . . . . . . . . . . . . . . . . . . . . . . . . 45Box A1-2 Basic Features of BADEA’s Fifth Five-Year Plan, 2005–2009 . . . . . . . . . . . . . . . . . . . . . 46Box A1-3 Yemen Social Fund for Development – A Success Story of Multi-Donor Financing
and Government Ownership and Achievements . . . . . . . . . . . . . . . . . . . . . . . . . . . . . . . 48Box A1-4 IsDB Islamic Project Financing Modalities . . . . . . . . . . . . . . . . . . . . . . . . . . . . . . . . . . . 51Box A1-5 Banking and Shari’ah Law – A Unique Feature of Arab Development Assistance . . . . . . . . . . . . . . . . . . . . . . . . . . . . . . . . . . . . . . . . . . . . . . . . . . . . . . . . . . . . 52
Table of Contents
viii ARAB DEVELOPMENT ASSISTANCE
FIGURES
Figure 1 Arab ODA in Volume and as a Share of GNI . . . . . . . . . . . . . . . . . . . . . . . . . . . . . . . . . . xiFigure 2 Yearly Average Commitment of Arab Financial Institutions . . . . . . . . . . . . . . . . . . . . . . xiiiFigure 2.1 ODA from Arab Donors . . . . . . . . . . . . . . . . . . . . . . . . . . . . . . . . . . . . . . . . . . . . . . . . . 5Figure 2.2 Share of ODA in GNI for Kuwait, KSA, UAE and DAC, 1973–2007 . . . . . . . . . . . . . . . 6Figure 2.3 ODA from Arab Countries and Oil Prices . . . . . . . . . . . . . . . . . . . . . . . . . . . . . . . . . . . . 7Figure 2.4 Main Sources of Arab ODA . . . . . . . . . . . . . . . . . . . . . . . . . . . . . . . . . . . . . . . . . . . . . . . 9Figure 2.5 ODA Funding from KSA, Kuwait and UAE, 1995–2007 . . . . . . . . . . . . . . . . . . . . . . . 10Figure 2.6 Recipients of Arab Bilateral ODA by Various Aggregations . . . . . . . . . . . . . . . . . . . . . . 13Figure 2.7 Arab ODA by Recipient Countries, 1970–2007 . . . . . . . . . . . . . . . . . . . . . . . . . . . . . . . 14Figure 3.1 Yearly Average Commitment of Arab Financial Institutions . . . . . . . . . . . . . . . . . . . . . . 20Figure 3.2 Financial Assistance and Operations Financed by Arab Financial Institutions . . . . . . . . . 20Figure 3.3 Recipients of Assistance from Arab Financial Institutions by Various Aggregations . . . . . 28Figure 3.4 Financial Assistance by Sector . . . . . . . . . . . . . . . . . . . . . . . . . . . . . . . . . . . . . . . . . . . . . 29
TABLES
Table 2.1 Arab Bilateral ODA Grants and Loans . . . . . . . . . . . . . . . . . . . . . . . . . . . . . . . . . . . . . . 11Table 2.2 Top 10 Recipients of Arab Bilateral ODA . . . . . . . . . . . . . . . . . . . . . . . . . . . . . . . . . . . 12Table 3.1 Total Financial Assistance by Type and Institution . . . . . . . . . . . . . . . . . . . . . . . . . . . . . 22Table 3.2 Cumulative TA Grant Financing Provided by Arab Financial Agencies, at end-2007 . . . 24Table 3.3 Total Commitments of Financial Institutions by Geographic Region and
Country Groupings . . . . . . . . . . . . . . . . . . . . . . . . . . . . . . . . . . . . . . . . . . . . . . . . . . . . 28Table 3.4 Lending Concentration . . . . . . . . . . . . . . . . . . . . . . . . . . . . . . . . . . . . . . . . . . . . . . . . . 29Table 3.5 Lending Terms at end-2007 . . . . . . . . . . . . . . . . . . . . . . . . . . . . . . . . . . . . . . . . . . . . . . 30Table 3.6 Operations and Geographic Coverage of Arab Aid, Cumulative to 2008 . . . . . . . . . . . . 33Table 3.7 Capital and Reserves of Arab Financial Institutions, 2007/2008 . . . . . . . . . . . . . . . . . . . 34Table A1-1 IsDB Specialized Funds . . . . . . . . . . . . . . . . . . . . . . . . . . . . . . . . . . . . . . . . . . . . . . . . . 54Table A1-2 Characteristics of Arab National and Regional Development Financial Institutions . . . . . . . . . . . . . . . . . . . . . . . . . . . . . . . . . . . . . . . . . . . . . . . . . . . . . . . . . . . 57Table A2-1 ODA from Arab Countries (%) . . . . . . . . . . . . . . . . . . . . . . . . . . . . . . . . . . . . . . . . . . . 61Table A2-2 ODA from Arab Countries (net disbursements) . . . . . . . . . . . . . . . . . . . . . . . . . . . . . . . 62Table A2-3 ODA from Arab Countries by Income Group or Other Aggregations . . . . . . . . . . . . . . 64Table A2-4 Arab ODA, Net Disbursements (% of GNI) . . . . . . . . . . . . . . . . . . . . . . . . . . . . . . . . . 66Table A2-5 ODA from Arab Countries. . . . . . . . . . . . . . . . . . . . . . . . . . . . . . . . . . . . . . . . . . . . . . . 68Table A2-6 ODA from BADEA, IsDB and OFID by Income Group, Region or
Other Aggregations . . . . . . . . . . . . . . . . . . . . . . . . . . . . . . . . . . . . . . . . . . . . . . . . . . . . 70Table A2-7 Recipient Countries of Arab ODA . . . . . . . . . . . . . . . . . . . . . . . . . . . . . . . . . . . . . . . . . 72Table A2-8 Financial Assistance by the State of Qatar . . . . . . . . . . . . . . . . . . . . . . . . . . . . . . . . . . . . 73Table A2-9 Oil Prices (US$/Barrel) and DAC Deflators . . . . . . . . . . . . . . . . . . . . . . . . . . . . . . . . . . 74
ixTable of Contents
Table A2-10 Total Financial Assistance of Arab Financial Institutions . . . . . . . . . . . . . . . . . . . . . . . . . 75Table A2-11 Financial Assistance of the Eight Major Arab Financial Institutions . . . . . . . . . . . . . . . . 77Table A2-12 Sector Allocation of Investment Lending of Arab Financial Institutions . . . . . . . . . . . . . 78Table A2-13 Total Assistance by Sectors and Country Groupings . . . . . . . . . . . . . . . . . . . . . . . . . . . . 79Table A2-14 AGFUND Contributions . . . . . . . . . . . . . . . . . . . . . . . . . . . . . . . . . . . . . . . . . . . . . . . . 81Table A2-15 Debt Restructuring by Arab Financial Institutions . . . . . . . . . . . . . . . . . . . . . . . . . . . . . 82Table A2-16 Saudi Arabia’s and Kuwait’s Contributions to Financial Development Institutions . . . . . . . . . . . . . . . . . . . . . . . . . . . . . . . . . . . . . . . . . . . . . . . . . . . . . . . . . . . 83

ix
This report was prepared by a team consisting of Mustapha Rouis (World Bank, Task Team Leader), Steven Tabor (Consultant, Arab financial institu-tions analysis), Stefano Migliorisi (Consultant, Arab ODA analysis), Eric Neumayer (Consultant, econometric analysis) and Komlan R. Kounetsron (World Bank, data analysis). Isabelle Chaal Dabi and Angela Hawkins (World Bank) provided valu-able administrative assistance and Amanda Green (Consultant) edited the report. The report was pre-pared under the stewardship of Daniela Gressani and Shamshad Akhtar, respectively past and cur-rent Vice President, Middle East and North Africa Region, World Bank; and Philippe Le Houerou and Axel van Trotsenburg, respectively past and current Vice President, Concessional Finance and Global Partnerships Department, World Bank.
The report benefited from inputs and comments at different stages of preparation from colleagues at the World Bank. Designated World Bank reviewers were Rocio Castro, Jorge Araujo and Willem van Eeghen. Helpful comments were also provided by Abebe Adugna, Hafed Al-Ghwell, Kevin Carey, Ju-lia Devlin, Farrukh Iqbal, Auguste Tano Kouame, and Joseph Saba from the World Bank.
The study has been prepared in close collaboration with the Coordination Group, the nine national and multilateral Arab funds and banks, and OECD DAC. Comments on earlier draft versions of this
report have been received from these institutions and reflected to the extent feasible in the report.
Valuable contributions were received from staff of Arab financial institutions and officials of Arab donor countries, including Anas Hassan Hamed (ADFD); Ahmed Osman, Said Al-Shinnawi, and Imed Limam (AFESD); Nasser Al-Kahtani and Jebrin Al-Jebrin (AGFUND); Mustapha Kara and Nabil G. Dahdah (AMF); Mohamed El Hadi Khelifi and Kamal Mah-moud (BADEA); Ezzeddine Bouchelaghem (Coor-dination Group Secretariat); Marwan A. Al Ghanem, Mustapha Ebrahim Bushiri, and Salem Abdullah Al-Qallaf (KFAED); Mohameden Mohamed Sidiya and Intizar Hussain (IsDB); Said Aissi, Ahmed Khouni (OFID); Hasan Attas, Ahmed Al-Yahya, Moham-mad Al-Magrashy, Abulrahamn AlOraini, Eid bin Eid (SFD). Government officials who provided in-puts included Ishaq Abdulkarim and Barrak A. Al Sheetan (Kuwait, Ministry of Finance); Aysha A. Al-Dikheel (Kuwait, Ministry of Foreign Affairs); Hamad Al-Bazai, Mohammed al Muqeteeb, Saleh Al-Rasheed, Mohammad Al Ghofaili, and Fahad Al Otaibi (Saudi Arabia, Ministry of Finance); Khalid Ali Al-Bustani and Hamid Nasr Mohamed (UAE, Ministry of Finance); and Sultan Al Shamsi and Martin Barber (UAE, Office of the Coordination of Foreign Aid). Finally, the team would like to ac-knowledge the support and comments received from Julia Benn, Ann Zimmerman, Kimberly Smith and Felix Zimmermann (OECD-DAC).
Acknowledgements
xii ARAB DEVELOPMENT ASSISTANCE
HIGHL IGHTS
Arab donors—predominantly the Kingdom of Saudi Arabia (KSA), Kuwait and United Arab Emirates (UAE)—have been among the most generous in the world, with official development assistance (ODA) averaging 1.5 percent of their combined gross national income (GNI) during the period 1973–2008, more than twice the United Nations target of 0.7 percent and five times the average of the OECD-DAC countries. Arab ODA accounts for 13 percent of total DAC ODA on average and nearly three-quarters of non-DAC ODA.
The share of Arab ODA in Arab GNI was exceptionally high in the 1970s and early 1980s, peaking at over 12 percent for the UAE and at about 8.5 percent for Kuwait and KSA in 1973. Nearly one-third of all ODA during the 1970s was from Arab donors. Although the ratio has fallen over time, it still exceeds the average among OECD-DAC member countries. Moreover, Arab aid is generally untied, and is offered without conditions or restrictions.
Over time, Arab donors have expanded their reach—beyond Arab and predominantly Muslim countries in terms of recipient countries and beyond infrastructure in terms of sectors. Their assistance has come to play a major role in total ODA flows to several developing countries.
In addition to government-to-government aid, Arab donors have established a number of specialized financial insti-tutions to provide development assistance to low-income countries. Assistance through these institutions increased substantially by 4.4 percent per year in real terms over the period 1990–2008.
There are good reasons to believe that Arab aid will continue to play an important role in international development assistance into the foreseeable future. Arab donors have recently increased their aid volumes, and Arab financial insti-tutions are well capitalized, with the capacity to scale up assistance.
xiii
associated with establishing aid programs and capi-talizing development funds and banks.
From this extraordinarily high starting point in the 1970s and early 1980s, levels of Arab ODA de-clined, although they remained well above OECD-DAC averages as a share of GNI. The downward trend can be explained by a combination of several
OVERVIEW AND TRENDS IN ARAB ODA
Overall, Arab donors—namely KSA, Kuwait and UAE—have been among the most generous in the world, with ODA totaling US$ 272 billion (in 2007 prices) between 1973 and 2008 and averaging 1.5 percent of combined GNI during the same period. This compares favorably with the United Nations (UN) development assistance target of 0.7 percent and with the average among the Organisation for Economic Co-operation and Development’s De-velopment Assistance Committee (OECD-DAC) members of 0.3 percent. Arab ODA represents on average 13 percent of total DAC ODA and nearly three-quarters of non-DAC ODA during the pe-riod under review.
As shown in Figure 1, the share of Arab ODA in GNI was exceptionally high in the 1970s, peaking at over 12 percent for UAE and at about 8.5 per-cent for Kuwait and KSA in 1973. About one-third of all ODA during the 1970s was from Arab do-nors. High levels of Arab ODA in the 1970s and 1980s were primarily a reflection of high oil prices and, to some extent, the substantial start-up costs
F IGURE 1 Arab ODA as a Share of GNI (%)
0.0
0.5
1.0
1.5
2.0
2.5
3.0
3.5
4.0
DACArab
UN Target (0.7%)
2000–081990–991980–891973–791973–08
Source: Annex 2, Table A2-1.
Executive Summary
This study provides an overview of Arab official development assistance (ODA)
over the past four decades. Trends in volume, composition, and direction are
discussed in Chapter 2 and the institutional framework is discussed in Chap-
ter 3. Over 90 percent of Arab development assistance is provided by three
countries: the Kingdom of Saudi Arabia (KSA), Kuwait, and the United Arab
Emirates (UAE).
xiv ARAB DEVELOPMENT ASSISTANCE
factors. First, the levels witnessed in the 1970s and early 1980s were very high by international stan-dards and could not be sustained over time. Second, fiscal space in these countries has been reduced as a result of declining oil revenues and growing na-tional spending on wages, transfers, debt service, and social services for a growing population. Third, external factors such as regional security concerns have also reduced to some extent the fiscal space.
Aid levels have increased since 2002, both in volume and as a share of GNI, as oil prices have risen and post-conflict reconstruction needs have expanded. As in the past, most aid comes from KSA, Kuwait, and UAE, respectively. Arab ODA from these countries accounts for the bulk of non-DAC ODA, averaging nearly three-quarters during 1991–2008. Preliminary estimates for 2008 indicate an even higher volume of aid (around US$ 6 billion and 0.7 percent of GNI) in spite of the global financial and economic crisis, with KSA accounting for the bulk of aid. The Arab ODA-to-GNI ratio remains more than twice the average of 0.3 percent of GNI among OECD-DAC members for 2008.
Over time, Arab donors have expanded their reach in terms of recipient countries—beyond Arab and predominantly Muslim countries—and in terms of sectors—beyond infrastructure. At present, Arab ODA covers a wide range of countries, and espe-cially poor countries in sub-Saharan Africa such as Mali, Mauritania, Senegal, Somalia, and Sudan; and in Asia such as Cambodia, Bangladesh, Nepal, Pakistan, Sri Lanka, Tajikistan, and Vietnam. The Kuwait Fund, the Saudi Fund and the OPEC Fund are the most global in focus, also financing projects in Europe and Latin America. The sector focus of Arab ODA has broadened over time to include ag-riculture, health, education, and social services.
Arab aid has played a major role in total ODA flows to some countries. In Syria, Arab ODA ac-
counts for over 70 percent of total ODA from all sources. In Morocco, Lebanon, Yemen, and Jordan, Arab ODA represents between 20 and 40 percent of total ODA. Arab ODA also accounts for 10–20 percent of total ODA in West Bank and Gaza, So-malia, Sudan, Turkey, Egypt, Mauritania, and Dji-bouti.
The composition of Arab bilateral ODA has shift-ed significantly in the last decade. Until 2000, over two-thirds of Arab bilateral ODA was in the form of grants. Since then, the share of grants has dropped to 40 percent; most aid is provided in the form of soft loans. The bulk of Arab ODA (87 percent) has been provided bilaterally. The average ratio of multilateral to total ODA among Arab do-nors was less than half of the OECD-DAC norm (13 percent as compared to 30 percent). Of the 11 percent of Arab ODA provided through multilat-eral sources during 1995–2007, some 4 percent has been channeled through Arab financial institu-tions, 4 percent through the World Bank, 2 percent through UN agencies and just under one percent through the African Development Bank (AfDB). Other ODA, for humanitarian purposes, has been directed through the Red Crescent Societies and other non-governmental organizations, for which consolidated sources of information are not avail-able.
Various factors play a role in determining ODA allocation decisions. Fiscal capacity has played an important role in influencing volumes of Arab aid, linked closely to movements in global petroleum prices and to the need to fund social services and rising wages and finance government debt. In their ODA allocation, Arab governments have tended to focus on poor and low-middle-income coun-tries, largely in the Middle East and North Africa (MENA) region followed by sub-Saharan Africa and South and Central Asia, as these countries re-ceive limited aid from other sources. Commercial
xvExecutive Summary
self-interest does not tend to play a significant role in Arab aid allocation.
ARAB FINANCIAL ASSISTANCE INSTITUTIONS
In the 1960s, and more importantly the 1970s and early 1980s, Arab donors established a number of specialized financial institutions to provide devel-opment assistance. Kuwait, KSA, and UAE estab-lished national aid agencies. In addition, five main regional funds were established: the Arab Fund for Economic and Social Development (AFESD), Arab Bank for Economic Development in Africa (BADEA), Islamic Development Bank (IsDB), OPEC Fund for International Development (OFID), and Arab Monetary Fund (AMF). Strict-ly speaking, IsDB and OFID are not exclusively Arab-financed institutions, but Arab countries provide the largest share of their funding. In addi-tion, the Arab Gulf Programme for United Nations Development Organizations (AGFUND) plays a special role in financing technical cooperation and humanitarian assistance through its support for specialized UN agencies. These institutions have grown to become major providers of external finan-cial assistance. With the exception of AGFUND, these agencies have financed their operations pri-marily from capital subscriptions and loan reflows.
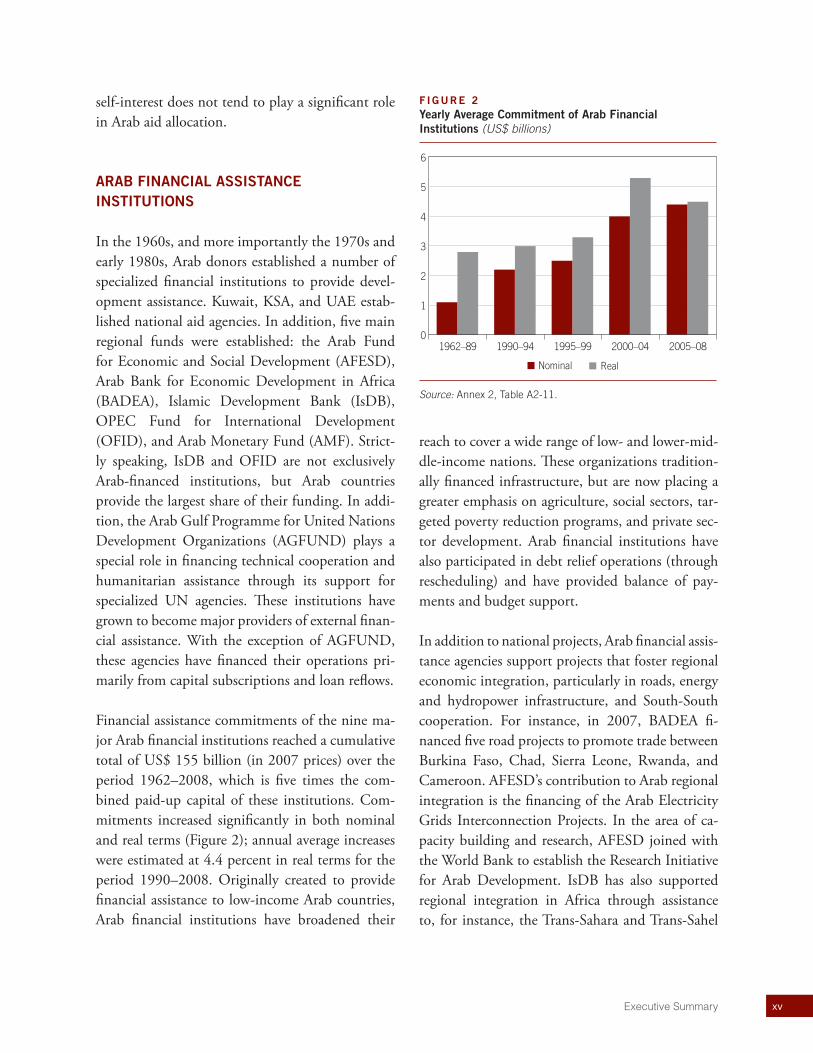
Financial assistance commitments of the nine ma-jor Arab financial institutions reached a cumulative total of US$ 155 billion (in 2007 prices) over the period 1962–2008, which is five times the com-bined paid-up capital of these institutions. Com-mitments increased significantly in both nominal and real terms (Figure 2); annual average increases were estimated at 4.4 percent in real terms for the period 1990–2008. Originally created to provide financial assistance to low-income Arab countries, Arab financial institutions have broadened their
reach to cover a wide range of low- and lower-mid-dle-income nations. These organizations tradition-ally financed infrastructure, but are now placing a greater emphasis on agriculture, social sectors, tar-geted poverty reduction programs, and private sec-tor development. Arab financial institutions have also participated in debt relief operations (through rescheduling) and have provided balance of pay-ments and budget support.
In addition to national projects, Arab financial assis-tance agencies support projects that foster regional economic integration, particularly in roads, energy and hydropower infrastructure, and South-South cooperation. For instance, in 2007, BADEA fi-nanced five road projects to promote trade between Burkina Faso, Chad, Sierra Leone, Rwanda, and Cameroon. AFESD’s contribution to Arab regional integration is the financing of the Arab Electricity Grids Interconnection Projects. In the area of ca-pacity building and research, AFESD joined with the World Bank to establish the Research Initiative for Arab Development. IsDB has also supported regional integration in Africa through assistance to, for instance, the Trans-Sahara and Trans-Sahel
F IGURE 2 Yearly Average Commitment of Arab Financial Institutions (US$ billions)
0
1
2
3
4
5
6
RealNominal
2005–082000–041995–991990–941962–89
Source: Annex 2, Table A2-11.
xvi ARAB DEVELOPMENT ASSISTANCE
roadways. There is a growing effort among Arab financial institutions to promote South-South cooperation, as illustrated by the IsDB Capacity Building Programme (Box 3.1). South-South co-operation is one of the hallmarks of Arab aid, and its effectiveness and lessons merit careful study.
Though Arab financial assistance is predominantly in the form of concessionary credit, some institu-tions provide grants to finance capacity building, project preparation, and technical advice. Arab agencies also provide consolidated support to UN specialized agencies, Red Crescent Societies, and non-governmental organizations (NGOs) for hu-manitarian assistance. Arab financial assistance is noteworthy for its partnership and solidarity with recipient countries—in practice, this is interpreted to mean that Arab donors do not attach policy con-ditions to the loans they provide.
Arab financial agencies coordinate policies and pro-cedures and co-finance projects through a Coordi-nation Group hosted by AFESD. Reports suggest that the use of common procedures has enabled Arab agencies to reduce transaction costs, foster greater transparency in project management, and improve project safeguards and accountability. Co-financing is the principal mechanism through
which these agencies collaborate among themselves and with other development partners. The Coordi-nation Group also participates in global initiatives to foster aid harmonization and alignment.
LOOKING AHEAD
Arab financial institutions are well positioned to meet the challenges posed by the global financial and economic crisis. Being well capitalized and financially conservative, these institutions may be able to help offset some of the slack that may be created by declining ODA from other sources. Over the medium to long run, these growing and maturing institutions will be well placed to tap into capital markets to increase the scope of their opera-tions.
Reporting practices among Arab ODA agencies are evolving. The establishment of a central agency to coordinate ODA in the UAE and efforts made to bolster the visibility of KSA’s aid program bode well for the future development of Arab ODA report-ing systems. Furthermore, the Coordination Group Secretariat is engaged in a capacity enhancement partnership with OECD-DAC that holds signifi-cant promise for improved reporting.
1
The study draws on two main data sources: official development assistance (ODA) flows as reported by OECD-DAC, and financial flows of the ma-jor bilateral funds and multilateral Arab banks as reported by the Coordination Group. Public dis-closure of Arab external assistance data tends to be sporadic and limited. But the situation is changing, and new institutional arrangements are helping to improve coordination and reporting.
The study is based largely on information for three countries that account for over 90 percent of Arab ODA. Although derived from official government sources, Arab ODA data suffer from incomplete country coverage and from lack of detailed infor-mation regarding what constitutes ODA. Conse-quently, this study focuses on Arab donor countries for which basic information is available—notably KSA, Kuwait, and UAE, which are also the region’s
major aid providers. These three countries account for over 90 percent of total Arab ODA during a period (1973–1989) for which data are available for a large group of countries (Algeria, Iraq, Ku-wait, Libya, Qatar, Saudi Arabia, and UAE). Arab donors provide ODA primarily on a bilateral (gov-ernment-to-government) basis. Multilateral ODA (contributions to Arab financial institutions, World Bank, AfDB, and a number of UN agencies) ac-counts for 11 percent of ODA.
The study also covers commitments of the Arab bilateral funds and multilateral development insti-tutions. A portion of these flows is in the form of as-sistance that is not classified as ODA, such as trade finance and private sector operations. These flows are part of official development finance (ODF),2 and are reviewed in Chapter 3 to illustrate another dimension of Arab assistance.
C H A P T E R 1
Introduction
This study provides an overview of Arab development assistance.1 It conducts
a broad survey of the volume, allocation, modalities, and uses of Arab devel-
opment financial assistance and identifies knowledge gaps. The effectiveness
of Arab aid is not addressed, as this topic falls beyond the scope of this exer-
cise and of available data.
1 Among previous studies, the following are notable: Pierre van den Boogaerde (IMF Occasional Paper 87, 1991) and Espen Villanger (Chr. Michelsen Institute, 2007).2 Development assistance can be analyzed from two angles—ODA and ODF. ODA measures donors’ aid efforts, capturing assistance provided to developing countries on concessional terms and for a development purpose. ODF measures developing countries’ resource receipts, which cover bilateral ODA, bilateral non-concessional lending for developmental purposes, and multilateral outflows. The latter may be in the form of grants or loans (concessional and non-concessional).
2 ARAB DEVELOPMENT ASSISTANCE
The two datasets are difficult to reconcile because of coverage limitation and measurement problems. First, the OECD-DAC dataset only partially cap-tures the ODA flows from Arab financial institu-tions. Data are received from the national funds of KSA, Kuwait, and UAE, as well as from three of the six Arab financial institutions: BADEA, IsDB and OFID. Total Arab ODA is therefore underestimat-ed by the amount of ODA provided by the three agencies (AFESD, AMF, and AGFUND) that are not captured in DAC data.3 Second, the Coordina-tion Group data do not capture all of the bilateral
ODA reported to OECD-DAC by Arab govern-ments; it covers only the ODA of its member insti-tutions and portions of other financial flows (such as trade finance and private sector development) that would be classified as other components of ODF. The national funds do manage loans and grants on behalf of their respective governments, but these activities are not reported by the Coor-dination Group. Finally, data compiled by the Co-ordination Group Secretariat,4 are on a cumulative commitment basis while the ODA data derived from OECD-DAC are on a net disbursement basis.
3 This underreporting is estimated to amount to about 5-8 percent of total Arab ODA. This figure is calculated on the basis of the ODA/commitment ratio calculated for the three agencies (BADEA, IsDB, and OFID) for which information is available. 4 The Coordination Group of Arab, Islamic and Organization of the Petroleum Exporting Countries (OPEC) Development Institutions comprises the Kuwait Fund for Arab Economic Development (KFAED), the Saudi Fund for Development (SFD), the Abu Dhabi Fund for Development (ADFD), the Arab Bank for Economic Development in Africa (BADEA), the Arab Fund for Economic and Social Development (AFESD), the Arab Gulf Programme for United Nations Development Organizations (AGFUND), the Arab Monetary Fund (AMF), the Islamic Development Bank, and the OPEC Fund for International Develop-ment (OFID). See Chapter 3 and Annex 1 for more details.
3
TRACKING ARAB OFFICIAL DEVELOPMENT ASSISTANCE
ODA is defined by OECD as financial assistance meeting the following four criteria: (i) provided to a developing country or an ODA-eligible multilat-eral organization; (ii) on concessional terms with a grant element of at least 25 percent; (iii) for a development purpose and (iv) by official agencies. Data on ODA flows are reported to DAC annually by a focal agency within each of the Gulf countries. It is difficult to verify the accuracy of this informa-tion, however, since Arab donors do not publish annual accounts of aid, nor do aid policies and leg-islation in these countries require full disclosure of external assistance. Moreover, aid management is often divided among several agencies, hampering the consolidation of external assistance estimates within the respective governments. New arrange-ments for coordinating ODA are evolving in ways
that are likely to improve the comprehensiveness and accuracy of Arab ODA data in the future (Box 2.1).6
Data reported to DAC by Arab donors are in the aggregate. Few details are available on the type of assistance provided (e.g., investment, technical as-sistance, debt relief, emergency relief ) or the sec-tor of focus. DAC provides time series data on net disbursements from Arab donors, disaggregated by bilateral and multilateral sources and by recipient countries—from 1973 to 1989 for seven countries (Algeria, Iraq, Kuwait, Libya, Qatar, KSA, and UAE) and from 1990 to 2008 for only three coun-tries (KSA, Kuwait, and UAE).
Caution should be exercised in the use of these data-sets, although they are based on official government sources. Official time series data do not offer the same degree of detail as the data reported by mem-
C H A P T E R 2
Overview and Trends in Arab Official Development Assistance
This chapter reviews Arab ODA flows since the first oil shock of 1973. The
analysis focuses on the three largest donors (KSA, Kuwait, and UAE) and
draws on available aggregate data provided by Arab countries to OECD-DAC.5
5 The 2008 Unified Arab Report provides aggregate data on Arab ODA (net disbursements) for the period 1970–2007 for all seven countries reported in DAC plus Oman (see pp. 395–396 of the Arabic version). These data are on the high side compared to DAC data, largely because the data included for Saudi Arabia refer to commitments rather than to net disbursements.6 In the case of UAE, the Office for the Coordination of Foreign Aid (OCFA) is, as stated in Box 2.1, in the process of collect-ing comprehensive data on UAE aid. As a next step, OCFA plans to discuss with OECD the submission of historical and current records on UAE aid so as to reconcile the data if need be.
4 ARAB DEVELOPMENT ASSISTANCE
bers of OECD-DAC, thus making it difficult for the DAC Secretariat to provide a conclusive esti-
mate of the degree of concessionality of reported Arab ODA.
BOX 2 .1 New Directions in Tracking and Coordinating Aid – UAE’s Office for the Coordination of Foreign Aid
Recognizing the growing diversity in the country’s overseas aid activities, the Government of UAE established the Office for the Coordination of Foreign Aid (OCFA) by Cabinet Decree in 2008. Work began in 2009 with H.H. Sheikh Ham-dan bin Zayed Al Nahyan, the Ruler’s Representative in the Western Region of the Emirate of Abu Dhabi, leading the organization as its President. OCFA’s mandate includes documenting UAE’s foreign aid flows, advising the Government, monitoring and evaluating the work of UAE’s humanitarian and development agencies, and building capacity within the UAE aid sector. OCFA is also responsible for supporting UAE aid agency responses to humanitarian emergencies and positioning the UAE as a major donor nation.
OCFA is collecting historical and current data on UAE foreign aid donations for the public record and to secure interna-tional recognition for the nation’s contributions. As part of this process, OCFA is submitting relevant data to OECD-DAC and to the UN Office for Coordination of Humanitarian Affairs Financial Tracking Service. In addition, a comprehensive annual report on UAE foreign aid donations will be published.
OCFA has carried out an assessment of training and capacity-building needs among humanitarian and development organizations in the UAE, and is providing training programs and workshops on the basis of this assessment.
To address increasing demands on the UAE donor community for emergency humanitarian relief around the world, OCFA is working to improve UAE’s emergency humanitarian response capacity. This includes developing early warning mechanisms, contingency planning, preparing country profiles and regular situation reports, advising the Government on effective allocation of humanitarian aid resources, and monitoring and reporting on potential conflict zones and areas vulnerable to natural disasters.
OCFA has identified five substantive goals, to be achieved by 2013:
OCFA manages an internationally recognized information management platform that links its UAE-based partners with international stakeholders.
UAE has endorsed a series of policies, standards, and guidelines relating to foreign aid that are internationally recognized for excellence.
Humanitarian agencies and donors in the UAE respond in a coordinated manner to major emergencies throughout the world.
UAE’s foreign aid sector consists of efficient organizations that perform to the highest international standards. UAE is recognized at home and internationally as an important and generous donor country, contributing actively
to international humanitarian and development agendas.
OCFA carries out its work through five units: Information Management; Policy, Monitoring, and Evaluation; Field Sup-port; Training and Capacity Building; and International Relations and Public Information.
Source: Office for the Coordination of Foreign Aid, United Arab Emirates.
5Chapter 2 Overview and Trends in Arab Official Development Assistance
AGGREGATE TRENDS IN THE VOLUME OF ARAB ODA
Overall, Arab donors—reflecting largely KSA, Ku-wait, and UAE—have been among the most gen-erous in the world, with ODA totaling US$ 272 billion (at 2007 prices) between 1973 and 2008 and averaging 1.5 percent of their combined Gross National Income (GNI) or twice the UN target and five times the OECD-DAC average. Arab ODA represents, on average, 13 percent of total DAC ODA and nearly three-quarters of non-DAC ODA (Annex 2, Table A2-1).
Arab ODA began at an unusually high volume dur-ing the 1970s, both overall and as a share of GNI. As shown in Figure 2.1, Arab ODA tripled from US$ 3 billion in 1972 to US$ 9.3 billion in 1973 and con-tinued to grow steeply, peaking at US$ 22 billion in 1981 (at constant 2007 prices). The growth of Arab ODA was initiated with the first oil shock, when Arab countries used a portion of oil revenues to assist developing countries struggling with a growing bur-den of poverty and underdevelopment. This was the first group of developing nations to provide large-scale assistance to low-income countries. High levels of aid in the late 1970s were also associated with the start-up phase of major assistance programs, as well as the capitalization of a number of national funds and multilateral banks (Chapter 3). Between 1973 and 1980, Arab donors represented the second larg-est concessional donor group in the world behind DAC countries—Arab ODA reached over one-third of total ODA from all donors during the 1970s (An-nex 2, Table A2-1). As a share of national income, Arab donors were the most generous in the world at an extraordinarily high ODA-to-GNI ratio of 12.5 percent for the UAE and just under 8.5 percent for Kuwait and KSA in the late 1970s.
Understandably, Arab aid declined in overall vol-ume in the 1980s and 1990s, but has begun to
increase in recent years. After the second oil price shock of 1979–80, official foreign exchange re-serves of Arab donors declined and Arab public expenditures, including foreign aid programs, were substantially reduced. By 1983, Arab aid had de-clined to about US$ 10 billion (at 2007 prices)—less than half of its peak level in 1980. Arab ODA continued to decline throughout the 1980s to less than US$ 3 billion in 1989. Aid increased rapidly in 1990–1991 in the aftermath of the Gulf War, but declined again throughout the 1990s to just over US$ 0.5 billion dollars by 1999. Since the early 2000s, Arab ODA increased to almost US$ 3 billion in 2007, along with a tripling of oil prices
F IGURE 2 .1 ODA from Arab Donors (US$ billions at 2007 prices), %
0
5
10
15
20
25
ODA ($ b)
1973 1978 1983 19880.0
1.0
2.0
3.0
4.0
5.0
6.0
ODA/GNI
0
1
2
3
4
5
6
1992 1997 2002 20070.0
0.1
0.2
0.3
0.4
0.5
0.6
0.7
0.8
0.9
1.0
US$
Bin
1973–1991
1992–2008
%
US$
Bin %
Source: Annex 2, Table A2-2.
6 ARAB DEVELOPMENT ASSISTANCE
(in nominal terms) between 2002 and 2007. Arab ODA is estimated to have doubled in 2008, reach-ing over US$ 6 billion. The bulk of this amount comes from the KSA.7
Major Arab donors have achieved international aid targets and their assistance has remained at or above DAC averages. Figure 2.2 shows the trend in ODA-to-GNI ratios at ten-year intervals. ODA-to-GNI ratios dropped sharply over the 1980s, reach-ing about 0.6 percent in 1989, and the 1990s (with the exception of 1990–91), reaching 0.2 percent in 1999. Bilateral ODA has been supplanted largely by the strong growth in financing provided by Arab funds and multilateral banks established in the late 1970s and early 1980s (Chapter 3). Nevertheless, with a combined ODA-to-GNI ratio8 ranging from over 9 percent in 1973 to 1.4 percent in 1991, the three main Arab donor countries exceeded the UN aid target of 0.7 percent of GNI over this time peri-od.9 In 2008, preliminary estimates show a signifi-cant increase in ODA flows from Arab donors both in volume (around US$ 6 billion) and as a ratio to GNI (0.7 percent), with KSA accounting for the bulk. The Arab ODA to GNI ratio compares favor-ably with an average of 0.3 percent among OECD-DAC members.10
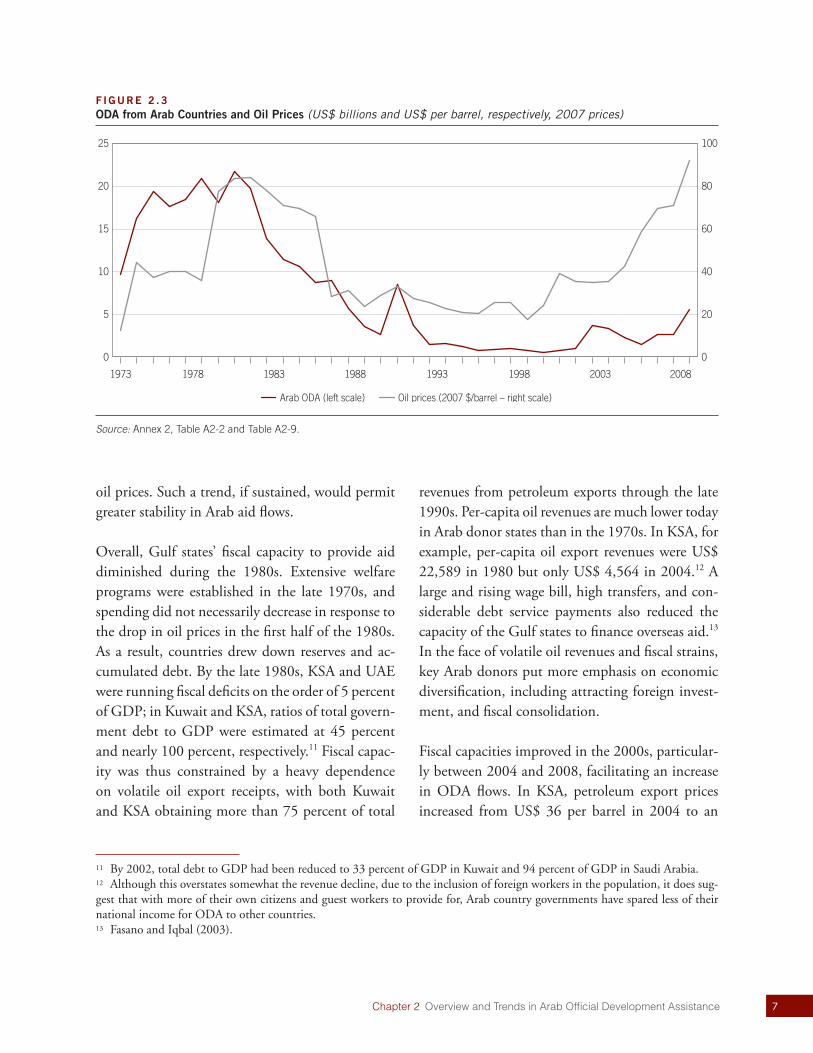
Arab ODA trends are broadly correlated with trends in petroleum prices, but the strength of the correlation varies among countries and sub-periods. Figure 2.3 shows that ODA trends have broadly tracked petroleum prices, rising when the latter are rising (though with a time lag) and fall-ing when the latter are falling. Since 1990 or so,
the correlation has weakened, indicating a possible delinking of Arab aid flows from volatility in global
F IGURE 2 .2 Share of ODA in GNI (%), 1973–2008
0.0
0.5
1.0
1.5
2.0
2.5
3.0
3.5
4.0
DAC
UN Target (0.7%)
Arab
2000–081990–991980–891973–791973–08
0
1
2
3
4
5
6
7
8
UAEKSAKuwait
2000–081990–991980–891973–791973–08
Source: Annex 2, Table A2-1 and Table A2-4.
7 Preliminary figures from OECD estimate total aid from the three countries at nearly US$ 6 billion for 2008, while the 2009 Unified Arab Economic Report, Annex Table 11.1, shows a much higher figure of US$ 6.8 billion. The difference is largely due to underreporting by OECD for both Kuwait and UAE—the latter by a large margin (US$ 88 million vs. US$ 561 million).8 The sum of these three countries’ ODA divided by the sum of their GNI.9 Donor governments committed to spend 0.7 percent of GNI on ODA at the UN General Assembly in 1970.10 The Arab ODA-to-GNI ratio of 0.7 percent is calculated using OECD-DAC figures for ODA flows and World Bank estimates for GNI/GDP. The DAC ODA flows for Kuwait and UAE are much lower than those found in the 2009 Unified Arab Economic Report, Annex Table 11.2. They are, however, about the same for KSA.
7Chapter 2 Overview and Trends in Arab Official Development Assistance
oil prices. Such a trend, if sustained, would permit greater stability in Arab aid flows.
Overall, Gulf states’ fiscal capacity to provide aid diminished during the 1980s. Extensive welfare programs were established in the late 1970s, and spending did not necessarily decrease in response to the drop in oil prices in the first half of the 1980s. As a result, countries drew down reserves and ac-cumulated debt. By the late 1980s, KSA and UAE were running fiscal deficits on the order of 5 percent of GDP; in Kuwait and KSA, ratios of total govern-ment debt to GDP were estimated at 45 percent and nearly 100 percent, respectively.11 Fiscal capac-ity was thus constrained by a heavy dependence on volatile oil export receipts, with both Kuwait and KSA obtaining more than 75 percent of total
revenues from petroleum exports through the late 1990s. Per-capita oil revenues are much lower today in Arab donor states than in the 1970s. In KSA, for example, per-capita oil export revenues were US$ 22,589 in 1980 but only US$ 4,564 in 2004.12 A large and rising wage bill, high transfers, and con-siderable debt service payments also reduced the capacity of the Gulf states to finance overseas aid.13 In the face of volatile oil revenues and fiscal strains, key Arab donors put more emphasis on economic diversification, including attracting foreign invest-ment, and fiscal consolidation.
Fiscal capacities improved in the 2000s, particular-ly between 2004 and 2008, facilitating an increase in ODA flows. In KSA, petroleum export prices increased from US$ 36 per barrel in 2004 to an
F IGURE 2 .3 ODA from Arab Countries and Oil Prices (US$ billions and US$ per barrel, respectively, 2007 prices)
1973 1978 1983 1988 1993 1998 2003 2008
0
5
10
15
20
25
0
20
40
60
80
100
Arab ODA (left scale) Oil prices (2007 $/barrel – right scale)
Source: Annex 2, Table A2-2 and Table A2-9.
11 By 2002, total debt to GDP had been reduced to 33 percent of GDP in Kuwait and 94 percent of GDP in Saudi Arabia.12 Although this overstates somewhat the revenue decline, due to the inclusion of foreign workers in the population, it does sug-gest that with more of their own citizens and guest workers to provide for, Arab country governments have spared less of their national income for ODA to other countries.13 Fasano and Iqbal (2003).
8 ARAB DEVELOPMENT ASSISTANCE
average of US$ 93 per barrel in 2008. In response, government revenues rose from 42 percent of GDP in 2004 to 61 percent of GDP in 2008. This rev-enue growth created ample fiscal space for discre-tionary spending—fiscal surpluses increased from 10 percent of GDP in 2004 to 33 percent of GDP in 2008, while government debt levels fell from 65 to 16 percent of GDP. Official reserves swelled from US$ 84 billion in 2004 to a peak of US$ 424 bil-lion in 2008, providing a substantial cushion from which higher ODA outflows could be financed. Trends are similar in Kuwait and UAE, although in both cases government debt was far smaller to begin with. The more modest growth in aggregate reserves in Kuwait and UAE (from US$ 7 billion to US$ 18 billion in Kuwait, and from US$ 19 bil-lion to US$ 28 billion in UAE between 2004 and 2008) reflects the use of sovereign wealth funds in those countries, as compared to KSA, which does not make use of such funds to manage its official reserves. In 2009, falling global petroleum prices contributed to a decline in revenues across the three states, leading in turn to a pronounced reduction in fiscal surpluses (and a projected deficit in KSA) as well as a modest drop in foreign exchange reserves.
Political and security issues have also influenced the allocation of Arab ODA to specific countries. At the 1974 Arab Summit Conference in Rabat, Morocco, oil exporting Arab countries agreed to extend sup-port to Egypt, Jordan and Syria, each of which was absorbing a large number of refugees from West Bank and Gaza. Between 1975 and 1979, over US$ 15 billion (in 2007 prices) in Arab aid was grant-ed to Egypt (though aid was halted after the 1978 Camp David Accord that led to the signing of the 1979 peace treaty between Israel and Egypt). At the 1978 Arab Summit in Baghdad, an agreement was
reached to provide an annual grant of US$ 3.5 bil-lion to the front-line states bordering Israel (Egypt, Jordan, Syria, and Lebanon). Low levels of aid in the late 1980s and early 1990s also reflected the re-flows of principal payments of aid loans extended in the previous years, as well as heavy military expen-ditures due to regional conflicts and the cessation of large amounts of general support to Jordan and Syria pledged under the 1978 Arab Summit.14 Re-construction needs in Kuwait and the fiscal strains in KSA following assistance provided to allies in the 1990–91 Gulf War contributed to a drop in aid from the three main Arab donors up to the mid-1990s.
Recent increases in Arab ODA have been influ-enced by the urgent need for post-conflict recon-struction. The countries of the Gulf Cooperation Council (GCC)15 have supported the reconstruc-tion of Lebanon following the 2006 war; Afghani-stan, Iraq, and Yemen after the 2006 Consultative Group meeting; and Gaza after the 2009 incur-sion. Yemen, for instance, received about US$ 5.3 billion in new donor pledges in late 2006, almost two-thirds of which originated from GCC coun-tries and Arab financial institutions.
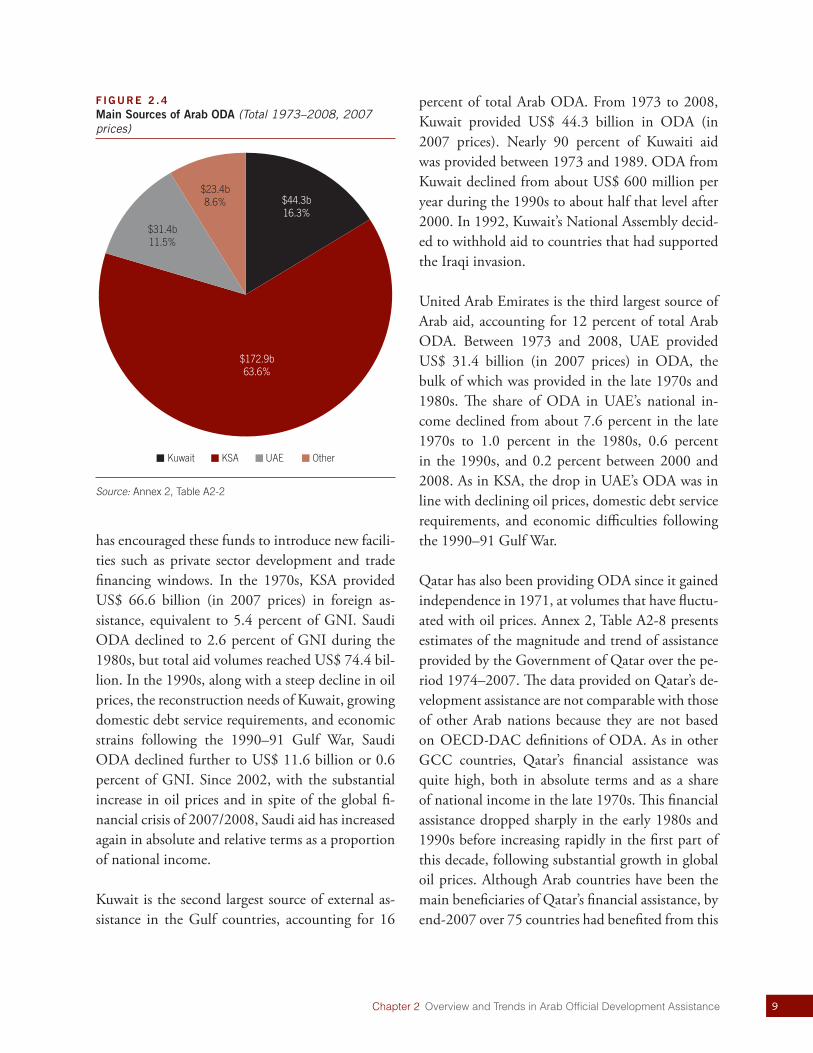
MAIN SOURCES OF ARAB ODA
KSA ranks as the top Gulf and Arab donor, ac-counting for almost two-thirds of total Arab ODA. Figure 2.4 shows that, between 1973 and 2008, 64 percent of total Arab ODA was provided by KSA—the majority on highly concessionary terms. KSA has also played an important role in support-ing Arab funds and multilateral development banks (Chapter 3). It is the leading contributor of capital, has consistently supported capital increases, and
14 Van den Boogaerde (1991)15 The GCC was established in May 1981 in Riyadh, Saudi Arabia, and comprises Bahrain, Kuwait, Oman, Qatar, Saudi Arabia, and UAE.
9Chapter 2 Overview and Trends in Arab Official Development Assistance
has encouraged these funds to introduce new facili-ties such as private sector development and trade financing windows. In the 1970s, KSA provided US$ 66.6 billion (in 2007 prices) in foreign as-sistance, equivalent to 5.4 percent of GNI. Saudi ODA declined to 2.6 percent of GNI during the 1980s, but total aid volumes reached US$ 74.4 bil-lion. In the 1990s, along with a steep decline in oil prices, the reconstruction needs of Kuwait, growing domestic debt service requirements, and economic strains following the 1990–91 Gulf War, Saudi ODA declined further to US$ 11.6 billion or 0.6 percent of GNI. Since 2002, with the substantial increase in oil prices and in spite of the global fi-nancial crisis of 2007/2008, Saudi aid has increased again in absolute and relative terms as a proportion of national income.
Kuwait is the second largest source of external as-sistance in the Gulf countries, accounting for 16
percent of total Arab ODA. From 1973 to 2008, Kuwait provided US$ 44.3 billion in ODA (in 2007 prices). Nearly 90 percent of Kuwaiti aid was provided between 1973 and 1989. ODA from Kuwait declined from about US$ 600 million per year during the 1990s to about half that level after 2000. In 1992, Kuwait’s National Assembly decid-ed to withhold aid to countries that had supported the Iraqi invasion.
United Arab Emirates is the third largest source of Arab aid, accounting for 12 percent of total Arab ODA. Between 1973 and 2008, UAE provided US$ 31.4 billion (in 2007 prices) in ODA, the bulk of which was provided in the late 1970s and 1980s. The share of ODA in UAE’s national in-come declined from about 7.6 percent in the late 1970s to 1.0 percent in the 1980s, 0.6 percent in the 1990s, and 0.2 percent between 2000 and 2008. As in KSA, the drop in UAE’s ODA was in line with declining oil prices, domestic debt service requirements, and economic difficulties following the 1990–91 Gulf War.
Qatar has also been providing ODA since it gained independence in 1971, at volumes that have fluctu-ated with oil prices. Annex 2, Table A2-8 presents estimates of the magnitude and trend of assistance provided by the Government of Qatar over the pe-riod 1974–2007. The data provided on Qatar’s de-velopment assistance are not comparable with those of other Arab nations because they are not based on OECD-DAC definitions of ODA. As in other GCC countries, Qatar’s financial assistance was quite high, both in absolute terms and as a share of national income in the late 1970s. This financial assistance dropped sharply in the early 1980s and 1990s before increasing rapidly in the first part of this decade, following substantial growth in global oil prices. Although Arab countries have been the main beneficiaries of Qatar’s financial assistance, by end-2007 over 75 countries had benefited from this
F IGURE 2 .4 Main Sources of Arab ODA (Total 1973–2008, 2007 prices)
OtherUAEKSAKuwait
$44.3b16.3%
$172.9b63.6%
$31.4b11.5%
$23.4b8.6%
Source: Annex 2, Table A2-2
10 ARAB DEVELOPMENT ASSISTANCE
assistance, the bulk of which was for humanitarian relief and reconstruction, security, and economic infrastructure development.16
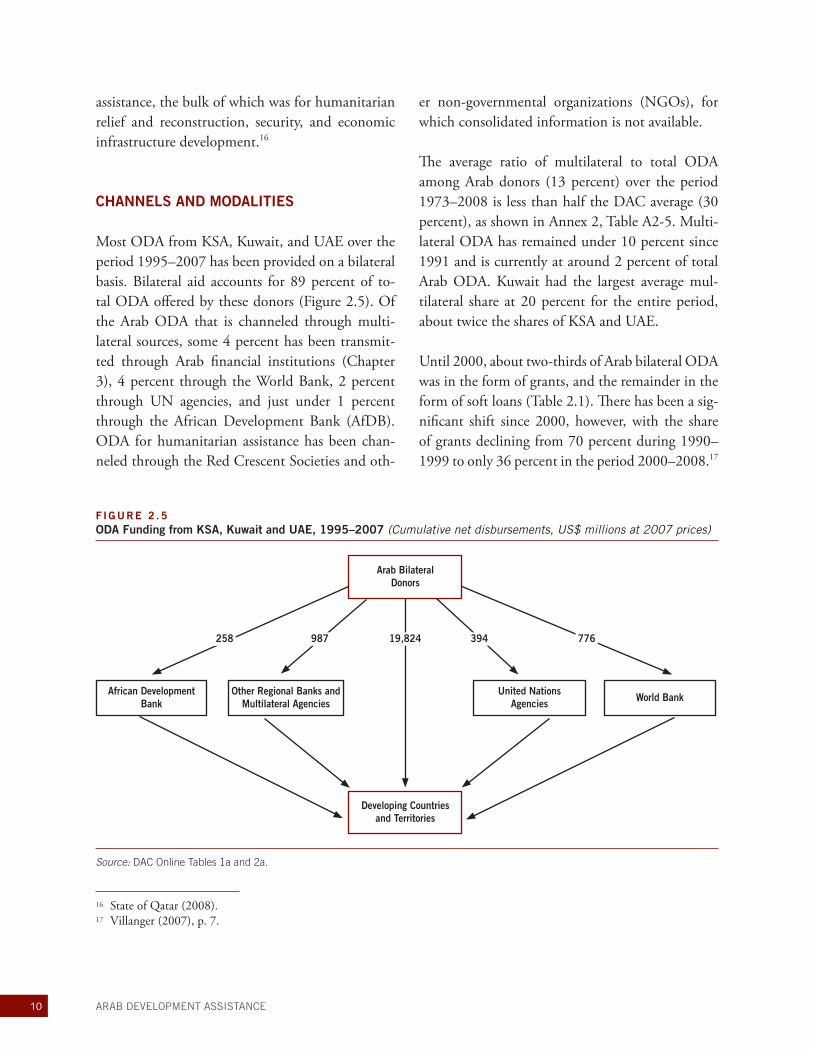
CHANNELS AND MODALITIES
Most ODA from KSA, Kuwait, and UAE over the period 1995–2007 has been provided on a bilateral basis. Bilateral aid accounts for 89 percent of to-tal ODA offered by these donors (Figure 2.5). Of the Arab ODA that is channeled through multi-lateral sources, some 4 percent has been transmit-ted through Arab financial institutions (Chapter 3), 4 percent through the World Bank, 2 percent through UN agencies, and just under 1 percent through the African Development Bank (AfDB). ODA for humanitarian assistance has been chan-neled through the Red Crescent Societies and oth-
er non-governmental organizations (NGOs), for which consolidated information is not available.
The average ratio of multilateral to total ODA among Arab donors (13 percent) over the period 1973–2008 is less than half the DAC average (30 percent), as shown in Annex 2, Table A2-5. Multi-lateral ODA has remained under 10 percent since 1991 and is currently at around 2 percent of total Arab ODA. Kuwait had the largest average mul-tilateral share at 20 percent for the entire period, about twice the shares of KSA and UAE.
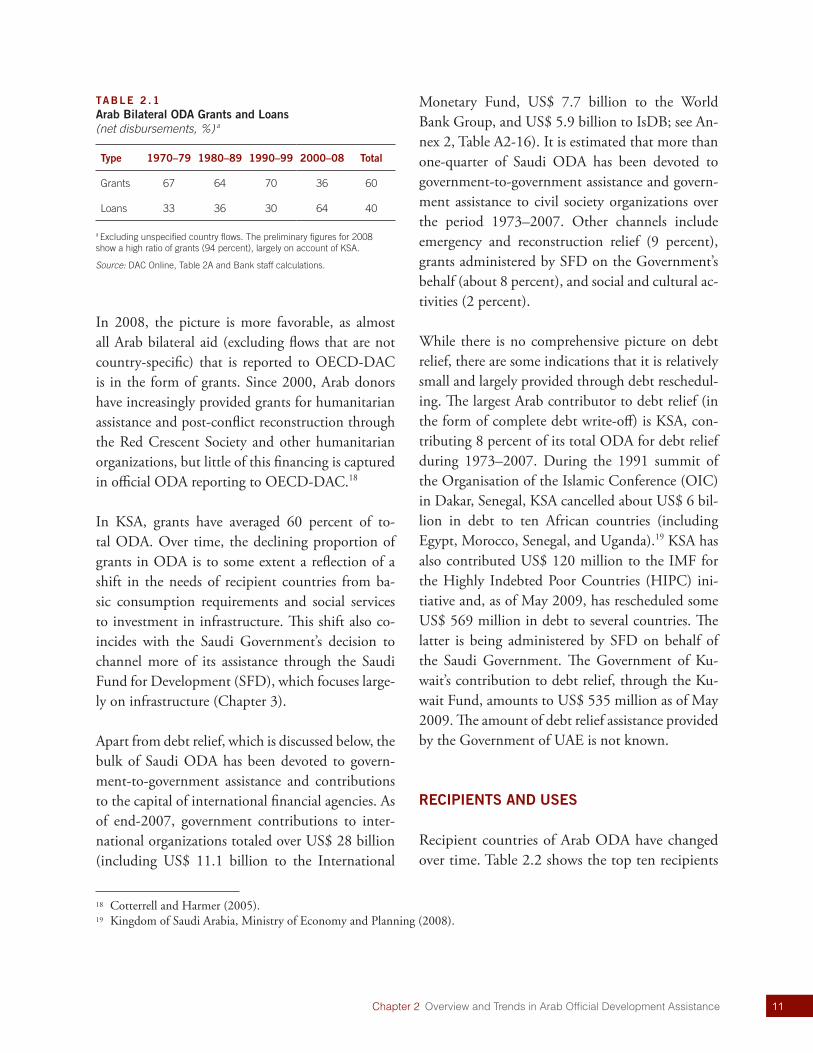
Until 2000, about two-thirds of Arab bilateral ODA was in the form of grants, and the remainder in the form of soft loans (Table 2.1). There has been a sig-nificant shift since 2000, however, with the share of grants declining from 70 percent during 1990–1999 to only 36 percent in the period 2000–2008.17
16 State of Qatar (2008). 17 Villanger (2007), p. 7.
F IGURE 2 .5 ODA Funding from KSA, Kuwait and UAE, 1995–2007 (Cumulative net disbursements, US$ millions at 2007 prices)
Source: DAC Online Tables 1a and 2a.
258 987 19,824 394 776
Arab Bilateral Donors
Developing Countries and Territories
African Development Bank
Other Regional Banks and Multilateral Agencies
United Nations Agencies World Bank
11Chapter 2 Overview and Trends in Arab Official Development Assistance
In 2008, the picture is more favorable, as almost all Arab bilateral aid (excluding flows that are not country-specific) that is reported to OECD-DAC is in the form of grants. Since 2000, Arab donors have increasingly provided grants for humanitarian assistance and post-conflict reconstruction through the Red Crescent Society and other humanitarian organizations, but little of this financing is captured in official ODA reporting to OECD-DAC.18
In KSA, grants have averaged 60 percent of to-tal ODA. Over time, the declining proportion of grants in ODA is to some extent a reflection of a shift in the needs of recipient countries from ba-sic consumption requirements and social services to investment in infrastructure. This shift also co-incides with the Saudi Government’s decision to channel more of its assistance through the Saudi Fund for Development (SFD), which focuses large-ly on infrastructure (Chapter 3).
Apart from debt relief, which is discussed below, the bulk of Saudi ODA has been devoted to govern-ment-to-government assistance and contributions to the capital of international financial agencies. As of end-2007, government contributions to inter-national organizations totaled over US$ 28 billion (including US$ 11.1 billion to the International
Monetary Fund, US$ 7.7 billion to the World Bank Group, and US$ 5.9 billion to IsDB; see An-nex 2, Table A2-16). It is estimated that more than one-quarter of Saudi ODA has been devoted to government-to-government assistance and govern-ment assistance to civil society organizations over the period 1973–2007. Other channels include emergency and reconstruction relief (9 percent), grants administered by SFD on the Government’s behalf (about 8 percent), and social and cultural ac-tivities (2 percent).
While there is no comprehensive picture on debt relief, there are some indications that it is relatively small and largely provided through debt reschedul-ing. The largest Arab contributor to debt relief (in the form of complete debt write-off) is KSA, con-tributing 8 percent of its total ODA for debt relief during 1973–2007. During the 1991 summit of the Organisation of the Islamic Conference (OIC) in Dakar, Senegal, KSA cancelled about US$ 6 bil-lion in debt to ten African countries (including Egypt, Morocco, Senegal, and Uganda).19 KSA has also contributed US$ 120 million to the IMF for the Highly Indebted Poor Countries (HIPC) ini-tiative and, as of May 2009, has rescheduled some US$ 569 million in debt to several countries. The latter is being administered by SFD on behalf of the Saudi Government. The Government of Ku-wait’s contribution to debt relief, through the Ku-wait Fund, amounts to US$ 535 million as of May 2009. The amount of debt relief assistance provided by the Government of UAE is not known.
RECIPIENTS AND USES
Recipient countries of Arab ODA have changed over time. Table 2.2 shows the top ten recipients
TABLE 2 .1 Arab Bilateral ODA Grants and Loans (net disbursements, %) a
Type 1970–79 1980–89 1990–99 2000–08 Total
Grants 67 64 70 36 60
Loans 33 36 30 64 40
a Excluding unspecified country flows. The preliminary figures for 2008 show a high ratio of grants (94 percent), largely on account of KSA.
Source: DAC Online, Table 2A and Bank staff calculations.
18 Cotterrell and Harmer (2005). 19 Kingdom of Saudi Arabia, Ministry of Economy and Planning (2008).
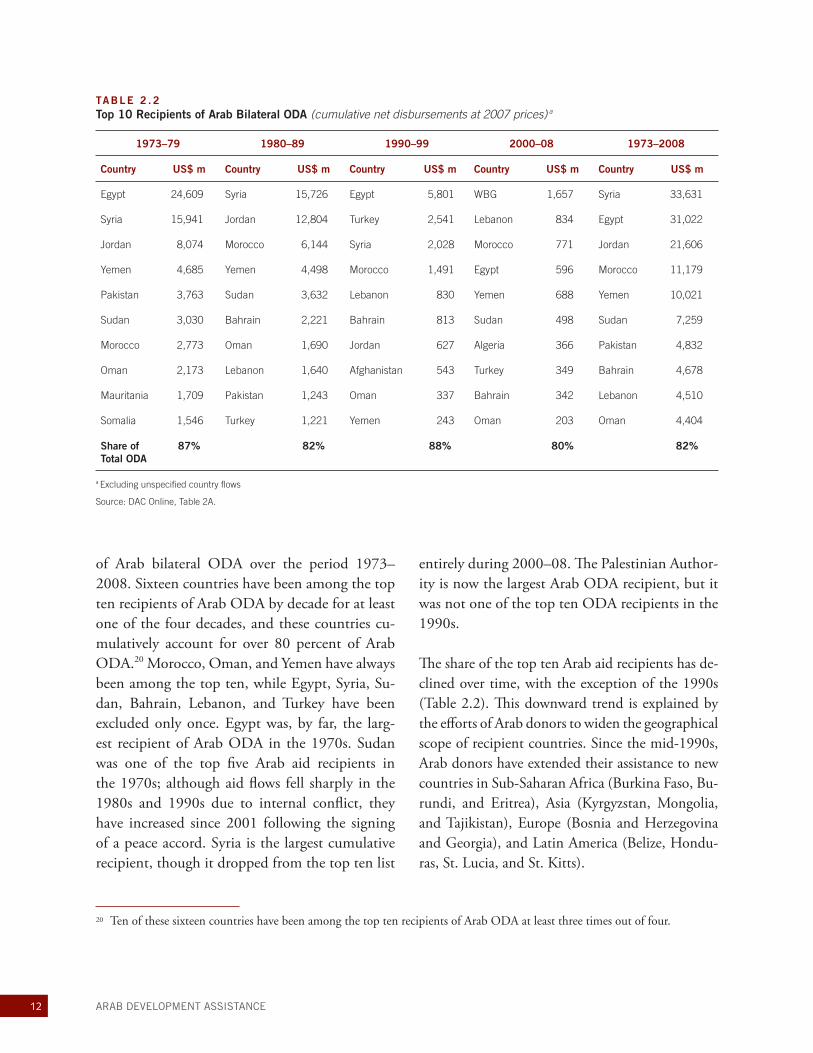
12 ARAB DEVELOPMENT ASSISTANCE
of Arab bilateral ODA over the period 1973–2008. Sixteen countries have been among the top ten recipients of Arab ODA by decade for at least one of the four decades, and these countries cu-mulatively account for over 80 percent of Arab ODA.20 Morocco, Oman, and Yemen have always been among the top ten, while Egypt, Syria, Su-dan, Bahrain, Lebanon, and Turkey have been excluded only once. Egypt was, by far, the larg-est recipient of Arab ODA in the 1970s. Sudan was one of the top five Arab aid recipients in the 1970s; although aid flows fell sharply in the 1980s and 1990s due to internal conflict, they have increased since 2001 following the signing of a peace accord. Syria is the largest cumulative recipient, though it dropped from the top ten list
entirely during 2000–08. The Palestinian Author-ity is now the largest Arab ODA recipient, but it was not one of the top ten ODA recipients in the 1990s.
The share of the top ten Arab aid recipients has de-clined over time, with the exception of the 1990s (Table 2.2). This downward trend is explained by the efforts of Arab donors to widen the geographical scope of recipient countries. Since the mid-1990s, Arab donors have extended their assistance to new countries in Sub-Saharan Africa (Burkina Faso, Bu-rundi, and Eritrea), Asia (Kyrgyzstan, Mongolia, and Tajikistan), Europe (Bosnia and Herzegovina and Georgia), and Latin America (Belize, Hondu-ras, St. Lucia, and St. Kitts).
TABLE 2 .2 Top 10 Recipients of Arab Bilateral ODA (cumulative net disbursements at 2007 prices) a
1973–79 1980–89 1990–99 2000–08 1973–2008
Country US$ m Country US$ m Country US$ m Country US$ m Country US$ m
Egypt 24,609 Syria 15,726 Egypt 5,801 WBG 1,657 Syria 33,631
Syria 15,941 Jordan 12,804 Turkey 2,541 Lebanon 834 Egypt 31,022
Jordan 8,074 Morocco 6,144 Syria 2,028 Morocco 771 Jordan 21,606
Yemen 4,685 Yemen 4,498 Morocco 1,491 Egypt 596 Morocco 11,179
Pakistan 3,763 Sudan 3,632 Lebanon 830 Yemen 688 Yemen 10,021
Sudan 3,030 Bahrain 2,221 Bahrain 813 Sudan 498 Sudan 7,259
Morocco 2,773 Oman 1,690 Jordan 627 Algeria 366 Pakistan 4,832
Oman 2,173 Lebanon 1,640 Afghanistan 543 Turkey 349 Bahrain 4,678
Mauritania 1,709 Pakistan 1,243 Oman 337 Bahrain 342 Lebanon 4,510
Somalia 1,546 Turkey 1,221 Yemen 243 Oman 203 Oman 4,404
Share of Total ODA
87% 82% 88% 80% 82%
a Excluding unspecified country flows
Source: DAC Online, Table 2A.
20 Ten of these sixteen countries have been among the top ten recipients of Arab ODA at least three times out of four.
13Chapter 2 Overview and Trends in Arab Official Development Assistance
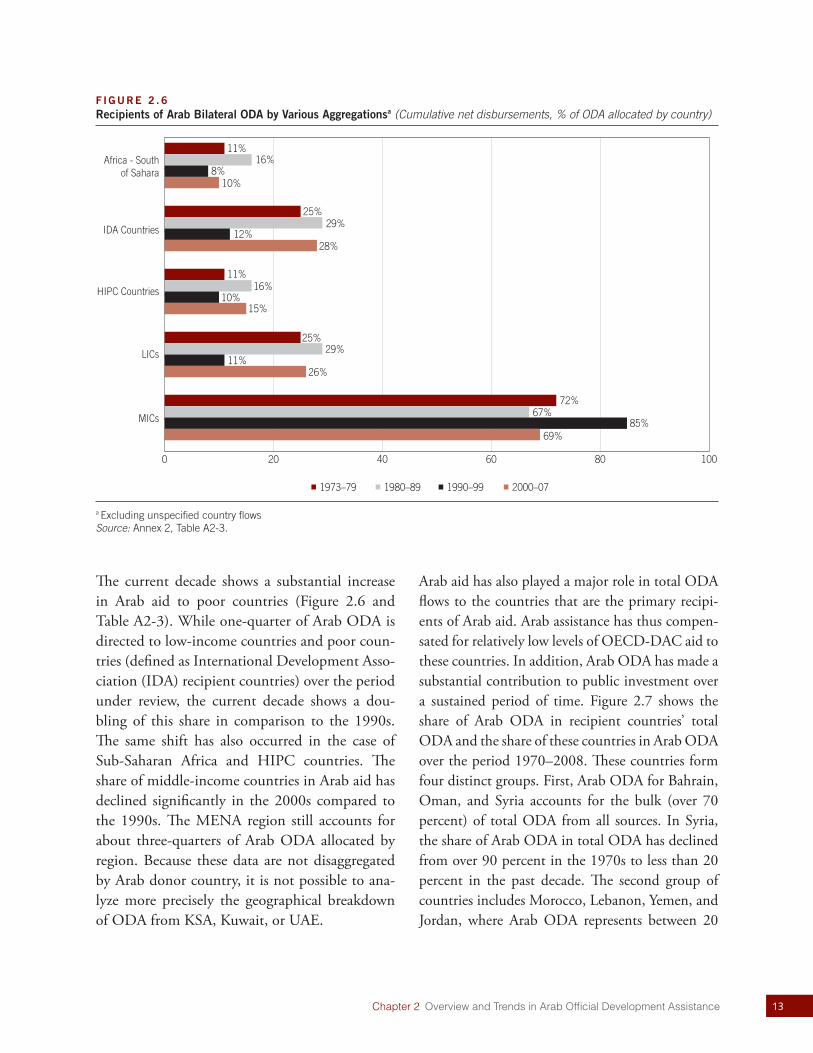
The current decade shows a substantial increase in Arab aid to poor countries (Figure 2.6 and Table A2-3). While one-quarter of Arab ODA is directed to low-income countries and poor coun-tries (defined as International Development Asso-ciation (IDA) recipient countries) over the period under review, the current decade shows a dou-bling of this share in comparison to the 1990s. The same shift has also occurred in the case of Sub-Saharan Africa and HIPC countries. The share of middle-income countries in Arab aid has declined significantly in the 2000s compared to the 1990s. The MENA region still accounts for about three-quarters of Arab ODA allocated by region. Because these data are not disaggregated by Arab donor country, it is not possible to ana-lyze more precisely the geographical breakdown of ODA from KSA, Kuwait, or UAE.
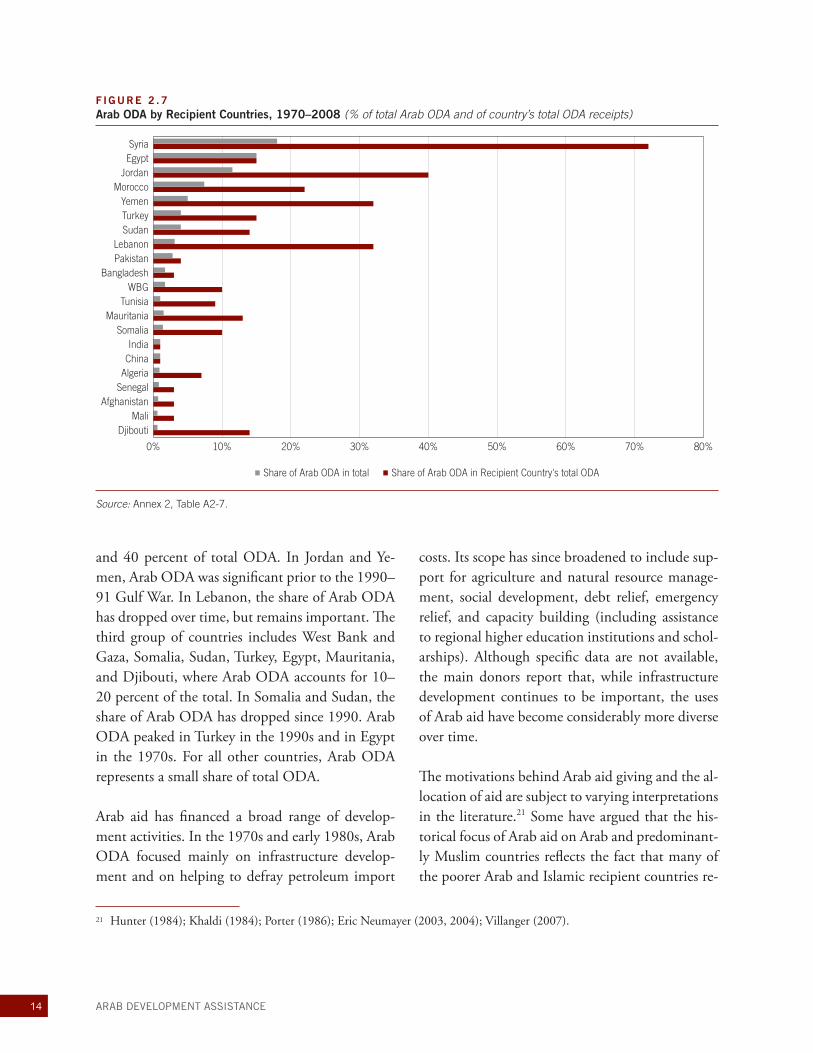
Arab aid has also played a major role in total ODA flows to the countries that are the primary recipi-ents of Arab aid. Arab assistance has thus compen-sated for relatively low levels of OECD-DAC aid to these countries. In addition, Arab ODA has made a substantial contribution to public investment over a sustained period of time. Figure 2.7 shows the share of Arab ODA in recipient countries’ total ODA and the share of these countries in Arab ODA over the period 1970–2008. These countries form four distinct groups. First, Arab ODA for Bahrain, Oman, and Syria accounts for the bulk (over 70 percent) of total ODA from all sources. In Syria, the share of Arab ODA in total ODA has declined from over 90 percent in the 1970s to less than 20 percent in the past decade. The second group of countries includes Morocco, Lebanon, Yemen, and Jordan, where Arab ODA represents between 20
F IGURE 2 .6 Recipients of Arab Bilateral ODA by Various Aggregationsa (Cumulative net disbursements, % of ODA allocated by country)
1973–79 1980–89 1990–99 2000–07
0 20
11%16%
8%10%
25%29%
12%28%
11%16%
10%15%
25%29%
11%26%
72%67%
85%69%
40 60 80 100
MICs
LICs
HIPC Countries
IDA Countries
Africa - Southof Sahara
a Excluding unspecified country flowsSource: Annex 2, Table A2-3.
14 ARAB DEVELOPMENT ASSISTANCE
and 40 percent of total ODA. In Jordan and Ye-men, Arab ODA was significant prior to the 1990–91 Gulf War. In Lebanon, the share of Arab ODA has dropped over time, but remains important. The third group of countries includes West Bank and Gaza, Somalia, Sudan, Turkey, Egypt, Mauritania, and Djibouti, where Arab ODA accounts for 10–20 percent of the total. In Somalia and Sudan, the share of Arab ODA has dropped since 1990. Arab ODA peaked in Turkey in the 1990s and in Egypt in the 1970s. For all other countries, Arab ODA represents a small share of total ODA.
Arab aid has financed a broad range of develop-ment activities. In the 1970s and early 1980s, Arab ODA focused mainly on infrastructure develop-ment and on helping to defray petroleum import
costs. Its scope has since broadened to include sup-port for agriculture and natural resource manage-ment, social development, debt relief, emergency relief, and capacity building (including assistance to regional higher education institutions and schol-arships). Although specific data are not available, the main donors report that, while infrastructure development continues to be important, the uses of Arab aid have become considerably more diverse over time.
The motivations behind Arab aid giving and the al-location of aid are subject to varying interpretations in the literature.21 Some have argued that the his-torical focus of Arab aid on Arab and predominant-ly Muslim countries reflects the fact that many of the poorer Arab and Islamic recipient countries re-
F IGURE 2 .7 Arab ODA by Recipient Countries, 1970–2008 (% of total Arab ODA and of country’s total ODA receipts)
0% 10% 20% 30% 40% 50% 60% 70% 80%
DjiboutiMali
AfghanistanSenegalAlgeriaChinaIndia
SomaliaMauritania
TunisiaWBG
BangladeshPakistanLebanon
SudanTurkeyYemen
MoroccoJordanEgyptSyria
Share of Arab ODA in total Share of Arab ODA in Recipient Country's total ODA
Source: Annex 2, Table A2-7.
21 Hunter (1984); Khaldi (1984); Porter (1986); Eric Neumayer (2003, 2004); Villanger (2007).
15Chapter 2 Overview and Trends in Arab Official Development Assistance
22 Neumayer (2003) finds that a typical Arab recipient country received 22 times more bilateral Arab ODA and six times more multilateral Arab ODA than a non-Arab recipient country in the period 1974–1997.
ceive limited aid from OECD donors. Other stud-ies have found that Arab aid is primarily driven by social solidarity, religious affiliation, and empathy with poorer countries. The favoring of Arab coun-tries in Arab aid giving can be seen as an expres-sion of Arab solidarity or as a reflection of efforts to build strong relations among Arab countries.22
Econometric analysis carried out for this study sug-gests that sub-Saharan African, MENA, and Asian countries are most likely to have access to Arab ODA. Poorer and smaller countries are more like-
ly to be deemed eligible for aid from Arab donor countries. In addition, a greater volume of Arab ODA goes to more populous countries. Overall, these empirical results suggest that Arab donors do not use aid as a means of export promotion. This analysis could be strengthened by incorporating variables that measure the size and role of ODA from OECD-DAC and other sources. The degree to which Arab ODA serves to complement or sub-stitute for aid from other sources is an important question for future research.

17
Since the 1960s, and more notably the 1970s, a de-velopment assistance architecture including three national funds and six major multilateral agencies has been in operation in the region. These funds and banks make an important contribution to de-velopment assistance by financing development activities worldwide. Arab donors also play an im-portant role as shareholders and financiers of the Bretton Woods institutions and other multilateral development agencies.
STRATEGIC ORIENTATION OF ARAB FINANCIAL ASSISTANCE INSTITUTIONS
A. Institutions
Arab financial assistance is managed by a complex range of national and multilateral agencies. Kuwait, KSA, and UAE have long-established national aid agencies in the form of bilateral assistance funds.
In addition, there are five main regional financial institutions: the Arab Fund for Economic and So-cial Development (AFESD), founded in 1971; the Arab Bank for Economic Development in Af-rica (BADEA), founded in 1973; IsDB, the largest of these institutions, founded in 1975; the OPEC Fund for International Development (OFID), es-tablished in 1976; and the Arab Monetary Fund (AMF), established in 1976. Strictly speaking, IsDB and OFID are not exclusively Arab-financed institu-tions, but Arab countries provide the largest share of funding.23 The Arab Gulf Programme for United Nations Development Organizations (AGFUND), founded in 1980, plays a major role in financing technical cooperation and humanitarian assistance through its support for specialized UN agencies. (See Annex 1 for more details on each of these agencies.)
Among the oil-rich Gulf states, Kuwait was a pi-oneer in the provision of external assistance. The Kuwait Fund for Arab Economic Development
C H A P T E R 3
Institutional Framework for Arab Financial Assistance
Arab nations were among the first developing countries to establish specialized
institutions to provide development assistance to low-income nations. This
chapter discusses the loans, grants, equity investments, and other development
financing that is channeled through bilateral funds and multilateral banks and
funds that are predominantly owned and capitalized by Arab nations.
23 Saudi Arabia’s contribution represents 30 percent of OFID’s capital and 25 percent of IsDB’s capital. Kuwait’s shares are 7 percent and 8 percent, respectively.
18 ARAB DEVELOPMENT ASSISTANCE
(KFAED) was established in 1961. Although origi-nally designed to assist Arab countries, KFAED’s mandate was broadened in 1974 to include all de-veloping countries. In addition to using the fund’s own resources, all bilateral ODA and some other bi-lateral assistance from the Government of Kuwait is channeled through KFAED. The UAE established the Abu Dhabi Fund for Development (ADFD) in 1971. Its mandate was enlarged in 1974, follow-ing a substantial increase in resources, to include all developing countries. The Saudi Fund for Devel-opment (SFD), established in 1974, had an initial mandate to provide financing for projects in all de-veloping countries.
In the three main Gulf donor countries, aid manage-ment is divided among various government depart-ments. The national funds are primarily responsible for project assistance. As mentioned above, Ku-wait channels the majority of its bilateral assistance through KFAED; the Kuwaiti Government’s Perma-nent Committee of External Assistance, with seven members from various ministries, reviews financing requests (including from NGOs) and makes recom-mendations to the Cabinet. In addition to national funds in KSA and UAE, these governments also dis-burse aid directly to beneficiary countries through ministries of finance and foreign affairs as well as line ministries.24 Bilateral aid from these three major Arab donors accounts for 87 percent of total assis-tance for the period 1973–2007, with the balance
channeled through various multilateral agencies (Chapter 2). Due to a lack of detailed data, it is dif-ficult to accurately assess trends in the assistance of major Arab financial assistance agencies.
Coordination between Arab financial assistance agencies and OECD-DAC has intensified in re-cent years, holding the promise of considerably im-proved information flows in the future.25 A joint meeting of the Coordination Group and OECD-DAC was held in Kuwait in May 2009. The meet-ing led to the adoption of a six-point Partnership Action Plan: (i) holding a high-level policy dia-logue every two years; (ii) holding regular consulta-tions; (iii) Coordination Group participation in the Working Party on Aid Effectiveness; (iv) consulta-tion at the technical level to identify opportunities for practical collaboration in specific countries; (v) exploration of the potential for bilateral staff exchanges; and (vi) exchange of information and statistics on ODA submitted by the Coordination Group’s member countries.
The main Arab financiers are also important con-tributors to non-Arab multilateral financial in-stitutions (Annex 2, Table A2–16). To encourage cooperation, the Arab funds also tend to have own-ership stakes in one another.26
Increasingly, Arab financial agencies have become involved in providing humanitarian assistance, par-
24 Information on direct government-to-government assistance is not available for public scrutiny from the Gulf donor states. Moreover, official aid channeled directly from government ministries tends not to be governed by a formal aid policy or account-ability framework. Kuwait’s development assistance has been integrated recently within the Ministry of Foreign Affairs; in other countries, oversight responsibilities are more diffuse.25 Since 2007, members of the Coordination Group and OECD-DAC have begun to revive the regular dialogue they pursued until the 1980s. In a meeting chaired by the Coordination Group in Kuwait on February 4, 2007, participants from both donor groups agreed on the need for better information flows between all donors. Speaking on behalf of the Coordination Group at the 2008 Accra High-Level Forum on Aid Effectiveness, OFID confirmed the Group’s strong interest in deeper dialogue with DAC. 26 For example, ADFD is a contributor to AFESD, IsDB, BADEA, AMF, the Arab Trade Financing Program, OFID, Arab Or-ganization for Agricultural Development, Arab Authority for Agricultural Investment and Development, and the Arab Agency for Investment Guarantee. Likewise, KFAED has provided financing to AMF, the Inter-Arab Investment Guarantee Corporation, AfDB, African Investment Fund, and IFAD.
19Chapter 3 Institutional Framework for Arab Financial Assistance
ticularly in post-conflict states and countries suf-fering from natural disasters. A large share of Arab humanitarian aid is channeled through the Arab Red Crescent and Red Cross societies. These agen-cies are coordinated, in turn, through the Confer-ence of Arab Red Crescent and Red Cross Societies and its secretariat in Jeddah, KSA. The League of Arab States (LAS) has also come to play a more prominent role in coordinating assistance for hu-manitarian affairs. Though traditionally focused on coordinating assistance for West Bank and Gaza, LAS has turned its attention recently to a number of other crises.27
B. Organizational Mandates
The mandates of the Arab financial assistance agen-cies require them to provide assistance to foster eco-nomic and social development, with distinctions drawn between those that are mandated to specifi-cally assist Arab member states (e.g., AFESD and AMF) and those with a broader geographic reach. With the exception of SFD, none of the Arab fi-nancial assistance agencies is mandated to promote home-country trade. OFID focuses on encouraging cooperation among oil-exporters and other coun-tries, IsDB works to foster principles of Islamic financing, and AMF promotes monetary stability, financial integration and trade flows. While all of the Arab aid organizations have equated economic and social development with poverty reduction, AGFUND’s mandate is the most specific in its fo-cus on sustainable human development. (See Annex 1, Table A1-2 for a more detailed discussion of the mandates of the main Arab financial organizations.)
The mandates of Arab funds are interpreted and operationalized through evolving corporate strate-gies and plans. The initial strategic imperative of
Gulf financial assistance agencies was to finance infrastructure projects, but more recently corpo-rate strategies have emphasized poverty reduction, social sector development, private sector develop-ment (including investment support), trade expan-sion and coordination (through the Arab Trade Financing Program (ATFP), for example), intro-duction of Islamic financing instruments, and regional cooperation. As Arab aid agencies have matured and expanded, corporate strategies have introduced new business processes, partnership modes, and assistance instruments and launched a number of special initiatives to focus assistance on disaster reconstruction, development in sub-Saha-ran Africa, and reaching the poorest of the poor. A large number of new specialized funds, corpora-tions, facilities, and assistance windows have been established to manage private sector operations and earmark financing for new areas of strategic interest (see Box 3.2 below).
At the country level, Arab financial assistance is directed toward priorities set by the national au-thorities of recipient countries. Arab donors do not prepare agency-specific country assistance strate-gies, preferring instead to position their assistance in support of the recipient’s requests. For the ma-jor recipient countries, multi-year assistance pipe-lines are, however, prepared by several agencies. Such pipelines (or business plans) serve to iden-tify agreed lending and non-lending operations and describe links to national development goals, plans, and strategies. Participatory and consulta-tive approaches are also used to elicit priorities and feedback from beneficiaries, particularly during the identification of new assistance operations.
Arab financial assistance agencies rely on core staff-ing and limited in-country presence to tailor their
27 In 1993, the Council of the Arab League passed a resolution committing its members to provide assistance to Somalia. More recently, league members have committed assistance to overcome humanitarian crises in Afghanistan, Iraq, and Sudan.
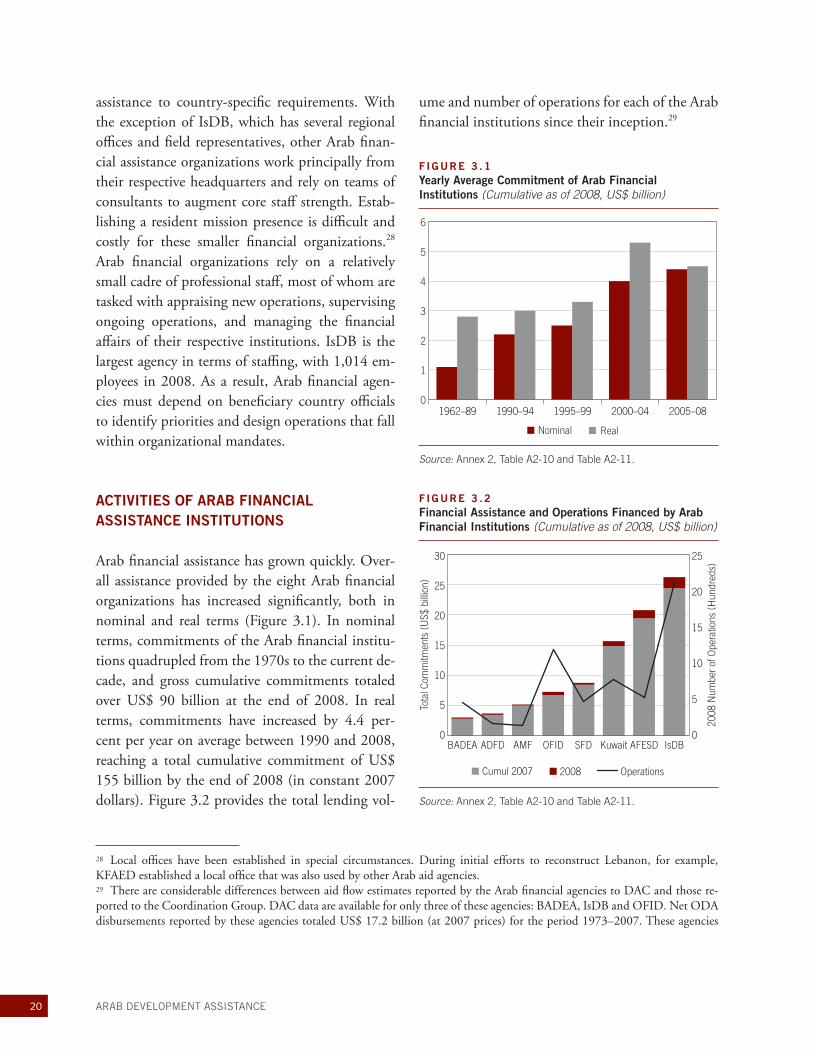
20 ARAB DEVELOPMENT ASSISTANCE
assistance to country-specific requirements. With the exception of IsDB, which has several regional offices and field representatives, other Arab finan-cial assistance organizations work principally from their respective headquarters and rely on teams of consultants to augment core staff strength. Estab-lishing a resident mission presence is difficult and costly for these smaller financial organizations.28 Arab financial organizations rely on a relatively small cadre of professional staff, most of whom are tasked with appraising new operations, supervising ongoing operations, and managing the financial affairs of their respective institutions. IsDB is the largest agency in terms of staffing, with 1,014 em-ployees in 2008. As a result, Arab financial agen-cies must depend on beneficiary country officials to identify priorities and design operations that fall within organizational mandates.
ACTIVITIES OF ARAB FINANCIAL ASSISTANCE INSTITUTIONS
Arab financial assistance has grown quickly. Over-all assistance provided by the eight Arab financial organizations has increased significantly, both in nominal and real terms (Figure 3.1). In nominal terms, commitments of the Arab financial institu-tions quadrupled from the 1970s to the current de-cade, and gross cumulative commitments totaled over US$ 90 billion at the end of 2008. In real terms, commitments have increased by 4.4 per-cent per year on average between 1990 and 2008, reaching a total cumulative commitment of US$ 155 billion by the end of 2008 (in constant 2007 dollars). Figure 3.2 provides the total lending vol-
ume and number of operations for each of the Arab financial institutions since their inception.29
28 Local offices have been established in special circumstances. During initial efforts to reconstruct Lebanon, for example, KFAED established a local office that was also used by other Arab aid agencies.29 There are considerable differences between aid flow estimates reported by the Arab financial agencies to DAC and those re-ported to the Coordination Group. DAC data are available for only three of these agencies: BADEA, IsDB and OFID. Net ODA disbursements reported by these agencies totaled US$ 17.2 billion (at 2007 prices) for the period 1973–2007. These agencies
F IGURE 3 .1 Yearly Average Commitment of Arab Financial Institutions (Cumulative as of 2008, US$ billion)
0
1
2
3
4
5
6
RealNominal
2005–082000–041995–991990–941962–89
Source: Annex 2, Table A2-10 and Table A2-11.
F IGURE 3 .2 Financial Assistance and Operations Financed by Arab Financial Institutions (Cumulative as of 2008, US$ billion)
0
5
10
15
20
25
30
IsDBAFESDKuwaitSFDOFIDAMFADFDBADEA0
5
10
15
20
25
Tota
l Com
mitm
ents
(US$
bill
ion)
2008
Num
ber o
f Ope
ratio
ns (H
undr
eds)
2008 OperationsCumul 2007
Source: Annex 2, Table A2-10 and Table A2-11.
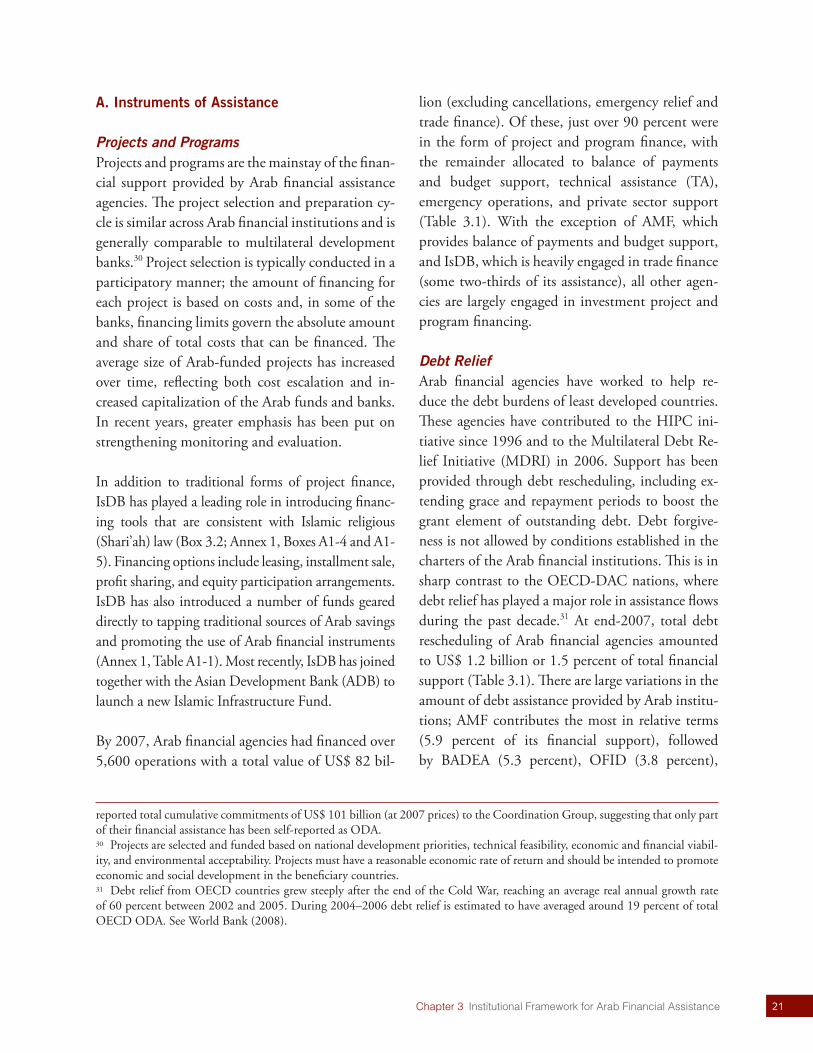
21Chapter 3 Institutional Framework for Arab Financial Assistance
A. Instruments of Assistance
Projects and ProgramsProjects and programs are the mainstay of the finan-cial support provided by Arab financial assistance agencies. The project selection and preparation cy-cle is similar across Arab financial institutions and is generally comparable to multilateral development banks.30 Project selection is typically conducted in a participatory manner; the amount of financing for each project is based on costs and, in some of the banks, financing limits govern the absolute amount and share of total costs that can be financed. The average size of Arab-funded projects has increased over time, reflecting both cost escalation and in-creased capitalization of the Arab funds and banks. In recent years, greater emphasis has been put on strengthening monitoring and evaluation.
In addition to traditional forms of project finance, IsDB has played a leading role in introducing financ-ing tools that are consistent with Islamic religious (Shari’ah) law (Box 3.2; Annex 1, Boxes A1-4 and A1-5). Financing options include leasing, installment sale, profit sharing, and equity participation arrangements. IsDB has also introduced a number of funds geared directly to tapping traditional sources of Arab savings and promoting the use of Arab financial instruments (Annex 1, Table A1-1). Most recently, IsDB has joined together with the Asian Development Bank (ADB) to launch a new Islamic Infrastructure Fund.
By 2007, Arab financial agencies had financed over 5,600 operations with a total value of US$ 82 bil-
lion (excluding cancellations, emergency relief and trade finance). Of these, just over 90 percent were in the form of project and program finance, with the remainder allocated to balance of payments and budget support, technical assistance (TA), emergency operations, and private sector support (Table 3.1). With the exception of AMF, which provides balance of payments and budget support, and IsDB, which is heavily engaged in trade finance (some two-thirds of its assistance), all other agen-cies are largely engaged in investment project and program financing.
Debt ReliefArab financial agencies have worked to help re-duce the debt burdens of least developed countries. These agencies have contributed to the HIPC ini-tiative since 1996 and to the Multilateral Debt Re-lief Initiative (MDRI) in 2006. Support has been provided through debt rescheduling, including ex-tending grace and repayment periods to boost the grant element of outstanding debt. Debt forgive-ness is not allowed by conditions established in the charters of the Arab financial institutions. This is in sharp contrast to the OECD-DAC nations, where debt relief has played a major role in assistance flows during the past decade.31 At end-2007, total debt rescheduling of Arab financial agencies amounted to US$ 1.2 billion or 1.5 percent of total financial support (Table 3.1). There are large variations in the amount of debt assistance provided by Arab institu-tions; AMF contributes the most in relative terms (5.9 percent of its financial support), followed by BADEA (5.3 percent), OFID (3.8 percent),
reported total cumulative commitments of US$ 101 billion (at 2007 prices) to the Coordination Group, suggesting that only part of their financial assistance has been self-reported as ODA.30 Projects are selected and funded based on national development priorities, technical feasibility, economic and financial viabil-ity, and environmental acceptability. Projects must have a reasonable economic rate of return and should be intended to promote economic and social development in the beneficiary countries.31 Debt relief from OECD countries grew steeply after the end of the Cold War, reaching an average real annual growth rate of 60 percent between 2002 and 2005. During 2004–2006 debt relief is estimated to have averaged around 19 percent of total OECD ODA. See World Bank (2008).
22 ARAB DEVELOPMENT ASSISTANCE
KFAED (2.8 percent),32 and IsDB (0.5 percent). (Beneficiary countries of debt relief are shown in Annex 2, Table A2–15.) In its latest corporate plan, BADEA has indicated that it will also participate in debt relief operations in the years to come.
Balance of Payments and Budget SupportMajor actors in this domain are AMF, BADEA, OFID, and to some extent ADFD. AMF provides short-term financing (three- to five-year loan dura-tion) to address overall balance of payments deficits
in its 22 member countries. By end-2007, AMF had issued balance of payments and budget sup-port loans worth a total of US$ 5 billion (about 6 percent of total Arab financial institution com-mitments), over 60 percent of which went to four countries: Egypt, Algeria, Morocco, and Yemen. Though AMF lending has declined in recent years owing to improvements in the foreign currency po-sition of its member countries, in 2007 AMF ex-tended two new balance of payments and budget support loans with a total value of US$ 98 million
TABLE 3 .1 Total Financial Assistance by Type and Institution Cumulative Financial Assistance (at end-2007, US$ millions) a
ADFD KFAED SFD AFESD AMF BADEA OFID IsDBe Totale %
Loans 3,231 14,391 8,410 18,911 4,681 2,560 6,015 20,277 78,475 95.9
Debt rescheduling 409 292 149 251 123 1,223 1.5
Grants b 191 26 535 78 409 873 2,112 2.6
Total 3,422 14,826 8,410 19,446 4,973 2,787 6,675 21,273 81,810 100.0
Projects/programs 3,231 14,213 8,410 19,375 2,476 5,772 20,400 73,876 90.3
BoP and budget support 4,973 214 724 5,911 7.2
Technical Assistance b 191 309 71 97 123 232 1,023 1.3
Other c 304 56 641 1,001 1.2
Total 3,422 14,826 8,410 19,446 4,973 2,787 6,675 21,273 81,810 100.0
Trade finance d 1,090 5,356 74 29,799 36,320
Other f 1,670 1,670
Grand total 3,422 14,826 9,500 19,446 10,329 2,787 8,419 51,072 119,800
Memo Items: Loans and Grants administered by National Funds (most recent data)
Loans (including rescheduled debt)
1,113 569
1,689
Grants 1,547 732 6,115 8,394
a The period of coverage varies from one institution to another as reported in Table A3-10; excludes assistance managed by national funds on behalf of their respective governments; b Underestimate, as data are partial; c Including emergency relief; d BADEA volumes: US$ 24 million (2006) and US$ 40 million (2007); e Loans and grant cancellations (US$ 3,160 million) excluded from IsDB, explaining the discrepancy between Coordination Group Secretariat figure for IsDB (US$ 24,433 million) and total (US$ 84,970 million); f Including transfers to the International Fund for Agriculture Development (IFAD) (US$ 861 million), IMF (US$ 111 million) and private sector development (US$ 649 million).
Source: Coordination Group Secretariat (total assistance by agency); Annual Report and Bank staff estimates.
32 After the liberation of Kuwait, the country wrote off the debts of some of the countries that had provided military assistance.
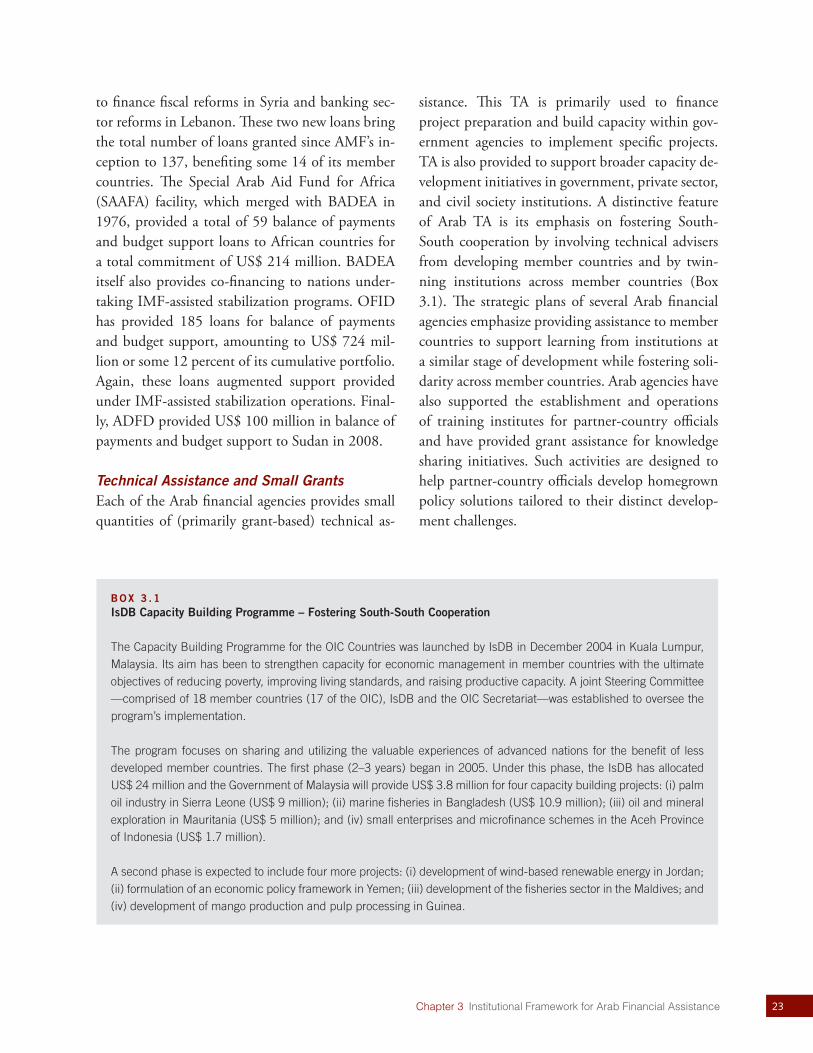
23Chapter 3 Institutional Framework for Arab Financial Assistance
to finance fiscal reforms in Syria and banking sec-tor reforms in Lebanon. These two new loans bring the total number of loans granted since AMF’s in-ception to 137, benefiting some 14 of its member countries. The Special Arab Aid Fund for Africa (SAAFA) facility, which merged with BADEA in 1976, provided a total of 59 balance of payments and budget support loans to African countries for a total commitment of US$ 214 million. BADEA itself also provides co-financing to nations under-taking IMF-assisted stabilization programs. OFID has provided 185 loans for balance of payments and budget support, amounting to US$ 724 mil-lion or some 12 percent of its cumulative portfolio. Again, these loans augmented support provided under IMF-assisted stabilization operations. Final-ly, ADFD provided US$ 100 million in balance of payments and budget support to Sudan in 2008.
Technical Assistance and Small GrantsEach of the Arab financial agencies provides small quantities of (primarily grant-based) technical as-
sistance. This TA is primarily used to finance project preparation and build capacity within gov-ernment agencies to implement specific projects. TA is also provided to support broader capacity de-velopment initiatives in government, private sector, and civil society institutions. A distinctive feature of Arab TA is its emphasis on fostering South-South cooperation by involving technical advisers from developing member countries and by twin-ning institutions across member countries (Box 3.1). The strategic plans of several Arab financial agencies emphasize providing assistance to member countries to support learning from institutions at a similar stage of development while fostering soli-darity across member countries. Arab agencies have also supported the establishment and operations of training institutes for partner-country officials and have provided grant assistance for knowledge sharing initiatives. Such activities are designed to help partner-country officials develop homegrown policy solutions tailored to their distinct develop-ment challenges.
BOX 3 .1 IsDB Capacity Building Programme – Fostering South-South Cooperation
The Capacity Building Programme for the OIC Countries was launched by IsDB in December 2004 in Kuala Lumpur, Malaysia. Its aim has been to strengthen capacity for economic management in member countries with the ultimate objectives of reducing poverty, improving living standards, and raising productive capacity. A joint Steering Committee —comprised of 18 member countries (17 of the OIC), IsDB and the OIC Secretariat—was established to oversee the program’s implementation.
The program focuses on sharing and utilizing the valuable experiences of advanced nations for the benefit of less developed member countries. The first phase (2–3 years) began in 2005. Under this phase, the IsDB has allocated US$ 24 million and the Government of Malaysia will provide US$ 3.8 million for four capacity building projects: (i) palm oil industry in Sierra Leone (US$ 9 million); (ii) marine fisheries in Bangladesh (US$ 10.9 million); (iii) oil and mineral exploration in Mauritania (US$ 5 million); and (iv) small enterprises and microfinance schemes in the Aceh Province of Indonesia (US$ 1.7 million).
A second phase is expected to include four more projects: (i) development of wind-based renewable energy in Jordan; (ii) formulation of an economic policy framework in Yemen; (iii) development of the fisheries sector in the Maldives; and (iv) development of mango production and pulp processing in Guinea.
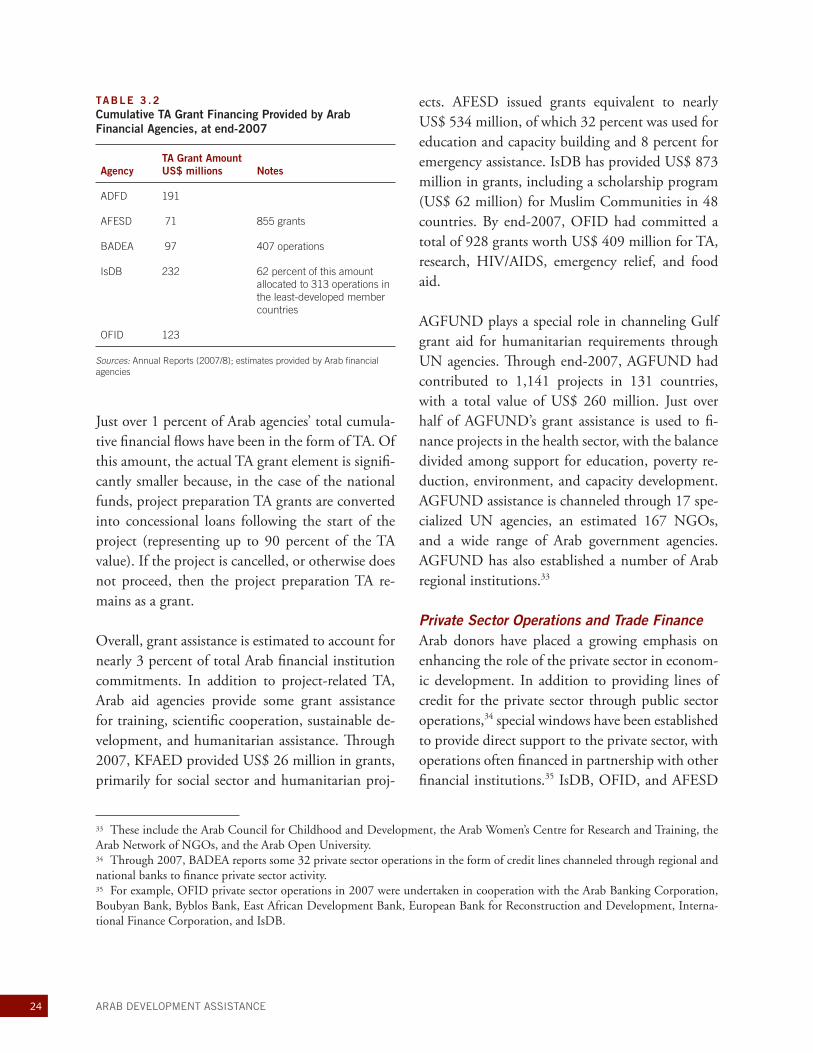
24 ARAB DEVELOPMENT ASSISTANCE
Just over 1 percent of Arab agencies’ total cumula-tive financial flows have been in the form of TA. Of this amount, the actual TA grant element is signifi-cantly smaller because, in the case of the national funds, project preparation TA grants are converted into concessional loans following the start of the project (representing up to 90 percent of the TA value). If the project is cancelled, or otherwise does not proceed, then the project preparation TA re-mains as a grant.
Overall, grant assistance is estimated to account for nearly 3 percent of total Arab financial institution commitments. In addition to project-related TA, Arab aid agencies provide some grant assistance for training, scientific cooperation, sustainable de-velopment, and humanitarian assistance. Through 2007, KFAED provided US$ 26 million in grants, primarily for social sector and humanitarian proj-
ects. AFESD issued grants equivalent to nearly US$ 534 million, of which 32 percent was used for education and capacity building and 8 percent for emergency assistance. IsDB has provided US$ 873 million in grants, including a scholarship program (US$ 62 million) for Muslim Communities in 48 countries. By end-2007, OFID had committed a total of 928 grants worth US$ 409 million for TA, research, HIV/AIDS, emergency relief, and food aid.
AGFUND plays a special role in channeling Gulf grant aid for humanitarian requirements through UN agencies. Through end-2007, AGFUND had contributed to 1,141 projects in 131 countries, with a total value of US$ 260 million. Just over half of AGFUND’s grant assistance is used to fi-nance projects in the health sector, with the balance divided among support for education, poverty re-duction, environment, and capacity development. AGFUND assistance is channeled through 17 spe-cialized UN agencies, an estimated 167 NGOs, and a wide range of Arab government agencies. AGFUND has also established a number of Arab regional institutions.33
Private Sector Operations and Trade FinanceArab donors have placed a growing emphasis on enhancing the role of the private sector in econom-ic development. In addition to providing lines of credit for the private sector through public sector operations,34 special windows have been established to provide direct support to the private sector, with operations often financed in partnership with other financial institutions.35 IsDB, OFID, and AFESD
TABLE 3 .2 Cumulative TA Grant Financing Provided by Arab Financial Agencies, at end-2007
AgencyTA Grant AmountUS$ millions Notes
ADFD 191
AFESD 71 855 grants
BADEA 97 407 operations
IsDB 232 62 percent of this amount allocated to 313 operations in the least-developed member countries
OFID 123
Sources: Annual Reports (2007/8); estimates provided by Arab financial agencies
33 These include the Arab Council for Childhood and Development, the Arab Women’s Centre for Research and Training, the Arab Network of NGOs, and the Arab Open University.34 Through 2007, BADEA reports some 32 private sector operations in the form of credit lines channeled through regional and national banks to finance private sector activity. 35 For example, OFID private sector operations in 2007 were undertaken in cooperation with the Arab Banking Corporation, Boubyan Bank, Byblos Bank, East African Development Bank, European Bank for Reconstruction and Development, Interna-tional Finance Corporation, and IsDB.
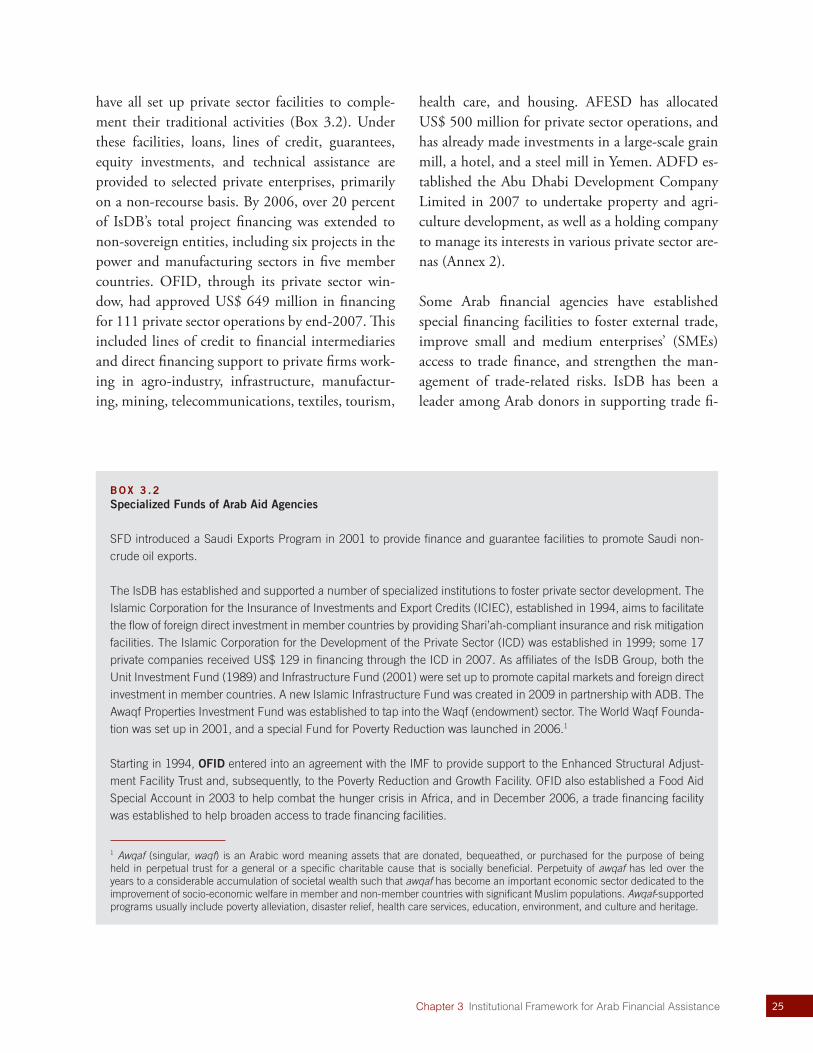
25Chapter 3 Institutional Framework for Arab Financial Assistance
have all set up private sector facilities to comple-ment their traditional activities (Box 3.2). Under these facilities, loans, lines of credit, guarantees, equity investments, and technical assistance are provided to selected private enterprises, primarily on a non-recourse basis. By 2006, over 20 percent of IsDB’s total project financing was extended to non-sovereign entities, including six projects in the power and manufacturing sectors in five member countries. OFID, through its private sector win-dow, had approved US$ 649 million in financing for 111 private sector operations by end-2007. This included lines of credit to financial intermediaries and direct financing support to private firms work-ing in agro-industry, infrastructure, manufactur-ing, mining, telecommunications, textiles, tourism,
health care, and housing. AFESD has allocated US$ 500 million for private sector operations, and has already made investments in a large-scale grain mill, a hotel, and a steel mill in Yemen. ADFD es-tablished the Abu Dhabi Development Company Limited in 2007 to undertake property and agri-culture development, as well as a holding company to manage its interests in various private sector are-nas (Annex 2).
Some Arab financial agencies have established special financing facilities to foster external trade, improve small and medium enterprises’ (SMEs) access to trade finance, and strengthen the man-agement of trade-related risks. IsDB has been a leader among Arab donors in supporting trade fi-
BOX 3 .2 Specialized Funds of Arab Aid Agencies
SFD introduced a Saudi Exports Program in 2001 to provide finance and guarantee facilities to promote Saudi non-crude oil exports.
The IsDB has established and supported a number of specialized institutions to foster private sector development. The Islamic Corporation for the Insurance of Investments and Export Credits (ICIEC), established in 1994, aims to facilitate the flow of foreign direct investment in member countries by providing Shari’ah-compliant insurance and risk mitigation facilities. The Islamic Corporation for the Development of the Private Sector (ICD) was established in 1999; some 17 private companies received US$ 129 in financing through the ICD in 2007. As affiliates of the IsDB Group, both the Unit Investment Fund (1989) and Infrastructure Fund (2001) were set up to promote capital markets and foreign direct investment in member countries. A new Islamic Infrastructure Fund was created in 2009 in partnership with ADB. The Awaqf Properties Investment Fund was established to tap into the Waqf (endowment) sector. The World Waqf Founda-tion was set up in 2001, and a special Fund for Poverty Reduction was launched in 2006.1
Starting in 1994, OFID entered into an agreement with the IMF to provide support to the Enhanced Structural Adjust-ment Facility Trust and, subsequently, to the Poverty Reduction and Growth Facility. OFID also established a Food Aid Special Account in 2003 to help combat the hunger crisis in Africa, and in December 2006, a trade financing facility was established to help broaden access to trade financing facilities.
1 Awqaf (singular, waqf) is an Arabic word meaning assets that are donated, bequeathed, or purchased for the purpose of being held in perpetual trust for a general or a specific charitable cause that is socially beneficial. Perpetuity of awqaf has led over the years to a considerable accumulation of societal wealth such that awqaf has become an important economic sector dedicated to the improvement of socio-economic welfare in member and non-member countries with significant Muslim populations. Awqaf-supported programs usually include poverty alleviation, disaster relief, health care services, education, environment, and culture and heritage.
26 ARAB DEVELOPMENT ASSISTANCE
nance. From 1975 to January 2007, trade financ-ing operations represented 66 percent of the value of IsDB’s net approvals, with total trade financing estimated at US$ 30 billion. In recent years, new trade promotion programs have been established by BADEA (in partnership with IsDB), OFID, and SFD. The BADEA Export Finance Scheme provides a specific window to finance trade be-tween African and Arab countries, with an allo-cation of US$ 100 million. AMF provides trade financing under the ATFP, which has authorized capital of US$ 500 million and has provided some US$ 6.1 billion in cumulative financing between 1991 and 2008. The ATFP aims mainly to pro-mote inter-Arab trade and foster competitiveness in the region. It also aims to play an important role in coordinating and harmonizing the interests of credit-supplier partners, including Arab funds, na-tional government and non-governmental banking and financial institutions, and joint Arab-foreign banking and financial institutions. The ATFP also provides information on Arab trade to all parties concerned through the Intra-Arab Trade Informa-tion Network (IATIN).
Regional OperationsIn addition to national projects, Arab financial assistance agencies support projects that foster re-gional economic integration, particularly in roads, energy, and hydropower infrastructure. In 2007, BADEA financed five road projects in Burkina Faso, Chad, Sierra Leone, Rwanda, and Camer-oon for a total commitment of US$ 53 million to promote trade among these nations. BADEA also financed TA aimed at exploring regional integra-tion in the “Liptaco Gourma” region connecting Burkina Faso, Mali, and Niger, and through the development of a trans-Saharan road. IsDB has supported regional integration in Africa through assistance to the Trans-Sahara and Trans-Sahel roadways, and support for the construction of the Sevare-Gao road and the Gao Bridge in Mali, and
the Agades-Zinder road in Niger. Arab financial assistance was crucial to the development of im-portant infrastructure along the Senegal River, under the aegis of OMVS (Organisation pour la Mise en Valeur du fleuve Senegal), including the construction of the Manantali dam in Mali and Diama dam in Senegal. Similarly, Arab support helped finance the Kompienga Hydroelectric dam in Burkina Faso, the Garafiri dam in Guinea, and the Marwi dam in Sudan. A landmark of AFESD’s contribution to Arab regional integration is the financing of the Arab Electricity Grids Intercon-nection Projects. Over the past ten years, total investment from all sources in these projects has reached US$ 1 billion, including US$ 566 million for the GCC Power Grid Interconnection Proj-ect, US$ 152 million for the Maghreb Countries Interconnection Project, and US$ 86 million for the interconnection of the two electricity grids in Yemen. AFESD has contributed over two-thirds of the financing of these projects on concessional terms. Another regional initiative is the integra-tion of the Arab Railway Network Scheme. In cooperation with the General Secretariat of the League of Arab States, AFESD agreed in January 2009 to finance and supervise the preparation of this scheme. Finally, in the area of capacity build-ing and research, AFESD joined with the World Bank in establishing the Research Initiative for Arab Development (Box 3.3).
B. Geographic and Sectoral Distribution of Assistance
Geographic DistributionArab financial assistance is based on country re-quests, and the range of countries assisted has widened significantly over time. Arab financial agencies focused initially on lower-income Arab states, but as more countries have become eligible for and familiar with the operations of the Arab agencies, assistance requests have increased sharply.
27Chapter 3 Institutional Framework for Arab Financial Assistance
The number of countries supported varies widely by agency; in 2007, OFID had the widest coverage (107 countries), followed by KFAED (103), SFD (71), IsDB (56), and ADFD (49). Only in AFESD and AMF, whose mandates restrict their activities to Arab member states, has assistance remained confined to a smaller set of recipients. The case of IsDB illustrates the growing global reach of Arab financial institutions, having expanded from 22 member countries in 1975 to 56 by 2005.
Africa and Asia (including the Near East) have ac-counted for nearly 98 percent of total Arab finan-cial assistance (Table 3.3 and Figure 3.3). OFID, KFAED, and SFD are the most global in focus, also financing projects in Europe and Latin America. Fi-nancial contributions to these regions account for 14 percent, 4.4 percent, and 1.8 percent of their total assistance, respectively. As in the case of Arab ODA, Arab financial assistance has also been allocated in-
creasingly to poor countries; some 40 percent of total Arab financial assistance was allocated to IDA recipient countries. The largest proportion of lend-ing from several Arab agencies has been directed to these countries. Between 50 and 90 percent of the total lending of SFD, OFID, and BADEA, and some 30–50 percent of ADFD, IsDB, and KFAED loans, have been allocated to IDA recipient countries. Fur-thermore, between one-fifth and one-quarter of to-tal Arab lending has been directed to HIPC-eligible countries and sub-Saharan Africa, respectively.
The top five recipient countries account for 18 to 73 percent of Arab financial agencies’ total cumula-tive lending (Table 3.4). These countries account for a particularly large share of total lending by ADFD, AFESD, and AMF, reflecting a tendency in these organizations to allocate resources primar-ily to low and lower middle-income Arab states, namely Egypt, Morocco, Syria, and Yemen.
BOX 3 .3 Research Initiative for Arab Development – An Illustration of World Bank-AFESD Cooperation
A partnership has been established between the World Bank and AFESD to support research on development issues in Arab countries. The main objective of the Research Initiative for Arab Development is to help scale up and enhance the quality of economic research in Arab countries in order to bridge the knowledge gap and ultimately help support regional efforts to deepen reforms and achieve the economic, social, and institutional transformations needed to meet development challenges.
The initiative will bring together financial resources, the know-how for the design and implementation of a regional research program, and other activities to inform decision making in the Arab countries. The initiative will focus on five priority areas: (i) equity and inequality; (ii) regional integration; (iii) economic diversification; (iv) environmental degra-dation and climate change; and (v) institutional change and dynamics.
For each of the main research areas, the initiative would aim to contribute to a better understanding of the issues involved and map out policy options and institutional designs through activities such as workshops, database develop-ment, research papers, books, conference volumes, flagship reports, and policy briefs. The initiative is expected to contribute to the dissemination of knowledge and consensus building through increased interaction between research institutions and decision-making circles, and policy debates involving a wide range of stakeholders—including policy-makers, parliamentarians, civil society, and the media. The initiative is being implemented by the Economic Research Forum, which is one of the well-established research institutions in the region.
28 ARAB DEVELOPMENT ASSISTANCE
F IGURE 3 .3 Recipients of Assistance from Arab Financial Institutions by Various Aggregations (% of cumulative commitments allocated by country)
0 10 30 40 50 60
IDA Countries
HIPIC Countries
Asia
Africa-Southof Sahara
Africa
1962–89 1990–99 2000–2008
50%
43%
44%
48%49%
46%
25%15%
22%
47%27%
39%
35%
48%52%
Source: Annex 2, Table A2-11.
TABLE 3 .3 Total Commitments of Financial Institutions by Geographic Region and Country Groupings
Cumulative Commitments (at end-2008)
ADFD KFAED SFD AFESD AMF BADEA OFID IsDB Total
Total (US$ millions) 3,651 15,655 8,722 20,814 5,151 2,983 7,230 26,285 90,493
% 4.0 17.3 9.6 23.0 5.7 3.3 8.0 29.0 100.0
Geographic Region
% of Totala 100.0 100.0 100.0 100.0 100.0 100.0 100.0 100.0 100.0
Africa 43.7 48.9 46.3 57.8 64.1 99.6 50.2 39.6 50.4
(of which SSA) 17.5 24.4 28.2 13.0 12.8 99.6 44.2 15.5 22.7
Asia 56.1 46.8 51.9 42.2 35.9 0.0 35.3 59.8 47.3
Europe 0.2 2.1 1.1 0.0 0.0 0.0 1.9 0.4 0.7
Latin America & Caribbean 0.0 2.3 0.7 0.0 0.0 0.0 12.1 0.1 1.5
Others
IDA Countries 31.3 39.0 50.0 22.8 24.7 88.2 76.4 35.1 38.7
HIPC 16.5 21.9 26.8 12.3 12.6 76.4 46.3 13.8 20.8
a/ Percentages do not sum to 100 due to rounding.Source: Annex 2, Table A2-10.
29Chapter 3 Institutional Framework for Arab Financial Assistance
Sectoral AllocationMost Arab assistance has gone toward infrastruc-ture investments (transport, energy, water, and communication), with great variation between national and multinational agencies (Figure 3.4). Overall, some 55 percent of recorded Arab lending has been allocated to infrastructure. In 2006–7, the following institutions allocated between half and three-quarters of their lending to infrastructure:
SFD (49 percent), IsDB (54 percent), BADEA (55 percent), AFESD (64 percent), OFID (70 percent), and KFAED (77 percent).
Greater emphasis has been accorded over time to lending for agriculture and the social sectors. This has been the case in the last decade in particular, as Arab donors have subscribed to the achievement of the MDGs. Donors that have allocated a sub-stantial share of their assistance portfolio to agri-culture include SFD (18 percent of total lending), BADEA (25 percent), AFESD (16 percent), OFID (15 percent), and KFAED (14 percent). Financing for social sector projects has also grown in impor-tance. SFD, OFID, and IsDB have allocated about 10 percent of their total assistance to education and health, while other Arab financial assistance agen-cies have allocated about half this proportion.
C. Terms of Assistance
ConcessionalityArab financial assistance is largely concessional, with a grant element ranging from 30 to 60 per-cent, well above the OECD-DAC threshold of 25 percent for concessional assistance. With the excep-tion of the SFD’s Export Development Program, Arab financial assistance is untied in the sense that
TABLE 3 .4 Lending Concentration (Share of Top Five Recipient Countries in Cumulative Lending as of 2007)
ADFD KFAED SFD AFESD AMF BADEA OFID IsDB
50% 36% 28% 56% 73% 27% 18% 27%
Oman Egypt Yemen Morocco Egypt Senegal Bangladesh Iran
Morocco Syria Syria Egypt Algeria Burkina Faso Pakistan Morocco
Syria Morocco Sudan Syria Morocco Mozambique India Pakistan
Pakistan China Egypt Yemen Iraq Mali Yemen KSA
Sudan Oman Morocco Tunisia Yemen Ghana Egypt Turkey
Source: Annual Reports.
F IGURE 3 .4 Financial Assistance by Sector (%)
0
10
20
30
40
50
60
70
80
90
100
TotalIsDBOFIDBADEAAFESDSFDKFAEDADFD
Transportation Energy Water and Sewerage AgricultureIndustry Social Sector Other
Source: Annex 2, Table A2-11.
30 ARAB DEVELOPMENT ASSISTANCE
relevant goods and services can be procured glob-ally (rather than restricting procurement to suppli-ers from the financing country).
The bulk of Arab financial assistance is provided in the form of soft loans rather than grants. Of the total US$ 85 million in financing provided at end-2007, it is estimated that 2.5 percent was provided in the form of outright grants, compared to 97.5 percent in the form of soft loans (including debt rescheduling). Lending terms include a combina-tion of below-market interest rates, grace periods of three to ten years, and (with the exception of AMF balance of payments and budget support) repay-ment periods of 20 to 30 years (Table 3.5).
The degree of concessionality can vary considerably within the same Arab financial assistance agency. The degree of concessionality depends on the na-
ture of the project (e.g., public or private, infra-structure or social sectors) and on the income level of the beneficiary country.36 For example, loans ex-tended by KFAED in 2007 ranged in terms from maturity of 18 to 30 years, grace period of three to ten years, and annual interest rate (inclusive of a 0.5 percent service charge) of 1.5 percent to 4 percent. The implied grant element varied from 37 percent to 69 percent of the face value of the loans.
Supporting Country-led ReformArab donors actively support country-led reform, but not in the form of conditions linked to dis-bursements. Arab donors tend to promote a policy of non-interference in recipient country policies, limiting advice on policy matters to situations when they are asked for advice and not explicitly linking external financing access to policy reform targets. Accordingly, Arab agencies generally do not
TABLE 3 .5 Lending Terms at end-2007
ADFD KFAED SFD AFESD AMF BADEA OFID IsDB
Interest rate, overall (%) a 2–5 2 3–4.5
LIC 1–2 3 1 2–2.75 1–2
MIC 2–3.5 4 2.5–4 4–5 5–6
Fee (%) 0.5
Repayment period (years) 20 20+ 20–30 22–25 37 30 20 18–25
Grace period (years) 3–5 5 5–10 4–7 1.5–3.5 10 5 3–7
Grant element (%) b 35 46 60 32–40 n.a. n.a. 35 n.a.
a Most institutions reduced their rates in late 2008 and early 2009. In the case of AFESD, the lending terms are now at 2.5 percent for LICs and 3 percent for MICs b As reported by the agency concerned. These figures are not strictly comparable as the institutions use different discount rates to assess concessionality. Some use the OECD-DAC reference rate of 10 percent while others use the less generous IMF discount rate.
Source: Annual Reports (2007).
36 A 2007 KFAED avian flu prevention project included a grant element of 65.7 percent, as compared to an estimated 47 percent for a power station project in Egypt in the same year. Similarly, a 2007 OFID loan for livestock development in Burkina Faso was provided at a 1 percent interest rate (with 5 years grace and 20 years repayment), while a loan to Swaziland for transport develop-ment was provided at a 3.5 percent interest rate (with similar grace and repayment period terms).
31Chapter 3 Institutional Framework for Arab Financial Assistance
provide assistance for policy-based lending. Abdla-tif Y. Al-Hamad (2003) describes the beneficiary-friendly nature of Arab project aid as follows:
Arab aid is a source welcomed and appreciated by the beneficiary countries. This is attribut-able to a number of reasons: Arab aid is free from political and economic conditions, has no strings attached, is highly concessional, has an established track record of efficient delivery, and most importantly, is given in a spirit of solidarity with developing countries of whom the Arab donor nations are an integral part.37
At the same time, Arab donors do provide balance of payments and budget support to Arab states through BADEA and AMF in support of country-led reform programs.
AID COORDINATION
Formal and informal mechanisms exist to forge aid coordination and harmonization among Arab financial agencies and their beneficiaries. Effec-tive coordination is one of the hallmarks of Arab aid. The Coordination Group of Arab, Islamic and OPEC Development Institutions was established in 1974 and Secretariat services are provided by AFESD. The Coordination Group aims to coordi-nate Arab external assistance, optimize the use of available resources and competencies, and harmo-nize funding policies and operating procedures.38
The current Coordination Group consists of the nine organizations discussed in this chapter. Ex-cluding KSA’s direct government-to-government assistance, it is estimated that more than 90 per-cent of Arab financial institution commitments are channeled through Coordination Group members. From 1975–2008, the Coordination Group held 63 meetings at the level of Directors of Operations, and 11 at the level of General Directors. These meetings have provided a forum for exchanging in-formation, discussing policy matters, and fostering consensus on procedures and external assistance principles. Frequent meetings have also resulted in a set of “partnership principles” or shared values.39 The Coordination Group Secretariat plays a valu-able role, hosting meetings among Arab donors, maintaining statistics on Arab financial assistance, and promoting harmonization and adoption of good practices in project management.
Aid coordination has succeeded in mobilizing the financing required for several large infrastructure projects, particularly in the poorer Arab countries. The Coordination Group has pulled together fund-ing for mega-projects such as the Beni Haroun dam in Algeria, Marwi dam in Sudan, Coastal Aftout project in Mauritania, Nubaria Power Generation Station in Egypt, Social Development Fund proj-ects in Egypt and Yemen, and the Litani Water Transfer project in Lebanon.
The vast majority of Arab financial assistance is channeled through co-financing arrangements, the
37 Al-Hamad (2003), p. 10.38 The first meeting of the Coordination Group was held in September 1975 at KFAED headquarters. Founding members in-cluded KFAED, ADFD, AFESD, and SFD. It was agreed that there would be two annual meetings at the level of Directors of Operation, and one at the level of General Directors whenever it was deemed necessary.39 The group’s members consider themselves as strictly “supportive partners” in development and not “dictating partners.” They prefer work arrangements that are based on partnership and cooperation and reveal the needs and priorities of beneficiary coun-tries. They are prepared to offer advice and not directions. The guiding principle is that beneficiaries should be solely responsible for the preparation and implementation of their own development strategies. See Coordination Group Secretariat (2009), p. 5; and Al-Hamad (2003).
32 ARAB DEVELOPMENT ASSISTANCE
principal mechanism through which Arab financial agencies collaborate among themselves and with other development partners.40 SFD has co-financed operations with over 40 donors in the past three de-cades (Annex 1, Box A1-1). KFAED reports that 58 percent of its 400 operations have been co-financed. Other development partners have provided some 82 percent of the total cost of projects funded by BADEA. Between 1983 and 2007, about 83 per-cent of total project financing for AFESD projects was provided by co-financiers. Finally, from 1976 to 2007, IsDB co-financed 1,869 projects worth US$ 86.6 billion, of which IsDB’s contribution was US$ 13.8 billion or 16 percent of total project costs.
Arab agencies also coordinate loan management. In these arrangements, one member of the Coordina-tion Group manages a loan on behalf of one or more of the other group members. For example, AFESD oversees the projects financed by various donor in-stitutions in Palestine, including a grant of US$ 25 million provided by the State of Kuwait, through KFAED, to finance projects in health and education and some 127 grants provided by OFID amounting to US$29.4 million between 1986 and 1997. This practice has been extended to include loan manage-ment arrangements with those outside the group, including IFAD.41 The combination of active co-fi-nancing and delegated loan management has allowed Arab donors to increase commitments, broaden geo-graphical coverage, and economize on staff resources.
Arab financial agencies have moved towards com-mon operational procedures. Since the early 1980s, these agencies have streamlined and unified their financing policies and procedures in five key areas:
feasibility studies, appraisal, design, supervision, and procurement. Standard project contracts, bidding, procurement, and supervision documents were de-veloped, and efforts are now being made to produce a common manual on environmental requirements for projects. The use of common procedures has aimed to help Arab agencies reduce transaction costs, foster greater transparency in project management, and improve project safeguards and accountability.
Coordination Group members have become more active in collaborating with other international do-nor institutions. Partners include the World Bank, European Commission, OECD-DAC members, AfDB, European Bank for Reconstruction and De-velopment (EBRD), and ADB. These partnerships have yielded project co-financing arrangements, cooperation in the preparation of special studies and advisory assistance, and regular exchange of ex-pertise and experience. Reflecting the principle of non-interference, coordination with OECD-DAC donors on lending is generally limited to investment projects with few explicit policy reform conditions.
Arab donors and assistance agencies have partici-pated actively in broader global efforts to strength-en aid effectiveness. The Governments of KSA and Kuwait are signatories to the Paris Declaration on Aid Effectiveness. Arab donors generally consider their assistance to be in line with the broad objec-tives of the Paris Declaration because support is based on government priorities and because of the extent to which they contribute, through projects and technical cooperation, to building country sys-tems. IsDB, BADEA, and OPIC are also signatories to the Paris Declaration, and IsDB has participated
40 Other mechanisms include staff exchange, joint field visits, advocacy, and outreach with other donors.41 As part of its lead role in coordinating Arab aid to Palestine, AFESD has been responsible for monitoring the execution of projects financed by Kuwaiti government grants to Palestine. In addition, AFESD has collaborated with OFID in administering their assistance to Palestine and has cooperated with the International Development Group on Palestine in financing, implement-ing, and supervising the Jerusalem Fund projects.
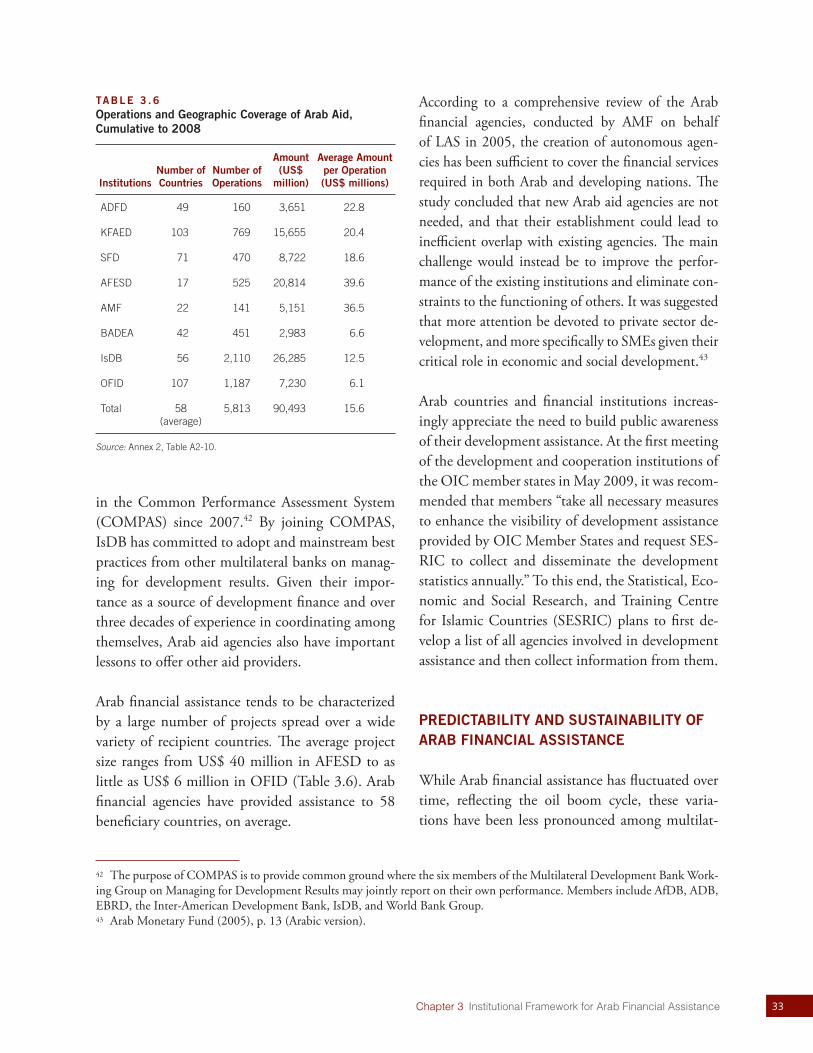
33Chapter 3 Institutional Framework for Arab Financial Assistance
in the Common Performance Assessment System (COMPAS) since 2007.42 By joining COMPAS, IsDB has committed to adopt and mainstream best practices from other multilateral banks on manag-ing for development results. Given their impor-tance as a source of development finance and over three decades of experience in coordinating among themselves, Arab aid agencies also have important lessons to offer other aid providers.
Arab financial assistance tends to be characterized by a large number of projects spread over a wide variety of recipient countries. The average project size ranges from US$ 40 million in AFESD to as little as US$ 6 million in OFID (Table 3.6). Arab financial agencies have provided assistance to 58 beneficiary countries, on average.
According to a comprehensive review of the Arab financial agencies, conducted by AMF on behalf of LAS in 2005, the creation of autonomous agen-cies has been sufficient to cover the financial services required in both Arab and developing nations. The study concluded that new Arab aid agencies are not needed, and that their establishment could lead to inefficient overlap with existing agencies. The main challenge would instead be to improve the perfor-mance of the existing institutions and eliminate con-straints to the functioning of others. It was suggested that more attention be devoted to private sector de-velopment, and more specifically to SMEs given their critical role in economic and social development.43
Arab countries and financial institutions increas-ingly appreciate the need to build public awareness of their development assistance. At the first meeting of the development and cooperation institutions of the OIC member states in May 2009, it was recom-mended that members “take all necessary measures to enhance the visibility of development assistance provided by OIC Member States and request SES-RIC to collect and disseminate the development statistics annually.” To this end, the Statistical, Eco-nomic and Social Research, and Training Centre for Islamic Countries (SESRIC) plans to first de-velop a list of all agencies involved in development assistance and then collect information from them.
PREDICTABILITY AND SUSTAINABILITY OF ARAB FINANCIAL ASSISTANCE
While Arab financial assistance has fluctuated over time, reflecting the oil boom cycle, these varia-tions have been less pronounced among multilat-
TABLE 3 .6 Operations and Geographic Coverage of Arab Aid, Cumulative to 2008
InstitutionsNumber of Countries
Number of Operations
Amount(US$
million)
Average Amount per Operation(US$ millions)
ADFD 49 160 3,651 22.8
KFAED 103 769 15,655 20.4
SFD 71 470 8,722 18.6
AFESD 17 525 20,814 39.6
AMF 22 141 5,151 36.5
BADEA 42 451 2,983 6.6
IsDB 56 2,110 26,285 12.5
OFID 107 1,187 7,230 6.1
Total 58 (average)
5,813 90,493 15.6
Source: Annex 2, Table A2-10.
42 The purpose of COMPAS is to provide common ground where the six members of the Multilateral Development Bank Work-ing Group on Managing for Development Results may jointly report on their own performance. Members include AfDB, ADB, EBRD, the Inter-American Development Bank, IsDB, and World Bank Group.43 Arab Monetary Fund (2005), p. 13 (Arabic version).
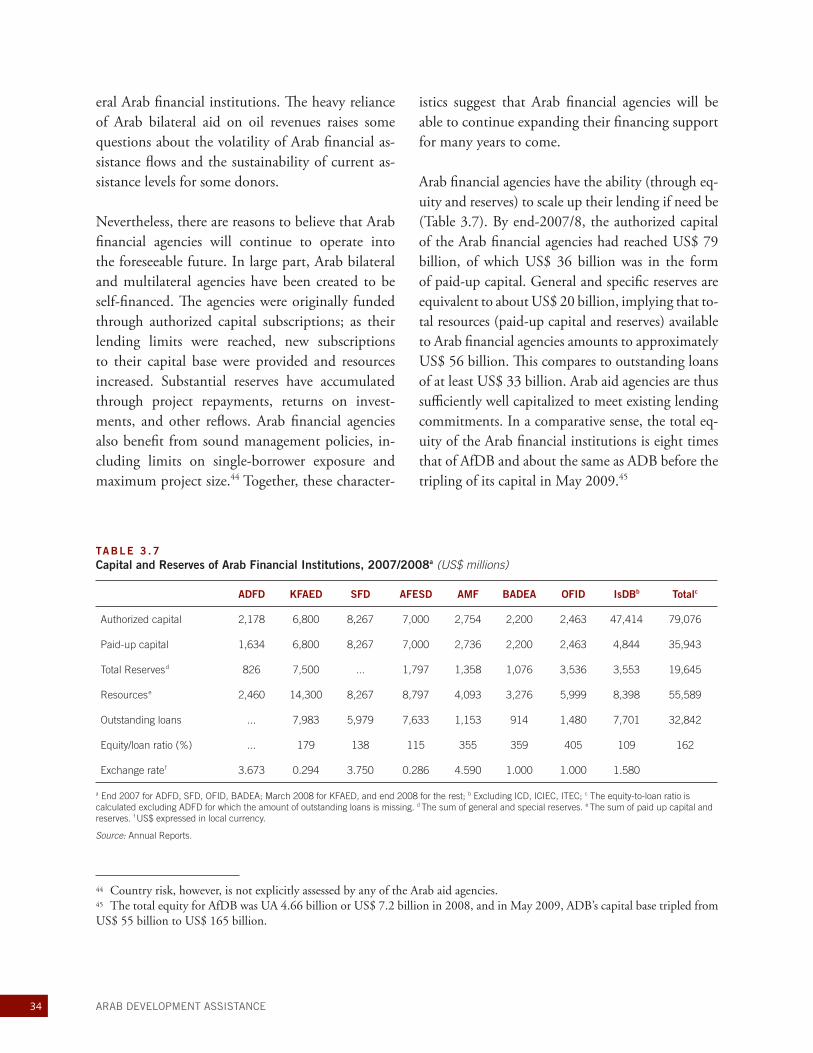
34 ARAB DEVELOPMENT ASSISTANCE
eral Arab financial institutions. The heavy reliance of Arab bilateral aid on oil revenues raises some questions about the volatility of Arab financial as-sistance flows and the sustainability of current as-sistance levels for some donors.
Nevertheless, there are reasons to believe that Arab financial agencies will continue to operate into the foreseeable future. In large part, Arab bilateral and multilateral agencies have been created to be self-financed. The agencies were originally funded through authorized capital subscriptions; as their lending limits were reached, new subscriptions to their capital base were provided and resources increased. Substantial reserves have accumulated through project repayments, returns on invest-ments, and other reflows. Arab financial agencies also benefit from sound management policies, in-cluding limits on single-borrower exposure and maximum project size.44 Together, these character-
istics suggest that Arab financial agencies will be able to continue expanding their financing support for many years to come.
Arab financial agencies have the ability (through eq-uity and reserves) to scale up their lending if need be (Table 3.7). By end-2007/8, the authorized capital of the Arab financial agencies had reached US$ 79 billion, of which US$ 36 billion was in the form of paid-up capital. General and specific reserves are equivalent to about US$ 20 billion, implying that to-tal resources (paid-up capital and reserves) available to Arab financial agencies amounts to approximately US$ 56 billion. This compares to outstanding loans of at least US$ 33 billion. Arab aid agencies are thus sufficiently well capitalized to meet existing lending commitments. In a comparative sense, the total eq-uity of the Arab financial institutions is eight times that of AfDB and about the same as ADB before the tripling of its capital in May 2009.45
TABLE 3 .7 Capital and Reserves of Arab Financial Institutions, 2007/2008a (US$ millions)
ADFD KFAED SFD AFESD AMF BADEA OFID IsDBb Totalc
Authorized capital 2,178 6,800 8,267 7,000 2,754 2,200 2,463 47,414 79,076
Paid-up capital 1,634 6,800 8,267 7,000 2,736 2,200 2,463 4,844 35,943
Total Reserves d 826 7,500 ... 1,797 1,358 1,076 3,536 3,553 19,645
Resources e 2,460 14,300 8,267 8,797 4,093 3,276 5,999 8,398 55,589
Outstanding loans ... 7,983 5,979 7,633 1,153 914 1,480 7,701 32,842
Equity/loan ratio (%) ... 179 138 115 355 359 405 109 162
Exchange rate f 3.673 0.294 3.750 0.286 4.590 1.000 1.000 1.580
a End 2007 for ADFD, SFD, OFID, BADEA; March 2008 for KFAED, and end 2008 for the rest; b Excluding ICD, ICIEC, ITEC; c The equity-to-loan ratio is calculated excluding ADFD for which the amount of outstanding loans is missing. d The sum of general and special reserves. e The sum of paid up capital and reserves. f US$ expressed in local currency.
Source: Annual Reports.
44 Country risk, however, is not explicitly assessed by any of the Arab aid agencies.45 The total equity for AfDB was UA 4.66 billion or US$ 7.2 billion in 2008, and in May 2009, ADB’s capital base tripled from US$ 55 billion to US$ 165 billion.
35Chapter 3 Institutional Framework for Arab Financial Assistance
Compared to regional development banks from other parts of the world (e.g., ADB, Inter-Amer-ican Development Bank), Arab financial agencies have made relatively modest use of the capital mar-kets to finance operations. Although in principle KFAED has access to capital markets, it has not yet exercised this option. IsDB has attempted to tap
capital markets but has faced higher funding costs owing mainly to its limited set of financing prod-ucts, the low liquidity level of available products, and the absence of a stable investor base. OFID is beginning to approach limits to its capital base and is considering turning to international capital mar-kets to augment its resources.

37
During the oil boom of the 1970s and early 1980s, Arab donor countries (particularly KSA, Kuwait, and UAE) devoted a significant share of rising fis-cal surpluses to assist developing countries in their efforts to foster poverty alleviation and economic growth. Amounts were generous both in nominal terms and as a share of donor countries’ GNI. Be-tween 1973 and 1980, Arab donors represented the second largest concessional donor group in the world behind DAC countries, and Arab ODA reached over one-third of total ODA from all do-nors during the 1970s.
Arab ODA has since declined in overall volume and as a share of national income, although it remains generous in comparison to aid levels provided by OECD-DAC nations. The downward trend can be explained by two sets of factors. First, aid levels in the 1970s and early 1980s were extraordinarily high by international standards and could not be sustained over time. These also included large start-up costs associated with establishing aid agencies. Second, a number of internal factors came into play (e.g., reduced fiscal space as a result of declining oil revenues; growing national spending on wages, transfers, and debt service; and growing popula-tions), external influences (political and security concerns, regional agreements), and repayment of aid extended in earlier years. In addition, Arab
donors’ ODA spending has been partially offset by steadily increasing commitments to other forms of financial assistance, channeled through specialized financial institutions established to provide devel-opment assistance to low-income nations. Over-all assistance provided by the three national funds (representing Kuwait, KSA, and UAE) and five major multilateral funds and banks has quadrupled since the 1970s, reaching over US$ 90 billion (in commitments) at end-2008.
Though Arab aid generally takes the form of ODA grants and concessional loans from financial agen-cies, the composition of aid has broadened over time. Since 2000, Arab donor countries have begun to shift away from a reliance on grant-based aid; nearly all Arab bilateral ODA reported to OECD-DAC is now in the form of soft loans. Despite this shift, Arab financial assistance remains largely con-cessional, with a grant element ranging from 30 to 60 percent, well above the OECD-DAC threshold of 25 percent for concessional assistance. Arab do-nors have increasingly provided grants through hu-manitarian organizations, but these grants are not captured in OECD-DAC data. The majority of development assistance provided by Arab financial agencies, on the other hand, is in the form of con-cessional loans for specific projects and programs. While investment operations are their mainstay,
C H A P T E R 4
Conclusions
Arab development assistance has been notable for its generosity and focus on
supporting underdeveloped countries—particularly those in the Middle East,
Africa, and Asia.
38 ARAB DEVELOPMENT ASSISTANCE
Arab financial institutions have also provided grant financing for capacity building, project preparation, and technical advice. They have participated in debt relief operations, offered balance of payments and budget support, provided trade financing, es-tablished specialized facilities to encourage private sector operations, and established financing instru-ments consistent with the tenets of Islamic law.
The sectoral focus of Arab aid has shifted in re-sponse to new priorities and financing modalities. In the 1970s and 1980s, Arab donor countries and financial assistance agencies focused mainly on in-frastructure development. As countries have sub-scribed to MDG targets, however, greater emphasis is now being placed on agricultural development, social sectors, debt relief, emergency relief, capacity building, targeted poverty reduction programs, and private sector development. As Arab aid agencies have expanded and matured, they have introduced new business processes, partnership modes, and as-sistance instruments, and launched special initia-tives to focus assistance in new areas.
The international reach of Arab aid has widened, and recipients have changed on the basis of de-velopment needs and priorities. The bulk of Arab bilateral ODA has gone to poor and lower-middle-income countries, largely in the MENA region fol-lowed by sub-Saharan Africa and South and Central Asia. Arab financial assistance agencies have tended to have a similar focus, with nearly two-fifths of lending allocated to IDA-eligible countries and one-fourth to sub-Saharan countries. Arab aid is noteworthy for its principles of partnership and solidarity with recipient countries—aid programs are defined on the basis of recipient country strat-egies and country requests, and policy conditions are generally not attached to financing.
Arab aid has played a major role in total ODA flows to the main recipients of Arab aid. In so do-
ing, it has compensated for relatively low levels of OECD-DAC assistance to these countries and has made a substantial contribution to public invest-ment over a sustained period of time.
With so many different agencies and government departments involved, coordinating Arab aid poses a tremendous challenge. Arab aid is typically co-financed and, in most instances, one institution prepares and supervises an operation on behalf of all co-financiers. The Coordination Group has developed a set of common practices and proce-dures that are used by all of its members. Frequent, high-level meetings among Coordination Group members provide an opportunity to harmonize as-sistance and identify special initiatives meriting the attention of the Coordination Group members. The capacity of the Coordination Group Secretari-at is limited, however, and there is a need for capac-ity building both within the Coordination Group and within its member institutions.
Despite the limited supply of oil, there are reasons to believe that Arab aid will continue into the fore-seeable future. Arab aid has rebounded recently with the upturn in global petroleum prices. Active participation by the main Arab donors in interna-tional aid harmonization and effectiveness initia-tives, the path-breaking establishment of a central agency to coordinate ODA in UAE, and a decided tendency to bolster the visibility of KSA’s aid pro-gram bode well for the future development of Arab ODA. Though the volume of Arab financial insti-tution aid flows in any given year may vary depend-ing on the cycle of oil production and prices, it is delivered through reasonably well-capitalized and conservatively managed funds and banks, which implies that Arab financial institution funding is likely to grow and serve as an increasingly impor-tant source of development finance in the decades to come.
39
Abdlatif Y. Al-Hamad. 2003. The Coordination Group of Arab National and Regional Devel-opment Institutions: A Framework for Efficient Aid Delivery. In Arab Aid: Past, Present and Future. Speeches delivered at the Symposium on Arab Development Aid, Dubai, United Arab Emirates, September 2003. Vienna: The OPEC Fund for International Development.
Annual Reports of National and Multilateral Fi-nancial Institutions, Various Issues.
Arab Monetary Fund. 2005. Arab Financial Institu-tions and the Financing of Investment and De-velopment in the Arab World (in Arabic). Abu Dhabi: Arab Monetary Fund .
__________. 2008. Unified Arab Economic Report (in Arabic). Abu Dhabi: Arab Monetary Fund.
__________. 2009. Unified Arab Economic Report (in Arabic). Abu Dhabi: Arab Monetary Fund.
Arab Bank for Economic Development in Africa (BADEA). 2008. Annual Report 2007.
Central Intelligence Agency. 2001. World Fact Book. Washington, DC: Central Intelligence Agency.
Coordination Group Secretariat. 2002. Arab Na-tional and Regional Development Institutions: A Profile. Vienna: The OPEC Fund for Interna-tional Development.
__________. 2007. Financing Operations Cumu-lative Summary (as of December 31, 2007). Arab National and Regional Development Institutions. Kuwait City: Arab Fund for Eco-nomic and Social Development.
__________. 2008. Annual Report.__________. 2009. The Coordination Group:
Overview. (Mimeo). Cotterrell, Lin, and Adele Harmer. 2005. Diversity
in donorship: the changing landscape of official
humanitarian aid—Aid donorship in the Gulf States. Humanitarian Policy Group: HPG Back-ground Paper, September. London: Overseas Development Institute. http://www.odi.org.uk/resources/hpg-publications/background-papers/2005/aid-donorship-gulf-states.pdf
Fasano, Ugo, and Zubair Iqbal. 2003. GCC Coun-tries: From Oil Dependence to Diversification. Washington D.C.: International Monetary Fund.
Gartzke, Erik. 2006. The Affinity of Nations Index. http://dss.ucsd.edu/~egartzke/
Henderson, Errol A., and Richard Tucker. 2001. Clear and Present Strangers: The Clash of Civi-lizations and International Conflict. Interna-tional Studies Quarterly 45 (2): 317–338.
Hunter, Shireen. 1984. OPEC and the Third World: The Politics of Aid. London and Sydney: Croom Helm.
Igbal, Zubair. 1994. Arab Development Assistance: Role of Development Funds and Support for Mul-tilateral Financial Institutions. Washington, DC: International Monetary Fund.
Imady, Mohammed. 1984. Patterns of Arab Eco-nomic Aid to Third World Countries. Arab Studies Quarterly 6 (1–2): 70–123.
International Development Association. 2008. Aid Architecture: An Overview of the Main Trends in Official Development Assistance Flows. Washington DC: The World Bank.
Islamic Development Bank. 2006. A Vision for Hu-man Dignity. Jeddah: Islamic Development Bank.
__________. 2007. Thirty-Three Years in the Ser-vice of Development. Jeddah: Islamic Develop-ment Bank.
References
40 ARAB DEVELOPMENT ASSISTANCE
__________. 2008. Thirty-Four Years in the Service of Development. Jeddah: Islamic Development Bank.
Khaldi, Mohamed. 1984. Arab Aid in the World Economy. In The Role of the Arab Development Funds in the World Economy, edited by Michele Achilli and Mohamed Khaldi: 7–39. London and Sydney: Croom Helm.
Kingdom of Saudi Arabia, Ministry of Economy and Planning, and United Nations Develop-ment Programme. 2008. Millennium Devel-opment Goals, Arabic version.
Kingdom of Saudi Arabia, Ministry of Finance. 2005. The Efforts of the Kingdom of Saudi Arabia in Economic and Social Development in Developing Countries, Fourth Edition.
Kornai, Janos. 1992. The Socialist System: The Po-litical Economy of Communism. Oxford: Clar-endon Press.
Manning, Richard. 2007. Will “Emerging Donors” Change the Face of International Cooperation? Paris: DAC/OECD.
Neumayer, Eric. 2003a. What Factors Determine the Allocation of Aid by Arab Countries and Multilateral Agencies? Journal of Development Studies 39 (4): 134–147.
__________. 2003b. The Pattern of Aid Giving – The Impact of Good Governance on Development Assistance. London: Routledge.
__________. 2004. Arab-Related Bilateral and Multilateral Sources of Development Finance: Issues, Trends, and the Way Forward. World Economy 27 (2): 281–300.
Nonneman, Gerd. 1988. Development, Administra-tion and Aid in the Middle East. London and New York: Routledge.
OPEC Fund for International Development. 2003. Arab Aid: Past, Present and Future. Speeches delivered at the Symposium on Arab Devel-opment Aid, Dubai, United Arab Emirates, September 2003. Vienna: The OPEC Fund for International Development.
__________. 2006. OPEC Fund Newsletter Spe-cial Bilingual Edition (May). Vienna: The OPEC Fund for International Development.
Porter, R.S. 1986. Arab Economic Aid. Develop-ment Policy Review 4 (1): 44–68.
Raffer, Kunibert, and H.W. Singer. 1996. The For-eign Aid Business: Economic Assistance and Development Co-operation. Cheltenham: Ed-ward Elgar.
Saudi Fund for Development. 2008. Annual Re-port.
State of Qatar. 2002. Development Assistance and Aid Provided by the State of Qatar. The Plan-ning Council, General Secretariat.
__________. 2004. Development Assistance and Aid Provided by the State of Qatar. The Plan-ning Council.
__________. 2008. Development Assistance and Aid by the State of Qatar. Council of Minis-ters, General Secretariat: Technical Coopera-tion Department.
United Nations. 2008. Commodity trade statistics database (COMTRADE). United Nations Sta-tistics Division, New York.
Van den Boogaerde, Pierre. 1991. Financial Assis-tance from Arab Countries and Arab Regional Institutions. IMF Occasional Paper 87. Wash-ington DC: International Monetary Fund.
Villanger, Espen. 2007. Arab Foreign Aid: Dis-bursement Patterns, Aid Policies and Mo-tives. CMI Report. Bergen: Chr. Michelsen Institute. http://www.cmi.no/publications/publication/?2615=arab-foreign-aid-disburse-ment-patterns
World Bank. 2009. World Development Indi-cators. Online Database. Washington, DC: The World Bank. http://go.worldbank.org/B53SONGPA0
41
The nine major institutions are: Abu Dhabi Fund for Development, Kuwait Fund for Arab Economic Development, Saudi Fund for Development, Arab Bank for Economic Development in Africa, Arab Fund for Economic and Social Development, Arab Gulf Programme for United Nations Development Organizations, Arab Monetary Fund, Islamic De-velopment Bank, and OPEC Fund for International Development. Strictly speaking, the IsDB and OFID are not exclusively Arab-financed institutions, but Arab countries provide the majority of their fund-ing. Annex 1 summarizes the key features of these institutions. Annex 2 provides supporting data.
BILATERAL DEVELOPMENT FUNDS
Abu Dhabi Fund for Development
The Abu Dhabi Fund for Development (ADFD) provides economic assistance to developing coun-tries in the form of concessional loans, grants, and equity in investment projects. ADFD primarily supports basic infrastructure projects in transport, water, electricity, and irrigation. ADFD also ad-ministers loans and grants on behalf of the Govern-ment of Abu Dhabi.
The Chairman of ADFD is Abu Dhabi’s Deputy Prime Minister and Minister of Presidential Af-fairs. A representative from Abu Dhabi’s Ministry of Foreign Affairs serves as Vice Chairman. Board members represent various public and private sec-tor stakeholders. ADFD employs a total of about 100 staff.
ADFD was established in 1971 with authorized capital of AED 580 million. The authorized capital was increased for the first time in 2007 to AED 8 billion (US$ 2.2 billion). Paid-up capital amounts to AED 6 billion (US$ 1.6 billion), and accumu-lated reserves total AED 3 billion (US$ 0.8 billion). In principle, ADFD is permitted to issue bonds, but has not done so thus far.
As of 2007, ADFD had approved 154 loans total-ing US$ 3.2 billion and about US$ 200 million in grants to over 52 countries. ADFD has also admin-istered on behalf of the Government of Abu Dhabi 60 loans worth US$ 1.1 billion and grants worth another US$ 1.5 billion. These loans and grants represent 42 percent of UAE’s total aid envelope. ADFD has financed a total of 267 projects, includ-ing grants.
A N N E X 1
An Overview of Arab Financial Institutions
Several Arab financial institutions have been created at the national, region-
al and international level to deliver assistance to developing countries more
broadly.
42 ARAB DEVELOPMENT ASSISTANCE
ADFD generally provides loans for investment projects. It has provided, on an exceptional ba-sis, US$ 100 million in balance of payments and budget support to Sudan and US$ 300 million to Lebanon. ADFD also extends grants for proj-ect preparation and humanitarian assistance; these total US$ 191 million so far. ADFD has holdings in private investment companies around the world, including tourism sector investments in Abu Dha-bi; a conference center in Austria; equity stakes in a Tunisian tourism company, a Bangladesh textiles factory, a cement company in Oman; and invest-ments in a range of industrial and tourism ventures in Morocco.
ADFD’s financial support is directed largely toward Arab and Islamic countries. Poor countries (IDA recipients) and Sub-Saharan Africa account, respec-tively, for 27 percent and 12 percent of total lend-ing. Over 35 percent of the projects financed by ADFD are in the infrastructure sector, followed by the industry and mining sector (16 percent) and agriculture (about 16 percent).
ADFD is in the process of revisiting its overall lend-ing strategy. Yearly targets currently include: four projects in infrastructure, two projects in social sectors, and a lending envelope of about AED 700 million. ADFD is also in the process of developing policies regarding debt relief.
Financing terms are concessional. The interest rate ranges between 2 and 4 percent with a repayment period of 20 years, and a grace period of three to five years. According to ADFD estimates, the grant element of its loans is about 35 percent; ADFD is considering increasing the grant element to match the IDA target of 60 percent.
ADFD administers, on behalf of the Government of Abu Dhabi, loans and grants totaling US$ 2.66 billion and contributes (also on behalf of the Gov-
ernment) to the capital of the IsDB and BADEA. For projects in Africa, ADFD has cooperated with AMF, the Arab Trade Financing Program, OFID, the Arab Organization for Agricultural Develop-ment, the Arab Authority for Agricultural Invest-ment and Development, and the Arab Agency for Investment Guarantees.
Kuwait Fund for Arab Economic Development
Kuwait is a true pioneer of the Arab aid effort. The Kuwait Fund for Arab Economic Develop-ment (KFAED), established in 1961, was the first development assistance fund to be set up by a de-veloping country. It was created as an autonomous public agency with access to the capital market. Recently, KFAED has come under the supervision of the Ministry of Foreign Affairs and, since 2005, has been in charge of coordinating Kuwait’s overall development assistance. It has a total staff of 455.
KFAED’s main objective is to support economic development in Arab and other developing coun-tries. KFAED provides loans, guarantees and TA, and contributes (on behalf of the Government of Kuwait) to regional and international institutions (including AFESD, ADB, BADEA, IDA, IFAD, and the Special Programme for Sub-saharan Afri-ca). KFAED does not provide balance of payments and budget support, though it has rescheduled debt as part of the HIPC initiative. It is generally prohibited from writing off debts, though follow-ing Kuwait’s liberation, it did write off the debt of some of the countries that supported its struggle. KFAED actively participates in global initiatives such as MDRI and supporting achievement of the MDGs.
KFAED’s financing terms are concessional, with interest rate and service charges averaging 3.2 per-cent (interest rates range from 1 percent to 3.5 percent annually). Repayment periods range from
43Annex 1 An Overview of Arab Financial Institutions
18 to 30 years, and the grace period from five to ten years. The grant element of KFAED loans has varied from 37 to 69 percent of the loan’s value. Using an OECD discount rate of 10 percent, the average grant element for KFAED assistance is 46 percent.
KFAED has gone through a series of capital in-creases, which has allowed it to expand its activi-ties. At end-March 2007, KFAED had authorized and paid-up capital of US$ 6.8 billion, and accu-mulated reserves of US$ 7.5 billion. Government had provided capital until 1987 (for a cumulative amount of KD 970 million); afterwards the capi-tal had been paid from the Fund’s own resources. The full capital payment was completed by 1997. Both the Government and KFAED contributed equal shares to the capital. Although the Fund can in principle borrow and issue bonds (Article 4 of its Charter), it has not done so to date.
Total loan commitments during 1973–2007 amounted to US$ 14.8 billion, covering 747 proj-ects in 101 countries. Nearly 55 percent of these projects were co-financed with other agencies, mainly AFESD and BADEA. KFAED also pro-vides parallel financing to World Bank-supported projects, and co-financing and parallel financing are reported to have increased over time. The most recent five-year strategic plan envisages an annual lending commitment of KD 200 million (US$ 680 million).
Islamic and Arab countries account for the bulk of KFAED loans (76 percent and over 54 percent, respectively). This is consistent with an explicit in-stitutional target of 50 percent for Arab states. IDA members and sub-Saharan African countries re-ceived nearly 40 percent and 25 percent of KFAED loans, respectively. KFAED has also contributed to debt relief for its HIPC-eligible African borrowers by rescheduling loans worth US$ 409 million.
Infrastructure activities (transport, energy, water and sanitation) accounted for 72 percent of to-tal lending, followed by agriculture (13 percent). KFAED expanded the scope of its activities to in-clude the social sectors beginning in 2000 and has recently decided to reduce its involvement in the industrial sector.
KFAED provides grants from its own resources for TA and small-scale projects in low-income coun-tries. Total commitments for 269 grants and TA activities amounted to US$ 309 million at end-March 2009. The actual grant element of KFAED TA is significantly less than its total TA commit-ments because most TA starts in the form of proj-ect preparation grants before being converted into loans once projects are approved. At end-2007, to-tal grants reached US$ 26 million.
KFAED also administers grants on behalf of the Kuwaiti government. The Government’s Perma-nent Committee of External Assistance, consisting of seven members from various ministries, reviews financing requests (including from NGOs), and makes recommendations to the Cabinet. As of March 2009, total commitments for some 34 gov-ernment grants to 24 countries amounted to US$ 732 million. KFAED does not provide humanitar-ian assistance or funding to the private sector. In 2008, however, it received US$ 100 million to ad-minister a Fund for Decent Life in Islamic Coun-tries on the Government’s behalf.
In fiscal year 2008, KFAED signed 23 loan agree-ments with six Arab and six African countries, four countries in East and South Asia and the Pacific, three countries in Latin America and the Carib-bean, and one country in Central Asia and Europe, for a total value of about US$ 630 million. In ad-dition, KFAED provided about US$ 11 million in grants and TA to various countries and institutions. These were provided primarily to finance techni-
44 ARAB DEVELOPMENT ASSISTANCE
cal services in support of project preparation, and the vast majority of funding will be converted into loans.
Saudi Fund for Development
The Saudi Fund for Development (SFD) is located in Riyadh, Saudi Arabia, and began operations in 1975. Its main objectives are to finance projects in developing countries through soft loans and to pro-mote national non-oil exports by providing finance and insurance products. To date, this bilateral agency has extended financial assistance to over 71 countries in Africa, Asia, Central Asia, and Latin America. The Saudi Fund employs about 400 staff.
At end-2007, SFD had authorized capital of SR 31 billion (US$ 8.3 billion), a significant increase over the SR 10 billion it held at its creation. SFD’s lend-ing terms are concessional, with an average inter-est rate of 2 percent, a repayment period of 20–30 years, and a grace period of five to ten years. The grant element of SFD assistance is estimated by SFD itself to be around 60 percent.
SFD lending is not limited to specific countries or regions. Nevertheless, there is a stronger focus on assistance to Asia and Africa given that most of the least developed countries are located in these two regions. A significant proportion of SFD lending is directed to poor countries (nearly 50 percent) and to countries in sub-Saharan Africa (28 percent). Nearly 60 percent of SFD lending is targeted to infrastructure activities, largely transportation and energy. Agriculture lending accounts for 18 percent of SFD activities, and social sectors receive 13 per-cent.
From its inception to the end of 2007, SFD en-tered into 428 agreements to finance 454 develop-ment projects and economic programs. These loan agreements amounted to US$ 8.4 billion, benefit-
ing some 71 developing countries worldwide. In addition, SFD has partnered with other financial institutions to finance 265 projects for which SFD’s contribution represented 62 percent of a total value of US$ 4.5 billion. Africa is a major beneficiary of SFD co-financing assistance, accounting for 173 projects out of the 265. In general, SFD’s financing may not exceed 50 percent of the total cost of any project, and no single project may exceed 5 percent of total SFD capital. SFD has co-financed opera-tions with a large number of regional and interna-tional financial institutions (Box A1-1).
SFD also administers on behalf of the Government loans and grants to developing countries totaling US$ 6.7 billion. This amount includes US$ 569 million of rescheduled loans and US$ 6.1 billion in grants.
In April 1999, SFD established the Saudi Export Program (SEP) to provide credit and insurance to encourage the export of non-traditional products (non-oil goods and services) from Saudi Arabia. The agreements signed by SEP from 2001 to 2008 amount to about SR 4.2 billion (US$ 1.11 billion), and some 49 export credit insurance and guarantee policies have been issued since the launch of the program, providing coverage of products equiva-lent to SR 5.3 billion (US$ 1.4 billion) in value. Goods exported under SEP in 2008 were destined for UAE, Sudan, Iran, Yemen, Egypt, Ethiopia, Qatar, and Djibouti, and included petrochemicals, iron, trucks, plastic pipes, children’s supplies and computer equipment.
The financial assistance provided by SFD represents a small fraction of total assistance provided by the Government of Saudi Arabia, which is estimated by a recent MDG report to amount to US$ 90 billion. Approximately one-fifth of this amount was chan-neled through bilateral funds and Arab multilateral organizations.
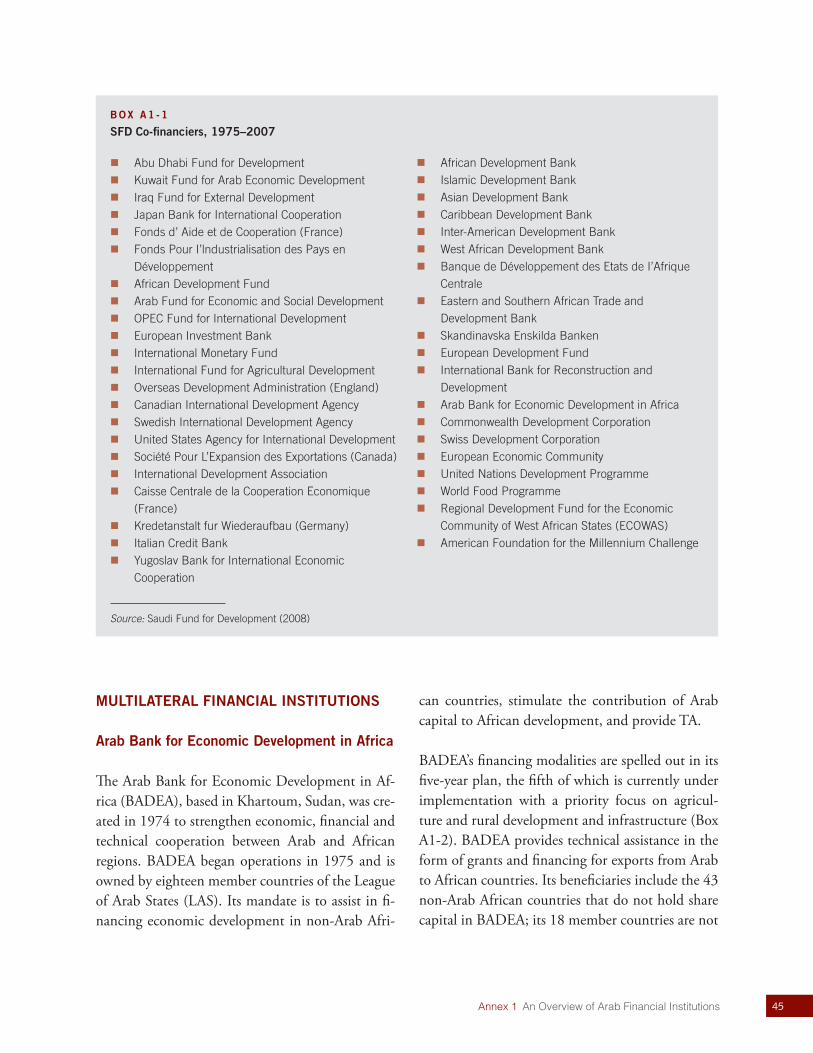
45Annex 1 An Overview of Arab Financial Institutions
MULTILATERAL FINANCIAL INSTITUTIONS
Arab Bank for Economic Development in Africa
The Arab Bank for Economic Development in Af-rica (BADEA), based in Khartoum, Sudan, was cre-ated in 1974 to strengthen economic, financial and technical cooperation between Arab and African regions. BADEA began operations in 1975 and is owned by eighteen member countries of the League of Arab States (LAS). Its mandate is to assist in fi-nancing economic development in non-Arab Afri-
can countries, stimulate the contribution of Arab capital to African development, and provide TA.
BADEA’s financing modalities are spelled out in its five-year plan, the fifth of which is currently under implementation with a priority focus on agricul-ture and rural development and infrastructure (Box A1-2). BADEA provides technical assistance in the form of grants and financing for exports from Arab to African countries. Its beneficiaries include the 43 non-Arab African countries that do not hold share capital in BADEA; its 18 member countries are not
BOX A1 -1
SFD Co-financiers, 1975–2007
Source: Saudi Fund for Development (2008)
Abu Dhabi Fund for Development Kuwait Fund for Arab Economic Development Iraq Fund for External Development Japan Bank for International Cooperation Fonds d’ Aide et de Cooperation (France) Fonds Pour I’lndustrialisation des Pays en
Développement African Development Fund Arab Fund for Economic and Social Development OPEC Fund for International Development European Investment Bank International Monetary Fund International Fund for Agricultural Development Overseas Development Administration (England) Canadian International Development Agency Swedish International Development Agency United States Agency for International Development Société Pour L’Expansion des Exportations (Canada) International Development Association Caisse Centrale de la Cooperation Economique
(France) Kredetanstalt fur Wiederaufbau (Germany) Italian Credit Bank Yugoslav Bank for International Economic
Cooperation
African Development Bank Islamic Development Bank Asian Development Bank Caribbean Development Bank Inter-American Development Bank West African Development Bank Banque de Développement des Etats de I’Afrique
Centrale Eastern and Southern African Trade and
Development Bank Skandinavska Enskilda Banken European Development Fund International Bank for Reconstruction and
Development Arab Bank for Economic Development in Africa Commonwealth Development Corporation Swiss Development Corporation European Economic Community United Nations Development Programme World Food Programme Regional Development Fund for the Economic
Community of West African States (ECOWAS) American Foundation for the Millennium Challenge
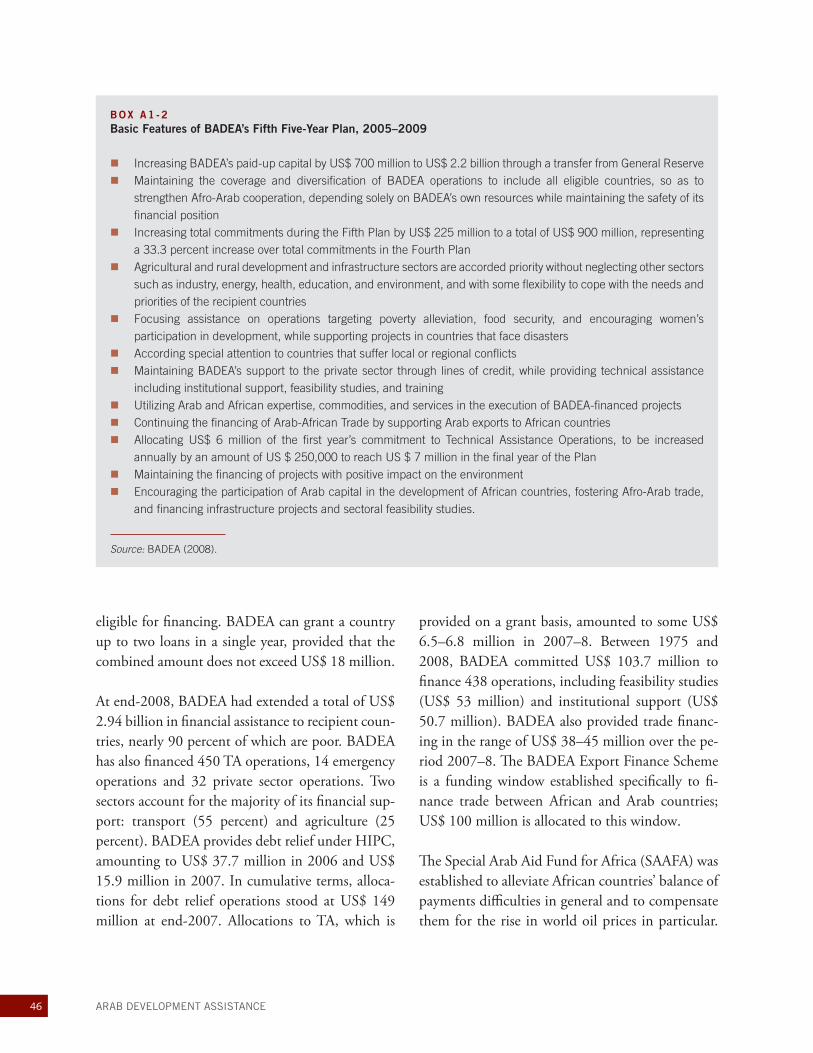
46 ARAB DEVELOPMENT ASSISTANCE
eligible for financing. BADEA can grant a country up to two loans in a single year, provided that the combined amount does not exceed US$ 18 million.
At end-2008, BADEA had extended a total of US$ 2.94 billion in financial assistance to recipient coun-tries, nearly 90 percent of which are poor. BADEA has also financed 450 TA operations, 14 emergency operations and 32 private sector operations. Two sectors account for the majority of its financial sup-port: transport (55 percent) and agriculture (25 percent). BADEA provides debt relief under HIPC, amounting to US$ 37.7 million in 2006 and US$ 15.9 million in 2007. In cumulative terms, alloca-tions for debt relief operations stood at US$ 149 million at end-2007. Allocations to TA, which is
provided on a grant basis, amounted to some US$ 6.5–6.8 million in 2007–8. Between 1975 and 2008, BADEA committed US$ 103.7 million to finance 438 operations, including feasibility studies (US$ 53 million) and institutional support (US$ 50.7 million). BADEA also provided trade financ-ing in the range of US$ 38–45 million over the pe-riod 2007–8. The BADEA Export Finance Scheme is a funding window established specifically to fi-nance trade between African and Arab countries; US$ 100 million is allocated to this window.
The Special Arab Aid Fund for Africa (SAAFA) was established to alleviate African countries’ balance of payments difficulties in general and to compensate them for the rise in world oil prices in particular.
BOX A1 -2 Basic Features of BADEA’s Fifth Five-Year Plan, 2005–2009
Increasing BADEA’s paid-up capital by US$ 700 million to US$ 2.2 billion through a transfer from General Reserve Maintaining the coverage and diversification of BADEA operations to include all eligible countries, so as to
strengthen Afro-Arab cooperation, depending solely on BADEA’s own resources while maintaining the safety of its financial position
Increasing total commitments during the Fifth Plan by US$ 225 million to a total of US$ 900 million, representing a 33.3 percent increase over total commitments in the Fourth Plan
Agricultural and rural development and infrastructure sectors are accorded priority without neglecting other sectors such as industry, energy, health, education, and environment, and with some flexibility to cope with the needs and priorities of the recipient countries
Focusing assistance on operations targeting poverty alleviation, food security, and encouraging women’s participation in development, while supporting projects in countries that face disasters
According special attention to countries that suffer local or regional conflicts Maintaining BADEA’s support to the private sector through lines of credit, while providing technical assistance
including institutional support, feasibility studies, and training Utilizing Arab and African expertise, commodities, and services in the execution of BADEA-financed projects Continuing the financing of Arab-African Trade by supporting Arab exports to African countries Allocating US$ 6 million of the first year’s commitment to Technical Assistance Operations, to be increased
annually by an amount of US $ 250,000 to reach US $ 7 million in the final year of the Plan Maintaining the financing of projects with positive impact on the environment Encouraging the participation of Arab capital in the development of African countries, fostering Afro-Arab trade,
and financing infrastructure projects and sectoral feasibility studies.
Source: BADEA (2008).
47Annex 1 An Overview of Arab Financial Institutions
SAAFA was merged with BADEA in 1976. Be-fore the merger, SAAFA financed projects worth of a total of US$ 214 million. From 1997 to 2008, BADEA also contributed to global debt relief ini-tiatives by providing US$ 148 million for the ben-efit of 16 countries.
BADEA has participated as a partner and signatory to the New Partnership for African Development (NEPAD), providing support to NEPAD priority sectors: agriculture, human resource development, and infrastructure. Assistance will also be provided to help develop financial sectors through institu-tional deepening and encouragement of foreign di-rect investment.
Almost all of BADEA’s operations are co-financed with other development partners. By statute, BADEA’s financing contribution is limited to 60 percent of a project’s total cost. Between 1975 and 2008, BADEA’s financing accounted for about 15.7 percent of the total cost of projects it financed. By comparison, the contributions of AFESD, IsDB, and OFID jointly accounted for 22.3 percent of total project costs for projects in which BADEA was a co-financier. Other sources of financing, in-cluding the World Bank Group, AfDB, European Union (EU), and DAC donors, accounted for 36.6 percent of total project costs. Beneficiary govern-ments contributed some 25.4 percent of the total project costs.
Arab Fund for Economic and Social Development
The Arab Fund for Economic and Social Develop-ment (AFESD) was established in 1971 in Kuwait City, with the aim of financing economic and social development in Arab countries. It is the oldest Arab regional development agency, and its membership consists of LAS countries. AFESD currently em-ploys a total of 192 staff.
AFESD extends concessional aid to governments and public and private organizations through loans and capital participation. It also promotes closer cooperation among Arab countries by funding re-gional projects. AFESD loan terms range from 22 to 25 years, with a grace period of four to seven years. In early 2009, AFESD halved its lending in-terest rates to 2.5–3 percent. Using a 10 percent discount rate, AFESD calculates that the grant ele-ment of its assistance ranges between 32 and 42 percent, with the higher share accorded to low-income borrowers and the lower share to middle-income borrowers.
At end-2007, AFESD had authorized capital of US$ 2.8 billion, paid-up capital of US$ 2.3 billion, and accumulated reserves of US$ 6.5 billion. Al-though it is permitted to access global capital mar-kets, it has not exercised this option. At present, it has the ability (through equity and reserves) to scale up its lending if need be.
Total AFESD loan commitments during 1974–2007 amounted to US$ 19.4 billion for a total of 510 projects. Disbursements reached a total of US$ 13.9 billion. TA represented a small amount (some US$ 71 million) of AFESD assistance during this period. Grants comprised about US$ 0.5 billion dollars in commitments, including some 855 small grants. Of AFESD’s small grants support, US$ 73.5 million was used for emergency assistance and US$ 175 million for training and institutional sup-port. About half of these small grants were inter-Arab grants aimed at promoting scientific exchange and building technical capacity. A large share of AFESD’s grants went to the West Bank and Gaza. Total development funding in the West Bank and Gaza over the period 1974–2007 reached KD 90.2 million, of which KD 76.2 million was in the form of grants. Since 2001, AFESD has allocated 10 percent of its yearly net income to the Palestinian Authority.
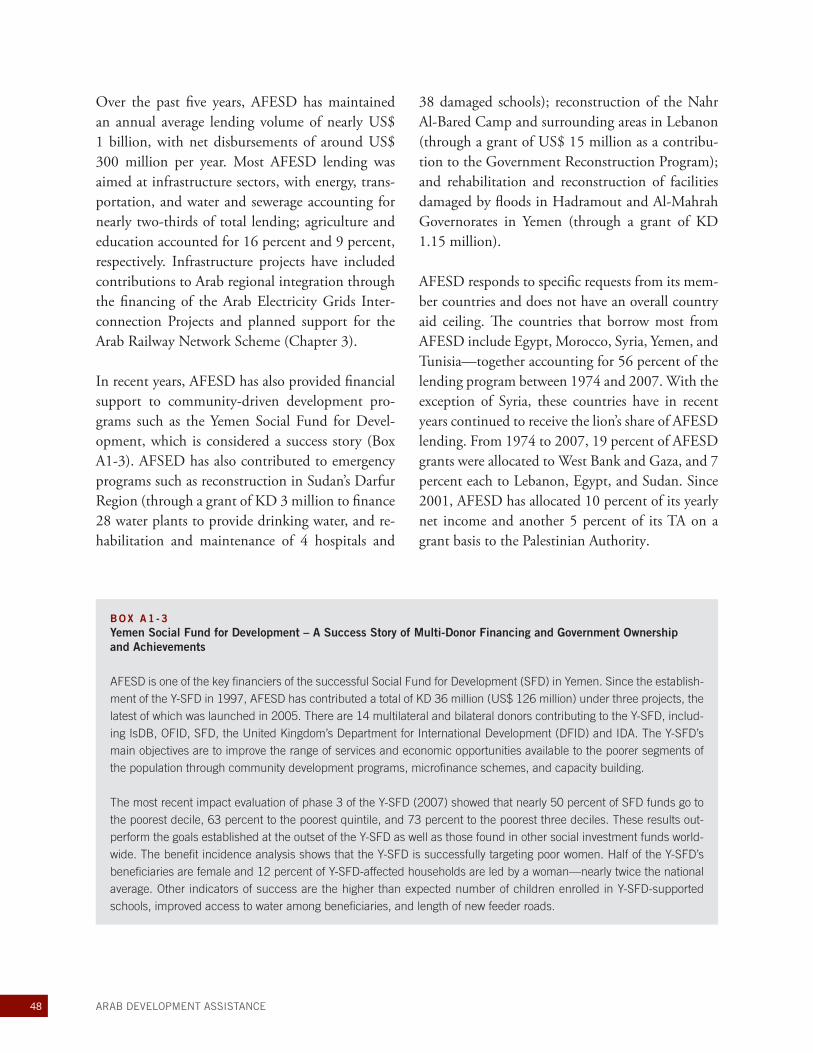
48 ARAB DEVELOPMENT ASSISTANCE
Over the past five years, AFESD has maintained an annual average lending volume of nearly US$ 1 billion, with net disbursements of around US$ 300 million per year. Most AFESD lending was aimed at infrastructure sectors, with energy, trans-portation, and water and sewerage accounting for nearly two-thirds of total lending; agriculture and education accounted for 16 percent and 9 percent, respectively. Infrastructure projects have included contributions to Arab regional integration through the financing of the Arab Electricity Grids Inter-connection Projects and planned support for the Arab Railway Network Scheme (Chapter 3).
In recent years, AFESD has also provided financial support to community-driven development pro-grams such as the Yemen Social Fund for Devel-opment, which is considered a success story (Box A1-3). AFSED has also contributed to emergency programs such as reconstruction in Sudan’s Darfur Region (through a grant of KD 3 million to finance 28 water plants to provide drinking water, and re-habilitation and maintenance of 4 hospitals and
38 damaged schools); reconstruction of the Nahr Al-Bared Camp and surrounding areas in Lebanon (through a grant of US$ 15 million as a contribu-tion to the Government Reconstruction Program); and rehabilitation and reconstruction of facilities damaged by floods in Hadramout and Al-Mahrah Governorates in Yemen (through a grant of KD 1.15 million).
AFESD responds to specific requests from its mem-ber countries and does not have an overall country aid ceiling. The countries that borrow most from AFESD include Egypt, Morocco, Syria, Yemen, and Tunisia—together accounting for 56 percent of the lending program between 1974 and 2007. With the exception of Syria, these countries have in recent years continued to receive the lion’s share of AFESD lending. From 1974 to 2007, 19 percent of AFESD grants were allocated to West Bank and Gaza, and 7 percent each to Lebanon, Egypt, and Sudan. Since 2001, AFESD has allocated 10 percent of its yearly net income and another 5 percent of its TA on a grant basis to the Palestinian Authority.
BOX A1 -3 Yemen Social Fund for Development – A Success Story of Multi-Donor Financing and Government Ownership and Achievements
AFESD is one of the key financiers of the successful Social Fund for Development (SFD) in Yemen. Since the establish-ment of the Y-SFD in 1997, AFESD has contributed a total of KD 36 million (US$ 126 million) under three projects, the latest of which was launched in 2005. There are 14 multilateral and bilateral donors contributing to the Y-SFD, includ-ing IsDB, OFID, SFD, the United Kingdom’s Department for International Development (DFID) and IDA. The Y-SFD’s main objectives are to improve the range of services and economic opportunities available to the poorer segments of the population through community development programs, microfinance schemes, and capacity building.
The most recent impact evaluation of phase 3 of the Y-SFD (2007) showed that nearly 50 percent of SFD funds go to the poorest decile, 63 percent to the poorest quintile, and 73 percent to the poorest three deciles. These results out-perform the goals established at the outset of the Y-SFD as well as those found in other social investment funds world-wide. The benefit incidence analysis shows that the Y-SFD is successfully targeting poor women. Half of the Y-SFD’s beneficiaries are female and 12 percent of Y-SFD-affected households are led by a woman—nearly twice the national average. Other indicators of success are the higher than expected number of children enrolled in Y-SFD-supported schools, improved access to water among beneficiaries, and length of new feeder roads.
49Annex 1 An Overview of Arab Financial Institutions
The majority of AFESD projects are co-financed. Cumulative AFESD commitments through end-2007 accounted for some 27 percent of total project costs, with the balance provided by a wide range of co-financiers and government borrowers. In 2007, AFESD co-financed operations with KFAED, OFID, and IsDB. It also continued to support and monitor the Arab Trade Financing program and participated in the preparation of the Unified Arab Economic Report. In addition to providing some US$ 136 million in cumulative support for World Bank Group projects, AFESD has managed an estimated 127 OFID grants with a total value of US$ 29 million. Some 60–70 percent of AFESD’s grants are non-refundable, covering support and institutional capacity building for NGOs. Project preparation grants are included in the loan costs for approved projects. During the Arab League Eco-nomic Summit held in Kuwait in January 2009, AFESD was entrusted as the custodian of a US$ 2 billion fund for SME development. Finally, AFESD provides secretariat services for the Coor-dination Group.
Arab Gulf Programme for United Nations Development Organizations
AGFUND was established in 1980 by H.R.H. Talal Bin Abdul Aziz with the support of the leaders of the GCC countries that constitute its membership and contribute to its budget. This non-profit orga-nization supports sustainable human development efforts targeting the neediest groups in developing countries, particularly projects aimed at assisting poor women and children. It cooperates with de-velopment organizations, NGOs, and other insti-tutions, and channels financial assistance through some 17 UN-specialized agencies. Its main areas of assistance include health, education, institutional capacity building, and special development proj-ects. AGFUND is the newest member of the Coor-dination Group and employs 37 staff in total.
AGFUND has contributed to the establishment of a number of Arab regional institutions, includ-ing the Arab Council for Childhood and Develop-ment, the Center for Arab Women Research and Training, the Arab Network of NGOs, and the Arab Open University.
AGFUND financial assistance amounted to about US$ 260 million for 1,141 projects during the pe-riod 1981–2007, averaging 52 projects per year for about US$ 12 million in annual grant assistance. AGFUND financial support was relatively substan-tial in its earlier years, ranging from US$ 10 to 40 million per year. This assistance has dropped to less than US$ 8 million per year since 1988. Nearly half of AGFUND’s assistance has been directed to projects in the health sector, followed by institu-tional capacity building, special development proj-ects, and education sector activities. AGFUND as-sistance is all in the form of grants.
AGFUND plays an advocacy, knowledge sharing, and catalyst role, and works in partnership with oth-er organizations, namely UN agencies. AGFUND has acquired practical experience in three areas in particular: early childhood education, higher edu-cation (Arab Open University), and micro-credit. Development partners can learn valuable lessons from AGFUND’s experience, with a view to sup-porting the scaling-up of the above initiatives.
Arab Monetary Fund
The Arab Monetary Fund (AMF), established in 1976 and located in Abu Dhabi, UAE, is a regional organization of LAS members. Its activities include financing balance of payments deficits, promoting and supporting economic reform, developing Arab capital markets, promoting intra-Arab trade, and supporting Greater Arab Free Trade Area initia-tives. AMF houses the Secretariat for the Council of Governors of Arab Central Banks and Monetary
50 ARAB DEVELOPMENT ASSISTANCE
46 The London Interbank Offered Rate (LIBOR) is a daily reference rate based on the interest rates at which banks borrow un-secured funds from other banks in the London wholesale money market.
Authorities and publishes a composite index mea-suring the performance of fifteen Arab stock mar-kets. AMF also provides economic surveillance and technical capacity building services to its member countries in fiscal, monetary, trade, and financial sector development. AMF’s Economic Policy Insti-tute has conducted some 176 training courses to build capacity in its member countries.
At end-2007, AMF’s authorized capital amounted to AAD 600 million and paid-up capital, includ-ing capitalized reserves in 2005, to AAD 596 mil-lion. Since AMF’s inception, some 137 loans have been granted to 14 member countries. Total loans amounted to nearly US$ 5 billion, with over 60 percent going to four countries: Egypt, Algeria, Morocco, and Yemen. AMF lending is concessional (concessionality is calculated as the difference be-tween LIBOR46 and the rate applied at the time of the loan agreement), with interest rates ranging from 3 to 4.5 percent, a repayment period of three to seven years, and a grace period of one-and-a-half to three-and-a-half years. AMF has also provided, through its Arab Trade Financing Program (ATFP), financing for member countries to meet essential import requirements, including the provision of trade credits to finance the sale of wheat by UAE to Egypt, Morocco, and Yemen during the 2008 food crisis.
The ATFP, established in 1989, has authorized capital of US$ 500 million and 49 shareholders representing a number of Arab financial organiza-tions, central banks, and commercial banks. The ATFP has provided some US$ 5.8 billion in cu-mulative financing since 1991, of which US$ 5.3 billion has been disbursed. The ATFP aims mainly to promote inter-Arab trade and foster competi-tiveness in the region. Its financing is provided at
competitive terms and is complemented by the provision of trade information on Arab markets, coordination of trade opportunities, and trade pro-motion.
Balance of payments and budget support has domi-nated AMF lending—the share of such loans rep-resented around 27 percent of total lending value, while Structural Adjustment Facilities amounted to 21 percent. AMF lending has declined in recent years due to improvements in the foreign curren-cy positions of its member countries. Debt relief worth US$ 12 million was extended to Mauritania in 2003/2004 and US$ 280 million to Sudan re-cently. In 2007, AMF introduced a new oil facility that allows members to borrow up to 200 percent of their paid-up subscription in a convertible cur-rency to meet the cost of petroleum imports.
AMF collaborates with the IMF and World Bank to help strengthen member countries’ balance of payments. AMF and the World Bank are also col-laborating in the provision of TA to Arab central banks for the development of a credit reporting sys-tem and a pan-Arab credit bureau.
Islamic Development Bank
The Islamic Development Bank (IsDB) was estab-lished by Muslim countries and is headquartered in Jeddah, Saudi Arabia. It began operations in 1975 and has a total staff of 1,014. IsDB has 56 mem-ber countries, up from 22 at its launch. The IsDB Group has four regional offices in member coun-tries: Almaty, Kazakhstan; Dakar, Senegal; Kuala Lumpur, Malaysia; and Rabat, Morocco. Field rep-resentatives are also stationed in Algeria, Gambia, Guinea-Bissau, Indonesia, Iran, Libya, Mauritania, Pakistan, and Sudan.
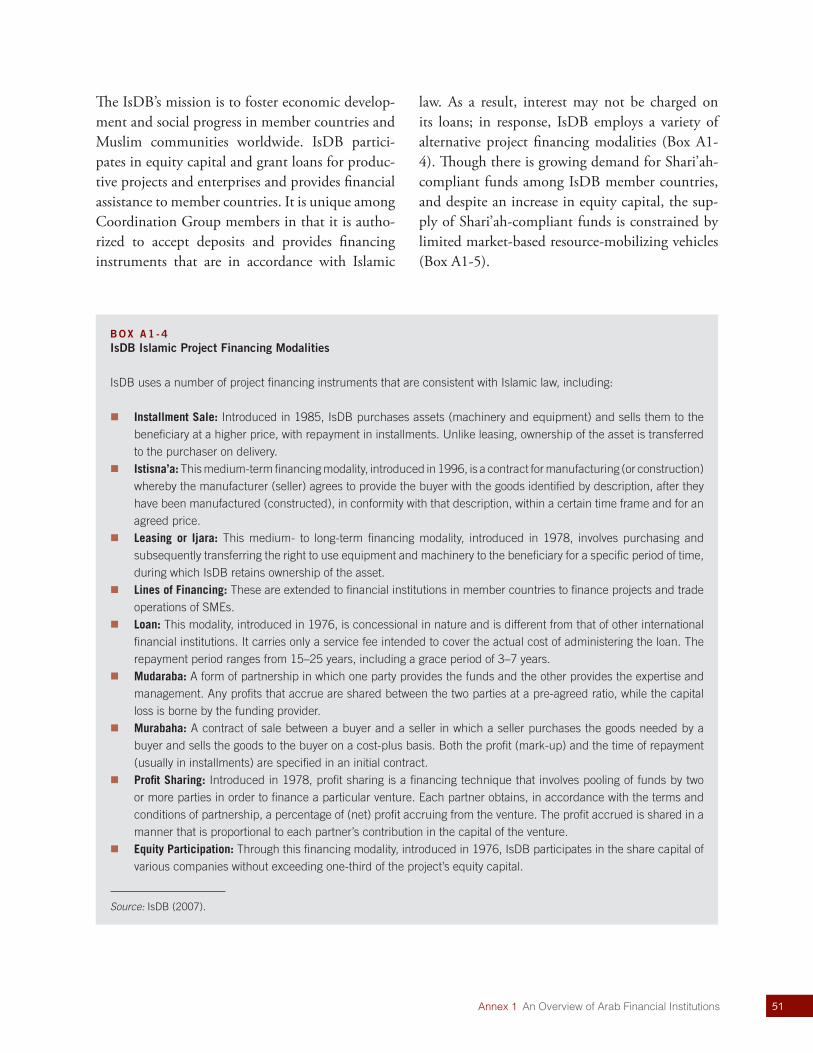
51Annex 1 An Overview of Arab Financial Institutions
The IsDB’s mission is to foster economic develop-ment and social progress in member countries and Muslim communities worldwide. IsDB partici-pates in equity capital and grant loans for produc-tive projects and enterprises and provides financial assistance to member countries. It is unique among Coordination Group members in that it is autho-rized to accept deposits and provides financing instruments that are in accordance with Islamic
law. As a result, interest may not be charged on its loans; in response, IsDB employs a variety of alternative project financing modalities (Box A1-4). Though there is growing demand for Shari’ah-compliant funds among IsDB member countries, and despite an increase in equity capital, the sup-ply of Shari’ah-compliant funds is constrained by limited market-based resource-mobilizing vehicles (Box A1-5).
BOX A1 -4 IsDB Islamic Project Financing Modalities
IsDB uses a number of project financing instruments that are consistent with Islamic law, including:
Installment Sale: Introduced in 1985, IsDB purchases assets (machinery and equipment) and sells them to the beneficiary at a higher price, with repayment in installments. Unlike leasing, ownership of the asset is transferred to the purchaser on delivery.
Istisna’a: This medium-term financing modality, introduced in 1996, is a contract for manufacturing (or construction) whereby the manufacturer (seller) agrees to provide the buyer with the goods identified by description, after they have been manufactured (constructed), in conformity with that description, within a certain time frame and for an agreed price.
Leasing or Ijara: This medium- to long-term financing modality, introduced in 1978, involves purchasing and subsequently transferring the right to use equipment and machinery to the beneficiary for a specific period of time, during which IsDB retains ownership of the asset.
Lines of Financing: These are extended to financial institutions in member countries to finance projects and trade operations of SMEs.
Loan: This modality, introduced in 1976, is concessional in nature and is different from that of other international financial institutions. It carries only a service fee intended to cover the actual cost of administering the loan. The repayment period ranges from 15–25 years, including a grace period of 3–7 years.
Mudaraba: A form of partnership in which one party provides the funds and the other provides the expertise and management. Any profits that accrue are shared between the two parties at a pre-agreed ratio, while the capital loss is borne by the funding provider.
Murabaha: A contract of sale between a buyer and a seller in which a seller purchases the goods needed by a buyer and sells the goods to the buyer on a cost-plus basis. Both the profit (mark-up) and the time of repayment (usually in installments) are specified in an initial contract.
Profit Sharing: Introduced in 1978, profit sharing is a financing technique that involves pooling of funds by two or more parties in order to finance a particular venture. Each partner obtains, in accordance with the terms and conditions of partnership, a percentage of (net) profit accruing from the venture. The profit accrued is shared in a manner that is proportional to each partner’s contribution in the capital of the venture.
Equity Participation: Through this financing modality, introduced in 1976, IsDB participates in the share capital of various companies without exceeding one-third of the project’s equity capital.
Source: IsDB (2007).
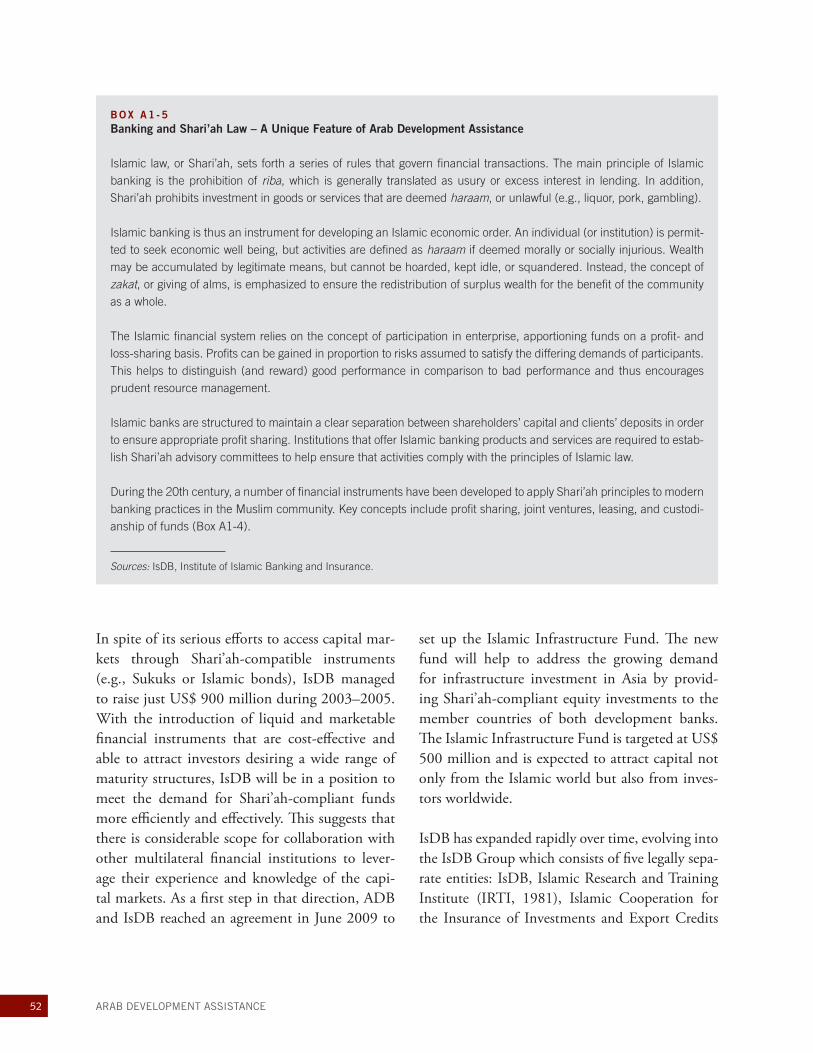
52 ARAB DEVELOPMENT ASSISTANCE
In spite of its serious efforts to access capital mar-kets through Shari’ah-compatible instruments (e.g., Sukuks or Islamic bonds), IsDB managed to raise just US$ 900 million during 2003–2005. With the introduction of liquid and marketable financial instruments that are cost-effective and able to attract investors desiring a wide range of maturity structures, IsDB will be in a position to meet the demand for Shari’ah-compliant funds more efficiently and effectively. This suggests that there is considerable scope for collaboration with other multilateral financial institutions to lever-age their experience and knowledge of the capi-tal markets. As a first step in that direction, ADB and IsDB reached an agreement in June 2009 to
set up the Islamic Infrastructure Fund. The new fund will help to address the growing demand for infrastructure investment in Asia by provid-ing Shari’ah-compliant equity investments to the member countries of both development banks. The Islamic Infrastructure Fund is targeted at US$ 500 million and is expected to attract capital not only from the Islamic world but also from inves-tors worldwide.
IsDB has expanded rapidly over time, evolving into the IsDB Group which consists of five legally sepa-rate entities: IsDB, Islamic Research and Training Institute (IRTI, 1981), Islamic Cooperation for the Insurance of Investments and Export Credits
BOX A1 -5 Banking and Shari’ah Law – A Unique Feature of Arab Development Assistance
Islamic law, or Shari’ah, sets forth a series of rules that govern financial transactions. The main principle of Islamic banking is the prohibition of riba, which is generally translated as usury or excess interest in lending. In addition, Shari’ah prohibits investment in goods or services that are deemed haraam, or unlawful (e.g., liquor, pork, gambling).
Islamic banking is thus an instrument for developing an Islamic economic order. An individual (or institution) is permit-ted to seek economic well being, but activities are defined as haraam if deemed morally or socially injurious. Wealth may be accumulated by legitimate means, but cannot be hoarded, kept idle, or squandered. Instead, the concept of zakat, or giving of alms, is emphasized to ensure the redistribution of surplus wealth for the benefit of the community as a whole.
The Islamic financial system relies on the concept of participation in enterprise, apportioning funds on a profit- and loss-sharing basis. Profits can be gained in proportion to risks assumed to satisfy the differing demands of participants. This helps to distinguish (and reward) good performance in comparison to bad performance and thus encourages prudent resource management.
Islamic banks are structured to maintain a clear separation between shareholders’ capital and clients’ deposits in order to ensure appropriate profit sharing. Institutions that offer Islamic banking products and services are required to estab-lish Shari’ah advisory committees to help ensure that activities comply with the principles of Islamic law.
During the 20th century, a number of financial instruments have been developed to apply Shari’ah principles to modern banking practices in the Muslim community. Key concepts include profit sharing, joint ventures, leasing, and custodi-anship of funds (Box A1-4).
Sources: IsDB, Institute of Islamic Banking and Insurance.
53Annex 1 An Overview of Arab Financial Institutions
(ICIEC, 1994), Islamic Cooperation for the De-velopment of the Private Sector (ICD, 1999), and International Islamic Trade Finance Corporation (ITFC, 2005). Apart from IsDB itself, the total commitments of ICIEC and ICD, the two largest entities, amounted to US$ 5.3 billion and US$ 680 million, respectively, at end-2007.
IsDB has recently adopted a new long-term strate-gic vision, A Vision for Human Dignity, in which it reaffirms its desire to become a world-class de-velopment bank inspired by Islamic principles and contributing significantly to improving human development in the Muslim world. The vision statement outlines nine strategic thrusts47 with the overarching aim of promoting comprehensive hu-man development by focusing on poverty allevia-tion, health, education, governance, and economic prosperity. IsDB is also seeking to become more of a knowledge-based bank, shifting its organizational structure and enhancing capacity and resources to achieve greater synergies among its various financ-ing instruments, empowerment of its borrowers, and transparency in its operations.
By end-2007, IsDB’s total commitments amount-ed to US$ 46.2 billion, of which US$ 15.5 bil-lion took the form of project financing. A total of US$ 232 million has been provided in the form of technical assistance grants and another US$ 641 million in special assistance grants. Financing for private sector activities has become increasingly important in recent years. In 2006, for example, over 20 percent of total IsDB project financing was
directed to non-sovereign entities for six projects in power infrastructure and manufacturing in five member countries. Apart from Arab countries, which accounted for 49 percent of lending, poor countries accounted for over 35 percent and sub-Saharan African countries for over 15 percent.
In 2002, IsDB adopted the Ouagadougou Dec-laration, committing to provide US$ 2 billion in development assistance to its least developed mem-ber countries in Africa over a five-year period from 2003 to 2007. The Declaration targeted support for the social sectors, transport, trade, micro-finance, and capacity building. IsDB’s performance exceed-ed the target by US$ 300 million. In response to the 2008 food crisis, IsDB prepared an assistance package of US$ 1.5 billion through the Jeddah Declaration Initiative to strengthen food security in member countries. The package was designed to support immediate, short-term, and medium- to longer-term measures. By June 2009, IsDB had ap-proved nearly US$ 442 million under the Initiative, representing over 29 percent of the total amount of the assistance package. This includes US$ 377 mil-lion for projects, US$ 52 million for trade finance (by ITFC), and US$ 12 million for private sector development (by ICD).
Since its inception, most IsDB project operations have been directed toward the infrastructure sector. This sector has accounted for some 74 percent of Ordi-nary Capital Resources (OCR) financing.48 Social sectors, agriculture, financial services, and industry share the remaining funds.
47 The nine strategic thrusts are as follows: reform IDB, alleviate poverty, promote health, universalize education, prosper the people, empower the Sisters of Islam without breaching the tenets of Islam, expand the Islamic financial industry, facilitate in-tegration of I[s]DB member country economies among themselves and with the world, and improve the image of the Muslim world. See IsDB (2006), p. 21 (English version).48 Data on the share of financing by sector are only available for IsDB’s OCR project assistance. An additional US$ 5 billion in lending was provided by the IsDB Group’s other entities/windows including ICD, Islamic Bank’s Portfolio, Unit Investment Fund, and Infrastructure Fund, for which no sector-wise allocation is available. However, the bulk of this assistance is for infra-structure so the proportion of infrastructure lending would be higher still.
54 ARAB DEVELOPMENT ASSISTANCE
The IsDB is expressly committed to financing projects that foster regional economic integration, providing assistance to major regional projects such as the Trans-Sahara and Trans-Sahel road-ways, the construction of the Sevare-Gao road, the Gao Bridge in Mali, and the Agades-Zinder road in Niger. These projects are expected to fa-cilitate movement of people and goods between countries, thereby boosting regional economic in-tegration.
IsDB has been a leader among Coordination Group members in supporting trade finance. Dur-ing the period 1975–2007, trade financing opera-tions represented (in value terms) 65.7 percent of IsDB’s net approvals, with total trade financing, net of cancellations, estimated at US$ 29.8 billion at the end of 2007. IsDB has created several spe-cialized agencies to promote external trade. ICIEC provides export credit insurance and reinsurance to cover non-payment of export receivables result-ing from commercial (buyer) and non-commercial (country) risks. By end-January 2007, ICIEC’s in-surance commitments stood at US$ 3.99 billion, with total business insured of US$ 2.28 billion. ITFC is devoted exclusively to trade, and was es-
tablished with initial authorized capital of US$ 3 billion. Since 1998, IsDB has managed a US$ 50 million export financing scheme for BADEA, un-der which 26 operations have been financed from 11 African countries. In 1997, IsDB launched a TA program for matters related to the World Trade Or-ganization, including workshops, seminars, trade policy courses, and consultations.
IsDB has established a number of specialized funds since its founding (Table A1-1).
IsDB co-finances the majority of its projects with other development partners. Between 1976 and January 2007, IsDB had co-financed 1,869 proj-ects with donors and multilateral development banks worth US$ 86.6 billion. Of this amount, IsDB’s contribution totaled US$ 13.8 billion, representing 16 percent of the total cost. Other co-financers contributed US$ 34.5 billion, repre-senting 39 percent of total project costs. IsDB has co-financed projects with the World Bank Group, ADB, EBRD, AfDB, ECOWAS Fund, European Investment Bank (EIB), International Finance Corporation, and members of the Coordination Group.
TABLE A1 -1 IsDB Specialized Funds
Fund Year Resources
IsDB Waqf Fund 1979 US$ 1.5 billion
Islamic Banks Portfolio for Investment and Development 1987 To date: US$ 4.4 billion
Unit Investment Fund 1989 Commitment: US$ 2.0 billion
Al Aqsa and Al Oud Funds 2000 US$ 1.0 billion
Awqaf Properties Investment Fund 2001 US$ 59 million
Islamic Solidarity Fund for Development 2007 Target: US$ 10 billion
Infrastructure Fund—expired in 2006 Investment: US$ 584 million
Islamic Infrastructure Fund (with ADB) 2009 US$ 500 million
55Annex 1 An Overview of Arab Financial Institutions
IsDB relies heavily on its own capital to fund its lending operations because of its limited access to the global capital market. Its current authorized capital stands at US$ 47.4 billion and its equity capital (i.e., member funds) at US$ 8.4 billion, following the latest capital increase in 2006. Total outstanding financing at end-2007 was US$ 7.7 billion, implying an equity-to-loan ratio of 109.
At its latest annual meeting in Ashgabat, Turkmen-istan, in June 2009, IsDB agreed to double its lend-ing volume over the next three years to help member countries address the ongoing global financial cri-sis. This decision would provide additional financ-ing of US$ 2.5 billion; US$ 500 million in Sukuk (bonds) will be issued in the near future.
OPEC Fund for International Development
The OPEC Fund for International Development (OFID) was established in 1976 by the 13 OPEC member countries at the time: Algeria, Gabon, Indonesia, Iran, Iraq, Kuwait, Libya, Nigeria, Qa-tar, Saudi Arabia, UAE, and Venezuela. Its aim is to foster social and economic development, par-ticularly of poor countries, and to advance South-South cooperation. OFID provides concessional loans for investment projects, programs, and bal-ance of payments and budget support. It also pro-vides debt relief as part of the HIPC initiative and grants for technical and humanitarian assistance. Furthermore, OFID provides equity/loans and trade financing to the private sector. OFID has a total staff of 140.
Total contributions (paid-in) by OPEC member countries stood at nearly US$ 3 billion at end-2007. This amount includes US$ 732 million ear-marked for IFAD and US$ 111 million transferred to the IMF Trust Fund (arising from profits from IMF gold sales in 1976). Actual contributions represent the bulk of the pledges (commitments)
made. Total contributions from Arab members of OPEC represent 68 percent of the total, with Saudi Arabia alone accounting for more than half of this share (35 percent). In addition to member countries’ contributions, which are voluntary, ac-cumulated reserves amounted to US$ 3.5 billion. The capital has been paid-in over time and no re-plenishment has taken place since OFID was estab-lished. Reserves have never been capitalized. OFID is now thinking of accessing the capital markets to strengthen its capital base.
OFID provides loans to low-income borrowers at an interest rate of 2 to 2.75 percent per year, and to middle-income borrowers at an interest rate of 4 to 5 percent per year. Repayment periods are generally set at 20 years, after an initial five-year grace period. OFID assistance has an estimated grant element of 35 percent.
At end-2007, OFID had committed US$ 9.5 bil-lion and disbursed US$ 5.9 billion, including the full amount earmarked for IFAD and the IMF Trust Fund. Excluding IFAD and the IMF Trust Fund, the majority of commitments and disburse-ments went to project and program lending (70–75 percent), followed by balance of payments support (9–15 percent), HIPC debt relief (3–4 percent), TA and emergency relief (5–6 percent), and pri-vate sector and trade (6–8 percent). Twenty-five countries, all but four in sub-Saharan Africa, have benefited from OFID debt relief in the form of 35 restructured loans worth a total of US$ 251 mil-lion. Overall, OFID lending has increased by 10 percent per year over the past 15 years. Through 2007, OFID had provided balance of payments support loans to Africa (US$ 430.5 million), Asia (US$ 175.8 million), and Latin American and the Caribbean (US$ 118.0 million).
An analysis of project and program lending, hu-manitarian assistance, balance of payments sup-
56 ARAB DEVELOPMENT ASSISTANCE
port, and debt relief (cumulative commitment) shows that poor countries receive the bulk of OFID assistance, with IDA recipient countries account-ing for three-quarters of total OFID assistance and HIPC countries and sub-Saharan Africa for nearly half. The shares received by Arab (LAS) and Islamic (OIC) countries are one-fifth and one-half, respec-tively.
A total of 1,165 investment loans have been ap-proved, benefiting 102 countries, half of which are in Africa. Most of the assistance is for infrastruc-ture, including transport (29.9 percent), energy (19 percent), and water supply and sewerage (7.9 percent); followed by agriculture (15.4 percent), education (10.5 percent), and health (6 percent).
OFID provides three main types of grants: TA, emergency relief, and funding for research and similar activities. It also has three special accounts within its grant program: the Special Grant Account for the Palestinian Authority, the HIV/AIDS Spe-cial Account, and the Special Food Aid Account. At end-2007, OFID had provided some 928 grants worth US$ 409 million. Of this amount, US$ 123 million was extended as TA, often in cooperation with UN agencies and a number of other interna-tional development organizations. US$ 56 million was directed to emergency relief operations, US$ 10.6 million to sponsored research and similar ac-tivities, US$ 49 million to finance projects within the framework of the HIV/AIDS Special Account, US$ 48 million to the Special Grant Account for Palestinian Authority, US$ 20 million to the Food Aid Special Grant Account, and US$ 20 million to IFAD.
OFID’s Trade Finance Facility was established in 2006 to provide trade finance to a wide range of institutions, including governments, parastatals, banks, and private enterprises. Under this facility, a total of US$ 109 million had been approved by
end-December 2007, including US$ 74.3 million in loans and lines of credit and US$ 34.7 million in risk sharing guarantees, provided to seven coun-tries.
Most of OFID’s project loans have been co-financed with other donors, including the World Bank. In 2007, OFID provided about 10 percent of the total cost of 33 public sector operations. Co-financing was mobilized from various aid agencies, includ-ing ADFD, AFESD, BADEA, IsDB, KFAED, and SFD, as well as a number of other partners: AfDB, ADB, West African Development Bank (BOAD), ECOWAS Regional Development Fund, EIB, EU, IDA, IDB, IFAD, Japan Fund for Poverty Reduc-tion, Millennium Challenge Corporation, United Nations Development Programme (UNDP), West African Economic Union, and the World Bank. The majority of OFID’s grant funded projects also received support from other donors; in 2007, these included Arab Authority for Agricultural Investment and Development, AFESD, Bill and Melinda Gates Foundation, Food and Agriculture Organization, GCC, International Atomic Energy Agency, International Crops Research Institute for the Semi-Arid Tropics, IFAD, Intel, International Committee of the Red Cross, IsDB, King Abdul-Aziz Fund, KFAED, SFD, UN, UNDP, United Nations Fund for International Partnerships, Unit-ed Nations Population Fund, United Nations High Commission on Refugees, United Nations Office on Drugs and Crime, and World Food Programme.
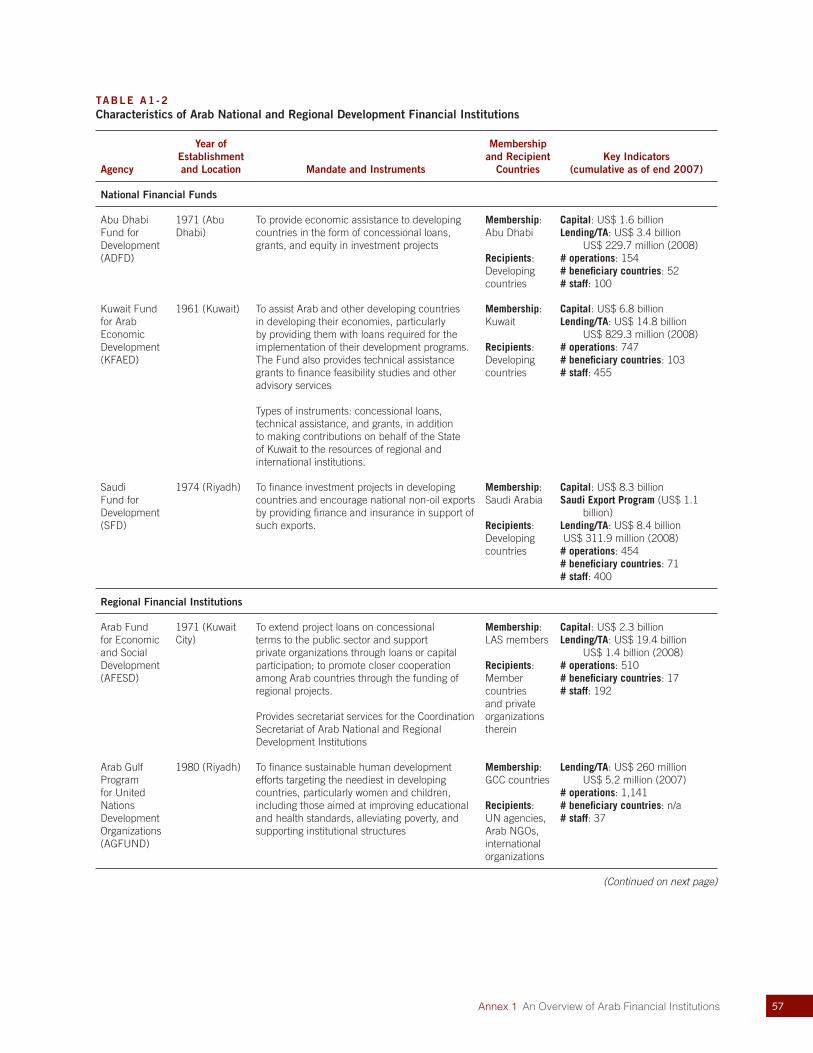
57Annex 1 An Overview of Arab Financial Institutions
TABLE A1 -2 Characteristics of Arab National and Regional Development Financial Institutions
Agency
Year of Establishment and Location Mandate and Instruments
Membership and Recipient
CountriesKey Indicators
(cumulative as of end 2007)
National Financial Funds
Abu Dhabi Fund for Development (ADFD)
1971 (Abu Dhabi)
To provide economic assistance to developing countries in the form of concessional loans, grants, and equity in investment projects
Membership: Abu Dhabi
Recipients: Developing countries
Capital: US$ 1.6 billionLending/TA: US$ 3.4 billion
US$ 229.7 million (2008) # operations: 154# beneficiary countries: 52# staff: 100
Kuwait Fund for Arab Economic Development (KFAED)
1961 (Kuwait) To assist Arab and other developing countries in developing their economies, particularly by providing them with loans required for the implementation of their development programs. The Fund also provides technical assistance grants to finance feasibility studies and other advisory services
Types of instruments: concessional loans, technical assistance, and grants, in addition to making contributions on behalf of the State of Kuwait to the resources of regional and international institutions.
Membership: Kuwait
Recipients: Developing countries
Capital: US$ 6.8 billionLending/TA: US$ 14.8 billion
US$ 829.3 million (2008) # operations: 747# beneficiary countries: 103# staff: 455
Saudi Fund for Development (SFD)
1974 (Riyadh) To finance investment projects in developing countries and encourage national non-oil exports by providing finance and insurance in support of such exports.
Membership: Saudi Arabia
Recipients: Developing countries
Capital: US$ 8.3 billionSaudi Export Program (US$ 1.1
billion)Lending/TA: US$ 8.4 billion US$ 311.9 million (2008) # operations: 454# beneficiary countries: 71# staff: 400
Regional Financial Institutions
Arab Fund for Economic and Social Development(AFESD)
1971 (Kuwait City)
To extend project loans on concessional terms to the public sector and support private organizations through loans or capital participation; to promote closer cooperation among Arab countries through the funding of regional projects.
Provides secretariat services for the Coordination Secretariat of Arab National and Regional Development Institutions
Membership: LAS members
Recipients: Member countries and private organizations therein
Capital: US$ 2.3 billionLending/TA: US$ 19.4 billion
US$ 1.4 billion (2008)# operations: 510# beneficiary countries: 17# staff: 192
Arab Gulf Program for United Nations Development Organizations (AGFUND)
1980 (Riyadh) To finance sustainable human development efforts targeting the neediest in developing countries, particularly women and children, including those aimed at improving educational and health standards, alleviating poverty, and supporting institutional structures
Membership:GCC countries
Recipients: UN agencies, Arab NGOs, international organizations
Lending/TA: US$ 260 million US$ 5.2 million (2007)
# operations: 1,141# beneficiary countries: n/a# staff: 37
(Continued on next page)
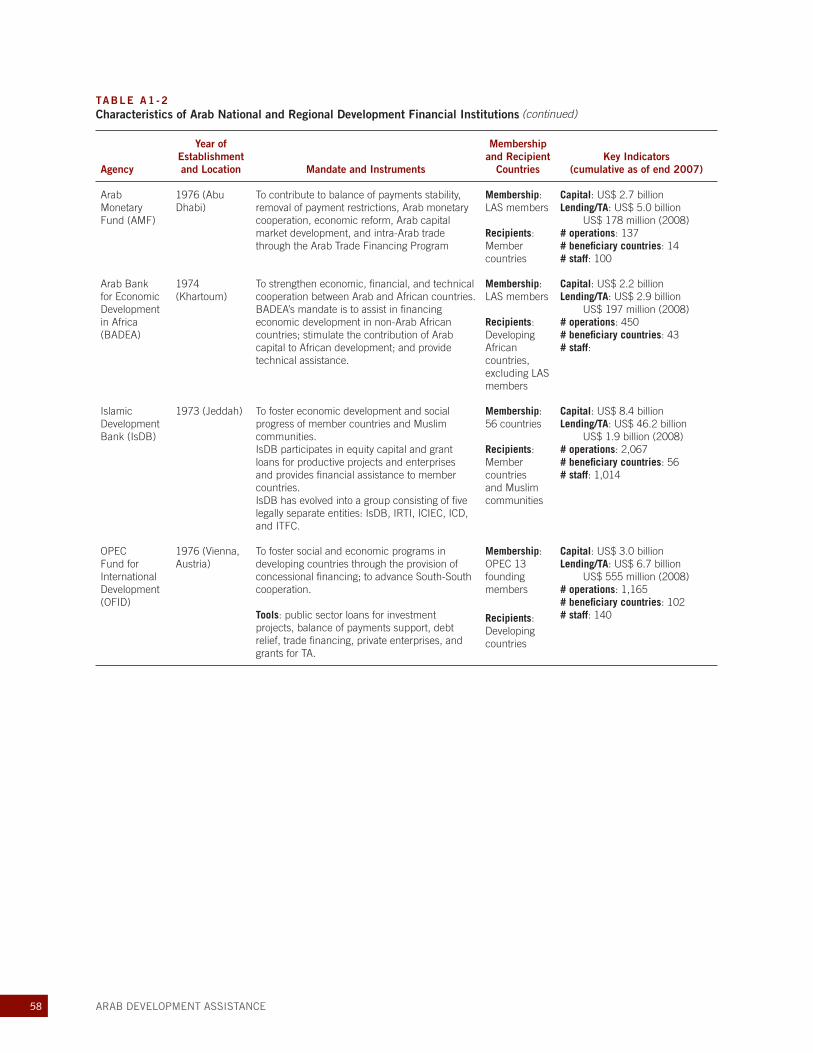
58 ARAB DEVELOPMENT ASSISTANCE
TABLE A1 -2 Characteristics of Arab National and Regional Development Financial Institutions
Agency
Year of Establishment and Location Mandate and Instruments
Membership and Recipient
CountriesKey Indicators
(cumulative as of end 2007)
Arab Monetary Fund (AMF)
1976 (Abu Dhabi)
To contribute to balance of payments stability, removal of payment restrictions, Arab monetary cooperation, economic reform, Arab capital market development, and intra-Arab trade through the Arab Trade Financing Program
Membership: LAS members
Recipients: Member countries
Capital: US$ 2.7 billionLending/TA: US$ 5.0 billion
US$ 178 million (2008)# operations: 137# beneficiary countries: 14# staff: 100
Arab Bank for Economic Development in Africa (BADEA)
1974 (Khartoum)
To strengthen economic, financial, and technical cooperation between Arab and African countries. BADEA’s mandate is to assist in financing economic development in non-Arab African countries; stimulate the contribution of Arab capital to African development; and provide technical assistance.
Membership: LAS members
Recipients: Developing African countries, excluding LAS members
Capital: US$ 2.2 billion Lending/TA: US$ 2.9 billion
US$ 197 million (2008)# operations: 450# beneficiary countries: 43# staff:
Islamic Development Bank (IsDB)
1973 (Jeddah) To foster economic development and social progress of member countries and Muslim communities.IsDB participates in equity capital and grant loans for productive projects and enterprises and provides financial assistance to member countries. IsDB has evolved into a group consisting of five legally separate entities: IsDB, IRTI, ICIEC, ICD, and ITFC.
Membership: 56 countries
Recipients: Member countries and Muslim communities
Capital: US$ 8.4 billionLending/TA: US$ 46.2 billion
US$ 1.9 billion (2008)# operations: 2,067# beneficiary countries: 56# staff: 1,014
OPEC Fund for International Development (OFID)
1976 (Vienna, Austria)
To foster social and economic programs in developing countries through the provision of concessional financing; to advance South-South cooperation.
Tools: public sector loans for investment projects, balance of payments support, debt relief, trade financing, private enterprises, and grants for TA.
Membership: OPEC 13 founding members
Recipients: Developing countries
Capital: US$ 3.0 billionLending/TA: US$ 6.7 billion
US$ 555 million (2008)# operations: 1,165# beneficiary countries: 102# staff: 140
(continued)
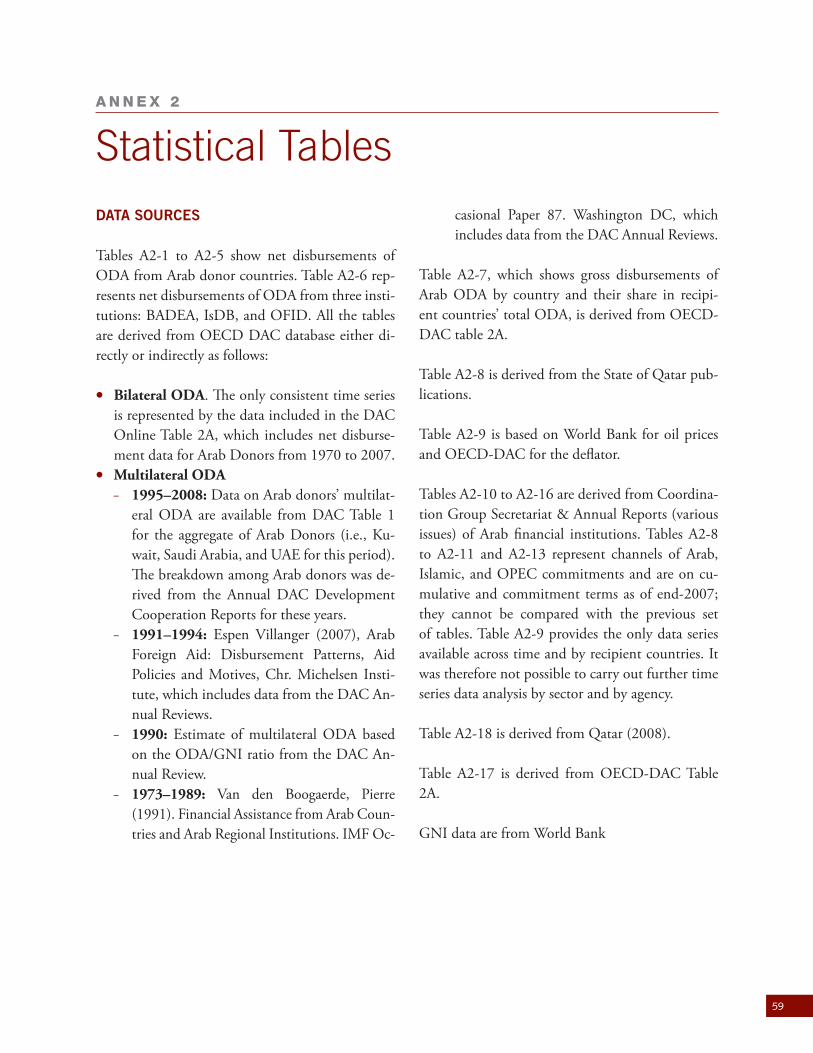
59
DATA SOURCES
Tables A2-1 to A2-5 show net disbursements of ODA from Arab donor countries. Table A2-6 rep-resents net disbursements of ODA from three insti-tutions: BADEA, IsDB, and OFID. All the tables are derived from OECD DAC database either di-rectly or indirectly as follows:
Bilateral ODA. The only consistent time series is represented by the data included in the DAC Online Table 2A, which includes net disburse-ment data for Arab Donors from 1970 to 2007.
Multilateral ODA – 1995–2008: Data on Arab donors’ multilat-
eral ODA are available from DAC Table 1 for the aggregate of Arab Donors (i.e., Ku-wait, Saudi Arabia, and UAE for this period). The breakdown among Arab donors was de-rived from the Annual DAC Development Cooperation Reports for these years.
– 1991–1994: Espen Villanger (2007), Arab Foreign Aid: Disbursement Patterns, Aid Policies and Motives, Chr. Michelsen Insti-tute, which includes data from the DAC An-nual Reviews.
– 1990: Estimate of multilateral ODA based on the ODA/GNI ratio from the DAC An-nual Review.
– 1973–1989: Van den Boogaerde, Pierre (1991). Financial Assistance from Arab Coun-tries and Arab Regional Institutions. IMF Oc-
casional Paper 87. Washington DC, which includes data from the DAC Annual Reviews.
Table A2-7, which shows gross disbursements of Arab ODA by country and their share in recipi-ent countries’ total ODA, is derived from OECD-DAC table 2A.
Table A2-8 is derived from the State of Qatar pub-lications.
Table A2-9 is based on World Bank for oil prices and OECD-DAC for the deflator.
Tables A2-10 to A2-16 are derived from Coordina-tion Group Secretariat & Annual Reports (various issues) of Arab financial institutions. Tables A2-8 to A2-11 and A2-13 represent channels of Arab, Islamic, and OPEC commitments and are on cu-mulative and commitment terms as of end-2007; they cannot be compared with the previous set of tables. Table A2-9 provides the only data series available across time and by recipient countries. It was therefore not possible to carry out further time series data analysis by sector and by agency.
Table A2-18 is derived from Qatar (2008).
Table A2-17 is derived from OECD-DAC Table 2A.
GNI data are from World Bank
A N N E X 2
Statistical Tables
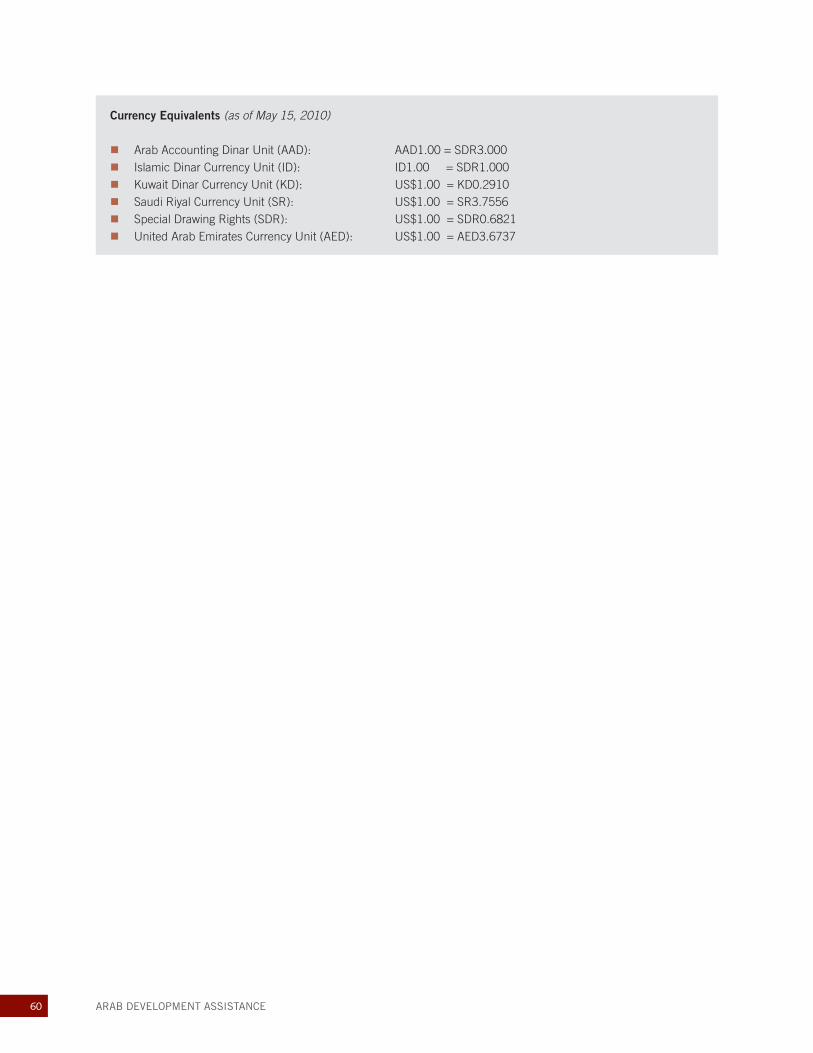
60 ARAB DEVELOPMENT ASSISTANCE
Currency Equivalents (as of May 15, 2010)
Arab Accounting Dinar Unit (AAD): AAD1.00 = SDR3.000 Islamic Dinar Currency Unit (ID): ID1.00 = SDR1.000 Kuwait Dinar Currency Unit (KD): US$1.00 = KD0.2910 Saudi Riyal Currency Unit (SR): US$1.00 = SR3.7556 Special Drawing Rights (SDR): US$1.00 = SDR0.6821 United Arab Emirates Currency Unit (AED): US$1.00 = AED3.6737
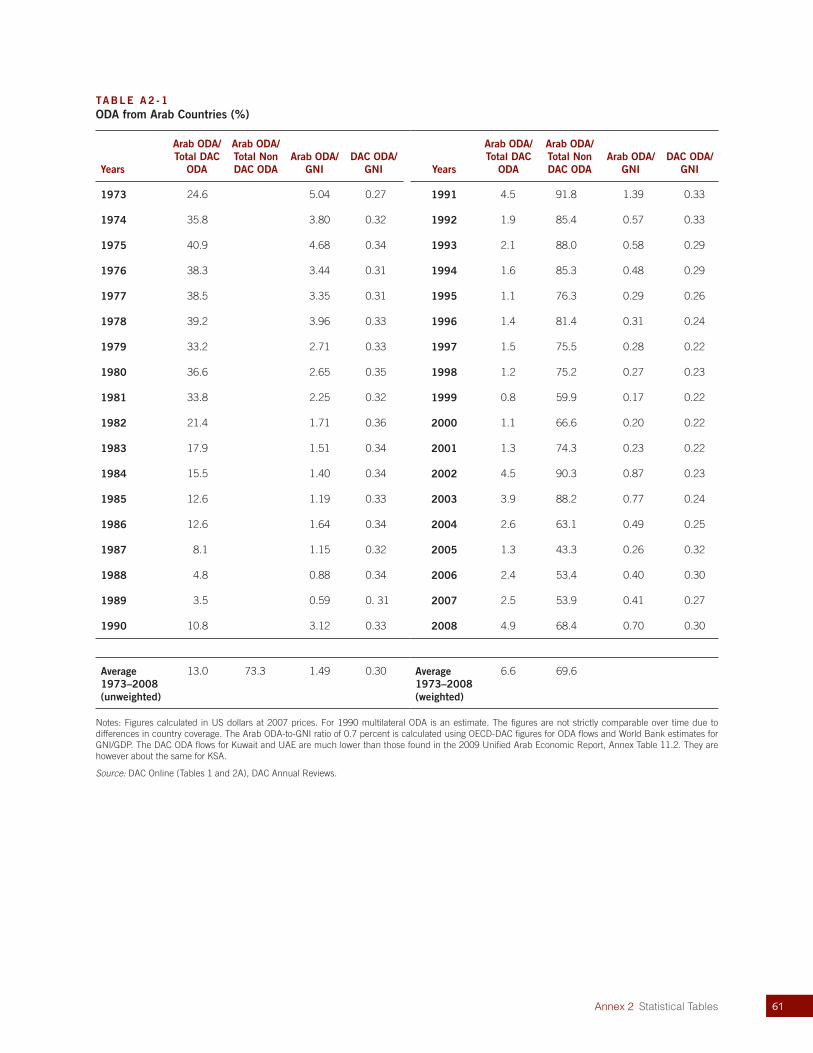
61Annex 2 Statistical Tables
TABLE A2 -1 ODA from Arab Countries (%)
Years
Arab ODA/ Total DAC
ODA
Arab ODA/Total Non DAC ODA
Arab ODA/GNI
DAC ODA/ GNI Years
Arab ODA/ Total DAC
ODA
Arab ODA/Total Non DAC ODA
Arab ODA/GNI
DAC ODA/ GNI
1973 24.6 5.04 0.27 1991 4.5 91.8 1.39 0.33
1974 35.8 3.80 0.32 1992 1.9 85.4 0.57 0.33
1975 40.9 4.68 0.34 1993 2.1 88.0 0.58 0.29
1976 38.3 3.44 0.31 1994 1.6 85.3 0.48 0.29
1977 38.5 3.35 0.31 1995 1.1 76.3 0.29 0.26
1978 39.2 3.96 0.33 1996 1.4 81.4 0.31 0.24
1979 33.2 2.71 0.33 1997 1.5 75.5 0.28 0.22
1980 36.6 2.65 0.35 1998 1.2 75.2 0.27 0.23
1981 33.8 2.25 0.32 1999 0.8 59.9 0.17 0.22
1982 21.4 1.71 0.36 2000 1.1 66.6 0.20 0.22
1983 17.9 1.51 0.34 2001 1.3 74.3 0.23 0.22
1984 15.5 1.40 0.34 2002 4.5 90.3 0.87 0.23
1985 12.6 1.19 0.33 2003 3.9 88.2 0.77 0.24
1986 12.6 1.64 0.34 2004 2.6 63.1 0.49 0.25
1987 8.1 1.15 0.32 2005 1.3 43.3 0.26 0.32
1988 4.8 0.88 0.34 2006 2.4 53.4 0.40 0.30
1989 3.5 0.59 0. 31 2007 2.5 53.9 0.41 0.27
1990 10.8 3.12 0.33 2008 4.9 68.4 0.70 0.30
Average 1973–2008 (unweighted)
13.0 73.3 1.49 0.30 Average 1973–2008 (weighted)
6.6 69.6
Notes: Figures calculated in US dollars at 2007 prices. For 1990 multilateral ODA is an estimate. The figures are not strictly comparable over time due to differences in country coverage. The Arab ODA-to-GNI ratio of 0.7 percent is calculated using OECD-DAC figures for ODA flows and World Bank estimates for GNI/GDP. The DAC ODA flows for Kuwait and UAE are much lower than those found in the 2009 Unified Arab Economic Report, Annex Table 11.2. They are however about the same for KSA.
Source: DAC Online (Tables 1 and 2A), DAC Annual Reviews.
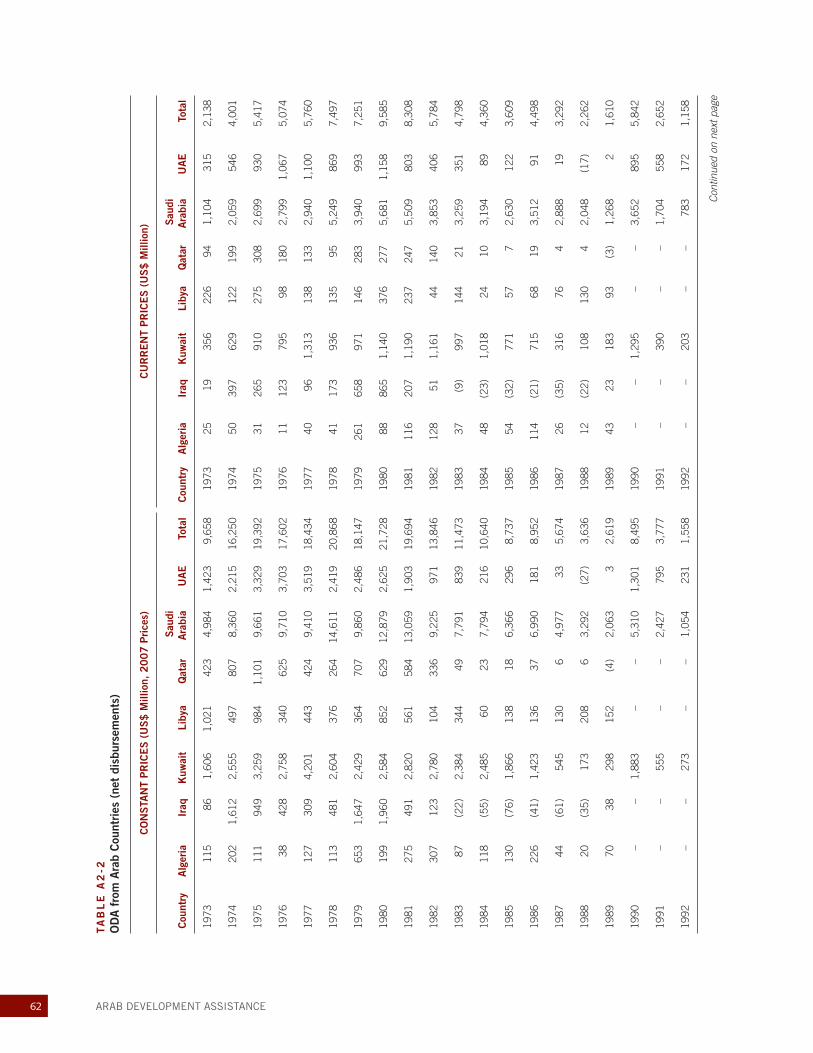
62 ARAB DEVELOPMENT ASSISTANCE
TA
BL
E A
2-2
O
DA
fro
m A
rab
Cou
ntri
es (
net
disb
urse
men
ts)
CO
NS
TAN
T P
RIC
ES
(U
S$
Mill
ion,
20
07
Pri
ces)
CU
RR
EN
T P
RIC
ES
(U
S$
Mill
ion)
Cou
ntry
Alg
eria
Iraq
Kuw
ait
Liby
aQ
atar
Sau
di
Ara
bia
UA
ETo
tal
Cou
ntry
Alg
eria
Iraq
Kuw
ait
Liby
aQ
atar
Sau
di
Ara
bia
UA
ETo
tal
1973
115
861,
606
1,02
142
34,
984
1,42
39,
658
1973
2519
356
226
941,
104
315
2,13
8
1974
202
1,61
22,
555
497
807
8,36
02,
215
16,2
5019
7450
397
629
122
199
2,05
954
64,
001
1975
111
949
3,25
998
41,
101
9,66
13,
329
19,3
9219
7531
265
910
275
308
2,69
993
05,
417
1976
3842
82,
758
340
625
9,71
03,
703
17,6
0219
7611
123
795
9818
02,
799
1,06
75,
074
1977
127
309
4,20
144
342
49,
410
3,51
918
,434
1977
4096
1,31
313
813
32,
940
1,10
05,
760
1978
113
481
2,60
437
626
414
,611
2,41
920
,868
1978
4117
393
613
595
5,24
986
97,
497
1979
653
1,64
72,
429
364
707
9,86
02,
486
18,1
4719
7926
165
897
114
628
33,
940
993
7,25
1
1980
199
1,96
02,
584
852
629
12,8
792,
625
21,7
2819
8088
865
1,14
037
627
75,
681
1,15
89,
585
1981
275
491
2,82
056
158
413
,059
1,90
319
,694
1981
116
207
1,19
023
724
75,
509
803
8,30
8
1982
307
123
2,78
010
433
69,
225
971
13,8
4619
8212
851
1,16
144
140
3,85
340
65,
784
1983
87(2
2)2,
384
344
497,
791
839
11,4
7319
8337
(9)
997
144
213,
259
351
4,79
8
1984
118
(55)
2,48
560
237,
794
216
10,6
4019
8448
(23)
1,01
824
103,
194
894,
360
1985
130
(76)
1,86
613
818
6,36
629
68,
737
1985
54(3
2)77
157
72,
630
122
3,60
9
1986
226
(41)
1,42
313
637
6,99
018
18,
952
1986
114
(21)
715
6819
3,51
291
4,49
8
1987
44(6
1)54
513
06
4,97
733
5,67
419
8726
(35)
316
764
2,88
819
3,29
2
1988
20(3
5)17
320
86
3,29
2(2
7)3,
636
1988
12(2
2)10
813
04
2,04
8(1
7)2,
262
1989
7038
298
152
(4)
2,06
33
2,61
919
8943
2318
393
(3)
1,26
82
1,61
0
1990
––
1,88
3–
–5,
310
1,30
18,
495
1990
––
1,29
5–
–3,
652
895
5,84
2
1991
––
555
––
2,42
779
53,
777
1991
––
390
––
1,70
455
82,
652
1992
––
273
––
1,05
423
11,
558
1992
––
203
––
783
172
1,15
8
Con
tinue
d on
nex
t pag
e
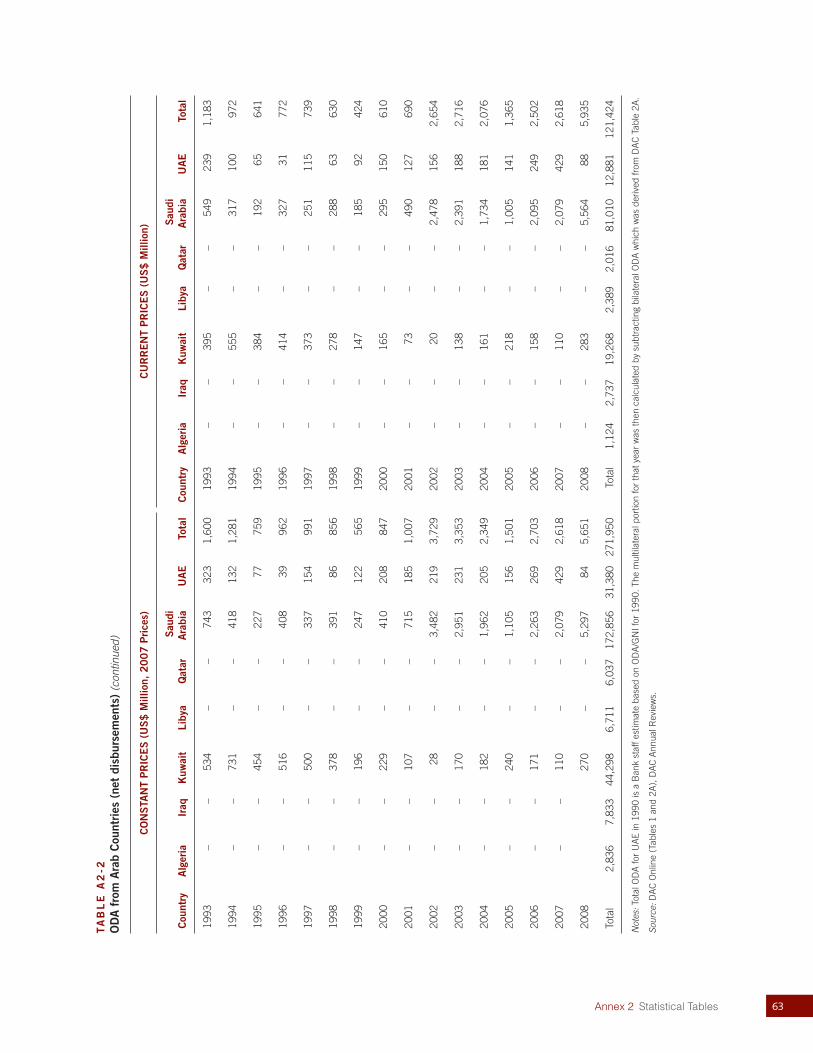
63Annex 2 Statistical Tables
TA
BL
E A
2-2
O
DA
fro
m A
rab
Cou
ntri
es (
net
disb
urse
men
ts)
CO
NS
TAN
T P
RIC
ES
(U
S$
Mill
ion,
20
07
Pri
ces)
CU
RR
EN
T P
RIC
ES
(U
S$
Mill
ion)
Cou
ntry
Alg
eria
Iraq
Kuw
ait
Liby
aQ
atar
Sau
di
Ara
bia
UA
ETo
tal
Cou
ntry
Alg
eria
Iraq
Kuw
ait
Liby
aQ
atar
Sau
di
Ara
bia
UA
ETo
tal
1993
––
534
–
– 7
43
323
1,
600
1993
––
395
–
– 5
49
239
1,
183
1994
––
731
–
– 4
18
132
1,
281
1994
––
555
–
– 3
17
100
9
72
1995
––
454
–
– 2
27
77
759
19
95–
– 3
84
––
192
65
6
41
1996
––
516
–
– 4
08
39
962
19
96–
– 4
14
––
327
31
7
72
1997
––
500
–
– 3
37
154
9
91
1997
––
373
–
– 2
51
115
7
39
1998
––
378
–
– 3
91
86
856
19
98–
– 2
78
––
288
63
6
30
1999
––
196
–
– 2
47
122
5
65
1999
––
147
–
– 1
85
92
424
2000
––
229
–
– 4
10
208
8
47
2000
––
165
–
– 2
95
150
6
10
2001
––
107
–
– 7
15
185
1,
007
2001
––
73
––
490
1
27
690
2002
––
28
––
3,48
2 2
19
3,72
9 20
02–
–20
–
–2,
478
156
2,
654
2003
––
170
–
–2,
951
231
3,
353
2003
––
138
–
–2,
391
188
2,
716
2004
––
182
–
–1,
962
205
2,
349
2004
––
161
–
–1,
734
181
2,
076
2005
––
240
–
–1,
105
156
1,
501
2005
––
218
–
–1,
005
141
1,
365
2006
––
171
–
–2,
263
269
2,
703
2006
––
158
–
–2,
095
249
2,
502
2007
––
110
–
–2,
079
429
2,
618
2007
––
110
–
–2,
079
429
2,
618
2008
270
–
–5,
297
84
5,65
1 20
08–
– 2
83
––
5,56
4 88
5,
935
Tota
l2,
836
7,83
3 4
4,29
8 6,
711
6,03
7 17
2,85
6 3
1,38
0 27
1,95
0 To
tal
1,12
4 2,
737
19,
268
2,38
9 2,
016
81,
010
12,
881
121
,424
Not
es: T
otal
OD
A fo
r U
AE
in 1
990
is a
Ban
k st
aff e
stim
ate
base
d on
OD
A/G
NI f
or 1
990.
The
mul
tilat
eral
por
tion
for
that
yea
r w
as th
en c
alcu
late
d by
sub
trac
ting
bila
tera
l OD
A w
hich
was
der
ived
from
DA
C T
able
2A
.
Sour
ce: D
AC
Onl
ine
(Tab
les
1 an
d 2A
), D
AC
Ann
ual R
evie
ws.
(con
tinue
d)
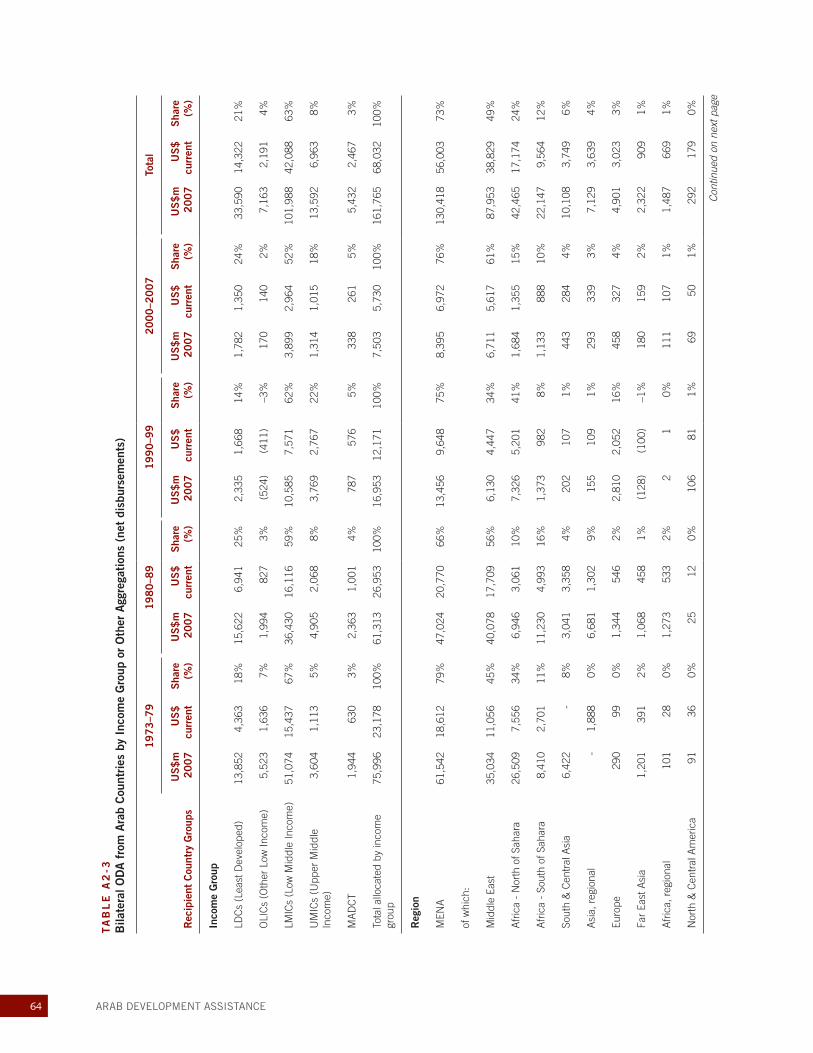
64 ARAB DEVELOPMENT ASSISTANCE
TA
BL
E A
2-3
B
ilate
ral O
DA
fro
m A
rab
Cou
ntri
es b
y In
com
e G
roup
or
Oth
er A
ggre
gati
ons
(net
dis
burs
emen
ts)
Rec
ipie
nt C
ount
ry G
roup
s
19
73
–79
19
80
–89
19
90
–99
20
00
–20
07
Tota
l
US
$m
2
00
7U
S$
cu
rren
tS
hare
(%
)U
S$
m
20
07
US
$
curr
ent
Sha
re
(%)
US
$m
2
00
7U
S$
cu
rren
tS
hare
(%
)U
S$
m
20
07
US
$
curr
ent
Sha
re
(%)
US
$m
2
00
7U
S$
cu
rren
tS
hare
(%
)
Inco
me
Gro
up
LDC
s (L
east
Dev
elop
ed)
13,
852
4,3
63
18%
15,6
22
6,94
1 25
% 2
,335
1,
668
14%
1,78
2 1,
350
24%
33,
590
14,
322
21%
OLI
Cs
(Oth
er L
ow In
com
e) 5
,523
1
,636
7%
1,9
94
827
3%
(524
) (
411)
–3%
170
1
40
2%7,
163
2,19
1 4%
LMIC
s (L
ow M
iddl
e In
com
e) 5
1,07
4 15
,437
67
%36
,430
1
6,11
6 59
%10
,585
7,
571
62%
3,89
9 2,
964
52%
101
,988
4
2,08
8 63
%
UM
ICs
(Upp
er M
iddl
e In
com
e) 3
,604
1
,113
5%
4,9
05
2,06
8 8%
3,7
69
2,76
7 22
%1,
314
1,01
5 18
% 1
3,59
2 6,
963
8%
MA
DC
T 1
,944
63
0 3%
2,3
63
1,00
1 4%
787
576
5%
338
2
61
5%5,
432
2,46
7 3%
Tota
l allo
cate
d by
inco
me
grou
p 7
5,99
6 23
,178
10
0%61
,313
2
6,95
3 10
0%16
,953
1
2,17
1 10
0%7,
503
5,73
0 10
0% 1
61,7
65
68,
032
100%
Reg
ion
MEN
A 6
1,54
2 18
,612
79
%47
,024
2
0,77
0 66
%13
,456
9,
648
75%
8,39
5 6,
972
76%
130
,418
5
6,00
3 73
%
of w
hich
:
Mid
dle
East
35,
034
11,0
56
45%
40,0
78
17,
709
56%
6,1
30
4,44
7 34
%6,
711
5,61
7 61
% 8
7,95
3 3
8,82
9 49
%
Afr
ica
- N
orth
of S
ahar
a 2
6,50
9 7
,556
34
% 6
,946
3,
061
10%
7,3
26
5,20
1 41
%1,
684
1,35
5 15
% 4
2,46
5 1
7,17
4 24
%
Afr
ica
- So
uth
of S
ahar
a 8
,410
2
,701
11
%11
,230
4,
993
16%
1,3
73
982
8%
1,13
3 8
88
10%
22,
147
9,56
4 12
%
Sout
h &
Cen
tral
Asi
a 6
,422
-
8% 3
,041
3,
358
4%20
2 1
07
1% 4
43
284
4%
10,
108
3,74
9 6%
Asi
a, r
egio
nal
-
1,8
88
0% 6
,681
1,
302
9%15
5 1
09
1% 2
93
339
3%
7,12
9 3,
639
4%
Euro
pe 2
90
99
0% 1
,344
5
46
2% 2
,810
2,
052
16%
458
3
27
4%4,
901
3,02
3 3%
Far
East
Asi
a 1
,201
39
1 2%
1,0
68
458
1%
(128
) (
100)
–1%
180
1
59
2%2,
322
909
1%
Afr
ica,
reg
iona
l 1
01
28
0% 1
,273
5
33
2% 2
1
0% 1
11
107
1%
1,48
7 6
69
1%
Nor
th &
Cen
tral
Am
eric
a 9
1 3
6 0%
25
12
0%10
6 81
1%
69
50
1% 2
92
179
0%
Con
tinue
d on
nex
t pag
e

65Annex 2 Statistical Tables
TA
BL
E A
2-3
B
ilate
ral O
DA
fro
m A
rab
Cou
ntri
es b
y In
com
e G
roup
or
Oth
er A
ggre
gati
ons
(net
dis
burs
emen
ts)
Rec
ipie
nt C
ount
ry G
roup
s
19
73
–79
19
80
–89
19
90
–99
20
00
–20
07
Tota
l
US
$m
2
00
7U
S$
cu
rren
tS
hare
(%
)U
S$
m
20
07
US
$
curr
ent
Sha
re
(%)
US
$m
2
00
7U
S$
cu
rren
tS
hare
(%
)U
S$
m
20
07
US
$
curr
ent
Sha
re
(%)
US
$m
2
00
7U
S$
cu
rren
tS
hare
(%
)
Sout
h A
mer
ica
60
22
0% 3
2 16
0%
24
18
0%(2
0)(1
7)0%
96
39
0%
Oce
ania
5 2
0%
16
8 0%
3
2 0%
(0)
(0)
0%25
12
0%
Tota
l allo
cate
d by
reg
ion
78,
124
23,7
79
100%
71,7
35
31,
995
100%
18,0
03
12,
902
100%
11,
062
9,10
9 10
0% 1
78,9
24
77,
785
100%
Oth
er R
egio
nal A
ggre
gati
ons
Org
aniz
atio
n of
Isla
mic
C
onfe
renc
e (O
IC)
72,
849
22,1
85
96%
58,2
50
25,
628
95%
16,4
76
11,
829
97%
7,08
0 5,
403
94%
154
,654
6
5,04
5 96
%
Leag
ue o
f Ara
b St
ates
65,
906
20,1
12
78%
51,7
57
22,
820
76%
12,8
89
9,25
2 85
%5,
841
4,45
8 87
% 1
36,3
93
56,
643
84%
IDA
Cou
ntrie
s 1
9,30
9 5
,975
25
%17
,728
7,
821
29%
2,0
07
1,41
0 12
%2,
104
1,60
1 28
% 4
1,14
7 1
6,80
8 25
%
HIP
C C
ount
ries
8,3
02
2,6
62
11%
9,9
39
4,43
6 16
% 1
,721
1,
235
10%
1,14
9 9
12
15%
21,
112
9,24
5 13
%
Sour
ce: D
AC
Onl
ine
(Tab
le 2
A).
(con
tinue
d)
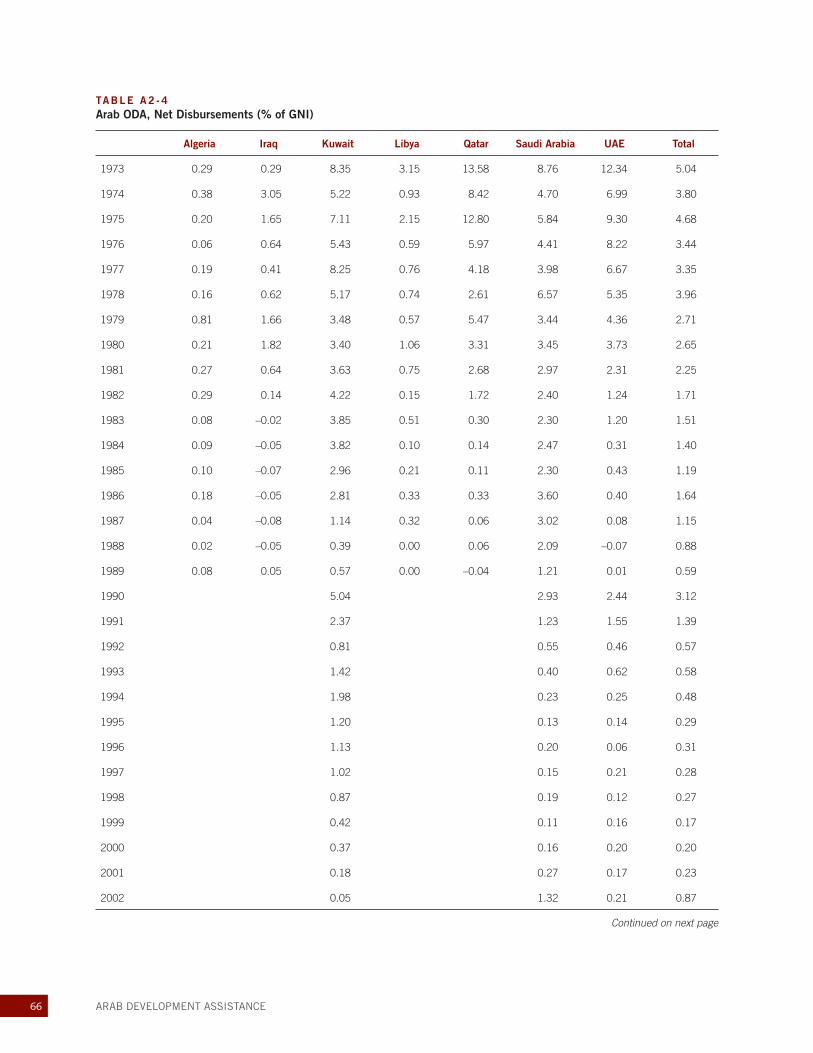
66 ARAB DEVELOPMENT ASSISTANCE
TABLE A2 -4 Arab ODA, Net Disbursements (% of GNI)
Algeria Iraq Kuwait Libya Qatar Saudi Arabia UAE Total
1973 0.29 0.29 8.35 3.15 13.58 8.76 12.34 5.04
1974 0.38 3.05 5.22 0.93 8.42 4.70 6.99 3.80
1975 0.20 1.65 7.11 2.15 12.80 5.84 9.30 4.68
1976 0.06 0.64 5.43 0.59 5.97 4.41 8.22 3.44
1977 0.19 0.41 8.25 0.76 4.18 3.98 6.67 3.35
1978 0.16 0.62 5.17 0.74 2.61 6.57 5.35 3.96
1979 0.81 1.66 3.48 0.57 5.47 3.44 4.36 2.71
1980 0.21 1.82 3.40 1.06 3.31 3.45 3.73 2.65
1981 0.27 0.64 3.63 0.75 2.68 2.97 2.31 2.25
1982 0.29 0.14 4.22 0.15 1.72 2.40 1.24 1.71
1983 0.08 –0.02 3.85 0.51 0.30 2.30 1.20 1.51
1984 0.09 –0.05 3.82 0.10 0.14 2.47 0.31 1.40
1985 0.10 –0.07 2.96 0.21 0.11 2.30 0.43 1.19
1986 0.18 –0.05 2.81 0.33 0.33 3.60 0.40 1.64
1987 0.04 –0.08 1.14 0.32 0.06 3.02 0.08 1.15
1988 0.02 –0.05 0.39 0.00 0.06 2.09 –0.07 0.88
1989 0.08 0.05 0.57 0.00 –0.04 1.21 0.01 0.59
1990 5.04 2.93 2.44 3.12
1991 2.37 1.23 1.55 1.39
1992 0.81 0.55 0.46 0.57
1993 1.42 0.40 0.62 0.58
1994 1.98 0.23 0.25 0.48
1995 1.20 0.13 0.14 0.29
1996 1.13 0.20 0.06 0.31
1997 1.02 0.15 0.21 0.28
1998 0.87 0.19 0.12 0.27
1999 0.42 0.11 0.16 0.17
2000 0.37 0.16 0.20 0.20
2001 0.18 0.27 0.17 0.23
2002 0.05 1.32 0.21 0.87
Continued on next page
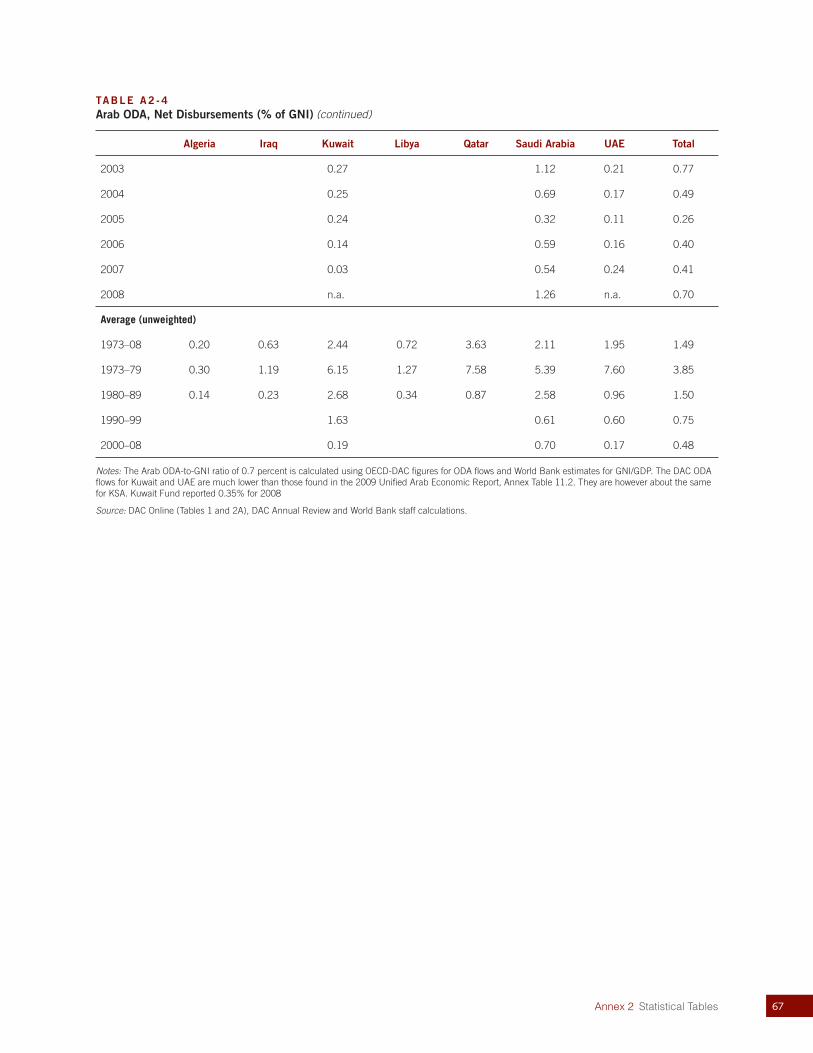
67Annex 2 Statistical Tables
TABLE A2 -4 Arab ODA, Net Disbursements (% of GNI)
Algeria Iraq Kuwait Libya Qatar Saudi Arabia UAE Total
2003 0.27 1.12 0.21 0.77
2004 0.25 0.69 0.17 0.49
2005 0.24 0.32 0.11 0.26
2006 0.14 0.59 0.16 0.40
2007 0.03 0.54 0.24 0.41
2008 n.a. 1.26 n.a. 0.70
Average (unweighted)
1973–08 0.20 0.63 2.44 0.72 3.63 2.11 1.95 1.49
1973–79 0.30 1.19 6.15 1.27 7.58 5.39 7.60 3.85
1980–89 0.14 0.23 2.68 0.34 0.87 2.58 0.96 1.50
1990–99 1.63 0.61 0.60 0.75
2000–08 0.19 0.70 0.17 0.48
Notes: The Arab ODA-to-GNI ratio of 0.7 percent is calculated using OECD-DAC figures for ODA flows and World Bank estimates for GNI/GDP. The DAC ODA flows for Kuwait and UAE are much lower than those found in the 2009 Unified Arab Economic Report, Annex Table 11.2. They are however about the same for KSA. Kuwait Fund reported 0.35% for 2008
Source: DAC Online (Tables 1 and 2A), DAC Annual Review and World Bank staff calculations.
(continued)
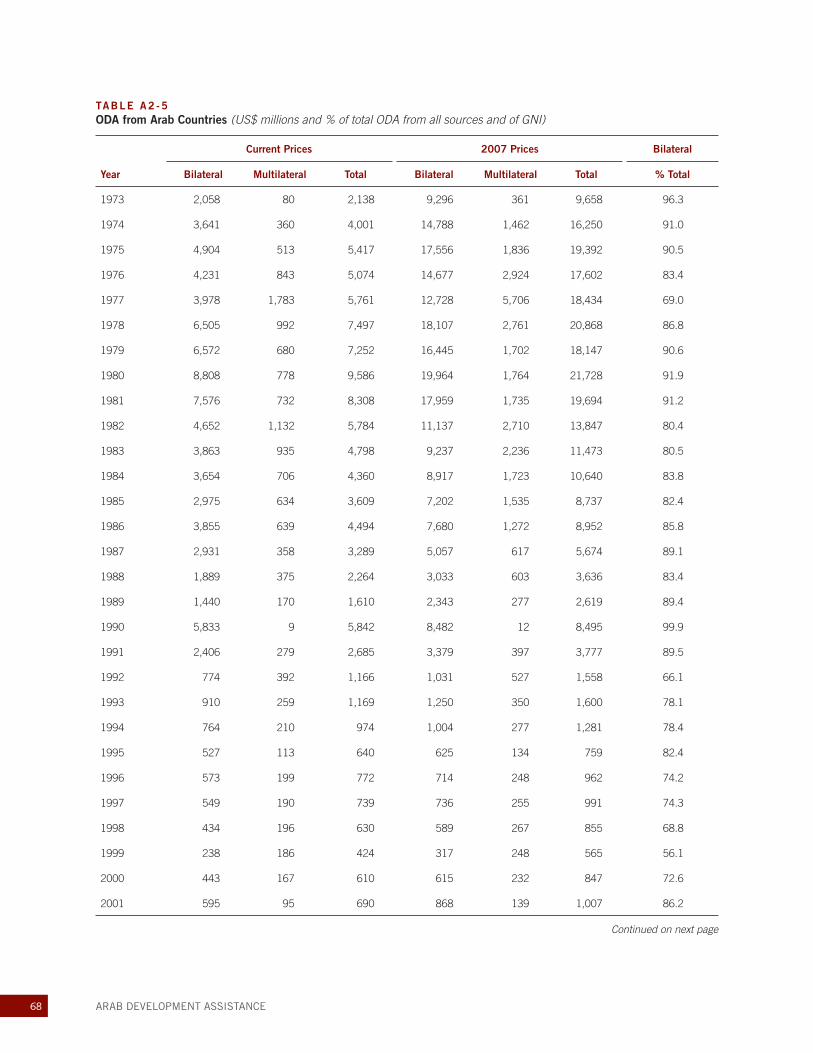
68 ARAB DEVELOPMENT ASSISTANCE
TABLE A2 -5 ODA from Arab Countries (US$ millions and % of total ODA from all sources and of GNI)
Year
Current Prices 2007 Prices Bilateral
Bilateral Multilateral Total Bilateral Multilateral Total % Total
1973 2,058 80 2,138 9,296 361 9,658 96.3
1974 3,641 360 4,001 14,788 1,462 16,250 91.0
1975 4,904 513 5,417 17,556 1,836 19,392 90.5
1976 4,231 843 5,074 14,677 2,924 17,602 83.4
1977 3,978 1,783 5,761 12,728 5,706 18,434 69.0
1978 6,505 992 7,497 18,107 2,761 20,868 86.8
1979 6,572 680 7,252 16,445 1,702 18,147 90.6
1980 8,808 778 9,586 19,964 1,764 21,728 91.9
1981 7,576 732 8,308 17,959 1,735 19,694 91.2
1982 4,652 1,132 5,784 11,137 2,710 13,847 80.4
1983 3,863 935 4,798 9,237 2,236 11,473 80.5
1984 3,654 706 4,360 8,917 1,723 10,640 83.8
1985 2,975 634 3,609 7,202 1,535 8,737 82.4
1986 3,855 639 4,494 7,680 1,272 8,952 85.8
1987 2,931 358 3,289 5,057 617 5,674 89.1
1988 1,889 375 2,264 3,033 603 3,636 83.4
1989 1,440 170 1,610 2,343 277 2,619 89.4
1990 5,833 9 5,842 8,482 12 8,495 99.9
1991 2,406 279 2,685 3,379 397 3,777 89.5
1992 774 392 1,166 1,031 527 1,558 66.1
1993 910 259 1,169 1,250 350 1,600 78.1
1994 764 210 974 1,004 277 1,281 78.4
1995 527 113 640 625 134 759 82.4
1996 573 199 772 714 248 962 74.2
1997 549 190 739 736 255 991 74.3
1998 434 196 630 589 267 855 68.8
1999 238 186 424 317 248 565 56.1
2000 443 167 610 615 232 847 72.6
2001 595 95 690 868 139 1,007 86.2
Continued on next page
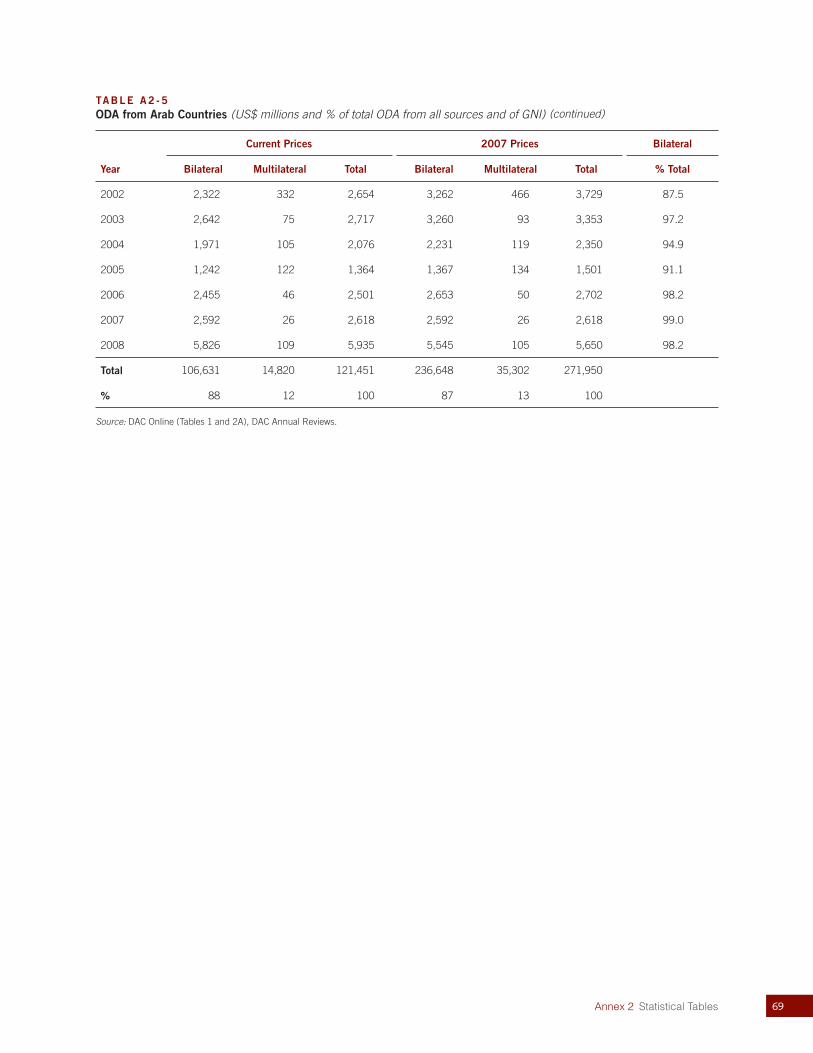
69Annex 2 Statistical Tables
TABLE A2 -5 ODA from Arab Countries (US$ millions and % of total ODA from all sources and of GNI)
Year
Current Prices 2007 Prices Bilateral
Bilateral Multilateral Total Bilateral Multilateral Total % Total
2002 2,322 332 2,654 3,262 466 3,729 87.5
2003 2,642 75 2,717 3,260 93 3,353 97.2
2004 1,971 105 2,076 2,231 119 2,350 94.9
2005 1,242 122 1,364 1,367 134 1,501 91.1
2006 2,455 46 2,501 2,653 50 2,702 98.2
2007 2,592 26 2,618 2,592 26 2,618 99.0
2008 5,826 109 5,935 5,545 105 5,650 98.2
Total 106,631 14,820 121,451 236,648 35,302 271,950
% 88 12 100 87 13 100
Source: DAC Online (Tables 1 and 2A), DAC Annual Reviews.
(continued)
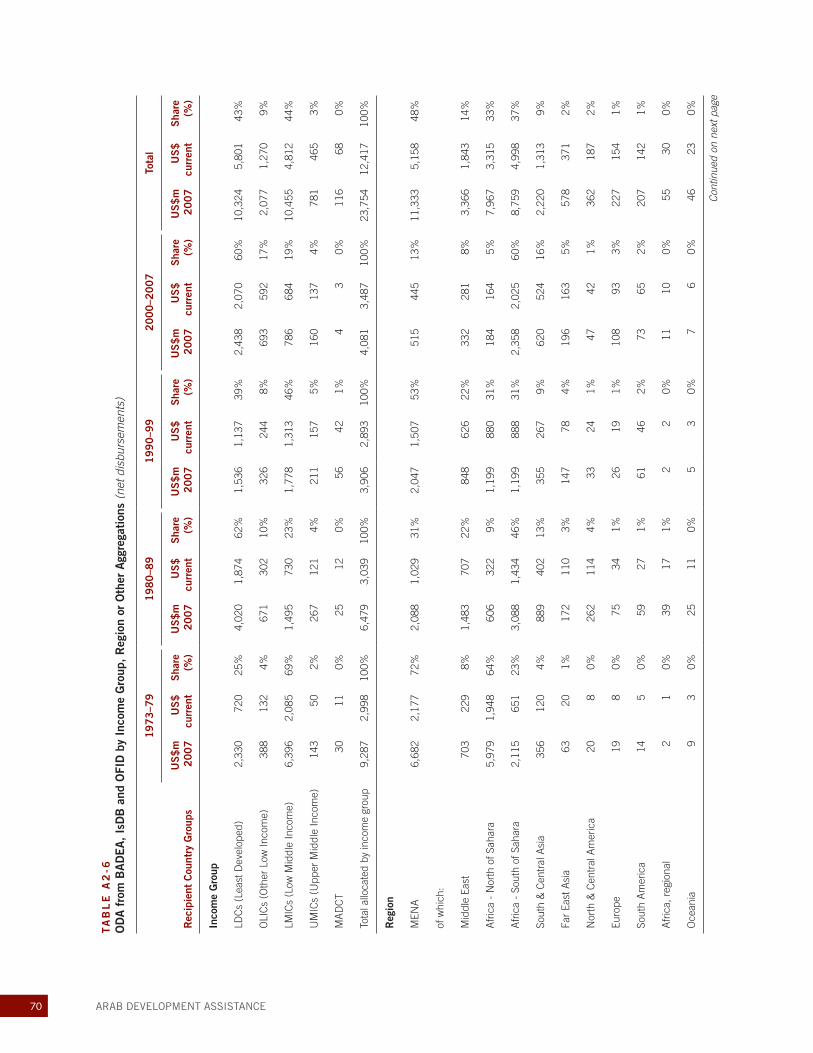
70 ARAB DEVELOPMENT ASSISTANCE
TA
BL
E A
2-6
O
DA
fro
m B
AD
EA
, Is
DB
and
OFI
D b
y In
com
e G
roup
, R
egio
n or
Oth
er A
ggre
gati
ons
(net
dis
burs
emen
ts)
Rec
ipie
nt C
ount
ry G
roup
s
19
73
–79
19
80
–89
19
90
–99
20
00
–20
07
Tota
l
US
$m
2
00
7U
S$
cu
rren
tS
hare
(%
)U
S$
m
20
07
US
$
curr
ent
Sha
re
(%)
US
$m
2
00
7U
S$
cu
rren
tS
hare
(%
)U
S$
m
20
07
US
$
curr
ent
Sha
re
(%)
US
$m
2
00
7U
S$
cu
rren
tS
hare
(%
)
Inco
me
Gro
up
LDC
s (L
east
Dev
elop
ed)
2,33
072
025
%4,
020
1,87
462
%1,
536
1,13
739
%2,
438
2,07
060
%10
,324
5,80
143
%
OLI
Cs
(Oth
er L
ow In
com
e)38
813
24%
671
302
10%
326
244
8%69
359
217
%2,
077
1,27
09%
LMIC
s (L
ow M
iddl
e In
com
e)6,
396
2,08
569
%1,
495
730
23%
1,77
81,
313
46%
786
684
19%
10,4
554,
812
44%
UM
ICs
(Upp
er M
iddl
e In
com
e)14
350
2%26
712
14%
211
157
5%16
013
74%
781
465
3%
MA
DC
T30
110%
2512
0%56
421%
43
0%11
668
0%
Tota
l allo
cate
d by
inco
me
grou
p9,
287
2,99
8 10
0%6,
479
3,03
9 10
0%3,
906
2,89
3 10
0%4,
081
3,48
7 10
0% 2
3,75
4 1
2,41
7 10
0%
Reg
ion
MEN
A6,
682
2,17
772
%2,
088
1,02
931
%2,
047
1,50
753
%51
544
513
%11
,333
5,15
848
%
of w
hich
:
Mid
dle
East
703
229
8%1,
483
707
22%
848
626
22%
332
281
8%3,
366
1,84
314
%
Afr
ica
- N
orth
of S
ahar
a5,
979
1,94
864
%60
632
29%
1,19
988
031
%18
416
45%
7,96
73,
315
33%
Afr
ica
- So
uth
of S
ahar
a2,
115
651
23%
3,08
81,
434
46%
1,19
988
831
%2,
358
2,02
560
%8,
759
4,99
837
%
Sout
h &
Cen
tral
Asi
a35
612
04%
889
402
13%
355
267
9%62
052
416
%2,
220
1,31
39%
Far
East
Asi
a63
201%
172
110
3%14
778
4%19
616
35%
578
371
2%
Nor
th &
Cen
tral
Am
eric
a20
80%
262
114
4%33
241%
4742
1%36
218
72%
Euro
pe19
80%
7534
1%26
191%
108
933%
227
154
1%
Sout
h A
mer
ica
145
0%59
271%
6146
2%73
652%
207
142
1%
Afr
ica,
reg
iona
l2
10%
3917
1%2
20%
1110
0%55
300%
Oce
ania
93
0%25
110%
53
0%7
60%
4623
0%
Con
tinue
d on
nex
t pag
e
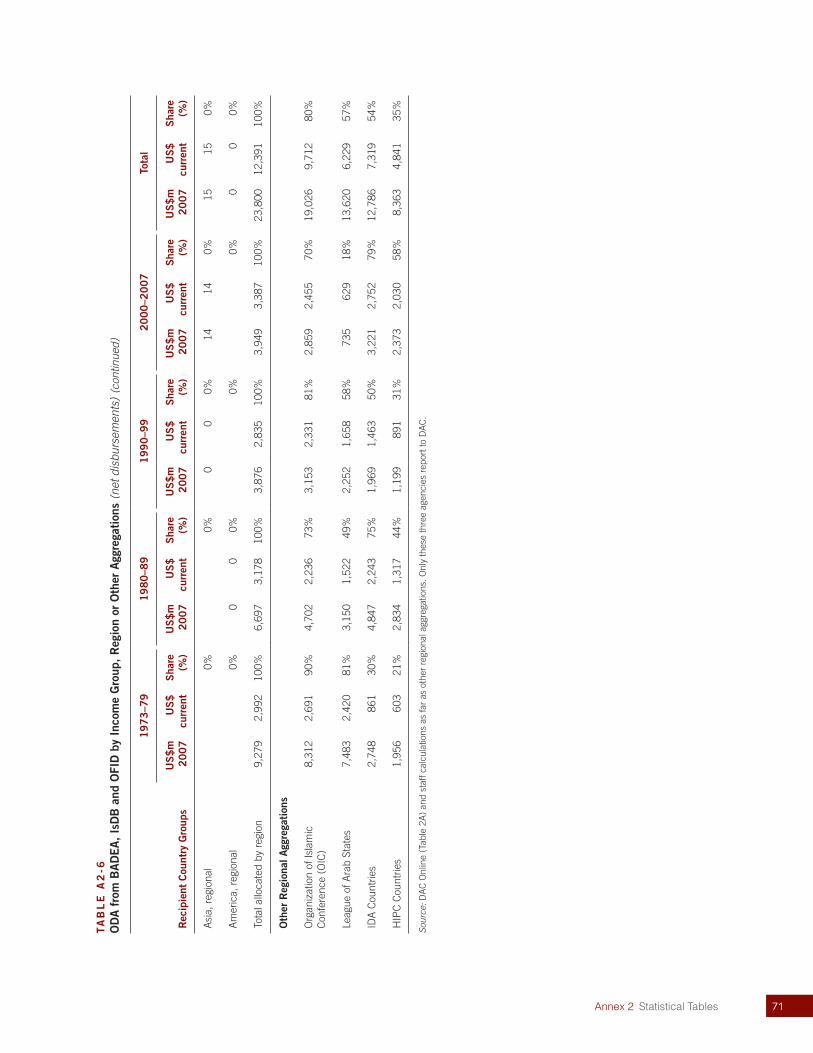
71Annex 2 Statistical Tables
TA
BL
E A
2-6
O
DA
fro
m B
AD
EA
, Is
DB
and
OFI
D b
y In
com
e G
roup
, R
egio
n or
Oth
er A
ggre
gati
ons
(net
dis
burs
emen
ts)
Rec
ipie
nt C
ount
ry G
roup
s
19
73
–79
19
80
–89
19
90
–99
20
00
–20
07
Tota
l
US
$m
2
00
7U
S$
cu
rren
tS
hare
(%
)U
S$
m
20
07
US
$
curr
ent
Sha
re
(%)
US
$m
2
00
7U
S$
cu
rren
tS
hare
(%
)U
S$
m
20
07
US
$
curr
ent
Sha
re
(%)
US
$m
2
00
7U
S$
cu
rren
tS
hare
(%
)
Asi
a, r
egio
nal
0%0%
00
0%14
140%
1515
0%
Am
eric
a, r
egio
nal
0%0
00%
0%0%
00
0%
Tota
l allo
cate
d by
reg
ion
9,27
92,
992
100%
6,69
73,
178
100%
3,87
62,
835
100%
3,94
93,
387
100%
23,8
0012
,391
100%
Oth
er R
egio
nal A
ggre
gati
ons
Org
aniz
atio
n of
Isla
mic
C
onfe
renc
e (O
IC)
8,31
2 2,
691
90%
4,70
2 2,
236
73%
3,15
3 2,
331
81%
2,85
9 2,
455
70%
19,
026
9,71
2 80
%
Leag
ue o
f Ara
b St
ates
7,48
3 2,
420
81%
3,15
0 1,
522
49%
2,25
2 1,
658
58%
735
6
29
18%
13,
620
6,22
9 57
%
IDA
Cou
ntrie
s2,
748
861
30
%4,
847
2,24
3 75
%1,
969
1,46
3 50
%3,
221
2,75
2 79
% 1
2,78
6 7,
319
54%
HIP
C C
ount
ries
1,95
6 6
03
21%
2,83
4 1,
317
44%
1,19
9 8
91
31%
2,37
3 2,
030
58%
8,36
3 4,
841
35%
Sour
ce: D
AC
Onl
ine
(Tab
le 2
A)
and
staf
f cal
cula
tions
as
far
as o
ther
reg
iona
l agg
rega
tions
. Onl
y th
ese
thre
e ag
enci
es r
epor
t to
DA
C.
(con
tinue
d)
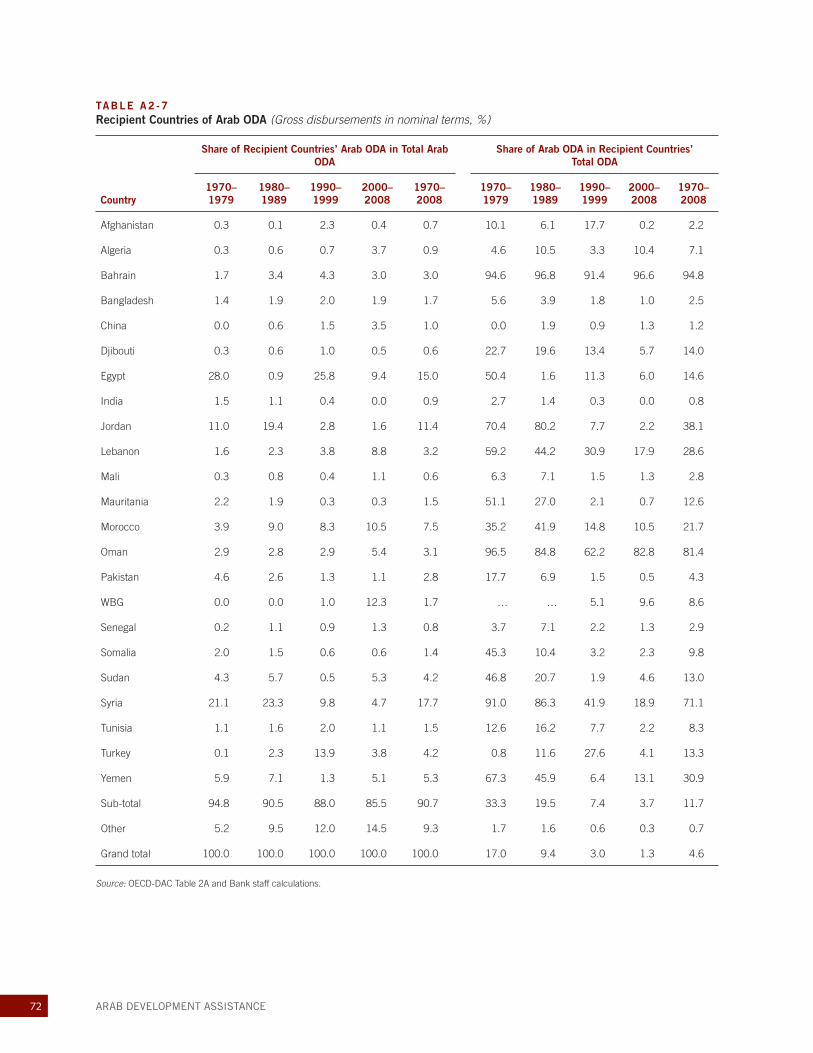
72 ARAB DEVELOPMENT ASSISTANCE
TABLE A2 -7 Recipient Countries of Arab ODA (Gross disbursements in nominal terms, %)
Country
Share of Recipient Countries’ Arab ODA in Total Arab ODA
Share of Arab ODA in Recipient Countries’ Total ODA
1970–1979
1980–1989
1990–1999
2000–2008
1970–2008
1970–1979
1980–1989
1990–1999
2000–2008
1970–2008
Afghanistan 0.3 0.1 2.3 0.4 0.7 10.1 6.1 17.7 0.2 2.2
Algeria 0.3 0.6 0.7 3.7 0.9 4.6 10.5 3.3 10.4 7.1
Bahrain 1.7 3.4 4.3 3.0 3.0 94.6 96.8 91.4 96.6 94.8
Bangladesh 1.4 1.9 2.0 1.9 1.7 5.6 3.9 1.8 1.0 2.5
China 0.0 0.6 1.5 3.5 1.0 0.0 1.9 0.9 1.3 1.2
Djibouti 0.3 0.6 1.0 0.5 0.6 22.7 19.6 13.4 5.7 14.0
Egypt 28.0 0.9 25.8 9.4 15.0 50.4 1.6 11.3 6.0 14.6
India 1.5 1.1 0.4 0.0 0.9 2.7 1.4 0.3 0.0 0.8
Jordan 11.0 19.4 2.8 1.6 11.4 70.4 80.2 7.7 2.2 38.1
Lebanon 1.6 2.3 3.8 8.8 3.2 59.2 44.2 30.9 17.9 28.6
Mali 0.3 0.8 0.4 1.1 0.6 6.3 7.1 1.5 1.3 2.8
Mauritania 2.2 1.9 0.3 0.3 1.5 51.1 27.0 2.1 0.7 12.6
Morocco 3.9 9.0 8.3 10.5 7.5 35.2 41.9 14.8 10.5 21.7
Oman 2.9 2.8 2.9 5.4 3.1 96.5 84.8 62.2 82.8 81.4
Pakistan 4.6 2.6 1.3 1.1 2.8 17.7 6.9 1.5 0.5 4.3
WBG 0.0 0.0 1.0 12.3 1.7 … … 5.1 9.6 8.6
Senegal 0.2 1.1 0.9 1.3 0.8 3.7 7.1 2.2 1.3 2.9
Somalia 2.0 1.5 0.6 0.6 1.4 45.3 10.4 3.2 2.3 9.8
Sudan 4.3 5.7 0.5 5.3 4.2 46.8 20.7 1.9 4.6 13.0
Syria 21.1 23.3 9.8 4.7 17.7 91.0 86.3 41.9 18.9 71.1
Tunisia 1.1 1.6 2.0 1.1 1.5 12.6 16.2 7.7 2.2 8.3
Turkey 0.1 2.3 13.9 3.8 4.2 0.8 11.6 27.6 4.1 13.3
Yemen 5.9 7.1 1.3 5.1 5.3 67.3 45.9 6.4 13.1 30.9
Sub-total 94.8 90.5 88.0 85.5 90.7 33.3 19.5 7.4 3.7 11.7
Other 5.2 9.5 12.0 14.5 9.3 1.7 1.6 0.6 0.3 0.7
Grand total 100.0 100.0 100.0 100.0 100.0 17.0 9.4 3.0 1.3 4.6
Source: OECD-DAC Table 2A and Bank staff calculations.
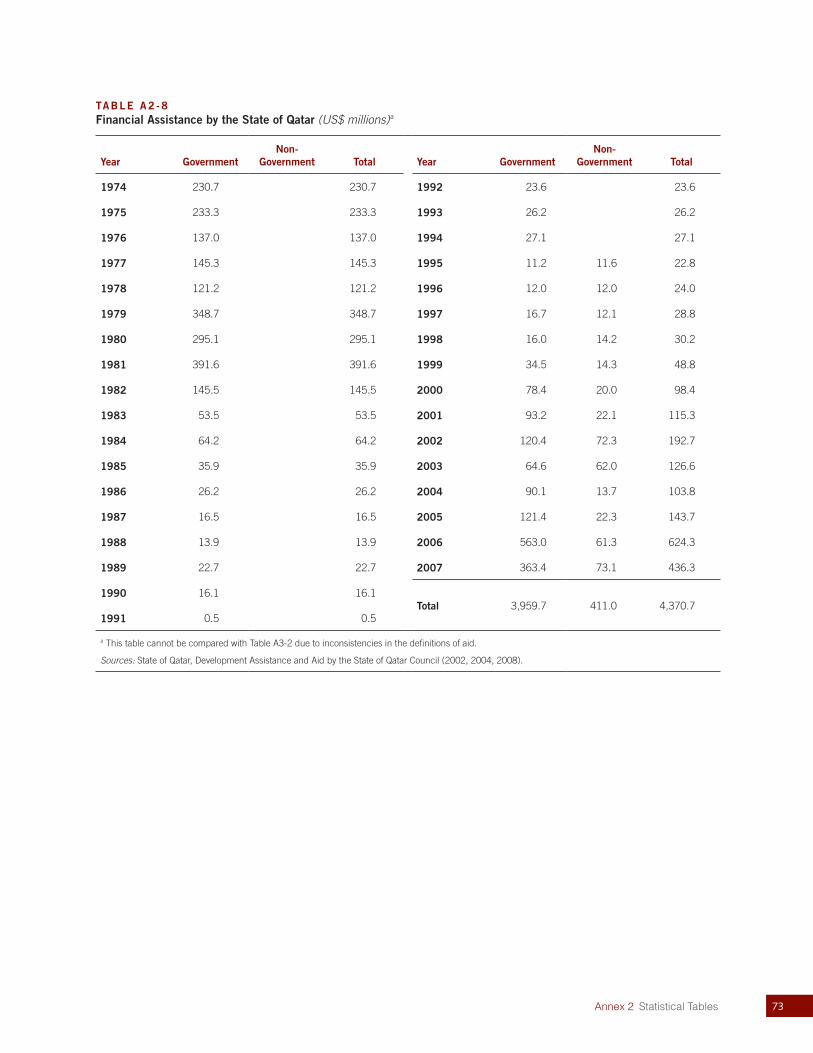
73Annex 2 Statistical Tables
TABLE A2 -8 Financial Assistance by the State of Qatar (US$ millions) a
Year Government Non-
Government Total Year Government Non-
Government Total
1974 230.7 230.7 1992 23.6 23.6
1975 233.3 233.3 1993 26.2 26.2
1976 137.0 137.0 1994 27.1 27.1
1977 145.3 145.3 1995 11.2 11.6 22.8
1978 121.2 121.2 1996 12.0 12.0 24.0
1979 348.7 348.7 1997 16.7 12.1 28.8
1980 295.1 295.1 1998 16.0 14.2 30.2
1981 391.6 391.6 1999 34.5 14.3 48.8
1982 145.5 145.5 2000 78.4 20.0 98.4
1983 53.5 53.5 2001 93.2 22.1 115.3
1984 64.2 64.2 2002 120.4 72.3 192.7
1985 35.9 35.9 2003 64.6 62.0 126.6
1986 26.2 26.2 2004 90.1 13.7 103.8
1987 16.5 16.5 2005 121.4 22.3 143.7
1988 13.9 13.9 2006 563.0 61.3 624.3
1989 22.7 22.7 2007 363.4 73.1 436.3
1990 16.1 16.1Total 3,959.7 411.0 4,370.7
1991 0.5 0.5
a This table cannot be compared with Table A3-2 due to inconsistencies in the definitions of aid.
Sources: State of Qatar, Development Assistance and Aid by the State of Qatar Council (2002, 2004, 2008).
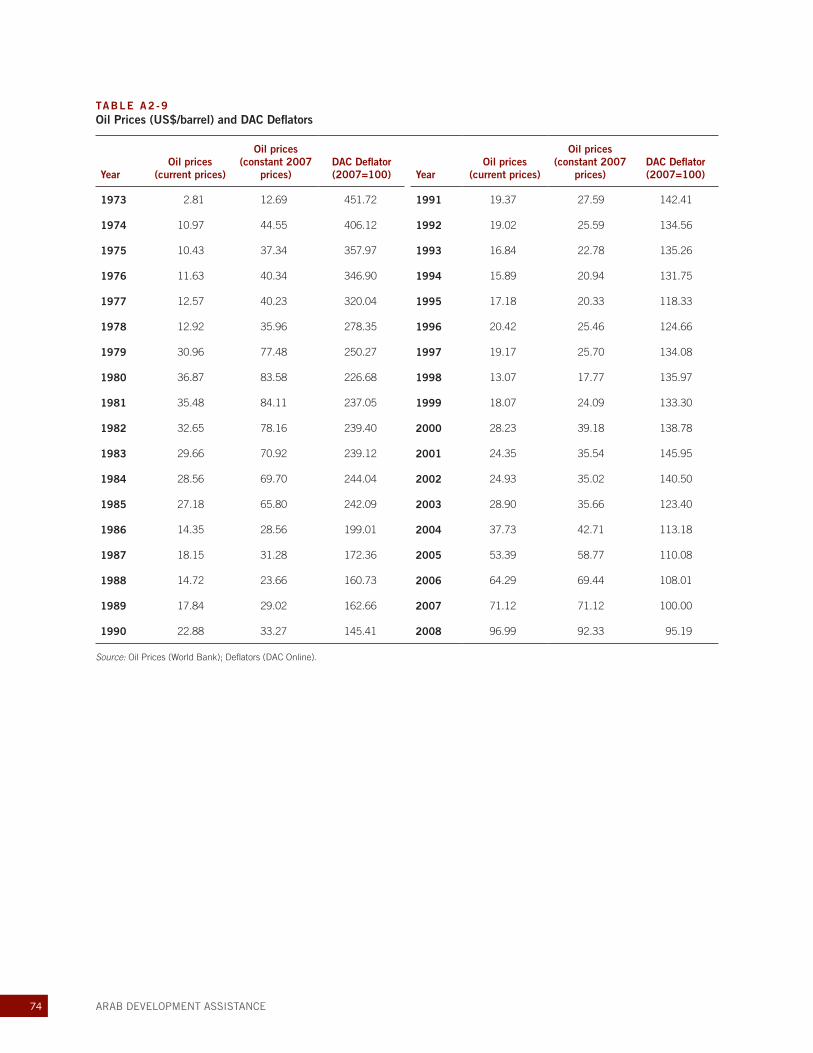
74 ARAB DEVELOPMENT ASSISTANCE
TABLE A2 -9 Oil Prices (US$/barrel) and DAC Deflators
YearOil prices
(current prices)
Oil prices(constant 2007
prices)DAC Deflator(2007=100) Year
Oil prices(current prices)
Oil prices(constant 2007
prices)DAC Deflator(2007=100)
1973 2.81 12.69 451.72 1991 19.37 27.59 142.41
1974 10.97 44.55 406.12 1992 19.02 25.59 134.56
1975 10.43 37.34 357.97 1993 16.84 22.78 135.26
1976 11.63 40.34 346.90 1994 15.89 20.94 131.75
1977 12.57 40.23 320.04 1995 17.18 20.33 118.33
1978 12.92 35.96 278.35 1996 20.42 25.46 124.66
1979 30.96 77.48 250.27 1997 19.17 25.70 134.08
1980 36.87 83.58 226.68 1998 13.07 17.77 135.97
1981 35.48 84.11 237.05 1999 18.07 24.09 133.30
1982 32.65 78.16 239.40 2000 28.23 39.18 138.78
1983 29.66 70.92 239.12 2001 24.35 35.54 145.95
1984 28.56 69.70 244.04 2002 24.93 35.02 140.50
1985 27.18 65.80 242.09 2003 28.90 35.66 123.40
1986 14.35 28.56 199.01 2004 37.73 42.71 113.18
1987 18.15 31.28 172.36 2005 53.39 58.77 110.08
1988 14.72 23.66 160.73 2006 64.29 69.44 108.01
1989 17.84 29.02 162.66 2007 71.12 71.12 100.00
1990 22.88 33.27 145.41 2008 96.99 92.33 95.19
Source: Oil Prices (World Bank); Deflators (DAC Online).
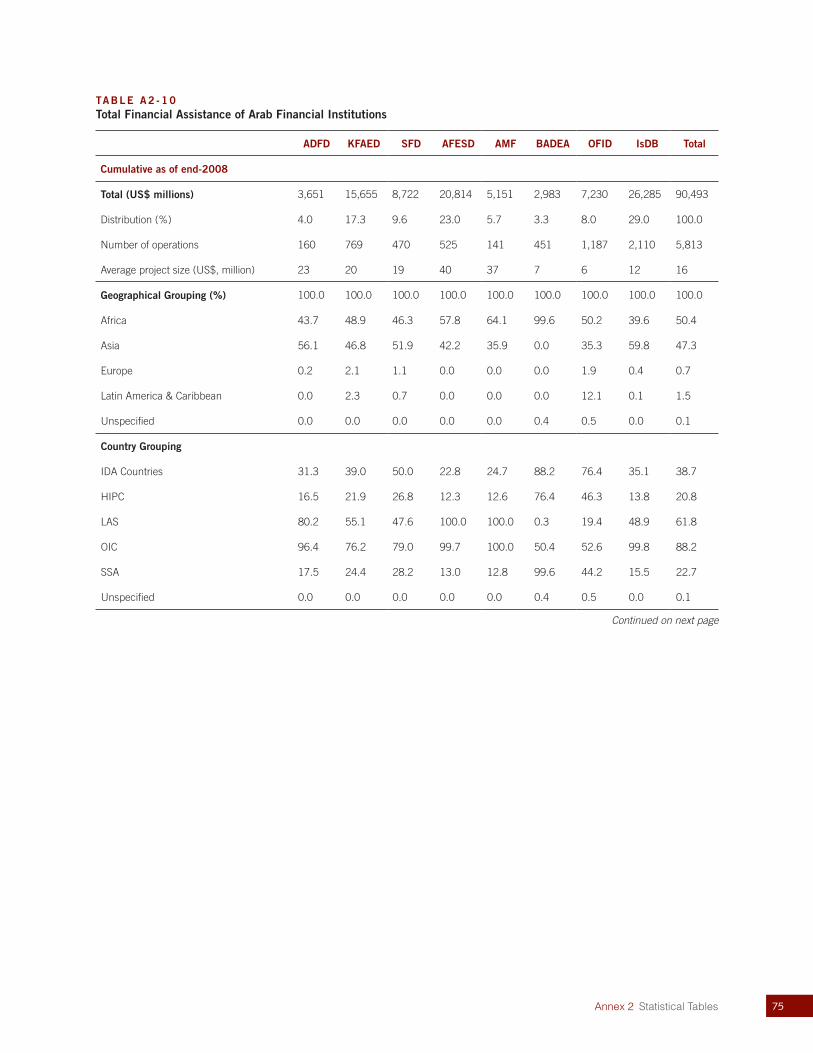
75Annex 2 Statistical Tables
TABLE A2 -10 Total Financial Assistance of Arab Financial Institutions
ADFD KFAED SFD AFESD AMF BADEA OFID IsDB Total
Cumulative as of end-2008
Total (US$ millions) 3,651 15,655 8,722 20,814 5,151 2,983 7,230 26,285 90,493
Distribution (%) 4.0 17.3 9.6 23.0 5.7 3.3 8.0 29.0 100.0
Number of operations 160 769 470 525 141 451 1,187 2,110 5,813
Average project size (US$, million) 23 20 19 40 37 7 6 12 16
Geographical Grouping (%) 100.0 100.0 100.0 100.0 100.0 100.0 100.0 100.0 100.0
Africa 43.7 48.9 46.3 57.8 64.1 99.6 50.2 39.6 50.4
Asia 56.1 46.8 51.9 42.2 35.9 0.0 35.3 59.8 47.3
Europe 0.2 2.1 1.1 0.0 0.0 0.0 1.9 0.4 0.7
Latin America & Caribbean 0.0 2.3 0.7 0.0 0.0 0.0 12.1 0.1 1.5
Unspecified 0.0 0.0 0.0 0.0 0.0 0.4 0.5 0.0 0.1
Country Grouping
IDA Countries 31.3 39.0 50.0 22.8 24.7 88.2 76.4 35.1 38.7
HIPC 16.5 21.9 26.8 12.3 12.6 76.4 46.3 13.8 20.8
LAS 80.2 55.1 47.6 100.0 100.0 0.3 19.4 48.9 61.8
OIC 96.4 76.2 79.0 99.7 100.0 50.4 52.6 99.8 88.2
SSA 17.5 24.4 28.2 13.0 12.8 99.6 44.2 15.5 22.7
Unspecified 0.0 0.0 0.0 0.0 0.0 0.4 0.5 0.0 0.1
Continued on next page
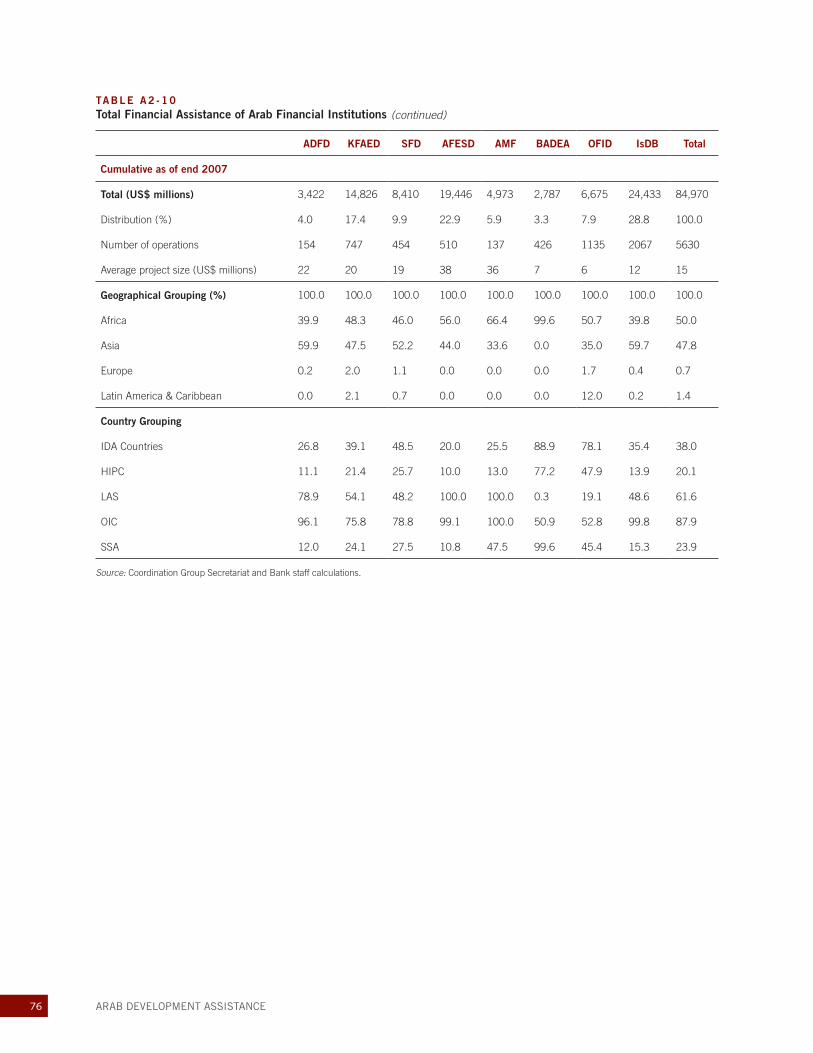
76 ARAB DEVELOPMENT ASSISTANCE
TABLE A2 -10 Total Financial Assistance of Arab Financial Institutions
ADFD KFAED SFD AFESD AMF BADEA OFID IsDB Total
Cumulative as of end 2007
Total (US$ millions) 3,422 14,826 8,410 19,446 4,973 2,787 6,675 24,433 84,970
Distribution (%) 4.0 17.4 9.9 22.9 5.9 3.3 7.9 28.8 100.0
Number of operations 154 747 454 510 137 426 1135 2067 5630
Average project size (US$ millions) 22 20 19 38 36 7 6 12 15
Geographical Grouping (%) 100.0 100.0 100.0 100.0 100.0 100.0 100.0 100.0 100.0
Africa 39.9 48.3 46.0 56.0 66.4 99.6 50.7 39.8 50.0
Asia 59.9 47.5 52.2 44.0 33.6 0.0 35.0 59.7 47.8
Europe 0.2 2.0 1.1 0.0 0.0 0.0 1.7 0.4 0.7
Latin America & Caribbean 0.0 2.1 0.7 0.0 0.0 0.0 12.0 0.2 1.4
Country Grouping
IDA Countries 26.8 39.1 48.5 20.0 25.5 88.9 78.1 35.4 38.0
HIPC 11.1 21.4 25.7 10.0 13.0 77.2 47.9 13.9 20.1
LAS 78.9 54.1 48.2 100.0 100.0 0.3 19.1 48.6 61.6
OIC 96.1 75.8 78.8 99.1 100.0 50.9 52.8 99.8 87.9
SSA 12.0 24.1 27.5 10.8 47.5 99.6 45.4 15.3 23.9
Source: Coordination Group Secretariat and Bank staff calculations.
(continued)
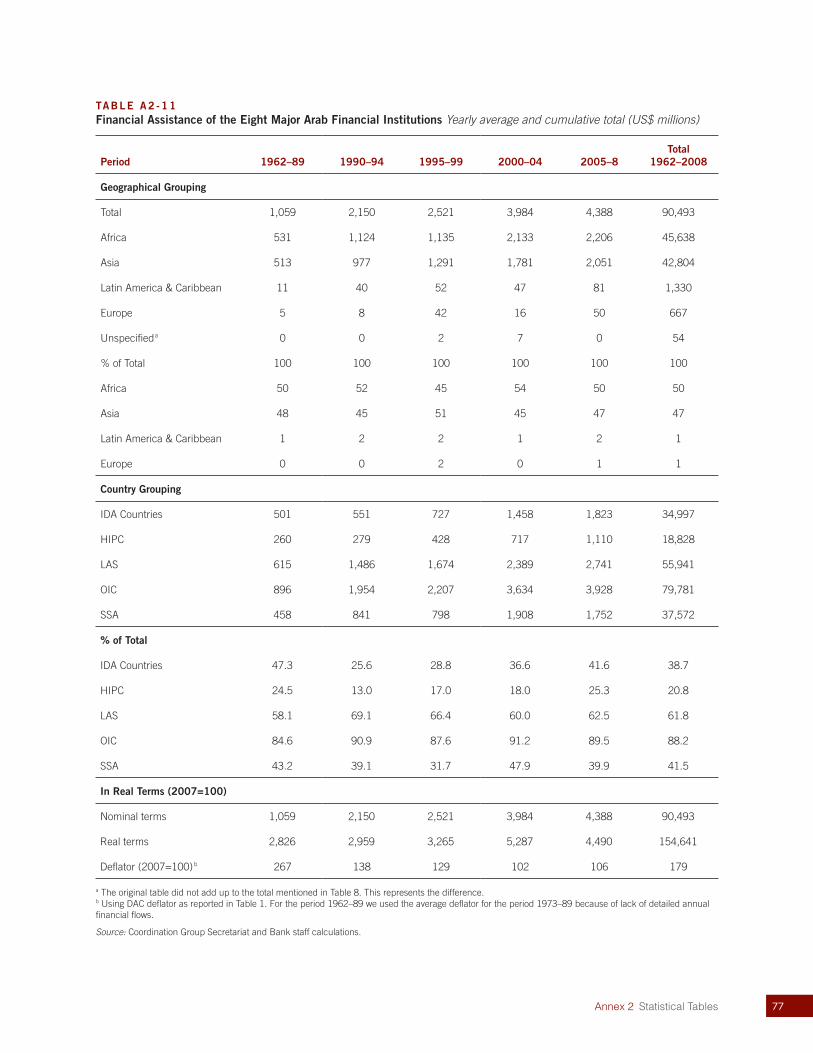
77Annex 2 Statistical Tables
TABLE A2 -11 Financial Assistance of the Eight Major Arab Financial Institutions Yearly average and cumulative total (US$ millions)
Period 1962–89 1990–94 1995–99 2000–04 2005–8Total
1962–2008
Geographical Grouping
Total 1,059 2,150 2,521 3,984 4,388 90,493
Africa 531 1,124 1,135 2,133 2,206 45,638
Asia 513 977 1,291 1,781 2,051 42,804
Latin America & Caribbean 11 40 52 47 81 1,330
Europe 5 8 42 16 50 667
Unspecified a 0 0 2 7 0 54
% of Total 100 100 100 100 100 100
Africa 50 52 45 54 50 50
Asia 48 45 51 45 47 47
Latin America & Caribbean 1 2 2 1 2 1
Europe 0 0 2 0 1 1
Country Grouping
IDA Countries 501 551 727 1,458 1,823 34,997
HIPC 260 279 428 717 1,110 18,828
LAS 615 1,486 1,674 2,389 2,741 55,941
OIC 896 1,954 2,207 3,634 3,928 79,781
SSA 458 841 798 1,908 1,752 37,572
% of Total
IDA Countries 47.3 25.6 28.8 36.6 41.6 38.7
HIPC 24.5 13.0 17.0 18.0 25.3 20.8
LAS 58.1 69.1 66.4 60.0 62.5 61.8
OIC 84.6 90.9 87.6 91.2 89.5 88.2
SSA 43.2 39.1 31.7 47.9 39.9 41.5
In Real Terms (2007=100)
Nominal terms 1,059 2,150 2,521 3,984 4,388 90,493
Real terms 2,826 2,959 3,265 5,287 4,490 154,641
Deflator (2007=100) b 267 138 129 102 106 179
a The original table did not add up to the total mentioned in Table 8. This represents the difference.b Using DAC deflator as reported in Table 1. For the period 1962–89 we used the average deflator for the period 1973–89 because of lack of detailed annual financial flows.
Source: Coordination Group Secretariat and Bank staff calculations.
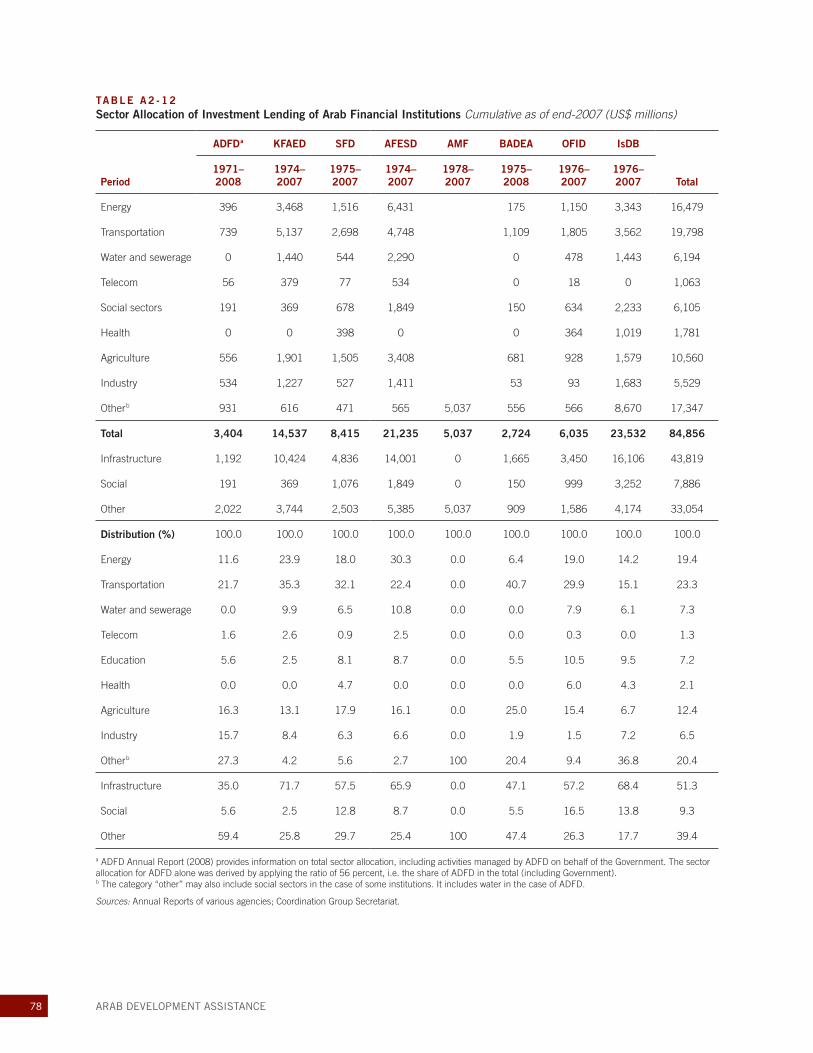
78 ARAB DEVELOPMENT ASSISTANCE
TABLE A2 -12 Sector Allocation of Investment Lending of Arab Financial Institutions Cumulative as of end-2007 (US$ millions)
Period
ADFD a KFAED SFD AFESD AMF BADEA OFID IsDB
Total1971–2008
1974–2007
1975–2007
1974–2007
1978–2007
1975–2008
1976–2007
1976–2007
Energy 396 3,468 1,516 6,431 175 1,150 3,343 16,479
Transportation 739 5,137 2,698 4,748 1,109 1,805 3,562 19,798
Water and sewerage 0 1,440 544 2,290 0 478 1,443 6,194
Telecom 56 379 77 534 0 18 0 1,063
Social sectors 191 369 678 1,849 150 634 2,233 6,105
Health 0 0 398 0 0 364 1,019 1,781
Agriculture 556 1,901 1,505 3,408 681 928 1,579 10,560
Industry 534 1,227 527 1,411 53 93 1,683 5,529
Other b 931 616 471 565 5,037 556 566 8,670 17,347
Total 3,404 14,537 8,415 21,235 5,037 2,724 6,035 23,532 84,856
Infrastructure 1,192 10,424 4,836 14,001 0 1,665 3,450 16,106 43,819
Social 191 369 1,076 1,849 0 150 999 3,252 7,886
Other 2,022 3,744 2,503 5,385 5,037 909 1,586 4,174 33,054
Distribution (%) 100.0 100.0 100.0 100.0 100.0 100.0 100.0 100.0 100.0
Energy 11.6 23.9 18.0 30.3 0.0 6.4 19.0 14.2 19.4
Transportation 21.7 35.3 32.1 22.4 0.0 40.7 29.9 15.1 23.3
Water and sewerage 0.0 9.9 6.5 10.8 0.0 0.0 7.9 6.1 7.3
Telecom 1.6 2.6 0.9 2.5 0.0 0.0 0.3 0.0 1.3
Education 5.6 2.5 8.1 8.7 0.0 5.5 10.5 9.5 7.2
Health 0.0 0.0 4.7 0.0 0.0 0.0 6.0 4.3 2.1
Agriculture 16.3 13.1 17.9 16.1 0.0 25.0 15.4 6.7 12.4
Industry 15.7 8.4 6.3 6.6 0.0 1.9 1.5 7.2 6.5
Other b 27.3 4.2 5.6 2.7 100 20.4 9.4 36.8 20.4
Infrastructure 35.0 71.7 57.5 65.9 0.0 47.1 57.2 68.4 51.3
Social 5.6 2.5 12.8 8.7 0.0 5.5 16.5 13.8 9.3
Other 59.4 25.8 29.7 25.4 100 47.4 26.3 17.7 39.4
a ADFD Annual Report (2008) provides information on total sector allocation, including activities managed by ADFD on behalf of the Government. The sector allocation for ADFD alone was derived by applying the ratio of 56 percent, i.e. the share of ADFD in the total (including Government). b The category “other” may also include social sectors in the case of some institutions. It includes water in the case of ADFD.
Sources: Annual Reports of various agencies; Coordination Group Secretariat.
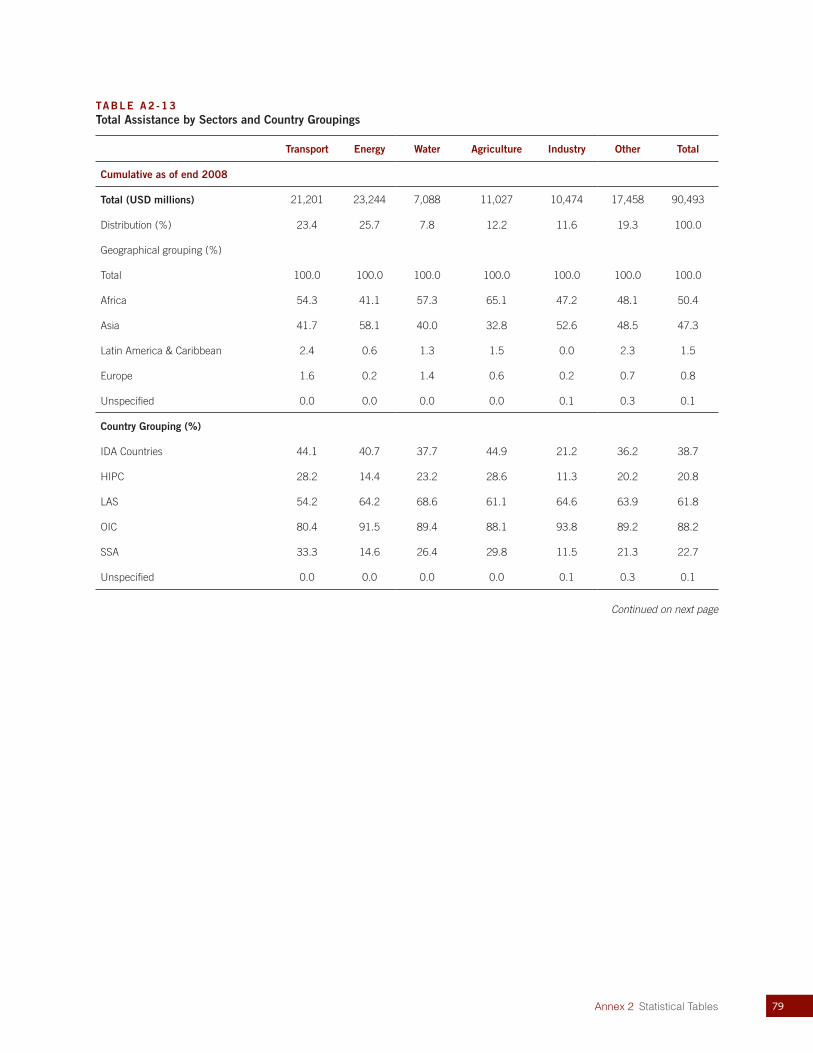
79Annex 2 Statistical Tables
TABLE A2 -13 Total Assistance by Sectors and Country Groupings
Transport Energy Water Agriculture Industry Other Total
Cumulative as of end 2008
Total (USD millions) 21,201 23,244 7,088 11,027 10,474 17,458 90,493
Distribution (%) 23.4 25.7 7.8 12.2 11.6 19.3 100.0
Geographical grouping (%)
Total 100.0 100.0 100.0 100.0 100.0 100.0 100.0
Africa 54.3 41.1 57.3 65.1 47.2 48.1 50.4
Asia 41.7 58.1 40.0 32.8 52.6 48.5 47.3
Latin America & Caribbean 2.4 0.6 1.3 1.5 0.0 2.3 1.5
Europe 1.6 0.2 1.4 0.6 0.2 0.7 0.8
Unspecified 0.0 0.0 0.0 0.0 0.1 0.3 0.1
Country Grouping (%)
IDA Countries 44.1 40.7 37.7 44.9 21.2 36.2 38.7
HIPC 28.2 14.4 23.2 28.6 11.3 20.2 20.8
LAS 54.2 64.2 68.6 61.1 64.6 63.9 61.8
OIC 80.4 91.5 89.4 88.1 93.8 89.2 88.2
SSA 33.3 14.6 26.4 29.8 11.5 21.3 22.7
Unspecified 0.0 0.0 0.0 0.0 0.1 0.3 0.1
Continued on next page
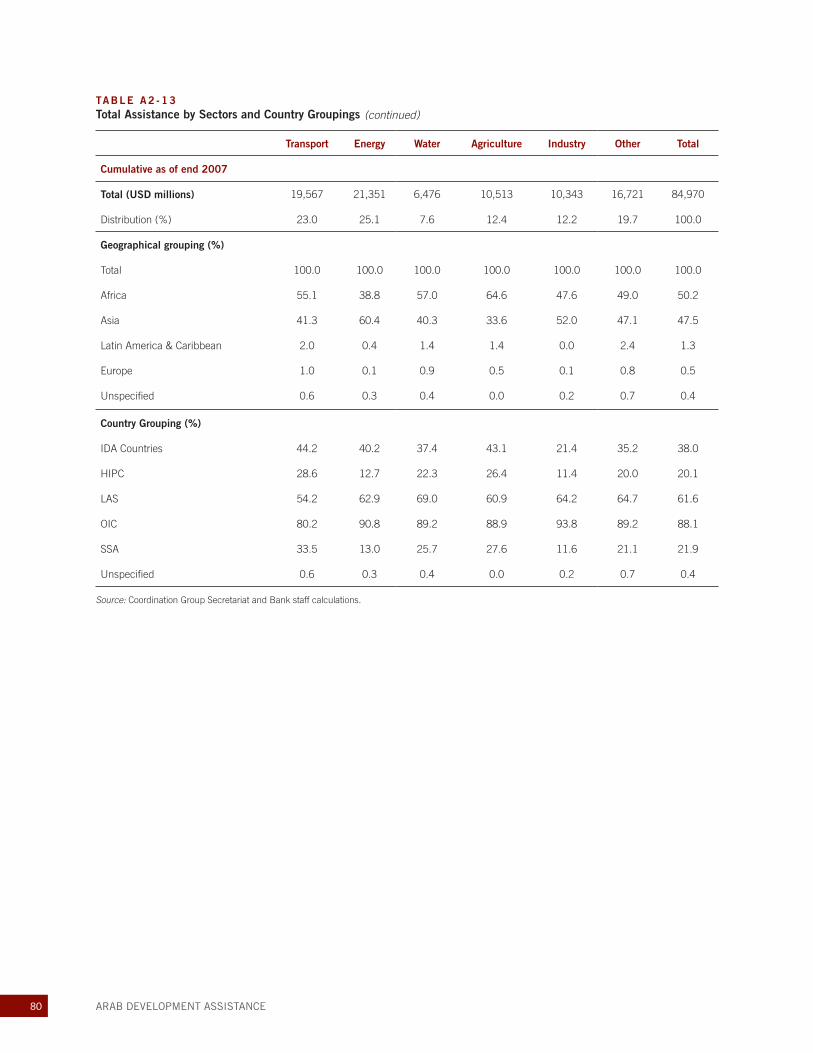
80 ARAB DEVELOPMENT ASSISTANCE
TABLE A2 -13 Total Assistance by Sectors and Country Groupings
Transport Energy Water Agriculture Industry Other Total
Cumulative as of end 2007
Total (USD millions) 19,567 21,351 6,476 10,513 10,343 16,721 84,970
Distribution (%) 23.0 25.1 7.6 12.4 12.2 19.7 100.0
Geographical grouping (%)
Total 100.0 100.0 100.0 100.0 100.0 100.0 100.0
Africa 55.1 38.8 57.0 64.6 47.6 49.0 50.2
Asia 41.3 60.4 40.3 33.6 52.0 47.1 47.5
Latin America & Caribbean 2.0 0.4 1.4 1.4 0.0 2.4 1.3
Europe 1.0 0.1 0.9 0.5 0.1 0.8 0.5
Unspecified 0.6 0.3 0.4 0.0 0.2 0.7 0.4
Country Grouping (%)
IDA Countries 44.2 40.2 37.4 43.1 21.4 35.2 38.0
HIPC 28.6 12.7 22.3 26.4 11.4 20.0 20.1
LAS 54.2 62.9 69.0 60.9 64.2 64.7 61.6
OIC 80.2 90.8 89.2 88.9 93.8 89.2 88.1
SSA 33.5 13.0 25.7 27.6 11.6 21.1 21.9
Unspecified 0.6 0.3 0.4 0.0 0.2 0.7 0.4
Source: Coordination Group Secretariat and Bank staff calculations.
(continued)
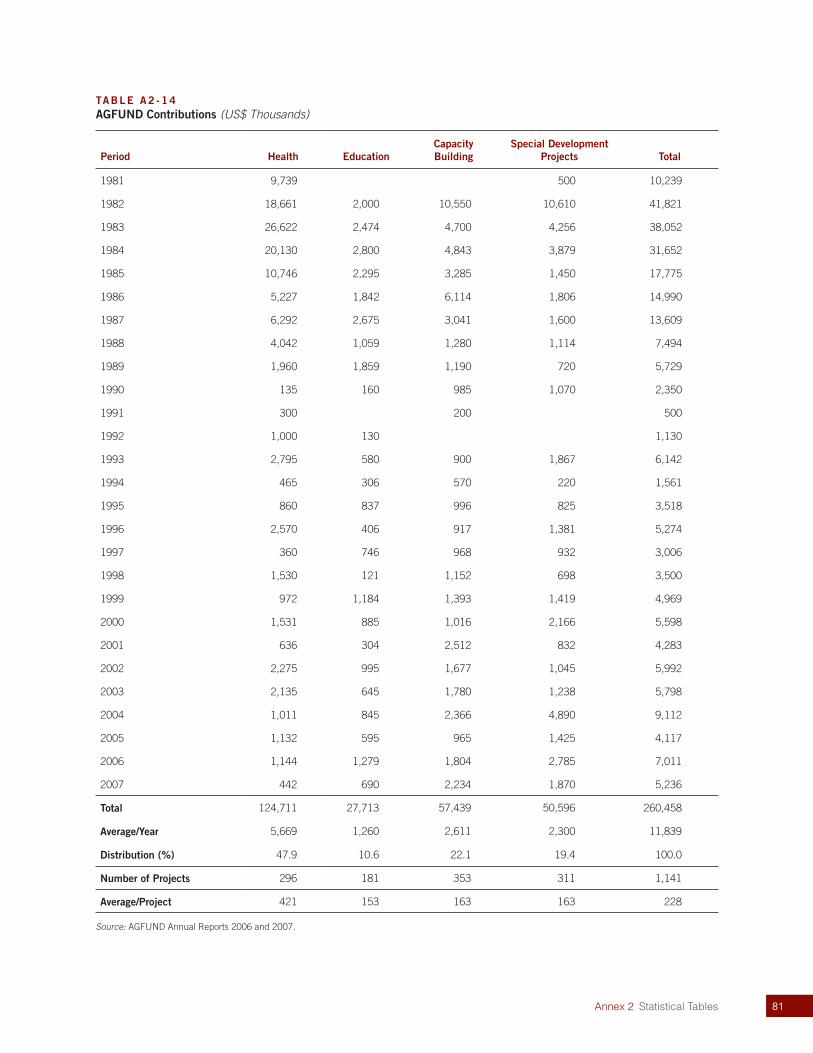
81Annex 2 Statistical Tables
TABLE A2 -14 AGFUND Contributions (US$ Thousands)
Period Health EducationCapacity Building
Special Development Projects Total
1981 9,739 500 10,239
1982 18,661 2,000 10,550 10,610 41,821
1983 26,622 2,474 4,700 4,256 38,052
1984 20,130 2,800 4,843 3,879 31,652
1985 10,746 2,295 3,285 1,450 17,775
1986 5,227 1,842 6,114 1,806 14,990
1987 6,292 2,675 3,041 1,600 13,609
1988 4,042 1,059 1,280 1,114 7,494
1989 1,960 1,859 1,190 720 5,729
1990 135 160 985 1,070 2,350
1991 300 200 500
1992 1,000 130 1,130
1993 2,795 580 900 1,867 6,142
1994 465 306 570 220 1,561
1995 860 837 996 825 3,518
1996 2,570 406 917 1,381 5,274
1997 360 746 968 932 3,006
1998 1,530 121 1,152 698 3,500
1999 972 1,184 1,393 1,419 4,969
2000 1,531 885 1,016 2,166 5,598
2001 636 304 2,512 832 4,283
2002 2,275 995 1,677 1,045 5,992
2003 2,135 645 1,780 1,238 5,798
2004 1,011 845 2,366 4,890 9,112
2005 1,132 595 965 1,425 4,117
2006 1,144 1,279 1,804 2,785 7,011
2007 442 690 2,234 1,870 5,236
Total 124,711 27,713 57,439 50,596 260,458
Average/Year 5,669 1,260 2,611 2,300 11,839
Distribution (%) 47.9 10.6 22.1 19.4 100.0
Number of Projects 296 181 353 311 1,141
Average/Project 421 153 163 163 228
Source: AGFUND Annual Reports 2006 and 2007.
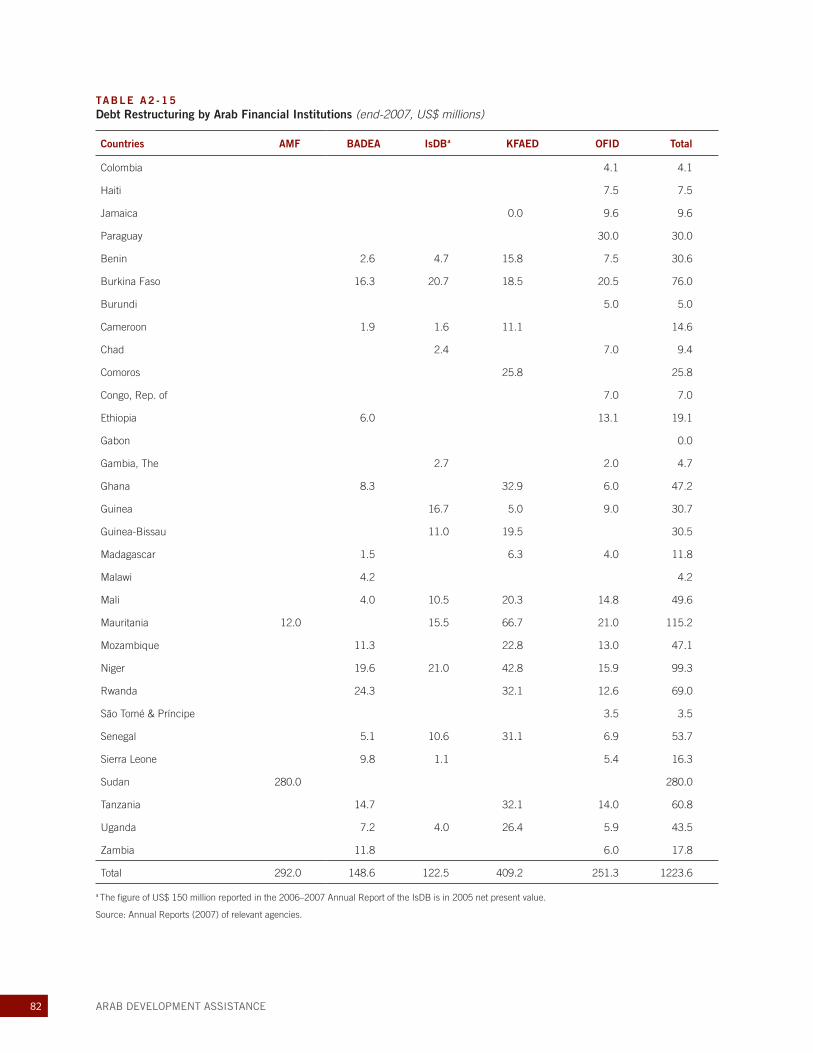
82 ARAB DEVELOPMENT ASSISTANCE
TABLE A2 -15 Debt Restructuring by Arab Financial Institutions (end-2007, US$ millions)
Countries AMF BADEA IsDB a KFAED OFID Total
Colombia 4.1 4.1
Haiti 7.5 7.5
Jamaica 0.0 9.6 9.6
Paraguay 30.0 30.0
Benin 2.6 4.7 15.8 7.5 30.6
Burkina Faso 16.3 20.7 18.5 20.5 76.0
Burundi 5.0 5.0
Cameroon 1.9 1.6 11.1 14.6
Chad 2.4 7.0 9.4
Comoros 25.8 25.8
Congo, Rep. of 7.0 7.0
Ethiopia 6.0 13.1 19.1
Gabon 0.0
Gambia, The 2.7 2.0 4.7
Ghana 8.3 32.9 6.0 47.2
Guinea 16.7 5.0 9.0 30.7
Guinea-Bissau 11.0 19.5 30.5
Madagascar 1.5 6.3 4.0 11.8
Malawi 4.2 4.2
Mali 4.0 10.5 20.3 14.8 49.6
Mauritania 12.0 15.5 66.7 21.0 115.2
Mozambique 11.3 22.8 13.0 47.1
Niger 19.6 21.0 42.8 15.9 99.3
Rwanda 24.3 32.1 12.6 69.0
São Tomé & Príncipe 3.5 3.5
Senegal 5.1 10.6 31.1 6.9 53.7
Sierra Leone 9.8 1.1 5.4 16.3
Sudan 280.0 280.0
Tanzania 14.7 32.1 14.0 60.8
Uganda 7.2 4.0 26.4 5.9 43.5
Zambia 11.8 6.0 17.8
Total 292.0 148.6 122.5 409.2 251.3 1223.6
a The figure of US$ 150 million reported in the 2006–2007 Annual Report of the IsDB is in 2005 net present value.
Source: Annual Reports (2007) of relevant agencies.
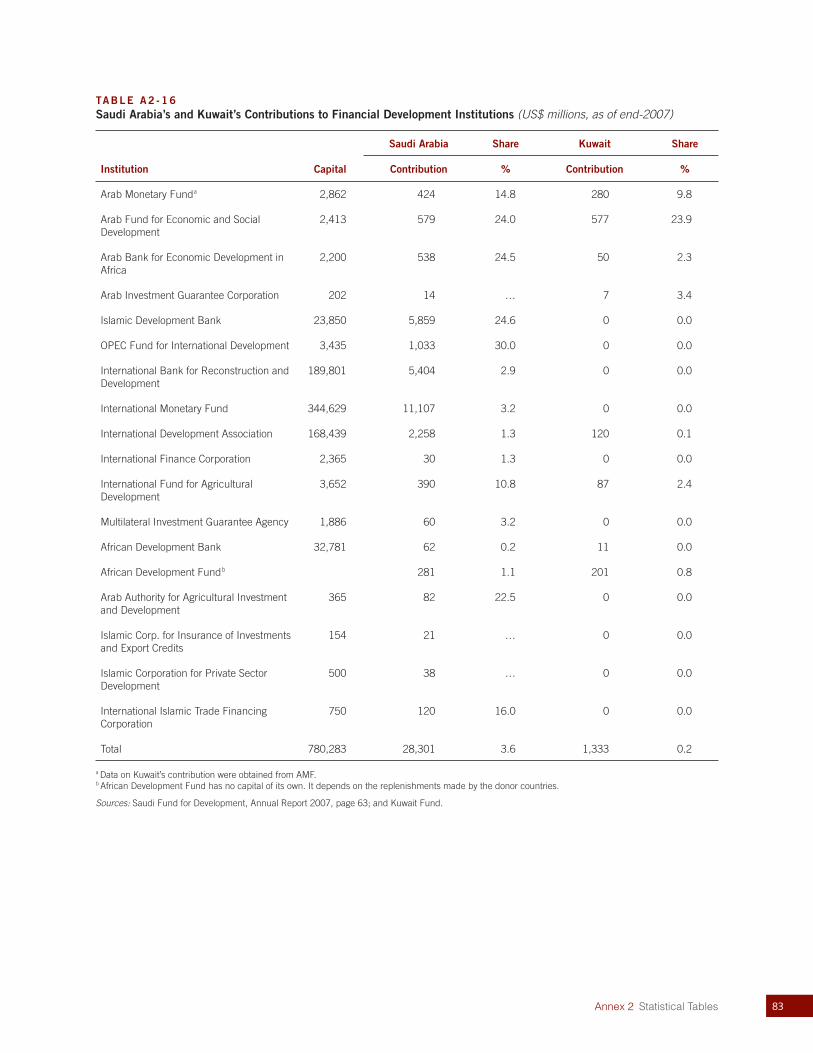
83Annex 2 Statistical Tables
TABLE A2 -16 Saudi Arabia’s and Kuwait’s Contributions to Financial Development Institutions (US$ millions, as of end-2007)
Institution Capital
Saudi Arabia Share Kuwait Share
Contribution % Contribution %
Arab Monetary Fund a 2,862 424 14.8 280 9.8
Arab Fund for Economic and Social Development
2,413 579 24.0 577 23.9
Arab Bank for Economic Development in Africa
2,200 538 24.5 50 2.3
Arab Investment Guarantee Corporation 202 14 … 7 3.4
Islamic Development Bank 23,850 5,859 24.6 0 0.0
OPEC Fund for International Development 3,435 1,033 30.0 0 0.0
International Bank for Reconstruction and Development
189,801 5,404 2.9 0 0.0
International Monetary Fund 344,629 11,107 3.2 0 0.0
International Development Association 168,439 2,258 1.3 120 0.1
International Finance Corporation 2,365 30 1.3 0 0.0
International Fund for Agricultural Development
3,652 390 10.8 87 2.4
Multilateral Investment Guarantee Agency 1,886 60 3.2 0 0.0
African Development Bank 32,781 62 0.2 11 0.0
African Development Fund b 281 1.1 201 0.8
Arab Authority for Agricultural Investment and Development
365 82 22.5 0 0.0
Islamic Corp. for Insurance of Investments and Export Credits
154 21 … 0 0.0
Islamic Corporation for Private Sector Development
500 38 … 0 0.0
International Islamic Trade Financing Corporation
750 120 16.0 0 0.0
Total 780,283 28,301 3.6 1,333 0.2
a Data on Kuwait’s contribution were obtained from AMF.b African Development Fund has no capital of its own. It depends on the replenishments made by the donor countries.
Sources: Saudi Fund for Development, Annual Report 2007, page 63; and Kuwait Fund.