Embed Size (px)
Citation preview

Shaping the FutureA Long-Term Perspective of People and Job Mobility
for the Middle East and North Africa
European Commission
Shaping the Future
The internationalization of the production of goods and services,
reduced communications, and transportation costs and global demo-
graphic developments will lead to higher international mobility of labor
and jobs in the coming decades. Over the long run, income growth and
the prosperity of nations will depend on the availability of a sufficiently
large workforce with a range of skill levels and the ability to adapt to
the changing needs of society. Two pillars underpin the analysis present-
ed in Shaping the Future: A Long-Term Perspective of People and Job Mobility for the
Middle East and North Africa. First, increasingly strong forces will be pulling
for the migration of people and jobs across the world’s regions in the
future. Second, countries and regions can adopt a proactive approach to
prepare for these global changes, seize opportunities, and address risks
head on. Recognizing the urgency to invest massively today in order to
increase the future global pool of medium and high-skilled workers
and to meet tomorrow’s global needs, the report develops a policy
framework for both labor-sending and labor-receiving countries and
advocates a collaborative approach to address the challenges ahead.
SKU 32173


Shaping the Future

A Long-Term Perspective of People and JobMobility for the Middle East and North Africa
Shaping the Future
© 2009 The International Bank for Reconstruction and Development / The World Bank
1818 H Street NW
Washington DC 20433
Telephone: 202-473-1000
Internet: www.worldbank.org
E-mail: [email protected]
All rights reserved
This volume is a product of the staff of the International Bank for Reconstruction and
Development / The World Bank. The findings, interpretations, and conclusions expressed
in this volume do not necessarily reflect the views of the Executive Directors of The World
Bank or the governments they represent, or the European Union.
The World Bank does not guarantee the accuracy of the data included in this work. The
boundaries, colors, denominations, and other information shown on any map in this work
do not imply any judgement on the part of The World Bank concerning the legal status of
any territory or the endorsement or acceptance of such boundaries.
Rights and PermissionsThe material in this publication is copyrighted. Copying and/or transmitting portions or
all of this work without permission may be a violation of applicable law. The International
Bank for Reconstruction and Development / The World Bank encourages dissemination of
its work and will normally grant permission to reproduce portions of the work promptly.
For permission to photocopy or reprint any part of this work, please send a request with
complete information to the Copyright Clearance Center Inc., 222 Rosewood Drive, Danvers,
MA 01923, USA; telephone: 978-750-8400; fax: 978-750-4470; Internet: www.copyright.com.
All other queries on rights and licenses, including subsidiary rights, should be addressed
to the Office of the Publisher, The World Bank, 1818 H Street NW, Washington, DC 20433,
USA; fax: 202-522-2422; e-mail: [email protected].
Acknowledgments xi
Abbreviations xiii
Overview xv
1 Introduction 1
People and Job Migration: The Stakes for the MENA Region 5
2 People and Job Mobility in the MENA Region 13
Labor Migration Out of MENA 13Evolution of MENA Migration 13MENA Migration in a Comparative Perspective 16
Job Migration to MENA 26
3 Demand and Supply Framework 33
Understanding the Demand Side 33The Demand for Foreign Labor in the
European Union 35The Supply of Migrants from MENA 40
4 Migration in the Long Term: The Outlook for
the Next Generations 51
Overview of the Worldwide Impact of Demographic Developments on Labor Migration 52
Population and Labor Force Dynamics in MENA 57Population and Labor Force Dynamics in Europe 61
5 A Conceptual Framework for Policy Makers 69
Policies and Practices Affecting LaborMigration Outcomes 70
Contents
v
Contentsvi
Good Practices in Labor Migration Policies inOECD Host Countries 70
Labor Migration Policies in MENA SendingCountries 80
Strategic Options for Adapting to Global Mobility 83Global Mobility Policy Areas 86Mobilizing Actors and Resources for
Global Mobility 88
Annex A 95
References 103
Boxes
2.1 Selected Terminology 21 2.2 Offshoring in Egypt 29 3.1 CEDEFOP Definition of Occupational Groups 39 3.2 Recruitment Difficulties and Skills
Shortages in France 41 5.1 Points Systems 72 5.2 The Management of Temporary Migration Flows:
The German-Polish Contract Agreement and the Spanish Agricultural Laborer Agreement 75
5.3 The Philippines Labor Emigration “Know-How” 81
Figures
1 Change in Total Labor Force forDeficit Regions, by Decade xvii
2 Change in Total Labor Force for Growing Regions, by Decade xvii
3 Emigration of the 15–39-Year-Old Labor Force by Sending Region at Current Emigration Rates, by Decade xviii
4 Skill Mismatch with and without Policy Reform inMENA Countries xxi
1.1 MENA: Economic Growth 7 1.2 MENA: The Comparative Employment Situation 8 1.3 MENA: Global Integration Indicators 10 1.4 MENA: Selected Remittance Flows as
Percentage of GDP, 1980–2006 10 2.1 Receiving Countries’ Unemployment Trends and
Migration from Maghreb into France 14
Contents vii
2.2 Distribution of MENA Region Migrants by Destination Regions 17
2.3 Distribution of MENA Emigrants by Region of Origin and Destination 18
2.4 Share of Migrants from MENA Countries in the Migratory Flows to Selected Continental European Countries 19
2.5 Share of Migrants from MENA Countries in the Migratory Flows to Selected Northern European Countries, 1995–2002 19
2.6 Share of Migrants from MENA Countries in the Migratory Flows to SelectedAnglo-Saxon Countries, 1995–2002 19
2.7 Distribution of Migrants by Region of Origin and Sub-Group of OECD Countries, 2000 20
2.8 Migration Inflows by Reason for Entry in 2004 21 2.9 Expatriation Rates to OECD Countries of
Population Ages 25 and Over in 2000 by MENA Country 22
2.10 Female Share of Total Migrants: 1990 and 2000 23 2.11 Expatriation Rates to the OECD, 2000 23 2.12 Highly Skilled Selection Rates, OECD,
1990 and 2000 24 2.13 Share of Highly Educated Migrants from MENA
Countries in OECD Countries, 2000 25 2.14 Share of Skilled Migrants from Morocco and
Tunisia, by Destination, 1990–2000 25 2.15 Comparative Wages in Selected Sectors and
Countries 30 2.16 Knowledge Economy and Innovation Indicators 31 3.1 Evolution of Unemployment Rates in Europe 35 3.2 Job Vacancy Rates in Some European
Countries, 2006 37 3.3 Vacant Jobs by Country, 2006 38 3.4 Job Vacancies by Economic Sector and
Country, 2005 39 3.5 Net Employment Change, 2006–15,
by Occupational Groups and Highest Level of Qualification, EU-25, Norway, and Switzerland 40
3.6 Demand by Occupation, Broad Groups,2006–15, EU-25, Norway, and Switzerland 41
Contentsviii
3.7 Education Outcomes in MENA and Comparator Countries 43
3.8 Employment Rates in EU-15, EU-15 Average and Migrants Groups, by Nationality and Country of Birth 47
4.1 Demographic Change by Age Group and Region Worldwide, 2010–50 53
4.2 Change in Total Labor Force for Deficit Regions by Decade, 2005–50 54
4.3 Change in Total Labor Force for Growing Regions by Decade, 2005–50 55
4.4 Emigration of Labor Force Ages 15–39 by Sending Region at Current Emigration Rates, 2005–50, by Decade 56
4.5 Projected Change in Labor Force between 2005 and 2050 by Age Group for MENA Emigration Countries, Variant I 58
4.6 Projected Change in Labor Force between 2005 and 2050 by Country and Age Group for MENA Emigration Countries, Variant I 59
4.7 Projected Change in Labor Force between 2005 and 2050 by Age Group for MENA Immigration Countries, Variant I 60
4.8 Projected Change in Labor Force between 2005 and 2050 by Country and Age Group for MENA Immigration Countries, Variant I 60
4.9 Evolution of MENA Labor Force (Ages 15–39) byEducation Level under Different Scenarios, 2005–20 and 2020–50 61
4.10 Projected Change in Labor Forcebetween 2005 and 2050 by Country and AgeGroup for EU-25+, Variant I 62
4.11 Go It Alone: Changes in Labor Force and Labor Force Average Age 64
4.12 Labor Force Decline by Age and Education Levels 65
4.13 Replacing People and Medium-Level Skills over Time: The Impact of Policy 66
5.1 Labor Sending Options 84 5.2 Labor Receiving Options 85 5.3 Policy Framework for Labor and Job Mobility 88 5.4 Key Actors and Areas of Responsibility 90
Contents ix
Tables
1 Collaboration or Competition? A Payoff Matrix xxiii 1.1 Ease of Doing Business Rankings: MENA and
Other Middle-Income Countries 8 1.2 MENA Labor Migration and Domestic
Labor Markets 9 2.1 Selected Characteristics of Moroccan Migrants
in the 1960s and 1990s 15 2.2 Attributes of Jobs Outsourced 26 2.3 Regional Distribution of Export-Oriented
FDI Projects in Outsourced Services, 2002–03 28 3.1 Testing the Determinants of Migration through a
Gravity Approach: Key Results 34 3.2 Distribution of University Students by Field of
Study 44 3.3 Unemployment Rates in Selected MENA
Countries, by Gender and Education Level, 2006 46 3.4 Education Levels of Migrants in France and
Spain, by Origin 46 3.5 Probability of Obtaining Skilled Jobs in the
United States, Selected Countries, 1990s 48 4.1 Projected Change in Labor Force, 2005–50,
by Region 54 5.1 Education Attainment of Migrant Populations
by Hosting and Sending Region, 2000 72 5.2 Migration Programs and Selection Method:
Pros and Cons 73 5.3 Collaboration or Competition? A Payoff Matrix 91
A1 Distribution of Migrants in OECD Countries, by Region of Origin, 2000 95
A2 Profile of MENA Emigrants in 2000, by Country 96A3 Youth Illiteracy Rate (Ages 15–24) in Selected
MENA Countries 1980–2005 98A4 Typology of Migration According to Duration of
Stay, Motivation, Legal Status, Access to Labor Markets, and Some Policy Examples 100
A5 Examples of Bilateral Agreement in Maghreb Countries 101

The genesis of this study lies in the growing realization, both inside and out-
side the World Bank, that migration represents challenges and opportunities
for both sending and receiving countries. A sound management of economic
migration, based on cooperation between home and host countries and inte-
grated into long-term development strategies, can have beneficial outcomes
for both sides, as well as for the migrants and their households. The charac-
teristics and specific needs of, as well as the advantages offered by, the coun-
tries of the Middle East and North Africa (MENA) led the Bank’s MNA
Region1 to initiate a program of country and regional investigations on this
subject, of which this study is the culmination. The study was prepared under
the overall guidance of Mustapha Nabli (as chief economist, MNA Region)
and Michal Rutkowski (as director of human development, MNA Region) by
Leila Zlaoui (team leader), Sara Johansson de Silva, and Alexander Kolev, who
were assisted by Ben Varon and Lin Chin in the last phase. Special thanks to
Abdeslam Marfouk, Université de Bruxelles, for providing key data updates.
The study is co-financed by the European Union and the World Bank. It is
the product of a broad collaborative effort, reflecting the approach to migra-
tion planning and management advocated throughout the text. The contrib-
utors to the study encompass Bank staff as well as local consultants from both
MENA countries and donor partners. The study draws heavily on the work of
international and multinational organizations, such as the European
Community, the United Nations, the International Labour Organization
(ILO), and the Organisation for Economic Co-operation and Development.
The study builds on the experience and lessons of other regions and countries
with successful labor migration and insourcing histories and sets the frame-
work for future MNA/EC joint work in the region.
The study consists of the main body of the analysis—including findings,
projections, and implications for policy makers on both the sending and
receiving sides (with a focus on Europe on the latter)—and four background
Acknowledgments
xi
Acknowledgmentsxii
papers on migration trends, issues, and prospects, which are on the CD
mounted inside the back cover. These papers were prepared for the World Bank
by Flore Gubert and Christophe J. Nordman (Migration from MENA to OCED
Countries: Trends, Determinants, and Prospects), Johannes Koettl (Prospects for
Management of Migration between Europe and the Middle East and North
Africa), Georges Corm (Labor Migration in the Middle East and North Africa: A
View from the Region), and Christophe Schramm (Migration from Egypt,
Morocco, and Tunisia: Synthesis of Three Case Studies). The synthesis of three
case studies is based on papers prepared by Tahar Abdessalem, Ahmed Basti,
Mohamed Khachani, Fouzi Mourji, Ayman Zohry, and the International
Organization for Migration country branches of Tunis and Cairo. The case
studies benefited from Hedi Larbi’s invaluable insights.
We acknowledge and thank all of the people mentioned above as contrib-
utors to this study. Additionally, the study has benefited greatly from guidance
by its peer reviewers Karim Al Aynaoui (Central Bank of Morocco), Ibrahim
Awad (ILO), and Uri Dadush (World Bank).
1. MNA is the denomination of the MENA unit in the World Bank organizational listing of regions.
MNA includes Algeria, Bahrain, Djibouti, the Arab Republic of Egypt, the Islamic Republic of Iran,
Iraq, Jordan, Kuwait, Lebanon, Libya, Malta, Morocco, Oman, Qatar, Saudi Arabia, the Syrian Arab
Republic, Tunisia, the United Arab Emirates, West Bank and Gaza, and the Republic of Yemen.
AILE Digital Registry of Foreign Workers
ATCT Agence Tunisienne de Coopération Technique
BPO business process outsourcing
CEDEFOP European Centre for the Development of Vocational Training
CFO Commission of Filipinos Overseas
EAP East Asia and the Pacific
EC European Commission
ECA Europe and Central Asia
EU European Union
FDI foreign direct investment
GCC Gulf Cooperation Council
GDP gross domestic product
GNP gross national product
HSMP High Skilled Migration Programme (United Kingdom)
ICT information and communication technology
ILO International Labour Organization
IMIS Integrated Migration Information System
IOM International Organization for Migration
JVR job vacancy rate
LAC Latin America and the Caribbean
MENA Middle East and North Africa
NAAPEC National Agency for the Promotion of Employment and
Competence
NGO nongovernmental organization
OECD Organisation for Economic Co-operation and Development
OTE Office des Tunisiens à l’Etranger
OWWA Overseas Workers Welfare Administration
POEA Philippines Overseas Employment Administration
R&D research and development
Abbreviations
xiii

Abbreviationsxiv
SA South Asia
SSA Sub-Saharan Africa
TICs traditional immigration countries
UAE United Arab Emirates
UN United Nations
VTC vocational training centers
xv
1
A Global Market for Jobs and Workers Is Developing Rapidly
The internationalization of the production of goods and services, reduced
communications and transportation costs, and global demographic develop-
ments will lead to higher international mobility of labor and jobs in the coming
decades. Over the long run, income growth and the prosperity of nations will
depend on the availability of a sufficiently large workforce with a range of skill
levels and the ability to adapt to the changing needs of society. Two pillars
underpin the analysis presented in Shaping the Future: A Long-Term
Perspective of People and Job Mobility for the Middle East and North Africa.
First, increasingly strong forces will be pulling for the migration of people and
jobs across the world’s regions in the future. Second, countries and regions
can adopt a proactive approach to prepare for these global changes, seize
opportunities, and address risks head on.
The globalization of labor markets involves both the age-old phenomenon of
migration by people seeking better opportunities across borders, and the relatively
recent phenomenon of job mobility through the outsourcing and offshoring of
jobs to other countries. Advances in telecommunication, management, and
organization have made the relocation of activities both attractive and possi-
ble, allowing large and small firms alike to build relationships abroad to tap
into technology upgrades and cost savings. Firms look for the best-adapted
workers for their money. Individuals look for an improved quality of life—
even to the point of leaving their home countries for work abroad. As a result,
firms are increasingly tapping into the global market for services, talent, and
sheer manpower, recruiting migrants and moving jobs around the world.
Both industrial and developing countries stand to benefit from better-organized
migration schemes, more opportunities for labor migration, and better matching
between skill demand and skill supply. This is very much the case for the Middle
East and North Africa (MENA) and Europe, where important migration links
exist. Currently, migration is the main form of global integration for MENA
Overview
xvi
countries, and is making an important contribution to household incomes
and national economies in the region. Yet, the scope for improving migration
outcomes is significant.
Demographic Differences Will Increase Pressures for Migration
In the course of the next 40 to 45 years, the world population will go through sig-
nificant shifts, which will affect growth and welfare prospects in all regions. The
population will grow by some 2.6 billion people to reach 9 billion by 2050. At
the same time, declining fertility and increasing longevity are contributing to
an aging population worldwide. As a result, the population over 40 years old
stands to increase by as much as 2 billion people—or by 75 percent—and
the share of people 65 and older will more than double. These prospects
could pose serious risks to economic growth, fiscal balances, and the welfare
of the elderly.
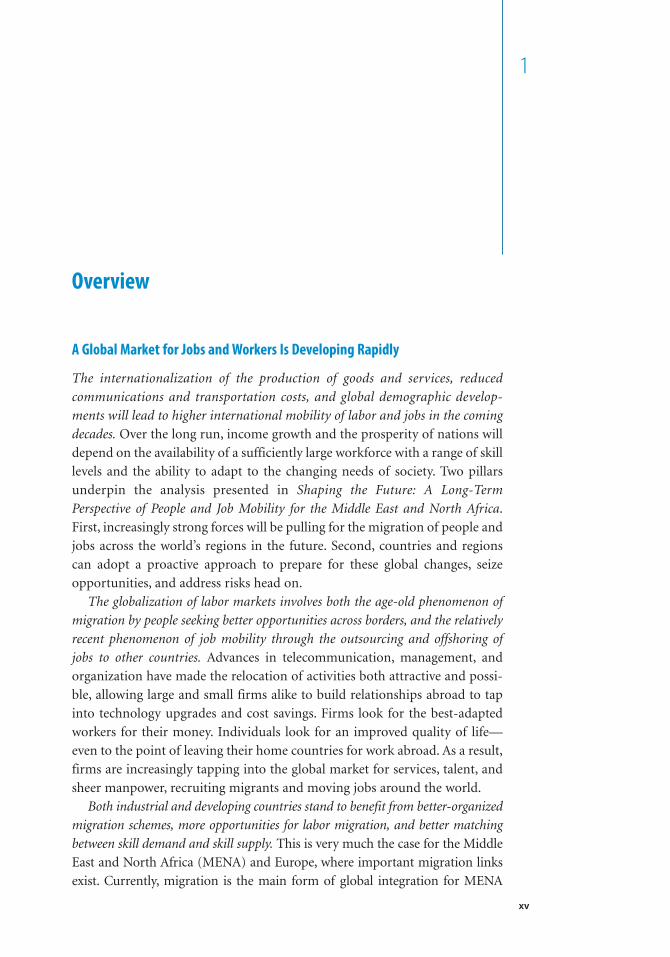
The dynamics vary significantly by region, with some regions, notably Europe,
facing the prospects of a rapid decline in population and labor force, even if drastic
policy measures are put in place. In the absence of migration, and assuming
that participation rates remain unchanged, Central Asia, the high-income
countries in East Asia as well as China, Europe, and North America would col-
lectively lose 216 million workers between now and 2050 (see figure 1). The
European Union alone would experience a loss of 66 million workers, a
decline of almost one-third, and by 2050, there will be about two retirees per
every one active person. Without heroic assumptions about labor productivity
growth, a reasonable level of aggregate income growth cannot be sustained
unless migrants are allowed to replace the retiring workforce.
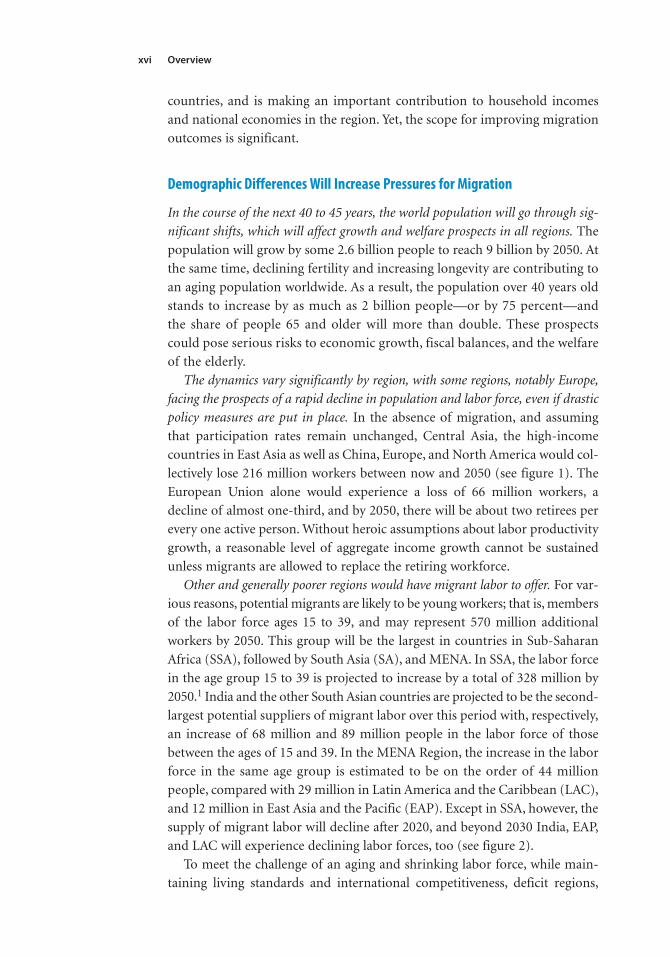
Other and generally poorer regions would have migrant labor to offer. For var-
ious reasons, potential migrants are likely to be young workers; that is, members
of the labor force ages 15 to 39, and may represent 570 million additional
workers by 2050. This group will be the largest in countries in Sub-Saharan
Africa (SSA), followed by South Asia (SA), and MENA. In SSA, the labor force
in the age group 15 to 39 is projected to increase by a total of 328 million by
2050.1 India and the other South Asian countries are projected to be the second-
largest potential suppliers of migrant labor over this period with, respectively,
an increase of 68 million and 89 million people in the labor force of those
between the ages of 15 and 39. In the MENA Region, the increase in the labor
force in the same age group is estimated to be on the order of 44 million
people, compared with 29 million in Latin America and the Caribbean (LAC),
and 12 million in East Asia and the Pacific (EAP). Except in SSA, however, the
supply of migrant labor will decline after 2020, and beyond 2030 India, EAP,
and LAC will experience declining labor forces, too (see figure 2).
To meet the challenge of an aging and shrinking labor force, while main-
taining living standards and international competitiveness, deficit regions,
Overview
Overview xvii
Figure 1. Change in Total Labor Force for Deficit Regions, by Decade
(millions, zero-migration variant, 2005–50)
–60
–40
–20
0
20
40
60
80
100
China EU and otherEurope
EAP high income ECA North America
2005–2010 2010–2020 2020–2030 2030–2040 2040–2050
Source: Koettl in background papers.
Figure 2. Change in Total Labor Force for Growing Regions, by Decade
(millions, zero-migration variant, 2005–50)
–60
–40
–20
0
20
40
60
80
100
EAP lowincome
India LAC MENA SA excl India SSA
2005–2010 2010–2020 2020–2030 2030–2040 2040–2050
Source: Koettl in background papers.
xviii
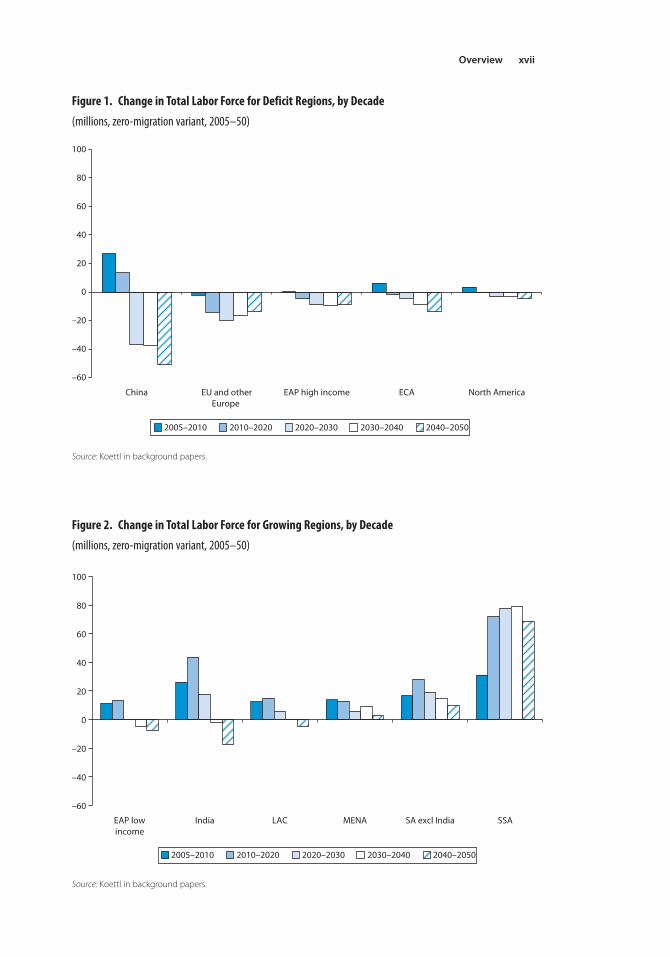
Figure 3. Emigration of the 15–39-Year-Old Labor Force by Sending Region at Current EmigrationRates (in millions) by Decade
–60
–40
–20
0
20
40
60
80
100
Latin Americaand Caribbean
Low-incomeEast Asia and
Pacific
Middle Eastand North
Africa
India Other SouthAsia
Sub-SaharanAfrica
2005–2010 2010–2020 2020–2030 2030–2040 2040–2050
Overview
including European countries, need to adopt a comprehensive approach. This
approach should aim to increase labor force employment rates (through, for
example, increasing retirement ages and women’s participation rates) and
boost productivity (through innovation). Domestic labor market reforms will
not be sufficient to close the labor force gap, however, and such reforms also
carry political costs.
Under current migration policies and with the broad economic and political
parameters unchanged, only a small fraction of the labor deficit would be filled
by other regions with surplus labor. What role could migration play to fill labor
shortages? As this and other research shows, the magnitude of imbalances is
such that migration into deficit regions is likely to intensify in the future. As
noted above, MENA, SA, and the poorer countries of East Asia will experience
continued increases in their young labor forces from where migrants could be
expected to come. Mass migration on a scale that would completely offset the
gap between labor surplus and deficit regions is not a realistic alternative; such
major displacement would, among other things, risk draining developing coun-
tries of their young and skilled workforce. Conversely, if current migration
policies and the other socioeconomic and political circumstances that drive
migration stay unchanged, only a small fraction of this surplus workforce—
32 million or less than 15 percent of the loss in workers in deficit regions—
would be willing or able to leave (see figure 3).
Overview xix
Labor Shortages Are Likely to Occur in Occupations across the Skills Spectrum
Labor migration involves and will continue to involve different skill levels. Labor
shortages in some areas, such as health care professionals at various skill levels,
are already significant. Short- and long-term projections both point to the fact
that labor shortages will grow in many rich countries, and that these labor
shortages will occur across the skills spectrum, with significant demand for
mid-level skills (such as nurses, intermediate business services) or even rela-
tively low-level skills (retail sales persons, waiters, and so on). Migrants with
vocational, secondary levels of education, and linguistic proficiency conceiv-
ably could fill these gaps.
Countries are increasingly aware of the need to attract talent at the high-
skilled level, but policies and instruments to promote mid-level skills are not as
high on the policy agenda. Employers will continue to hunt globally for the best
talent. Scientists and academics already move in a global labor market, as do
business executives. Emerging economies, including China and India, are
increasingly supplying the much-needed talent through migrants or outsourc-
ing. Many European countries now focus on how to adapt migration policies
to catch up with traditional immigration countries, like Australia, Canada, and
the United States, to attract a more skilled workforce. Commensurate initia-
tives are not available, however, to explore how to prepare and organize the
recruitment of mid-level skills and provide the necessary training. Yet mid-
level skills not only are in high demand, but also are likely to constitute the bulk
of future labor shortages if no action is taken.
How Can MENA’s Sending Countries Prepare for Higher People and Job Mobility?
Opportunities for regular labor migration to Europe and the Middle East currently
are limited. Migration within and out of MENA has a long history. The more
recent surge took place in the 1960s, as Western and Northern European coun-
tries actively recruited Maghreb workers for their expanding economies. This
recruitment continued in the 1970s as the booming oil economies in the Gulf
absorbed a large pool of skilled and low-skilled manpower. Over time, as formal
job opportunities diminished, migration to Europe increasingly took the form of
permanent migration for the purposes of family reunification and formation, as
well as undocumented migration and has been directed to Southern European
countries. In the Gulf countries, in particular, Middle Eastern workers have faced
increased competition from national and Asian workers.
MENA migrants have brought important benefits to home and host countries.
Remittance income is a key source of foreign exchange in the MENA sending
countries: formal remittances income accounts for between 5 and 20 percent
xx Overview
of the gross national product (GNP) in some of the main MENA migration
countries. Jobs abroad (in the member countries of the Organisation for
Economic Co-operation and Development [OECD] and the Gulf) are equiv-
alent to 6 percent of total employment at home. The impact on technology
flows, innovation, education, and investment of an active Diaspora and return-
ing migrants is potentially significant. Estimates suggest that migrants have
contributed considerably to economic growth in “new” receiving countries,
such as Spain.
Yet outcomes are still disappointing relative to the potential. Irregular migra-
tion from the MENA Region currently is subjecting migrant workers to poor
living and working conditions, substantial health and income risks, and social
marginalization. Second-generation immigrants in Europe generally do much
worse on labor markets than their national peers, and migrants are propor-
tionally less likely to be employed in occupations corresponding to their level
of education. Social and political tension around immigration and integration
issues is rising in a number of countries. Last, compared with migrants from
other regions, a large share of MENA’s educated workers leaves for foreign
shores, potentially draining the sending country of its skilled workforce.
MENA’s demographic bulge is now hitting labor markets with full force. To
meet labor force growth and absorb the large pool of unemployed, the region
needs to create nearly 5 million jobs per year up until 2020. At the moment,
job creation is barely keeping up with the growing labor force, and although
unemployment rates are falling, they remain excessively high, especially
among the young and educated.
Migration is not a panacea for sluggish job creation in MENA countries or for
an aging European population, but it could form part of the policy approach to
address these challenges. Migration cannot solve MENA’s unemployment
problem. As seen above, migration would need to take on unrealistic propor-
tions to replace the demographic deficit in Europe and elsewhere. But many
of the policy actions and institutional reforms that will be needed to stimulate
global labor and job mobility—enhanced education, overall investment climate,
financial system, public sector—are in tune with those needed to foster private
sector job creation and labor productivity growth at home.
Outsourcing and offshoring offer additional opportunities for tapping into the
global jobs market. The international migration of jobs to China and India
shows the important potential for job creation from the insourcing of jobs.
Offshoring to third parties is accelerating, and developing countries are
increasing their stake. In the right circumstances, MENA could attract signifi-
cant job creation, especially in business services, from abroad. The region’s
strengths include its geographic, cultural, and linguistic ties to Europe; its stable
investment climate, despite weaknesses in the business environment; and its
wage advantages in a few sectors. However, from a knowledge perspective—the
education level and specialization of the workforce, private sector research and
Overview xxi
development (R&D), information and communication technology (ICT)
skills—the region may, on average, have less to offer.
Actually, some of the features that block economic growth and domestic
job creation as well as insourcing options also may hamper the potential for
higher migration benefits in the sending countries. High illiteracy rates, as
well as unreformed education systems favoring social sciences over physical
sciences, technical and engineering skills, or business services, keep MENA
uncompetitive compared with other regions.
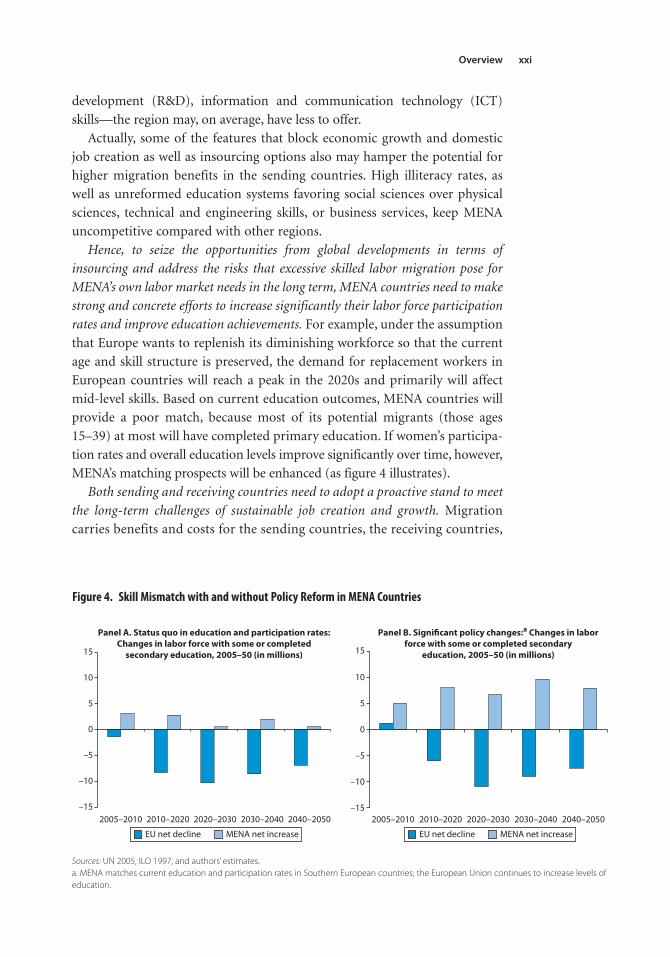
Hence, to seize the opportunities from global developments in terms of
insourcing and address the risks that excessive skilled labor migration pose for
MENA’s own labor market needs in the long term, MENA countries need to make
strong and concrete efforts to increase significantly their labor force participation
rates and improve education achievements. For example, under the assumption
that Europe wants to replenish its diminishing workforce so that the current
age and skill structure is preserved, the demand for replacement workers in
European countries will reach a peak in the 2020s and primarily will affect
mid-level skills. Based on current education outcomes, MENA countries will
provide a poor match, because most of its potential migrants (those ages
15–39) at most will have completed primary education. If women’s participa-
tion rates and overall education levels improve significantly over time, however,
MENA’s matching prospects will be enhanced (as figure 4 illustrates).
Both sending and receiving countries need to adopt a proactive stand to meet
the long-term challenges of sustainable job creation and growth. Migration
carries benefits and costs for the sending countries, the receiving countries,
Figure 4. Skill Mismatch with and without Policy Reform in MENA Countries
–15
–10
–5
0
5
10
15
–15
–10
–5
0
5
10
15
Panel A. Status quo in education and participation rates:Changes in labor force with some or completed
secondary education, 2005–50 (in millions)
Panel B. Significant policy changes:a Changes in laborforce with some or completed secondary
education, 2005–50 (in millions)
2005–2010 2010–2020 2005–2010 2010–2020 2020–2030 2030–2040 2040–20502020–2030 2030–2040 2040–2050
EU net decline MENA net increase EU net decline MENA net increase
Sources: UN 2005, ILO 1997, and authors’ estimates.a. MENA matches current education and participation rates in Southern European countries; the European Union continues to increase levels ofeducation.
xxii Overview
and the migrants themselves, and it has a wide-ranging impact on com -
petitiveness, social welfare, and cultural identity. High levels of irregular
migration, problems of integration, and the issue of “brain drain” divert
attention from migrants’ contributions to economic growth, globalization,
and cultural diversity. Although migration has a prominent place on the
international policy agenda, the focus remains mainly on high-skilled
migration, integration policies, and security concerns. Preparing for the
future effectively will require—additionally and especially—wide-ranging
changes in education, social protection, labor markets, and migration poli-
cies in both sending and receiving countries, as well as significant efforts to
incorporate these issues in international cooperation.
Most important, addressing future labor market skill needs requires action
now. Why? Because it takes 15 to 20 years or more to train a skilled worker
from childhood to adulthood, making the supply of skilled workers inelas-
tic in the short term. Today’s children will make up the labor force of 2030,
and the labor force of 2040 to 2050 will be born and educated in the next 10 to
20 years. A collaborative approach to the challenges ahead is required and
would bring important gains to both sending and receiving countries; sim-
ilarly, noncollaboration would hurt both sides equally. If the investment to
expand, in number and quality, the global pool of medium- and high-skilled
workers is not undertaken today, the large number of skilled workers
migrating to higher-income areas will create skill shortages in sending
countries. Moreover, in the absence of a large pool of competences and
expertise, competition between labor deficit countries would increase the
remuneration of scarce labor without avoiding shortages in light of the
inelastic character of the supply.
The common policy agenda embraces a host of economic and social reforms.
Policies will need to include (i) education, training, and migration prepara-
tion; (ii) encouraging mobility through social security and health insurance
portability; (iii) specific emigrant-immigrant services that facilitate adapta-
tion to host countries’ cultures and maintain ties with home countries; (iv)
measures to identify and fill labor market gaps; and (v) a mix of migration
programs—temporary, circular, permanent, demand, or supply driven—that
will be most effective for a smooth functioning of labor markets and fiscal
sustainability. Ongoing education, social protection, and financial reforms
need to be revisited and fine-tuned to meet the demands of global mobility.
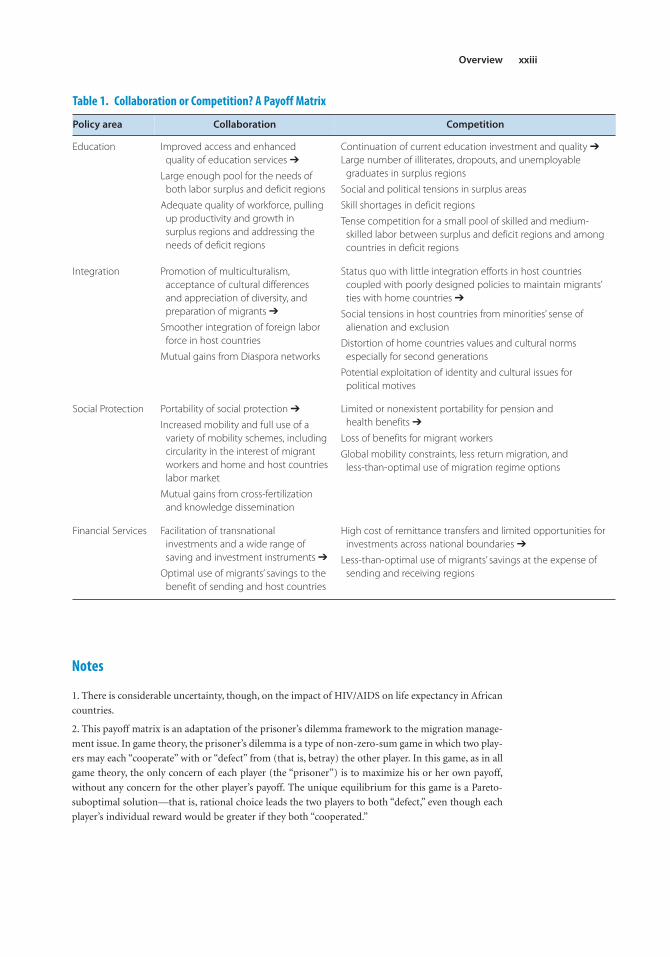
Recognizing that education for a global labor market is an issue for which col-
laboration is in the common interest and competition or short-term oppor-
tunism would hurt all stakeholders, partnerships between growing and deficit
regions of the world involving public, private, and associative actors are
needed to address the know-how and financial challenges associated with
preparing a high-quality global workforce for the future (see table 1).2
Overview xxiii
Notes
1. There is considerable uncertainty, though, on the impact of HIV/AIDS on life expectancy in African
countries.
2. This payoff matrix is an adaptation of the prisoner’s dilemma framework to the migration manage-
ment issue. In game theory, the prisoner’s dilemma is a type of non-zero-sum game in which two play-
ers may each “cooperate” with or “defect” from (that is, betray) the other player. In this game, as in all
game theory, the only concern of each player (the “prisoner”) is to maximize his or her own payoff,
without any concern for the other player’s payoff. The unique equilibrium for this game is a Pareto-
suboptimal solution—that is, rational choice leads the two players to both “defect,” even though each
player’s individual reward would be greater if they both “cooperated.”
Table 1. Collaboration or Competition? A Payoff Matrix
Policy area Collaboration Competition
Education Improved access and enhanced quality of education services ➔
Large enough pool for the needs of both labor surplus and deficit regions
Adequate quality of workforce, pulling up productivity and growth in surplus regions and addressing theneeds of deficit regions
Continuation of current education investment and quality ➔Large number of illiterates, dropouts, and unemployable
graduates in surplus regions
Social and political tensions in surplus areas
Skill shortages in deficit regions
Tense competition for a small pool of skilled and medium-skilled labor between surplus and deficit regions and amongcountries in deficit regions
Integration Promotion of multiculturalism, acceptance of cultural differences and appreciation of diversity, andpreparation of migrants ➔
Smoother integration of foreign labor force in host countries
Mutual gains from Diaspora networks
Status quo with little integration efforts in host countries coupled with poorly designed policies to maintain migrants’ties with home countries ➔
Social tensions in host countries from minorities’ sense of alienation and exclusion
Distortion of home countries values and cultural norms especially for second generations
Potential exploitation of identity and cultural issues for political motives
Social Protection Portability of social protection ➔
Increased mobility and full use of a variety of mobility schemes, includingcircularity in the interest of migrantworkers and home and host countrieslabor market
Mutual gains from cross-fertilization and knowledge dissemination
Limited or nonexistent portability for pension and health benefits ➔
Loss of benefits for migrant workers
Global mobility constraints, less return migration, and less-than-optimal use of migration regime options
Financial Services Facilitation of transnational investments and a wide range of saving and investment instruments ➔
Optimal use of migrants’ savings to the benefit of sending and host countries
High cost of remittance transfers and limited opportunities for investments across national boundaries ➔
Less-than-optimal use of migrants’ savings at the expense of sending and receiving regions

1
Introduction
1
The world population is going through significant shifts that will affect labor
demand and, ultimately, the growth and welfare prospects of all regions. Some
regions and countries, most notably Europe, but also North America, China,
and other East and Central Asian countries, will experience significant reduc-
tions in their available labor force in the coming decades. If no migration
takes place, these shrinking regions will collectively lose hundreds of millions
of workers between now and 2050. Foreign labor could not reasonably be
expected to fill these gaps. It is remarkable, nevertheless, that if current emi-
gration rates remain unchanged, only a tiny fraction of the labor force decline
would be met by migrants. This calls for a stronger role for migration policy
in both emigration and immigration countries and regions.
The economy-wide cost of aging populations or increasing old-age depend-
ency rates (the ratio of retirees to working-age population) has been the subject
of much study, most of which concludes that demographic transitions will have
strong effects on a number of economic indicators that in turn can affect
income growth. Declining saving rates, increasing consumption taxes and social
security contributions, and increasing real wages (a reflection of relative labor
scarcity) are associated with an aging population.1 Because of longer life
expectancies and lower fertility, working populations will have to support the
consumption, including of health and care services, of a consistently increasing
group of retirees. The falling share of the working-age population means that
relatively fewer people will pay taxes and social contributions, while the rising
share of the elderly means that more people are receiving pensions and needing
costly health services.2 Shrinking active populations also would mean lower
employment in the economies that, in turn, tend to lower per capita income
Shaping the Future2
growth. Projections for the European Union (EU) indicate that, as a result of an
aging population, the annual average potential gross domestic product (GDP)
growth rate could decline from 2.4 percent during 2004–10 to only 1.2 percent
between 2031 and 2050. Coupled with the decline in GDP, EU population aging
could lead to an increase in age-related spending between 3 and 4 percentage
points of GDP between 2004 and 2050—the equivalent of a 10 percent increase
in the size of the government sector.3 Some of this impact could be mitigated
by, for example, increases in capital intensity, technological progress, and over-
all growth in labor productivity, increased activity rates, and higher retirement
ages, but such policy responses are not likely to be sufficient to reverse these
declines and, at any rate, will not reverse the aging of the labor force.
The gains and losses of increased migration flows are not uniformly
distributed within countries or among migrants, and individuals’ assets—
capital, land, labor, and human capital—will determine the net impact on
their income. In receiving countries especially, those differences are likely to
shape voters’ preferences and acceptance for migration. To the extent that
migration constitutes a labor supply shock, increased migration should affect
wages negatively and increase the return to capital and land. Generally, new
migrants may have the most to win, especially if they are from poorer coun-
tries.4 As long as there is some segmentation of labor markets, the impact on
wages for low-skilled native workers in receiving countries would be relatively
small, however.5 If migrants are viewed as substitutes for native workers, the
negative impact of migration on the wages of the latter would be higher. If
migration is a response to a labor supply shock caused by rapidly shrinking
labor forces caused by accelerated attrition from the retirement of rapidly
aging populations, migrants likely will complement the native labor force at
the various skill levels and segments of the labor market.
On the premise that migration is a desirable feature of globalization,
policies for managing the international movement of workers need to build
a constituency in their favor. In other words, they need to offer clear bene-
fits to sending countries, receiving countries, and the migrants themselves.
From this perspective, it is clear, first, that all parties stand to win from
regular rather than irregular migration. Second, migration policies should
encourage migration forms that benefit longer-term economic development
and poverty reduction in sending countries. This would augur for, among
other things, managed labor migration (including for the low-skilled work-
ers), efficient remittance channels, and measures to address the problems
associated with skilled emigration. Migration policies should further ensure
that migrants are protected from risks, ranging from health to vulnerable
employment situations and outright marginalization. This objective
requires portable social protection benefits and well-designed integration
policies that are respectful of cultural diversity. Third, policies must favor
migration flows that contribute to the prosperity of receiving countries and
Introduction 3
guarantee the security of these countries. This last objective could be fulfilled
only with regular migration flows and a stronger focus on managed labor
migration across all skill levels, as well as with integration policies that
address marginalization and segregation.
The costs of badly managed migration are high, and both migrant send-
ing and receiving countries stand to win by adopting proactive and coordi-
nated approaches. Skilled migration can result in “brain drain” and a related
loss of public investments in education and training of skilled labor. Poor
and inefficient education policies, combined with the lack of predeparture
training programs and job counseling for potential migrants, may accentuate
skill mismatch and make the integration into foreign labor markets difficult.
Restrictive labor migration policies may increase the scope for irregular
migration, which is often seen as a risk factor for criminal activities, labor
exploitation, and human rights abuse, while contributing to xenophobia and
social instability in the receiving countries.
This study reviews global demographic trends and related labor force
trends, identifies the main imbalances that are likely to occur (as some regions
experience rapid population aging and shrinking workforces, while others see
a rapidly growing young workforce), and illustrates how these imbalances are
likely to raise pressures for migration. Although the overall analysis under-
scores the fact that labor and job mobility is a global issue requiring global
cooperation, a closer look at the MENA and EU neighborhoods indicates that
both Europe and the MENA Region stand to win from well-managed migra-
tion flows that focus on skills and labor shortages, and that offer opportunities
for return migration as well as for integration in host countries.6 For EU coun-
tries, increased labor mobility offers a way to cope with labor market pressure
and skill shortages and to address the demographic challenges posed by low
fertility rates and an aging population. For sending MENA countries, labor
emigration provides important benefits (household income, foreign exchange
to the country, and risk diversion) and could ease some labor market and polit-
ical pressures related to the demographic strain and the difficulty to generate
enough jobs for its current youth bulge.
The idea of migration as a demographic arbitrage between older and
younger working populations warrants some comments. Demographic pro-
jections are only projections and certainly inexact; in the past, demographic
projections suggested a slower demographic transition for the MENA Region
than what actually occurred. Moreover, this partial equilibrium approach
does not take into account the potential impact of a host of economic and
political factors beyond population growth and structure, including economic
growth, technological change, and labor productivity growth, as well as wage
and labor market flexibility. An improved economic climate in sending coun-
tries favoring investment could mean higher domestic job creation, which in
turn would imply that a larger share of workers could be absorbed at home.
Shaping the Future4
Participation rates are sensitive to economic conditions, however, and may in
fact increase in response to better opportunities, which would raise the
growth of the workforce further. Conversely, because of poor economic con-
ditions, countries with negative working-age population growth still may be
sending migrants abroad, as is happening in some of the former communist
countries. Slow economic growth in receiving countries would moderate
demand for migrants—indeed, sustaining economic growth is a driving fac-
tor for migration in the first place. Finally, outsourcing and more liberal trade
policies toward developing countries (agricultural policies being a prime
example) could facilitate job creation and economic growth in sending coun-
tries and reduce demand for labor in receiving countries.
All these caveats apply to the analysis that follows. However, the scenarios
presented below suggest that some migration pressures will arise in the future
under reasonable assumptions of demographic and economic developments.
A more comprehensive approach using a dynamic general equilibrium frame-
work to capture demographic, economic, and technological changes needs to be
developed and should be updated every 5 to 10 years. Such an approach would
allow a better understanding of the future outlooks and guide policy makers in
their positioning with respect to the mobility of labor and jobs in global markets.
The demographic and labor demand perspective applied here excludes
other types of migration. The most obvious exclusion is human rights–related
migration—including asylum and refugees who migrate to avoid political
instability or persecution. Moreover, although the study takes a long-term
view, it does not include other global developments that could give rise to
higher migration, including climate change and the potentially huge impact
of an increasing incidence of water scarcity and natural disasters. Finally, for
the more immediate future, high and rising international food prices present
a high risk for MENA countries, which on average are net importers of food
and for which consumption vulnerability—here meaning the risk of falling
into poverty—is high. In the absence of safety nets, increased poverty because
of higher food prices could contribute to increased migration flows. The
impact of food prices on the domestic agricultural sectors, land value, and
agricultural employment remains to be seen.
The objective of this study is to provide a long-term perspective for the
ongoing policy dialogue on the management of labor migration in Europe
and the MENA countries. It is organized as follows. Chapter 1 puts the report
and migration in the context of the economic and social development in
MENA countries. Chapter 2 provides the historical context of MENA migra-
tion patterns and an overview of the presence and skill characteristics of
migrants in OECD countries today. This chapter also discusses the potential for
insourcing—that is, migration of jobs into the region—as an alternative or
complement to labor migration. Chapter 3 analyzes the demand and supply
framework for migration, the determinants of migration patterns, the potential
Introduction 5
demand for labor in the EU, and the characteristics and trends of MENA labor
supply. Chapter 4 looks to the worldwide impact of demographic and labor
force developments in the decades ahead and their implications on labor and
job mobility. The chapter analyzes the likely population and labor force growth
in Europe and MENA, the challenges this growth poses, and the scope for
demographic arbitrage between the two regions. This chapter provides the basis
for the fifth and concluding chapter. Chapter 5 covers the institutional setup
and the various economic and social protection policies and practices world-
wide that have a strong and positive bearing on migration flows and presents a
conceptual framework on both the labor and job sending and receiving sides
that can be used by policy makers to articulate, defend, and implement a collab-
orative approach to the challenges ahead.
Against the backdrop of this ambitious agenda, the study of migration is
handicapped by serious data limitations, as confirmed by nearly all studies
and researchers. These difficulties permeate all aspects of the subject, includ-
ing migrant stocks and characteristics, migrant flows, remittances, and others.
Some of these problems are more acute in the case of MENA, but they are by
no means limited to the region, the nearly universal problem of unrecorded
migrants being a prime example. These problems hinder in particular cross-
country comparisons but pose a lesser difficulty here, where the concern is
focused on long-term trends for the region as a whole.
Finally, this study heavily draws on the background papers and to a greater
extent than the specific references to them may suggest.
People and Job Migration: The Stakes for the MENA Region
After independence and up until the early 1980s, Middle East and North
Africa (MENA) countries7 followed a model of state-led development. This
development included nationalization of private assets, state planning of eco-
nomic activities, and industrial development through protected local markets.
Wealth was redistributed through public expenditures directed at social devel-
opment and large-scale public sector employment. Financed by oil revenues
in oil-producing countries, loans and grants from oil producers to nonoil pro-
ducers and international aid, and helped by remittances from workers in oil-
producing countries, this development model initially served the region well.
The period was marked by fast growth (on average 3.6 percent a year in GDP
per capita between 1965 and 1980), a sharp fall in poverty, large education
gains (average education level for the adult population rose from less than one
year in 1960 to three years by 1980), and impressive improvements in health
indicators (reductions in maternal mortality and declines in fertility, a halving
of infant mortality rates, and increase in life expectancy—up to 62 years from
47 at the beginning of the period).
Shaping the Future6
Over the longer run, however, this development model also proved costly.
A dramatic expansion in the scale of the public sector, a stifled demand for
accountability, highly regulated labor markets, repressed financial sectors, and
inward-looking and heavily protected industries constrained MENA countries’
ability to adjust to a changing global environment when oil prices collapsed in
the mid-1980s. Macroeconomic imbalances emerged rapidly, and the state-led
model, which depended on oil, aid, and labor remittances, could not keep up
with labor force growth, as all three sources declined.
During the 1990s, macroeconomic stability was largely achieved in most
countries, as evidenced by improved fiscal and external balances and low and
falling inflation. Despite efforts to restructure and integrate into the global
economy across the region, however, the public sector continued to dominate
economic activity. The pace and depth of second-generation reforms aimed
at trade, labor markets, privatization, deregulation, and competition
remained by and large modest and structural reform remained incomplete in
most countries. Excessive and costly regulation stifled the development of a
dynamic private sector and constrained the region’s ability to create jobs for
a growing labor force.
Between 2000 and 2007, sustained increases in oil prices, together with
progress on economic reforms, has raised economic growth in the MENA
Region. The region experienced its strongest per capita growth since the oil
boom of the 1970s. Largely, higher growth rates reflected developments in
the buoyant oil-exporting economies. Overall, these countries have managed
their growing wealth prudently, sustaining high fiscal surpluses, building up
reserves, and paying off government debt. Heightened competition from
Asia and declining European demand has encouraged poorer oil-importing
economies to remove obstacles to export-led growth. Almost all countries,
but especially oil importers, have taken significant steps to reduce impedi-
ments to trade and to anchor their economies in the global market. Reforms
aimed at improving the overall investment climate and enhance governance
have been implemented in several countries, including service sector liberal-
ization as well as judiciary, anticorruption, and civil service reform.
Oil-importing countries have experienced regionwide positive spillovers
from the oil bonanza, in the form of increased labor remittances, foreign direct
and portfolio investment, tourism receipts, and aid—the share of foreign direct
investment (FDI) in GDP, for example, has more than doubled in oil-importing
countries since the end of the 1990s. However, high oil prices directly took a sig-
nificant toll on oil-importing countries, where growth generally has been
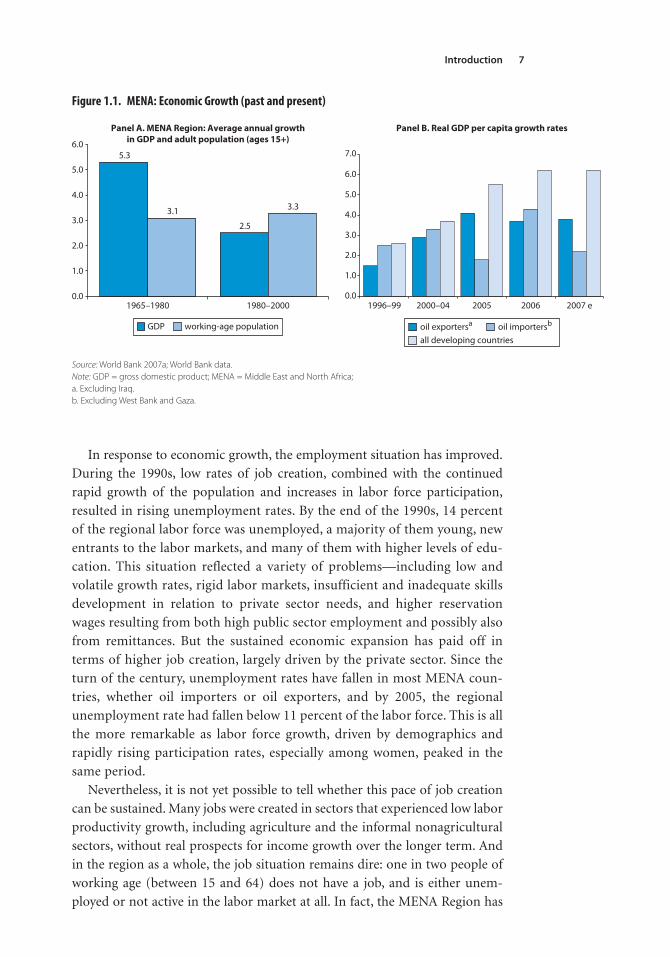
respectable but more modest over the past years. Moreover, GDP growth is not
keeping up with the growth of the labor force and the gap between MENA’s per
capita growth rate and those of other developing countries is far from closed
(see figure 1.1). Finally, oil-importing countries remain especially vulnerable
because of the recent global slowdown following the U.S. subprime mortgage
crisis and the fiscal implications of rising food prices.
Introduction 7
In response to economic growth, the employment situation has improved.
During the 1990s, low rates of job creation, combined with the continued
rapid growth of the population and increases in labor force participation,
resulted in rising unemployment rates. By the end of the 1990s, 14 percent
of the regional labor force was unemployed, a majority of them young, new
entrants to the labor markets, and many of them with higher levels of edu-
cation. This situation reflected a variety of problems—including low and
volatile growth rates, rigid labor markets, insufficient and inadequate skills
development in relation to private sector needs, and higher reservation
wages resulting from both high public sector employment and possibly also
from remittances. But the sustained economic expansion has paid off in
terms of higher job creation, largely driven by the private sector. Since the
turn of the century, unemployment rates have fallen in most MENA coun-
tries, whether oil importers or oil exporters, and by 2005, the regional
unemployment rate had fallen below 11 percent of the labor force. This is all
the more remarkable as labor force growth, driven by demographics and
rapidly rising participation rates, especially among women, peaked in the
same period.
Nevertheless, it is not yet possible to tell whether this pace of job creation
can be sustained. Many jobs were created in sectors that experienced low labor
productivity growth, including agriculture and the informal nonagricultural
sectors, without real prospects for income growth over the longer term. And
in the region as a whole, the job situation remains dire: one in two people of
working age (between 15 and 64) does not have a job, and is either unem-
ployed or not active in the labor market at all. In fact, the MENA Region has
0.0
1.0
2.0
3.0
4.0
5.0
6.0
7.0
1996–99 2000–04 2005 2006 2007 e
5.3
2.5
3.1 3.3
0.0
1.0
2.0
3.0
4.0
5.0
6.0
Panel A. MENA Region: Average annual growthin GDP and adult population (ages 15+)
Panel B. Real GDP per capita growth rates
1980–20001965–1980
oil exportersa oil importersb
all developing countriesGDP working-age population
Figure 1.1. MENA: Economic Growth (past and present)
Source: World Bank 2007a; World Bank data. Note: GDP = gross domestic product; MENA = Middle East and North Africa;a. Excluding Iraq.b. Excluding West Bank and Gaza.
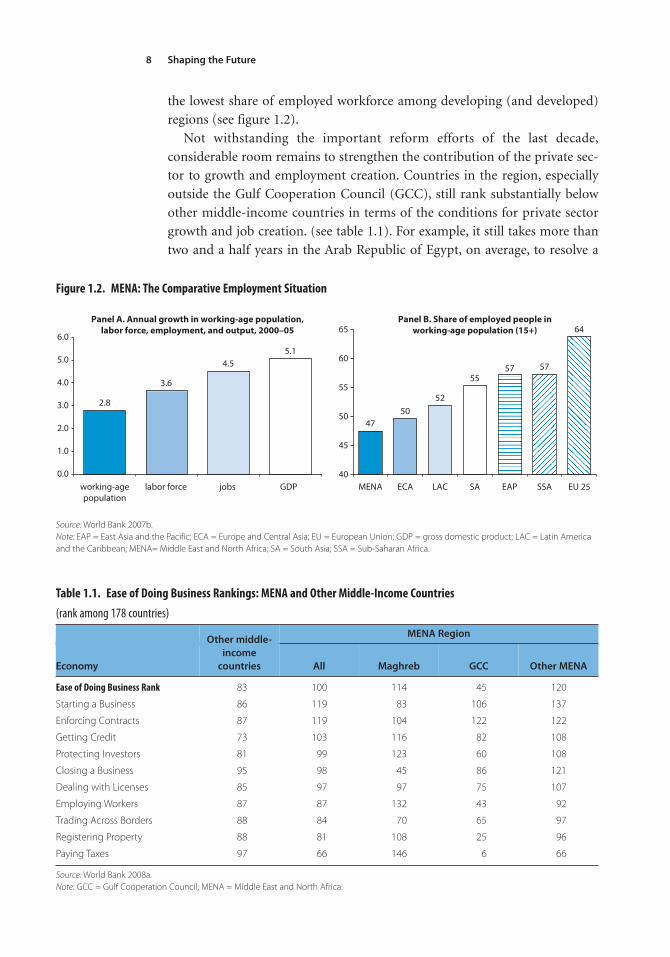
Shaping the Future8
the lowest share of employed workforce among developing (and developed)
regions (see figure 1.2).
Not withstanding the important reform efforts of the last decade,
considerable room remains to strengthen the contribution of the private sec-
tor to growth and employment creation. Countries in the region, especially
outside the Gulf Cooperation Council (GCC), still rank substantially below
other middle-income countries in terms of the conditions for private sector
growth and job creation. (see table 1.1). For example, it still takes more than
two and a half years in the Arab Republic of Egypt, on average, to resolve a
2.8
3.6
4.55.1
0.0
1.0
2.0
3.0
4.0
5.0
6.0
Panel A. Annual growth in working-age population,labor force, employment, and output, 2000–05
Panel B. Share of employed people inworking-age population (15+)
working-agepopulation
labor force jobs GDP
4750
52
5557 57
64
40
45
50
55
60
65
MENA ECA LAC SA EAP SSA EU 25
Figure 1.2. MENA: The Comparative Employment Situation
Source: World Bank 2007b.Note: EAP = East Asia and the Pacific; ECA = Europe and Central Asia; EU = European Union; GDP = gross domestic product; LAC = Latin Americaand the Caribbean; MENA= Middle East and North Africa; SA = South Asia; SSA = Sub-Saharan Africa.
Table 1.1. Ease of Doing Business Rankings: MENA and Other Middle-Income Countries
(rank among 178 countries)
Other middle-
income
countries
MENA Region
Economy All Maghreb GCC Other MENA
Ease of Doing Business Rank 83 100 114 45 120
Starting a Business 86 119 83 106 137
Enforcing Contracts 87 119 104 122 122
Getting Credit 73 103 116 82 108
Protecting Investors 81 99 123 60 108
Closing a Business 95 98 45 86 121
Dealing with Licenses 85 97 97 75 107
Employing Workers 87 87 132 43 92
Trading Across Borders 88 84 70 65 97
Registering Property 88 81 108 25 96
Paying Taxes 97 66 146 6 66
Source: World Bank 2008a. Note: GCC = Gulf Cooperation Council; MENA = Middle East and North Africa.
Introduction 9
contractual dispute; in Maghreb countries, tax payments absorb between 6 to
12 working weeks of entrepreneurs’ time annually, and in a majority of MENA
countries, more than 10 different procedures are required to start a business.8
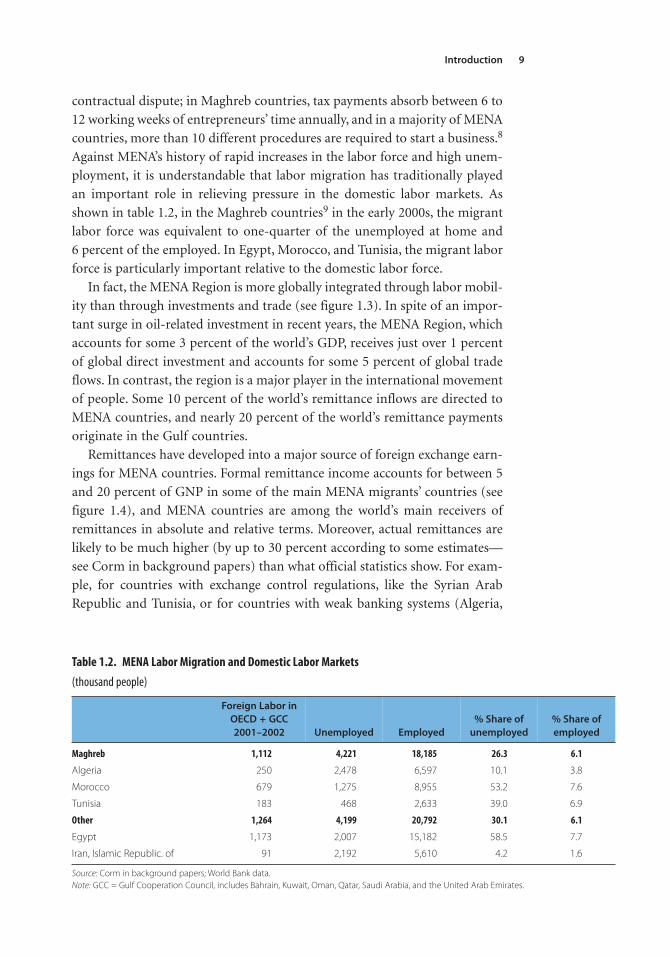
Against MENA’s history of rapid increases in the labor force and high unem-
ployment, it is understandable that labor migration has traditionally played
an important role in relieving pressure in the domestic labor markets. As
shown in table 1.2, in the Maghreb countries9 in the early 2000s, the migrant
labor force was equivalent to one-quarter of the unemployed at home and
6 percent of the employed. In Egypt, Morocco, and Tunisia, the migrant labor
force is particularly important relative to the domestic labor force.
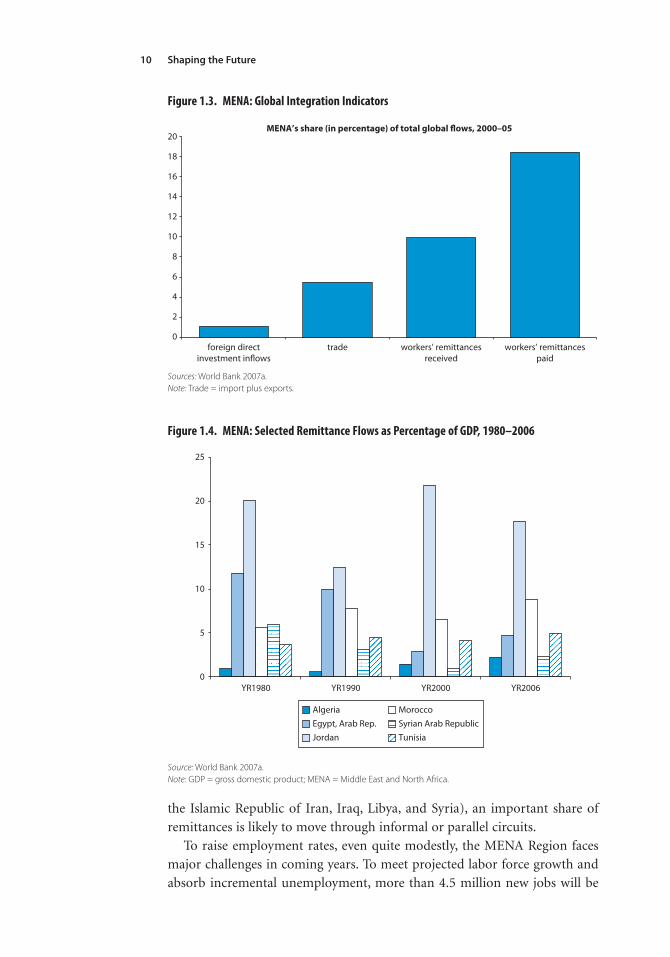
In fact, the MENA Region is more globally integrated through labor mobil-
ity than through investments and trade (see figure 1.3). In spite of an impor-
tant surge in oil-related investment in recent years, the MENA Region, which
accounts for some 3 percent of the world’s GDP, receives just over 1 percent
of global direct investment and accounts for some 5 percent of global trade
flows. In contrast, the region is a major player in the international movement
of people. Some 10 percent of the world’s remittance inflows are directed to
MENA countries, and nearly 20 percent of the world’s remittance payments
originate in the Gulf countries.
Remittances have developed into a major source of foreign exchange earn-
ings for MENA countries. Formal remittance income accounts for between 5
and 20 percent of GNP in some of the main MENA migrants’ countries (see
figure 1.4), and MENA countries are among the world’s main receivers of
remittances in absolute and relative terms. Moreover, actual remittances are
likely to be much higher (by up to 30 percent according to some estimates—
see Corm in background papers) than what official statistics show. For exam-
ple, for countries with exchange control regulations, like the Syrian Arab
Republic and Tunisia, or for countries with weak banking systems (Algeria,
Table 1.2. MENA Labor Migration and Domestic Labor Markets
(thousand people)
Foreign Labor in
OECD + GCC
2001–2002 Unemployed Employed
% Share of
unemployed
% Share of
employed
Maghreb 1,112 4,221 18,185 26.3 6.1
Algeria 250 2,478 6,597 10.1 3.8
Morocco 679 1,275 8,955 53.2 7.6
Tunisia 183 468 2,633 39.0 6.9
Other 1,264 4,199 20,792 30.1 6.1
Egypt 1,173 2,007 15,182 58.5 7.7
Iran, Islamic Republic. of 91 2,192 5,610 4.2 1.6
Source: Corm in background papers; World Bank data. Note: GCC = Gulf Cooperation Council, includes Bahrain, Kuwait, Oman, Qatar, Saudi Arabia, and the United Arab Emirates.
Shaping the Future10
the Islamic Republic of Iran, Iraq, Libya, and Syria), an important share of
remittances is likely to move through informal or parallel circuits.
To raise employment rates, even quite modestly, the MENA Region faces
major challenges in coming years. To meet projected labor force growth and
absorb incremental unemployment, more than 4.5 million new jobs will be
0
2
4
6
8
10
12
14
16
18
20
foreign directinvestment inflows
trade
MENA’s share (in percentage) of total global flows, 2000–05
workers’ remittancesreceived
workers’ remittancespaid
Figure 1.3. MENA: Global Integration Indicators
Sources: World Bank 2007a. Note: Trade = import plus exports.
0
5
10
15
20
25
YR1980 YR1990 YR2000 YR2006
Algeria MoroccoEgypt, Arab Rep. Syrian Arab RepublicJordan Tunisia
Figure 1.4. MENA: Selected Remittance Flows as Percentage of GDP, 1980–2006
Source: World Bank 2007a.Note: GDP = gross domestic product; MENA = Middle East and North Africa.

Introduction 11
needed every year for the next 15 years.10 Most of these jobs must clearly be
home grown and arise from higher job creation, in tandem with some pro-
ductivity improvements. But global demand for labor offers important and
complementary job opportunities for MENA’s populations, in the form of
labor mobility (international migration within and outside the region) and
the newer phenomenon of job mobility (outsourcing and offshoring activities
in the region). Moreover, these additional opportunities must be integrated in
the region’s long-term growth and job creation strategy. Economic reforms
that foster domestic job creation are likely to maximize the benefits from
labor migration as well, while attracting FDI and outsourcing opportunities
from outside the region.
The remainder of the report focuses on the MENA Region’s global employ-
ment opportunities. With new technology and higher economic integration,
labor markets stand to become more integrated. Workers can seize job oppor-
tunities abroad by migrating, or jobs can move to areas where workers are
available. Although the report emphasizes labor migration, which remains the
main form of labor-related mobility on the global market, job mobility (or
outsourcing)—a more recent but highly promising trend for skilled labor—is
also discussed.
Notes
1. See Auerbach, Kotlikoff, Hagemann, and Nicoletti 1989.
2. OECD 2008.
3. IMF 2006.
4. World Bank 2006. The underlying assumptions for the modeling exercise were as follows: wages are
flexible, old and new migrants are perfectly substitutable, both old and new migrants are mostly
unskilled, native and migrant unskilled labor are not perfect substitutes, unskilled labor is a substitute
for capital and skilled labor, and skilled labor is a near complement with capital.
5. In addition, general equilibrium effects will be at play—because the cost of capital increases, rela-
tive demand for (goods that are intensive in) low-skilled labor will increase, which in turn will favor
wages for the less-skilled workers.
6. See Diwan, Johansson de Silva, Nabli, and Coulibali 2005; Holzmann and Münz 2004; and Katseli,
Lucas, and Xenogiani 2007.
7. Algeria, Bahrain, Djibouti, the Arab Republic of Egypt, the Islamic Republic of Iran, Iraq, Jordan,
Kuwait, Lebanon, Libya, Malta, Morocco, Oman, Qatar, Saudi Arabia, the Syrian Arab Republic,
Tunisia, the United Arab Emirates, West Bank and Gaza, and the Republic of Yemen.
8. World Bank 2008a.
9. The Maghreb also includes Libya, which is not shown separately in table 1.2.
10. World Bank 2007.

13
People and Job Mobility
in the MENA Region
2
Labor Migration Out of MENA
Evolution of MENA Migration1
The MENA Region has a long history of migration, related to the growth of
Islam, trade, and tribal pastoralism, as well as war and conflict; however, the
region’s population experienced a period of relative stability from the sixteenth
century to the mid-1960s. Arab and Berber invasion of the Iberian Peninsula
in the eighth century, and the expansion of the Ottoman Empire in the fifteenth
and sixteenth centuries, are examples of events that resulted in important
population movements and constantly changing geographic and economic
borders in the region and its neighborhood. After the sixteenth century, how-
ever, at a time when Europe began out-migration to the Americas, migratory
movements in the MENA Region were limited and consisted mainly of immi-
gration by refugees from neighboring areas (for example, the Caucasus) and
European colonial settlers. Lebanon constituted an important exception; dur-
ing the mid-1850s, France and Great Britain fought for the control of the
province, which led to the first waves of migration from Lebanon to North
and South America. In more recent times, the main migratory flows have been
directed toward the European continent and the oil-producing countries in
the Persian Gulf.
The 1960s to the mid-1970s saw massive labor emigration from the
Maghreb and Turkey to Europe. After World War II, during the “three glori-
ous decades” (1945–75), economies in Western Europe were in their recon-
struction phase and enjoyed high growth rates. Because of relatively high
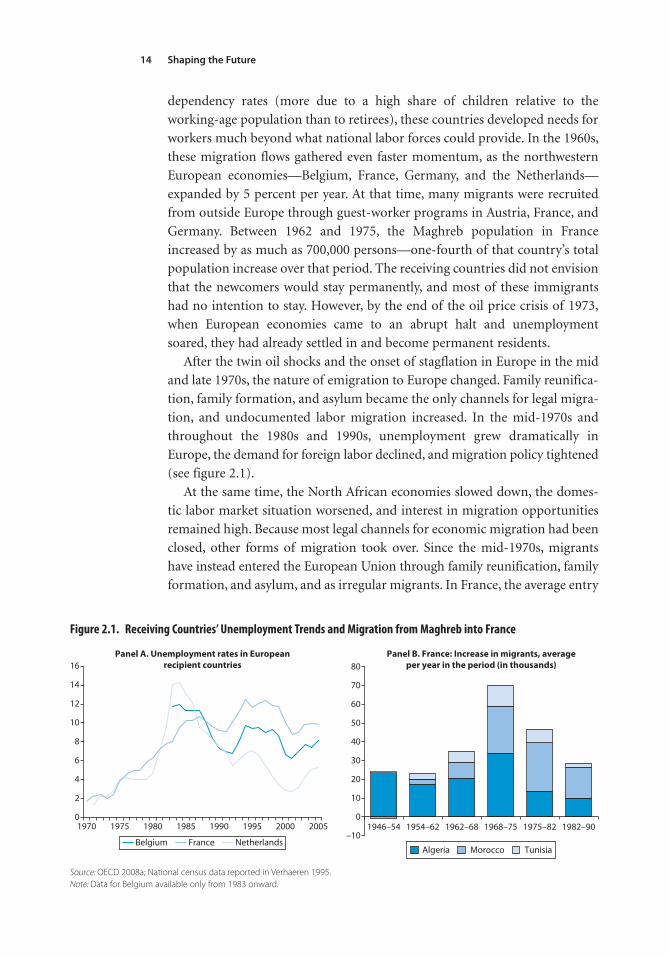
Shaping the Future14
dependency rates (more due to a high share of children relative to the
working-age population than to retirees), these countries developed needs for
workers much beyond what national labor forces could provide. In the 1960s,
these migration flows gathered even faster momentum, as the northwestern
European economies—Belgium, France, Germany, and the Netherlands—
expanded by 5 percent per year. At that time, many migrants were recruited
from outside Europe through guest-worker programs in Austria, France, and
Germany. Between 1962 and 1975, the Maghreb population in France
increased by as much as 700,000 persons—one-fourth of that country’s total
population increase over that period. The receiving countries did not envision
that the newcomers would stay permanently, and most of these immigrants
had no intention to stay. However, by the end of the oil price crisis of 1973,
when European economies came to an abrupt halt and unemployment
soared, they had already settled in and become permanent residents.
After the twin oil shocks and the onset of stagflation in Europe in the mid
and late 1970s, the nature of emigration to Europe changed. Family reunifica-
tion, family formation, and asylum became the only channels for legal migra-
tion, and undocumented labor migration increased. In the mid-1970s and
throughout the 1980s and 1990s, unemployment grew dramatically in
Europe, the demand for foreign labor declined, and migration policy tightened
(see figure 2.1).
At the same time, the North African economies slowed down, the domes-
tic labor market situation worsened, and interest in migration opportunities
remained high. Because most legal channels for economic migration had been
closed, other forms of migration took over. Since the mid-1970s, migrants
have instead entered the European Union through family reunification, family
formation, and asylum, and as irregular migrants. In France, the average entry
0
2
4
6
8
10
12
14
16Panel A. Unemployment rates in European
recipient countriesPanel B. France: Increase in migrants, average
per year in the period (in thousands)
–10
0
10
20
30
40
50
60
70
80
1970 1975 1980 1985 1990 1995 2000 2005 1946–54 1954–62 1962–68 1968–75 1975–82 1982–90
Belgium France NetherlandsAlgeria Morocco Tunisia
Figure 2.1. Receiving Countries’ Unemployment Trends and Migration from Maghreb into France
Source: OECD 2008a; National census data reported in Verhaeren 1995. Note: Data for Belgium available only from 1983 onward.
People and Job Mobility in the MENA Region 15
of Maghreb migrants fell from around 70,000 per year in the mid-1970s, to
less than half that amount in the 1980s.
When legal options for labor migration diminished, the main direction of
North African economic migration shifted from Northern Europe to the
Southern European countries. In particular, Italy and Spain, formerly
exporters of labor to Northern and Continental Europe, became increasingly
attractive to North African migrants, as their income levels have increased and
converged with those of the northern countries, and their demand for low-
skilled labor increased (the sustained economic boom in Spain provided a
particularly strong pulling force). Their long coastlines along the Mediterranean
have provided easier access to Europe for undocumented migrants from
North Africa and Sub-Saharan Africa (SSA), as well as for Asian migrants who
use the North African countries as transit ports on their way to Europe.
The MENA migrants’ characteristics changed as a result of transformations
in the region and changing migration policies in receiving countries. The move
from active recruitment of labor to family reunification and formation
changed the type of migrants who arrive in Europe (for example, more women
migrate than men and, partly as a consequence, more inactive persons are
among them). In MENA countries, the constant increase in education oppor-
tunities, unmatched by job opportunities, has resulted in higher levels of edu-
cation among new cohorts (although, as will be discussed below, MENA
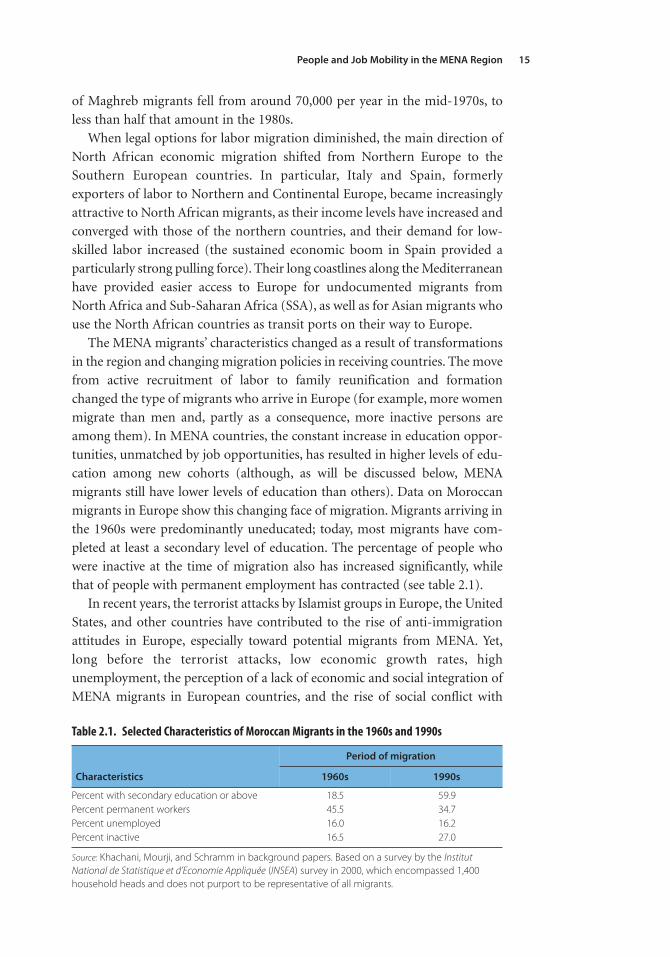
migrants still have lower levels of education than others). Data on Moroccan
migrants in Europe show this changing face of migration. Migrants arriving in
the 1960s were predominantly uneducated; today, most migrants have com-
pleted at least a secondary level of education. The percentage of people who
were inactive at the time of migration also has increased significantly, while
that of people with permanent employment has contracted (see table 2.1).
In recent years, the terrorist attacks by Islamist groups in Europe, the United
States, and other countries have contributed to the rise of anti-immigration
attitudes in Europe, especially toward potential migrants from MENA. Yet,
long before the terrorist attacks, low economic growth rates, high
unemployment, the perception of a lack of economic and social integration of
MENA migrants in European countries, and the rise of social conflict with
Table 2.1. Selected Characteristics of Moroccan Migrants in the 1960s and 1990s
Characteristics
Period of migration
1960s 1990s
Percent with secondary education or above 18.5 59.9Percent permanent workers 45.5 34.7Percent unemployed 16.0 16.2Percent inactive 16.5 27.0
Source: Khachani, Mourji, and Schramm in background papers. Based on a survey by the InstitutNational de Statistique et d’Economie Appliquée (INSEA) survey in 2000, which encompassed 1,400household heads and does not purport to be representative of all migrants.
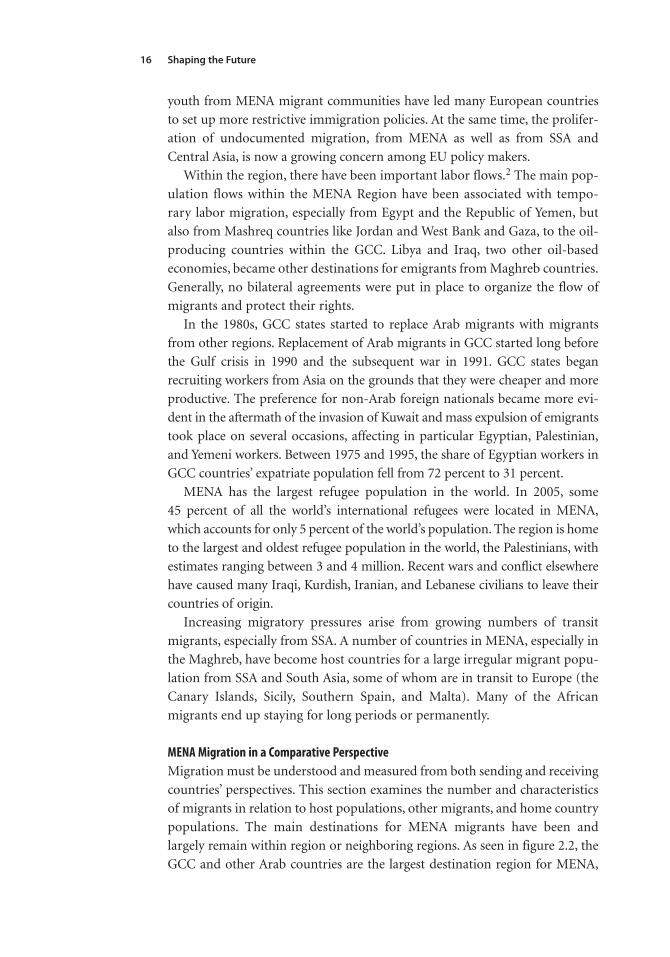
Shaping the Future16
youth from MENA migrant communities have led many European countries
to set up more restrictive immigration policies. At the same time, the prolifer-
ation of undocumented migration, from MENA as well as from SSA and
Central Asia, is now a growing concern among EU policy makers.
Within the region, there have been important labor flows.2 The main pop-
ulation flows within the MENA Region have been associated with tempo-
rary labor migration, especially from Egypt and the Republic of Yemen, but
also from Mashreq countries like Jordan and West Bank and Gaza, to the oil-
producing countries within the GCC. Libya and Iraq, two other oil-based
economies, became other destinations for emigrants from Maghreb countries.
Generally, no bilateral agreements were put in place to organize the flow of
migrants and protect their rights.
In the 1980s, GCC states started to replace Arab migrants with migrants
from other regions. Replacement of Arab migrants in GCC started long before
the Gulf crisis in 1990 and the subsequent war in 1991. GCC states began
recruiting workers from Asia on the grounds that they were cheaper and more
productive. The preference for non-Arab foreign nationals became more evi-
dent in the aftermath of the invasion of Kuwait and mass expulsion of emigrants
took place on several occasions, affecting in particular Egyptian, Palestinian,
and Yemeni workers. Between 1975 and 1995, the share of Egyptian workers in
GCC countries’ expatriate population fell from 72 percent to 31 percent.
MENA has the largest refugee population in the world. In 2005, some
45 percent of all the world’s international refugees were located in MENA,
which accounts for only 5 percent of the world’s population. The region is home
to the largest and oldest refugee population in the world, the Palestinians, with
estimates ranging between 3 and 4 million. Recent wars and conflict elsewhere
have caused many Iraqi, Kurdish, Iranian, and Lebanese civilians to leave their
countries of origin.
Increasing migratory pressures arise from growing numbers of transit
migrants, especially from SSA. A number of countries in MENA, especially in
the Maghreb, have become host countries for a large irregular migrant popu-
lation from SSA and South Asia, some of whom are in transit to Europe (the
Canary Islands, Sicily, Southern Spain, and Malta). Many of the African
migrants end up staying for long periods or permanently.
MENA Migration in a Comparative PerspectiveMigration must be understood and measured from both sending and receiving
countries’ perspectives. This section examines the number and characteristics
of migrants in relation to host populations, other migrants, and home country
populations. The main destinations for MENA migrants have been and
largely remain within region or neighboring regions. As seen in figure 2.2, the
GCC and other Arab countries are the largest destination region for MENA,
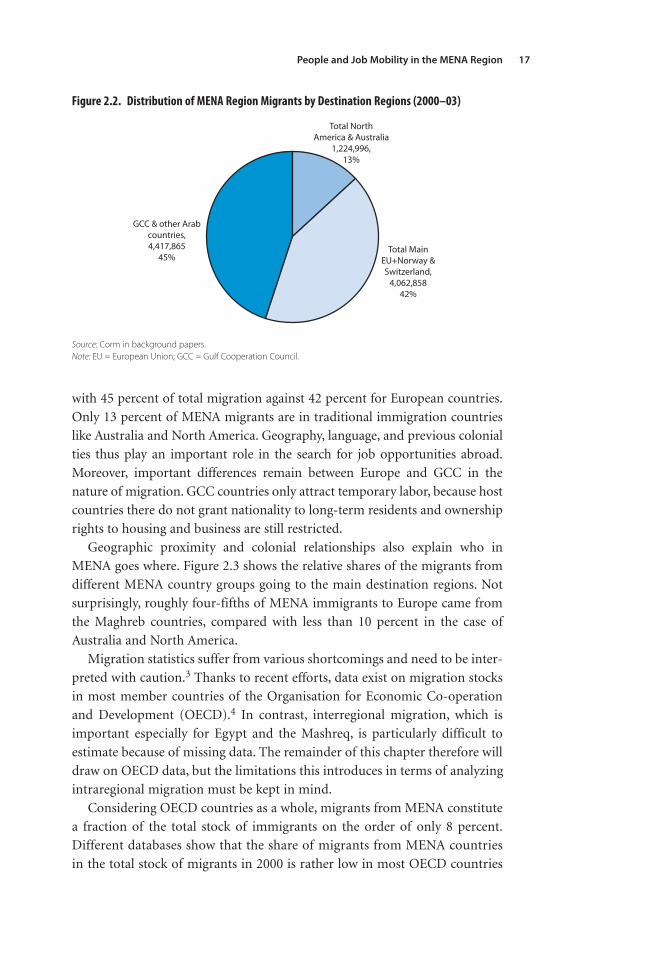
People and Job Mobility in the MENA Region 17
with 45 percent of total migration against 42 percent for European countries.
Only 13 percent of MENA migrants are in traditional immigration countries
like Australia and North America. Geography, language, and previous colonial
ties thus play an important role in the search for job opportunities abroad.
Moreover, important differences remain between Europe and GCC in the
nature of migration. GCC countries only attract temporary labor, because host
countries there do not grant nationality to long-term residents and ownership
rights to housing and business are still restricted.
Geographic proximity and colonial relationships also explain who in
MENA goes where. Figure 2.3 shows the relative shares of the migrants from
different MENA country groups going to the main destination regions. Not
surprisingly, roughly four-fifths of MENA immigrants to Europe came from
the Maghreb countries, compared with less than 10 percent in the case of
Australia and North America.
Migration statistics suffer from various shortcomings and need to be inter-
preted with caution.3 Thanks to recent efforts, data exist on migration stocks
in most member countries of the Organisation for Economic Co-operation
and Development (OECD).4 In contrast, interregional migration, which is
important especially for Egypt and the Mashreq, is particularly difficult to
estimate because of missing data. The remainder of this chapter therefore will
draw on OECD data, but the limitations this introduces in terms of analyzing
intraregional migration must be kept in mind.
Considering OECD countries as a whole, migrants from MENA constitute
a fraction of the total stock of immigrants on the order of only 8 percent.
Different databases show that the share of migrants from MENA countries
in the total stock of migrants in 2000 is rather low in most OECD countries
GCC & other Arabcountries,4,417,865
45%
Total NorthAmerica & Australia
1,224,996,13%
Total MainEU+Norway &Switzerland,
4,062,85842%
Figure 2.2. Distribution of MENA Region Migrants by Destination Regions (2000–03)
Source: Corm in background papers. Note: EU = European Union; GCC = Gulf Cooperation Council.
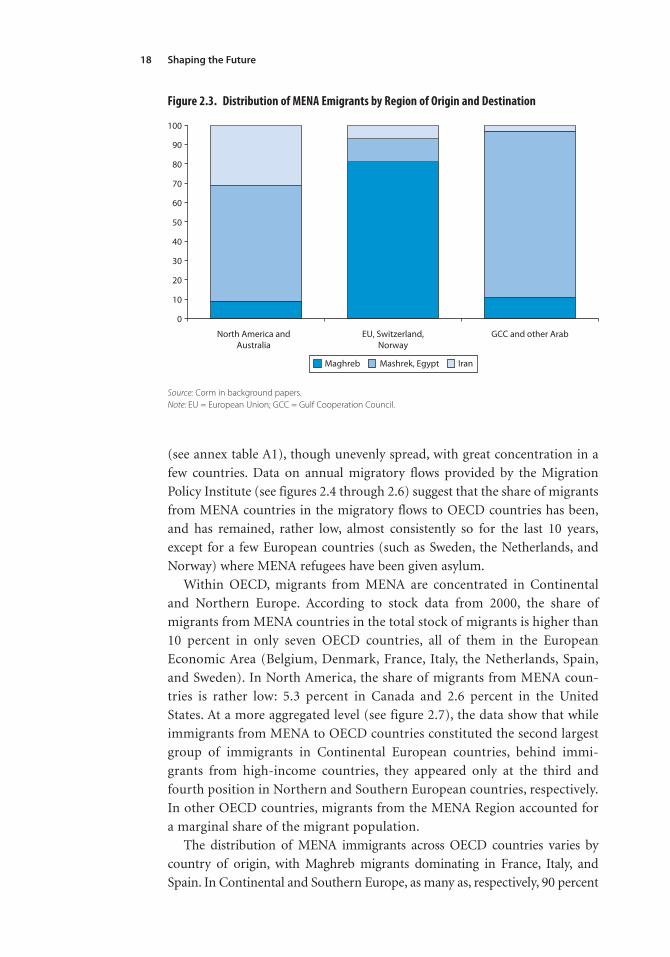
Shaping the Future18
(see annex table A1), though unevenly spread, with great concentration in a
few countries. Data on annual migratory flows provided by the Migration
Policy Institute (see figures 2.4 through 2.6) suggest that the share of migrants
from MENA countries in the migratory flows to OECD countries has been,
and has remained, rather low, almost consistently so for the last 10 years,
except for a few European countries (such as Sweden, the Netherlands, and
Norway) where MENA refugees have been given asylum.
Within OECD, migrants from MENA are concentrated in Continental
and Northern Europe. According to stock data from 2000, the share of
migrants from MENA countries in the total stock of migrants is higher than
10 percent in only seven OECD countries, all of them in the European
Economic Area (Belgium, Denmark, France, Italy, the Netherlands, Spain,
and Sweden). In North America, the share of migrants from MENA coun-
tries is rather low: 5.3 percent in Canada and 2.6 percent in the United
States. At a more aggregated level (see figure 2.7), the data show that while
immigrants from MENA to OECD countries constituted the second largest
group of immigrants in Continental European countries, behind immi-
grants from high-income countries, they appeared only at the third and
fourth position in Northern and Southern European countries, respectively.
In other OECD countries, migrants from the MENA Region accounted for
a marginal share of the migrant population.
The distribution of MENA immigrants across OECD countries varies by
country of origin, with Maghreb migrants dominating in France, Italy, and
Spain. In Continental and Southern Europe, as many as, respectively, 90 percent
0
10
20
30
40
50
60
70
80
90
100
North America andAustralia
EU, Switzerland,Norway
GCC and other Arab
Maghreb Mashrek, Egypt Iran
Figure 2.3. Distribution of MENA Emigrants by Region of Origin and Destination
Source: Corm in background papers. Note: EU = European Union; GCC = Gulf Cooperation Council.
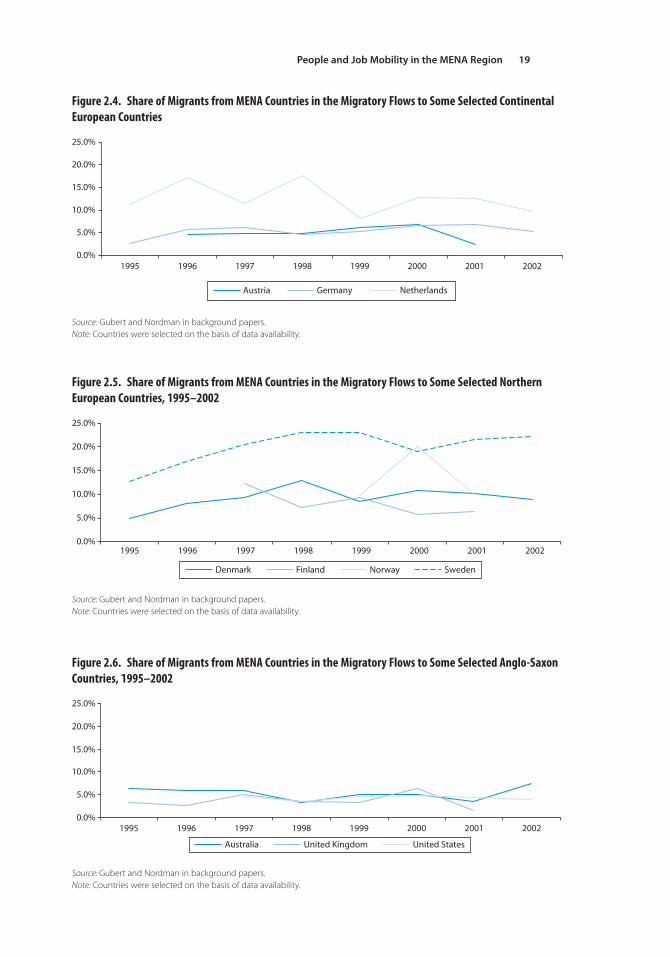
People and Job Mobility in the MENA Region 19
0.0%
5.0%
10.0%
15.0%
20.0%
25.0%
1995 1996 1997 1998 1999 2000 2001 2002
Austria Germany Netherlands
Figure 2.4. Share of Migrants from MENA Countries in the Migratory Flows to Some Selected ContinentalEuropean Countries
Source: Gubert and Nordman in background papers. Note: Countries were selected on the basis of data availability.
0.0%
5.0%
10.0%
15.0%
20.0%
25.0%
1995 1996 1997 1998 1999 2000 2001 2002
Denmark Finland Norway Sweden
Figure 2.5. Share of Migrants from MENA Countries in the Migratory Flows to Some Selected NorthernEuropean Countries, 1995–2002
Source: Gubert and Nordman in background papers. Note: Countries were selected on the basis of data availability.
0.0%
5.0%
10.0%
15.0%
20.0%
25.0%
1995 1996 1997 1998 1999 2000 2001 2002
United StatesAustralia United Kingdom
Figure 2.6. Share of Migrants from MENA Countries in the Migratory Flows to Some Selected Anglo-SaxonCountries, 1995–2002
Source: Gubert and Nordman in background papers. Note: Countries were selected on the basis of data availability.
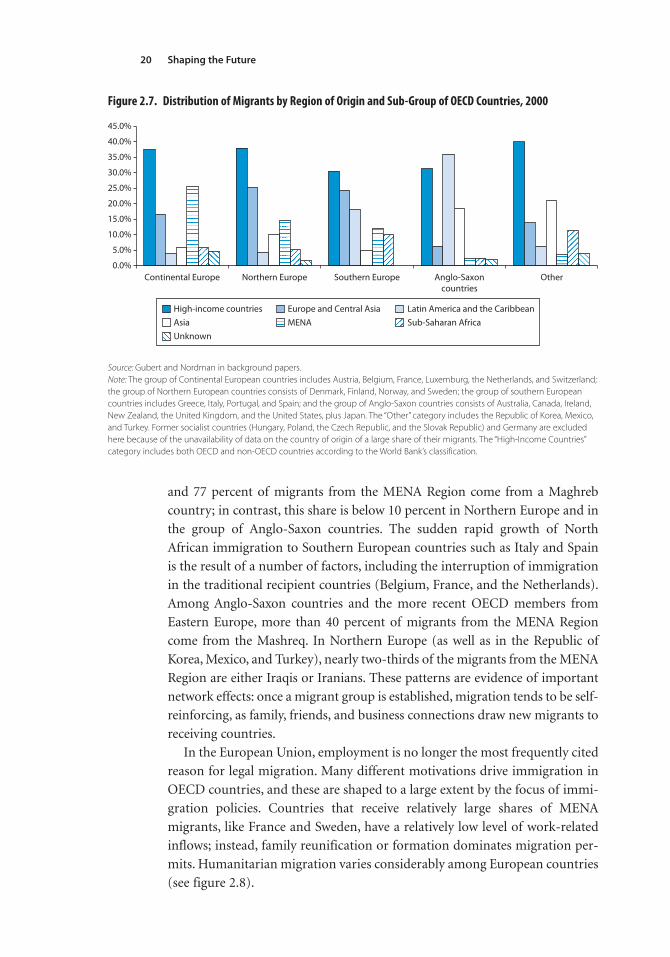
Shaping the Future20
and 77 percent of migrants from the MENA Region come from a Maghreb
country; in contrast, this share is below 10 percent in Northern Europe and in
the group of Anglo-Saxon countries. The sudden rapid growth of North
African immigration to Southern European countries such as Italy and Spain
is the result of a number of factors, including the interruption of immigration
in the traditional recipient countries (Belgium, France, and the Netherlands).
Among Anglo-Saxon countries and the more recent OECD members from
Eastern Europe, more than 40 percent of migrants from the MENA Region
come from the Mashreq. In Northern Europe (as well as in the Republic of
Korea, Mexico, and Turkey), nearly two-thirds of the migrants from the MENA
Region are either Iraqis or Iranians. These patterns are evidence of important
network effects: once a migrant group is established, migration tends to be self-
reinforcing, as family, friends, and business connections draw new migrants to
receiving countries.
In the European Union, employment is no longer the most frequently cited
reason for legal migration. Many different motivations drive immigration in
OECD countries, and these are shaped to a large extent by the focus of immi-
gration policies. Countries that receive relatively large shares of MENA
migrants, like France and Sweden, have a relatively low level of work-related
inflows; instead, family reunification or formation dominates migration per-
mits. Humanitarian migration varies considerably among European countries
(see figure 2.8).
0.0%
5.0%
10.0%
15.0%
20.0%
25.0%
30.0%
35.0%
40.0%
45.0%
Continental Europe Northern Europe Southern Europe Anglo-Saxoncountries
Other
High-income countriesAsiaUnknown
Europe and Central AsiaMENA
Latin America and the CaribbeanSub-Saharan Africa
Figure 2.7. Distribution of Migrants by Region of Origin and Sub-Group of OECD Countries, 2000
Source: Gubert and Nordman in background papers.Note: The group of Continental European countries includes Austria, Belgium, France, Luxemburg, the Netherlands, and Switzerland;the group of Northern European countries consists of Denmark, Finland, Norway, and Sweden; the group of southern Europeancountries includes Greece, Italy, Portugal, and Spain; and the group of Anglo-Saxon countries consists of Australia, Canada, Ireland,New Zealand, the United Kingdom, and the United States, plus Japan. The “Other” category includes the Republic of Korea, Mexico,and Turkey. Former socialist countries (Hungary, Poland, the Czech Republic, and the Slovak Republic) and Germany are excludedhere because of the unavailability of data on the country of origin of a large share of their migrants. The “High-Income Countries”category includes both OECD and non-OECD countries according to the World Bank’s classification.
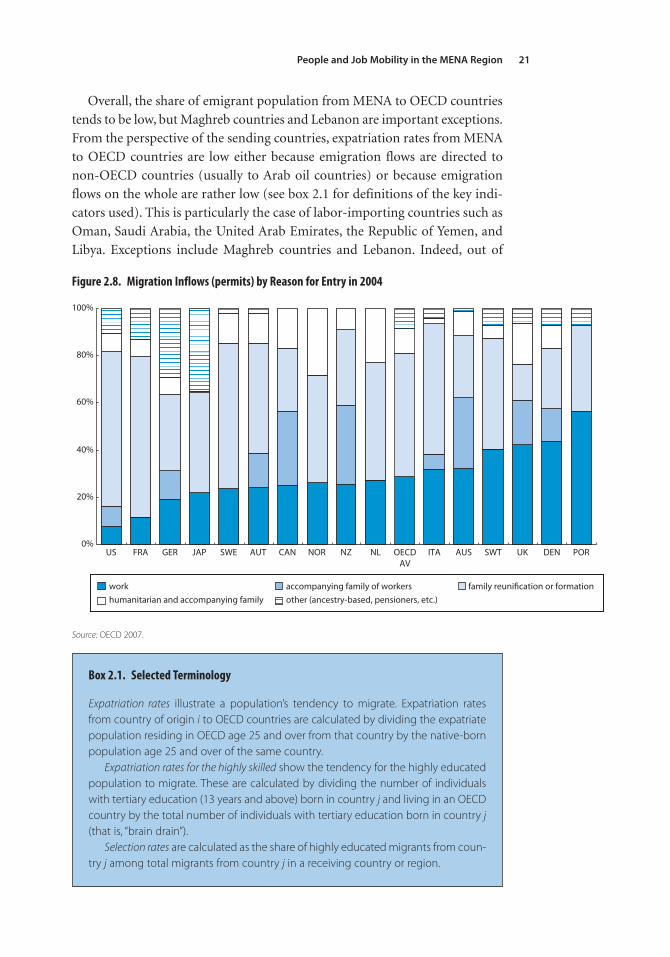
People and Job Mobility in the MENA Region 21
Overall, the share of emigrant population from MENA to OECD countries
tends to be low, but Maghreb countries and Lebanon are important exceptions.
From the perspective of the sending countries, expatriation rates from MENA
to OECD countries are low either because emigration flows are directed to
non-OECD countries (usually to Arab oil countries) or because emigration
flows on the whole are rather low (see box 2.1 for definitions of the key indi-
cators used). This is particularly the case of labor-importing countries such as
Oman, Saudi Arabia, the United Arab Emirates, the Republic of Yemen, and
Libya. Exceptions include Maghreb countries and Lebanon. Indeed, out of
0%
20%
40%
60%
80%
100%
US FRA GER JAP SWE AUT CAN NOR NZ NL OECDAV
ITA AUS SWT UK DEN POR
work accompanying family of workers family reunification or formation humanitarian and accompanying family other (ancestry-based, pensioners, etc.)
Figure 2.8. Migration Inflows (permits) by Reason for Entry in 2004
Source: OECD 2007.
Box 2.1. Selected Terminology
Expatriation rates illustrate a population’s tendency to migrate. Expatriation ratesfrom country of origin i to OECD countries are calculated by dividing the expatriatepopulation residing in OECD age 25 and over from that country by the native-bornpopulation age 25 and over of the same country.
Expatriation rates for the highly skilled show the tendency for the highly educatedpopulation to migrate. These are calculated by dividing the number of individualswith tertiary education (13 years and above) born in country j and living in an OECDcountry by the total number of individuals with tertiary education born in country j(that is, “brain drain”).
Selection rates are calculated as the share of highly educated migrants from coun-try j among total migrants from country j in a receiving country or region.
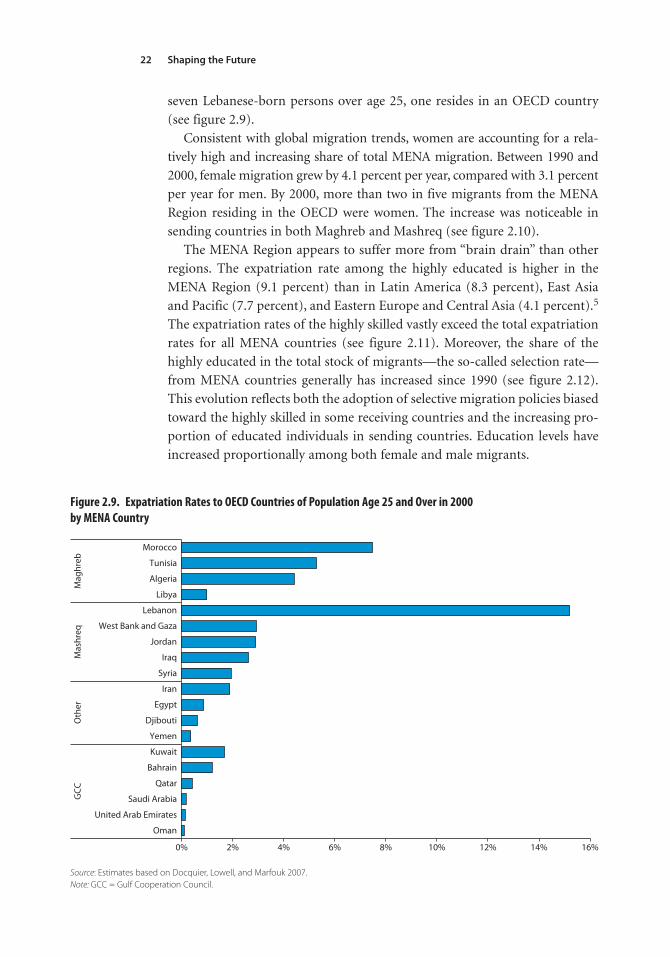
Shaping the Future22
seven Lebanese-born persons over age 25, one resides in an OECD country
(see figure 2.9).
Consistent with global migration trends, women are accounting for a rela-
tively high and increasing share of total MENA migration. Between 1990 and
2000, female migration grew by 4.1 percent per year, compared with 3.1 percent
per year for men. By 2000, more than two in five migrants from the MENA
Region residing in the OECD were women. The increase was noticeable in
sending countries in both Maghreb and Mashreq (see figure 2.10).
The MENA Region appears to suffer more from “brain drain” than other
regions. The expatriation rate among the highly educated is higher in the
MENA Region (9.1 percent) than in Latin America (8.3 percent), East Asia
and Pacific (7.7 percent), and Eastern Europe and Central Asia (4.1 percent).5
The expatriation rates of the highly skilled vastly exceed the total expatriation
rates for all MENA countries (see figure 2.11). Moreover, the share of the
highly educated in the total stock of migrants—the so-called selection rate—
from MENA countries generally has increased since 1990 (see figure 2.12).
This evolution reflects both the adoption of selective migration policies biased
toward the highly skilled in some receiving countries and the increasing pro-
portion of educated individuals in sending countries. Education levels have
increased proportionally among both female and male migrants.
0% 2% 4% 6% 8% 10% 12% 14% 16%
Oman
United Arab Emirates
Saudi Arabia
Qatar
Bahrain
Kuwait
Yemen
Djibouti
Egypt
Iran
Syria
Iraq
Jordan
West Bank and Gaza
Lebanon
Libya
Algeria
Tunisia
Morocco
GCC
Oth
erM
ashr
eqM
aghr
eb
Figure 2.9. Expatriation Rates to OECD Countries of Population Age 25 and Over in 2000 by MENA Country
Source: Estimates based on Docquier, Lowell, and Marfouk 2007.Note: GCC = Gulf Cooperation Council.
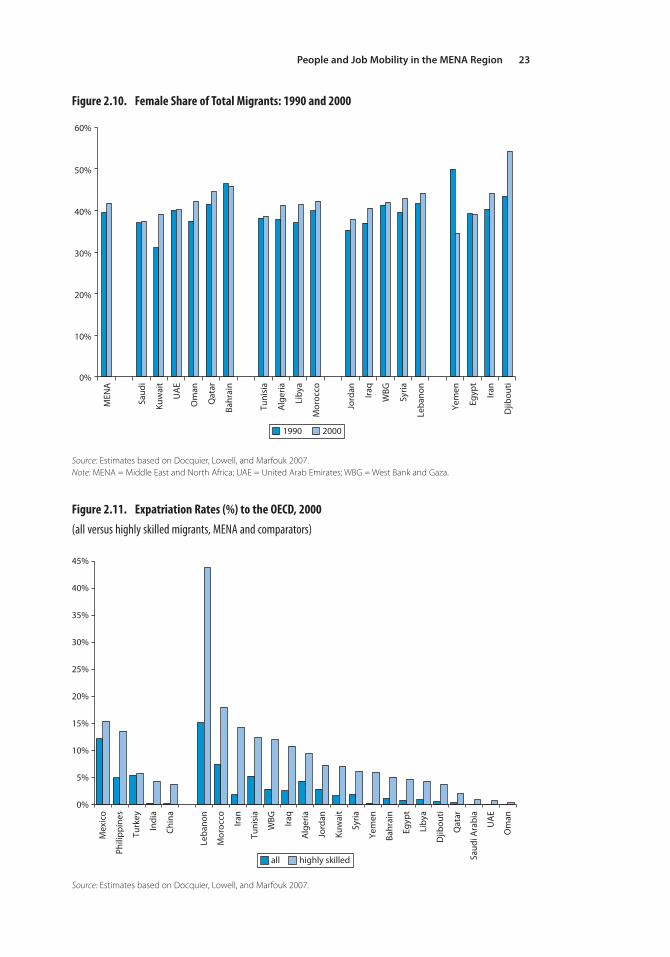
People and Job Mobility in the MENA Region 23
0%
5%
10%
15%
20%
25%
30%
35%
40%
45%
Mex
ico
Phili
ppin
es
Turk
ey
Indi
a
Chin
a
Leba
non
Mor
occo
Iran
Tuni
sia
WBG Ira
q
Alg
eria
Jord
an
Kuw
ait
Syria
Yem
en
Bahr
ain
Egyp
t
Liby
a
Djib
outi
Qat
ar
Saud
i Ara
bia
UA
E
Om
an
all highly skilled
Figure 2.11. Expatriation Rates (%) to the OECD, 2000
(all versus highly skilled migrants, MENA and comparators)
Source: Estimates based on Docquier, Lowell, and Marfouk 2007.
0%
10%
20%
30%
40%
50%
60%
MEN
A
Saud
i
Kuw
ait
UA
E
Om
an
Qat
ar
Bahr
ain
Tuni
sia
Alg
eria
Liby
a
Mor
occo
Jord
an Iraq
WBG
Syria
Leba
non
Yem
en
Egyp
t
Iran
Djib
outi
1990 2000
Figure 2.10. Female Share of Total Migrants: 1990 and 2000
Source: Estimates based on Docquier, Lowell, and Marfouk 2007.Note: MENA = Middle East and North Africa; UAE = United Arab Emirates; WBG = West Bank and Gaza.
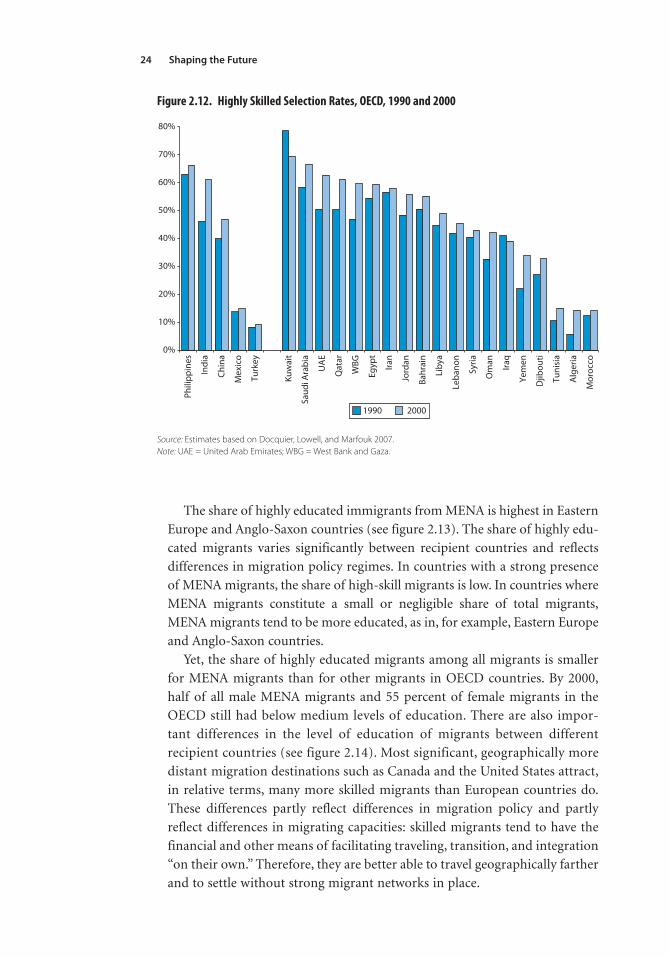
Shaping the Future24
The share of highly educated immigrants from MENA is highest in Eastern
Europe and Anglo-Saxon countries (see figure 2.13). The share of highly edu-
cated migrants varies significantly between recipient countries and reflects
differences in migration policy regimes. In countries with a strong presence
of MENA migrants, the share of high-skill migrants is low. In countries where
MENA migrants constitute a small or negligible share of total migrants,
MENA migrants tend to be more educated, as in, for example, Eastern Europe
and Anglo-Saxon countries.
Yet, the share of highly educated migrants among all migrants is smaller
for MENA migrants than for other migrants in OECD countries. By 2000,
half of all male MENA migrants and 55 percent of female migrants in the
OECD still had below medium levels of education. There are also impor-
tant differences in the level of education of migrants between different
recipient countries (see figure 2.14). Most significant, geographically more
distant migration destinations such as Canada and the United States attract,
in relative terms, many more skilled migrants than European countries do.
These differences partly reflect differences in migration policy and partly
reflect differences in migrating capacities: skilled migrants tend to have the
financial and other means of facilitating traveling, transition, and integration
“on their own.” Therefore, they are better able to travel geographically farther
and to settle without strong migrant networks in place.
0%
10%
20%
30%
40%
50%
60%
70%
80%
Phili
ppin
es
Indi
a
Chin
a
Mex
ico
Turk
ey
Kuw
ait
Saud
i Ara
bia
UA
E
Qat
ar
WBG
Egyp
t
Iran
Jord
an
Bahr
ain
Liby
a
Leba
non
Syria
Om
an Iraq
Yem
en
Djib
outi
Tuni
sia
Alg
eria
Mor
occo
1990 2000
Figure 2.12. Highly Skilled Selection Rates, OECD, 1990 and 2000
Source: Estimates based on Docquier, Lowell, and Marfouk 2007.Note: UAE = United Arab Emirates; WBG = West Bank and Gaza.
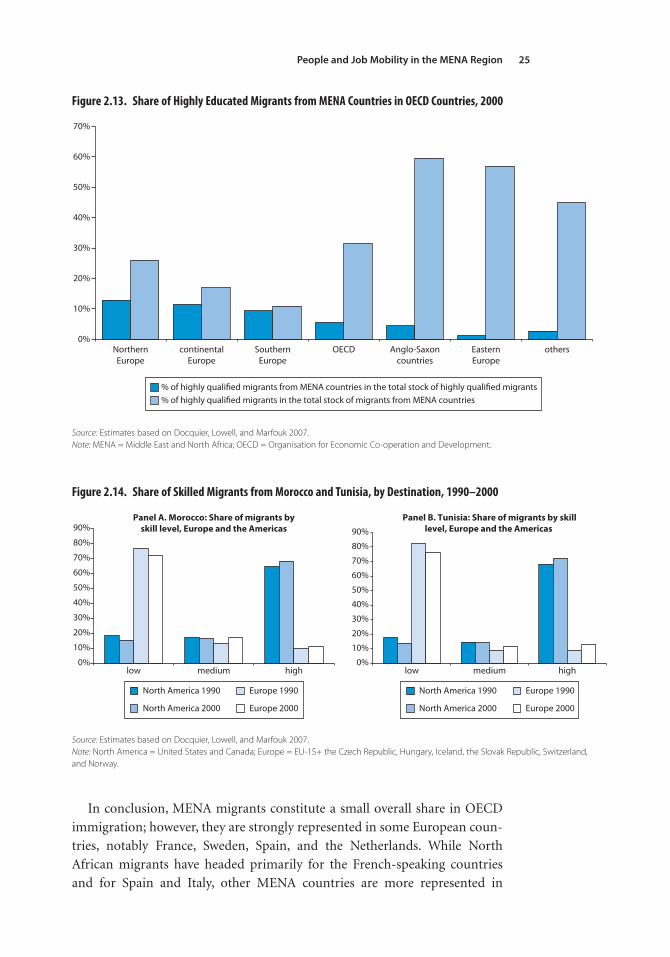
People and Job Mobility in the MENA Region 25
In conclusion, MENA migrants constitute a small overall share in OECD
immigration; however, they are strongly represented in some European coun-
tries, notably France, Sweden, Spain, and the Netherlands. While North
African migrants have headed primarily for the French-speaking countries
and for Spain and Italy, other MENA countries are more represented in
0%
10%
20%
30%
40%
50%
60%
70%
NorthernEurope
continentalEurope
SouthernEurope
OECD Anglo-Saxoncountries
EasternEurope
others
% of highly qualified migrants from MENA countries in the total stock of highly qualified migrants% of highly qualified migrants in the total stock of migrants from MENA countries
Figure 2.13. Share of Highly Educated Migrants from MENA Countries in OECD Countries, 2000
Source: Estimates based on Docquier, Lowell, and Marfouk 2007.Note: MENA = Middle East and North Africa; OECD = Organisation for Economic Co-operation and Development.
0%
10%
20%
30%
40%
50%
60%
70%
80%
90%Panel A. Morocco: Share of migrants by
skill level, Europe and the AmericasPanel B. Tunisia: Share of migrants by skill
level, Europe and the Americas
0%
10%
20%
30%
40%
50%
60%
70%
80%
90%
low medium high low medium high
North America 1990 Europe 1990
North America 2000 Europe 2000
North America 1990 Europe 1990
North America 2000 Europe 2000
Figure 2.14. Share of Skilled Migrants from Morocco and Tunisia, by Destination, 1990–2000
Source: Estimates based on Docquier, Lowell, and Marfouk 2007. Note: North America = United States and Canada; Europe = EU-15+ the Czech Republic, Hungary, Iceland, the Slovak Republic, Switzerland, and Norway.
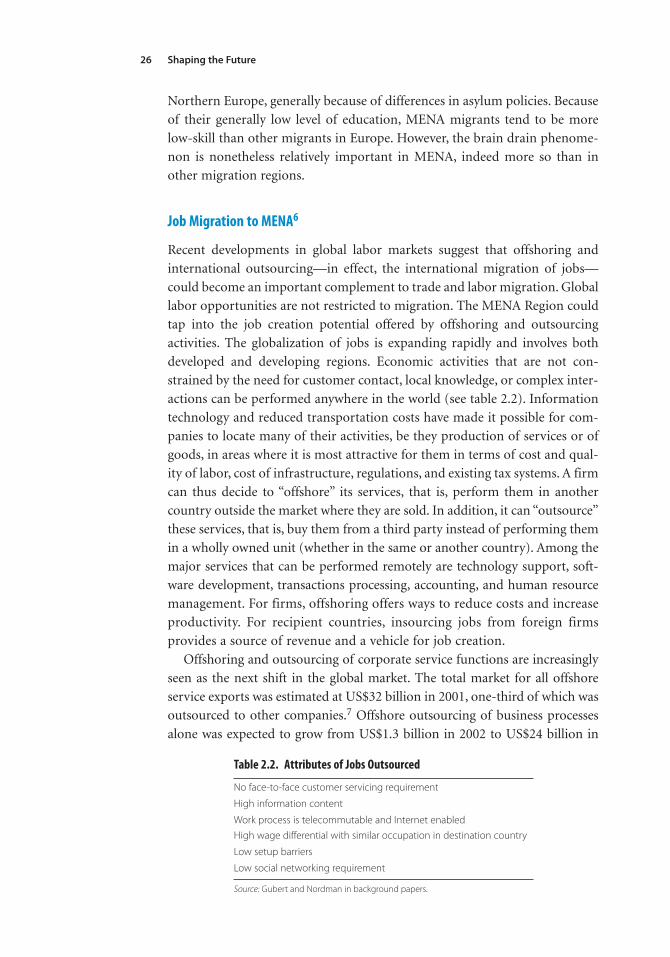
Shaping the Future26
Northern Europe, generally because of differences in asylum policies. Because
of their generally low level of education, MENA migrants tend to be more
low-skill than other migrants in Europe. However, the brain drain phenome-
non is nonetheless relatively important in MENA, indeed more so than in
other migration regions.
Job Migration to MENA6
Recent developments in global labor markets suggest that offshoring and
international outsourcing—in effect, the international migration of jobs—
could become an important complement to trade and labor migration. Global
labor opportunities are not restricted to migration. The MENA Region could
tap into the job creation potential offered by offshoring and outsourcing
activities. The globalization of jobs is expanding rapidly and involves both
developed and developing regions. Economic activities that are not con-
strained by the need for customer contact, local knowledge, or complex inter-
actions can be performed anywhere in the world (see table 2.2). Information
technology and reduced transportation costs have made it possible for com-
panies to locate many of their activities, be they production of services or of
goods, in areas where it is most attractive for them in terms of cost and qual-
ity of labor, cost of infrastructure, regulations, and existing tax systems. A firm
can thus decide to “offshore” its services, that is, perform them in another
country outside the market where they are sold. In addition, it can “outsource”
these services, that is, buy them from a third party instead of performing them
in a wholly owned unit (whether in the same or another country). Among the
major services that can be performed remotely are technology support, soft-
ware development, transactions processing, accounting, and human resource
management. For firms, offshoring offers ways to reduce costs and increase
productivity. For recipient countries, insourcing jobs from foreign firms
provides a source of revenue and a vehicle for job creation.
Offshoring and outsourcing of corporate service functions are increasingly
seen as the next shift in the global market. The total market for all offshore
service exports was estimated at US$32 billion in 2001, one-third of which was
outsourced to other companies.7 Offshore outsourcing of business processes
alone was expected to grow from US$1.3 billion in 2002 to US$24 billion in
Table 2.2. Attributes of Jobs Outsourced
No face-to-face customer servicing requirement
High information content
Work process is telecommutable and Internet enabled
High wage differential with similar occupation in destination country
Low setup barriers
Low social networking requirement
Source: Gubert and Nordman in background papers.
People and Job Mobility in the MENA Region 27
2007, raising the international share of the total market from 1 percent to
14 percent in five years.8 Most offshoring activities are still performed by for-
eign affiliates of large multinational companies, but offshoring to third parties
in low-cost countries is developing fast, especially for European companies.
More recent estimates put the entire global outsourcing industry (domestic
and international) at US$297 billion in 2007,9 and two emerging economies,
namely China and India, capture 16 percent (nearly US$50 billion) of the
global outsourcing activities.
Developing countries have an important and growing stake in insourcing
jobs. During 2000–04, India is estimated to have created 260,000 jobs in the off-
shoring sector.10 Many countries now want to do the same. Offshored services
are still concentrated in a small number of countries: Canada, India, Ireland,
and Israel accounted for 71 percent of the total market for offshored services in
2001.11 But since then, other emerging markets have attracted offshored activi-
ties. India is the major destination, followed by the Philippines. However, coun-
tries in Europe, the Middle East, and Africa are becoming competitive targets for
outsourcing. The Czech Republic, Ghana, Hungary, Malaysia, Poland, Senegal,
and Uruguay are emerging as outsourcing destinations, especially for European
call centers.
An important potential for offshoring exists in areas where MENA coun-
tries could provide the workforce. Because of the cross-border nature of off-
shoring activities and the dynamism experienced in this sector, comprehensive
and up-to-date data are lacking. Available information suggests that although
MENA has attracted limited jobs from abroad so far, this may be changing,
especially in the services sector. And, clearly, the potential is huge. A study by
McKinsey Global Institute12 suggested that the global offshoring sector could
be absorbing some 18 million full-time jobs. Key sectors include automotive,
health, insurance, information communication technology (ICT), software, phar -
maceutical services, retail, and banking services. These areas will require, in
particular, engineers and ICT specialists. Similarly, a report by Datamonitor
projected for 2007, about 290,000 agent positions (16 percent of all agent posi-
tions in the region) will be located in Europe, the Middle East, and Africa.13
The same study estimated the annual growth of outsourcing activities to the
Middle East and Africa at a rate of 22 percent between 2002 and 2007. Most of
the outsourced activities are service and IT jobs, including Web design, soft-
ware development, and call centers, for which wages typically account for a
high share of total costs (see table 2.3).
The United Arab Emirates is a major center for outsourcing business activi-
ties. Dubai has emerged as an important service hub between Europe and the
Asian continent. Indeed, in 2002–03, around 80 percent of the activities out-
sourced to the MENA Region took place in the United Arab Emirates, with the
establishment of headquarters accounting for 50 percent of all export-oriented
projects in MENA countries’ offshored activities.14 Other MENA countries now
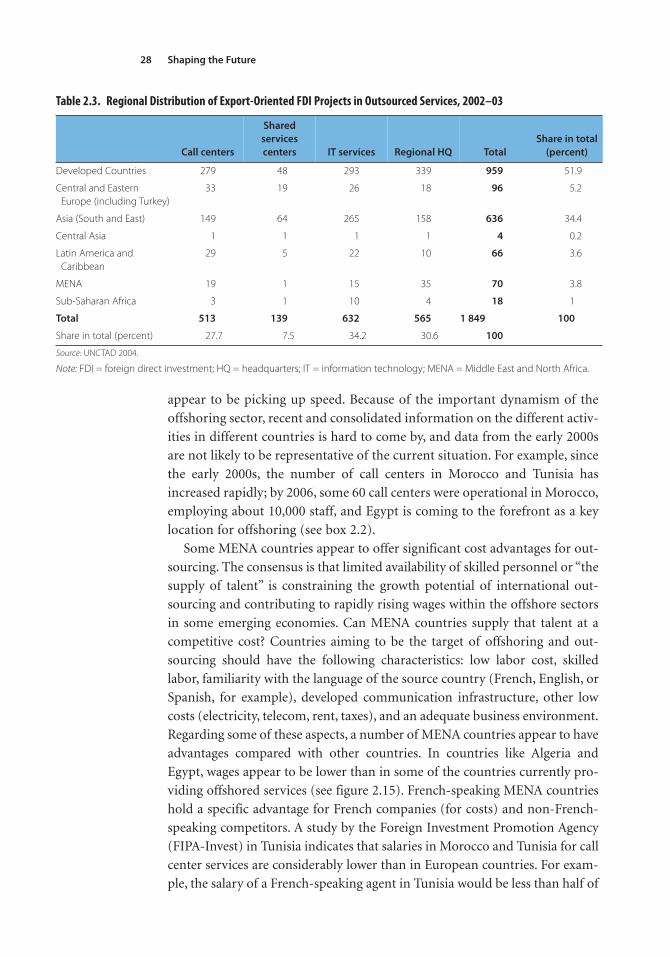
Shaping the Future28
appear to be picking up speed. Because of the important dynamism of the
offshoring sector, recent and consolidated information on the different activ-
ities in different countries is hard to come by, and data from the early 2000s
are not likely to be representative of the current situation. For example, since
the early 2000s, the number of call centers in Morocco and Tunisia has
increased rapidly; by 2006, some 60 call centers were operational in Morocco,
employing about 10,000 staff, and Egypt is coming to the forefront as a key
location for offshoring (see box 2.2).
Some MENA countries appear to offer significant cost advantages for out-
sourcing. The consensus is that limited availability of skilled personnel or “the
supply of talent” is constraining the growth potential of international out-
sourcing and contributing to rapidly rising wages within the offshore sectors
in some emerging economies. Can MENA countries supply that talent at a
competitive cost? Countries aiming to be the target of offshoring and out-
sourcing should have the following characteristics: low labor cost, skilled
labor, familiarity with the language of the source country (French, English, or
Spanish, for example), developed communication infrastructure, other low
costs (electricity, telecom, rent, taxes), and an adequate business environment.
Regarding some of these aspects, a number of MENA countries appear to have
advantages compared with other countries. In countries like Algeria and
Egypt, wages appear to be lower than in some of the countries currently pro-
viding offshored services (see figure 2.15). French-speaking MENA countries
hold a specific advantage for French companies (for costs) and non-French-
speaking competitors. A study by the Foreign Investment Promotion Agency
(FIPA-Invest) in Tunisia indicates that salaries in Morocco and Tunisia for call
center services are considerably lower than in European countries. For exam-
ple, the salary of a French-speaking agent in Tunisia would be less than half of
Table 2.3. Regional Distribution of Export-Oriented FDI Projects in Outsourced Services, 2002–03
Call centers
Shared
services
centers IT services Regional HQ Total
Share in total
(percent)
Developed Countries 279 48 293 339 959 51.9
Central and Eastern Europe (including Turkey)
33 19 26 18 96 5.2
Asia (South and East) 149 64 265 158 636 34.4
Central Asia 1 1 1 1 4 0.2
Latin America and Caribbean
29 5 22 10 66 3.6
MENA 19 1 15 35 70 3.8
Sub-Saharan Africa 3 1 10 4 18 1
Total 513 139 632 565 1 849 100
Share in total (percent) 27.7 7.5 34.2 30.6 100
Source: UNCTAD 2004.
Note: FDI = foreign direct investment; HQ = headquarters; IT = information technology; MENA = Middle East and North Africa.
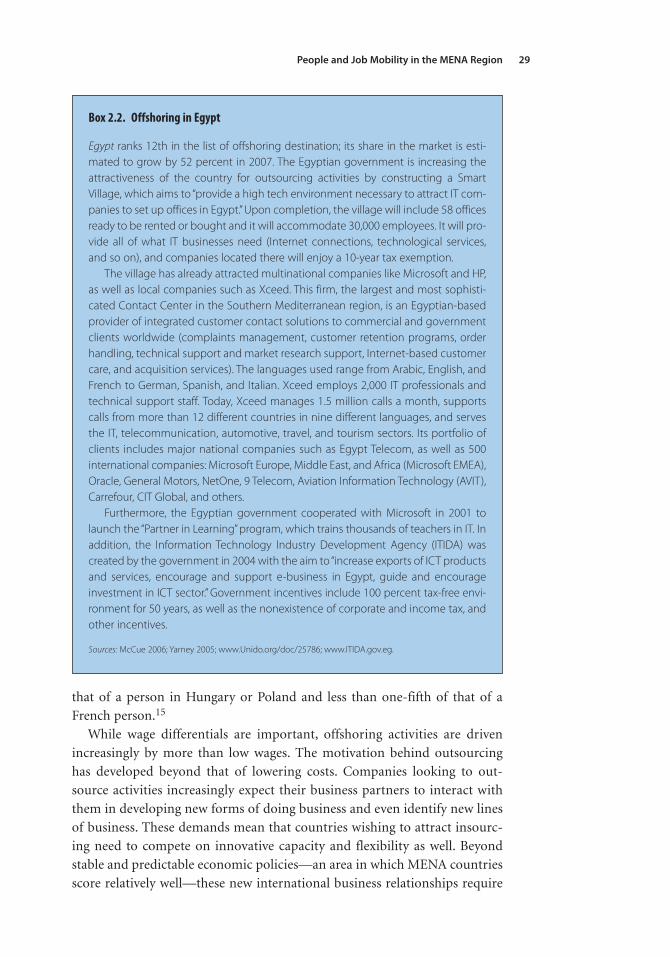
People and Job Mobility in the MENA Region 29
that of a person in Hungary or Poland and less than one-fifth of that of a
French person.15
While wage differentials are important, offshoring activities are driven
increasingly by more than low wages. The motivation behind outsourcing
has developed beyond that of lowering costs. Companies looking to out-
source activities increasingly expect their business partners to interact with
them in developing new forms of doing business and even identify new lines
of business. These demands mean that countries wishing to attract insourc-
ing need to compete on innovative capacity and flexibility as well. Beyond
stable and predictable economic policies—an area in which MENA countries
score relatively well—these new international business relationships require
Box 2.2. Offshoring in Egypt
Egypt ranks 12th in the list of offshoring destination; its share in the market is esti-mated to grow by 52 percent in 2007. The Egyptian government is increasing theattractiveness of the country for outsourcing activities by constructing a SmartVillage, which aims to “provide a high tech environment necessary to attract IT com-panies to set up offices in Egypt.” Upon completion, the village will include 58 officesready to be rented or bought and it will accommodate 30,000 employees. It will pro-vide all of what IT businesses need (Internet connections, technological services,and so on), and companies located there will enjoy a 10-year tax exemption.
The village has already attracted multinational companies like Microsoft and HP,as well as local companies such as Xceed. This firm, the largest and most sophisti-cated Contact Center in the Southern Mediterranean region, is an Egyptian-basedprovider of integrated customer contact solutions to commercial and governmentclients worldwide (complaints management, customer retention programs, orderhandling, technical support and market research support, Internet-based customercare, and acquisition services). The languages used range from Arabic, English, andFrench to German, Spanish, and Italian. Xceed employs 2,000 IT professionals andtechnical support staff. Today, Xceed manages 1.5 million calls a month, supportscalls from more than 12 different countries in nine different languages, and servesthe IT, telecommunication, automotive, travel, and tourism sectors. Its portfolio ofclients includes major national companies such as Egypt Telecom, as well as 500international companies: Microsoft Europe, Middle East, and Africa (Microsoft EMEA),Oracle, General Motors, NetOne, 9 Telecom, Aviation Information Technology (AVIT),Carrefour, CIT Global, and others.
Furthermore, the Egyptian government cooperated with Microsoft in 2001 tolaunch the “Partner in Learning” program, which trains thousands of teachers in IT. Inaddition, the Information Technology Industry Development Agency (ITIDA) wascreated by the government in 2004 with the aim to “increase exports of ICT productsand services, encourage and support e-business in Egypt, guide and encourageinvestment in ICT sector.” Government incentives include 100 percent tax-free envi-ronment for 50 years, as well as the nonexistence of corporate and income tax, andother incentives.
Sources: McCue 2006; Yarney 2005; www.Unido.org/doc/25786; www.ITIDA.gov.eg.
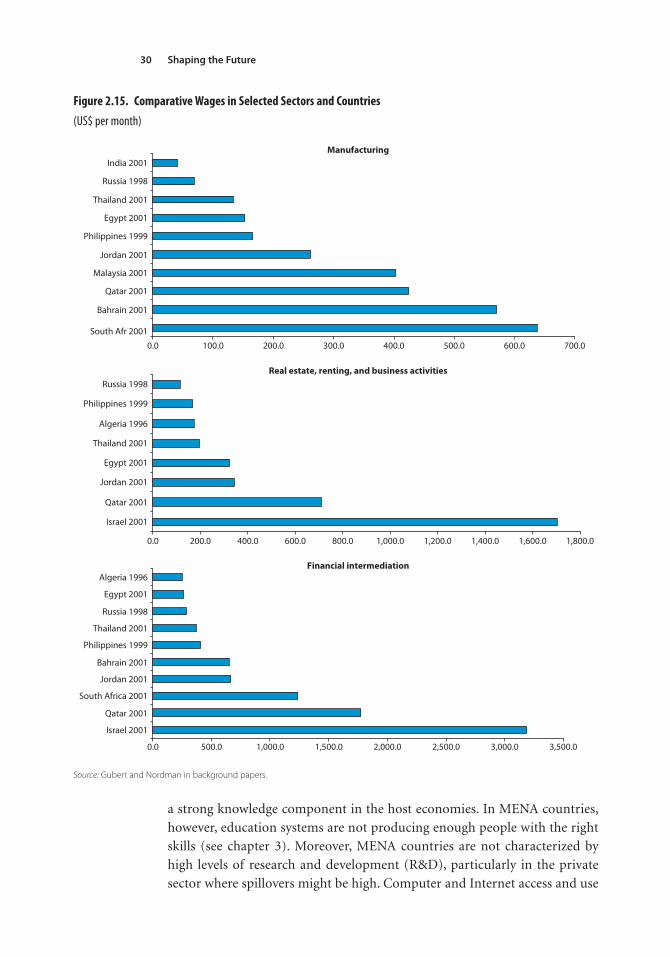
Shaping the Future30
a strong knowledge component in the host economies. In MENA countries,
however, education systems are not producing enough people with the right
skills (see chapter 3). Moreover, MENA countries are not characterized by
high levels of research and development (R&D), particularly in the private
sector where spillovers might be high. Computer and Internet access and use
Manufacturing
0.0 100.0 200.0 300.0 400.0 500.0 600.0 700.0
South Afr 2001
Bahrain 2001
Qatar 2001
Malaysia 2001
Jordan 2001
Philippines 1999
Egypt 2001
Thailand 2001
Russia 1998
India 2001
Real estate, renting, and business activities
0.0 200.0 400.0 600.0 800.0 1,000.0 1,200.0 1,400.0 1,600.0 1,800.0
Israel 2001
Qatar 2001
Jordan 2001
Egypt 2001
Thailand 2001
Algeria 1996
Philippines 1999
Russia 1998
Financial intermediation
0.0 500.0 1,000.0 1,500.0 2,000.0 2,500.0 3,000.0 3,500.0
Israel 2001
Qatar 2001
South Africa 2001
Jordan 2001
Bahrain 2001
Philippines 1999
Thailand 2001
Russia 1998
Egypt 2001
Algeria 1996
Figure 2.15. Comparative Wages in Selected Sectors and Countries
(US$ per month)
Source: Gubert and Nordman in background papers.
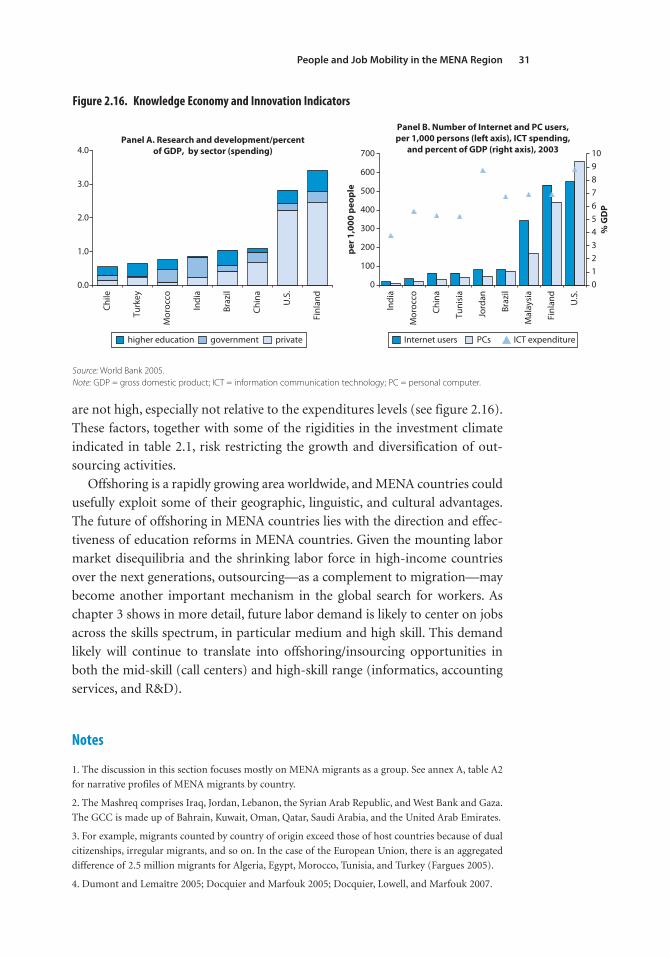
People and Job Mobility in the MENA Region 31
Notes
1. The discussion in this section focuses mostly on MENA migrants as a group. See annex A, table A2
for narrative profiles of MENA migrants by country.
2. The Mashreq comprises Iraq, Jordan, Lebanon, the Syrian Arab Republic, and West Bank and Gaza.
The GCC is made up of Bahrain, Kuwait, Oman, Qatar, Saudi Arabia, and the United Arab Emirates.
3. For example, migrants counted by country of origin exceed those of host countries because of dual
citizenships, irregular migrants, and so on. In the case of the European Union, there is an aggregated
difference of 2.5 million migrants for Algeria, Egypt, Morocco, Tunisia, and Turkey (Fargues 2005).
4. Dumont and Lemaître 2005; Docquier and Marfouk 2005; Docquier, Lowell, and Marfouk 2007.
are not high, especially not relative to the expenditures levels (see figure 2.16).
These factors, together with some of the rigidities in the investment climate
indicated in table 2.1, risk restricting the growth and diversification of out-
sourcing activities.
Offshoring is a rapidly growing area worldwide, and MENA countries could
usefully exploit some of their geographic, linguistic, and cultural advantages.
The future of offshoring in MENA countries lies with the direction and effec-
tiveness of education reforms in MENA countries. Given the mounting labor
market disequilibria and the shrinking labor force in high-income countries
over the next generations, outsourcing—as a complement to migration—may
become another important mechanism in the global search for workers. As
chapter 3 shows in more detail, future labor demand is likely to center on jobs
across the skills spectrum, in particular medium and high skill. This demand
likely will continue to translate into offshoring/insourcing opportunities in
both the mid-skill (call centers) and high-skill range (informatics, accounting
services, and R&D).
0.0
1.0
2.0
3.0
4.0Panel A. Research and development/percent
of GDP, by sector (spending)
Panel B. Number of Internet and PC users,per 1,000 persons (left axis), ICT spending,
and percent of GDP (right axis), 2003
Chile
Turk
ey
Mor
occo
Indi
a
Braz
il
Chin
a
U.S
.
Finl
and
0
100
200
300
400
500
600
700
Indi
a
Mor
occo
Chin
a
Tuni
sia
Jord
an
Braz
il
Mal
aysi
a
Finl
and
U.S
.
per 1
,000
peo
ple
012345678910
% G
DP
higher education government private Internet users PCs ICT expenditure
Figure 2.16. Knowledge Economy and Innovation Indicators
Source: World Bank 2005. Note: GDP = gross domestic product; ICT = information communication technology; PC = personal computer.
Shaping the Future32
5. Because of the important size of their brain drain and the small size of their populations and
economies, very small countries and islands that disproportionately affect averages were removed
from the different subgroups. Only developing countries are included.
6. This section draws on, among other things, the three country case studies, synthesized by Schramm,
and the background overview by Corm in the background papers, which devoted special attention to
offshoring and outsourcing.
7. According to the McKinsey Global Institute 2004, p. 153.
8. McKinsey Global Institute 2004, p. 153.
9. Estimates by XMG (http://www.xmg-global.com/mc_articles/mc071102.html). The forecast
includes information technology, business process outsourcing (BPO), and call center services, and the
onshore and offshore delivery of outsourcing services.
10. Knowledge@Wharton 2005.
11. McKinsey Global Institute 2004, p. 159.
12. McKinsey Global Institute 2005.
13. Call Center Magazine 2003.
14. UNCTAD 2004.
15. FIPA-Invest in Tunisia 2004 (Etude Comparative de Competitivite par Produit).
33
Demand and Supply Framework
3
Migration outcomes are determined by a mix of economic, political, social,
and demographic factors in the sending and receiving countries. Some nega-
tive outcomes of migration are linked to a poor matching between the demand
and the supply side. Both immigration and emigration policies in the wider
sense—including their education and labor market dimensions—can facil-
itate the matching process, increase efficiency, and deliver gains to the
countries and individuals involved. To improve migration outcomes, the
determinants of migration and the demand for foreign labor in particular
must be understood.
Understanding the Demand Side
A mix of economic, political, social, and demographic factors influence people’s
decision to move abroad and, from the opposite side, the demand for foreign
workers. Actual migration is thus a result of a combination of factors in the
sending and destination countries. In developing countries, high population
pressures, scarcity of good jobs, low returns to schooling, and high poverty lev-
els contribute to increase the supply of migrants. Noneconomic home country
factors also may play a role; these factors include the extent of political rights,
such as fair and free elections and government accountability, as well as civil
rights, including the rule of law and the right to freedom of association. The
generosity of social protection and safety nets could influence migrants’ choice
of a country of destination—referred to as the “welfare magnet effect.”
Destination is influenced by factors that lower the transaction costs involved
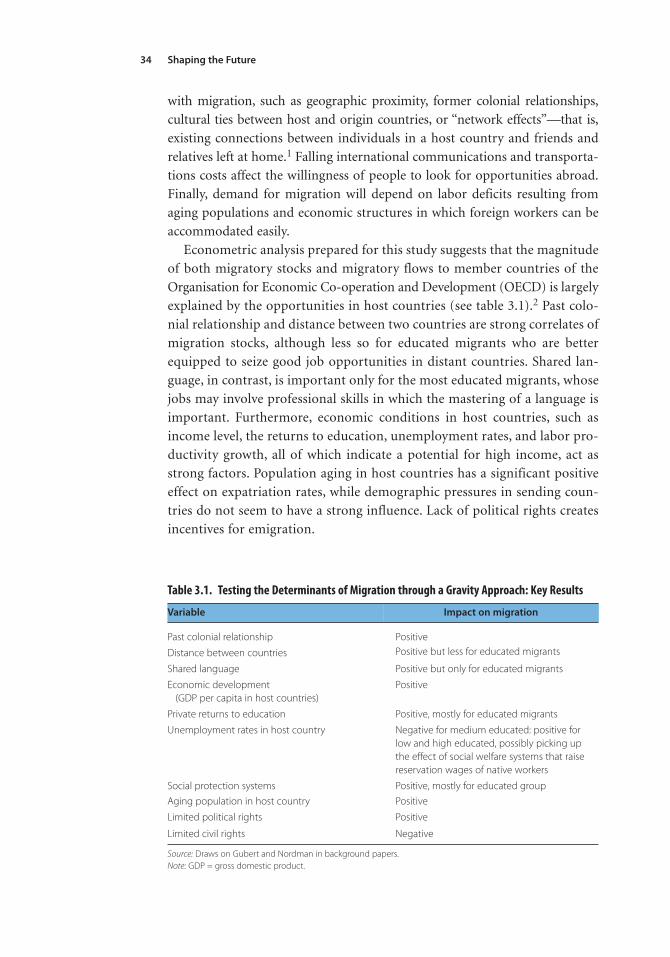
Shaping the Future34
with migration, such as geographic proximity, former colonial relationships,
cultural ties between host and origin countries, or “network effects”—that is,
existing connections between individuals in a host country and friends and
relatives left at home.1 Falling international communications and transporta-
tions costs affect the willingness of people to look for opportunities abroad.
Finally, demand for migration will depend on labor deficits resulting from
aging populations and economic structures in which foreign workers can be
accommodated easily.
Econometric analysis prepared for this study suggests that the magnitude
of both migratory stocks and migratory flows to member countries of the
Organisation for Economic Co-operation and Development (OECD) is largely
explained by the opportunities in host countries (see table 3.1).2 Past colo-
nial relationship and distance between two countries are strong correlates of
migration stocks, although less so for educated migrants who are better
equipped to seize good job opportunities in distant countries. Shared lan-
guage, in contrast, is important only for the most educated migrants, whose
jobs may involve professional skills in which the mastering of a language is
important. Furthermore, economic conditions in host countries, such as
income level, the returns to education, unemployment rates, and labor pro-
ductivity growth, all of which indicate a potential for high income, act as
strong factors. Population aging in host countries has a significant positive
effect on expatriation rates, while demographic pressures in sending coun-
tries do not seem to have a strong influence. Lack of political rights creates
incentives for emigration.
Table 3.1. Testing the Determinants of Migration through a Gravity Approach: Key Results
Variable Impact on migration
Past colonial relationship Positive
Distance between countries Positive but less for educated migrants
Shared language Positive but only for educated migrants
Economic development (GDP per capita in host countries)
Positive
Private returns to education Positive, mostly for educated migrants
Unemployment rates in host country Negative for medium educated: positive for low and high educated, possibly picking up the effect of social welfare systems that raisereservation wages of native workers
Social protection systems Positive, mostly for educated group
Aging population in host country Positive
Limited political rights Positive
Limited civil rights Negative
Source: Draws on Gubert and Nordman in background papers.Note: GDP = gross domestic product.
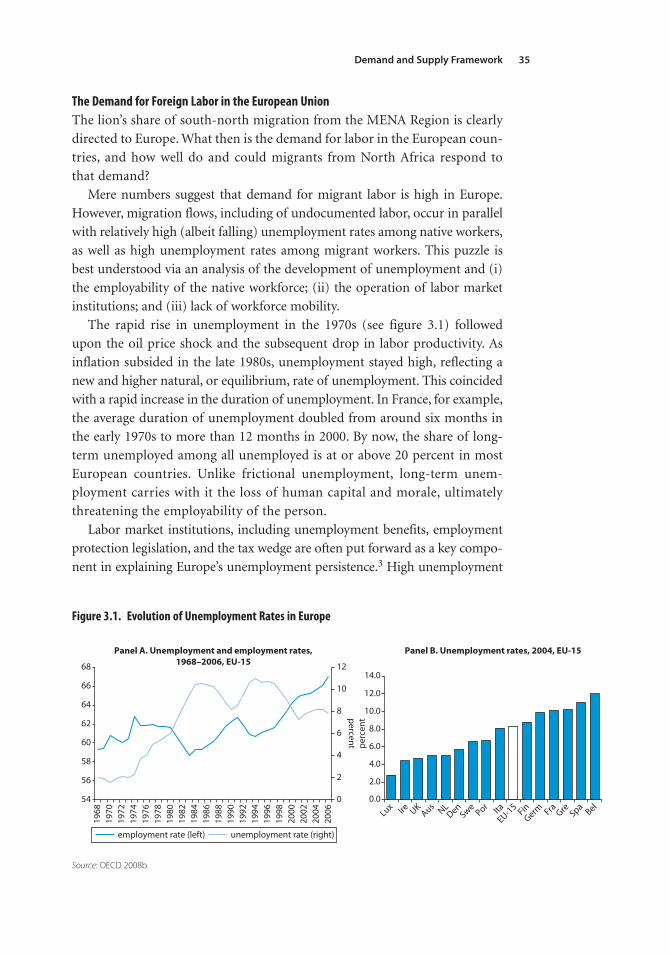
Demand and Supply Framework 35
The Demand for Foreign Labor in the European UnionThe lion’s share of south-north migration from the MENA Region is clearly
directed to Europe. What then is the demand for labor in the European coun-
tries, and how well do and could migrants from North Africa respond to
that demand?
Mere numbers suggest that demand for migrant labor is high in Europe.
However, migration flows, including of undocumented labor, occur in parallel
with relatively high (albeit falling) unemployment rates among native workers,
as well as high unemployment rates among migrant workers. This puzzle is
best understood via an analysis of the development of unemployment and (i)
the employability of the native workforce; (ii) the operation of labor market
institutions; and (iii) lack of workforce mobility.
The rapid rise in unemployment in the 1970s (see figure 3.1) followed
upon the oil price shock and the subsequent drop in labor productivity. As
inflation subsided in the late 1980s, unemployment stayed high, reflecting a
new and higher natural, or equilibrium, rate of unemployment. This coincided
with a rapid increase in the duration of unemployment. In France, for example,
the average duration of unemployment doubled from around six months in
the early 1970s to more than 12 months in 2000. By now, the share of long-
term unemployed among all unemployed is at or above 20 percent in most
European countries. Unlike frictional unemployment, long-term unem-
ployment carries with it the loss of human capital and morale, ultimately
threatening the employability of the person.
Labor market institutions, including unemployment benefits, employment
protection legislation, and the tax wedge are often put forward as a key compo-
nent in explaining Europe’s unemployment persistence.3 High unemployment
54
56
58
60
62
64
66
68
Panel A. Unemployment and employment rates,1968–2006, EU-15
Panel B. Unemployment rates, 2004, EU-15
1968
1970
1972
1974
1976
1978
1980
1982
1984
1986
1988
1990
1992
1994
1996
1998
2000
2002
2004
2006
0
2
4
6
8
10
12
0.0
2.0
4.0
6.0
8.0
10.0
12.0
percent perc
ent
14.0
Lux Ire UKAus NL
DenSwe
Por ItaEU-15 Fin
Germ Fra Gre Spa Bel
employment rate (left) unemployment rate (right)
Figure 3.1. Evolution of Unemployment Rates in Europe
Source: OECD 2008b.
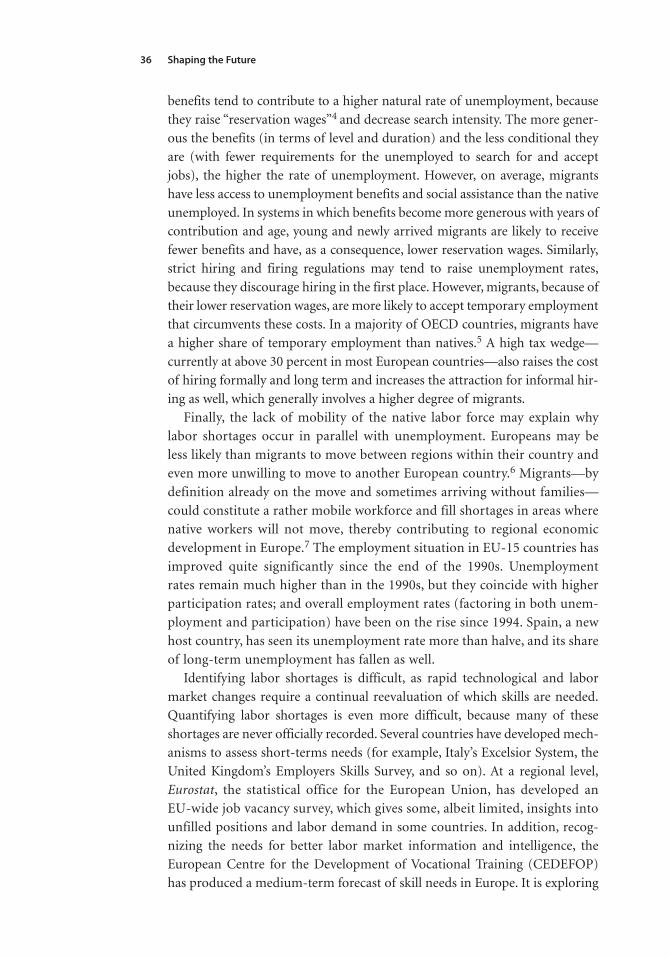
Shaping the Future36
benefits tend to contribute to a higher natural rate of unemployment, because
they raise “reservation wages”4 and decrease search intensity. The more gener-
ous the benefits (in terms of level and duration) and the less conditional they
are (with fewer requirements for the unemployed to search for and accept
jobs), the higher the rate of unemployment. However, on average, migrants
have less access to unemployment benefits and social assistance than the native
unemployed. In systems in which benefits become more generous with years of
contribution and age, young and newly arrived migrants are likely to receive
fewer benefits and have, as a consequence, lower reservation wages. Similarly,
strict hiring and firing regulations may tend to raise unemployment rates,
because they discourage hiring in the first place. However, migrants, because of
their lower reservation wages, are more likely to accept temporary employment
that circumvents these costs. In a majority of OECD countries, migrants have
a higher share of temporary employment than natives.5 A high tax wedge—
currently at above 30 percent in most European countries—also raises the cost
of hiring formally and long term and increases the attraction for informal hir-
ing as well, which generally involves a higher degree of migrants.
Finally, the lack of mobility of the native labor force may explain why
labor shortages occur in parallel with unemployment. Europeans may be
less likely than migrants to move between regions within their country and
even more unwilling to move to another European country.6 Migrants—by
definition already on the move and sometimes arriving without families—
could constitute a rather mobile workforce and fill shortages in areas where
native workers will not move, thereby contributing to regional economic
development in Europe.7 The employment situation in EU-15 countries has
improved quite significantly since the end of the 1990s. Unemployment
rates remain much higher than in the 1990s, but they coincide with higher
participation rates; and overall employment rates (factoring in both unem-
ployment and participation) have been on the rise since 1994. Spain, a new
host country, has seen its unemployment rate more than halve, and its share
of long-term unemployment has fallen as well.
Identifying labor shortages is difficult, as rapid technological and labor
market changes require a continual reevaluation of which skills are needed.
Quantifying labor shortages is even more difficult, because many of these
shortages are never officially recorded. Several countries have developed mech-
anisms to assess short-terms needs (for example, Italy’s Excelsior System, the
United Kingdom’s Employers Skills Survey, and so on). At a regional level,
Eurostat, the statistical office for the European Union, has developed an
EU-wide job vacancy survey, which gives some, albeit limited, insights into
unfilled positions and labor demand in some countries. In addition, recog-
nizing the needs for better labor market information and intelligence, the
European Centre for the Development of Vocational Training (CEDEFOP)
has produced a medium-term forecast of skill needs in Europe. It is exploring
Demand and Supply Framework 37
the feasibility of identifying the skills and competence needs at the workplace
level using enterprise surveys to complement quantitative measurement at the
macro level.
It appears that a steady supply of jobs is available in Europe at any point in
time and regardless of business cycles. The job vacancy rate (JVR) measures
the proportion of total posts that are vacant, as a percentage of all existing jobs
(occupied and vacant). Eurostat’s data set does not include all countries and is
notably lacking information for France and Italy. However, among countries
for which data are available, job vacancy rates8 were particularly high in
Belgium, Finland, Germany, the Netherlands, and the United Kingdom in 2006
(see figure 3.2). Moreover, the variations in past years (2001–04) in vacancy
rates was small, ranging from –0.7 percent to +0.2 percent only, indicating
that this type of labor shortages have been only marginally sensitive to short-
term economic cycles.
Based on these data, and bearing in mind that they exclude several large
countries, the total number of job vacancies for 18 countries in the European
Union reached 2.3 million in 2005 and 2.7 million in 2006. More than half of
the job vacancies were available in Germany and another 25 percent in the
United Kingdom (see figure 3.3).
The most serious recruitment difficulties appear to arise in finance and in
wholesale and retail trade, hotels and restaurants, and transport and commu-
nication. In 2006, for a total of 17 European countries, the number of vacant
jobs stood at around 760,000 in finance; 665,000 in wholesale and retail
trade, hotels and restaurants, and transport and communication; 618,000 in
Slov
enia
Bulg
aria
Slov
akia
Hun
gary
Latv
ia
Pola
nd
Rom
ania
Lith
uani
a
Esto
nia
Czec
h Re
publ
ic
Cypr
us
Luxe
mbu
rg
Port
ugal
Spai
n
Gre
ece
Swed
en
Aus
tria
Finl
and
Net
herla
nds
Uni
ted
King
dom
Ger
man
y
0.0
1.0
2.0
3.0
4.0
5.0
6.0
Figure 3.2. Job Vacancy Rates in Some European Countries, 2006
Source: Authors’ estimates based on Eurostat. Note: 2005 data for Austria, Greece, the Netherlands, and Portugal.
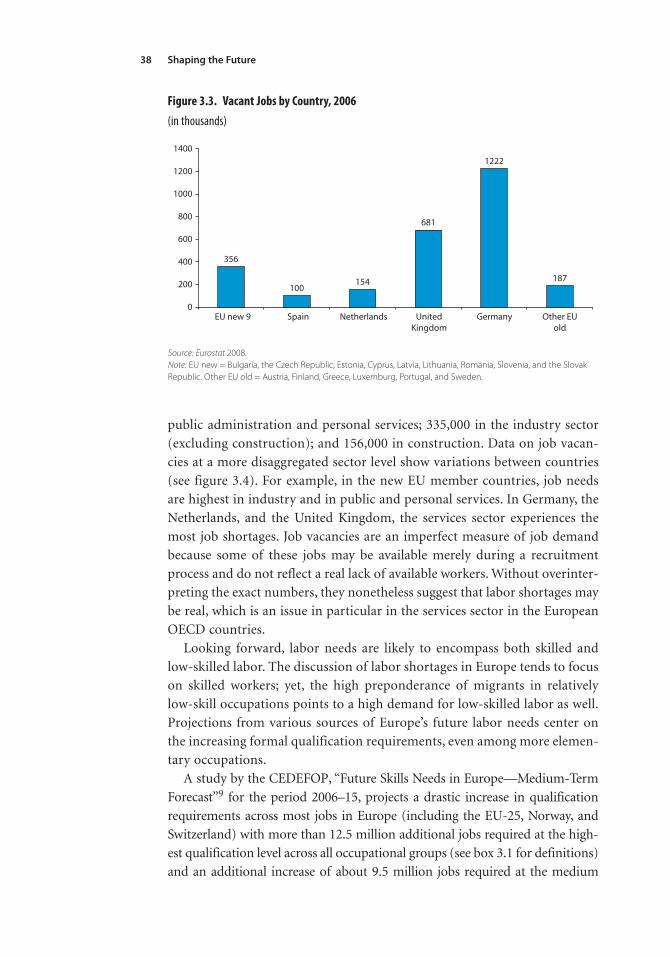
Shaping the Future38
public administration and personal services; 335,000 in the industry sector
(excluding construction); and 156,000 in construction. Data on job vacan-
cies at a more disaggregated sector level show variations between countries
(see figure 3.4). For example, in the new EU member countries, job needs
are highest in industry and in public and personal services. In Germany, the
Netherlands, and the United Kingdom, the services sector experiences the
most job shortages. Job vacancies are an imperfect measure of job demand
because some of these jobs may be available merely during a recruitment
process and do not reflect a real lack of available workers. Without overinter-
preting the exact numbers, they nonetheless suggest that labor shortages may
be real, which is an issue in particular in the services sector in the European
OECD countries.
Looking forward, labor needs are likely to encompass both skilled and
low-skilled labor. The discussion of labor shortages in Europe tends to focus
on skilled workers; yet, the high preponderance of migrants in relatively
low-skill occupations points to a high demand for low-skilled labor as well.
Projections from various sources of Europe’s future labor needs center on
the increasing formal qualification requirements, even among more elemen-
tary occupations.
A study by the CEDEFOP, “Future Skills Needs in Europe—Medium-Term
Forecast”9 for the period 2006–15, projects a drastic increase in qualification
requirements across most jobs in Europe (including the EU-25, Norway, and
Switzerland) with more than 12.5 million additional jobs required at the high-
est qualification level across all occupational groups (see box 3.1 for definitions)
and an additional increase of about 9.5 million jobs required at the medium
Figure 3.3. Vacant Jobs by Country, 2006
(in thousands)
356
100154
681
1222
187
0
200
400
600
800
1000
1200
1400
EU new 9 Spain Netherlands UnitedKingdom
Germany Other EUold
Source: Eurostat 2008. Note: EU new = Bulgaria, the Czech Republic, Estonia, Cyprus, Latvia, Lithuania, Romania, Slovenia, and the SlovakRepublic. Other EU old = Austria, Finland, Greece, Luxemburg, Portugal, and Sweden.
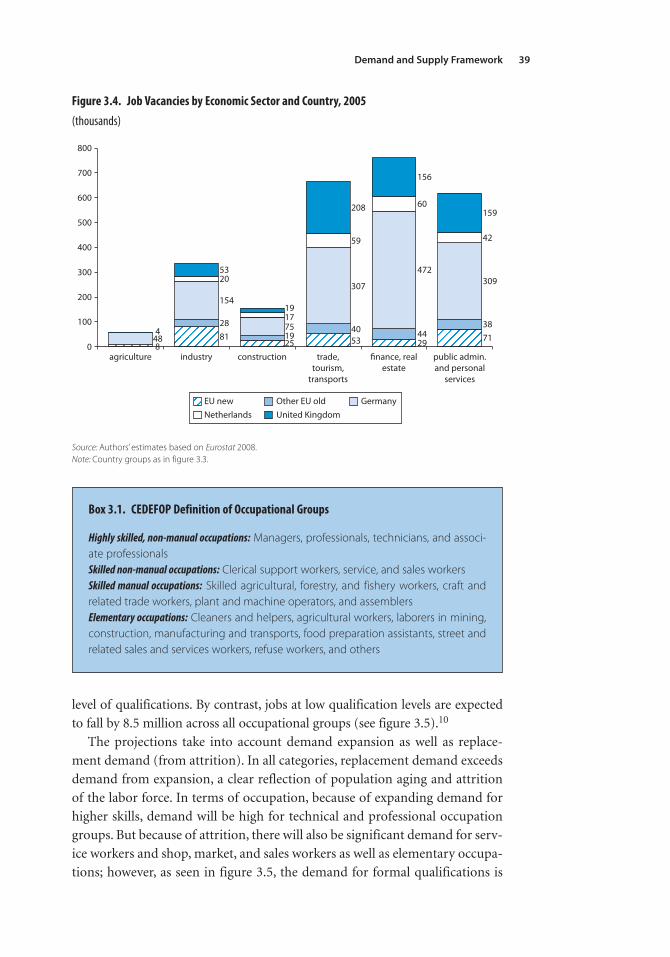
Demand and Supply Framework 39
level of qualifications. By contrast, jobs at low qualification levels are expected
to fall by 8.5 million across all occupational groups (see figure 3.5).10
The projections take into account demand expansion as well as replace-
ment demand (from attrition). In all categories, replacement demand exceeds
demand from expansion, a clear reflection of population aging and attrition
of the labor force. In terms of occupation, because of expanding demand for
higher skills, demand will be high for technical and professional occupation
groups. But because of attrition, there will also be significant demand for serv-
ice workers and shop, market, and sales workers as well as elementary occupa-
tions; however, as seen in figure 3.5, the demand for formal qualifications is
8
2840 44
38
48
154
75
307
472309
4
20
17
59
60
42
53
208
156
159
2519
19
0
100
200
300
400
500
600
700
800
agriculture industry construction trade,tourism,
transports
finance, realestate
public admin.and personal
services
EU new Other EU old GermanyNetherlands United Kingdom
7181 53 29
Figure 3.4. Job Vacancies by Economic Sector and Country, 2005
(thousands)
Source: Authors’ estimates based on Eurostat 2008. Note: Country groups as in figure 3.3.
Box 3.1. CEDEFOP Definition of Occupational Groups
Highly skilled, non-manual occupations: Managers, professionals, technicians, and associ-ate professionalsSkilled non-manual occupations: Clerical support workers, service, and sales workersSkilled manual occupations: Skilled agricultural, forestry, and fishery workers, craft andrelated trade workers, plant and machine operators, and assemblers Elementary occupations: Cleaners and helpers, agricultural workers, laborers in mining,construction, manufacturing and transports, food preparation assistants, street andrelated sales and services workers, refuse workers, and others
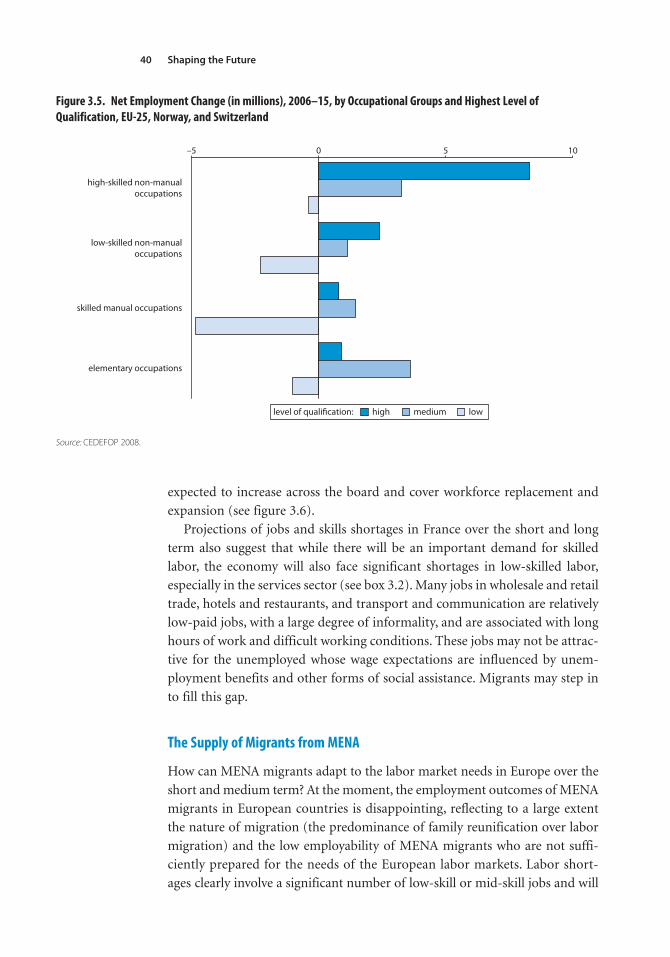
Shaping the Future40
expected to increase across the board and cover workforce replacement and
expansion (see figure 3.6).
Projections of jobs and skills shortages in France over the short and long
term also suggest that while there will be an important demand for skilled
labor, the economy will also face significant shortages in low-skilled labor,
especially in the services sector (see box 3.2). Many jobs in wholesale and retail
trade, hotels and restaurants, and transport and communication are relatively
low-paid jobs, with a large degree of informality, and are associated with long
hours of work and difficult working conditions. These jobs may not be attrac-
tive for the unemployed whose wage expectations are influenced by unem-
ployment benefits and other forms of social assistance. Migrants may step in
to fill this gap.
The Supply of Migrants from MENA
How can MENA migrants adapt to the labor market needs in Europe over the
short and medium term? At the moment, the employment outcomes of MENA
migrants in European countries is disappointing, reflecting to a large extent
the nature of migration (the predominance of family reunification over labor
migration) and the low employability of MENA migrants who are not suffi-
ciently prepared for the needs of the European labor markets. Labor short-
ages clearly involve a significant number of low-skill or mid-skill jobs and will
1050–5
high-skilled non-manualoccupations
low-skilled non-manualoccupations
skilled manual occupations
elementary occupations
level of qualification: high medium low
Figure 3.5. Net Employment Change (in millions), 2006–15, by Occupational Groups and Highest Level ofQualification, EU-25, Norway, and Switzerland
Source: CEDEFOP 2008.
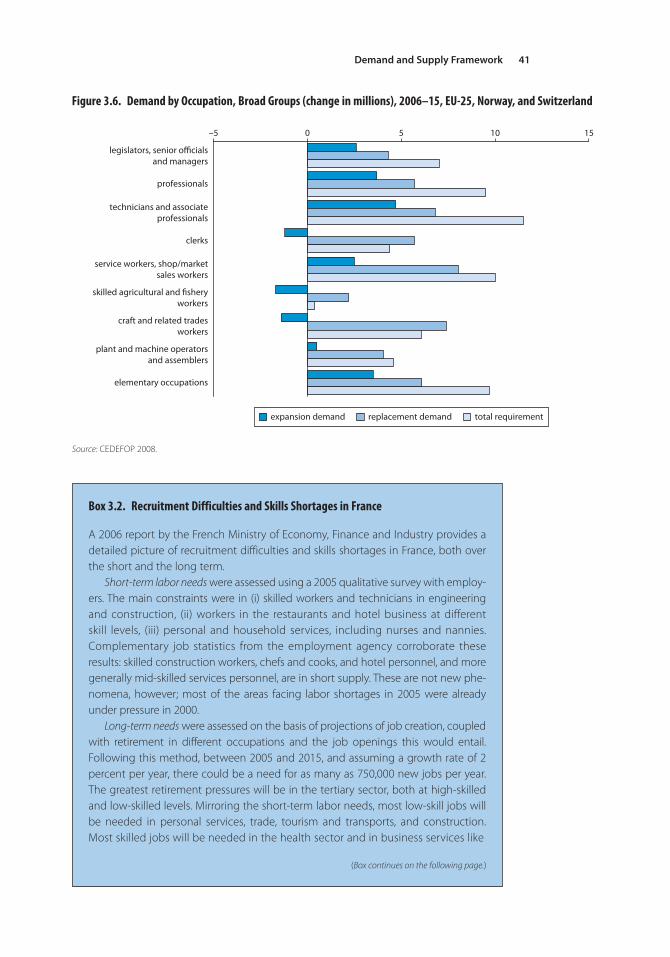
Demand and Supply Framework 41
–5 0 5 10 15
legislators, senior officialsand managers
professionals
technicians and associateprofessionals
clerks
service workers, shop/marketsales workers
skilled agricultural and fisheryworkers
craft and related tradesworkers
plant and machine operatorsand assemblers
elementary occupations
expansion demand replacement demand total requirement
Figure 3.6. Demand by Occupation, Broad Groups (change in millions), 2006–15, EU-25, Norway, and Switzerland
Source: CEDEFOP 2008.
Box 3.2. Recruitment Difficulties and Skills Shortages in France
A 2006 report by the French Ministry of Economy, Finance and Industry provides adetailed picture of recruitment difficulties and skills shortages in France, both overthe short and the long term.
Short-term labor needs were assessed using a 2005 qualitative survey with employ-ers. The main constraints were in (i) skilled workers and technicians in engineeringand construction, (ii) workers in the restaurants and hotel business at differentskill levels, (iii) personal and household services, including nurses and nannies.Complementary job statistics from the employment agency corroborate theseresults: skilled construction workers, chefs and cooks, and hotel personnel, and moregenerally mid-skilled services personnel, are in short supply. These are not new phe-nomena, however; most of the areas facing labor shortages in 2005 were alreadyunder pressure in 2000.
Long-term needs were assessed on the basis of projections of job creation, coupledwith retirement in different occupations and the job openings this would entail.Following this method, between 2005 and 2015, and assuming a growth rate of 2percent per year, there could be a need for as many as 750,000 new jobs per year.The greatest retirement pressures will be in the tertiary sector, both at high-skilledand low-skilled levels. Mirroring the short-term labor needs, most low-skill jobs willbe needed in personal services, trade, tourism and transports, and construction.Most skilled jobs will be needed in the health sector and in business services like
(Box continues on the following page.)
Shaping the Future42
continue to do so. Given sufficient language training and minor preparation,
relatively low-skilled MENA potential migrants should be employable for such
jobs, even in the services sector. To improve the employability of migrants in
Europe and raise private and public returns to education, however, the region
needs a more proactive approach. A migration strategy should reorient the
education system, but also, over the short term, build partnerships to respond
to labor shortages as rapidly as they occur.
Poor education outcomes in MENA countries remain an obstacle to com-
pete in global labor markets. More important, MENA’s education systems do
not deliver and remain at the root of MENA’s educational and technological
shortcomings.11 Returns to education are comparatively low in the region;
migration, under the right circumstances, could offer a means of increasing
those returns. The region has made important strides in making education
available to its rapidly growing population and comparatively large amounts
of public resources have been and still are spent on education. As a result, the
average age of schooling in the adult population has more than tripled in the
past 50 years. However, by 2000, the MENA Region had reached only the level
of schooling that countries in East Asia and Latin America had reached by
1980. Moreover, the quality and equity of spending has suffered.12
Illiteracy rates are comparatively high among new labor market entrants
in MENA, especially for young women. A first and basic indicator of the lack
Box 3.2. (continued)
accounting. More precisely, the projections suggest the following long-term jobcreation needs due to retirement: contracting industry (413,000 job openings),tourism and transport (444,000 new jobs), accounting and administrative services(641,000 new jobs), trade (453,000 new jobs), personal services (790,000 new jobs),and public administration (500,000 new jobs). Most low-skill jobs will be created inthe following sectors: personal services (+416,000 jobs over the period), transportand tourism (+225,000 jobs), trade (+196,000 jobs), and contracting industry(+116,000 jobs). By contrast, most skilled jobs will be created in the health sector(+304,000 jobs) and in accounting services (+197,000 jobs).
The same report concludes that labor and skill needs will be particularly highin the following occupations: managers and professional occupations (teachers,managers and administrative officers, software and IT professionals, sales managersand technicians, managers and technicians in the contracting industry, researchengineers and researchers); technical and skilled occupations (executive assistants,nurses, sales representatives, intermediate sales and service occupations, admin-istrative clerks, supervisors, and processing occupations); skilled workers (skilleddrivers, skilled workers in processing, skilled workers in storehouse management,skilled workers in heavy construction); and lower-skill occupations (child minders,care assistants, in-home employees, light duty cleaners).
Source: Gubert and Nordman in background papers.
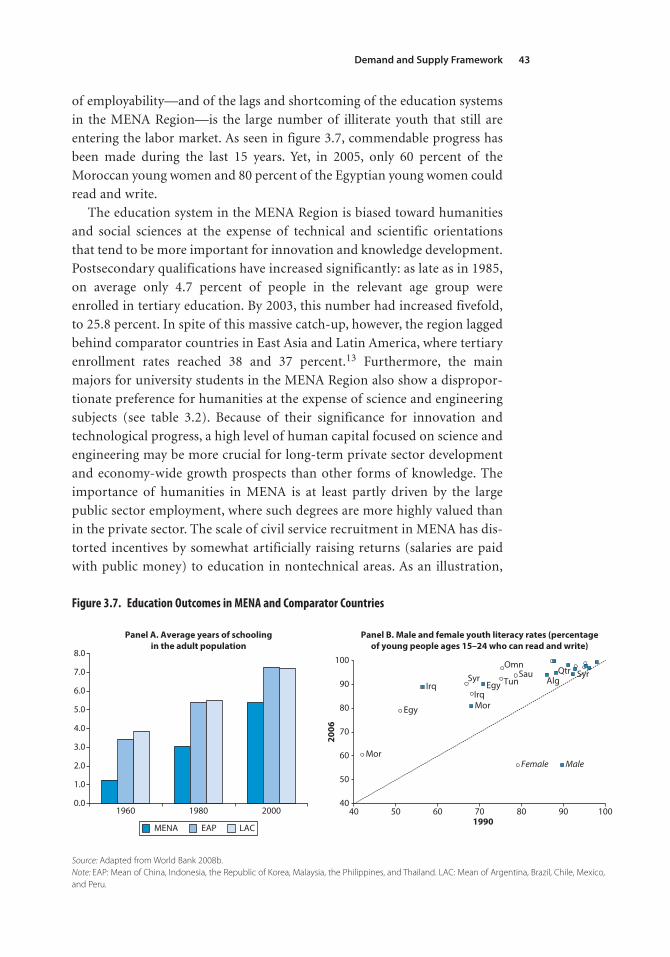
Demand and Supply Framework 43
of employability—and of the lags and shortcoming of the education systems
in the MENA Region—is the large number of illiterate youth that still are
entering the labor market. As seen in figure 3.7, commendable progress has
been made during the last 15 years. Yet, in 2005, only 60 percent of the
Moroccan young women and 80 percent of the Egyptian young women could
read and write.
The education system in the MENA Region is biased toward humanities
and social sciences at the expense of technical and scientific orientations
that tend to be more important for innovation and knowledge development.
Postsecondary qualifications have increased significantly: as late as in 1985,
on average only 4.7 percent of people in the relevant age group were
enrolled in tertiary education. By 2003, this number had increased fivefold,
to 25.8 percent. In spite of this massive catch-up, however, the region lagged
behind comparator countries in East Asia and Latin America, where tertiary
enrollment rates reached 38 and 37 percent.13 Furthermore, the main
majors for university students in the MENA Region also show a dispropor-
tionate preference for humanities at the expense of science and engineering
subjects (see table 3.2). Because of their significance for innovation and
technological progress, a high level of human capital focused on science and
engineering may be more crucial for long-term private sector development
and economy-wide growth prospects than other forms of knowledge. The
importance of humanities in MENA is at least partly driven by the large
public sector employment, where such degrees are more highly valued than
in the private sector. The scale of civil service recruitment in MENA has dis-
torted incentives by somewhat artificially raising returns (salaries are paid
with public money) to education in nontechnical areas. As an illustration,
0.0
1.0
2.0
3.0
4.0
5.0
6.0
7.0
8.0
Panel A. Average years of schoolingin the adult population
Panel B. Male and female youth literacy rates (percentageof young people ages 15–24 who can read and write)
Mor
Egy
Irq
Syr TunSau
Omn
Mor
Irq Egy AlgQtr Syr
40
50
60
70
80
90
100
1960 1980 2000 40 50 60 70 80 90 1001990
2006
Female Male
MENA EAP LAC
Figure 3.7. Education Outcomes in MENA and Comparator Countries
Source: Adapted from World Bank 2008b. Note: EAP: Mean of China, Indonesia, the Republic of Korea, Malaysia, the Philippines, and Thailand. LAC: Mean of Argentina, Brazil, Chile, Mexico,and Peru.
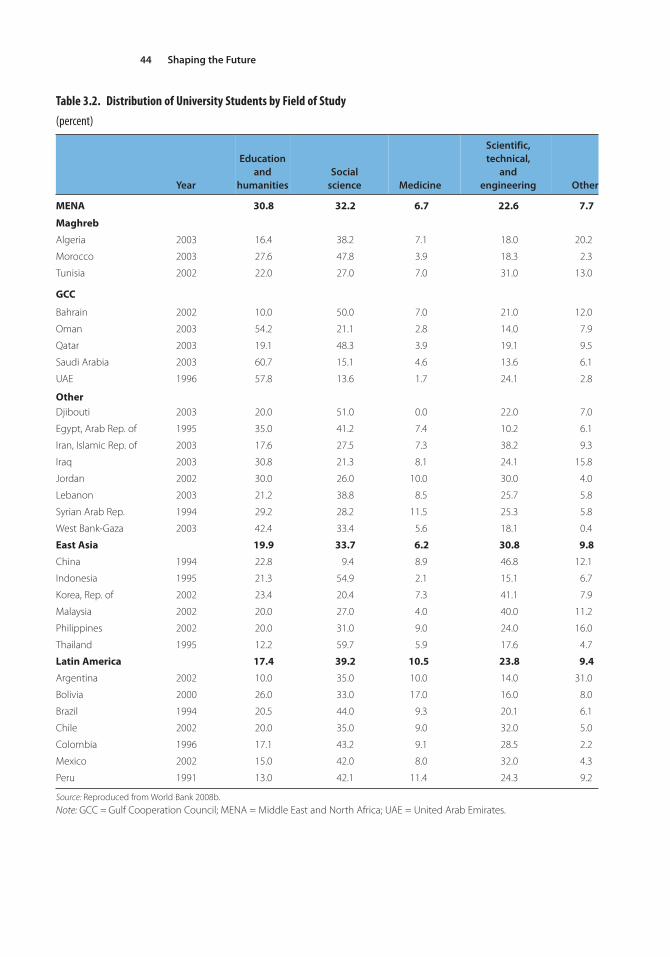
Shaping the Future44
Table 3.2. Distribution of University Students by Field of Study
(percent)
Year
Education
and
humanities
Social
science Medicine
Scientific,
technical,
and
engineering Other
MENA 30.8 32.2 6.7 22.6 7.7
Maghreb
Algeria 2003 16.4 38.2 7.1 18.0 20.2
Morocco 2003 27.6 47.8 3.9 18.3 2.3
Tunisia 2002 22.0 27.0 7.0 31.0 13.0
GCC
Bahrain 2002 10.0 50.0 7.0 21.0 12.0
Oman 2003 54.2 21.1 2.8 14.0 7.9
Qatar 2003 19.1 48.3 3.9 19.1 9.5
Saudi Arabia 2003 60.7 15.1 4.6 13.6 6.1
UAE 1996 57.8 13.6 1.7 24.1 2.8
OtherDjibouti 2003 20.0 51.0 0.0 22.0 7.0
Egypt, Arab Rep. of 1995 35.0 41.2 7.4 10.2 6.1
Iran, Islamic Rep. of 2003 17.6 27.5 7.3 38.2 9.3
Iraq 2003 30.8 21.3 8.1 24.1 15.8
Jordan 2002 30.0 26.0 10.0 30.0 4.0
Lebanon 2003 21.2 38.8 8.5 25.7 5.8
Syrian Arab Rep. 1994 29.2 28.2 11.5 25.3 5.8
West Bank-Gaza 2003 42.4 33.4 5.6 18.1 0.4
East Asia 19.9 33.7 6.2 30.8 9.8
China 1994 22.8 9.4 8.9 46.8 12.1
Indonesia 1995 21.3 54.9 2.1 15.1 6.7
Korea, Rep. of 2002 23.4 20.4 7.3 41.1 7.9
Malaysia 2002 20.0 27.0 4.0 40.0 11.2
Philippines 2002 20.0 31.0 9.0 24.0 16.0
Thailand 1995 12.2 59.7 5.9 17.6 4.7
Latin America 17.4 39.2 10.5 23.8 9.4
Argentina 2002 10.0 35.0 10.0 14.0 31.0
Bolivia 2000 26.0 33.0 17.0 16.0 8.0
Brazil 1994 20.5 44.0 9.3 20.1 6.1
Chile 2002 20.0 35.0 9.0 32.0 5.0
Colombia 1996 17.1 43.2 9.1 28.5 2.2
Mexico 2002 15.0 42.0 8.0 32.0 4.3
Peru 1991 13.0 42.1 11.4 24.3 9.2
Source: Reproduced from World Bank 2008b.
Note: GCC = Gulf Cooperation Council; MENA = Middle East and North Africa; UAE = United Arab Emirates.
Demand and Supply Framework 45
technology and engineering students attending university in Morocco
increased by 3,500 between 1994–95 and 2003–04 but still accounted for
only 2 percent of all students.
Access to education remains unequal and outcomes disappointing. A rela-
tively high share of spending on secondary and tertiary education, compared
with primary education, has tended to favor better-off families. Education
gaps between the poor and the non-poor have narrowed in some countries
(Egypt) but widened in others (Morocco). The distribution of education, as
measured by the Gini coefficient of years of schooling, has fallen significantly,
from 0.760 in 1970 to 0.507 in 2000, but it remains much higher than in East
Asia or Latin America. Similarly, MENA countries score, in general, less well
on international mathematics and science tests.
The ultimate evidence of problems in the education sector is the high
unemployment rate among the highly qualified, especially women. Rapid
increases in enrollment rates at higher levels of education, coupled with qual-
ity problems and mismatches in skills and expectations in the labor markets,
have resulted in high unemployment rates among the educated. Unemploy -
ment rates are particularly high among young new entrants and women who
have completed secondary or higher education (see table 3.3).
As discussed, although education levels are increasing in the region, a
higher proportion of MENA migrants in OECD countries have low skills,
compared with other migrants or Europeans. Consider, for example, France
and Spain, the first an “old” and the second a “new” MENA migrant-receiving
country. In France, the share of low-skilled workers among people born in
MENA and those born in other non-OECD countries is similar. But among
those who still hold a foreign nationality, the share of low-skilled workers
is much higher for MENA migrants. In Spain, the differences between
MENA migrants and non-MENA migrants are even starker: three-quarters
of MENA migrants are low-skilled workers, compared with half for other
migrants (see table 3.4).
The actual labor market situation of MENA migrants varies sharply from
one OECD country to another. Data from the European Labor Force Survey
show that immigrants from MENA countries have a lower probability of
being employed than EU nationals and immigrants from other regions. In
2005, two in three EU-15 nationals between the ages of 15 and 64 living in
their country of birth were employed. The comparable figure for nationals of
MENA countries living in EU-15 countries was 45 percent—much lower
than for the group of migrants as a whole, for which the employment rate
reached 59 percent. Figure 3.8 illustrates the employment rates for MENA
foreign-born and foreign nationals, males and females, compared with
Turkey and other important migrant groups in 2005. MENA and Turkish
male and female immigrants perform poorly compared with other migrant
groups, especially for women—only 24 percent of female MENA nationals in
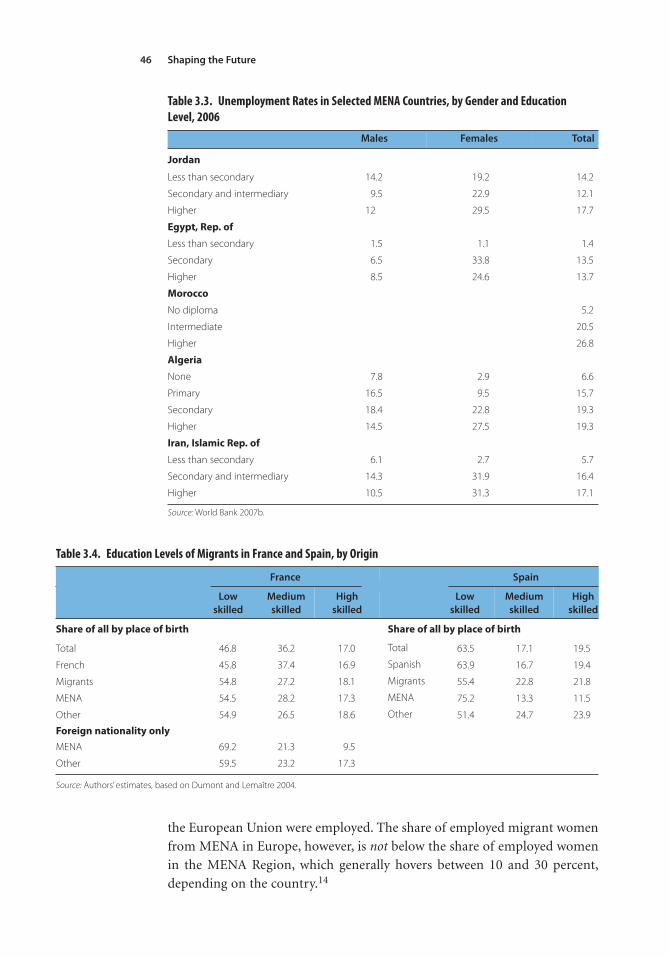
Shaping the Future46
Table 3.3. Unemployment Rates in Selected MENA Countries, by Gender and Education Level, 2006
Males Females Total
Jordan
Less than secondary 14.2 19.2 14.2
Secondary and intermediary 9.5 22.9 12.1
Higher 12 29.5 17.7
Egypt, Rep. of
Less than secondary 1.5 1.1 1.4
Secondary 6.5 33.8 13.5
Higher 8.5 24.6 13.7
Morocco
No diploma 5.2
Intermediate 20.5
Higher 26.8
Algeria
None 7.8 2.9 6.6
Primary 16.5 9.5 15.7
Secondary 18.4 22.8 19.3
Higher 14.5 27.5 19.3
Iran, Islamic Rep. of
Less than secondary 6.1 2.7 5.7
Secondary and intermediary 14.3 31.9 16.4
Higher 10.5 31.3 17.1
Source: World Bank 2007b.
the European Union were employed. The share of employed migrant women
from MENA in Europe, however, is not below the share of employed women
in the MENA Region, which generally hovers between 10 and 30 percent,
depending on the country.14
Table 3.4. Education Levels of Migrants in France and Spain, by Origin
France Spain
Low
skilled
Medium
skilled
High
skilled
Low
skilled
Medium
skilled
High
skilled
Share of all by place of birth Share of all by place of birth
Total 46.8 36.2 17.0 Total 63.5 17.1 19.5
French 45.8 37.4 16.9 Spanish 63.9 16.7 19.4
Migrants 54.8 27.2 18.1 Migrants 55.4 22.8 21.8
MENA 54.5 28.2 17.3 MENA 75.2 13.3 11.5
Other 54.9 26.5 18.6 Other 51.4 24.7 23.9
Foreign nationality only
MENA 69.2 21.3 9.5
Other 59.5 23.2 17.3
Source: Authors’ estimates, based on Dumont and Lemaître 2004.
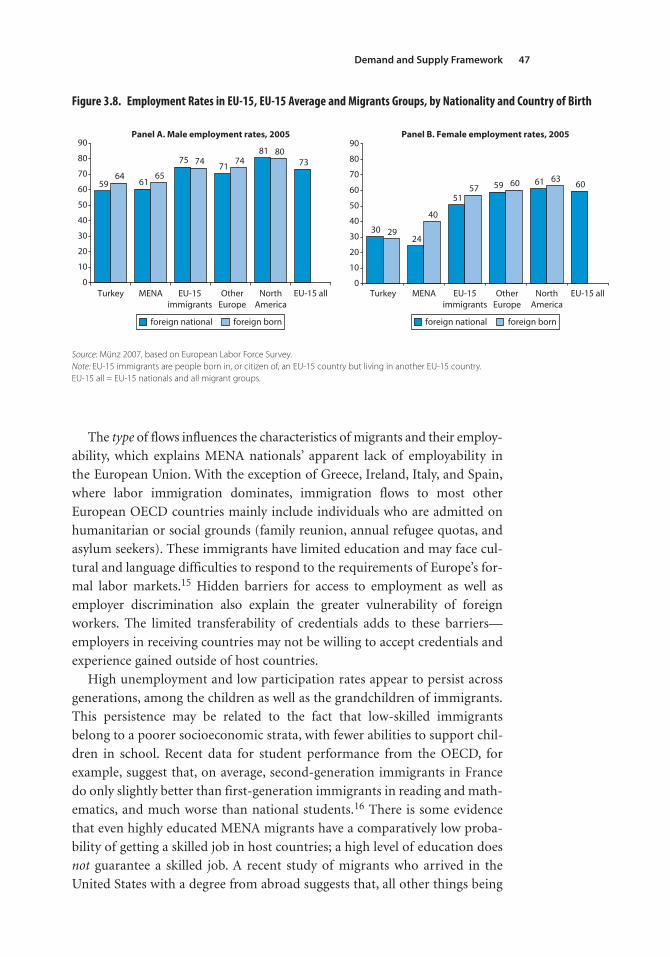
Demand and Supply Framework 47
The type of flows influences the characteristics of migrants and their employ-
ability, which explains MENA nationals’ apparent lack of employability in
the European Union. With the exception of Greece, Ireland, Italy, and Spain,
where labor immigration dominates, immigration flows to most other
European OECD countries mainly include individuals who are admitted on
humanitarian or social grounds (family reunion, annual refugee quotas, and
asylum seekers). These immigrants have limited education and may face cul-
tural and language difficulties to respond to the requirements of Europe’s for-
mal labor markets.15 Hidden barriers for access to employment as well as
employer discrimination also explain the greater vulnerability of foreign
workers. The limited transferability of credentials adds to these barriers—
employers in receiving countries may not be willing to accept credentials and
experience gained outside of host countries.
High unemployment and low participation rates appear to persist across
generations, among the children as well as the grandchildren of immigrants.
This persistence may be related to the fact that low-skilled immigrants
belong to a poorer socioeconomic strata, with fewer abilities to support chil-
dren in school. Recent data for student performance from the OECD, for
example, suggest that, on average, second-generation immigrants in France
do only slightly better than first-generation immigrants in reading and math-
ematics, and much worse than national students.16 There is some evidence
that even highly educated MENA migrants have a comparatively low proba-
bility of getting a skilled job in host countries; a high level of education does
not guarantee a skilled job. A recent study of migrants who arrived in the
United States with a degree from abroad suggests that, all other things being
59 61
7571
8173
64 65
74 7480
0
10
20
30
40
50
60
70
80
90Panel A. Male employment rates, 2005 Panel B. Female employment rates, 2005
OtherEurope
NorthAmerica
EU-15 all
3024
5159 61 60
29
40
57 60 63
0
10
20
30
40
50
60
70
80
90
Turkey MENA EU-15immigrants
OtherEurope
NorthAmerica
EU-15 allTurkey MENA EU-15immigrants
foreign national foreign born foreign national foreign born
Figure 3.8. Employment Rates in EU-15, EU-15 Average and Migrants Groups, by Nationality and Country of Birth
Source: Münz 2007, based on European Labor Force Survey.Note: EU-15 immigrants are people born in, or citizen of, an EU-15 country but living in another EU-15 country. EU-15 all = EU-15 nationals and all migrant groups.
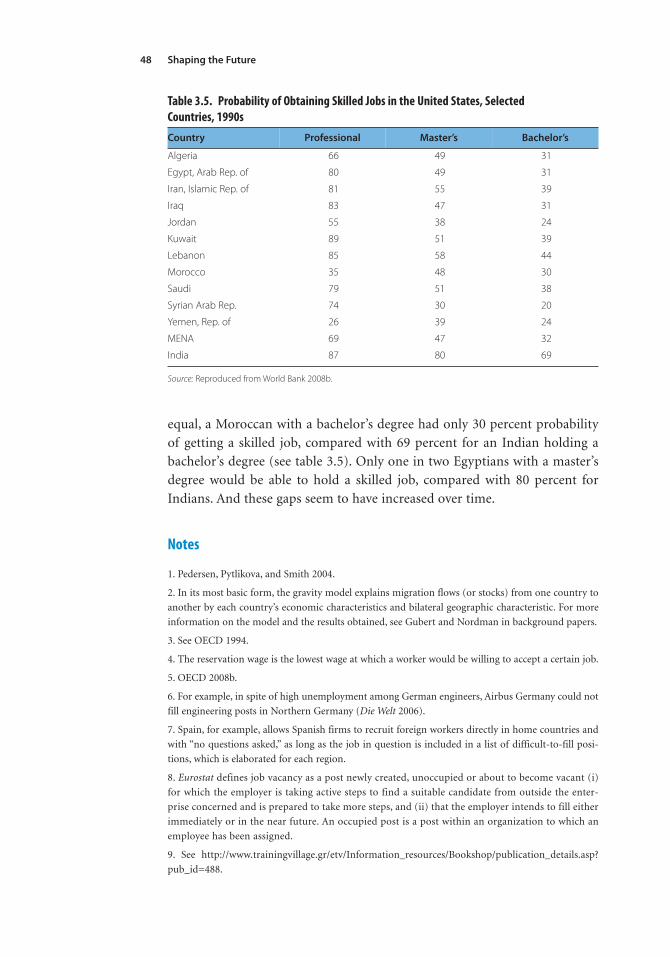
Shaping the Future48
equal, a Moroccan with a bachelor’s degree had only 30 percent probability
of getting a skilled job, compared with 69 percent for an Indian holding a
bachelor’s degree (see table 3.5). Only one in two Egyptians with a master’s
degree would be able to hold a skilled job, compared with 80 percent for
Indians. And these gaps seem to have increased over time.
Notes
1. Pedersen, Pytlikova, and Smith 2004.
2. In its most basic form, the gravity model explains migration flows (or stocks) from one country to
another by each country’s economic characteristics and bilateral geographic characteristic. For more
information on the model and the results obtained, see Gubert and Nordman in background papers.
3. See OECD 1994.
4. The reservation wage is the lowest wage at which a worker would be willing to accept a certain job.
5. OECD 2008b.
6. For example, in spite of high unemployment among German engineers, Airbus Germany could not
fill engineering posts in Northern Germany (Die Welt 2006).
7. Spain, for example, allows Spanish firms to recruit foreign workers directly in home countries and
with “no questions asked,” as long as the job in question is included in a list of difficult-to-fill posi-
tions, which is elaborated for each region.
8. Eurostat defines job vacancy as a post newly created, unoccupied or about to become vacant (i)
for which the employer is taking active steps to find a suitable candidate from outside the enter-
prise concerned and is prepared to take more steps, and (ii) that the employer intends to fill either
immediately or in the near future. An occupied post is a post within an organization to which an
employee has been assigned.
9. See http://www.trainingvillage.gr/etv/Information_resources/Bookshop/publication_details.asp?
pub_id=488.
Table 3.5. Probability of Obtaining Skilled Jobs in the United States, Selected Countries, 1990s
Country Professional Master’s Bachelor’s
Algeria 66 49 31
Egypt, Arab Rep. of 80 49 31
Iran, Islamic Rep. of 81 55 39
Iraq 83 47 31
Jordan 55 38 24
Kuwait 89 51 39
Lebanon 85 58 44
Morocco 35 48 30
Saudi 79 51 38
Syrian Arab Rep. 74 30 20
Yemen, Rep. of 26 39 24
MENA 69 47 32
India 87 80 69
Source: Reproduced from World Bank 2008b.

Demand and Supply Framework 49
10. These changes reflect both increasing qualification levels of the workforce (supply) and an
increasing need for higher qualifications across all jobs.
11. This situation has been abundantly described by MENA researchers: see, in particular, Zahlan 1980,
1999; Corm 1997.
12. World Bank 2008.
13. Ibid.
14. World Bank 2007b.
15. A significant proportion of population movements within and from MENA results from political
instability and armed conflicts. Over the recent period, people from Algeria, Iraq, and the Islamic
Republic of Iran have been among the largest groups of asylum seekers in Europe.
16. Calculations made with data available at www.oecd.org/pisa.

51
Migration in the Long Term:
The Outlook for the Next
Generations
4
Can migration help mitigate demographic gaps, population aging, and global
labor market imbalances? The first half of this century will see considerable
disparities in demographic developments between rich and poor countries.
The former will experience a rapidly aging population and labor force short-
ages, while the working-age populations will continue to grow rapidly in the
latter. These disparities create opportunities for demographic arbitrage-
reducing labor market imbalances through increased labor mobility for the
benefit of both the sending and receiving regions. From a quantitative per-
spective, the diverging demographic trends and structural differences between
most European countries and MENA’s economies suggest that there are
synergies to explore.
Yet, whether increased labor mobility from the MENA Region can com-
pensate for the aging labor force in Europe will depend crucially on whether
MENA’s skill supply matches Europe’s skill requirements. Moreover, MENA,
like some other developing regions, will increasingly face problems similar
to those of Europe: a rapidly aging workforce and a growing contingent of
elderly dependents. Within MENA, the Gulf Cooperation Council (GCC)
countries provide something of a special case—they are not, demographically,
experiencing a shrinking labor force, but their economies are dependent on a
large migrant labor force.
This chapter presents demographic projections available from the United
Nations, with a focus on demographic imbalances between European and
MENA countries. Different scenarios for education profiles and labor force
participation rates are provided to investigate the extent to which Europe,
through different policy measures including migration, could meet this
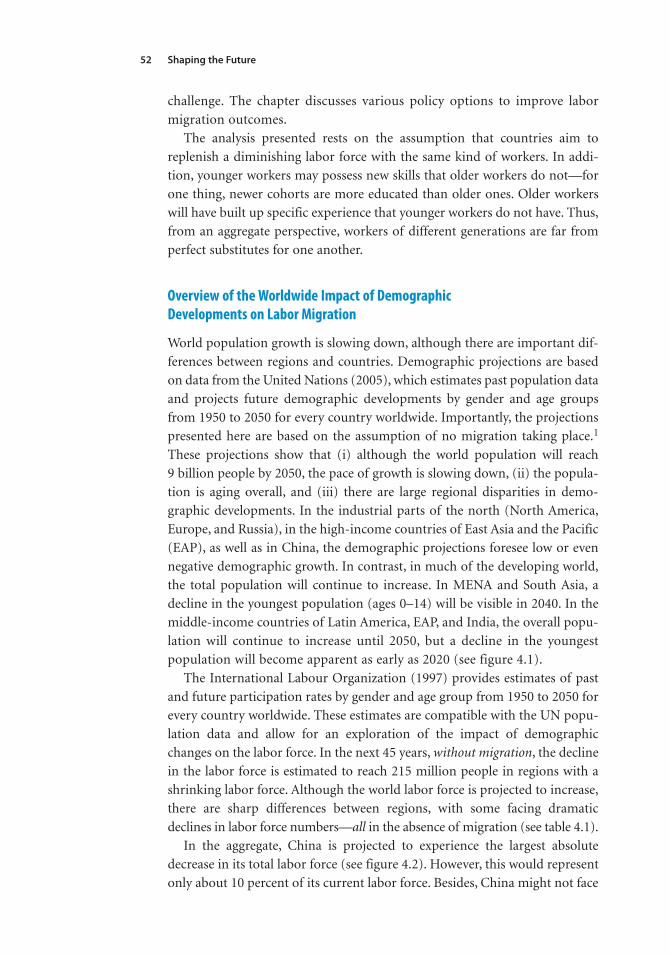
Shaping the Future52
challenge. The chapter discusses various policy options to improve labor
migration outcomes.
The analysis presented rests on the assumption that countries aim to
replenish a diminishing labor force with the same kind of workers. In addi-
tion, younger workers may possess new skills that older workers do not—for
one thing, newer cohorts are more educated than older ones. Older workers
will have built up specific experience that younger workers do not have. Thus,
from an aggregate perspective, workers of different generations are far from
perfect substitutes for one another.
Overview of the Worldwide Impact of Demographic Developments on Labor Migration
World population growth is slowing down, although there are important dif-
ferences between regions and countries. Demographic projections are based
on data from the United Nations (2005), which estimates past population data
and projects future demographic developments by gender and age groups
from 1950 to 2050 for every country worldwide. Importantly, the projections
presented here are based on the assumption of no migration taking place.1
These projections show that (i) although the world population will reach
9 billion people by 2050, the pace of growth is slowing down, (ii) the popula-
tion is aging overall, and (iii) there are large regional disparities in demo-
graphic developments. In the industrial parts of the north (North America,
Europe, and Russia), in the high-income countries of East Asia and the Pacific
(EAP), as well as in China, the demographic projections foresee low or even
negative demographic growth. In contrast, in much of the developing world,
the total population will continue to increase. In MENA and South Asia, a
decline in the youngest population (ages 0–14) will be visible in 2040. In the
middle-income countries of Latin America, EAP, and India, the overall popu-
lation will continue to increase until 2050, but a decline in the youngest
population will become apparent as early as 2020 (see figure 4.1).
The International Labour Organization (1997) provides estimates of past
and future participation rates by gender and age group from 1950 to 2050 for
every country worldwide. These estimates are compatible with the UN popu-
lation data and allow for an exploration of the impact of demographic
changes on the labor force. In the next 45 years, without migration, the decline
in the labor force is estimated to reach 215 million people in regions with a
shrinking labor force. Although the world labor force is projected to increase,
there are sharp differences between regions, with some facing dramatic
declines in labor force numbers—all in the absence of migration (see table 4.1).
In the aggregate, China is projected to experience the largest absolute
decrease in its total labor force (see figure 4.2). However, this would represent
only about 10 percent of its current labor force. Besides, China might not face
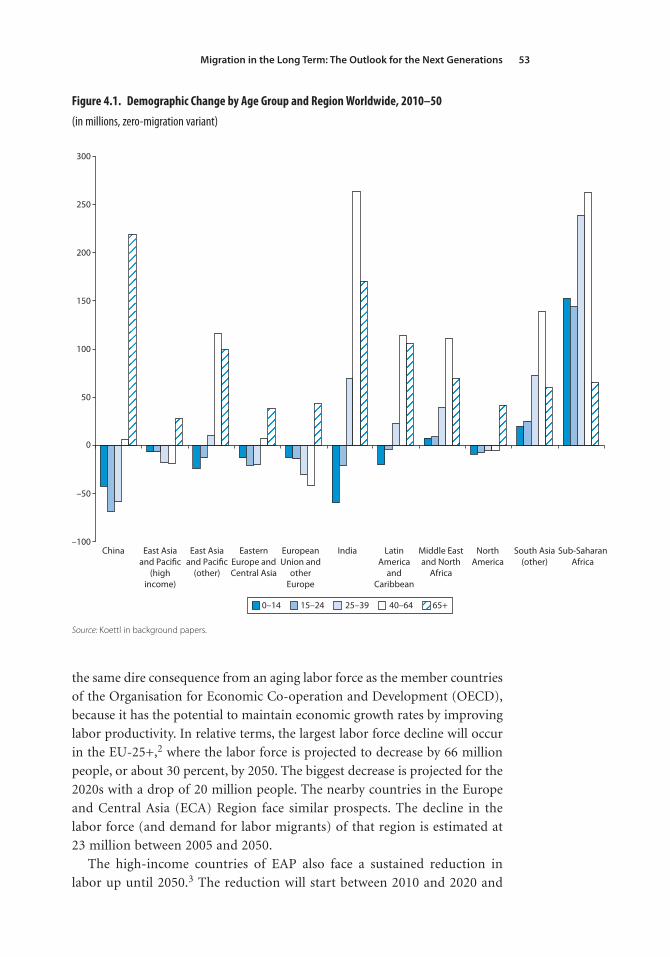
Migration in the Long Term: The Outlook for the Next Generations 53
the same dire consequence from an aging labor force as the member countries
of the Organisation for Economic Co-operation and Development (OECD),
because it has the potential to maintain economic growth rates by improving
labor productivity. In relative terms, the largest labor force decline will occur
in the EU-25+,2 where the labor force is projected to decrease by 66 million
people, or about 30 percent, by 2050. The biggest decrease is projected for the
2020s with a drop of 20 million people. The nearby countries in the Europe
and Central Asia (ECA) Region face similar prospects. The decline in the
labor force (and demand for labor migrants) of that region is estimated at
23 million between 2005 and 2050.
The high-income countries of EAP also face a sustained reduction in
labor up until 2050.3 The reduction will start between 2010 and 2020 and
Figure 4.1. Demographic Change by Age Group and Region Worldwide, 2010–50
(in millions, zero-migration variant)
–100
–50
0
50
100
150
200
250
300
East Asiaand Pacific
(other)
EasternEurope andCentral Asia
EuropeanUnion and
otherEurope
China East Asiaand Pacific
(highincome)
India LatinAmerica
andCaribbean
Middle Eastand North
Africa
NorthAmerica
South Asia(other)
Sub-SaharanAfrica
0–14 15–24 25–39 40–64 65+
Source: Koettl in background papers.
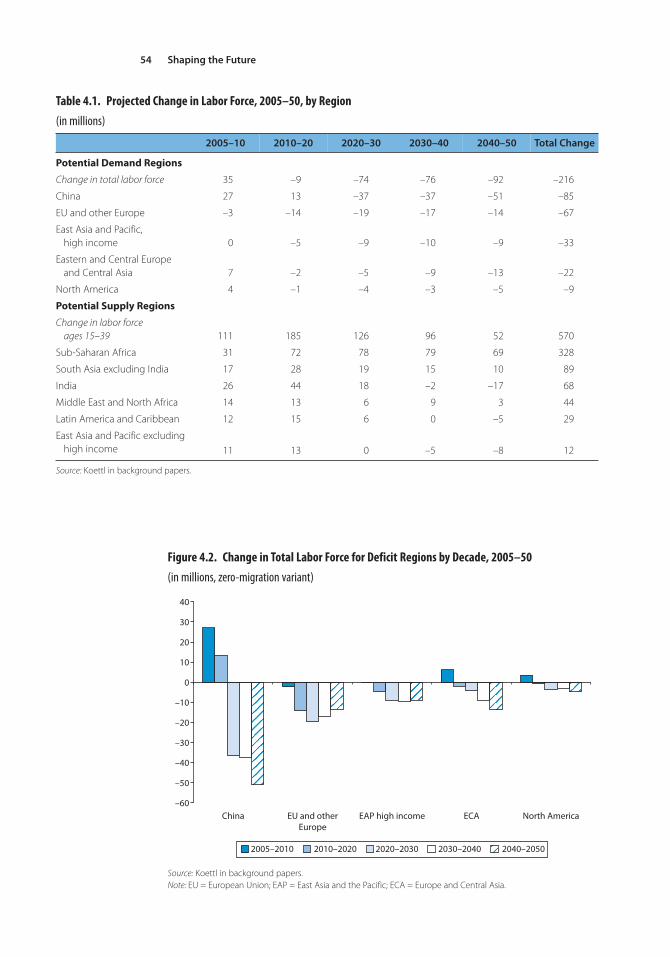
Shaping the Future54
Table 4.1. Projected Change in Labor Force, 2005–50, by Region
(in millions)
2005–10 2010–20 2020–30 2030–40 2040–50 Total Change
Potential Demand Regions
Change in total labor force 35 –9 –74 –76 –92 –216
China 27 13 –37 –37 –51 –85
EU and other Europe –3 –14 –19 –17 –14 –67
East Asia and Pacific, high income 0 –5 –9 –10 –9 –33
Eastern and Central Europe and Central Asia 7 –2 –5 –9 –13 –22
North America 4 –1 –4 –3 –5 –9
Potential Supply Regions
Change in labor force ages 15–39 111 185 126 96 52 570
Sub-Saharan Africa 31 72 78 79 69 328
South Asia excluding India 17 28 19 15 10 89
India 26 44 18 –2 –17 68
Middle East and North Africa 14 13 6 9 3 44
Latin America and Caribbean 12 15 6 0 –5 29
East Asia and Pacific excludinghigh income 11 13 0 –5 –8 12
Source: Koettl in background papers.
Figure 4.2. Change in Total Labor Force for Deficit Regions by Decade, 2005–50
(in millions, zero-migration variant)
–60
–50
–40
–30
–20
–10
0
10
20
30
40
China EU and otherEurope
EAP high income ECA North America
2005–2010 2010–2020 2020–2030 2030–2040 2040–2050
Source: Koettl in background papers.Note: EU = European Union; EAP = East Asia and the Pacific; ECA = Europe and Central Asia.
Migration in the Long Term: The Outlook for the Next Generations 55
will continue in the 2030s, with a loss of almost 10 million people in that
decade. In total, the labor force is projected to decline by 33 million people
by 2050.
In Canada and the United States, which have been traditional countries of
immigration, the decline is more moderate, at about 9 million people occur-
ring after 2010. North America appears to have a relatively stable labor force
because of its relatively high fertility rate.
In contrast, other and generally poorer regions would have migrant labor to
offer. Because of the nature of migration and the costs of uprooting individu-
als and workers, migrants are most likely to come from the pool of young
workers, that is, those between the ages of 15 and 39. This group will be the
largest in the countries of Sub-Saharan Africa, followed by South Asia and
MENA (see figure 4.3). In Sub-Saharan Africa, in the next 45 years or so, the
labor force in the age group 15–39 is projected to increase by a total of 328 mil-
lion by 2050.4 India and the other South Asian countries are projected to be the
second-largest potential suppliers of migrant labor with, respectively, an
increase of 68 million and 89 million people in the labor force between 15 and
39 years old. In the MENA Region, the increase in the labor force in the same
age group is estimated to reach 44 million people, compared with 29 million
in Latin America and the Caribbean (LAC), and 12 million in EAP. However,
except in Sub-Saharan Africa, the supply of migrant labor will decline after
2020. Beyond 2030, India, EAP, and LAC will experience declining labor forces.
Figure 4.3. Change in Total Labor Force for Growing Regions by Decade, 2005–50(in millions, zero-migration variant)
–40
–20
0
20
40
60
80
100
EAP lowincome
India LAC MENA SA excl India SSA
2005–2010 2010–2020 2020–2030 2030–2040 2040–2050
Source: Koettl in background papers.Note: EAP = East Asia and the Pacific; ECA = Europe and Central Asia; LAC = Latin America and the Caribbean; MENA =Middle East and North Africa; SA = South Asia; SSA = Sub-Saharan Africa.
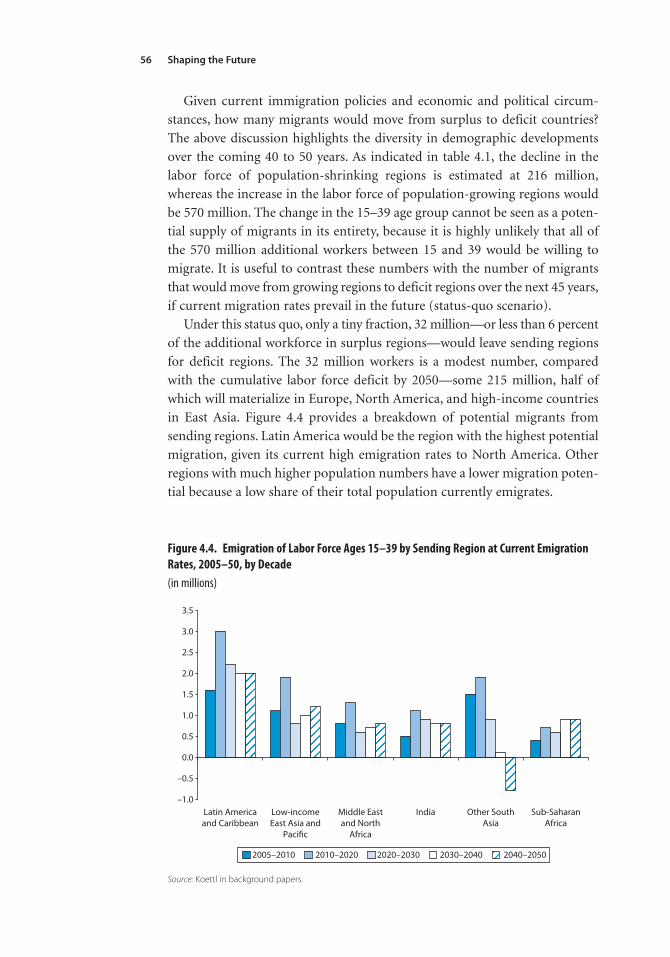
Shaping the Future56
Given current immigration policies and economic and political circum-
stances, how many migrants would move from surplus to deficit countries?
The above discussion highlights the diversity in demographic developments
over the coming 40 to 50 years. As indicated in table 4.1, the decline in the
labor force of population-shrinking regions is estimated at 216 million,
whereas the increase in the labor force of population-growing regions would
be 570 million. The change in the 15–39 age group cannot be seen as a poten-
tial supply of migrants in its entirety, because it is highly unlikely that all of
the 570 million additional workers between 15 and 39 would be willing to
migrate. It is useful to contrast these numbers with the number of migrants
that would move from growing regions to deficit regions over the next 45 years,
if current migration rates prevail in the future (status-quo scenario).
Under this status quo, only a tiny fraction, 32 million—or less than 6 percent
of the additional workforce in surplus regions—would leave sending regions
for deficit regions. The 32 million workers is a modest number, compared
with the cumulative labor force deficit by 2050—some 215 million, half of
which will materialize in Europe, North America, and high-income countries
in East Asia. Figure 4.4 provides a breakdown of potential migrants from
sending regions. Latin America would be the region with the highest potential
migration, given its current high emigration rates to North America. Other
regions with much higher population numbers have a lower migration poten-
tial because a low share of their total population currently emigrates.
Figure 4.4. Emigration of Labor Force Ages 15–39 by Sending Region at Current EmigrationRates, 2005–50, by Decade (in millions)
–1.0
–0.5
0.0
0.5
1.0
1.5
2.0
2.5
3.0
3.5
Latin Americaand Caribbean
Low-incomeEast Asia and
Pacific
Middle Eastand North
Africa
India Other SouthAsia
Sub-SaharanAfrica
2005–2010 2010–2020 2020–2030 2030–2040 2040–2050
Source: Koettl in background papers.
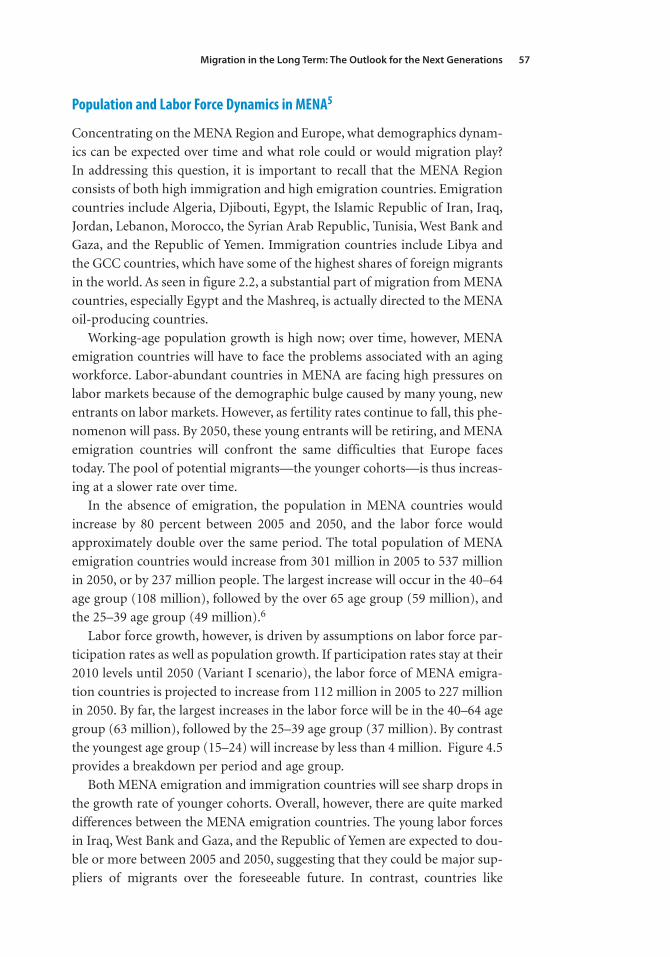
Migration in the Long Term: The Outlook for the Next Generations 57
Population and Labor Force Dynamics in MENA5
Concentrating on the MENA Region and Europe, what demographics dynam-
ics can be expected over time and what role could or would migration play?
In addressing this question, it is important to recall that the MENA Region
consists of both high immigration and high emigration countries. Emigration
countries include Algeria, Djibouti, Egypt, the Islamic Republic of Iran, Iraq,
Jordan, Lebanon, Morocco, the Syrian Arab Republic, Tunisia, West Bank and
Gaza, and the Republic of Yemen. Immigration countries include Libya and
the GCC countries, which have some of the highest shares of foreign migrants
in the world. As seen in figure 2.2, a substantial part of migration from MENA
countries, especially Egypt and the Mashreq, is actually directed to the MENA
oil-producing countries.
Working-age population growth is high now; over time, however, MENA
emigration countries will have to face the problems associated with an aging
workforce. Labor-abundant countries in MENA are facing high pressures on
labor markets because of the demographic bulge caused by many young, new
entrants on labor markets. However, as fertility rates continue to fall, this phe-
nomenon will pass. By 2050, these young entrants will be retiring, and MENA
emigration countries will confront the same difficulties that Europe faces
today. The pool of potential migrants—the younger cohorts—is thus increas-
ing at a slower rate over time.
In the absence of emigration, the population in MENA countries would
increase by 80 percent between 2005 and 2050, and the labor force would
approximately double over the same period. The total population of MENA
emigration countries would increase from 301 million in 2005 to 537 million
in 2050, or by 237 million people. The largest increase will occur in the 40–64
age group (108 million), followed by the over 65 age group (59 million), and
the 25–39 age group (49 million).6
Labor force growth, however, is driven by assumptions on labor force par-
ticipation rates as well as population growth. If participation rates stay at their
2010 levels until 2050 (Variant I scenario), the labor force of MENA emigra-
tion countries is projected to increase from 112 million in 2005 to 227 million
in 2050. By far, the largest increases in the labor force will be in the 40–64 age
group (63 million), followed by the 25–39 age group (37 million). By contrast
the youngest age group (15–24) will increase by less than 4 million. Figure 4.5
provides a breakdown per period and age group.
Both MENA emigration and immigration countries will see sharp drops in
the growth rate of younger cohorts. Overall, however, there are quite marked
differences between the MENA emigration countries. The young labor forces
in Iraq, West Bank and Gaza, and the Republic of Yemen are expected to dou-
ble or more between 2005 and 2050, suggesting that they could be major sup-
pliers of migrants over the foreseeable future. In contrast, countries like
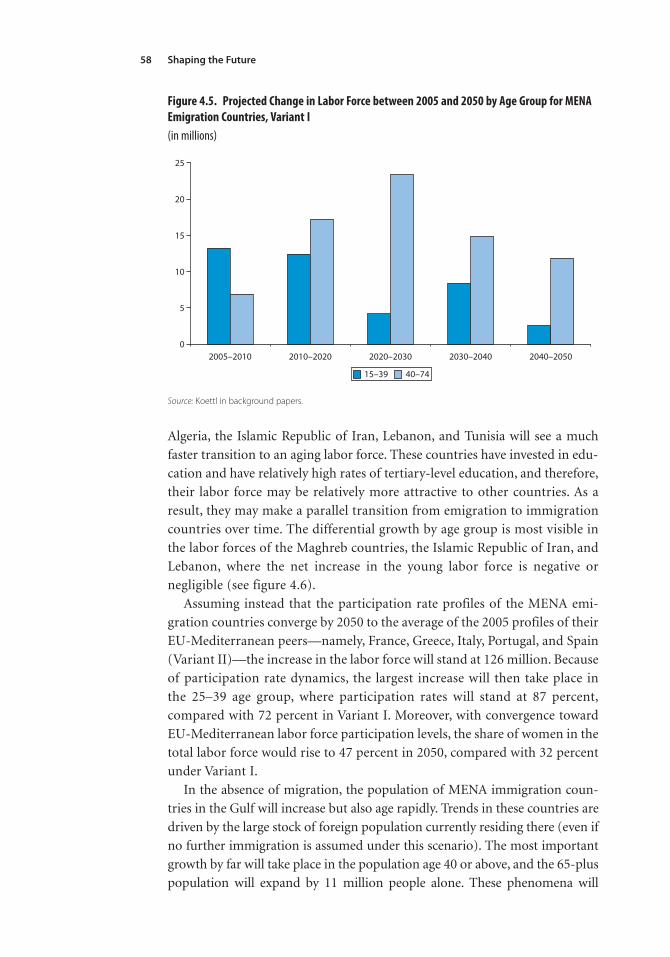
Shaping the Future58
Algeria, the Islamic Republic of Iran, Lebanon, and Tunisia will see a much
faster transition to an aging labor force. These countries have invested in edu-
cation and have relatively high rates of tertiary-level education, and therefore,
their labor force may be relatively more attractive to other countries. As a
result, they may make a parallel transition from emigration to immigration
countries over time. The differential growth by age group is most visible in
the labor forces of the Maghreb countries, the Islamic Republic of Iran, and
Lebanon, where the net increase in the young labor force is negative or
negligible (see figure 4.6).
Assuming instead that the participation rate profiles of the MENA emi-
gration countries converge by 2050 to the average of the 2005 profiles of their
EU-Mediterranean peers—namely, France, Greece, Italy, Portugal, and Spain
(Variant II)—the increase in the labor force will stand at 126 million. Because
of participation rate dynamics, the largest increase will then take place in
the 25–39 age group, where participation rates will stand at 87 percent,
compared with 72 percent in Variant I. Moreover, with convergence toward
EU-Mediterranean labor force participation levels, the share of women in the
total labor force would rise to 47 percent in 2050, compared with 32 percent
under Variant I.
In the absence of migration, the population of MENA immigration coun-
tries in the Gulf will increase but also age rapidly. Trends in these countries are
driven by the large stock of foreign population currently residing there (even if
no further immigration is assumed under this scenario). The most important
growth by far will take place in the population age 40 or above, and the 65-plus
population will expand by 11 million people alone. These phenomena will
Figure 4.5. Projected Change in Labor Force between 2005 and 2050 by Age Group for MENAEmigration Countries, Variant I(in millions)
0
5
10
15
20
25
2005–2010 2010–2020 2020–2030 2030–2040 2040–2050
15–39 40–74
Source: Koettl in background papers.
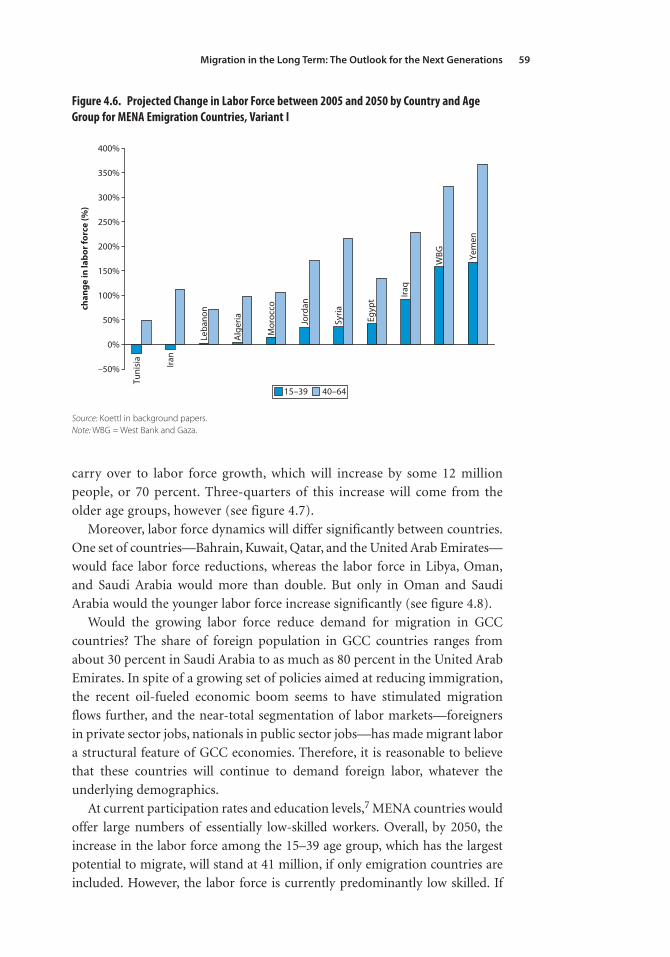
Migration in the Long Term: The Outlook for the Next Generations 59
carry over to labor force growth, which will increase by some 12 million
people, or 70 percent. Three-quarters of this increase will come from the
older age groups, however (see figure 4.7).
Moreover, labor force dynamics will differ significantly between countries.
One set of countries—Bahrain, Kuwait, Qatar, and the United Arab Emirates—
would face labor force reductions, whereas the labor force in Libya, Oman,
and Saudi Arabia would more than double. But only in Oman and Saudi
Arabia would the younger labor force increase significantly (see figure 4.8).
Would the growing labor force reduce demand for migration in GCC
countries? The share of foreign population in GCC countries ranges from
about 30 percent in Saudi Arabia to as much as 80 percent in the United Arab
Emirates. In spite of a growing set of policies aimed at reducing immigration,
the recent oil-fueled economic boom seems to have stimulated migration
flows further, and the near-total segmentation of labor markets—foreigners
in private sector jobs, nationals in public sector jobs—has made migrant labor
a structural feature of GCC economies. Therefore, it is reasonable to believe
that these countries will continue to demand foreign labor, whatever the
underlying demographics.
At current participation rates and education levels,7 MENA countries would
offer large numbers of essentially low-skilled workers. Overall, by 2050, the
increase in the labor force among the 15–39 age group, which has the largest
potential to migrate, will stand at 41 million, if only emigration countries are
included. However, the labor force is currently predominantly low skilled. If
Figure 4.6. Projected Change in Labor Force between 2005 and 2050 by Country and AgeGroup for MENA Emigration Countries, Variant I
Tuni
sia
Iran
Leba
non
Alg
eria
Mor
occo
Jord
an
Syria
Egyp
t Iraq
WBG Ye
men
–50%
0%
50%
100%
150%
200%
250%
300%
350%
400%
chan
ge in
labo
r for
ce (%
)
15–39 40–64
Source: Koettl in background papers.Note: WBG = West Bank and Gaza.
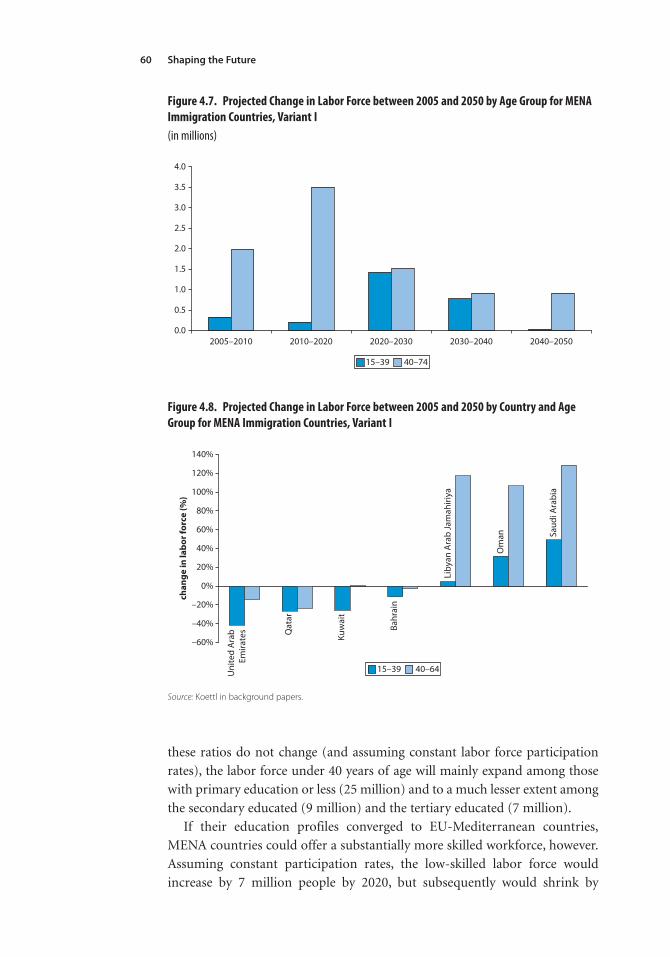
Shaping the Future60
these ratios do not change (and assuming constant labor force participation
rates), the labor force under 40 years of age will mainly expand among those
with primary education or less (25 million) and to a much lesser extent among
the secondary educated (9 million) and the tertiary educated (7 million).
If their education profiles converged to EU-Mediterranean countries,
MENA countries could offer a substantially more skilled workforce, however.
Assuming constant participation rates, the low-skilled labor force would
increase by 7 million people by 2020, but subsequently would shrink by
Figure 4.7. Projected Change in Labor Force between 2005 and 2050 by Age Group for MENAImmigration Countries, Variant I (in millions)
0.0
0.5
1.0
1.5
2.0
2.5
3.0
3.5
4.0
2005–2010 2010–2020 2020–2030 2030–2040 2040–2050
15–39 40–74
Figure 4.8. Projected Change in Labor Force between 2005 and 2050 by Country and AgeGroup for MENA Immigration Countries, Variant I
Uni
ted
Ara
bEm
irate
s Qat
ar
Kuw
ait
Bahr
ain
Liby
an A
rab
Jam
ahiri
ya
Om
an Saud
i Ara
bia
–60%
–40%
–20%
0%
20%
40%
60%
80%
100%
120%
140%
chan
ge in
labo
r for
ce (%
)
15–39 40–64
Source: Koettl in background papers.
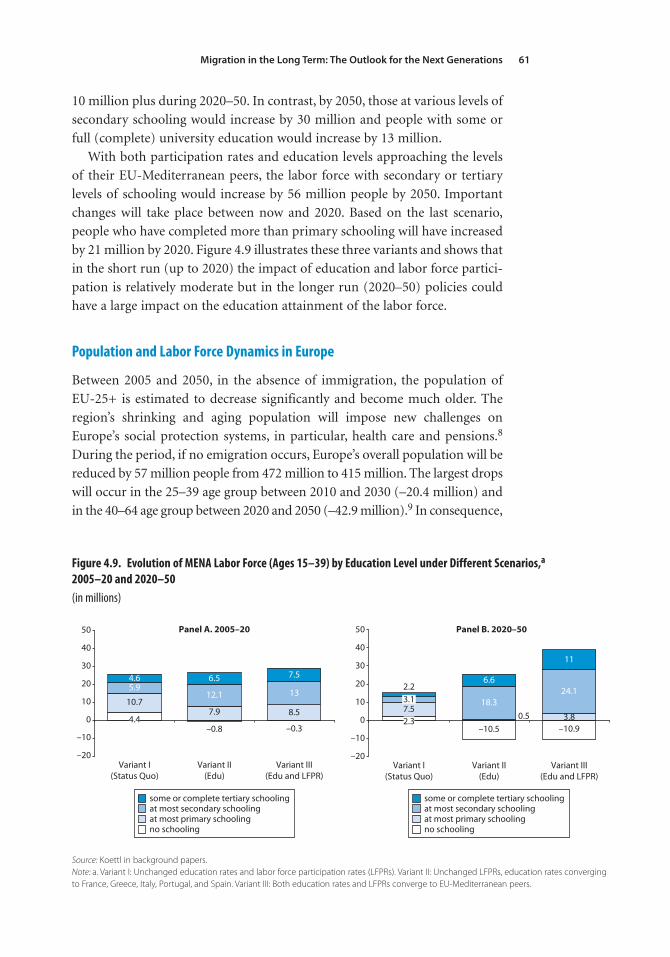
Migration in the Long Term: The Outlook for the Next Generations 61
10 million plus during 2020–50. In contrast, by 2050, those at various levels of
secondary schooling would increase by 30 million and people with some or
full (complete) university education would increase by 13 million.
With both participation rates and education levels approaching the levels
of their EU-Mediterranean peers, the labor force with secondary or tertiary
levels of schooling would increase by 56 million people by 2050. Important
changes will take place between now and 2020. Based on the last scenario,
people who have completed more than primary schooling will have increased
by 21 million by 2020. Figure 4.9 illustrates these three variants and shows that
in the short run (up to 2020) the impact of education and labor force partici-
pation is relatively moderate but in the longer run (2020–50) policies could
have a large impact on the education attainment of the labor force.
Population and Labor Force Dynamics in Europe
Between 2005 and 2050, in the absence of immigration, the population of
EU-25+ is estimated to decrease significantly and become much older. The
region’s shrinking and aging population will impose new challenges on
Europe’s social protection systems, in particular, health care and pensions.8
During the period, if no emigration occurs, Europe’s overall population will be
reduced by 57 million people from 472 million to 415 million. The largest drops
will occur in the 25–39 age group between 2010 and 2030 (–20.4 million) and
in the 40–64 age group between 2020 and 2050 (–42.9 million).9 In consequence,
Figure 4.9. Evolution of MENA Labor Force (Ages 15–39) by Education Level under Different Scenarios,a
2005–20 and 2020–50 (in millions)
8.5
12.1 13
4.6 6.5 7.5
–0.8 –0.34.4
10.77.9
5.9
–20
–10
0
10
20
30
40
50 Panel A. 2005–20 Panel B. 2020–50
Variant I(Status Quo)
Variant II(Edu)
Variant III(Edu and LFPR)
7.53.8
18.324.1
6.6
11
–10.5 –10.92.3 0.5
2.2
–20
–10
0
10
20
30
40
50
Variant I(Status Quo)
Variant II(Edu)
Variant III(Edu and LFPR)
3.1
some or complete tertiary schoolingat most secondary schoolingat most primary schoolingno schooling
some or complete tertiary schoolingat most secondary schoolingat most primary schoolingno schooling
Source: Koettl in background papers.Note: a. Variant I: Unchanged education rates and labor force participation rates (LFPRs). Variant II: Unchanged LFPRs, education rates convergingto France, Greece, Italy, Portugal, and Spain. Variant III: Both education rates and LFPRs converge to EU-Mediterranean peers.
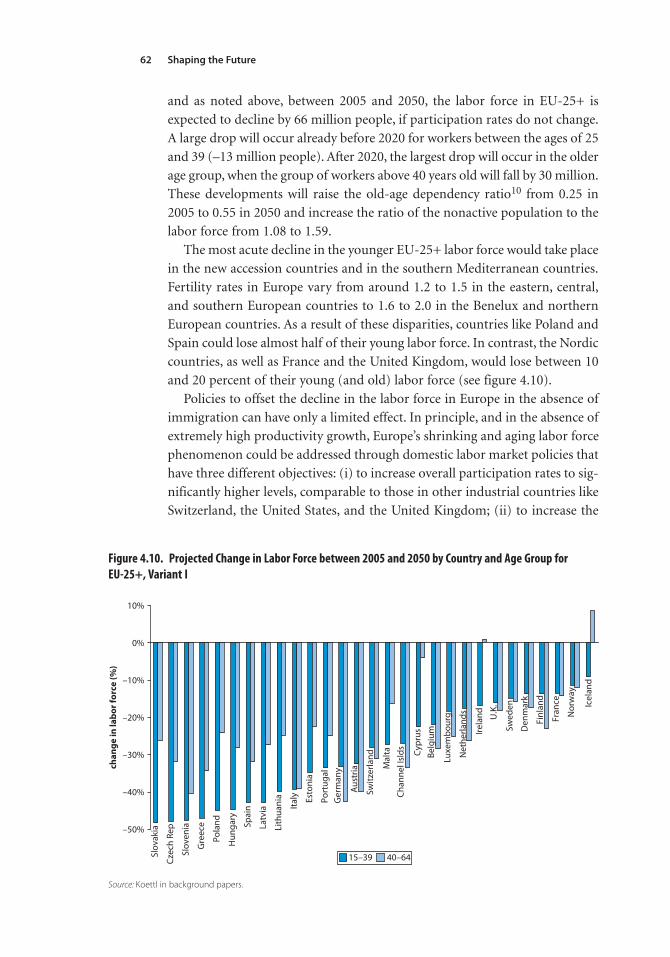
Shaping the Future62
and as noted above, between 2005 and 2050, the labor force in EU-25+ is
expected to decline by 66 million people, if participation rates do not change.
A large drop will occur already before 2020 for workers between the ages of 25
and 39 (–13 million people). After 2020, the largest drop will occur in the older
age group, when the group of workers above 40 years old will fall by 30 million.
These developments will raise the old-age dependency ratio10 from 0.25 in
2005 to 0.55 in 2050 and increase the ratio of the nonactive population to the
labor force from 1.08 to 1.59.
The most acute decline in the younger EU-25+ labor force would take place
in the new accession countries and in the southern Mediterranean countries.
Fertility rates in Europe vary from around 1.2 to 1.5 in the eastern, central,
and southern European countries to 1.6 to 2.0 in the Benelux and northern
European countries. As a result of these disparities, countries like Poland and
Spain could lose almost half of their young labor force. In contrast, the Nordic
countries, as well as France and the United Kingdom, would lose between 10
and 20 percent of their young (and old) labor force (see figure 4.10).
Policies to offset the decline in the labor force in Europe in the absence of
immigration can have only a limited effect. In principle, and in the absence of
extremely high productivity growth, Europe’s shrinking and aging labor force
phenomenon could be addressed through domestic labor market policies that
have three different objectives: (i) to increase overall participation rates to sig-
nificantly higher levels, comparable to those in other industrial countries like
Switzerland, the United States, and the United Kingdom; (ii) to increase the
Figure 4.10. Projected Change in Labor Force between 2005 and 2050 by Country and Age Group for EU-25+, Variant I
Slov
akia
Czec
h Re
p
Slov
enia
Gre
ece
Pola
nd
Hun
gary
Spai
n
Latv
ia
Lith
uani
a
Italy Es
toni
a
Port
ugal
Ger
man
y
Aus
tria
Switz
erla
nd
Mal
ta
Chan
nel I
slds Cy
prus
Belg
ium
Luxe
mbo
urg
Net
herla
nds
Irela
nd U.K
.
Swed
en
Den
mar
k
Finl
and
Fran
ce
Nor
way
Icel
and
–50%
–40%
–30%
–20%
–10%
0%
10%
chan
ge in
labo
r for
ce (%
)
15–39 40–64
Source: Koettl in background papers.
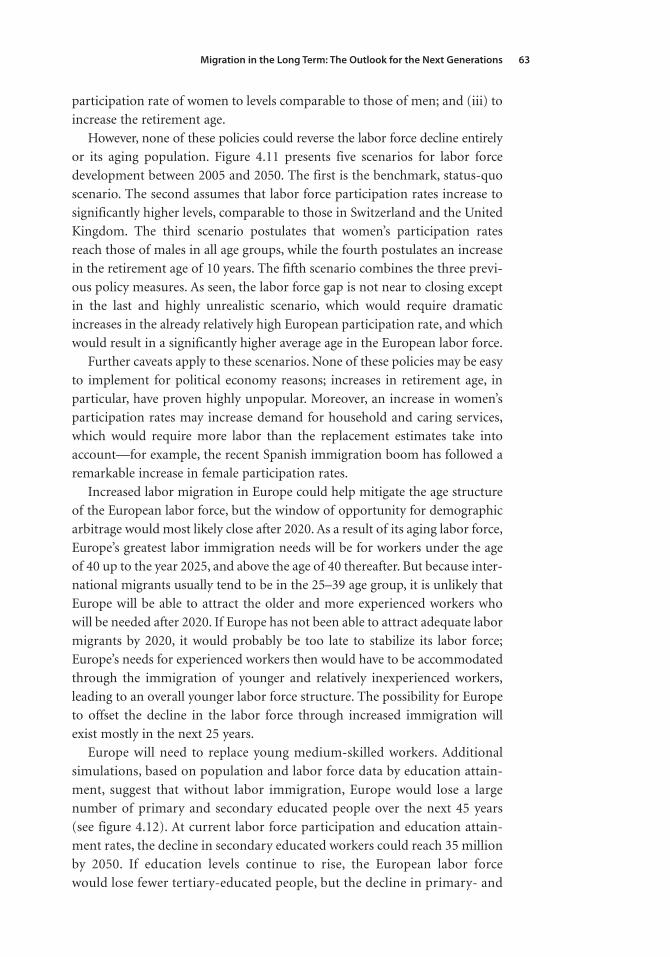
Migration in the Long Term: The Outlook for the Next Generations 63
participation rate of women to levels comparable to those of men; and (iii) to
increase the retirement age.
However, none of these policies could reverse the labor force decline entirely
or its aging population. Figure 4.11 presents five scenarios for labor force
development between 2005 and 2050. The first is the benchmark, status-quo
scenario. The second assumes that labor force participation rates increase to
significantly higher levels, comparable to those in Switzerland and the United
Kingdom. The third scenario postulates that women’s participation rates
reach those of males in all age groups, while the fourth postulates an increase
in the retirement age of 10 years. The fifth scenario combines the three previ-
ous policy measures. As seen, the labor force gap is not near to closing except
in the last and highly unrealistic scenario, which would require dramatic
increases in the already relatively high European participation rate, and which
would result in a significantly higher average age in the European labor force.
Further caveats apply to these scenarios. None of these policies may be easy
to implement for political economy reasons; increases in retirement age, in
particular, have proven highly unpopular. Moreover, an increase in women’s
participation rates may increase demand for household and caring services,
which would require more labor than the replacement estimates take into
account—for example, the recent Spanish immigration boom has followed a
remarkable increase in female participation rates.
Increased labor migration in Europe could help mitigate the age structure
of the European labor force, but the window of opportunity for demographic
arbitrage would most likely close after 2020. As a result of its aging labor force,
Europe’s greatest labor immigration needs will be for workers under the age
of 40 up to the year 2025, and above the age of 40 thereafter. But because inter-
national migrants usually tend to be in the 25–39 age group, it is unlikely that
Europe will be able to attract the older and more experienced workers who
will be needed after 2020. If Europe has not been able to attract adequate labor
migrants by 2020, it would probably be too late to stabilize its labor force;
Europe’s needs for experienced workers then would have to be accommodated
through the immigration of younger and relatively inexperienced workers,
leading to an overall younger labor force structure. The possibility for Europe
to offset the decline in the labor force through increased immigration will
exist mostly in the next 25 years.
Europe will need to replace young medium-skilled workers. Additional
simulations, based on population and labor force data by education attain-
ment, suggest that without labor immigration, Europe would lose a large
number of primary and secondary educated people over the next 45 years
(see figure 4.12). At current labor force participation and education attain-
ment rates, the decline in secondary educated workers could reach 35 million
by 2050. If education levels continue to rise, the European labor force
would lose fewer tertiary-educated people, but the decline in primary- and
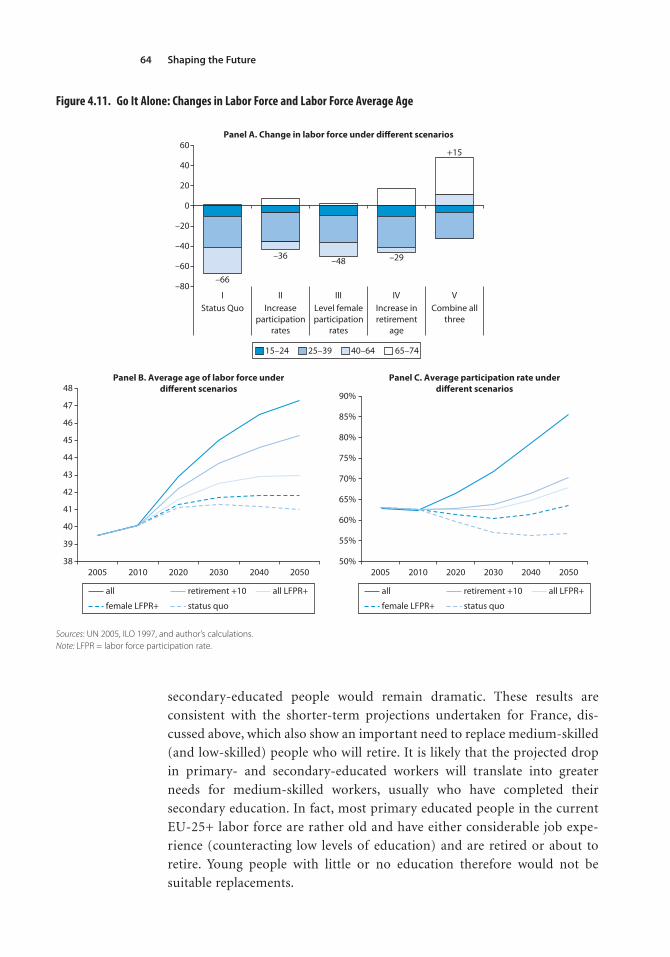
Shaping the Future64
secondary-educated people would remain dramatic. These results are
consistent with the shorter-term projections undertaken for France, dis-
cussed above, which also show an important need to replace medium-skilled
(and low-skilled) people who will retire. It is likely that the projected drop
in primary- and secondary-educated workers will translate into greater
needs for medium-skilled workers, usually who have completed their
secondary education. In fact, most primary educated people in the current
EU-25+ labor force are rather old and have either considerable job expe-
rience (counteracting low levels of education) and are retired or about to
retire. Young people with little or no education therefore would not be
suitable replacements.
Figure 4.11. Go It Alone: Changes in Labor Force and Labor Force Average Age
–80
–60
–40
–20
0
20
40
60
I II III IV V
Status Quo Increaseparticipation
rates
Level femaleparticipation
rates
Increase inretirement
age
Combine allthree
–66
–48–36 –29
+15
Panel A. Change in labor force under different scenarios
15–24 25–39 40–64 65–74
38
39
40
41
42
43
44
45
46
47
48
50%
55%
60%
65%
70%
75%
80%
85%
90%
2005 2010 2020 2030 2040 2050 2005 2010 2020 2030 2040 2050
Panel B. Average age of labor force underdifferent scenarios
Panel C. Average participation rate underdifferent scenarios
all retirement +10 all LFPR+
female LFPR+ status quo
all retirement +10 all LFPR+
female LFPR+ status quo
Sources: UN 2005, ILO 1997, and author’s calculations.Note: LFPR = labor force participation rate.
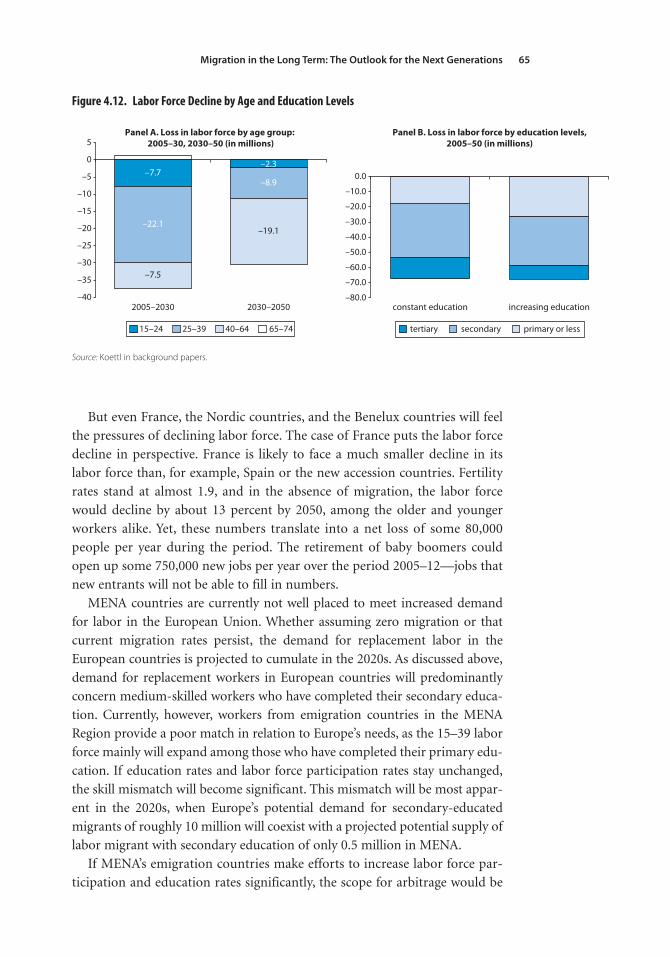
Migration in the Long Term: The Outlook for the Next Generations 65
But even France, the Nordic countries, and the Benelux countries will feel
the pressures of declining labor force. The case of France puts the labor force
decline in perspective. France is likely to face a much smaller decline in its
labor force than, for example, Spain or the new accession countries. Fertility
rates stand at almost 1.9, and in the absence of migration, the labor force
would decline by about 13 percent by 2050, among the older and younger
workers alike. Yet, these numbers translate into a net loss of some 80,000
people per year during the period. The retirement of baby boomers could
open up some 750,000 new jobs per year over the period 2005–12—jobs that
new entrants will not be able to fill in numbers.
MENA countries are currently not well placed to meet increased demand
for labor in the European Union. Whether assuming zero migration or that
current migration rates persist, the demand for replacement labor in the
European countries is projected to cumulate in the 2020s. As discussed above,
demand for replacement workers in European countries will predominantly
concern medium-skilled workers who have completed their secondary educa-
tion. Currently, however, workers from emigration countries in the MENA
Region provide a poor match in relation to Europe’s needs, as the 15–39 labor
force mainly will expand among those who have completed their primary edu-
cation. If education rates and labor force participation rates stay unchanged,
the skill mismatch will become significant. This mismatch will be most appar-
ent in the 2020s, when Europe’s potential demand for secondary-educated
migrants of roughly 10 million will coexist with a projected potential supply of
labor migrant with secondary education of only 0.5 million in MENA.
If MENA’s emigration countries make efforts to increase labor force par-
ticipation and education rates significantly, the scope for arbitrage would be
Figure 4.12. Labor Force Decline by Age and Education Levels
–7.7–2.3
–22.1
–8.9
–7.5
–19.1
–40
–35
–30
–25
–20
–15
–10
–5
0
5
2030–20502005–2030–80.0
–70.0
–60.0
–50.0
–40.0
–30.0
–20.0
–10.0
0.0
Panel B. Loss in labor force by education levels,2005–50 (in millions)
Panel A. Loss in labor force by age group: 2005–30, 2030–50 (in millions)
constant education increasing education
15–24 25–39 40–64 65–74 tertiary secondary primary or less
Source: Koettl in background papers.
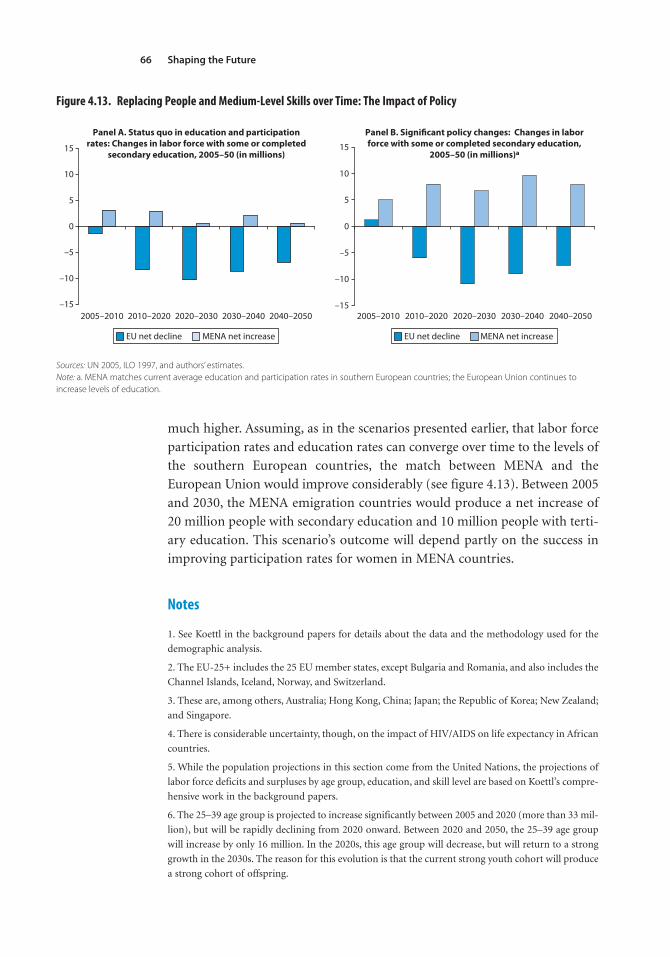
Shaping the Future66
much higher. Assuming, as in the scenarios presented earlier, that labor force
participation rates and education rates can converge over time to the levels of
the southern European countries, the match between MENA and the
European Union would improve considerably (see figure 4.13). Between 2005
and 2030, the MENA emigration countries would produce a net increase of
20 million people with secondary education and 10 million people with terti-
ary education. This scenario’s outcome will depend partly on the success in
improving participation rates for women in MENA countries.
Notes
1. See Koettl in the background papers for details about the data and the methodology used for the
demographic analysis.
2. The EU-25+ includes the 25 EU member states, except Bulgaria and Romania, and also includes the
Channel Islands, Iceland, Norway, and Switzerland.
3. These are, among others, Australia; Hong Kong, China; Japan; the Republic of Korea; New Zealand;
and Singapore.
4. There is considerable uncertainty, though, on the impact of HIV/AIDS on life expectancy in African
countries.
5. While the population projections in this section come from the United Nations, the projections of
labor force deficits and surpluses by age group, education, and skill level are based on Koettl’s compre-
hensive work in the background papers.
6. The 25–39 age group is projected to increase significantly between 2005 and 2020 (more than 33 mil-
lion), but will be rapidly declining from 2020 onward. Between 2020 and 2050, the 25–39 age group
will increase by only 16 million. In the 2020s, this age group will decrease, but will return to a strong
growth in the 2030s. The reason for this evolution is that the current strong youth cohort will produce
a strong cohort of offspring.
Figure 4.13. Replacing People and Medium-Level Skills over Time: The Impact of Policy
–15
–10
–5
0
5
10
15
Panel A. Status quo in education and participationrates: Changes in labor force with some or completed
secondary education, 2005–50 (in millions)
Panel B. Significant policy changes: Changes in laborforce with some or completed secondary education,
2005–50 (in millions)a
–15
–10
–5
0
5
10
15
2005–2010 2010–2020 2020–2030 2030–2040 2040–2050 2005–2010 2010–2020 2020–2030 2030–2040 2040–2050
EU net decline MENA net increase EU net decline MENA net increase
Sources: UN 2005, ILO 1997, and authors’ estimates.Note: a. MENA matches current average education and participation rates in southern European countries; the European Union continues toincrease levels of education.

Migration in the Long Term: The Outlook for the Next Generations 67
7. See Koettl in the background papers, table A9, for the detailed figures.
8. Holzmann 2005.
9. These two age groups are part of the same cohort—the cohort following the baby boomers born in
the 1950s and 1960s (the “demographic echo” of the baby boomers).
10. The old-age dependency ratio is the ratio of the over 65 age group to the 15–64 age group. The
ratio gives the number of people of retirement age per person of working age.

69
A Conceptual Framework
for Policy Makers
5
This study takes a global and regional approach to long-term migration and
job mobility prospects. The objective is to draw attention to imbalances that
will manifest themselves in the future often beyond the time horizon of today’s
policy makers. It argues that only if action is taken today can the potentially
adverse impact of these imbalances be averted and can the opportunities they
offer be seized.
The labor market impact of the demographic trends discussed in the pre-
ceding chapter is marked by two critical factors. First, tomorrow’s demogra-
phy is locked in today’s demographic characteristics, in particular, fertility and
life expectancy.1 Hence policies to reverse those trends will take generations to
achieve their objectives. Second, the quality of tomorrow’s labor force will
depend on today’s reforms because it takes 15 to 20 or more years to educate
a potentially skilled worker from childhood to adulthood.
As discussed above, large-scale global labor market imbalances may occur in
the future, creating a strong impetus for migration flows. The shrinking of the
labor force in deficit countries could exceed 200 million workers; but, on the
basis of today’s migration rates, only 32 million workers would be willing or
able to move from sending to deficit countries to compensate for the decline.
Hence only one in six of those retiring workers would be replaced. A sharp
acceleration of global mobility to address the consequences of an aging popu-
lation and low fertility in deficit countries is highly likely to occur, though not
without consequences. This study and others like it argue that luck favors the
prepared and that these forces are best met by active management. In particu-
lar, developed and developing countries stand to win from better-organized
Shaping the Future70
migration schemes, more opportunities for labor migration, and better
matching of skill demand and supply. The stakes are high for both sending
and receiving countries. In receiving countries, economic growth, fiscal bal-
ances, and the welfare of the elderly could be affected severely by sharp
declines in the size of their active populations or by critical skill shortages. In
sending countries, migration flows need to be managed to avoid severe “brain”
or “hand drains” and related labor shortages.2
This chapter synthesizes lessons on migration policies, both in receiving
and sending countries, within and outside the MENA Region. Although these
policy conclusions serve as pointers, differences in endowments, challenges,
and priorities preclude a one-size-fits-all policy approach. Migration needs to
be streamlined into a diverse array of policy areas, including economic man-
agement, banking and finance, and education and social protection. Rather
than deriving policy prescriptions, the second section of the chapter draws
from the analysis of common conditions in sending and receiving countries
to provide policy makers with a framework for action. The framework, it is
hoped, would help map out country-specific situations and challenges,
explore strategic options, and establish a policy road map.
Policies and Practices Affecting Labor Migration Outcomes
A wide range of public and private institutions in both sending and receiving
countries are instrumental in structuring migration flows, reducing potential
demographic and labor market imbalances, and influencing migrants’ social
and economic experiences in host countries—in short, arriving at a win-win-
win situation. The institutional framework for labor migration not only
encompasses immigration policies and regulations, but also economic inte-
gration policies, emigration policies, education systems, overall employment
and social protection policy, and migrant networks. Each of these compo-
nents serves in a particular context. Their influence may vary across coun-
tries and over time, and what works well in one country may not do so in
another. Nevertheless, it is useful to identify what good practices exist and
what lessons may be distilled and generalized. This section focuses on the
programs and measures that are particularly important for the management
of labor migration and the reduction of labor market imbalances.
Good Practices in Labor Migration Policies in OECD Host CountriesLabor immigration policies: traditional and new immigration countries. Given the
wide range of immigration policies that exist in member countries of the
Organisation for Economic Co-operation and Development (OECD), it is
essential to distinguish among various types of migration, that is (i) accord-
ing to the intended duration of stay (temporary, transitional, or permanent);3
(ii) according to main motivation (humanitarian, family reunification, or
A Conceptual Framework for Policy Makers 71
economic migration); and (iii) along legal status (legal residence, with or
without a work permit, and undocumented migration). Usually, immigra-
tion programs in OECD countries are intended for labor migrants, family
reunion, and asylum seekers. In contrast to economic migration programs,
family reunification and humanitarian migration schemes involve human
rights–based considerations. Permanent immigration programs are specific
to traditional immigration countries (TICs), such as Australia, Canada, and the
United States, and have to be considered in their historical context as a tool for
nation building. Other elements of immigration policies include discretionary
immigration and regularization (annex table A4).
In contrast with TICs, family reunification or formation has been the driv-
ing force of most European countries’ immigration policies. Family reunifica-
tion programs play an important role in OECD immigration policies not only
from a human rights perspective but also for the integration of migrants into
host countries. It is, among other things, close to a prerequisite for attracting
high-skilled labor. Family reunification has become so important in European
countries that economic migration is no longer the most frequently cited rea-
son for migration.
European immigration policies have so far resulted in mainly low-skilled
migration. Based on 2000 data, the EU-25+ countries host about 6.4 million
primary-educated migrants, out of a total of 13 million (that is, 49 percent of
the EU-25+ migrant population originating from outside the EU-25+ have
primary education, while only 25 percent have secondary education, and 21
percent have tertiary education).4 The TICs, on the other hand, have much
higher shares of secondary- and tertiary-educated migrants. In Australia,
New Zealand, and the United States, tertiary-educated migrants represent
around 40 percent and almost 60 percent in Canada. Accordingly, their shares
of primary educated migrants are relatively low (16 to 30 percent). The share
of secondary-educated migrants is somewhat wider, going from only 12 per-
cent in Canada to 35 percent in the United States (see table 5.1). All of these
countries apply “points system” to screen migrants (see box 5.1).
Labor migration programs can be differentiated according to their selection
criteria. International experience shows that each method for choosing
migrants will have a set of issues and problems. From this perspective, table 5.2
summarizes the two main forms of programs in place and their respective
advantages and disadvantages.
Demand-driven programs are most responsive to the needs of host country
labor markets. Future job shortages are subject to great uncertainty; the struc-
ture of economic growth and other factors, including intra-OECD migration,
ultimately will form the basis for labor demand. Demand-driven programs
offer the most flexible means of responding to real-time demand as it occurs in
the economy, and require less government planning capacity, as they transfer
the administrative burden to employers. The U.K. Work Permits Program,
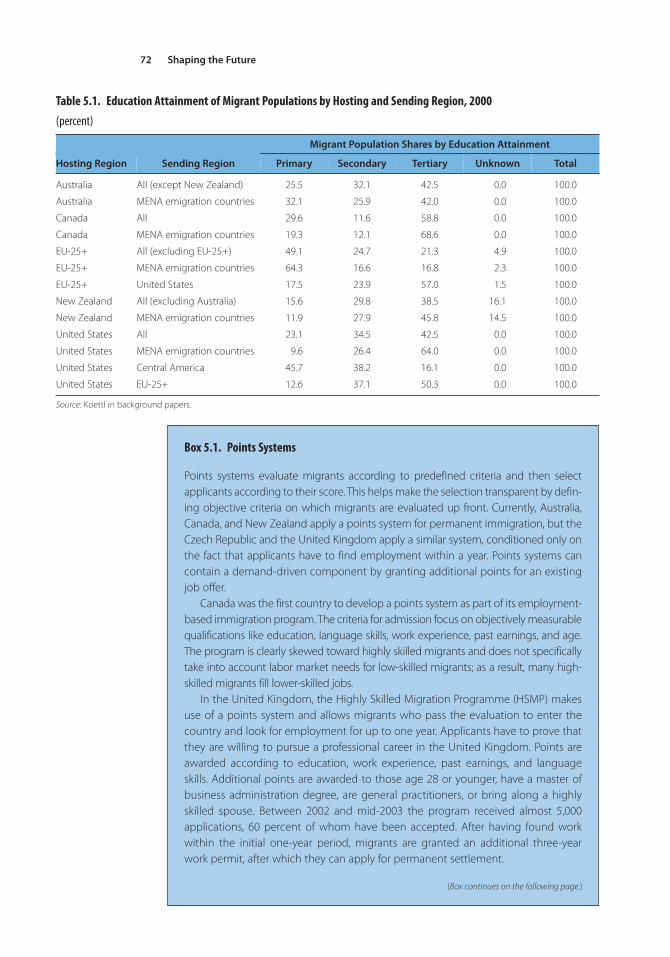
Shaping the Future72
Table 5.1. Education Attainment of Migrant Populations by Hosting and Sending Region, 2000
(percent)
Migrant Population Shares by Education Attainment
Hosting Region Sending Region Primary Secondary Tertiary Unknown Total
Australia All (except New Zealand) 25.5 32.1 42.5 0.0 100.0
Australia MENA emigration countries 32.1 25.9 42.0 0.0 100.0
Canada All 29.6 11.6 58.8 0.0 100.0
Canada MENA emigration countries 19.3 12.1 68.6 0.0 100.0
EU-25+ All (excluding EU-25+) 49.1 24.7 21.3 4.9 100.0
EU-25+ MENA emigration countries 64.3 16.6 16.8 2.3 100.0
EU-25+ United States 17.5 23.9 57.0 1.5 100.0
New Zealand All (excluding Australia) 15.6 29.8 38.5 16.1 100.0
New Zealand MENA emigration countries 11.9 27.9 45.8 14.5 100.0
United States All 23.1 34.5 42.5 0.0 100.0
United States MENA emigration countries 9.6 26.4 64.0 0.0 100.0
United States Central America 45.7 38.2 16.1 0.0 100.0
United States EU-25+ 12.6 37.1 50.3 0.0 100.0
Source: Koettl in background papers.
Box 5.1. Points Systems
Points systems evaluate migrants according to predefined criteria and then selectappli cants according to their score. This helps make the selection transparent by defin-ing objective criteria on which migrants are evaluated up front. Currently, Australia,Canada, and New Zealand apply a points system for permanent immigration, but theCzech Republic and the United Kingdom apply a similar system, conditioned only onthe fact that applicants have to find employment within a year. Points systems cancontain a demand-driven component by granting additional points for an existingjob offer.
Canada was the first country to develop a points system as part of its employment-based immigration program. The criteria for admission focus on objectively measurablequalifications like education, language skills, work experience, past earnings, and age.The program is clearly skewed toward highly skilled migrants and does not specificallytake into account labor market needs for low-skilled migrants; as a result, many high-skilled migrants fill lower-skilled jobs.
In the United Kingdom, the Highly Skilled Migration Programme (HSMP) makesuse of a points system and allows migrants who pass the evaluation to enter thecountry and look for employment for up to one year. Applicants have to prove thatthey are willing to pursue a professional career in the United Kingdom. Points areawarded according to education, work experience, past earnings, and languageskills. Additional points are awarded to those age 28 or younger, have a master ofbusiness administration degree, are general practitioners, or bring along a highlyskilled spouse. Between 2002 and mid-2003 the program received almost 5,000applications, 60 percent of whom have been accepted. After having found workwithin the initial one-year period, migrants are granted an additional three-yearwork permit, after which they can apply for permanent settlement.
(Box continues on the following page.)
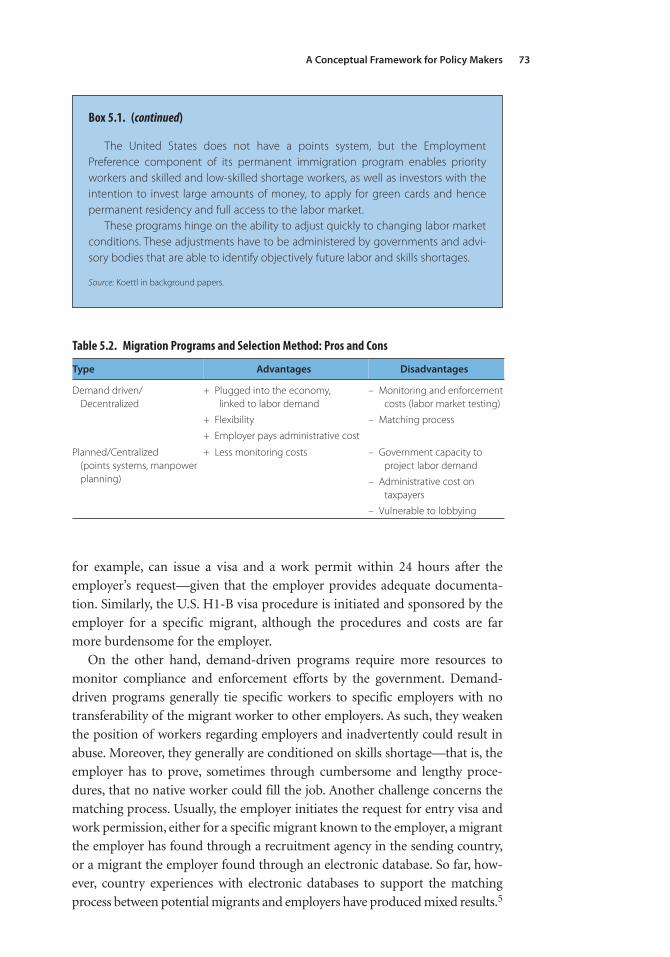
A Conceptual Framework for Policy Makers 73
for example, can issue a visa and a work permit within 24 hours after the
employer’s request—given that the employer provides adequate documenta-
tion. Similarly, the U.S. H1-B visa procedure is initiated and sponsored by the
employer for a specific migrant, although the procedures and costs are far
more burdensome for the employer.
On the other hand, demand-driven programs require more resources to
monitor compliance and enforcement efforts by the government. Demand-
driven programs generally tie specific workers to specific employers with no
transferability of the migrant worker to other employers. As such, they weaken
the position of workers regarding employers and inadvertently could result in
abuse. Moreover, they generally are conditioned on skills shortage—that is, the
employer has to prove, sometimes through cumbersome and lengthy proce-
dures, that no native worker could fill the job. Another challenge concerns the
matching process. Usually, the employer initiates the request for entry visa and
work permission, either for a specific migrant known to the employer, a migrant
the employer has found through a recruitment agency in the sending country,
or a migrant the employer found through an electronic database. So far, how-
ever, country experiences with electronic databases to support the matching
process between potential migrants and employers have produced mixed results.5
Box 5.1. (continued)
The United States does not have a points system, but the EmploymentPreference component of its permanent immigration program enables priorityworkers and skilled and low-skilled shortage workers, as well as investors with theintention to invest large amounts of money, to apply for green cards and hencepermanent residency and full access to the labor market.
These programs hinge on the ability to adjust quickly to changing labor marketconditions. These adjustments have to be administered by governments and advi-sory bodies that are able to identify objectively future labor and skills shortages.
Source: Koettl in background papers.
Table 5.2. Migration Programs and Selection Method: Pros and Cons
Type Advantages Disadvantages
Demand driven/Decentralized
+ Plugged into the economy, linked to labor demand
+ Flexibility
+ Employer pays administrative cost
– Monitoring and enforcementcosts (labor market testing)
– Matching process
Planned/Centralized (points systems, manpower planning)
+ Less monitoring costs – Government capacity to project labor demand
– Administrative cost on taxpayers
– Vulnerable to lobbying
Shaping the Future74
The main problem associated with electronic databases seems to be the uncer-
tainty of the qualifications of the potential migrant. Obviously, the higher the
required qualifications, the less willing the employer is to hire a migrant with-
out additional information obtained though some personal contact.
State-planned programs for permanent immigration, such as the Canadian
points system (see box 5.1), tend to be less flexible and require more capacity
from the government with regard to research and planning to determine labor
market needs, and to administer the selection process.6 When selection crite-
ria are controlled by the government, lobbyists could distort decisions.
Granting additional points to migrants with an existing job offer, as the
Australian system does, may improve the outcome but the main charge
remains with the government.
Demand-driven immigration programs have been designed for tempo-
rary and transitional migrants. Demand-driven immigration programs for
temporary migrants are aimed at sectors with seasonal work requirements. In
contrast, demand-driven transitional migrant programs filter successful
migrants by granting migrants, first, a temporary residence and work per-
mission, but subsequently offering a clear option for permanent residence
and work permission in the long run. The original entry permission is
granted for education, business, or work reasons and offers a clear avenue
for migrants to permanent residency and, ultimately, citizenship. Such pro-
grams acknowledge the fact that migrants who fill inherently permanent
jobs will be willing to stay in their job, and that employers are willing to keep
the migrants in their positions.
Demand-driven temporary migration programs that offer inherently tem-
porary jobs to migrants who have no intention to stay over the long term
reduce the risk of mismatch. Most OECD countries successfully run seasonal
migrant worker programs for the agricultural and tourism sectors.7 Since the
position filled by the migrant essentially disappears at the end of the season,
migrants have no incentives to overstay their visas to continue their job, nor
do employers have incentives to keep migrants in their position. Moreover,
experience shows that many of these agreements work well because they aim
primarily at a segment of the labor market in the host country that does not
compete much with the native labor force: many of the jobs in the agricultural
and tourism sectors are considered underpaid by the native labor force. But
temporary migration can work in settings other than seasonal programs. A con-
crete example is the German-Polish bilateral agreement, which allows German
companies to subcontract certain services to Polish companies, especially in
the construction sector. The Polish workers who come to Germany have low
incentives to overstay their jobs as their jobs remain with the Polish firm (see
box 5.2). Caretaker and personal services might be another sector in which
such temporary migration schemes could be developed and lead to a formal-
ization of an important share of the informal sector.
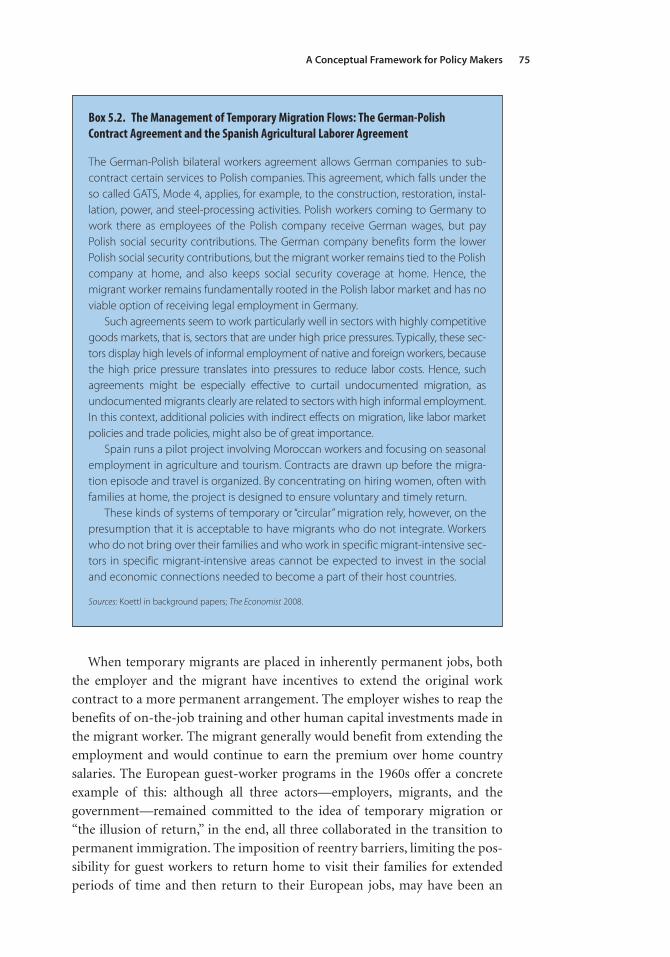
A Conceptual Framework for Policy Makers 75
When temporary migrants are placed in inherently permanent jobs, both
the employer and the migrant have incentives to extend the original work
contract to a more permanent arrangement. The employer wishes to reap the
benefits of on-the-job training and other human capital investments made in
the migrant worker. The migrant generally would benefit from extending the
employment and would continue to earn the premium over home country
salaries. The European guest-worker programs in the 1960s offer a concrete
example of this: although all three actors—employers, migrants, and the
government—remained committed to the idea of temporary migration or
“the illusion of return,” in the end, all three collaborated in the transition to
permanent immigration. The imposition of reentry barriers, limiting the pos-
sibility for guest workers to return home to visit their families for extended
periods of time and then return to their European jobs, may have been an
Box 5.2. The Management of Temporary Migration Flows: The German-PolishContract Agreement and the Spanish Agricultural Laborer Agreement
The German-Polish bilateral workers agreement allows German companies to sub-contract certain services to Polish companies. This agreement, which falls under theso called GATS, Mode 4, applies, for example, to the construction, restoration, instal-lation, power, and steel-processing activities. Polish workers coming to Germany towork there as employees of the Polish company receive German wages, but payPolish social security contributions. The German company benefits form the lowerPolish social security contributions, but the migrant worker remains tied to the Polishcompany at home, and also keeps social security coverage at home. Hence, themigrant worker remains fundamentally rooted in the Polish labor market and has noviable option of receiving legal employment in Germany.
Such agreements seem to work particularly well in sectors with highly competitivegoods markets, that is, sectors that are under high price pressures. Typically, these sec-tors display high levels of informal employment of native and foreign workers, becausethe high price pressure translates into pressures to reduce labor costs. Hence, suchagreements might be especially effective to curtail undocumented migration, asundocumented migrants clearly are related to sectors with high informal employment.In this context, additional policies with indirect effects on migration, like labor marketpolicies and trade policies, might also be of great importance.
Spain runs a pilot project involving Moroccan workers and focusing on seasonalemployment in agriculture and tourism. Contracts are drawn up before the migra-tion episode and travel is organized. By concentrating on hiring women, often withfamilies at home, the project is designed to ensure voluntary and timely return.
These kinds of systems of temporary or “circular” migration rely, however, on thepresumption that it is acceptable to have migrants who do not integrate. Workerswho do not bring over their families and who work in specific migrant-intensive sec-tors in specific migrant-intensive areas cannot be expected to invest in the socialand economic connections needed to become a part of their host countries.
Sources: Koettl in background papers; The Economist 2008.
Shaping the Future76
important driver for guest workers to settle as permanent migrants and bring
their families to Europe instead.
Demand-driven immigration programs for transitional migrants may be
more successful if they lead to the receipt of permanent work permits,
reduce migrants’ dependency on their initial employer, and give migrants
full access to the labor market and social protection after some time. Such
programs identify adequate migrants by first granting temporary residence
and work permits. If migrants in permanent jobs are allowed to stay for a
longer time in the host country, they as well as employers have the incentive
to invest in training and reduce search, hiring, and firing costs; migrants
have stronger incentives to integrate into host societies. This minimizes
dependence on the initial employer and by consequence reduces the scope
for abuse. Three types of transitional migration programs have been devel-
oped in OECD countries: (i) education-to-residency, (ii) business-to-residency,
and (iii) work-to-residency.
Examples of education-to-residency transitional programs include Australian
student visas and U.S. F-1 visas. In the United States, the student visa offers an
optional practical training visa after the completion of university studies, which
then typically leads to an H1-B work visa. This program has been effective in
attracting highly educated migrants to the U.S. labor market and identifies
successful settlers. Meanwhile, the cost of the education investment may be
shared by home and host country. There is also some evidence from Canada
that the education received in the host country increases the value of the edu-
cation received at home, thereby reducing the brain waste.8 In contrast, a pro-
gram like the Korea Traineeship Program used migrants to fill permanent jobs
in the small and medium enterprise (SME) sector without offering a path to
residency. The intention was to offer a competitive advantage to smaller firms
(through cheaper labor), but the result was a massive informalization of
migrant workers over time.
Examples of business-to-residency transitional programs include the U.S. E-1
program, the North American Free Trade Agreement, the U.S.-Canada Free
Trade Agreement (the so-called treaty traders), and the U.S. B-1 program. These
programs allow investors, especially from countries with which the United
States has free trade agreements, to engage in business in the United States and
subsequently to apply for a green card.
Finally, work-to-residency programs allow workers to obtain a temporary
work permit, usually tied to a particular employer or sector, and subsequently
obtain a permanent residence and work permit. The U.S. H1-B program is one
such program, allowing high- and semi-skilled migrants in to fill shortages in
the U.S. labor markets over the last decade, with an annual quota of about
85,000. The program allows explicitly for so-called dual intent, whereby the
migrant does not have to prove plans to return to the home country after the
expiration of the visa. However, the U.S. employer has to prove that no
A Conceptual Framework for Policy Makers 77
equally qualified U.S. citizens are willing to take the job at prevailing wages,
which sometimes requires considerable time and effort to show. In addition,
the employer sponsors the migrant’s visa, and moving jobs requires moving the
sponsorship, which tends to tie the migrant to the employer and increases the
potential for abuse.
The U.K. General Work Permit Scheme is similar to the U.S. program.
Work permits are processed within at most one to two weeks. Employers have
to prove that they were unable to fill the post with native workers, but some
key priority sectors or skill categories with identified labor shortages require
no such evidence (currently health care, education, actuaries, engineers).
A less successful example of a transitional work-to-residency program is the
German Green Card Program. The program was launched right after the
burst of the IT bubble and aimed to fill a quota of 20,000 IT experts, mostly
from India. However, the program did not offer any option to extend the orig-
inal work permit of five years to a permanent residency. As a result, the quota
was not filled, and it was mainly used by eastern European IT experts instead
of Indians.
Economic integration policies. Integration of migrants into the economic and
social fabric of host countries is at the core of the debate on migration.
Economic integration counteracts competition between migrants and natives
and helps migrants contribute to the welfare state rather than burden it. Social
assimilation helps migrants to gain social capital and enhance cultural and
language skills, all of which should help them improve their labor market per-
formance and be viewed more favorably in host countries. Data from the
European Community Household Panel suggest that the economic perform-
ance of migrants depends on the duration of stay; differences between natives
and migrants diminish over time.
OECD countries have developed different integration programs to
improve migrants’ labor market outcomes. Approaches to the integration of
minority populations have varied across countries, focusing on assimilation
(France), the development of multiculturalism (Sweden), and the acknowl-
edgment of the particular characteristics of migrant population (the
Netherlands). While these approaches have translated into country-specific
economic integration programs, today most OECD countries have devel-
oped a mix of active labor market programs opened to the population as a
whole regardless of ethnic status, in the spirit of the integration model, as
well as specific programs targeted toward minority groups, recognizing their
special needs.9 Some governments in host countries have supported a num-
ber of migrant associations that provide education and social services to their
members. Besides this formal support by governments, migrant Diasporas
have been able to mobilize large private networks to help newcomers to
find jobs.
Shaping the Future78
Programs to facilitate the economic integration of migrants usually cover a
combination of language training and education, skills training, and antidis-
crimination measures. Language abilities are seen as a key element for a suc-
cessful integration in most OECD countries. Successful language training
programs are those that link language training to employment experience,
education, and skills upgrading.10 In Canada, the Language Instruction for
Newcomers offers free language training courses to adult permanent resi-
dents. To encourage women to participate in language class, some of the
training centers also offer free child care. In France, specific measures for
immigrant children who speak little French and special training and infor-
mation centers dealing with the education of immigrant children who
recently arrived in France have been established by the Ministry of
Education. Similarly, the German government’s Agency for Migration and
Refugees has been asked to provide integration and orientation courses with
language training and civic and history instruction. The courses are compul-
sory for newcomers without knowledge of German and are open to immi-
grants who have been in Germany for several years. In Sweden, the approach
to language instruction has been slightly different: bilingualism is strongly
promoted and the children of immigrants are entitled to study their mother
tongue as well as Swedish.
Many OECD countries have developed active labor market programs to
facilitate the matching process in the labor market. These programs are
generally more effective when they are well targeted and tailored to the
needs of specific groups. In France, for instance, a number of initiatives
have been developed to facilitate the access to employment of disadvan-
taged groups. These programs are not specifically directed to migrants, but
migrants who are overrepresented among the low-skilled unemployed have
benefited significantly from these measures. Similarly, in Germany a num-
ber of important training programs are open to all residents. The German
federal government has developed specific vocational training programs
for immigrant children.
Antidiscrimination legislation is another key area in which many OECD
countries have made progress to improve the economic integration of
migrants. Comprehensive antidiscrimination legislation and antidiscrimina-
tion provisions incorporated into labor legislation are believed to be the most
effective ways to combat discrimination at the workplace.11 The United
Kingdom and the Netherlands, for instance, have a well-established set of
policies and institutions to address ethnic and racial discrimination, particu-
larly in the workplace. In France, the government passed an antidiscrimina-
tion bill in 2001 that specifically addresses discrimination in employment
and amends several provisions of the labor code; the legislation was updated
after the 2005 riots.
A Conceptual Framework for Policy Makers 79
Social protection policies. Social protection policies play an important role for
the integration of migrants in host countries and for their decision to return or
to stay. In fact, migrants may prolong their stay because pensions or health
benefits accumulated through the migration episode will not be available when
they leave, and they have not accumulated the corresponding benefits at home.
Generally, legal migrants have reasonable access to social services in Europe.
The bilateral EU-Mediterranean Agreements ensure portability of social
security arrangements between the European Union and Algeria, Morocco,
and Tunisia. However, other MENA migrants are not covered in similar
arrangements, and importantly, the portability of health care benefits is not
included in these agreements. Undocumented migrants have varying degrees of
access to basic health services and no access to pensions or other forms of social
services. Therefore, this following section focuses on legal migrants.
Newly arrived migrants—like natives who have just entered the labor mar-
ket—are excluded from some forms of social assistance because of minimum
time contribution requirements. Some social services—unemployment bene-
fits, public housing—require some length of contribution or presence in the
country before becoming accessible, that is, newly arrived migrants are more
vulnerable to exclusion from these forms of assistance. This exclusion is not
necessarily an issue of discrimination, as natives, too, generally accumulate
benefits like unemployment insurance over time.
Pension contribution totalization is necessary to ensure full portability of
old-age protection. Old-age pensions are usually exportable. However, in the
absence of bilateral agreements that ensure portability, migrants who
return home before having worked long enough to qualify for old-age pension
(15 years in Europe, usually) would lose all their benefits. These migrants fall
between two systems, as they will not have contributed to any scheme at
home. This situation calls for a totalization of contributions (combining the
working years and contributions) to count toward one benefit, paid pro rata
by each country. Alternatively, migrant workers can receive a lump-sum
payment reflecting contributions, upon return.
Health care benefits are exportable only to a limited extent. Only a few bilat-
eral social security agreements (Germany and Morocco) include provisions for
portability—they are not included in the EU-Mediterranean Agreements.
Normally, a returned migrant would qualify for health insurance and benefits
once he or she becomes employed in the home country. Retired migrants, how-
ever, may need to rely solely on private health care. Often, host country social
security programs pay health care expenses abroad, as they would for any res-
ident on holiday; however, reimbursement may reflect the cost structures at
home and may not cover the actual expenses in home countries, thereby
exposing the migrant to higher costs. Portability would in fact open up a
cross-border trade in health services.
Shaping the Future80
The lack of portability creates distortions, for example, in the form of
higher informality as migrants have no incentive to contribute to social
security. It also shifts around the fiscal burden of social security unequally.
Returned migrants may benefit from emergency assistance and may receive
means-tested social assistance or pensions, without having contributed to
the system during their working years.
Labor Migration Policies in MENA Sending CountriesGovernments in MENA countries are increasingly paying attention to emi-
gration flows and the legal environment for labor migration. The efficient
management of migration flows is gaining priority in the international agen-
da, both for receiving and sending countries. For example, the management
of migration flows was mentioned in the objectives of the Barcelona Process
creating a free EU-Mediterranean trade zone. This objective is mentioned in
the new Neighborhood Policy of the European Union and represents an
important challenge for several countries in MENA. The Moroccan govern-
ment has created a special Ministry for Moroccans Abroad, seeking to review
many of the issues in this area.
An important step to improve the management of migration flows has been
the conclusion of bilateral agreements between a number of MENA sending
countries and the countries of destination. Particular efforts have been devot-
ed by Egypt, Morocco, and Tunisia to regulate and monitor the movements of
workers and migrants, especially because these countries are also receiving a
large number of irregular immigrants and asylum seekers. With respect to
labor migration, the conclusion of bilateral agreements by many countries in
the region has been instrumental in supporting the rights of migrant workers
and defining legal channels of cooperation between host and home country
authorities and specialized agencies, in particular in the area of labor migrant
quotas, tax regimes, and social security arrangements (see annex table A5 for
an overview of bilateral agreements).
By and large, only limited efforts are devoted to the training, orientation,
and counseling of potential labor migrants. In contrast with countries like
the Philippines, which have promoted emigration through several institu-
tions (see box 5.3), no countries in MENA have developed comprehensive
programs and policies to facilitate the process of matching their workers’
interests and foreign labor market needs. The number of public employ-
ment agencies in the region dealing with job vacancies abroad is limited.
Private recruitment agencies exist, but they work mostly with member
countries of the Gulf Cooperation Council (GCC) and do not provide ori-
entation sessions or predeparture training. The practices of these private
agencies in MENA countries have been criticized and many of them seem
to operate outside labor legislation and international conventions.12 Again,
this is in contrast with the Philippines’ system of formal accreditation.
A Conceptual Framework for Policy Makers 81
Box 5.3. The Philippines Labor Emigration “Know-How”
In 2006, overseas Filipinos—be they temporary workers, permanent emigrants, orirregular migrants—made up an estimated 8.2 million people, or one-quarter, of thetotal labor force. As in the case of many MENA countries, high emigration flows arepartly explained by slow domestic growth and endemic unemployment problems,especially among the young and uneducated. The number of migrant workers hasincreased almost 25-fold over the past 20 years. However, as the major organizedlabor exporting country in the world, the Philippines has been able to reap significantbenefits by responding and adjusting to global labor market demands. Importantly,the protection of workers and their families abroad has become a centerpiece of theinstitutional framework. As of the mid-1980s, Filipino migration increased exponen-tially. The takeoff was mostly due to demand for service workers, especially in house-hold and other private services, as well as production process workers, transportequipment operators, and laborers. There has been a continued demand for profes-sionals (including nurses) and technical and related workers. Because of the focus onprivate services, female workers now make up half of all Filipino temporary migrants.
In the early 1980s, the government established the Philippines Overseas Employ -ment Administration (POEA) “to ensure decent and productive employment forOverseas Filipino workers,” and the Overseas Workers Welfare Administration(OWWA). Their role was reinforced in the mid-1990s with the Migrant Workers andOverseas Filipino Act, stating that—
The existence of the overseas employment program rests solely on the assurancethat the dignity and fundamental human rights and freedom of the Filipino cit-izen shall not, at any time, be compromised or violated.
The POEA is responsible for managing the recruitment of Filipino workers and theirdeployment overseas. Because of the large number of demands for workers, the gov-ernment licensed more than 1,000 Philippines-based agencies to recruit workers forcompanies in Saudi Arabia, Kuwait, and many other countries. Whether these workersare recruited by private agencies or by the government agency (POEA), workers aswell as recruiters are subject to contracts enforceable under Philippine law.
The OWWA is responsible for ensuring workers welfare while they are employedabroad. Official migrants receive a number of benefits: premigration training onsocial and work conditions abroad; life insurance and pension plans; medical insur-ance; financial assistance before, during, and after the migration episode; tuitionassistance for the migrant and his or her family; and paralegal services abroad.Registration for these benefits is administrated by the OWWA and costs less thanUS$25 per migrant per year. Repatriation assistance, whether resulting from forcedor voluntary return, remains the most important program of the OWWA, however.OWWA negotiates with employers or brokers, facilitates documentary requirementsand clearances, and coordinates with Philippines embassies and other agencies asnecessary to speed up return. The OWWA registration card can serve as an identifi-cation and automated teller machine card abroad.
A separate agency, the Commission on Filipinos Overseas (CFO), created in 1980,provides programs and services to permanent emigrants. CFO was transferred fromthe Ministry of Foreign Affairs to the Office of the President in 2004. The Commission
(Box continues on the following page.)
Shaping the Future82
Some new initiatives are now being launched in the region, and it will be
important to evaluate their impact.
Many countries in the region are attempting to adapt their migration
management institutions, programs, and instruments in a variety of ways.
Over the years, Tunisia, for example has established a number of institutions
and programs for the management of labor migration flows. The Ministry
of Labor has developed, with the support of the International Organization
for Migration (IOM), initiatives to facilitate the social and economic inte-
gration of potential emigrants. These initiatives include the organization of
training for trainers in job and cultural counseling, and the strengthening of
institutional capacity for monitoring of labor migration. The Office des
Tunisiens à l’Etranger (OTE) provides social services targeted at migrants
and returned migrants. An Agence Tunisienne de Coopération Technique
(ATCT) collects data on international job vacancies, selects national candi-
dates, prepares contracts, and organizes training for labor emigrants. In
Jordan, the Ministry of Labor is similarly in charge of issuing licenses to pri-
vate employment agencies whose aim is to identify job opportunities abroad
for Jordanians seeking to emigrate.
In Egypt, the Emigration Sector of the Ministry of Manpower and Emigra -
tion, together with the Italian Government as the donor partner and the
IOM as the implementing agency, has launched the Integrated Migration
Information System (IMIS) project. The project has set up a Web site for job
opportunities abroad and promoted the creation of a portal for Egyptian
migrants. The Web site is tailored to provide services to employers abroad and
Egyptian job seekers. It furnishes an automatic job-matching system between
demand and supply. Foreign employers seeking specific employees’ profiles
may consult the Web site roster, identify potential candidates, and contact the
Ministry of Manpower and Emigration, which can then verify the candidate
profiles. The final selection of the candidates is the responsibility of the for-
eign employers, who can either appoint a local recruitment agency or make
the selection directly.
Box 5.3. (continued)
“provides assistance to the President and the Congress of the Philippines in the formulation of policies and measures concerning or affecting Filipinos overseas.” TheCommission is responsible for “preserving and enhancing the social, economic andcultural ties of Filipinos overseas with the motherland.” Moreover, the Commissionmaintains a databank on Filipino migration to provide relevant and accurate dataand information for policy formulation. The CFO provides technical and secretariatsupport to various interagency committees related to migration.
Sources: Koettl in background papers; Agunias and Ruiz 2007.
A Conceptual Framework for Policy Makers 83
In Morocco, the National Agency for the Promotion of Employment and
Competence (NAAPEC) identifies job offers in foreign countries and
opportunities of placement of Moroccan migrants abroad.13 The Agency
works closely with the Moroccan Ministry of Work and diplomatic and eco-
nomic representations abroad. Within bilateral agreements and in collabo-
ration with employment administrations of hosting countries, the Agency
supports three kinds of programs: (i) the placement of skilled workers to
acquire professional experience abroad, as in France; (ii) the placement of
seasonal workers with a maximum duration of six months per year, as in
Spain; and (iii) the placement of permanent workers with open-ended or
fixed-term contracts.
Notwithstanding the streamlining of efforts in several countries, the
overall approach to migration management remains fragmented and ad
hoc, responding to the demands, pressures, and opportunities emanating
from receiving countries. MENA sending countries need to adopt a differ-
ent approach to migration management that gives attention to long-term
trends and addresses in an integrated way the economic, social, and institu-
tional facets of migration management.
Strategic Options for Adapting to Global Mobility
Can sending and receiving countries position themselves in terms of long-
term labor and job mobility? Both the sending and the receiving sides face
some key questions. First and foremost is the choice between “positioning”
and “laissez-faire”—where the latter is more likely to be the mere conse-
quence of inaction than an explicit and well-informed choice. Second, what
does “positioning” mean and what does it entail? The response will depend
on each country’s specific circumstances. Great variations exist across coun-
tries in that regard, with some likely to face major labor force surpluses and
other minimal changes. Moreover, in many countries, the situation will
evolve over time, changing the country’s status from net sending to net
receiving. Yet notwithstanding the diversity of country circumstances and the
dynamic nature of their labor markets, it is possible to lay out some key steps
to be taken and strategic options to be explored to smooth the adaptation to
global conditions.
As a first step, individual countries need to develop medium- and long-term
demographic and labor force projections to get a clear sense of their demo-
graphic transition stages and the related medium- and long-term impact on
their labor force. This step could be anchored in a framework of repeated
modeling exercises that go beyond demographic projections and explore dif-
ferent scenarios and strategies in a general equilibrium context, including key
parameters such as growth, productivity, and technological change.
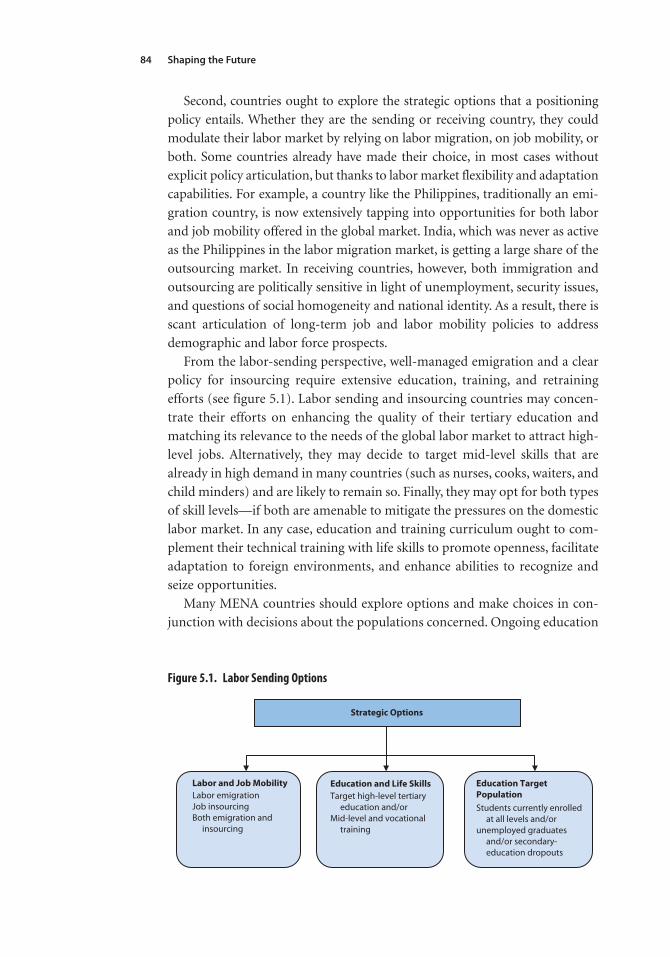
Shaping the Future84
Second, countries ought to explore the strategic options that a positioning
policy entails. Whether they are the sending or receiving country, they could
modulate their labor market by relying on labor migration, on job mobility, or
both. Some countries already have made their choice, in most cases without
explicit policy articulation, but thanks to labor market flexibility and adaptation
capabilities. For example, a country like the Philippines, traditionally an emi-
gration country, is now extensively tapping into opportunities for both labor
and job mobility offered in the global market. India, which was never as active
as the Philippines in the labor migration market, is getting a large share of the
outsourcing market. In receiving countries, however, both immigration and
outsourcing are politically sensitive in light of unemployment, security issues,
and questions of social homogeneity and national identity. As a result, there is
scant articulation of long-term job and labor mobility policies to address
demographic and labor force prospects.
From the labor-sending perspective, well-managed emigration and a clear
policy for insourcing require extensive education, training, and retraining
efforts (see figure 5.1). Labor sending and insourcing countries may concen-
trate their efforts on enhancing the quality of their tertiary education and
matching its relevance to the needs of the global labor market to attract high-
level jobs. Alternatively, they may decide to target mid-level skills that are
already in high demand in many countries (such as nurses, cooks, waiters, and
child minders) and are likely to remain so. Finally, they may opt for both types
of skill levels—if both are amenable to mitigate the pressures on the domestic
labor market. In any case, education and training curriculum ought to com-
plement their technical training with life skills to promote openness, facilitate
adaptation to foreign environments, and enhance abilities to recognize and
seize opportunities.
Many MENA countries should explore options and make choices in con-
junction with decisions about the populations concerned. Ongoing education
Strategic Options
Labor and Job MobilityLabor emigrationJob insourcingBoth emigration and insourcing
Education and Life Skills Target high-level tertiary education and/orMid-level and vocational training
Education TargetPopulationStudents currently enrolled at all levels and/orunemployed graduates and/or secondary- education dropouts
Figure 5.1. Labor Sending Options
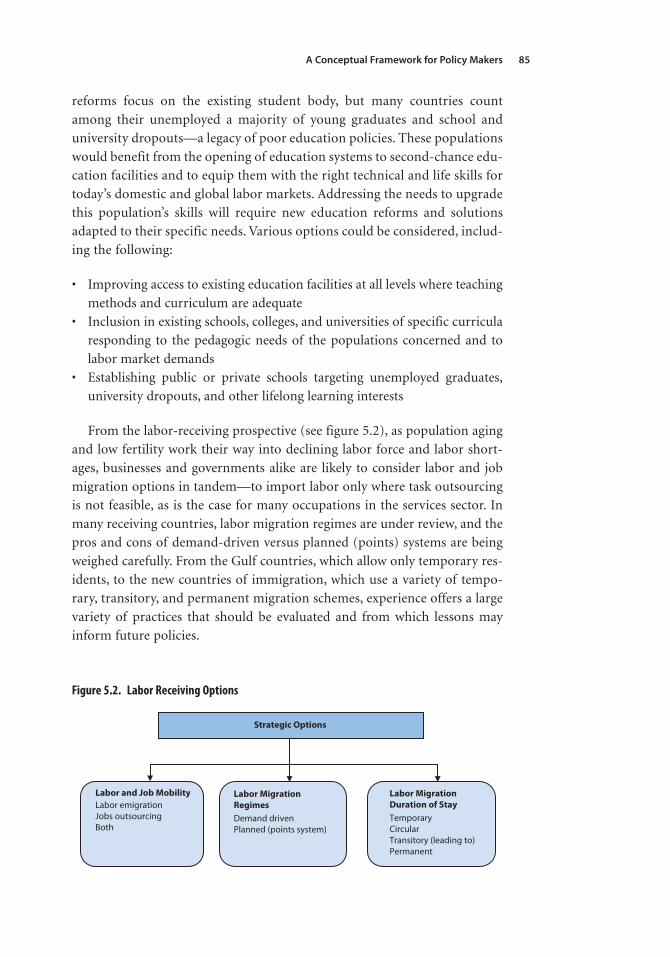
A Conceptual Framework for Policy Makers 85
reforms focus on the existing student body, but many countries count
among their unemployed a majority of young graduates and school and
university dropouts—a legacy of poor education policies. These populations
would benefit from the opening of education systems to second-chance edu-
cation facilities and to equip them with the right technical and life skills for
today’s domestic and global labor markets. Addressing the needs to upgrade
this population’s skills will require new education reforms and solutions
adapted to their specific needs. Various options could be considered, includ-
ing the following:
• Improving access to existing education facilities at all levels where teaching
methods and curriculum are adequate
• Inclusion in existing schools, colleges, and universities of specific curricula
responding to the pedagogic needs of the populations concerned and to
labor market demands
• Establishing public or private schools targeting unemployed graduates,
university dropouts, and other lifelong learning interests
From the labor-receiving prospective (see figure 5.2), as population aging
and low fertility work their way into declining labor force and labor short-
ages, businesses and governments alike are likely to consider labor and job
migration options in tandem—to import labor only where task outsourcing
is not feasible, as is the case for many occupations in the services sector. In
many receiving countries, labor migration regimes are under review, and the
pros and cons of demand-driven versus planned (points) systems are being
weighed carefully. From the Gulf countries, which allow only temporary res-
idents, to the new countries of immigration, which use a variety of tempo-
rary, transitory, and permanent migration schemes, experience offers a large
variety of practices that should be evaluated and from which lessons may
inform future policies.
Strategic Options
Labor and Job Mobility Labor emigrationJobs outsourcingBoth
Labor MigrationRegimes Demand drivenPlanned (points system)
Labor MigrationDuration of Stay TemporaryCircularTransitory (leading to)Permanent
Figure 5.2. Labor Receiving Options
Shaping the Future86
Global Mobility Policy Areas
The third step is about making well-informed choices and mapping out policy
and institutional reforms that will enable countries to seize opportunities and
avoid the potential adverse impact of demographic and labor force imbalances.
Migration management policies are by nature multisectoral (foreign affairs,
interior, economy and finance, education, social protection) and involve a large
array of institutions. Duplication of functions is common and coordination
is often poor. In MENA countries, the migration institutional infrastructure,
if it exists at all, is fragmented, with key functions scattered across ministries
and agencies, and in many ways incomplete, especially regarding migration
data collection and analysis.
Effective job and labor migration management will require (i) streamlining
the migration institutional infrastructure14 to assign clear functions and
responsibilities to the various entities and avoid duplication, and (ii) estab-
lishing a strong home to anchor migration policy making, data collection, and
analysis, and to empower coordination across sectoral ministries and agencies
in all migration-related areas.
Many MENA countries have embarked on broad programs of reforms that
encompass many of the areas of labor and job migration management. In
most countries, however, education, social protection, and financial sector
reforms were rarely designed with the optimization of opportunities for job
and labor mobility as a criterion. Hence, reform programs must be revisited
and their content enhanced. In this context, however, countries need to give
due attention to important issues of reform interactions and the sequencing
of the reform agenda, including the role of macroeconomic policies, capital
controls, and currency convertibility.
From the receiving country perspective, a range of policies (education,
social protection, and others) to support mobility should be coordinated with
labor-sending partners. Education, in particular, will require a global approach
whereby future deficit countries recognize their future dependence problems
and contribute to the education effort. The objective is to ensure the quality of
the cohorts that will form part of their future labor force and produce a large
enough pool of skilled workers to meet the future needs of both sending and
receiving countries. Many countries are waking up to the need to attract talent
in the form of high-skilled persons, and this trend is likely to last, but it is also
quite apparent that far less than all labor demand will arise in high-skill occu-
pations. Indeed, many of the current and future deficit sectors and occupations
probably will generate a demand for medium-level skills (such as nurses) or
even relatively low-skilled workers (retail sales persons, waiters, and so on).
Migrants with secondary levels of education and linguistic knowledge could
conceivably fill these gaps.
These prospects require major adjustments in labor market, education, social
protection, and migration management policies around the globe in sending and
A Conceptual Framework for Policy Makers 87
receiving countries. In particular, partnerships to address future labor market
skill needs should be established now, because as noted, it takes 15 to 20 or more
years to train a skilled worker from childhood to adulthood—making the supply
of skills highly inelastic in the short-term. Similarly, social protection arrange-
ments for health and pension and portability schemes will likely need to adapt to
an increasingly complex mobility environment, in which workers could alternate
work periods at home and abroad or between different countries.
Global mobility also requires efficient, diverse, and well-coordinated finan-
cial services, in particular regarding the following:
• Cost and speed of remittance transfers;
• Access of beneficiaries of remittances to financial services;
• Diversity of migration-related financial instruments (such as Diaspora
bonds, transnational mortgages) to take full advantage of macroeconomic
and individual financial opportunities stemming from labor mobility; and
• Capital controls and currency convertibility to facilitate migrants’ capital
movements and related investments.
Global labor market intermediation requires systematic labor market moni-
toring and trend analysis. Skills and vacancy information must be disseminated
broadly to allow for efficient labor intermediation as well as for education and
training purposes.
Migration regime schemes (demand driven versus planned) should be
assessed thoroughly. They have different administrative arrangements and
intensity and vary in terms of outcomes. Irrespective of regime choices,
involving the business community in the design of migration schemes is cru-
cial to sharpen their demand dimensions, ensure adequate employment, and
facilitate migrants’ integration. These schemes should be realistic in terms of
the implications of labor immigration in terms of integration and accompa-
nying family immigration.
Finally, sending and receiving countries have each a role to play in facilitat-
ing migrants’ integration in host countries. Integration policies must guarantee
equal treatment and opportunities for migrants and host country nationals, and
offer effective protection of migrants against racism and discrimination in
receiving countries. Sending countries, in turn, should ensure that nurturing
the cultural ties with home countries goes hand in hand with the recognition of,
and benefits from, multiculturalism and that predeparture programs—in terms
of language, culture, social norms, and legal system—are in place to facilitate
integration in host countries. Finally, the richer and more complex cultural
identities associated with mobility and globalization must make their way into
the social and cultural norms—an area in which public policy and civil society
activism in both sending and receiving countries have roles to play. This role may
become particularly important in countries where circular migration schemes
take a prominent place.
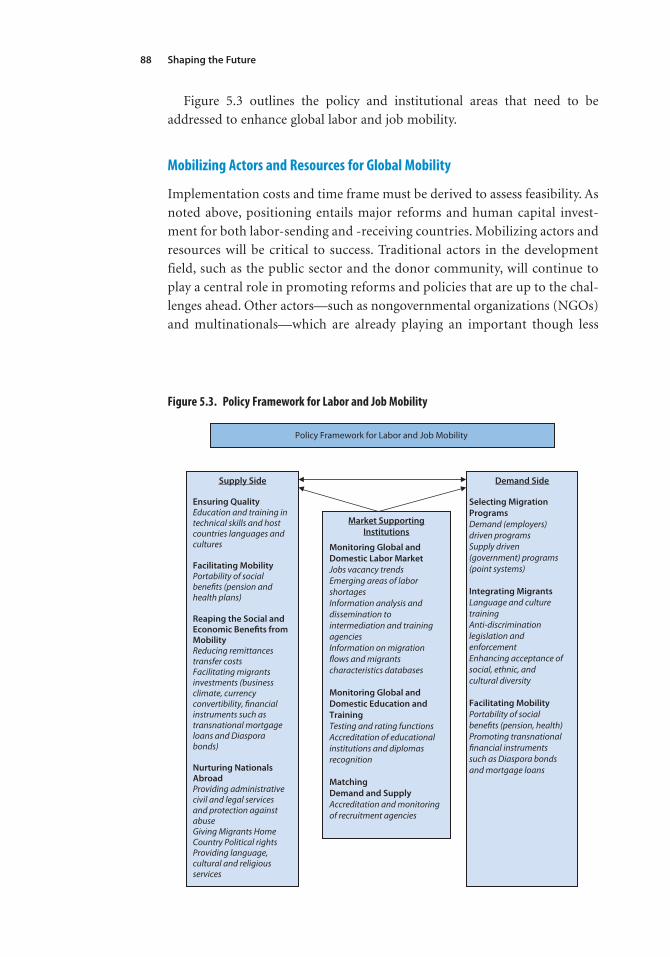
Shaping the Future88
Figure 5.3 outlines the policy and institutional areas that need to be
addressed to enhance global labor and job mobility.
Mobilizing Actors and Resources for Global Mobility
Implementation costs and time frame must be derived to assess feasibil ity. As
noted above, positioning entails major reforms and human capital invest-
ment for both labor-sending and -receiving countries. Mobilizing actors and
resources will be critical to success. Traditional actors in the development
field, such as the public sector and the donor community, will continue to
play a central role in promoting reforms and policies that are up to the chal-
lenges ahead. Other actors—such as nongovernmental organizations (NGOs)
and multinationals—which are already playing an important though less
Policy Framework for Labor and Job Mobility
Supply Side Demand Side
Market Supporting
Institutions
Ensuring Quality
Education and training in technical skills and host countries languages and cultures
Facilitating Mobility
Portability of social benefits (pension and health plans)
Reaping the Social and
Economic Benefits from
Mobility
Reducing remittances transfer costsFacilitating migrants investments (business climate, currency convertibility, financial instruments such as transnational mortgage loans and Diaspora bonds)
Nurturing Nationals
Abroad
Providing administrative civil and legal servicesand protection against abuseGiving Migrants Home Country Political rights Providing language, cultural and religious services
Selecting Migration
Programs
Demand (employers)driven programsSupply driven(government) programs (point systems)
Integrating Migrants
Language and culture trainingAnti-discrimination legislation andenforcementEnhancing acceptance of social, ethnic, andcultural diversity
Facilitating Mobility
Portability of socialbenefits (pension, health)Promoting transnational financial instrumentssuch as Diaspora bondsand mortgage loans
Monitoring Global and
Domestic Labor Market
Jobs vacancy trends Emerging areas of labor shortagesInformation analysis and dissemination tointermediation and training agenciesInformation on migration flows and migrants characteristics databases
Monitoring Global and
Domestic Education and
Training
Testing and rating functions Accreditation of educational institutions and diplomas recognition
Matching
Demand and Supply
Accreditation and monitoring of recruitment agencies
Figure 5.3. Policy Framework for Labor and Job Mobility
A Conceptual Framework for Policy Makers 89
noticeable role in some aspects of global mobility, should be brought to the
forefront of the adaptation effort.
The public sector in both sending and receiving countries is in charge of
policies, their implementation, monitoring, and evaluation. In labor-sending
countries, regulation and accreditation of nonpublic providers of education,
labor intermediation to match migrant workers with employers abroad, and
other services linked to global mobility are among the public sector’s key
responsibilities. As the case of the Philippines15 illustrates, migration manage-
ment requires strong state capacity. The institutionalization of labor export in
that country in 1974 led to the establishment of specialized agencies for the
licensing and monitoring of private recruitment agencies; provision of vari-
ous services and benefits, such as insurance, loans, and scholarships; and mit-
igation of the risks involved in migration, such as exploitation and abuse.
Labor intermediation and migrant protection against abuse are transnational
issues requiring tight collaboration with host countries.
In most migrant-sending countries, the private sector is active in domestic
labor market monitoring and intermediation (private recruitment compa-
nies), education and technical training, and language training. These activities
should be better tuned and their scope extended to respond to global mobility-
specific demands (be it for labor emigration or job insourcing) and include
migrant predeparture preparation programs (language culture, logistics of
arrival and settling in). Multinationals that are extensively involved in training
their workers overseas could partner with local or regional institutions for a
perennial approach to educating and training the workforce. Financial innova-
tions to offer a wider variety of portable health and pension schemes and a
diverse range of financial instruments for migrants and the beneficiaries of
their remittances are among the areas in which domestic and international
entrepreneurship could play a major role.
Like the private sector, NGOs are increasingly participating in labor inter-
mediation, education, and training. In all regions, migrants’ associations play
a key role in enhancing the efficiency of migrant remittance transfers and
their local investment. In many sending countries, NGOs contribute to the
provision of cultural services to migrants and second generations (and
beyond) born abroad. In receiving countries, they monitor migrant social
conditions and are active defenders of migrants’ rights. This is increasingly the
case of trade unions in some countries, such as France, Germany, and the
United Kingdom.16 Technical and professional Diaspora networks are part-
nering increasingly with sending countries’ high-level education and research
institutions, especially in the scientific fields, and could play a critical role in
enhancing education quality.
The role of the donor community, which includes bilateral cooperation
programs, multilateral aid agencies, and an increasing number of private
foundations, is crucial for addressing the know-how and financial challenges
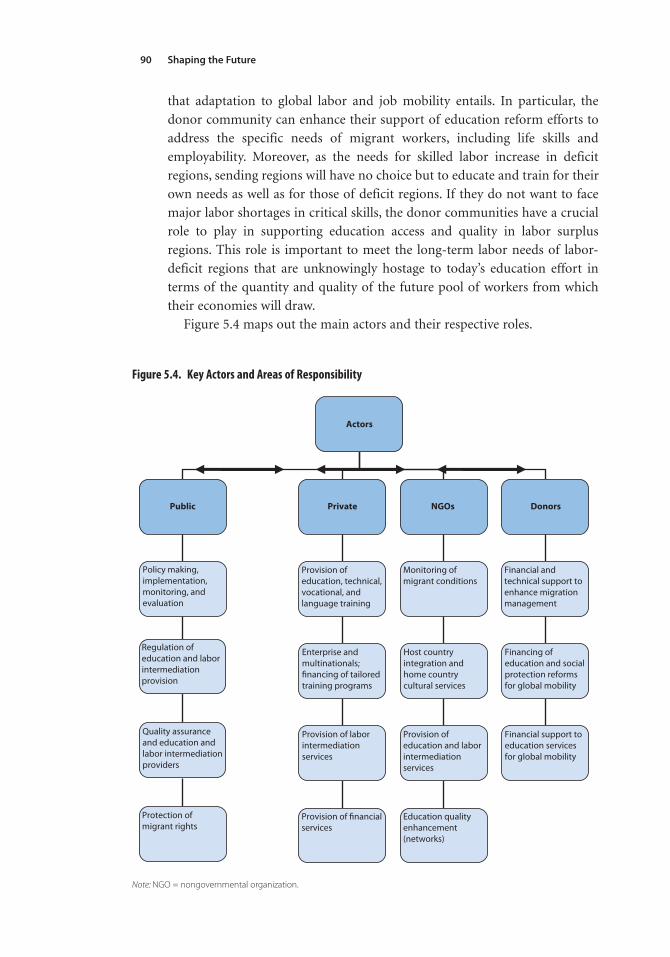
Shaping the Future90
that adaptation to global labor and job mobility entails. In particular, the
donor community can enhance their support of education reform efforts to
address the specific needs of migrant workers, including life skills and
employability. Moreover, as the needs for skilled labor increase in deficit
regions, sending regions will have no choice but to educate and train for their
own needs as well as for those of deficit regions. If they do not want to face
major labor shortages in critical skills, the donor communities have a crucial
role to play in supporting education access and quality in labor surplus
regions. This role is important to meet the long-term labor needs of labor-
deficit regions that are unknowingly hostage to today’s education effort in
terms of the quantity and quality of the future pool of workers from which
their economies will draw.
Figure 5.4 maps out the main actors and their respective roles.
Actors
Public Private NGOs
Policy making,implementation,monitoring, andevaluation
Regulation ofeducation and laborintermediationprovision
Provision ofeducation, technical,vocational, andlanguage training
Enterprise andmultinationals;financing of tailoredtraining programs
Monitoring ofmigrant conditions
Host countryintegration andhome countrycultural services
Provision of laborintermediationservices
Donors
Provision of financialservices
Financial andtechnical support toenhance migrationmanagement
Financing ofeducation and socialprotection reformsfor global mobility
Provision ofeducation and laborintermediationservices
Education qualityenhancement(networks)
Quality assuranceand education andlabor intermediationproviders
Financial support toeducation servicesfor global mobility
Protection ofmigrant rights
Figure 5.4. Key Actors and Areas of Responsibility
Note: NGO = nongovernmental organization.

A Conceptual Framework for Policy Makers 91
Table 5.3. Collaboration or Competition? A Payoff Matrix
Policy Area Collaboration Competition
Education Improved access and enhanced quality of education services ➔
Large enough pool for the needs of both labor surplus and deficit regions
Adequate quality of workforce, pulling up productivity and growth in surplus regions and addressing theneeds of deficit regions
Continuation of current education investment and quality ➔Large number of illiterates, dropouts, and unemployable
graduates in surplus regions
Social and political tensions in surplus regions
Skill shortages in deficit regions
Tense competition for a small pool of skilled and medium-skilled labor between surplus and deficit regionsand among countries in deficit regions
Integration Promotion of multiculturalism, acceptance of cultural differences and appreciation of diversity, andpreparation of migrants ➔
Smoother integration of foreign labor force in host countries
Mutual gains from Diaspora networks
Status quo with little integration efforts in host countries coupled with poorly designed policies to maintain migrants’ties with home countries ➔
Social tensions in host countries from minorities’ sense of alienation and exclusion
Distortion of home countries values and cultural norms especially for second generations
Facilitating potential exploitation of identity and cultural issuesfor political motives
Social Protection Portability of social protection ➔
Increased mobility and full use of a variety of mobility schemes, includ-ing circularity in the interest ofmigrant workers and home and hostcountries labor market
Mutual gains from cross-fertilization and knowledge dissemination
Limited or nonexistent portability for pension and health benefits ➔
Loss of benefits for migrant workers
Global mobility constraints, less return migration, and less-than-optimal use of migration regime options
Financial Services Facilitation of transnational investments and a wide range of savings and investment instruments ➔
Optimal use of migrants’ savings to the benefit of sending and host countries
High cost of remittance transfers and limited opportunities forinvestments across national boundaries ➔
Less-than-optimal use of migrants’ savings at the expense ofsending and receiving regions
As table 5.3 lays out, the consequences of collaboration versus competition
in responding to the challenges ahead merit careful consideration.17 If all
actors agree to a collaborative approach to the challenges ahead, large gains
would accrue to both sending and receiving countries. From a long-term per-
spective, the gains from collaboration and coordination are clear. Sending
countries would be able to improve access to and the quality of education,
while future labor deficit regions will more likely face a well-functioning global
labor market. Conversely, noncollaboration would hurt both sides equally. If
the investment to expand in number and quality the global pool of medium-
and high-skilled workers is not undertaken today, the large number of skilled
workers migrating to higher-income/labor deficit areas would create short-
ages in the sending countries.
Moreover, if the pool of medium- and high-skilled workers is not large
enough to meet the demands from countries in those higher-income/labor
Shaping the Future92
deficit areas, competition between them would increase remuneration of
scarce labor without, however, avoiding shortages, in light of the inelastic
character of the supply of skills in the short term. Therefore partnerships
between growing and deficit regions of the world involving public, private,
and associative actors need to be established to address the know-how and
financial challenges associated with preparing a high-quality global workforce
for the future.
A long-term perspective of labor and population challenges will favor inter-
national cooperation. There will be rapid and large payoffs to stronger cooper-
ation in the management of labor and job mobility for both sending and
receiving areas of the world. Since reform and adaptation needs to take place
now and a large share of the cost of investment will need to occur upfront,
all countries need to adopt a long-term perspective and a proactive, cooper-
ative, and concerted approach to address the challenges and opportunities
associated with a smooth functioning of future labor and job markets.
Notes
1. As discussed in chapter 4, known changes in key parameters such as increasing labor force overall
participation rates and retirement age would mitigate but appear unlikely to alter the global picture
significantly. Nevertheless, future developments relating to productivity, capital versus labor intensity,
science, and technology could transform the picture and open different avenues for future labor and
jobs mobility.
2. Although, for the sake of simplicity we use the terminology of sending and receiving countries, this
distinction is becoming increasingly artificial. Many countries are already and will increasingly find
themselves on both sides of global labor mobility-sending and receiving. Demographic transition and
differential levels of income and opportunities are likely to expand this phenomenon.
3. Temporary and permanent migration are straightforward concepts, yet in reality a large part of
migrants fall somewhere in between, in the category of transitional migrants. These are migrants that
arrive on temporary visas and work permits with no intention to stay permanently, but eventually
transform into long-term migrants or permanent settlers.
4. All of these numbers refer to third-country nationals only and hence do not take into account intra-
EU migration.
5. The Italian government, for example, was running pilot programs with Albania and Egypt, but
both projects resulted in low numbers of actual matchings. On the Albanian pilot project, called
Digital Registry of Foreign Workers (AILE), see OECD (2004). The pilot project with Egypt is called
Integrated Information System (IMIS) and resulted in only 8 matches in 2004 and 2005, although this
was not the primary objective of the project.
6. The Canadian points system apparently attracts the largest share of tertiary educated migrants, but
many of those highly educated migrants end up in jobs that are not adequate for their education. This
“brain waste” may result from a disconnection between labor demand and the migration program
(Reitz 2005).
7. In the United States, the H2-A and H2-B visas grant access to the U.S. labor market of up to one
year, with about 100,000 visas issued every year. Canada has concluded bilateral agreements aiming at
seasonal workers with Mexico and Jamaica. Under the German-Polish bilateral agreement, every year
more than 200,000 seasonal Polish workers enter Germany (see OECD 2004).
8. Abella 2006.
A Conceptual Framework for Policy Makers 93
9. Ray 2004.
10. Ibid.
11. Ibid.
12. There are few statistics on private recruitment agencies in MENA countries but, based on anecdotal
evidence, a large number of these agencies seem to operate without official control. It is common for
these agencies to request high fees from potential emigrants without providing valuable services. As a
result, they tend to have a bad reputation in many countries.
13. NAAPEC offers a range of services for all kinds of firms and destination countries: analysis of
human resources needs and profile definition, gathering of applications (database, spread within the
agencies network, and newspapers), preselection of applications according to the employer criteria,
disposition of offices for interviewers, organization of technical tests, and administrative support for
candidates.
14. See background papers, Synthesis of Three Case Studies, for a concise discussion of the institutional
infrastructure and issues.
15. See Agunias and Ruiz 2007.
16. See Menz 2007.
17. This payoff matrix is an adaptation of the prisoner’s dilemma framework to the migration man-
agement issue. The situation can be compared to the game theory concept of the prisoner’s dilemma,
a non-zero-sum game in which two players may each “cooperate” with or “defect” from (that is, betray)
the other player. The only concern of each individual player (the “prisoner”) is to maximize his or her
own payoff, without any concern for the other player’s payoff. The unique equilibrium for this game
is a Pareto-suboptimal solution—that is, rational choice leads the two players to both “defect,” even
though each player’s individual reward would be greater if they both “cooperated.” It has also been
shown, however, that if the game is repeated over several periods, cooperation may instead arise as a
rational solution, because players have the opportunity to retaliate for deviant behavior.

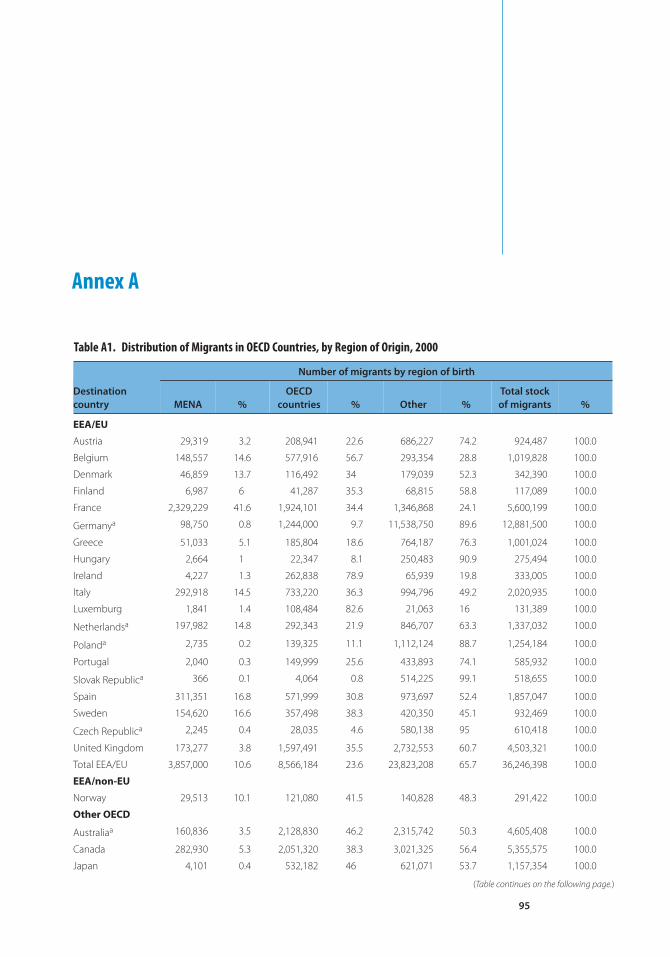
95
Number of migrants by region of birth
Destination
country MENA %
OECD
countries % Other %
Total stock
of migrants %
EEA/EU
Austria 29,319 3.2 208,941 22.6 686,227 74.2 924,487 100.0
Belgium 148,557 14.6 577,916 56.7 293,354 28.8 1,019,828 100.0
Denmark 46,859 13.7 116,492 34 179,039 52.3 342,390 100.0
Finland 6,987 6 41,287 35.3 68,815 58.8 117,089 100.0
France 2,329,229 41.6 1,924,101 34.4 1,346,868 24.1 5,600,199 100.0
Germanya 98,750 0.8 1,244,000 9.7 11,538,750 89.6 12,881,500 100.0
Greece 51,033 5.1 185,804 18.6 764,187 76.3 1,001,024 100.0
Hungary 2,664 1 22,347 8.1 250,483 90.9 275,494 100.0
Ireland 4,227 1.3 262,838 78.9 65,939 19.8 333,005 100.0
Italy 292,918 14.5 733,220 36.3 994,796 49.2 2,020,935 100.0
Luxemburg 1,841 1.4 108,484 82.6 21,063 16 131,389 100.0
Netherlandsa 197,982 14.8 292,343 21.9 846,707 63.3 1,337,032 100.0
Polanda 2,735 0.2 139,325 11.1 1,112,124 88.7 1,254,184 100.0
Portugal 2,040 0.3 149,999 25.6 433,893 74.1 585,932 100.0
Slovak Republica 366 0.1 4,064 0.8 514,225 99.1 518,655 100.0
Spain 311,351 16.8 571,999 30.8 973,697 52.4 1,857,047 100.0
Sweden 154,620 16.6 357,498 38.3 420,350 45.1 932,469 100.0
Czech Republica 2,245 0.4 28,035 4.6 580,138 95 610,418 100.0
United Kingdom 173,277 3.8 1,597,491 35.5 2,732,553 60.7 4,503,321 100.0
Total EEA/EU 3,857,000 10.6 8,566,184 23.6 23,823,208 65.7 36,246,398 100.0
EEA/non-EU
Norway 29,513 10.1 121,080 41.5 140,828 48.3 291,422 100.0
Other OECD
Australiaa 160,836 3.5 2,128,830 46.2 2,315,742 50.3 4,605,408 100.0
Canada 282,930 5.3 2,051,320 38.3 3,021,325 56.4 5,355,575 100.0
Japan 4,101 0.4 532,182 46 621,071 53.7 1,157,354 100.0
(Table continues on the following page.)
Table A1. Distribution of Migrants in OECD Countries, by Region of Origin, 2000
Annex A
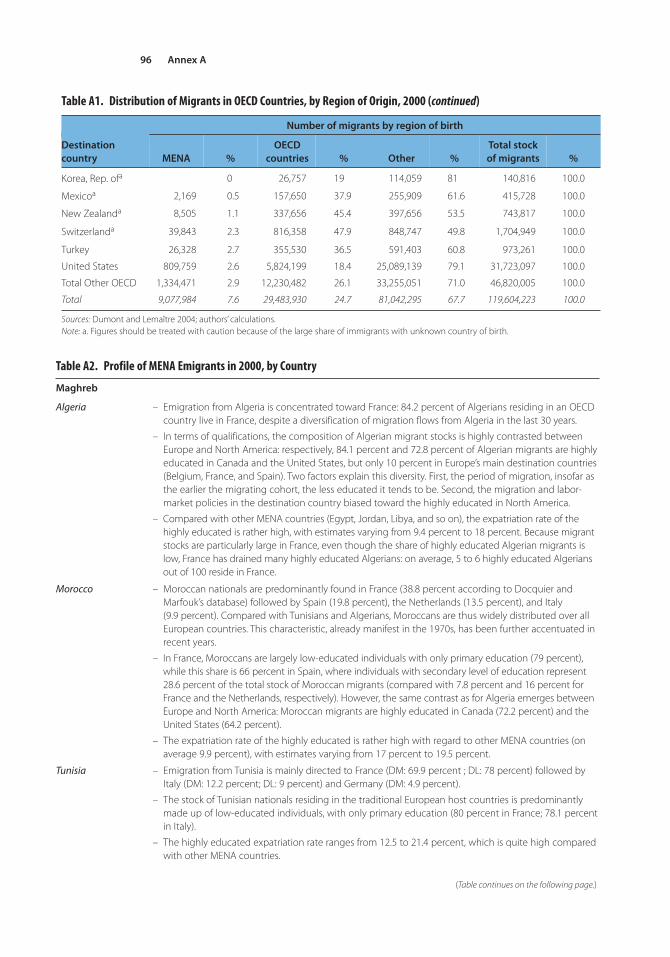
Annex A96
Number of migrants by region of birth
Destination
country MENA %
OECD
countries % Other %
Total stock
of migrants %
Korea, Rep. ofa 0 26,757 19 114,059 81 140,816 100.0
Mexicoa 2,169 0.5 157,650 37.9 255,909 61.6 415,728 100.0
New Zealanda 8,505 1.1 337,656 45.4 397,656 53.5 743,817 100.0
Switzerlanda 39,843 2.3 816,358 47.9 848,747 49.8 1,704,949 100.0
Turkey 26,328 2.7 355,530 36.5 591,403 60.8 973,261 100.0
United States 809,759 2.6 5,824,199 18.4 25,089,139 79.1 31,723,097 100.0
Total Other OECD 1,334,471 2.9 12,230,482 26.1 33,255,051 71.0 46,820,005 100.0
Total 9,077,984 7.6 29,483,930 24.7 81,042,295 67.7 119,604,223 100.0
Sources: Dumont and Lemaître 2004; authors’ calculations.Note: a. Figures should be treated with caution because of the large share of immigrants with unknown country of birth.
Algeria – Emigration from Algeria is concentrated toward France: 84.2 percent of Algerians residing in an OECDcountry live in France, despite a diversification of migration flows from Algeria in the last 30 years.
– In terms of qualifications, the composition of Algerian migrant stocks is highly contrasted betweenEurope and North America: respectively, 84.1 percent and 72.8 percent of Algerian migrants are highlyeducated in Canada and the United States, but only 10 percent in Europe’s main destination countries(Belgium, France, and Spain). Two factors explain this diversity. First, the period of migration, insofar asthe earlier the migrating cohort, the less educated it tends to be. Second, the migration and labor-market policies in the destination country biased toward the highly educated in North America.
– Compared with other MENA countries (Egypt, Jordan, Libya, and so on), the expatriation rate of thehighly educated is rather high, with estimates varying from 9.4 percent to 18 percent. Because migrantstocks are particularly large in France, even though the share of highly educated Algerian migrants islow, France has drained many highly educated Algerians: on average, 5 to 6 highly educated Algeriansout of 100 reside in France.
Morocco – Moroccan nationals are predominantly found in France (38.8 percent according to Docquier andMarfouk’s database) followed by Spain (19.8 percent), the Netherlands (13.5 percent), and Italy (9.9 percent). Compared with Tunisians and Algerians, Moroccans are thus widely distributed over allEuropean countries. This characteristic, already manifest in the 1970s, has been further accentuated inrecent years.
– In France, Moroccans are largely low-educated individuals with only primary education (79 percent),while this share is 66 percent in Spain, where individuals with secondary level of education represent28.6 percent of the total stock of Moroccan migrants (compared with 7.8 percent and 16 percent forFrance and the Netherlands, respectively). However, the same contrast as for Algeria emerges betweenEurope and North America: Moroccan migrants are highly educated in Canada (72.2 percent) and theUnited States (64.2 percent).
– The expatriation rate of the highly educated is rather high with regard to other MENA countries (onaverage 9.9 percent), with estimates varying from 17 percent to 19.5 percent.
Tunisia – Emigration from Tunisia is mainly directed to France (DM: 69.9 percent ; DL: 78 percent) followed byItaly (DM: 12.2 percent; DL: 9 percent) and Germany (DM: 4.9 percent).
– The stock of Tunisian nationals residing in the traditional European host countries is predominantlymade up of low-educated individuals, with only primary education (80 percent in France; 78.1 percentin Italy).
– The highly educated expatriation rate ranges from 12.5 to 21.4 percent, which is quite high comparedwith other MENA countries.
(Table continues on the following page.)
Table A1. Distribution of Migrants in OECD Countries, by Region of Origin, 2000 (continued)
Table A2. Profile of MENA Emigrants in 2000, by Country
Maghreb
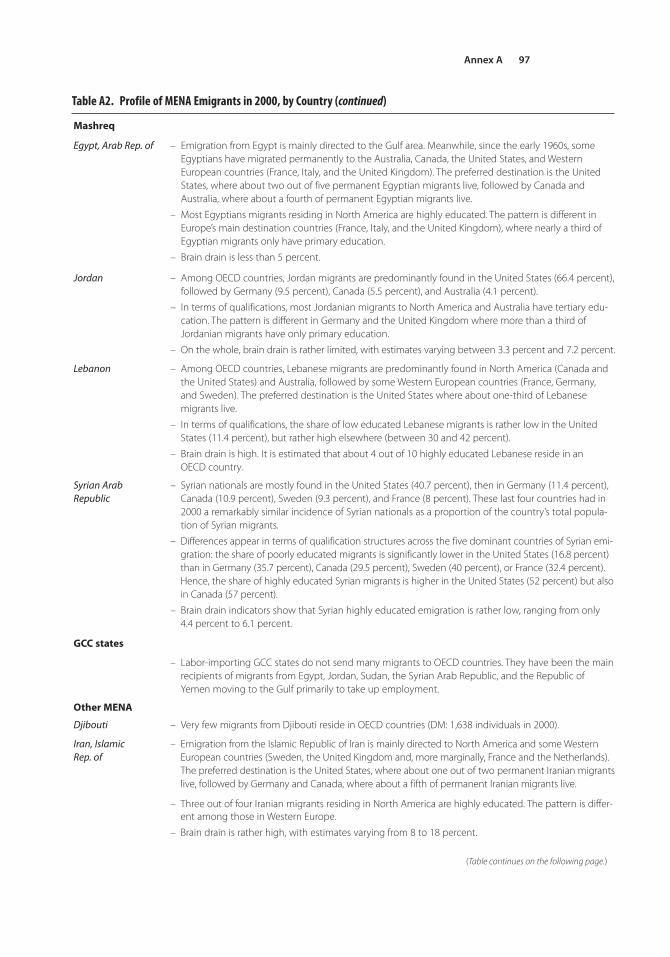
Annex A 97
Mashreq
Egypt, Arab Rep. of – Emigration from Egypt is mainly directed to the Gulf area. Meanwhile, since the early 1960s, someEgyptians have migrated permanently to the Australia, Canada, the United States, and WesternEuropean countries (France, Italy, and the United Kingdom). The preferred destination is the UnitedStates, where about two out of five permanent Egyptian migrants live, followed by Canada andAustralia, where about a fourth of permanent Egyptian migrants live.
– Most Egyptians migrants residing in North America are highly educated. The pattern is different inEurope’s main destination countries (France, Italy, and the United Kingdom), where nearly a third ofEgyptian migrants only have primary education.
– Brain drain is less than 5 percent.
Jordan – Among OECD countries, Jordan migrants are predominantly found in the United States (66.4 percent),followed by Germany (9.5 percent), Canada (5.5 percent), and Australia (4.1 percent).
– In terms of qualifications, most Jordanian migrants to North America and Australia have tertiary edu-cation. The pattern is different in Germany and the United Kingdom where more than a third ofJordanian migrants have only primary education.
– On the whole, brain drain is rather limited, with estimates varying between 3.3 percent and 7.2 percent.
Lebanon – Among OECD countries, Lebanese migrants are predominantly found in North America (Canada andthe United States) and Australia, followed by some Western European countries (France, Germany, and Sweden). The preferred destination is the United States where about one-third of Lebanesemigrants live.
– In terms of qualifications, the share of low educated Lebanese migrants is rather low in the UnitedStates (11.4 percent), but rather high elsewhere (between 30 and 42 percent).
– Brain drain is high. It is estimated that about 4 out of 10 highly educated Lebanese reside in an OECD country.
Syrian Arab Republic
– Syrian nationals are mostly found in the United States (40.7 percent), then in Germany (11.4 percent),Canada (10.9 percent), Sweden (9.3 percent), and France (8 percent). These last four countries had in2000 a remarkably similar incidence of Syrian nationals as a proportion of the country’s total popula-tion of Syrian migrants.
– Differences appear in terms of qualification structures across the five dominant countries of Syrian emi-gration: the share of poorly educated migrants is significantly lower in the United States (16.8 percent)than in Germany (35.7 percent), Canada (29.5 percent), Sweden (40 percent), or France (32.4 percent).Hence, the share of highly educated Syrian migrants is higher in the United States (52 percent) but alsoin Canada (57 percent).
– Brain drain indicators show that Syrian highly educated emigration is rather low, ranging from only 4.4 percent to 6.1 percent.
GCC states
– Labor-importing GCC states do not send many migrants to OECD countries. They have been the mainrecipients of migrants from Egypt, Jordan, Sudan, the Syrian Arab Republic, and the Republic ofYemen moving to the Gulf primarily to take up employment.
Other MENA
Djibouti – Very few migrants from Djibouti reside in OECD countries (DM: 1,638 individuals in 2000).
Iran, Islamic Rep. of
– Emigration from the Islamic Republic of Iran is mainly directed to North America and some WesternEuropean countries (Sweden, the United Kingdom and, more marginally, France and the Netherlands).The preferred destination is the United States, where about one out of two permanent Iranian migrantslive, followed by Germany and Canada, where about a fifth of permanent Iranian migrants live.
– Three out of four Iranian migrants residing in North America are highly educated. The pattern is differ-ent among those in Western Europe.
– Brain drain is rather high, with estimates varying from 8 to 18 percent.
(Table continues on the following page.)
Table A2. Profile of MENA Emigrants in 2000, by Country (continued)
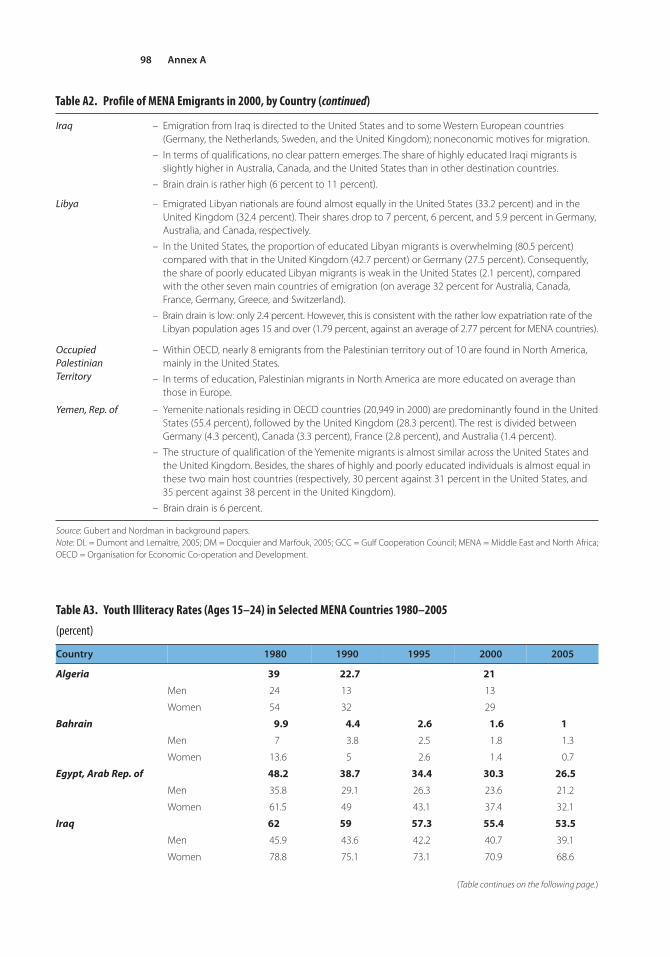
Iraq – Emigration from Iraq is directed to the United States and to some Western European countries(Germany, the Netherlands, Sweden, and the United Kingdom); noneconomic motives for migration.
– In terms of qualifications, no clear pattern emerges. The share of highly educated Iraqi migrants isslightly higher in Australia, Canada, and the United States than in other destination countries.
– Brain drain is rather high (6 percent to 11 percent).
Libya – Emigrated Libyan nationals are found almost equally in the United States (33.2 percent) and in theUnited Kingdom (32.4 percent). Their shares drop to 7 percent, 6 percent, and 5.9 percent in Germany,Australia, and Canada, respectively.
– In the United States, the proportion of educated Libyan migrants is overwhelming (80.5 percent) compared with that in the United Kingdom (42.7 percent) or Germany (27.5 percent). Consequently,the share of poorly educated Libyan migrants is weak in the United States (2.1 percent), comparedwith the other seven main countries of emigration (on average 32 percent for Australia, Canada,France, Germany, Greece, and Switzerland).
– Brain drain is low: only 2.4 percent. However, this is consistent with the rather low expatriation rate of theLibyan population ages 15 and over (1.79 percent, against an average of 2.77 percent for MENA countries).
Occupied Palestinian Territory
– Within OECD, nearly 8 emigrants from the Palestinian territory out of 10 are found in North America,mainly in the United States.
– In terms of education, Palestinian migrants in North America are more educated on average thanthose in Europe.
Yemen, Rep. of – Yemenite nationals residing in OECD countries (20,949 in 2000) are predominantly found in the UnitedStates (55.4 percent), followed by the United Kingdom (28.3 percent). The rest is divided betweenGermany (4.3 percent), Canada (3.3 percent), France (2.8 percent), and Australia (1.4 percent).
– The structure of qualification of the Yemenite migrants is almost similar across the United States andthe United Kingdom. Besides, the shares of highly and poorly educated individuals is almost equal inthese two main host countries (respectively, 30 percent against 31 percent in the United States, and35 percent against 38 percent in the United Kingdom).
– Brain drain is 6 percent.
Source: Gubert and Nordman in background papers.Note: DL = Dumont and Lemaître, 2005; DM = Docquier and Marfouk, 2005; GCC = Gulf Cooperation Council; MENA = Middle East and North Africa;OECD = Organisation for Economic Co-operation and Development.
Annex A98
Table A2. Profile of MENA Emigrants in 2000, by Country (continued)
Country 1980 1990 1995 2000 2005
Algeria 39 22.7 21
Men 24 13 13
Women 54 32 29
Bahrain 9.9 4.4 2.6 1.6 1
Men 7 3.8 2.5 1.8 1.3
Women 13.6 5 2.6 1.4 0.7
Egypt, Arab Rep. of 48.2 38.7 34.4 30.3 26.5
Men 35.8 29.1 26.3 23.6 21.2
Women 61.5 49 43.1 37.4 32.1
Iraq 62 59 57.3 55.4 53.5
Men 45.9 43.6 42.2 40.7 39.1
Women 78.8 75.1 73.1 70.9 68.6
(Table continues on the following page.)
Table A3. Youth Illiteracy Rates (Ages 15–24) in Selected MENA Countries 1980–2005
(percent)
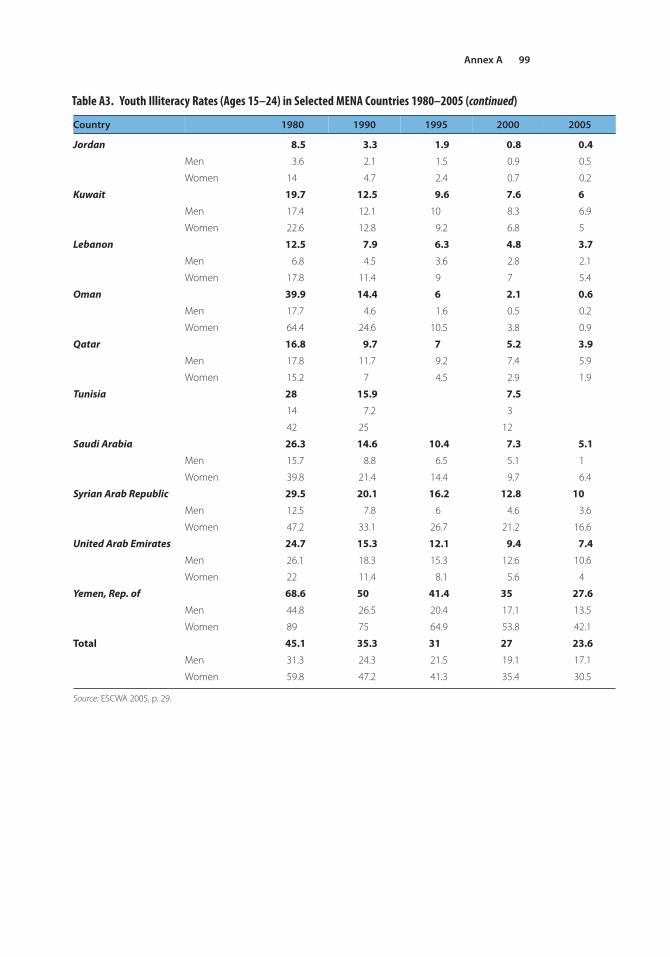
Annex A 99
Country 1980 1990 1995 2000 2005
Jordan 8.5 3.3 1.9 0.8 0.4
Men 3.6 2.1 1.5 0.9 0.5
Women 14 4.7 2.4 0.7 0.2
Kuwait 19.7 12.5 9.6 7.6 6
Men 17.4 12.1 10 8.3 6.9
Women 22.6 12.8 9.2 6.8 5
Lebanon 12.5 7.9 6.3 4.8 3.7
Men 6.8 4.5 3.6 2.8 2.1
Women 17.8 11.4 9 7 5.4
Oman 39.9 14.4 6 2.1 0.6
Men 17.7 4.6 1.6 0.5 0.2
Women 64.4 24.6 10.5 3.8 0.9
Qatar 16.8 9.7 7 5.2 3.9
Men 17.8 11.7 9.2 7.4 5.9
Women 15.2 7 4.5 2.9 1.9
Tunisia 28 15.9 7.5
14 7.2 3
42 25 12
Saudi Arabia 26.3 14.6 10.4 7.3 5.1
Men 15.7 8.8 6.5 5.1 1
Women 39.8 21.4 14.4 9.7 6.4
Syrian Arab Republic 29.5 20.1 16.2 12.8 10
Men 12.5 7.8 6 4.6 3.6
Women 47.2 33.1 26.7 21.2 16.6
United Arab Emirates 24.7 15.3 12.1 9.4 7.4
Men 26.1 18.3 15.3 12.6 10.6
Women 22 11.4 8.1 5.6 4
Yemen, Rep. of 68.6 50 41.4 35 27.6
Men 44.8 26.5 20.4 17.1 13.5
Women 89 75 64.9 53.8 42.1
Total 45.1 35.3 31 27 23.6
Men 31.3 24.3 21.5 19.1 17.1
Women 59.8 47.2 41.3 35.4 30.5
Source: ESCWA 2005, p. 29.
Table A3. Youth Illiteracy Rates (Ages 15–24) in Selected MENA Countries 1980–2005 (continued)
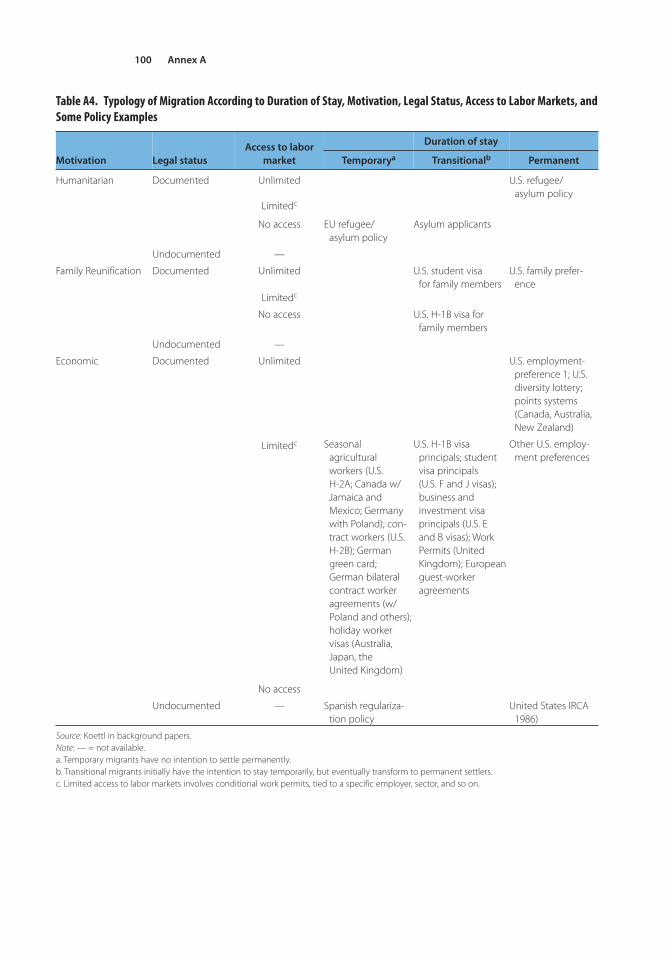
Annex A100
Table A4. Typology of Migration According to Duration of Stay, Motivation, Legal Status, Access to Labor Markets, andSome Policy Examples
Motivation Legal status
Access to labor
market Temporarya Transitionalb Permanent
Humanitarian Documented Unlimited U.S. refugee/asylum policy
Limitedc
No access EU refugee/asylum policy
Asylum applicants
Undocumented —
Family Reunification Documented Unlimited U.S. student visa for family members
U.S. family prefer-ence
Limitedc
No access U.S. H-1B visa for family members
Undocumented —
Economic Documented Unlimited U.S. employment-preference 1; U.S.diversity lottery;points systems(Canada, Australia,New Zealand)
Limitedc Seasonal agricultural workers (U.S. H-2A; Canada w/Jamaica and Mexico; Germanywith Poland); con-tract workers (U.S. H-2B); German green card; German bilateralcontract workeragreements (w/Poland and others);holiday worker visas (Australia,Japan, the United Kingdom)
U.S. H-1B visa principals; studentvisa principals (U.S. F and J visas);business and investment visa principals (U.S. E and B visas); WorkPermits (UnitedKingdom); Europeanguest-worker agreements
Other U.S. employ-ment preferences
No access
Undocumented — Spanish regulariza-tion policy
United States IRCA1986)
Source: Koettl in background papers.Note: — = not available. a. Temporary migrants have no intention to settle permanently.b. Transitional migrants initially have the intention to stay temporarily, but eventually transform to permanent settlers.c. Limited access to labor markets involves conditional work permits, tied to a specific employer, sector, and so on.
Duration of stay
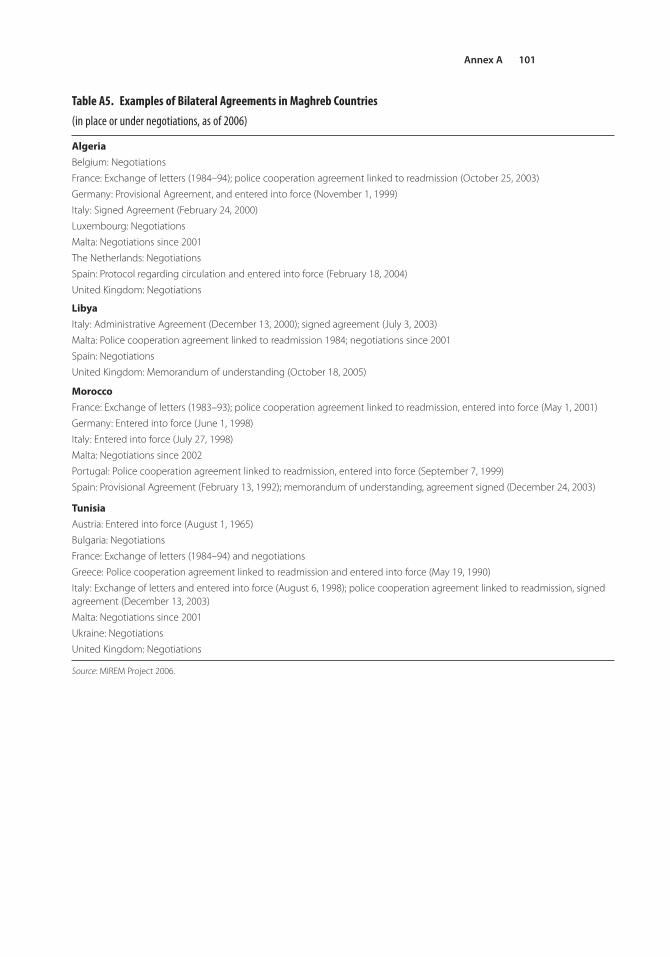
Annex A 101
Table A5. Examples of Bilateral Agreements in Maghreb Countries
(in place or under negotiations, as of 2006)
Algeria
Belgium: Negotiations
France: Exchange of letters (1984–94); police cooperation agreement linked to readmission (October 25, 2003)
Germany: Provisional Agreement, and entered into force (November 1, 1999)
Italy: Signed Agreement (February 24, 2000)
Luxembourg: Negotiations
Malta: Negotiations since 2001
The Netherlands: Negotiations
Spain: Protocol regarding circulation and entered into force (February 18, 2004)
United Kingdom: Negotiations
Libya
Italy: Administrative Agreement (December 13, 2000); signed agreement (July 3, 2003)
Malta: Police cooperation agreement linked to readmission 1984; negotiations since 2001
Spain: Negotiations
United Kingdom: Memorandum of understanding (October 18, 2005)
Morocco
France: Exchange of letters (1983–93); police cooperation agreement linked to readmission, entered into force (May 1, 2001)
Germany: Entered into force (June 1, 1998)
Italy: Entered into force (July 27, 1998)
Malta: Negotiations since 2002
Portugal: Police cooperation agreement linked to readmission, entered into force (September 7, 1999)
Spain: Provisional Agreement (February 13, 1992); memorandum of understanding, agreement signed (December 24, 2003)
Tunisia
Austria: Entered into force (August 1, 1965)
Bulgaria: Negotiations
France: Exchange of letters (1984–94) and negotiations
Greece: Police cooperation agreement linked to readmission and entered into force (May 19, 1990)
Italy: Exchange of letters and entered into force (August 6, 1998); police cooperation agreement linked to readmission, signedagreement (December 13, 2003)
Malta: Negotiations since 2001
Ukraine: Negotiations
United Kingdom: Negotiations
Source: MIREM Project 2006.

103
Note: This is a list of selected references. More extensive lists, akin to bibliographies, are found accompa-
nying the background papers on the CD.
Abella, M. 2006. “Policies and Best Practices for Management of Temporary Migration.” Paper presented
at the International Symposium of International Migration and Development in Turin, Italy, June
28–30.
Agunias, Rannveig, and Ruiz. 2007. “Protecting Overseas Workers: Lessons and Cautions from the
Philippines.” MPI Insight Paper, the Migration Policy Institute, September. http://www.migra
tionpolicy.org/pubs/MigDevInsight_091807.pdf.
Auerbach, Kotlikoff, Hagemann, and Nicoletti. 1989. “The Economic Dynamics of an Ageing
Population: The Case of Four OECD Countries.” OECD Economics Department Working Papers
62, OECD Economics Department, Paris.
Call Center Magazine. 2003. “Call Centers in EMEA: Outsourcing to Surge.” www.callcentermagazine.com.
CEDEFOP (European Centre for the Development of Vocational Training). 2008. Future Skills Needs
in Europe: Medium-Term Forecast: Key Findings. Luxembourg: Office for Official Publications of
the European Communities.
Commission of the European Communities. 2004. “First Annual Report on Migration and
Integration.” (COM 2004 508) Brussels, May 16.
Corm, G. 1997. Sustainable Human Development and Macro Economy: The Case of the Arab World.
Human Development Series No. 6, ESCWA, United Nations, New York.
Corm, G. 2008. “Labor Migration in the Middle East and North Africa: A Diagnostic Overview.” Paper
prepared for the World Bank, June 2006. Background papers for this study.
Die Welt. 2006. “Airbus findet keine Ingenieure in Deutschland.” June 5. http://www.welt.de/data/2006/
06/05/903068.html.
Diwan, I., S. Johansson de Silva, M. Nabli, and A. Coulibali. 2003. “Economic Reforms and People
Mobility for a More Effective EU-MED Partnership.” In C. Mallat, ed., Union Européenne et
Moyen Orient, Etat des lieux, Beirut: Presses de l’Université Saint Joseph.
Docquier, F., and A. Marfouk. 2005. “International Migration by Educational Attainment, 1990–2000.”
In C. Ozden and M. Schiff, eds., International Migration, Remittances and the Brain Drain.
Washington, DC: World Bank.
Docquier, F., B. L. Lowell, and A. Marfouk. 2007. “A Gendered Assessment of the Brain Drain.” IZA
Discussion Paper No. 3232. December, Institute for the Study of Labor, Bonn. Reprinted in Policy
Research Working Paper No. 4613, May 2008, World Bank, Washington, DC.
Dumont, J. C., and G. Lemaître. 2005. “Counting Immigrants and Expatriates in OECD Countries: A
New Perspective.” OECD Social, Employment and Migration Working Papers, No. 25.
Organisation for Economic Co-operation and Development, Paris.
References
The Economist. 2008. Special Report on Migration. January 5–11.
ESCWA (Economic and Social Commission for Western Asia). 2005. Statistical Abstract of the ESCWA
Region, 24th Issue, E/ESCWA/2005/2. United Nations, New York.
Fargues, P., ed. 2005. Migrations méditerranéennes, rapport 2005. Cooperation project on migration
financed by the ECMEDA program, EUI-RSCAS, CARIM Consortium, Florence.
FIPA-Invest in Tunisia. 2004. “Les centres d’appel et les centres de services partagés dans la région euro -
méditerranéenne, ‘ANIMA,’ Investir en Méditerranée.” December.
Gubert, F., and C. Nordman. 2008. “Migration from MENA to OECD Countries: Trends, Determinants
and Prospects.” Paper prepared for the World Bank, June 2006. Background papers for this study.
Holzmann, Robert. 2005. “Demographic Alternatives for Aging Industrial Countries: Increased Total
Fertility, Labor Force Participation, or Immigration.” IZA Discussion Paper No. 1885, Institute for
the Study of Labor, Bonn. http://ftp.iza.org/dp1885.pdf (accessed June 5, 2006).
Holzmann, R., and R. Münz. 2004. “Challenges and Opportunities of International Migration for the
EU, Its Member States, Neighboring Countries and Regions: A Policy Note.” Institute for Futures
Studies, Stockholm.
IMF (International Monetary Fund). 2006. “Can Europe Afford to Grow Old?” Finance and
Development 43 (3).
ILO (International Labour Organization). 1997. Economically Active Population, 1950–2010, 4th edi-
tion (diskette database). Geneva: ILO.
Katseli, L., R. E. B. Lucas, and T. Xenogiani. 2007. “Policies for Migration and Development: A
European Perspective.” OECD Development Centre Policy Brief No. 30, Organisation for
Economic Co-operation and Development, Paris.
Knowledge@Wharton. 2004. “Move Over, India: The Shifting Geography of Offshore Outsourcing
Creates New Challengers.” University of Pennsylvania. http://Knowledge.Wharton.upenn.edu.
Koettl, J. 2008. “Prospects for Management of Migration Between Europe and the Middle East and North
Africa.” Paper prepared for the World Bank, September 2007. Background papers for this study.
Mayda, A. M. 2005. “International Migration: A Panel Data Analysis of Economic and Non-Economic
Determinants.” Georgetown University, Washington, DC.
McCue, A. 2006. “Egypt Touts Itself as Next Offshore Outsourcing Hot-Spot.” http://services.silicon.
com/offshoring/0,3800004877,39156347,00.htm.
McKinsey Global Institute. 2005. The Emerging Global Market. San Francisco.
McKinsey Global Institute. 2004. World Investment Report. San Francisco.
Menz, G. 2007. “Employers, Trade Unions and Labor Migration Policies: Examining the Role of Non-
State Actors.” Paper prepared for the EU Studies Association 10th biennial Conference.
MIREM Project. 2006. Migration de retour vers le Maghreb. Robert Schuman Centre for Advanced
Studies. www.mirem.eu.
Münz, R. 2007. “Migration, Labor Markets and Integration of Migrants. An Overview for Europe.”
Hamburg Institute of International Economics (HWWI), Policy Paper No. 3–6. http://www.hwwi.
org (accessed October 17, 2007).
OECD (Organisation for Economic Co-operation and Development). 1994. The OECD Jobs Study:
Facts, Analysis, Strategies. Paris: OECD.
OECD (Organisation for Economic Co-operation and Development). 2004. Migration for
Employment. Bilateral Agreements at a Crossroads. Paris: OECD.
OECD (Organisation for Economic Co-operation and Development). 2007. Trends in Migration.
SOPEMI 2007, Paris.
OECD (Organisation for Economic Co-operation and Development). 2008a. “Employment Statistics.”
OECD, Paris. www.oecd.org.
OECD (Organisation for Economic Co-operation and Development). 2008b. OECD Observer.
“Population Ageing: Facing the Challenge.” OECD, Paris.
104 References104
Pedersen, M., P. J. Pytlikova, and N. Smith. 2004. “Selection or Network Effects? Migration Flows into
27 OECD Countries, 1999–2000.” IZA Discussion Paper, No. 1104, Institute for the Study of Labor,
Bonn. http://ftp.iza.org/dp1104.pdf (accessed September 29, 2008).
Peri, G. 2005. “International Migration: Some Comparisons and Lessons from the EU.” University of
California, Davis.
Ray, B. 2004. “Practices to Promote the Integration of Migrants in Labor Markets.” Paper prepared for
the European Commission, DG Employment and Social Affairs, Brussels, European Commission;
Hamburg, HWWA.
Reitz, J. G. 2005. “Tapping Immigrants Skills. New Directions for Canadian Immigration Policy in the
Knowledge Economy.” IRPP Choices 11 (1).
Rotte, R., and M. Vogler. 1999. “The Effects of Development on Migration: Theoretical Issues and New
Empirical Evidence.” IZA Discussion Papers No. 46, Institute for the Study of Labor, Bonn.
Schramm, C. 2006. “Migration from Egypt, Morocco and Tunisia: Synthesis of Three Case Studies.”
World Bank, Washington, DC. Background papers for this study.
UNCTAD (United Nations Conference on Trade and Development). 2005. World Investment Report.
New York and Geneva.
UNCTAD (United Nations Conference on Trade and Development). 2004. World Investment Report.
New York and Geneva.
United Nations. 2005. World Population Prospects. The 2004 Revision. New York.
Verhaeren, R. 1995. “L’émigration Maghrébine depuis 1946.” Mondes en Développement 23.
World Bank. 2005. “Knowledge Assessment Methodology.” World Bank, Washington, DC. www.world
bank.org/kam.
World Bank. 2006. “Global Economic Prospects: Economic Implications of Remittances and
Migration.” World Bank, Washington, DC.
World Bank. 2007a. World Development Indicators, CD-ROM. World Bank, Washington, DC.
World Bank. 2007b. Middle East and North Africa: Economic Developments and Prospects. Office of the
MENA Region Chief Economist, Washington, DC.
World Bank. 2008a. Doing Business. Database and multiple updates. World Bank, Washington, DC.
World Bank. 2008b. Education Reform in the Middle East and North Africa: The Road Not Traveled.
Washington, DC: World Bank.
Yarney, J. 2005. “African Countries Set Sights on BPO Market.” http://www.computerworld.com/
action/article.do?command=viewArticleBasic&articleId=103179.
Zahlan, A. B. 1980. Science and Science Policy in the Arab World. London: Croom Helm.
Zahlan, A. B. 1999. “The Arabs and the Challenges of Science and Technology. Progress without
Change (in Arabic).” Center for Arab Unity Studies, Beirut.
105References
ECO-AUDIT
Environmental Benefits Statement
The World Bank is committed to preservingendangered forests and natural resources. TheOffice of the Publisher has chosen to printShaping the Future on recycled paper with30 percent postconsumer fiber, in accordancewith the recommended standards for paperusage set by the Green Press Initiative, a non-profit program supporting publishers in usingfiber that is not sourced from endangeredforests. For more information, visit www.greenpressinitiative. org.
Saved:• 8 trees• 5 million BTUs of
total energy• 664 lbs of net
greenhouse gases• 2,756 gallons of waste
water• 354 lbs of solid waste

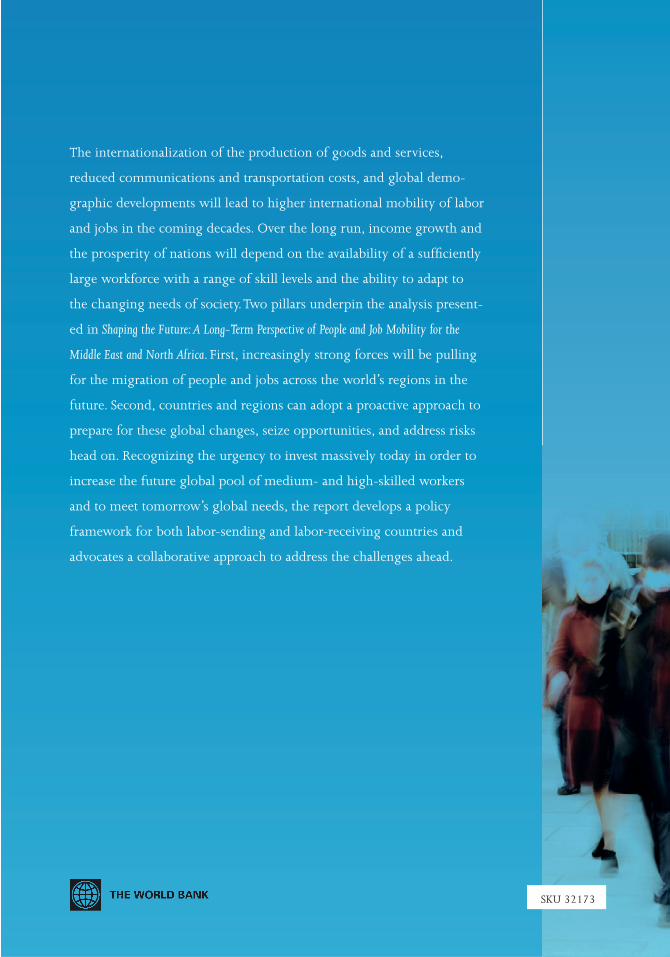
The internationalization of the production of goods and services,
reduced communications and transportation costs, and global demo-
graphic developments will lead to higher international mobility of labor
and jobs in the coming decades. Over the long run, income growth and
the prosperity of nations will depend on the availability of a suffi ciently
large workforce with a range of skill levels and the ability to adapt to
the changing needs of society. Two pillars underpin the analysis present-
ed in Shaping the Future: A Long-Term Perspective of People and Job Mobility for the
Middle East and North Africa. First, increasingly strong forces will be pulling
for the migration of people and jobs across the world’s regions in the
future. Second, countries and regions can adopt a proactive approach to
prepare for these global changes, seize opportunities, and address risks
head on. Recognizing the urgency to invest massively today in order to
increase the future global pool of medium- and high-skilled workers
and to meet tomorrow’s global needs, the report develops a policy
framework for both labor-sending and labor-receiving countries and
advocates a collaborative approach to address the challenges ahead.
SKU 32173