Embed Size (px)
Citation preview
Chapter 6
49
Syrian Arab Rep.
Source: World Development Indicators (2008: CD version). Data are from 2006 or most recent year available.
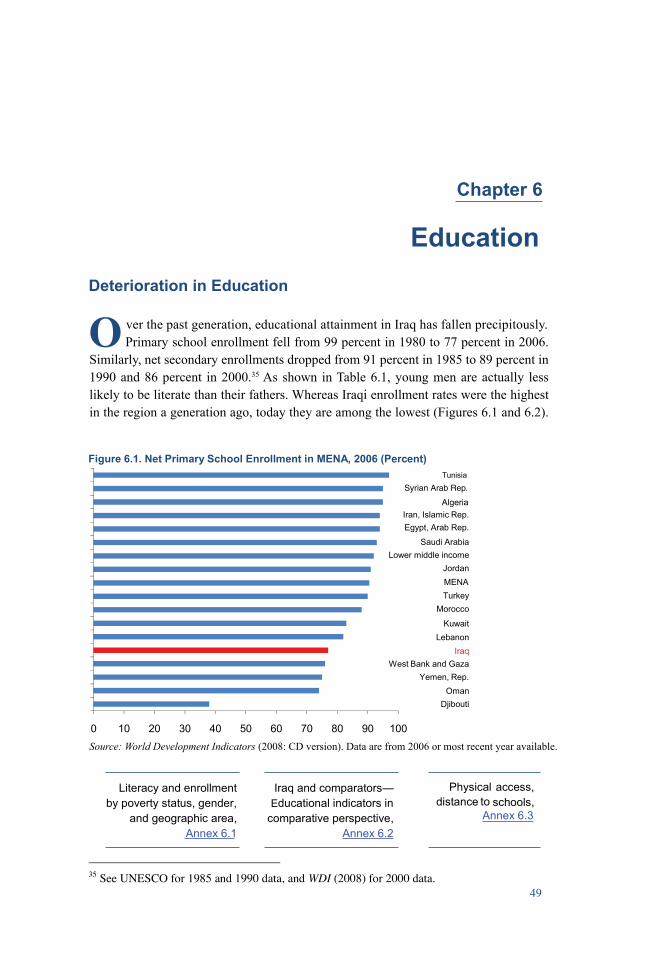
ver the past generation, educational attainment in Iraq has fallen precipitously. Primary school enrollment fell from 99 percent in 1980 to 77 percent in 2006. Similarly, net secondary enrollments dropped from 91 percent in 1985 to 89 percent in 1990 and 86 percent in 2000.35 As shown in Table 6.1, young men are actually less likely to be literate than their fathers. Whereas Iraqi enrollment rates were the highest in the region a generation ago, today they are among the lowest (Figures 6.1 and 6.2).
Education
Deterioration in Education
Figure 6.1. Net Primary School Enrollment in MENA, 2006 (Percent) Tunisia
Syrian Arab Rep.
Algeria Iran, Islamic Rep.
^ ^ ^ ^ H Egypt, Arab Rep.
Saudi Arabia ^ ^ ^ H Lower middle Income
Jordan MENA Turkey
Morocco
Kuwait
Lebanon
Iraq West Bank and Gaza
Yemen, Rep. Oman
Djibouti
0 10 20 30 40 50 60 70 80 90 100 Source: World Development Indicators (2008: CD version). Data are from 2006 or most recent year available.
Literacy and enrollment Iraq and comparators— Physical access, by poverty status, gender, Educational indicators in distance to schools,
and geographic area, comparative perspective, Annex 6.3 Annex 6.1 Annex 6,2
35 See UNESCO for 1985 and 1990 data, and WDI (2008) for 2000 data. 49
Confronting Poverty in Iraq: Main Findings
50
PercentPercent
by: 2.6 percent (Iraq), versus 6.0 percent (international average).
Sources: IHSES, World Bank, and World Development Indicators (2008: CD version).
Literacy
Net enrollment rates
Returns to education (%)
Government spending on education (%)
Average out-of-pocket expenditure per household
Kilometers to nearest school
Student-teacher ratioin primary schools
Female-to-male ratioin primary schools
Confronting Poverty in Iraq: Main Findings
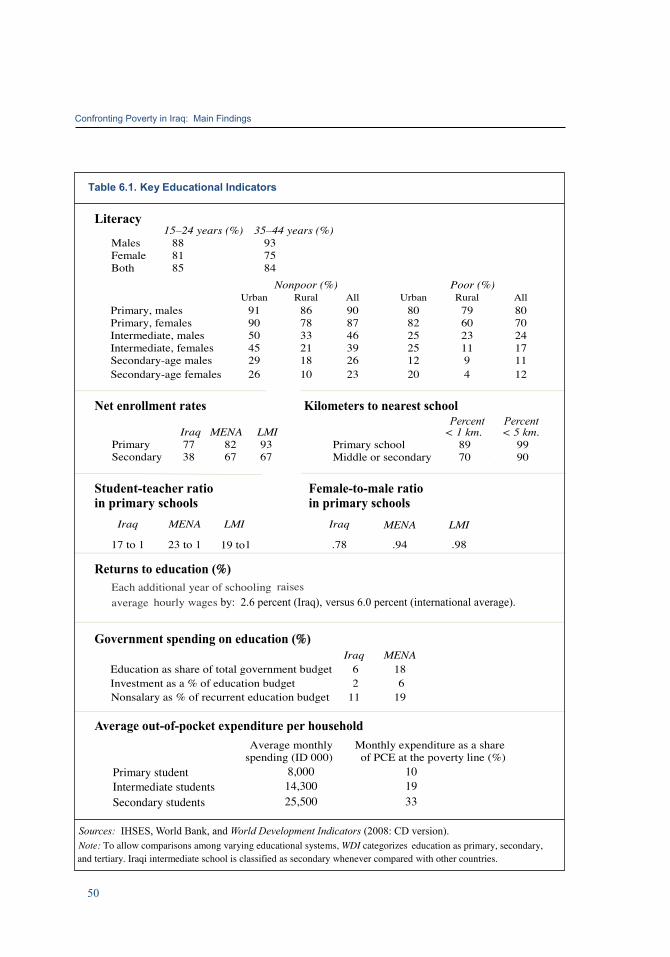
Table 6.1. Key Educational Indicators
Literacy
Males Female Both
15 24 years (9c) 88 81 85
35-44 years (%) 93 75 84
Nonpoor (%)
Primary, males Primary, females Intermediate, males Intermediate, females Secondary-age males Secondary-age females
Urban 91 90 50 45 29 26
Rural 86 78 33 21 18 10
All 90 87 46 39 26 23
Urban 80 82 25 25 12 20
Poor(%) Rural
79 60 23 11 9 4
All 80 70 24 17 11 12
Net enrollment rates
Primary Secondary
Iraq MENA 77 82 38 67
LMI 93 67
Kilometers to nearest school Percent Percent
< 1 km. < 5 km. Primary school 89 99 Middle or secondary 70 90
Student-teacher ratio in primary schools
Iraq MENA LMI
17 to 1 23 to 1 19 to i
Female-to-male ratio in primary schools
Iraq MENA
.78 .94
LMI
.98
Returns to education (%) Each additional year of schooling raises average hourly wages by: 2.6 percent (Iraq), versus 6.0 percent (international average).
Government spending on education (%)
Education as share of total government budget Investment as a % of education budget Nonsalary as % of recurrent education budget
Iraq 6 2
11
MENA 18 6
19
Average out-of-pocket expenditure per household
Primary student Intermediate students Secondary students
Average monthly spending (ID 000)
8,000 14,300 25,500
Monthly expenditure as a share of PCE at the poverty line (%)
10 19 33
Sources: IHSES, World Bank, and World Development Indicators (2008: CD version). Note: To allow comparisons among varying educational systems, WDI categorizes education as primary, secondary, and tertiary. Iraqi intermediate school is classified as secondary whenever compared with other countries.
50
51
6. Education
PoorNonpoor
Female
Urban
Male Female Male
Syrian Arab Rep.
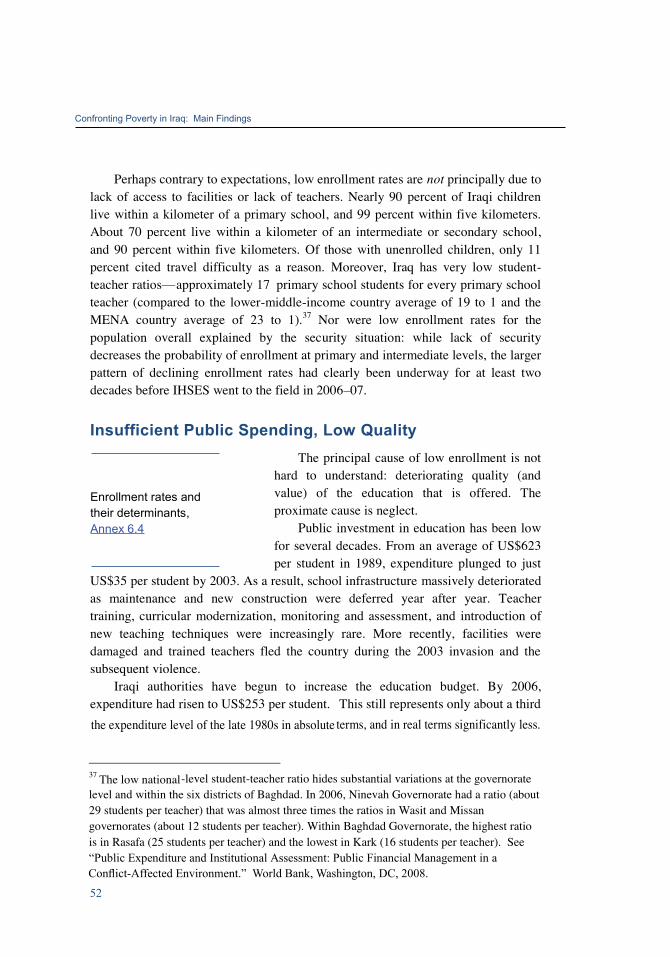
Figure 6.3. Intermediate School Enrollment Rates, by Gender and Urban/Rural Location (Percent)
Rural
as secondary school where comparisons are made with UNESCO or World Development Indicators data.
6. Education
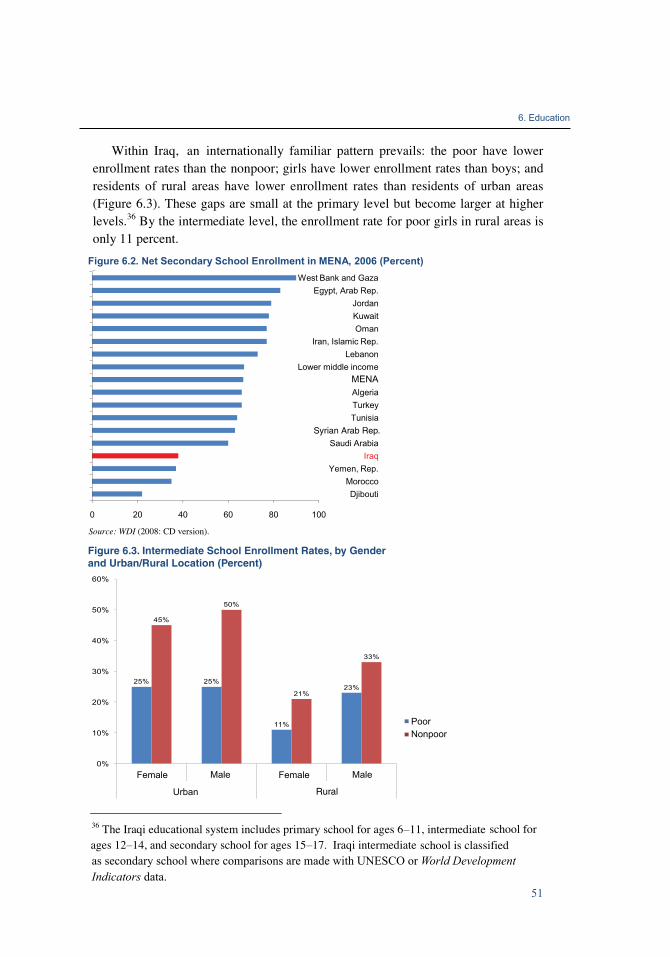
Within Iraq, an internationally familiar pattern prevails: the poor have lower enrollment rates than the nonpoor; girls have lower enrollment rates than boys; and residents of rural areas have lower enrollment rates than residents of urban areas (Figure 6.3). These gaps are small at the primary level but become larger at higher levels.36 By the intermediate level, the enrollment rate for poor girls in rural areas is only 11 percent.
Figure 6.2. Net Secondary School Enrollment in MENA, 2006 (Percent)
West Bank and Gaza Egypt, Arab Rep.
Jordan Kuwait Oman
Iran, Islamic Rep. Lebanon
Lower middle income MENA Algeria Turkey Tunisia
Syrian Arab Rep. Saudi Arabia
Iraq Yemen, Rep.
Morocco Djibouti
0 20 40 60 80 100
Source: WDI (2008: CD version).
Figure 6.3. Intermediate School Enrollment Rates, by Gender and Urban/Rural Location (Percent)
60%
40%
Female Male Female Male
Urban Rural
Poor Nonpoor
36 The Iraqi educational system includes primary school for ages 6-11, intermediate school for ages 12 14, and secondary school for ages 15 17. Iraqi intermediate school is classified as secondary school where comparisons are made with UNESCO or World Development Indicators data.
51
Confronting Poverty in Iraq: Main Findings
52
Conflict-Affected Environment.” World Bank, Washington, DC, 2008.
Perhaps contrary to expectations, low enrollment rates are not principally due to lack of access to facilities or lack of teachers. Nearly 90 percent of Iraqi children live within a kilometer of a primary school, and 99 percent within five kilometers. About 70 percent live within a kilometer of an intermediate or secondary school, and 90 percent within five kilometers. Of those with unenrolled children, only 11 percent cited travel difficulty as a reason. Moreover, Iraq has very low student-teacher ratios—approximately 17 primary school students for every primary school teacher (compared to the lower-middle-income country average of 19 to 1 and the MENA country average of 23 to l).37 Nor were low enrollment rates for the population overall explained by the security situation: while lack of security decreases the probability of enrollment at primary and intermediate levels, the larger pattern of declining enrollment rates had clearly been underway for at least two decades before IHSES went to the field in 2006^)7.
Insufficient Public Spending, Low Quality
The principal cause of low enrollment is not hard to understand: deteriorating quality (and
Enrollment rates and value) of the education that is offered. The their determinants, proximate cause is neglect. Annex 6.4 Public investment in education has been low
for several decades. From an average of US$623 per student in 1989, expenditure plunged to just
US$35 per student by 2003. As a result, school infrastructure massively deteriorated as maintenance and new construction were deferred year after year. Teacher training, curricular modernization, monitoring and assessment, and introduction of new teaching techniques were increasingly rare. More recently, facilities were damaged and trained teachers fled the country during the 2003 invasion and the subsequent violence.
Iraqi authorities have begun to increase the education budget. By 2006, expenditure had risen to US$253 per student. This still represents only about a third the expenditure level of the late 1980s in absolute terms, and in real terms significantly less.
37 The low national-level student-teacher ratio hides substantial variations at the governorate level and within the six districts of Baghdad. In 2006, Ninevah Governorate had a ratio (about 29 students per teacher) that was almost three times the ratios in Wasit and Missan governorates (about 12 students per teacher). Within Baghdad Governorate, the highest ratio is in Rasafa (25 students per teacher) and the lowest in Kark (16 students per teacher). See "Public Expenditure and Institutional Assessment: Public Financial Management in a Conflict-Affected Environment.” World Bank, Washington, DC, 2008.
52
53
6. Education6. Education
Despite the increased spending, the ratio of the education budget to the overall public budget . .
education, (6 percent) is still only about a third of the regional Annex 6 5 average (18percent).
Current spending is not well balanced with respect to teacher salaries, materials, and training, and to capital investment. Salaries in 2007 accounted for more than 90 percent of operational expenditure. The wage bill has risen substantially from both salary increases and the massive recruitment of new staff, which largely explains the relatively low student-teacher ratios. This does not, however, necessarily imply more and better teachers in the classroom, or adequate replacement of the very large number of teachers who fled or were displaced.
The low share of nonsalary recurrent expenditure by the Ministry of Education (5 percent of the educational operating budget) represents little more than half the average of other MENA countries. Investment in aspects of education other than salaries is extremely low as a share of spending. Spending on salaries at this level crowds out resources for inputs such as curricular materials and in-service teacher training needed to improve quality. Compounding matters, in 2006 only 14 percent of the nonsalary recurrent budget in education was spent and fully 88 percent of that amount went to security-related equipment and services.
Only 2 percent of the education budget was allocated to capital investment in 2006 quite low compared with other MENA countries, which on average allocate approximately 6 percent to capital improvements. There was a large jump in the capital investment budget in 2007. However, only a small portion of this was spent. Reflecting this ongoing underinvestment in education, about a third of Iraqi schools run double or even triple shifts. Facilities remain in poor condition, often lacking basic services such as electricity.
The low quality of the educational offering is evidenced by unusually low returns to education Estimating returns to (that is, increased earnings attributed to
main models and additional years of schooling). Holding other . . , . . J 6 / 6 robustness of tests,
factors constant, a wage earner's average hourly Annex 6 6 earnings increases at most3* 2.6 percent for each additional year of schooling. (Internationally, returns to education average around 6 percent. )
38 The term at most is used here because, if anything, the estimated 2.6 percent increase in salary attributed to one additional year of education overstates the return to education in Iraq since the methodology controls for experience, gender, sector of work, and location, but not for ability. Years of schooling are used as a proxy for ability. More direct measures for ability would almost certainly reduce the estimated coefficient for returns to education.
53
Confronting Poverty in Iraq: Main Findings
54
vs.
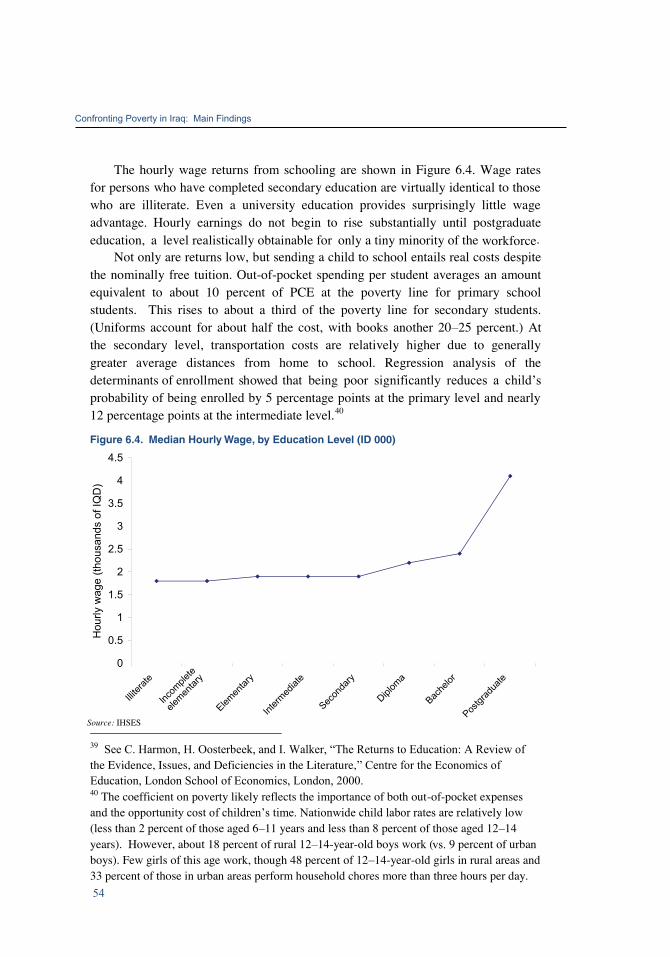
Figure 6.4. Median Hourly Wage, by Education Level (ID 000)
H
Education, London School of Economics, London, 2000.
Confronting Poverty in Iraq: Main Findings
The hourly wage returns from schooling are shown in Figure 6.4. Wage rates for persons who have completed secondary education are virtually identical to those who are illiterate. Even a university education provides surprisingly little wage advantage. Hourly earnings do not begin to rise substantially until postgraduate education, a level realistically obtainable for only a tiny minority of the workforce·
Not only are returns low, but sending a child to school entails real costs despite the nominally free tuition. Out-of-pocket spending per student averages an amount equivalent to about 10 percent of PCE at the poverty line for primary school students. This rises to about a third of the poverty line for secondary students. (Uniforms account for about half the cost, with books another 20 25 percent.) At the secondary level, transportation costs are relatively higher due to generally greater average distances from home to school. Regression analysis of the determinants of enrollment showed that being poor significantly reduces a child's probability of being enrolled by 5 percentage points at the primary level and nearly 12 percentage points at the intermediate level.40
Figure 6.4. Median Hourly Wage, by Education Level (ID 000)
4.5 Ί
Λ 4 Q S 3.5 «4— o -a °
| 2.5 o Ê 2 a> σ> | 1.5
o 1
0.5
#
Source: fflSES
f At <? «· S • < / <& /
£ Φα
See C. Harmon, H. Oosterbeek, and I. Walker, "The Returns to Education: A Review of the Evidence, Issues, and Deficiencies in the Literature," Centre for the Economics of Education, London School of Economics, London, 2000. 40 The coefficient on poverty likely reflects the importance of both out-of-pocket expenses and the opportunity cost of children's time. Nationwide child labor rates are relatively low (less than 2 percent of those aged 6 11 years and less than 8 percent of those aged 12 14 years). However, about 18 percent of rural 12 14-year-old boys work (vs. 9 percent of urban boys). Few girls of this age work, though 48 percent of 12 14-year-old girls in rural areas and 33 percent of those in urban areas perform household chores more than three hours per day. 54