Embed Size (px)
Citation preview

THE MACROECONOMICS
OF LABOR MARKET OUTCOMES
IN MENA OVER THE 1990s:
How Growth Has Failed To Keep Pace With A Burgeoning Labor Market
Jennifer Keller*Mustapha K. Nabli*
June, 2002
Jennifer Keller is an economist in the Middle East North Africa Region of the World Bank. Mustapha K. Nabli is Chief
Economist of the Middle East and North Africa Region of the World Bank. The authors are grateful to Sebastien Dessus,
Dipak Dasgupta, and Marie-Ange Veganzones for their comments and suggestions. Views expressed here do not
necessarily reflect those of the World Bank, its executive directors, or the countries they represent.

The Macroeconomics Of Labor Market Outcomes In MENA Over The 1990s:
How Growth Has Failed To Keep Pace With A Burgeoning Labor Market
Introduction
Perhaps the greatest single issue facing the economies of the Middle East and North Africa1 is the challenge of employing its people in good jobs. While the region is heterogeneous in terms of developments in the labor market, the majority of the region has been characterized by high levels of unemployment, and in some cases by declining real wages, as well. The problem of job creation for the MENA region is staggering. Some 47 million jobs need to be created over the next 10 years just to keep pace with new entrants to the job market.2 Close to 6.5 million additional jobs would be needed to reduce the regional unemployment rate3 by one half. The implication is that the current employed workforce would have to expand by close to 60% over the next ten years (see Annex Table 1). Such an accomplishment was not even achieved by the high performing East Asian economies4
during the height of their employment growth periods.
Unemployment rates in the region are among the highest in the world, averaging 20% of the labor force for economies outside the oil producing economies of the Gulf. Unemployment among the young5 is even more prevalent, averaging more than twice the national averages. Such severe unemployment, particularly among these first-time job seekers, has potentially large implications on the society. Indeed, of recent months, the role that social inclusion (including economic inclusion) plays in preventing social conflict has been of immense interest.
But unemployment also implies a substantial loss of human capital to the economy. The MENA region has made considerable progress over the last decades in increasing access to basic education. The educational attainment of the adult population in MENA has increased over 180% over the last three decades, higher than any other region of the world.
1 The countries of the Middle East and North Africa region included in this analysis (depending upon data availability) are: Morocco, Algeria, Libya, Tunisia, Egypt, Jordan, Lebanon, Syria, Iran, Iraq, Yemen, Bahrain, Kuwait, Oman, Qatar, Saudi Arabia, the West Bank and Gaza, and the United Arab Emirates.
2 These numbers are based on assumptions on labor force growth rates from the International Labour Organisation. The labor force growth rates are, in part, based upon assumptions about changes to labor force participation rates, which differ from country to country. Without a detailed analysis of these underlying assumptions, we have accepted the ILO’s labor force projections at face value, but the assumptions are clearly important in determining the extent of the labor market challenge over the next decade. The demand for jobs may be even higher under more realistic assumptions given the social transformations, and possible significant increase in labor force participation by women in view of the gains in education levels.
3 While comparability issues (in terms of defining the labor force and the unemployed) prevent a true calculation of the regional unemployment rate, a rough approximation of 18.7% has been estimated, based on the latest available unemployment rate estimates from country and other sources. In Annex Table 1, the implication of reducing the regional unemployment rate to 9.3% (in terms of the number of new jobs which would need to be created) is shown.
4 Hong Kong; Indonesia; Japan; Korea; Malaysia; Singapore; Taiwan, China; and Thailand.
5 Under age 25.
1

But precisely at the time when human capital achievements should be having their greatest pay-off, in terms of economic growth, a considerable portion of these resources are left idle.
Much of the story behind the MENA region’s lost decade of growth, and the consequences on the labor market, are understood. Declining oil prices had a major impact on the region, both for the oil exporting nations and for much of the region through the impact on remittances and external financial flows. Additionally, the region was marked by macroeconomic instability and structural inefficiencies which prevented the emergence of a strong private sector. At least half of the MENA economies suffered from some degree of macroeconomic instability during the 1985-1995 period. Public sector ownership was extensive, yet while large investments were taking place with the oil windfalls, there were few policies in place to make these investments competitive. Trade regimes were protective. Regulation limited the entry of the private sector into most sectors. Financial sectors were geared to serving public enterprises, and institutions were not in place to facilitate a vibrant private sector. As a consequence, when oil prices collapsed, the engine for growth in the economies of MENA stalled, and there was limited ability to absorb the burgeoning labor force.
What is of greater concern in MENA is that despite macroeconomic stabilization and at least some structural reform undertaken throughout most of the region, economic recovery has remained elusive. GDP per capita growth over the region averaged only 1.5% a year over the 1990s, higher than in the 1980s (less than 0.1% a year), but hardly the rebound one would have desired following a decade of stagnation. Outside the Gulf economies, growth has been somewhat healthier, averaging 1.8% per year, but less than robust. After almost 2 decades of poor or lackluster economic performance, the MENA region now faces unemployment rates that are higher than in every other region in the world (with the exception, perhaps, of Sub-Saharan Africa6). Improving labor market opportunities has become among the highest priorities for policy makers in the region.
In this paper, we analyze the major labor market trends that have developed in the MENA region over the 1990s. We then examine the failure of growth to materialize following widespread structural reform throughout the region. By decomposing growth over the 1990s between factor accumulation and productivity growth, we find that productivity growth has improved for the majority of countries in the region over the 1990s, with an average increase of TFP growth of 1.3% per year over the 1980s. At the same time, despite these positive improvements in productivity in MENA, economic growth has remained anemic (with average growth GDP per laborer over the 1990s virtually unchanged from the 1980s), in great part because of the collapse in investment that has occurred in virtually every economy in the region.
We then offer some reasons why private sector investment has not materialized as dynamically as hoped despite widespread macroeconomic and structural policy reforms instituted throughout the region in the early part of the decade. Despite the region’s achievements over the 1990s in terms of macroeconomic stabilization and policy reform, MENA’s progress with structural reform has been incomplete. Financial sectors remain 6 Reliable unemployment rate figures for Sub-Saharan Africa are only available for a handful of economies. For many countries in which such figures are not available, however, the suspected degree of unemployment is high.
2

weak. Trade liberalization remains incomplete, with continuing high protection levels. Public ownership remains high. And, the regulatory framework and supportive institutions for private sector investment have not materialized.
Finally, we offer policy recommendations for improving labor market oucomes. Pushing forward with more complex and politically challenging “second generation” reforms may be mandatory if the region is ever to ensure the higher and sustainable economic growth that is needed to ensure better labor market prospects in the region.
The Disappointing Labor Market Outcomes In MENA
The lack of employment opportunities in the region
According to official statistics available, MENA’s unemployment rates are the highest in the world, although anecdotal evidence would suggest even more widespread
unemployment in Sub-Saharan Africa. Excluding the GCC economies, the average national unemployment rate in MENA is almost 20% of the labor force7. The unemployment problem is most severe in Iraq , with an estimated 50% of the work force unemployed. In West Bank and Gaza, estimates of unemployment in 2001 were close to 40%, but
the events of recent months in 2002 have without question resulted in even higher levels of unemployment. And in a number of other countries in the region, such as Iran, Algeria, Libya, and Yemen, as much as a third of the potential workforce is unemployed.
A caveat in comparing unemployment rates across economies must be offered. Because of differences in the way in which employment and labor force are defined across
7 Within the GCC, the proportion is much lower (9%), but still moderately high in both Oman and Bahrain.
3
F ig u r e 1 : U n e m p lo y m e n t , 2 0 0 1 *
0 %
5 %
1 0 %
1 5 %
2 0 %
2 5 %
3 0 %
M E N A M E N A E a s t E u r o p e L a t i n H i g h S o u t h S u b -M a g h r e b G C C A s ia & & C e n t r a l A m e r ic a / I n c o m e A s ia S a h a r a n
a n d M a s h r e k P a c i f i c A s ia C a r ib b e a n O E C D A f r i c a* O r m o s t r e c e n t y e a r a v a i la b l e . N o te : R e g io n a l u n e m p lo y m e n t r a te s w e i g h te d b y la b o r f o r c e . S o u r c e s : S e e A n n e x T a b le 1 f o r d e t a i le d d e s c r i p t io n o f s o u r c e s .
5 0 % - -
4 0 % - -
3 0 % - - A lg e r ia /L ib y a /Y e m e n
W e s t B a n k a n d G a z a
I r a q
S y r i a
L e b a n o n / M o r o c c oI r a n /T u n is i a
J o r d a n
E g y p t O m a n / S a u d i A r a b iaU n it e d A r a b E m ir a t e s
B a h r a in
K u w a it
U n e m p l o y m e n t r a t e , la t e s t a v a i l a b le y e a r

countries (or even between different sources within a country) a comparison of unemployment rates is difficult. For example, those who are unemployed but are between the ages of 15-17, or age 60 and above, are not included in Tunisia’s official unemployment figures. At the same time, the Tunisians count the set of inactive people (mostly housewives) as unemployed, although these people would not be counted as unemployed in most other countries8. Even with comparable definitions for unemployment, there is also the possibility of underestimation of unemployment rates in economies where labor market opportunities are poor. Labor force participation is often greatly affected by market opportunities, with individuals tending to withdraw from the labor market when opportunities for employment are poor. As a result, labor force estimates are often downwardly biased in precisely those economies where labor market opportunities are the poorest.
Unemployment most likely worsened throughout the 1990s, contributing to the high unemployment rates currently observed. Table 1 compares labor force growth to employment growth over the 1990s. Because of discouraged workers leaving the labor force, it is not always possible to interpret employment growth outpacing labor force growth as necessarily a reduction in “unemployment.” However, when the labor force growth exceeds the growth of employment, it is indicative of worsening unemployment. From that table, the rate of growth of the labor force exceeded the rate of growth of employment in Algeria, Iran, Jordan, Morocco, and Yemen, which together account for approximately 50% of the entire region’s labor force, and in which current unemployment rates now average 21%. In Tunisia and Egypt, where the rate of unemployment was already moderately high, the rate of growth of employment remained about on par with the rate of growth of the labor force. For the Gulf countries for which we have employment information, we find that only in Bahrain, Kuwait, and Oman did employment growth outpace labor force growth.
Table 1: Labor Force Growth versus Employment Growth over the 1990s
Labor Force Unemployment as % of
Labor Force Employment (%,latest year total MENACountry Growth (%) Growth (%) Time Period available) labor force*
Algeria 4.0 3.2 1989-1997 28.7 10.7Iran 2.7 1.9 1992-2000 16.2 20.1Morocco 2.6 2.2 1990-1999 17.8 11.6Yemen 3.8 3.3 1994-1998 30.0 5.7Jordan 3.7 3.5 1996-2000 13.7 1.5
Egypt 2.7 2.7 1988-1998 9.4 24.4Tunisia 2.9 3.0 1989-1997 15.9 3.9
Bahrain 3.2 4.3 1987-1994 5.0 0.3Kuwait 6.4 7.9 1994-1997 1.3 0.8Oman 3.6 5.1 1991-1997 10.0 0.7
* Including Lebanon, Libya, Iraq, and the other GCC economies, for which employment data is unavailable.
Worker productivity – which, over the long term, forms the basis for increases in real wages -- has generally increased throughout MENA, but remains low by international 8 See Rama, 1998.
4

standards. Over the 1990s, the growth of GDP per worker was lower in the MENA region than in any other region of the world, averaging only 0.8% a year. Productivity actually declined over the 1990s in Algeria, Kuwait and Oman.
Table 2: Employment, worker productivity and growth in MENA during the 1990s (%)
GDP Employment Productivity EmploymentCountry Growth Growth Growth Elasticity Period
Algeria 0.9 3.2 -2.2 3.6 1989-1997Egypt 4.4 2.7 1.6 0.6 1988-1998Iran 3.1 1.9 1.1 0.6 1992-2000Morocco 3.3 2.7 1.1 0.8 1993-1999Tunisia 5.0 3.0 1.9 0.6 1989-1997Bahrain 5.9 4.3 1.5 0.7 1987-1994Kuwait 7.5 8.3 -0.7 1.1 1992-1997Oman 4.6 5.1 -0.4 1.1 1991-1997
MENA 3.4 2.6 0.8 1.1
Sources: Employment information from country sources. GDP growth figures from WDI.
Understanding the Poor Labor Market Outcomes in MENA
Under almost any comparison, MENA's labor market outcomes have been disappointing. Why aren't enough jobs being created? Why are resources sitting idle? Why are those laborers who do find jobs unable to watch their wages grow?
The simplest answer is that economic growth has been insufficient, given the region’s labor force growth. Labor force growth in MENA is exceptional, the result of both rapid population growth and increasing rates of labor market participation (particularly for females). At an average rate of growth of 3% a year, MENA’s labor force is growing at a higher rate than in any other region of the world.
At the same time, this labor force growth has barely been matched by economic growth. High labor force growth, of course, need not be an automatic recipe for poor labor outcomes. It could very easily contribute to high GDP growth, as was the case in East Asia during their high growth years. But, in MENA, high labor force growth rates have been accompanied by only marginal growth of real output. In Table 3, labor force growth rates and real GDP growth rates between East Asia in the 1970s are compared with labor force growth rates and real GDP growth rates of MENA economies in the 1990s. There is little
5

difference between the two regions’ labor force growth -- both were exceptionally high (3.0% in MENA, versus 3.1% in East Asia).
Table 3: Labor Force Growth and Real GDP GrowthMENA 1990s versus East Asia in the 1970s (%)
Average Yearly Average Average Yearly Labor Force Yearly GDP Growth of Output
MENA 1990s Growth Growth Per LaborerAlgeria 3.8 1.9 -1.9Egypt 2.9 4.4 1.5Iran 2.3 4.1 1.8Jordan 5.7 5.1 -0.6Lebanon 3.0 7.1 4.0Morocco 2.5 2.1 -0.4Syria 4.3 5.3 1.0Tunisia 2.9 4.8 1.8Yemen 4.5 3.3 -1.1Bahrain 3.3 4.1 0.9Oman 3.4 4.5 1.1Saudi Arabia 2.5 2.1 -0.3UAE 4.7 2.0 -2.6
MENA 3.0 3.6 0.6 GCC 2.9 2.3 -0.5 Maghreb 3.0 2.4 -0.6 Others 3.0 4.4 1.3
East Asia 1970s 3.1 7.6 4.4Philippines 3.0 5.9 2.8Hong Kong 4.2 9.3 4.9Indonesia 2.7 7.9 5.1Korea 3.2 7.6 4.3Malaysia 3.6 7.8 4.1Singapore 4.4 9.0 4.4Thailand 3.5 6.9 3.3
Period of analysis for MENA region 1990-1999, with exception of Kuwait (1993-1999). GDP growth figures in Table 2 are based on different periods of analysis, based on the availability of employment growth data (generally, much less readily available). As a result, GDP growth rates differ – at times significantly -- from those in Table 2. Period of analysis for E. Asia 1970-1980. Sources: World Development Indicators, country sources.
The real difference between the regions, of course, is that East Asia’s labor force growth was accompanied by enormous increases in real output, not witnessed in the MENA economies. Real GDP growth in East Asia averaged 7.6% a year between 1970-1980 – more
6

than double its labor force growth rate for the same period. In MENA, in comparison, economic growth during the 1990s has only averaged about 3.6% a year – only marginally higher than the growth rate of its labor force, and implying virtual stagnation in productivity per potential laborer for the region as a whole.
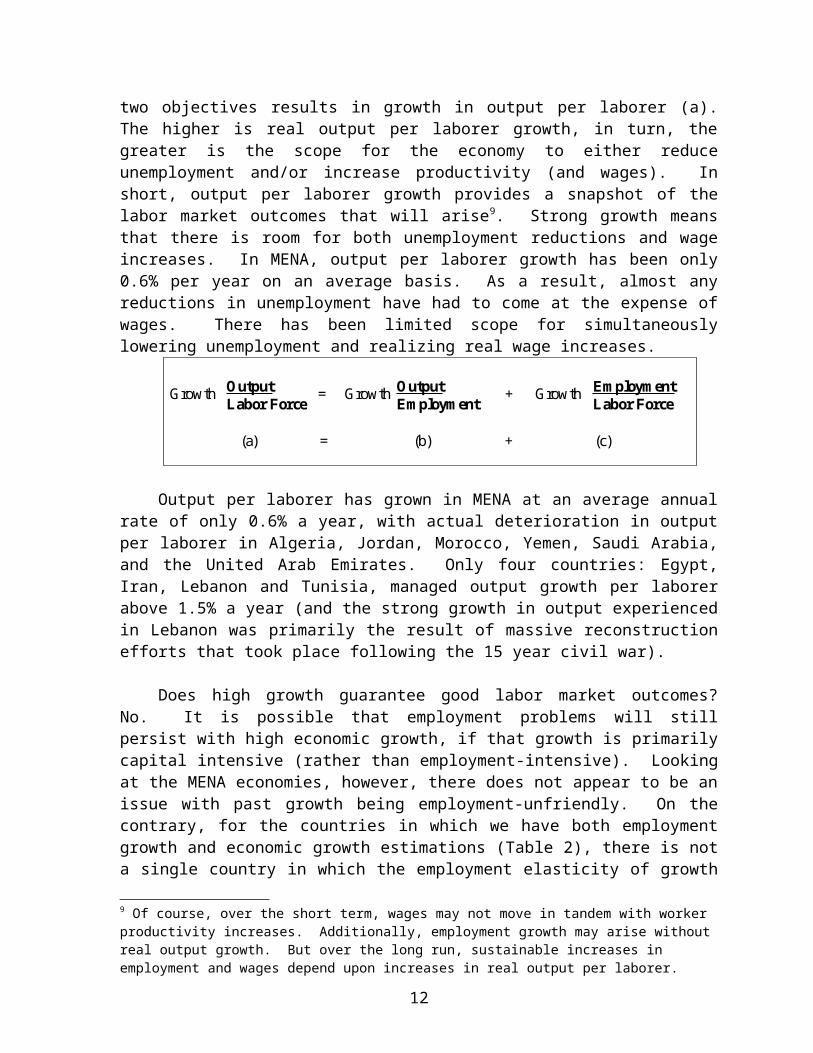
To better understand the importance of the growth of output per laborer in improving labor market outcomes, we can refer to the simple accounting framework below. Creating employment for those who want to work is equivalent to increasing the ratio of employed persons to the total labor force (c). Increasing productivity (the basis for wage growth, at least over the long term) is equivalent to increasing output per employed person (b). The sum of these two objectives results in growth in output per laborer (a). The higher is real output per laborer growth, in turn, the greater is the scope for the economy to either reduce unemployment and/or increase productivity (and wages). In short, output per laborer growth provides a snapshot of the labor market outcomes that will arise9. Strong growth means that there is room for both unemployment reductions and wage increases. In MENA, output per laborer growth has been only 0.6% per year on an average basis. As a result, almost any reductions in unemployment have had to come at the expense of wages. There has been limited scope for simultaneously lowering unemployment and realizing real wage increases.
Output per laborer has grown in MENA at an average annual rate of only 0.6% a year, with actual deterioration in output per laborer in Algeria, Jordan, Morocco, Yemen, Saudi Arabia, and the United Arab Emirates. Only four countries: Egypt, Iran, Lebanon and Tunisia, managed output growth per laborer above 1.5% a year (and the strong growth in output experienced in Lebanon was primarily the result of massive reconstruction efforts that took place following the 15 year civil war).
Does high growth guarantee good labor market outcomes? No. It is possible that employment problems will still persist with high economic growth, if that growth is primarily capital intensive (rather than employment-intensive). Looking at the MENA economies, however, there does not appear to be an issue with past growth being employment-unfriendly. On the contrary, for the countries in which we have both employment growth and economic growth estimations (Table 2), there is not a single country in which the employment elasticity of growth is below 0.6. As a comparison, during the height of their employment creation in the high performing East Asian economies, the employment elasticity of growth rarely exceeded 0.6. The elasticity of employment with respect to growth for the MENA region, in fact, has averaged above 1 – implying that any percentage change in economic output was accompanied by a higher percentage change in total employment (clearly, unsustainable in the long run). The intense nature with which growth has led to employment (or more accurately, with which employment has expanded strongly 9 Of course, over the short term, wages may not move in tandem with worker productivity increases. Additionally, employment growth may arise without real output growth. But over the long run, sustainable increases in employment and wages depend upon increases in real output per laborer.
7
Output Output Employment Labor Force Employment Labor Force
Growth = Growth + Growth
(a) = (b) + (c)

despite low levels of growth) is a reflection of the nature of employment creation in the region, where public sector employment has been used to refuge large portions of the labor force. While this type of employment creation is unlikely to be sustainable over the longer term (and employment will inevitably have to emerge from the private sector), there is still little evidence that the MENA region’s growth has a poor employment generating capacity.
But more importantly, what is clear is that employment cannot emerge without growth. High employment growth cannot coexist over a sustainable period with low levels of economic growth. Paramount to improving the region’s labor market outcomes, then, is improving the region’s growth prospects.
In the end, policy makers should have two basic goals for what happens in labor markets: (1) that those who want to work can find work, and (2) that wages increase. In MENA, lack of growth of output per laborer has prevented both goals from transpiring simultaneously in the majority of countries. If one goal has been achieved (such as a reduction in unemployment), it has had to come at the expense of the other (real wage loss).
The story of employment outcomes in MENA is clear from an arithmetic standpoint: output growth has been insufficient. With output growth just keeping pace with growth in the labor force, it is impossible to achieve simultaneous objectives of growth in wages and reduction in unemployment. Within MENA, that tradeoff is apparent – the region has, as a whole, experienced slight or no reductions in unemployment rates over the last decade, but output per worker declined as well. If the region wants to achieve both higher employment growth and higher wages, much higher output growth will be required. It is well-established and backed by a wealth of empirical evidence that rapid output growth brings with it rapid growth in employment. Periods of buoyant GDP expansion are almost invariably associated with rising job numbers while, conversely, slow-downs bring growing unemployment10.
What Explains MENA’s Poor Growth Performance ?
Over the last decade, MENA countries took a number of steps to overcome the macroeconomic imbalances and structural impediments that prevailed throughout the 1980s. Starting in the late 1980s, several countries in the region – Morocco and Tunisia, and soon after, Jordan and Egypt, embarked on extensive programs of macroeconomic stabilization and policy reform. By the 1990s, nearly all of the non-GCC countries in the region followed suit, as did several of the Gulf economies. While there has been considerable variance among economies in terms of both the speed and depth of these reforms, the overall change in policy throughout the region would seem to be a significant step forward in creating an environment in which the private sector could emerge and become an engine for higher and sustainable growth. Despite this, strong growth failed to emerge.
In order to understand why, we have examined the region’s economic growth in a growth accounting framework, in which economic growth occurs as the result of factor accumulation (either physical or human) and increases in total factor productivity (see Annex 2 for methodology and description of the data).
10 Boltho and Glyn, 1995.
8

TFP growth is something of a mixed bag. It is the residual of what cannot be explained by investments if we assume those investments (both physical and human) earn a reasonable rate of return. TFP growth is often thought of as “technical progress”, but in fact, as the residual of a growth accounting estimation, it not only embodies the differences across countries in their progress in the adoption of better technology, but also reflects a host of non-technological differences, including changes in the utilization of both capital and labor, changes in schooling quality, and changes in the overall efficiency with which factors are allocated in the production process. Our interest is to explore how MENA’s overall growth has improved or deteriorated since it began its structural reform process, to better understand what has prevented the region from achieving the rates of growth needed to improve its labor market outcomes.
In the MENA region accumulation and productivity have often gone in opposite directions, such as during the period of massive public sector investments. Examining growth alone will mask these very different effects, and the somewhat anemic growth that has characterized the region since reform may be more a reflection of significantly lower investments than of continuing poor productivity performance.
In Table 4, estimates of total factor productivity growth over the 1960-1999 period are presented by region and decade. TFP growth has been calculated as the simple residual between output growth and the growth of factor inputs (capital, and labor), assuming those factors earn a reasonable rate of return11. Much as expected, the MENA region exhibited a pattern of high TFP growth in the 1960s, declining dramatically over the 1970s and continuing throughout the 1980s12. To understand these developments, however, requires a more detailed look at growth, accumulation and productivity.
11 In our case, the elasticity of output with respect to capital is exogenously assumed to be 0.4, which is based upon both international evidence, as well as our own estimations.
12 See Bosworth, Collins and Chen (1995) for similar findings.
9

Table 4
GDP per capita growth and growth of accumulation and productivity by region1960-1990 (%)
Growth of Growth of Growth ofGDP Physical capital Human capital
Region Decade per laborer per laborer per laborer TFP Growth
Sub-Saharan Africa 1960s 1.8 3.8 0.4 0.11970s 0.6 4.2 0.3 -1.31980s -0.9 -0.1 0.7 -1.31990s 0.3 0.0 0.5 0.0
East Asia & Pacific 1960s 2.1 1.1 0.8 1.21970s 3.3 5.3 0.9 0.71980s 5.6 6.7 1.0 2.31990s 7.5 7.8 0.6 4.0
Latin America/Caribb. 1960s 2.9 3.1 0.6 1.31970s 2.9 4.3 0.6 0.81980s -1.7 0.2 0.9 -2.41990s 0.6 0.6 0.8 -0.1
High Income/OECD 1960s 4.4 5.8 0.5 1.71970s 1.8 3.6 1.4 -0.41980s 1.8 2.3 0.3 0.71990s 1.3 2.2 0.5 0.1
South Asia 1960s 2.2 4.0 0.6 0.21970s 0.6 1.9 1.0 -0.71980s 3.6 2.7 0.9 2.01990s 2.9 2.1 0.8 1.6
MENA 1960s 4.6 4.9 0.5 2.41970s 2.6 7.9 1.5 -1.41980s 0.4 2.1 1.4 -1.31990s 0.7 -0.3 1.2 0.0
World 1960s 2.7 3.2 0.6 1.11970s 2.2 4.1 1.0 0.01980s 3.2 3.8 0.8 1.21990s 4.0 4.1 0.7 2.0
Note: Regional averages are constructed as the weighted average of country estimates of GDP per laborer growth, factor accumulation per laborer, and TFP growth, weighted by mid-period labor force.
In the 1960s, MENA’s economic growth performance was the highest in the world, averaging 6.7% per year (4.6% per year per laborer). Beginning in the 1960s, the region began a two-decade period of massive public investment in infrastructure, health and education, which in this early period of development was able to translate into high growth. In addition to high levels of accumulation spurring growth, TFP growth over the 1960s was also high, with large-scale public investments in critical infrastructure generating a significant growth response.
10

This is not to say that all of the investments undertaken during the 1960s were exceptionally productive. Along with investments in large infrastructure projects, the regional also invested heavily into protected state industries. But in the 1960s, even the region’s overall strategy of industrial and agricultural protectionism, supported by trade barriers and encouraged by publicly subsidized energy, water, and agrochemicals, was initially successful, as it allowed the region to utilize underused capacities and provide the early boost of industrialization.
In the 1970s, going by growth figures alone, MENA was still in the middle of a growth “heyday”, with GDP growth averaging 5.7 percent a year. But the underlying conditions spurring growth in the 1970s represent a serious and negative departure from the previous decade of high growth and productivity. To begin, the 1970s were marked by an increase in the rate of physical capital accumulation per laborer of more than 60%, and an almost doubling of the rate of human capital accumulation per laborer. Over the 1970s, the MENA region realized the highest rates of growth of both physical capital per laborer and human capital per laborer. Despite this immense increase in accumulation, on a per laborer basis, growth actually declined, on average by close to 2 percentage points a year. Thus, the 1970s represented two large and yet conflicting growth dynamics for the region, where investments were being undertaken in record levels (all things equal, increasing the region’s growth potential) at the same time that these investments were having increasingly poor payoffs, in terms of growth.
11
F igure 2: G row th of output versus grow th of factor inputs per l aborer1960s versus 1970s
-6
-4
-2
0
2
4
6
8
F a c t o r A c c u m u la t io n T F P
G row th of G D P , factor inputs per lab orer (% )
1960s 1970s
Source : W orld B ank staff estim a tes .
A fricaE ast A siaand thePacific
L atinA m ericaand theC arib bean
H ighIncom e/O E C D
SouthA sia
G C C
M ahgreb
O thers
M E N A
While MENA’s investments in needed infrastructure during the 1960s generated a significant pay-off in terms of a growth response, by the 1970s, the public sector’s sphere of comparative advantage in investment began to shrink, and the limits of the MENA region’s strategy of protection of both public and private industries began to be realized.
The pattern of higher levels of accumulation partnered with declining productivity characterized many of the economies within the region. Egypt almost doubled its rate of physical capital accumulation, and more than doubled its rate of human capital accumulation, but TFP growth declined by about a quarter. Morocco and Algeria also doubled their rate of accumulation, but TFP growth went from high and positive (4.6% in Morocco, 1.4% in Algeria), to negative rates. And in the Gulf, Saudi Arabia’s 4-fold increase in physical capital accumulation (and 15% increase in human capital accumulation) was accompanied by a decline in per laborer GDP of about 34%.
But by the 1980s, as international oil prices slumped in the wake of global overproduction, these economic gains became unsustainable and the region’s countries witnessed slow or even negative per laborer growth rates. With eroding macroeconomic balances and growing debt burdens, and despite both heavy external assistance (which permitted spending for several more years) and a strong social contract (which hindered the government’s abilities to retract from commitments), investments declined dramatically, with the rate of growth of the physical capital stock per laborer cut by almost three quarters from the prior decade.
12
F igure 3: G row th of output versus grow th of factor inputs per l aborer1960s versus 1970s: M iddle E ast and N orth A frica R egion
-8
-6
-4
-2
0
2
4
6
8
1 0
F a c t o r A c c u m u la t io n T F P
G row th of G D P , factor inputs per lab orer (% )
1960s 1970s
Source: W orld B ank staff estim ates.N ote: T he to tal bar height rep resents G D P per labore r grow th on ly w hen both facto r accum ulation and T FP g row th arepositive . If T FP grow th is negative (but fac to r accum ulation po sitive), fo r exam ple , the bar heigh t representsonly facto r accum ulation .
T unisia E gy pt M orocco A lg eria Syria
Iran
SaudiA rabia

This decline in accumulation was almost without exception, with every country in the region but Kuwait experiencing a dramatic decline in accumulation between the 1970s and 1980s, and almost every economy experiencing a likewise decline in TFP. Only Iran and Oman saw actual improvements in total factor productivity between the 1970s and 1980s. Negative productivity growth was most prevalent in the oil-producing economies of the region – both within the GCC economies as well as Algeria. Because our TFP estimates are a reflection of factor efficiency, the degree to which capital is underutilized will be heavily reflected in the ensuing TFP growth measurements. This feature is of particular importance for these economies, since as oil prices collapsed in the 1980s, there was a significant effort on the part of oil-producers to prop up oil prices by holding down production. Nevertheless, even in the non-oil producing economies, there were widespread declines in productivity for almost every country. With both massive declines in accumulation and corresponding declines in TFP for most countries, the MENA region experienced a collapse of economic growth per laborer.
By the late 1980s, the ‘lost decade of growth’ prompted a handful of countries in the region – Morocco and Tunisia, and soon after, Jordan, to embark on programs of macroeconomic stabilization and policy reform. By the 1990s, nearly all of the non-GCC countries in the region followed suit, as did several of the Gulf economies. The reasoning, of course, was to create an environment in which the private sector could emerge and become an engine for higher and sustainable economic growth, crucial for employment creation.
13
F igure 4: G row th of output versus grow th of factor inputs per l aborer1970s versus 1980s: M iddle E ast and N orth A frica R egion
-8
-6
-4
-2
0
2
4
6
8
1 0
F a c to r A c c u m u la t io n T F P
G row th of G D P , factor inp u ts per lab orer (% )
1970s 1980s
Source: W orld B ank staff estim ates.
IranSaudiA rabia
T un isia E gy pt M orocco
JordanA lgeria Syria
K uw ait
O m an

How has the region fared in the 1990s? To understand the developments over the decade, we again turn to a growth decomposition. In Table 5 below, we present the MENA region’s changes to accumulation, productivity and growth over the decade. For clarity, the table does not present GDP and TFP growth over the 1990s, but rather the change in average GDP, factor, and TFP growth between the 1980s and 1990s (thus if an economy moved from an average GDP per laborer growth of 2% a year in the 1980s, to 5% a year over the 1990s, the change in GDP growth per laborer over the decade is 3%).
The countries are presented in order of the change to their average TFP growth per laborer between the 1980s and 1990s. At the top of the list of improved productivity growth is Syria, which in the 1990s benefited from both increased oil production and agricultural performance, an aid windfall during the Gulf war (which allowed it to undertake key growth-enhancing infrastructure investments, such as the purchase of power stations and a telephone network), as well as some limited liberalization reforms. And three of the four countries13 we would term the ‘early reformers’ (specifically, Jordan, Tunisia and Egypt) also experienced improvements in their average TFP growth between the 1980s and 1990s.
Table 5Change in MENA’s growth and TFP growth between 1980s and 1990s (%)
Change in Change in physical Change in humanAverage GDP capital accumulation capital accumulation Change in
Country growth per laborer per laborer per laborer TFP growth
Syria 2.54 -3.06 -0.80 4.24Jordan 1.07 -6.27 -0.71 4.00Saudi Arabia 5.69 5.20 -0.27 3.77Kuwait 9.11 7.64 6.47 2.17Egypt -0.99 -5.65 -0.66 1.67Tunisia 0.84 -1.45 0.09 1.37Iran 0.88 -0.57 0.23 0.97Algeria -0.92 -3.80 -0.46 0.88Morocco -1.23 -1.35 0.12 -0.77Oman -4.10 -3.33 0.52 -3.08
Overall, TFP growth in the region actually improved in all but two economies (Morocco and Oman). At the same time, however, due to large declines in accumulation within most of MENA (particularly accumulation of physical capital), the improvements in factor allocation and efficiency have not translated into significant increases in GDP growth.
What are the implications of this exercise? The message that emerges in terms of the region’s failure to improve its labor market outcomes is that improving the region’s labor market outcomes must come from substantial increases in investment. Improving employment creation in the region can either come from only two sources: enhancing the employment-creation-capacity of growth (the employment elasticity), or from higher economic growth itself.
13 Jordan, Morocco, Tunisia and Egypt, which all embarked upon structural reform programs from the mid 1980s to early 1990s.
14

Let’s consider the first notion, that improving labor market outcomes could be achieved through increasing the employment intensity of growth. Employment elasticities reflect the percent change in employment that are associated with some percent change in real output. International evidence would suggest that the long-run elasticity of output with respect to employment falls somewhere between 0.4 and 0.8. In countries which are highly capital intensive, the employment elasticity is likely to be closer to 0.4, while in labor-intensive production structures, the employment elasticity is likely to be closer to 0.8. In our estimates, we assume an employment elasticity of 0.7, which is relatively healthy, by international standards, and is unlikely to be improved. In Table 6, we estimate the level of output growth necessary to create sufficient jobs to fully absorb the growing labor force, given relatively high rates of employment creation14.We then compare that GDP growth rate with the observed growth rate over the 1990s. The difference reflects how the gap between needed growth and observed growth.
In three cases (Egypt, Iran, and Tunisia) the rates of growth which were observed were sufficient, under optimistic employment generation assumptions, to create the levels of employment to meet the growth of the labor force, without any increases in either productivity or capital accumulation. For most of the other countries in the region, however, the needed increases in output growth in order to reach growth levels consistent with the desired rates of employment growth are substantial: in Jordan, output would have needed to grow by 3 percentage points a year; in Algeria, by almost 4 percentage points a year; and in Kuwait, by more than 5 percentage points a year. In Saudi Arabia, economic growth would have needed to grow by more than 2 percentage points a year than what was observed to be consistent with the desired employment creation levels.
Table 6: GDP growth consistent with desired employment creation rates1990-1999 (%)
Needed GDP growth employment consistent Observed Gap growth (=labor with employment GDP in
Country force growth) growth growth GDP growthAlgeria 3.8 5.5 1.5 4.0 Egypt 2.9 4.2 4.3 Iran 2.3 3.3 4.0 Jordan 5.8 8.3 5.2 3.1Kuwait 5.1 7.3 2.1 5.3Morocco 2.5 3.5 2.2 1.3 Oman 3.7 5.3 4.7 0.6 Saudi Arabia 3.1 4.4 2.1 2.3Syria 4.3 6.1 5.9 0.2 Tunisia 2.9 4.1 4.8
14 Of course, the process is circular: just as employment creates output growth, output growth in some sense “creates” employment, in that in order to sustain that level of output growth, it requires continuing increases in employment. Thus, rather than thinking of growth generating employment, we can think of certain levels of output growth consistent with a given level of sustainable employment creation.
15

Thus, even with employment-intensive growth, the level of economic growth itself has prevented the employment creation rates needed to absorb the growing labor force. The remaining potential for improving employment creation in the region, then, is higher economic growth. We have seen, throughout the 1990s, a substantial improvement in the region’s productivity growth. While there is always potential for even greater productivity improvements, there are also limits to what can be achieved. With economic growth so substantially below what would be needed to be consistent with full labor absorption, the considerable improvement in economic growth rates must come from primarily from substantial increases in investment.
Over the 1990s, however, almost every economy in MENA experienced an actual decline in the amount of physical capital per laborer, and the region went from increasing its physical capital per laborer by 2.1% a year in the 1980s to experiencing actual declines in physical capital per laborer of 0.3% a year in the 1990s (Table 4). MENA stands at the bottom in terms of physical capital accumulation during this period.
Interpreting the Decline in Investment
It is difficult to definitively interpret the substantial declines in accumulation throughout the 1990s, without reliable investment data broken down between the public and private sectors. Public sector investments have almost certainly dropped off. So, in the midst of an overall factor accumulation deterioration, it is possible that private sector factor accumulation is actually improving, but not sufficiently to counter-act the large declines in public investment.
However, it is also possible that while productivity and factor allocation efficiency has improved significantly over the 1990s, it has failed to generate a comparable private sector investment response. Understanding the lack of increased private investment is complex. Much of the private sector investment that occurred in the 1980s in the region was domestic demand driven. The private sector developed under the patronage of governments. It flourished not so much by being dynamic in a competitive environment but often based on supplying protected domestic markets and generally “living off the state.” Thus, the investments that took place by the private sector during the 1980s were largely focused on serving the domestic market rather than on export expansion. For example, the share of construction in value added during the 1980s, at 7.1% (relative to a world average of 5.6%) suggests that a larger than average share of the region’s investment constituted new buildings rather than re-tooling, or investments in (new or high-tech) sectors (see Table 7). Over the 1990s, we have seen a decline in share of construction in value added, which may signal a change in the types of investment the private sector is undertaking. So, even while we see declines in private sector investments over the 1990s, it could be the case that the investments currently taking place are more externally demand-driven and, hence, over the long term, more sustainable.
16

Table 7: Share of Construction in Value Added1980s and 1990s (%)
Share of Construction in Value AddedCountry 1980s 1990s ChangeAlgeria 13.7 10.5 -3.2Egypt 5.0 5.0 0.0Iran 6.9 3.8 -3.1Jordan 7.6 5.1 -2.5Kuwait 3.5 3.3 -0.2Morocco 5.9 4.7 -1.2Oman 5.2 3.2 -2.0Saudi Arabia 11.7 8.9 -2.9Syria 5.9 4.1 -1.8Tunisia 5.2 4.5 -0.8
Regional Average* 7.1 5.3 -1.8World Average* 5.6 5.7 0.1
* Unweighted average.
Then there is the possibility that private sector investment, in addition to dropping off in the domestic-demand markets, has not significantly improved in the tradable goods sectors, either. Why would the reform process, which has clearly produced an impact on the region’s productivity, fail to generate a private-sector investment response in the external-oriented sectors? While the comprehensive macroeconomic and structural reform programs espoused by many of the MENA economies created an exuberant boost in their economic outlooks, most of the region have failed to complete the reform process. Reforms have generally been limited to the “stroke of the pen” reforms, easily executed but which, in the absence of other, more serious and challenging reforms, have limited effect.
Policy Implications
Understanding why private investment has failed to respond to the improved productivity and reforms in the region is essential for realizing the rates of investment necessary for high and sustained economic growth. In order to significantly increase the growth of private investment in the region, the private investment climate must be improved. While this paper cannot definitely establish the chief factors which have inhibited an enabling private investment climate, several likely possibilities are offered.
To begin with, the region has substantial work to do in terms of creating an enabling macroeconomic environment through exchange rate management. The pre-occupation with macroeconomic stability during the 1990s has often relied on maintaining nominally fixed and stable exchange rates by virtually all countries in the region (Algeria, Tunisia and Yemen and more recently Iran are notable exceptions), which has meant that one important tool to
17

make exports more profitable was surrendered. This is the opposite of the policies that the successful exporting countries such as the “East Asian Tigers” have pursued over the last three decades. We know from experience that growing export of manufactured and non-traditional goods also creates dynamism in the domestic economy with very significant spill-over effects. The issue now is to find ways to “exit” the pegs in an orderly manner to push economic growth.
Then, there is the size of the public sector. Governments may account for as much as 40-60% of gross domestic output and of employment in the region. This includes continuing high expenditures on military and social services which account for the large size of public sector. The big role of the state -- a sector that essentially has low productivity and with limited inherent potential for productivity gain – is a drag on growth in most economies in the region. Efforts to reduce the public sector through rationalization of public employment, improving its performance through better incentives and institutions, and privatization of goods and services that could be produced more efficiently in the private sector have begun in many countries. But, by and large, these efforts remain slow and half-hearted to-date.
Thirdly, the private sector is stifled from development because of the systems of governance that pervade the region. Chief among the governance problems is the issue of regulatory capture, where groups of influential businesses (whether public or private) are able to essentially capture the state regulations and utilize them to profit, at the expense of the rest of the private sector. High on the list of regulatory capture are infrastructure and telecommunications, but the list extends to taxes, licensing, and manipulating the loopholes within the system. The unfair advantages extended to a group of elite firms prevents other private business from entering and competing. Addressing the myriad of governance issues pervading the region should be on the top of the agenda if the private sector is to ultimately thrive in MENA.
Fourth, there is the issue of trade reform. Trade policy in the region remains one of the most restrictive in the world with low level and speed of integration into the world economy. Tariff rates remain high and the extent of non-tariff barriers large. The importance of export orientation in growth is well established in the empirical literature. High and sustainable growth simply does not occur without a substantial outward orientation. A number of policy moves across the region are expected to lead to greater trade openness, stimulating integration and hopefully growth, most notably the EU association agreements signed by Tunisia, Morocco, Jordan, Algeria, Egypt and Lebanon.
Among the most important but lagging reforms is that of the banking sector, particularly the slow progress on privatizing state banks in countries such as Algeria, Egypt, Tunisia, Iran, and Syria. While in a number of countries the banking sectors are relatively healthy, this is not the case in most countries and financial sector development remains a principal constraint for the development of the private sector and for growth.
And finally, the region needs a virtual overhaul on its system of property rights, better legal systems and improved contract enforcement mechanisms.
Unless the private sector begins to see itself as an independent source of growth and productivity in the economy, and society begins to underpin this change economically and
18

politically, it is unlikely that any of the past economic reforms in themselves will be adequate. The public sector’s role in improving labor market outcomes in the region is important…but unlike the 1960s and 1970s, better labor market outcomes cannot be guaranteed through public employment. The government’s role has distinctly changed. Now the public sector must find ways to improve the investment climate and promote economic growth, which remains the single most important way to ensure better labor market outcomes in the future.
19

Bibliography
Barro, Robert J. and Jong-Wha Lee. 2000. “International data on educational attainment: updates and implications.” CID Working Paper No. 42. Center for International Development at Harvard University.
Boltho, Andrea and Andrew Glyn. 1995. “Can macroeconomic policies raise growth?” International Labor Review v134, n4-5: 451-470.
Bosworth, Barry, Susan M Collins, and Yu-chin Chen. 1995. Accounting for Differences in Economic Growth. Paper for conference on “Structural Adjustment Policies in the 1990s: Experience and Prospects”, organized by the Institute of Developing Economies, Tokyo, Japan.
Easterly, William, and Ross Levine. 2001. “It’s Not Factor Accumulation: Stylized Facts and Growth Models.” World Bank Economic Review v15, n2: 177-219.
Islam, Nazrul. 1999. “International Comparison of Total Factor Productivity: A Review.” Review of Income and Wealth v45 n4 .
Keller, Jennifer. 2001. “Sources of Growth in MNA.” Unpublished mimeo. MNSED, World Bank.
Nehru, Vikram and Ashok Dhareshwar. 1993. “A new database on physical capital stock: Sources, methodology, and results.” Revista de Análisis Economico v8 n1: 37-59.
Rama, Martin. 1998. “How bad is unemployment in Tunisia? Assessing labor market efficiency in a developing country.” World Bank Research Observer v13 n1: 59-77.
20

Annex 1
Source: Unemployment rates from country sources. Labor force, population figures from ILO.
Note: Differences among countries in terms of defining the labor force or the unemployed prevent a true calculation of the regional unemployment rate. The regional unemployment rate of 18.7% provided above is a simple weighted average (weighted by the labor force) of the most recently available country-level unemployment rates. Reducing the MENA regional unemployment rate by 50% , in practice, would be heavily determined by reducing unemployment in the most labor-populous countries (Egypt, Iran, Morocco, Algeria), exerting a greater weight on the regional rate of unemployment. The labor force growth rates are, in part, based upon the ILO’s assumptions about changes to labor force participation rates, which differ from country to country. Without a detailed analysis of these underlying assumptions, we have accepted the ILO’s labor force projections at face value, but the assumptions are clearly important in determining the extent of the labor market challenge over the next decade.
21
Table A1: Calculating the needed job growth between 2002-2012 to absorb new labor force entrants and reduce
the regional unemployment rate by 50%
Country
Unemployment rate (latest year available) Year
Labor force 2002
Of whom unemployed (actual)
Labor force 2012
Of whom unemployed (with 50% reduction in regional unemployment rate)
Labor force participation rate, 2002 (Labor force over total population)
Labor force participation rate, 2012
Algeria 28.7 1997 11,472,694 3,292,663 16,729,709 34.9 41.6Egypt, Arab Rep. 9.4 1998 27,444,152 2,579,750 36,106,612 39.0 43.5Iran, Islamic Rep. 16.2 2000 25,778,539 4,176,123 39,874,080 32.1 38.6Iraq 50.0 1999 6,873,680 3,436,840 9,769,273 28.2 30.4Libya 30.0 1994 1,954,684 586,405 2,762,705 28.8 29.8Yemen, Rep. 30.0 1996 6,165,097 1,849,529 9,006,543 31.8 33.1Syrian Arab Republic 25.0 1999 5,560,916 1,390,229 8,210,567 32.9 38.2Lebanon 18.0 1997 1,215,942 218,870 1,586,104 36.0 41.3Morocco 17.8 1996 12,162,105 2,164,855 15,528,683 40.8 45.1Tunisia 15.9 1997 4,097,709 651,536 5,294,497 40.4 45.0Jordan 13.7 2001 2,035,570 278,873 2,997,171 30.3 33.4Bahrain 5.0 2000 291,440 14,572 362,472 45.8 49.1Oman 10.0 1995 783,990 78,399 1,191,751 26.7 27.7Kuwait 1.3 1997 854,535 10,743 1,218,463 41.8 49.0Saudi Arabia 10.0 1998 7,610,381 761,038 10,595,557 33.1 34.2United Arab Emirates 6.7 2000 1,241,670 83,068 1,424,631 49.2 48.1
MENA region 18.7 115,543,102 21,573,492 162,658,817 15,185,323 (9.3%)
New laborers, 2002-2012 47,115,715
+ Reduction in unemployed, 2002-2012
6,388,169
Total jobs needed 53,503,884 As percent of current employed
57%

Annex 2: Measuring growth, accumulation, and TFP growth
To examine how the MENA region’s growth has changed since it began its comprehensive structural reform process, we made simple calculations of the change in both the region’s rate of accumulation, as well as the region’s total factor productivity (TFP) growth.
TFP growth is something of a mixed bag. It is the residual of what cannot be explained by investments if we assume those investments (both physical and human) earn a reasonable rate of return. TFP growth is often thought of as “technical progress”, but in fact, as the residual of a growth accounting estimation, it not only embodies the differences across countries in their progress in the adoption of better technology, but also reflects a host of non-technological differences, including changes in the utilization of both capital and labor, changes in schooling quality, and changes in the overall efficiency with which factors are allocated in the production process. Because of the many other factors that can potentially affect the growth residual, much empirical work has focused on reducing those elements of the residual (TFP) which do not reflect actual shifts in technological opportunities in the economy. For example, adjustments for the business cycle have been introduced, to account for the short-term fluctuations in capacity utilization (Griliches, 1992; Lefort and Solimano; 1994; Fajnzylber and Lederman, 1999). An alternative procedure employed by Griliches and Lichtenberg (1984) has been to estimate growth over 5-year periods, and to only allow the TFP series to increase or stay constant (resetting any values to the previously observed peak level) to maintain the assumption that “true” productivity can only improve and that measured reductions in TFP can only reflect short-term fluctuations.
For our purposes, we have adopted a more casual approach about our measurements. Our interest is to explore how MENA’s overall growth has improved or deteriorated since it began its structural reform process. In the end, growth will be determined by both accumulation of physical and human capital, as well as the overall manner in which those factors are put to production. For the MENA region, things such as improved capacity utilization of capital and human capital by the region are precisely the elements we believe may be heavily affected by structural reform, and thus we would like to have this effect reflected in our estimates. At the same time, as we discuss in the subsequent section, we have controlled for global shocks.
Under many circumstances, the environment created to encourage investment would also correspond to an environment in which those investments could be productive. But in the MENA region, accumulation and productivity have often gone in opposite directions, such as during the period of massive public sector investments which yielded rates of return well below international norms. Examining growth alone will mask these very different effects, and the somewhat anemic growth that has characterized the region since reform may be more a reflection of significantly lower public investments than of continuing poor productivity performance. And from the standpoint of evaluating the impact of the region’s structural reform, it is precisely TFP growth which we would expect to be most influenced by changes in national policies that enhance the efficiency of capital and labor.
22

Data and Methodology
TFP growth estimates were made utilizing panel data of capital stock accumulation, human capital stock accumulation, and GDP growth from 1960-1999. Estimates of the physical capital stock for a sample of 83 economies from 1960 to 1990 come from Nehru and Dhareshwar (199315), which was created by a perpetual inventory method from investment rates from 1950 forward, with initial assumptions about the capital/output ratio, and assuming a common fixed annual geometric depreciation rate of 0.04. These capital stock data were extended to 1999 using the growth rates of constant price local currency investment from the World Bank’s World Development Indicators database16, and applying similar assumptions on the depreciation rate. Capital stock estimates for another 12 economies, including 4 economies in the MENA region of particular interest to us, were created according to a similar methodology, using investment rates from 1960 forward. Since we will estimate GDP growth using a panel regression approach over 10 year periods, the sample was restricted to those economies in which the capital stock could be estimated for the full 1960-1999 period, both to maintain a balanced panel, and reducing the importance of the assumption about the initial stock in the period of analysis of particular importance to us, the 1990s.
Real GDP in constant local currency also come from World Bank data. The human capital-augmented labor stock was estimated, using both labor force estimates as reported by the International Labor Organization, from the World Bank database, and estimates of the educational attainment of the adult population from Barro and Lee17. The functional form of human capital augmented labor has been assumed as:
H = L e (r * S)
where L is the labor force and S is the average years of schooling of the adult population, and r is the rate of return to schooling. According to international evidence, a reasonable approximation of that rate of return is 10%, which we have assumed for the purposes of our analysis.
TFP growth was calculated over ten-year periods from 1960-1999, rather than on an annual basis, to minimize the error that is inherent in current capital stock measurements. National accounts would attribute any investment expenditures made over the year, even the last day of the year, to that year’s capital stock. However, it is unlikely that that investment expenditure would contribute to economic growth immediately, but rather would only create the potential to contribute to growth into the future. To reduce this lag-effect that physical capital exhibits, we calculated TFP growth based on ten-year averages. We allowed for a slight variation in the years counted for Kuwait, in order to minimize the very large impact
15 Nehru, Vikram Ashok Dhareshwar. 1993. A New Database on Physical Capital Stock: Sources, Methodology and Results. Revista de Analisis Economico 8 (1): 37-59.
16 In the case of MENA economies, where there were inconsistencies, the World Bank MENA regional database investment series was preferred.17 “International Data on Educational Attainment: Updates and Implications”; CID Working paper No. 42; Center for International Development at Harvard University; April 2000.
23

that came from the Gulf war. For Kuwait, the years 1989-1992 have been removed from the analysis. This small change to the dataset was made not to mine the data in any fashion, but only to better serve our purpose of evaluating the country’s growth, accumulation, and productivity.
Production was assumed to follow a Cobb-Douglas specification with constant returns to scale between physical and human-capital-augmented labor:
Yt = A (t) * Kt*Ht
(1-)
where Y is output, A is an index of total factor productivity, and K and H are the stocks of physical and human-augmented labor, respectively. Dividing both sides by the work force, taking logs, and first-differencing, growth of output per laborer can be related as follows:
ln (yi /yi-1,) = ln (kt / kt-1) + (1-) ln (ht / ht-1) + ln (At / At-1)
To determine the coefficients on capital and human-capital augmented labor, and (1-), the average annual rate of GDP per labor growth over the decade was regressed on average growth of physical capital per laborer and human-capital per laborer with a least squares trend over the entire period of availability (1960-1999).
From our estimation, the elasticity of output of physical capital was estimated to be 0.49, somewhat higher than the average estimated coefficient from previous research, but within the range of accepted parameters. This may be due to the inclusion of several more developing countries than in the original Nehru-Dhareshwar physical capital stock dataset, made possible using World Bank data. At the same time, our purpose here is not to break new ground in measuring TFP, but to evaluate the region’s performance in factor allocation and efficiency. Thus, we have calculated the TFP using three distinct calculation of factor shares -- k=0.3, k=0.4, and k=0.5, to check the sensitivity of the region’s growth performance to the assumptions made on the output elasticities. The resulting sets of TFP growth estimations for the full sample of countries are presented in Annex 1. Within the text of the paper, TFP calculations are based on elasticity of capital assumption of 0.4 across countries.
24

Annex Table 2: TFP estimates under alternate assumptions on k
Region Country DecadeTFP growth, alpha k=0.5
TFP growth, alpha k=0.4
TFP growth, alpha k=0.3
East Asia & Pacific China 1960s 1.44 1.38 1.32East Asia & Pacific China 1970s 0.37 0.77 1.17East Asia & Pacific China 1980s 2.41 3.01 3.60East Asia & Pacific China 1990s 4.55 5.34 6.14East Asia & Pacific Fiji 1960s -2.42 -1.69 -0.96East Asia & Pacific Fiji 1970s -1.39 -0.97 -0.55East Asia & Pacific Fiji 1980s -1.47 -1.49 -1.52East Asia & Pacific Fiji 1990s 0.21 0.01 -0.20East Asia & Pacific Indonesia 1960s 0.46 0.46 0.46East Asia & Pacific Indonesia 1970s -0.19 0.56 1.31East Asia & Pacific Indonesia 1980s -1.13 -0.46 0.21East Asia & Pacific Indonesia 1990s -2.11 -1.61 -1.11East Asia & Pacific Korea 1960s 0.25 1.09 1.92East Asia & Pacific Korea 1970s -1.76 -0.96 -0.16East Asia & Pacific Korea 1980s 1.57 2.21 2.84East Asia & Pacific Korea 1990s -0.43 0.18 0.79East Asia & Pacific Malaysia 1960s -0.36 0.21 0.78East Asia & Pacific Malaysia 1970s -0.05 0.56 1.17East Asia & Pacific Malaysia 1980s -0.45 0.02 0.48East Asia & Pacific Malaysia 1990s -0.19 0.44 1.07East Asia & Pacific Myanmar 1960s -0.10 0.01 0.13East Asia & Pacific Myanmar 1970s 1.69 1.78 1.86East Asia & Pacific Myanmar 1980s -2.09 -1.94 -1.79East Asia & Pacific Myanmar 1990s 0.73 1.37 2.01East Asia & Pacific Papau New Guinea 1960s -1.98 -0.59 0.80East Asia & Pacific Papau New Guinea 1970s -1.90 -1.53 -1.16East Asia & Pacific Papau New Guinea 1980s -1.53 -1.52 -1.50East Asia & Pacific Papau New Guinea 1990s 2.27 2.22 2.17East Asia & Pacific Philippines 1960s -0.18 0.15 0.48East Asia & Pacific Philippines 1970s -0.28 -0.03 0.22East Asia & Pacific Philippines 1980s -2.39 -2.26 -2.14East Asia & Pacific Philippines 1990s -0.76 -0.81 -0.86East Asia & Pacific Singapore 1960s -1.50 -0.22 1.05East Asia & Pacific Singapore 1970s -0.92 0.04 1.00East Asia & Pacific Singapore 1980s 0.31 0.88 1.46East Asia & Pacific Singapore 1990s 1.34 1.79 2.23East Asia & Pacific Thailand 1960s 0.49 1.53 2.58East Asia & Pacific Thailand 1970s -0.11 0.47 1.05East Asia & Pacific Thailand 1980s 1.90 2.30 2.69East Asia & Pacific Thailand 1990s -0.89 -0.33 0.22Europe & Central Asia Cyprus 1960s 4.04 4.45 4.86Europe & Central Asia Cyprus 1970s 0.62 0.87 1.12Europe & Central Asia Cyprus 1980s 1.71 1.87 2.03Europe & Central Asia Cyprus 1990s 1.40 1.53 1.67Europe & Central Asia Hungary 1960s -0.91 0.01 0.92Europe & Central Asia Hungary 1970s -0.09 0.82 1.74Europe & Central Asia Hungary 1980s -0.13 0.31 0.74Europe & Central Asia Hungary 1990s -1.03 -0.81 -0.60Europe & Central Asia Turkey 1960s 1.64 2.01 2.39
25

Region Country DecadeTFP growth, alpha k=0.5
TFP growth, alpha k=0.4
TFP growth, alpha k=0.3
Europe & Central Asia Turkey 1970s -0.01 0.53 1.08Europe & Central Asia Turkey 1980s 1.29 1.41 1.53Europe & Central Asia Turkey 1990s -0.86 -0.84 -0.82High Income / OECD Australia 1960s 0.81 1.10 1.39High Income / OECD Australia 1970s -0.16 0.05 0.27High Income / OECD Australia 1980s -0.04 0.07 0.17High Income / OECD Australia 1990s 1.12 1.27 1.41High Income / OECD Austria 1960s 1.36 2.20 3.03High Income / OECD Austria 1970s 0.27 0.77 1.27High Income / OECD Austria 1980s 0.28 0.49 0.71High Income / OECD Austria 1990s -0.25 -0.05 0.14High Income / OECD Belgium 1960s 1.69 2.04 2.40High Income / OECD Belgium 1970s 1.03 1.40 1.77High Income / OECD Belgium 1980s 0.49 0.61 0.73High Income / OECD Belgium 1990s -0.10 0.06 0.22High Income / OECD Canada 1960s 1.69 1.85 2.01High Income / OECD Canada 1970s -0.26 -0.24 -0.23High Income / OECD Canada 1980s -0.68 -0.47 -0.26High Income / OECD Canada 1990s -0.33 -0.14 0.06High Income / OECD Denmark 1960s 0.07 0.74 1.40High Income / OECD Denmark 1970s -0.76 -0.47 -0.18High Income / OECD Denmark 1980s 0.44 0.51 0.59High Income / OECD Denmark 1990s 1.15 1.32 1.49High Income / OECD Finland 1960s 1.28 1.66 2.05High Income / OECD Finland 1970s 0.33 0.57 0.81High Income / OECD Finland 1980s 0.07 0.12 0.16High Income / OECD Finland 1990s 0.94 0.95 0.97High Income / OECD France 1960s 1.11 1.75 2.40High Income / OECD France 1970s -0.43 -0.09 0.26High Income / OECD France 1980s 0.45 0.69 0.93High Income / OECD France 1990s -0.35 -0.31 -0.26High Income / OECD Greece 1960s 2.34 3.27 4.20High Income / OECD Greece 1970s -0.01 0.41 0.82High Income / OECD Greece 1980s -0.83 -0.79 -0.75High Income / OECD Greece 1990s -0.09 0.07 0.24High Income / OECD Iceland 1960s 0.33 0.56 0.79High Income / OECD Iceland 1970s 1.67 1.86 2.06High Income / OECD Iceland 1980s -0.82 -0.73 -0.65High Income / OECD Iceland 1990s 0.52 0.57 0.61High Income / OECD Ireland 1960s 1.16 1.69 2.21High Income / OECD Ireland 1970s 0.70 1.13 1.56High Income / OECD Ireland 1980s 0.91 1.08 1.25High Income / OECD Ireland 1990s 3.53 3.61 3.69High Income / OECD Israel 1960s 2.81 3.05 3.30High Income / OECD Israel 1970s 0.26 0.49 0.73High Income / OECD Israel 1980s 0.59 0.65 0.72High Income / OECD Israel 1990s 0.25 0.36 0.46High Income / OECD Italy 1960s 1.84 2.42 3.00High Income / OECD Italy 1970s 1.05 1.38 1.71
26

Region Country DecadeTFP growth, alpha k=0.5
TFP growth, alpha k=0.4
TFP growth, alpha k=0.3
High Income / OECD Italy 1980s 0.21 0.35 0.50High Income / OECD Italy 1990s -0.32 -0.24 -0.16High Income / OECD Japan 1960s 2.33 3.64 4.95High Income / OECD Japan 1970s -1.09 -0.33 0.42High Income / OECD Japan 1980s 0.63 1.02 1.40High Income / OECD Japan 1990s -1.52 -1.19 -0.87High Income / OECD Netherlands 1960s -0.26 0.00 0.26High Income / OECD Netherlands 1970s -0.19 0.01 0.21High Income / OECD Netherlands 1980s -0.55 -0.59 -0.62High Income / OECD Netherlands 1990s 0.97 1.06 1.15High Income / OECD New Zealand 1960s 0.34 0.53 0.72High Income / OECD New Zealand 1970s -1.44 -1.45 -1.46High Income / OECD New Zealand 1980s -0.63 -0.54 -0.45High Income / OECD New Zealand 1990s -0.07 0.07 0.21High Income / OECD Norway 1960s 0.81 0.96 1.12High Income / OECD Norway 1970s 0.82 1.01 1.20High Income / OECD Norway 1980s -1.52 -1.66 -1.79High Income / OECD Norway 1990s 2.11 2.12 2.14High Income / OECD Portugal 1960s 1.98 2.66 3.34High Income / OECD Portugal 1970s -0.20 0.01 0.22High Income / OECD Portugal 1980s 0.10 0.31 0.52High Income / OECD Portugal 1990s -0.30 -0.04 0.21High Income / OECD Spain 1960s 1.80 2.52 3.24High Income / OECD Spain 1970s -0.79 -0.37 0.05High Income / OECD Spain 1980s 0.35 0.51 0.67High Income / OECD Spain 1990s -0.34 -0.18 -0.02High Income / OECD Sweden 1960s 1.13 1.57 2.02High Income / OECD Sweden 1970s -1.27 -1.21 -1.15High Income / OECD Sweden 1980s 0.30 0.47 0.65High Income / OECD Sweden 1990s -0.52 -0.64 -0.75High Income / OECD Switzerland 1960s -0.15 0.28 0.71High Income / OECD Switzerland 1970s -1.87 -1.72 -1.56High Income / OECD Switzerland 1980s -0.26 -0.06 0.15High Income / OECD Switzerland 1990s -1.24 -1.11 -0.98High Income / OECD United Kingdom 1960s -0.05 0.45 0.96High Income / OECD United Kingdom 1970s -0.41 -0.17 0.07High Income / OECD United Kingdom 1980s 0.62 0.78 0.94High Income / OECD United Kingdom 1990s 0.12 0.29 0.47High Income / OECD United States 1960s 0.68 0.74 0.81High Income / OECD United States 1970s -1.17 -1.33 -1.49High Income / OECD United States 1980s 0.90 1.05 1.21High Income / OECD United States 1990s 0.60 0.74 0.89Latin America & Caribbean Argentina 1960s 0.57 0.83 1.08Latin America & Caribbean Argentina 1970s -0.79 -0.53 -0.28Latin America & Caribbean Argentina 1980s -2.42 -2.66 -2.90Latin America & Caribbean Argentina 1990s 3.25 3.07 2.88Latin America & Caribbean Barbados 1960s -1.96 -1.16 -0.35Latin America & Caribbean Barbados 1970s -0.06 0.72 1.49Latin America & Caribbean Barbados 1980s -1.46 -1.46 -1.45
27

Region Country DecadeTFP growth, alpha k=0.5
TFP growth, alpha k=0.4
TFP growth, alpha k=0.3
Latin America & Caribbean Barbados 1990s -0.19 -0.26 -0.33Latin America & Caribbean Bolivia 1960s 1.45 1.82 2.20Latin America & Caribbean Bolivia 1970s -0.10 0.25 0.59Latin America & Caribbean Bolivia 1980s -1.05 -1.43 -1.80Latin America & Caribbean Bolivia 1990s 1.79 1.58 1.38Latin America & Caribbean Brazil 1960s 1.19 1.46 1.74Latin America & Caribbean Brazil 1970s 2.01 2.63 3.25Latin America & Caribbean Brazil 1980s -2.35 -2.39 -2.43Latin America & Caribbean Brazil 1990s -0.14 -0.18 -0.23Latin America & Caribbean Chile 1960s 1.18 1.40 1.62Latin America & Caribbean Chile 1970s -0.06 -0.20 -0.35Latin America & Caribbean Chile 1980s -0.09 -0.16 -0.23Latin America & Caribbean Chile 1990s 1.61 2.04 2.46Latin America & Caribbean Colombia 1960s 2.08 2.26 2.44Latin America & Caribbean Colombia 1970s 0.61 0.63 0.65Latin America & Caribbean Colombia 1980s -0.87 -0.86 -0.85Latin America & Caribbean Colombia 1990s -1.34 -1.22 -1.10Latin America & Caribbean Costa Rica 1960s 0.60 0.89 1.17Latin America & Caribbean Costa Rica 1970s -1.39 -1.06 -0.74Latin America & Caribbean Costa Rica 1980s -1.42 -1.44 -1.47Latin America & Caribbean Costa Rica 1990s 1.15 1.37 1.59Latin America & Caribbean Dominican Republic 1960s 0.45 0.53 0.61Latin America & Caribbean Dominican Republic 1970s -0.49 0.20 0.89Latin America & Caribbean Dominican Republic 1980s -2.79 -2.64 -2.49Latin America & Caribbean Dominican Republic 1990s 1.91 2.02 2.12Latin America & Caribbean Ecuador 1960s 0.59 0.78 0.97Latin America & Caribbean Ecuador 1970s 2.86 3.05 3.23Latin America & Caribbean Ecuador 1980s -1.11 -1.13 -1.16Latin America & Caribbean Ecuador 1990s -1.50 -1.60 -1.69Latin America & Caribbean El Salvador 1960s 0.11 0.32 0.53Latin America & Caribbean El Salvador 1970s -1.94 -1.55 -1.16Latin America & Caribbean El Salvador 1980s -2.33 -2.49 -2.64Latin America & Caribbean El Salvador 1990s 0.54 0.50 0.46Latin America & Caribbean Guatemala 1960s 1.18 1.40 1.62Latin America & Caribbean Guatemala 1970s 0.63 0.89 1.15Latin America & Caribbean Guatemala 1980s -1.53 -1.62 -1.71Latin America & Caribbean Guatemala 1990s 0.49 0.46 0.43Latin America & Caribbean Guyana 1960s 0.79 0.92 1.05Latin America & Caribbean Guyana 1970s -1.36 -1.39 -1.43Latin America & Caribbean Guyana 1980s -4.14 -4.45 -4.77Latin America & Caribbean Guyana 1990s 2.68 2.78 2.88Latin America & Caribbean Haiti 1960s -1.21 -1.20 -1.19Latin America & Caribbean Haiti 1970s -0.35 0.29 0.92Latin America & Caribbean Haiti 1980s -4.31 -4.10 -3.90Latin America & Caribbean Haiti 1990s -1.60 -1.88 -2.16Latin America & Caribbean Honduras 1960s 0.39 0.62 0.86Latin America & Caribbean Honduras 1970s 0.48 0.69 0.90Latin America & Caribbean Honduras 1980s -1.83 -2.02 -2.21Latin America & Caribbean Honduras 1990s -1.20 -1.23 -1.26
28

Region Country DecadeTFP growth, alpha k=0.5
TFP growth, alpha k=0.4
TFP growth, alpha k=0.3
Latin America & Caribbean Jamaica 1960s 1.25 1.62 1.99Latin America & Caribbean Jamaica 1970s -3.91 -4.07 -4.22Latin America & Caribbean Jamaica 1980s 0.43 0.17 -0.08Latin America & Caribbean Jamaica 1990s -3.08 -2.82 -2.56Latin America & Caribbean Mexico 1960s 1.02 1.42 1.82Latin America & Caribbean Mexico 1970s -0.21 0.11 0.44Latin America & Caribbean Mexico 1980s -3.02 -3.14 -3.26Latin America & Caribbean Mexico 1990s -0.53 -0.48 -0.42Latin America & Caribbean Nicaragua 1960s 0.70 1.11 1.52Latin America & Caribbean Nicaragua 1970s -4.12 -4.03 -3.93Latin America & Caribbean Nicaragua 1980s -4.52 -4.66 -4.79Latin America & Caribbean Nicaragua 1990s -0.34 -0.62 -0.90Latin America & Caribbean Panama 1960s 1.36 2.01 2.67Latin America & Caribbean Panama 1970s -0.95 -0.60 -0.25Latin America & Caribbean Panama 1980s -3.17 -3.38 -3.60Latin America & Caribbean Panama 1990s 1.23 1.28 1.33Latin America & Caribbean Paraguay 1960s 0.30 0.50 0.69Latin America & Caribbean Paraguay 1970s 0.88 1.56 2.23Latin America & Caribbean Paraguay 1980s -2.69 -2.39 -2.08Latin America & Caribbean Paraguay 1990s -1.60 -1.48 -1.35Latin America & Caribbean Peru 1960s 1.10 1.22 1.34Latin America & Caribbean Peru 1970s -0.90 -0.95 -1.00Latin America & Caribbean Peru 1980s -3.50 -3.56 -3.63Latin America & Caribbean Peru 1990s 0.33 0.22 0.11Latin America & Caribbean Trinidad and Tobago 1960s 0.76 1.02 1.27Latin America & Caribbean Trinidad and Tobago 1970s -0.51 -0.14 0.24Latin America & Caribbean Trinidad and Tobago 1980s -6.00 -5.74 -5.49Latin America & Caribbean Trinidad and Tobago 1990s -1.40 -1.08 -0.76Latin America & Caribbean Uruguay 1960s -0.15 -0.22 -0.29Latin America & Caribbean Uruguay 1970s -0.89 -0.72 -0.56Latin America & Caribbean Uruguay 1980s -0.10 -0.32 -0.54Latin America & Caribbean Uruguay 1990s 1.38 1.47 1.55Latin America & Caribbean Venezuela 1960s 2.02 1.95 1.88Latin America & Caribbean Venezuela 1970s -4.04 -4.12 -4.20Latin America & Caribbean Venezuela 1980s -1.57 -1.69 -1.81Latin America & Caribbean Venezuela 1990s -2.37 -2.55 -2.72Middle East & North Africa Algeria 1960s 1.37 1.44 1.52Middle East & North Africa Algeria 1970s -0.84 -0.42 0.00Middle East & North Africa Algeria 1980s -2.60 -2.66 -2.71Middle East & North Africa Algeria 1990s -1.39 -1.78 -2.17Middle East & North Africa Egypt 1960s 1.47 1.78 2.08Middle East & North Africa Egypt 1970s 0.81 1.34 1.86Middle East & North Africa Egypt 1980s -1.64 -1.23 -0.81Middle East & North Africa Egypt 1990s 0.53 0.45 0.36Middle East & North Africa Iran 1960s 1.43 2.39 3.35Middle East & North Africa Iran 1970s -7.59 -6.76 -5.93Middle East & North Africa Iran 1980s 0.40 0.25 0.10Middle East & North Africa Iran 1990s 1.45 1.22 0.99Middle East & North Africa Jordan 1970s 1.57 2.30 3.02
29

Region Country DecadeTFP growth, alpha k=0.5
TFP growth, alpha k=0.4
TFP growth, alpha k=0.3
Middle East & North Africa Jordan 1980s -3.48 -3.45 -3.42Middle East & North Africa Jordan 1990s 1.08 0.55 0.02Middle East & North Africa Kuwait 1970s -4.80 -5.35 -5.90Middle East & North Africa Kuwait 1980s -4.91 -5.34 -5.78Middle East & North Africa Kuwait 1990s -2.85 -3.17 -3.49Middle East & North Africa Morocco 1960s 4.38 4.59 4.80Middle East & North Africa Morocco 1970s -0.82 -0.36 0.09Middle East & North Africa Morocco 1980s -0.59 -0.44 -0.29Middle East & North Africa Morocco 1990s -1.20 -1.20 -1.20Middle East & North Africa Oman 1970s -5.19 -4.21 -3.23Middle East & North Africa Oman 1980s 2.33 2.60 2.87Middle East & North Africa Oman 1990s -0.37 -0.48 -0.60Middle East & North Africa Saudi Arabia 1960s 4.44 4.69 4.95Middle East & North Africa Saudi Arabia 1970s -5.13 -3.45 -1.77Middle East & North Africa Saudi Arabia 1980s -4.54 -5.11 -5.67Middle East & North Africa Saudi Arabia 1990s -1.32 -1.33 -1.35Middle East & North Africa Syria 1960s -0.25 0.26 0.77Middle East & North Africa Syria 1970s 1.15 1.92 2.69Middle East & North Africa Syria 1980s -2.85 -2.76 -2.68Middle East & North Africa Syria 1990s 1.62 1.48 1.33Middle East & North Africa Tunisia 1960s 1.03 1.43 1.84Middle East & North Africa Tunisia 1970s 1.27 1.45 1.64Middle East & North Africa Tunisia 1980s -0.44 -0.36 -0.27Middle East & North Africa Tunisia 1990s 1.09 1.02 0.95South Asia Bangladesh 1960s 0.67 0.87 1.07South Asia Bangladesh 1970s -0.93 -1.09 -1.24South Asia Bangladesh 1980s 1.80 1.85 1.91South Asia Bangladesh 1990s 1.09 1.12 1.14South Asia India 1960s -0.20 0.11 0.43South Asia India 1970s -0.89 -0.77 -0.65South Asia India 1980s 1.93 2.14 2.35South Asia India 1990s 1.59 1.73 1.88South Asia Pakistan 1960s -1.14 -0.11 0.93South Asia Pakistan 1970s 0.07 0.20 0.32South Asia Pakistan 1980s 1.10 1.16 1.22South Asia Pakistan 1990s 0.40 0.56 0.72South Asia Sri Lanka 1960s 1.28 1.36 1.45South Asia Sri Lanka 1970s -0.66 -0.26 0.15South Asia Sri Lanka 1980s -0.74 -0.32 0.10South Asia Sri Lanka 1990s 0.97 1.21 1.44Sub-Saharan Africa Bostwana 1960s 0.60 1.80 3.01Sub-Saharan Africa Bostwana 1970s 3.20 4.59 5.98Sub-Saharan Africa Bostwana 1980s 2.22 2.61 3.00Sub-Saharan Africa Bostwana 1990s -0.63 -0.35 -0.06Sub-Saharan Africa Cameroon 1960s -1.35 -1.06 -0.76Sub-Saharan Africa Cameroon 1970s 2.20 2.81 3.42Sub-Saharan Africa Cameroon 1980s -3.38 -2.88 -2.38Sub-Saharan Africa Cameroon 1990s -0.42 -0.80 -1.17Sub-Saharan Africa Cote D'Ivoire 1960s 2.45 3.06 3.66
30

Region Country DecadeTFP growth, alpha k=0.5
TFP growth, alpha k=0.4
TFP growth, alpha k=0.3
Sub-Saharan Africa Cote D'Ivoire 1970s -1.43 -0.85 -0.26Sub-Saharan Africa Cote D'Ivoire 1980s -2.28 -2.52 -2.76Sub-Saharan Africa Cote D'Ivoire 1990s -0.07 -0.31 -0.54Sub-Saharan Africa Ethiopia 1960s -1.05 -0.38 0.29Sub-Saharan Africa Ethiopia 1970s 0.05 0.12 0.19Sub-Saharan Africa Ethiopia 1980s -3.48 -3.12 -2.76Sub-Saharan Africa Ethiopia 1990s -0.33 0.01 0.34Sub-Saharan Africa Ghana 1960s -2.75 -2.52 -2.29Sub-Saharan Africa Ghana 1970s -1.97 -2.00 -2.03Sub-Saharan Africa Ghana 1980s -0.09 -0.29 -0.49Sub-Saharan Africa Ghana 1990s 1.15 1.17 1.19Sub-Saharan Africa Kenya 1960s 1.61 1.50 1.39Sub-Saharan Africa Kenya 1970s 3.21 3.22 3.22Sub-Saharan Africa Kenya 1980s 1.31 1.10 0.88Sub-Saharan Africa Kenya 1990s -0.76 -0.98 -1.21Sub-Saharan Africa Lesotho 1960s 0.59 1.16 1.73Sub-Saharan Africa Lesotho 1970s -1.55 -0.26 1.03Sub-Saharan Africa Lesotho 1980s -1.24 -0.53 0.18Sub-Saharan Africa Lesotho 1990s -1.58 -1.05 -0.52Sub-Saharan Africa Malawi 1960s -1.55 -0.73 0.08Sub-Saharan Africa Malawi 1970s -0.61 0.02 0.65Sub-Saharan Africa Malawi 1980s 0.23 0.07 -0.09Sub-Saharan Africa Malawi 1990s 2.04 1.77 1.49Sub-Saharan Africa Mali 1960s 0.15 0.36 0.56Sub-Saharan Africa Mali 1970s 1.82 1.89 1.95Sub-Saharan Africa Mali 1980s -0.69 -0.57 -0.45Sub-Saharan Africa Mali 1990s 0.99 1.04 1.10Sub-Saharan Africa Mauritious 1960s 0.51 0.27 0.03Sub-Saharan Africa Mauritious 1970s 1.12 1.10 1.09Sub-Saharan Africa Mauritious 1980s 3.73 3.79 3.84Sub-Saharan Africa Mauritious 1990s 1.32 1.61 1.89Sub-Saharan Africa Mozambique 1960s 0.74 1.16 1.59Sub-Saharan Africa Mozambique 1970s -3.90 -3.82 -3.73Sub-Saharan Africa Mozambique 1980s -1.28 -1.35 -1.43Sub-Saharan Africa Mozambique 1990s 2.96 3.09 3.22Sub-Saharan Africa Niger 1960s -2.08 -1.71 -1.34Sub-Saharan Africa Niger 1970s -3.19 -2.88 -2.58Sub-Saharan Africa Niger 1980s -2.21 -2.43 -2.66Sub-Saharan Africa Niger 1990s 0.98 0.56 0.14Sub-Saharan Africa Nigeria 1960s -1.78 -1.39 -1.00Sub-Saharan Africa Nigeria 1970s -3.52 -2.54 -1.57Sub-Saharan Africa Nigeria 1980s -1.69 -1.95 -2.20Sub-Saharan Africa Nigeria 1990s -0.93 -1.01 -1.09Sub-Saharan Africa Rwanda 1960s -1.02 -1.03 -1.04Sub-Saharan Africa Rwanda 1970s -0.16 0.13 0.42Sub-Saharan Africa Rwanda 1980s -4.98 -4.47 -3.95Sub-Saharan Africa Rwanda 1990s -1.54 -1.87 -2.20Sub-Saharan Africa Senegal 1960s 0.40 0.41 0.42Sub-Saharan Africa Senegal 1970s -1.25 -1.21 -1.16
31

Region Country DecadeTFP growth, alpha k=0.5
TFP growth, alpha k=0.4
TFP growth, alpha k=0.3
Sub-Saharan Africa Senegal 1980s 0.75 0.68 0.61Sub-Saharan Africa Senegal 1990s 0.42 0.37 0.32Sub-Saharan Africa South Africa 1960s 1.16 1.47 1.79Sub-Saharan Africa South Africa 1970s -0.49 -0.01 0.47Sub-Saharan Africa South Africa 1980s -2.30 -2.43 -2.56Sub-Saharan Africa South Africa 1990s -0.96 -1.10 -1.24Sub-Saharan Africa Tanzania 1960s 2.80 2.98 3.16Sub-Saharan Africa Tanzania 1970s -0.67 -0.36 -0.06Sub-Saharan Africa Tanzania 1980s 0.03 -0.06 -0.15Sub-Saharan Africa Tanzania 1990s 0.53 0.44 0.35Sub-Saharan Africa Togo 1960s -0.70 0.43 1.56Sub-Saharan Africa Togo 1970s -3.03 -2.36 -1.68Sub-Saharan Africa Togo 1980s -2.08 -2.09 -2.09Sub-Saharan Africa Togo 1990s -0.19 -0.48 -0.78Sub-Saharan Africa Uganda 1960s -0.22 0.03 0.28Sub-Saharan Africa Uganda 1970s -10.07 -10.19 -10.32Sub-Saharan Africa Uganda 1980s 2.60 2.23 1.86Sub-Saharan Africa Uganda 1990s 3.92 3.90 3.88Sub-Saharan Africa Zambia 1960s 0.27 0.36 0.44Sub-Saharan Africa Zambia 1970s -1.25 -1.37 -1.50Sub-Saharan Africa Zambia 1980s 0.23 -0.27 -0.77Sub-Saharan Africa Zambia 1990s -0.73 -1.39 -2.06Sub-Saharan Africa Zimbabwe 1960s 3.42 3.35 3.28Sub-Saharan Africa Zimbabwe 1970s -1.09 -0.91 -0.74Sub-Saharan Africa Zimbabwe 1980s -0.53 -0.95 -1.36Sub-Saharan Africa Zimbabwe 1990s -0.04 -0.04 -0.03
World Average 1960s 0.65 1.05 1.45World Average 1970s -0.72 -0.37 -0.01World Average 1980s -0.86 -0.80 -0.74World Average 1990s 0.22 0.26 0.31
32

LLCook/tt/file_convert/5ae32da17f8b9a7b218cbb48/document.doc
33