Embed Size (px)
Citation preview
13182 | Phys. Chem. Chem. Phys., 2014, 16, 13182--13190 This journal is© the Owner Societies 2014
Cite this:Phys.Chem.Chem.Phys.,
2014, 16, 13182
Nanostructure of an ionic liquid–glycerolmixture†
Thomas Murphy,a Robert Hayes,a Silvia Imberti,b Gregory G. Warrc and Rob Atkin*a
The nanostructure of a 50 : 50 vol% mixture of glycerol and ethylammonium formate (EAF), a protic
ionic liquid (IL), has been investigated using neutron diffraction and empirical potential structure
refinement (EPSR) fits. EPSR fits reveal that the mixture is nanostructured. Electrostatic interactions
between IL charge groups leads to the formation of ionic regions. These solvophobically repel cation
alkyl groups which cluster together to form apolar domains. The polar glycerol molecules are
preferentially incorporated into the charged domains, and form hydrogen bonds with EAF groups rather
than with other glycerol molecules. However, radial distribution functions reveal that glycerol molecules
pack around each other in a fashion similar to that found in pure glycerol. This suggests that a glycerol
channel runs through the ionic domain of EAF. The absence of significant glycerol–glycerol hydrogen
bonding indicates that glycerol molecules are able to span the polar domain, bridging EAF charge
groups. Glycerol can adopt six distinct conformations. The distribution of conformers in the EAF mixture
is very different to that found in the pure liquid because hydrogen bonds form with EAF rather than with
other glycerol molecules, which imparts different packing constraints.
Introduction
ILs are solvents composed entirely of ions, with melting pointsbelow 100 1C.1 ILs often boast an array of desirable physio-chemical properties, including high electrochemical stability,2
high thermal stability,3 low vapour pressure2,4,5 and the abilityto dissolve both organic and inorganic substances.6 ILs are‘designer solvents’ because their properties can be tuned viaalteration of their chemical structures.4,7,8
Many ILs are nanostructured, meaning that the bulk liquid isstructurally inhomogeneous.9–11 IL nanostructure usually arisesdue to the solvophobic segregation of cation alkyl chains.9,10,12–14
IL nanostructure was first predicted by molecular dynamics (MD)simulations15–17 and later confirmed by neutron10 and X-raydiffraction.9 Over the past several years the nanostructure of asuite of ILs has been elucidated,10,12–14 enabling the molecularorigins of nanostructure to be discerned, and structure–propertyrelationships to be explained.
IL nanostructure has attracted considerable research attention. Itinfluences solvent strength,18–20 rheological properties,21–23 inter-facial structure,8,24–27 IL–solid interface tribological properties,28–32
the stability of nanoparticle dispersions in ILs33,34 and the ability of
the IL to support amphiphilic self-assembly.18,19 IL nanostructurecan be used to template the synthesis of structured materials.35,36 Asmany IL applications require the addition of solutes and co-solvents,understanding the interactions and structure of solvent–IL mixturesis thus critical; solvents can induce changes in nanostructure.19,37
The structure and interactions in IL–solvent mixtures hasbeen probed using molecular dynamic simulations,20,38–40
dielectric spectroscopy,41–43 FT-IR,38,44,45 optical Kerr effectspectroscopy,40,46 and X-ray19,47,48 and neutron diffraction.37,49
Solutes added to ILs are solvated by the domain for which theyhave greatest affinity; non-polar solutes are solvated by theuncharged alkyl domains17,19 while polar solutes are solvatedby the ionic regions.17,20,37,39 At low concentrations solutes onlyeffect the IL nanostructure weakly, but at higher concentrationssolutes can have a marked effect on the IL native bulk struc-ture,17,20 leading to one of two outcomes. The solute and the ILcan mix homogeneously,50,51 resulting in a smooth transitionbetween the properties of the IL and solute, or structuralheterogeneity can be retained up to high concentration,37,52
with a step change in properties when the nanostructure isbroken resulting in a homogeneous mixture.
Studies of IL–solvent mixtures have focused largely on aprotic(especially imidazolium) ILs.20,38,40,42,47,53 Comparatively fewstudies have examined protic ionic liquid mixtures19,37,41 despiteapplications including as enzyme stabilisation agents54,55 or forelectrolytes in hydrogen fuel cells.56,57 Previously, the structureof a 1 : 6 mole fraction ethylammonium nitrate (EAN)–watermixture was examined using neutron diffraction coupled with
a Discipline of Chemistry, The University of Newcastle, Callaghan, NSW 2308,
Australia. E-mail: [email protected] STFC, Rutherford Appleton Laboratory, Didcot, UKc School of Chemistry, The University of Sydney, NSW 2006, Australia
† Electronic supplementary information (ESI) available. See DOI: 10.1039/c4cp01570c
Received 11th April 2014,Accepted 20th May 2014
DOI: 10.1039/c4cp01570c
www.rsc.org/pccp
PCCP
PAPER
Ope
n A
cces
s A
rtic
le. P
ublis
hed
on 2
0 M
ay 2
014.
Dow
nloa
ded
on 1
1/17
/202
1 10
:04:
17 A
M.
Thi
s ar
ticle
is li
cens
ed u
nder
a C
reat
ive
Com
mon
s A
ttrib
utio
n-N
onC
omm
erci
al 3
.0 U
npor
ted
Lic
ence
.
View Article OnlineView Journal | View Issue
This journal is© the Owner Societies 2014 Phys. Chem. Chem. Phys., 2014, 16, 13182--13190 | 13183
EPSR simulations.37 Pure EAN has a sponge-like nanostructure12
with alkyl and ionic groups segregated into bicontinuous domainsthroughout the bulk liquid. When water is added, it is incorpo-rated into EAN’s polar domains and interacts with the chargegroups to transform the structure into a locally cylindrical meshmorphology.37 Spatial density functions reveal that the packing ofwater molecules around each other in the mixture is similar topure water, and that packing of EAN ions in the mixture is similarto pure EAN. This revealed that the water and IL formed distinctdomains in the liquid, with a well-defined interface between themconsisting of the nonpolar ethyl groups on one side, and ammo-nium cation, nitrate anion, and water on the other side.37
Glycerol has long been used as a cryoprotective agent.58 Whenadded to water, glycerol prevents the formation of percolatinghydrogen bond networks, hindering the formation of large crystal-lites which would otherwise damage cryopreserved tissues.59 Theliquid structure of pure glycerol, and its mixtures with water, hasbeen elucidated using neutron diffraction and EPSR simulationsby Towey et al.59–61 Neat glycerol adopts one of six distinctmolecular conformations, 83% of which are in the ‘‘ab’’ confor-mation. Addition of water to glycerol at lower concentrations(0.25 mol fraction) has little effect on the interactions betweenglycerol molecules.63 However, when glycerol is the minor com-ponent in water (0.05 mol fraction glycerol), both the preferredglycerol conformation, and the conformer distribution, change.This is attributed to incorporation of glycerol into water’s hydro-gen bonding network in the most energy efficient fashion.61
In this work we examine how glycerol affects protic IL nano-structure. Like water, glycerol has extensive hydrogen bondingcapacity, but glycerol has a much larger molecular volume andsignificant conformational freedom. As the combination ofEAN and glycerol has the potential to form explosive mixtures,ethylammonium formate (EAF) is used in place of EAN.
Experimental
A series of 5 chemically identical, but isotopically different samplesat the same EAF : Gly concentration (50 : 50 vol : vol%) were prepared:H-EAF/H-glycerol (CH3CH2NH3HCO2/HOCH2CH(HO)CH2OH),d3-EAF/d3-glycerol (CH3CH2ND3 HCO2/DOCH2CH(DO)CH2OD),H-EAF/d5-glycerol (CH3CH2NH3HCO2/HOCD2CD(HO)CD2OH),d3-EAF/d8-glycerol (CH3CH2ND3HCO2/DOCD2CD(DO)CD2OD) andd8-EAF/d8-glycerol (CD3CD2ND3HCO2/DOCD2CD(DO)CD2OD). Selec-tive deuteration enables the contribution of different correlations tothe structure factor function, S(q), to be highlighted via contrastvariation.
H-EAF was prepared via the drop-wise addition of formicacid (HCOOH) (Sigma-Aldrich, 95 w/w%) to a chilled solution(o5 1C) of ethylamine (Sigma-Aldrich 70 wt%) and distilledwater. Excess water was removed firstly by rotor evaporation forseveral hours at 25 1C and then under high vacuum conditions.The final water content of the IL was determined to be o0.5%by Karl-Fischer titration.
d3-EAF was synthesised by performing the acid–base reactionin deuterium oxide (D2O (99% Sigma Aldrich)). 1H-NMR
experiments reveal that, on average, 2.5 out of 3 amino hydrogenatoms are replaced with deuterium. d5-EAF and d8-EAF weresynthesised using 1,1,1,2,2-d5-ethylamine (CD3CD2NH2) (CDNisotopes) via the above procedures for H-EAF and d3-EAF respec-tively. Protiated and deuterated samples of anhydrous glycerol(Sigma-Aldrich) were used without additional purification.
Neutron diffraction measurements were performed on theSANDALS instrument at the ISIS research facility, RutherfordAppleton Laboratories, UK. The neutron wavelength range is0.05–4.95 Å, and data was collected over the Q range 0.1 to 50 Å�1.
Samples were contained in chemically inert, null scatteringTi0.68Zr0.32 flat plate cans sealed with PTFE O-rings during theneutron diffraction experiment. The can dimensions are 35 �35 mm2 with a 1 mm path length and 1 mm wall thicknesses ofknown atom density, 0.0541 atoms �3. Prior to loading,diffraction measurements were made on the empty cans, emptyinstrument and a vanadium standard sample for data correc-tion and normalization.
Diffraction experiments were conducted at 298 K undervacuum. The sample chamber was left to equilibrate for 10 minprior to measurements and the temperature was maintained at25 � 0.1 1C by a Julabo FP50 temperature controller. Thecombined weight of the can and sample for each contrast wasmeasured before and after the diffraction measurement to ensureevaporation had not occurred in the vacuum chamber. The netrun time for each system was at least 8 h.
Data analysis was carried out using GUDRUN, as describedin the ATLAS manual.64 This performed corrections includingnormalisation to the incident flux, absorption and multiplescattering corrections, Ti–Zr can subtraction and normalisationto absolute units by dividing the measured differential crosssection by the scattering of a vanadium standard of knownthickness. Corrections for single atom scattering and hydrogeninelasticity were also applied. Fitting to the normalised diffrac-tion data was conducted using empirical potential structurerefinement (EPSR). The optimized three-dimensional geome-tries of both EAF and glycerol have been determined previously.An EPSR model was developed consisting of 500 anions, 500cations and 613 glycerol molecules in a simulation box, con-sistent with the measured diffraction data, and specified phy-sical constraints including molecular structure, samplecomposition, atomic overlaps, and liquid density. Atomic andmolecular translations and rotations were governed by thestandard rules for a Monte Carlo simulation with respect to areference potential of Lennard-Jones plus Coulombic interac-tions. The potential was refined via an iterative algorithm untilconvergence between the simulated and experimental structurefactors was reached. All five EAF/glycerol contrasts weremodelled simultaneously, normalising for isotope populations.
Results and discussion
Neutron diffraction spectra were obtained for five isotopomeric50 : 50 vol% mixtures of EAF and glycerol, and EPSR simulationsperformed to fit the diffraction data. The structures of EAF and
Paper PCCP
Ope
n A
cces
s A
rtic
le. P
ublis
hed
on 2
0 M
ay 2
014.
Dow
nloa
ded
on 1
1/17
/202
1 10
:04:
17 A
M.
Thi
s ar
ticle
is li
cens
ed u
nder
a C
reat
ive
Com
mon
s A
ttrib
utio
n-N
onC
omm
erci
al 3
.0 U
npor
ted
Lic
ence
.View Article Online
13184 | Phys. Chem. Chem. Phys., 2014, 16, 13182--13190 This journal is© the Owner Societies 2014
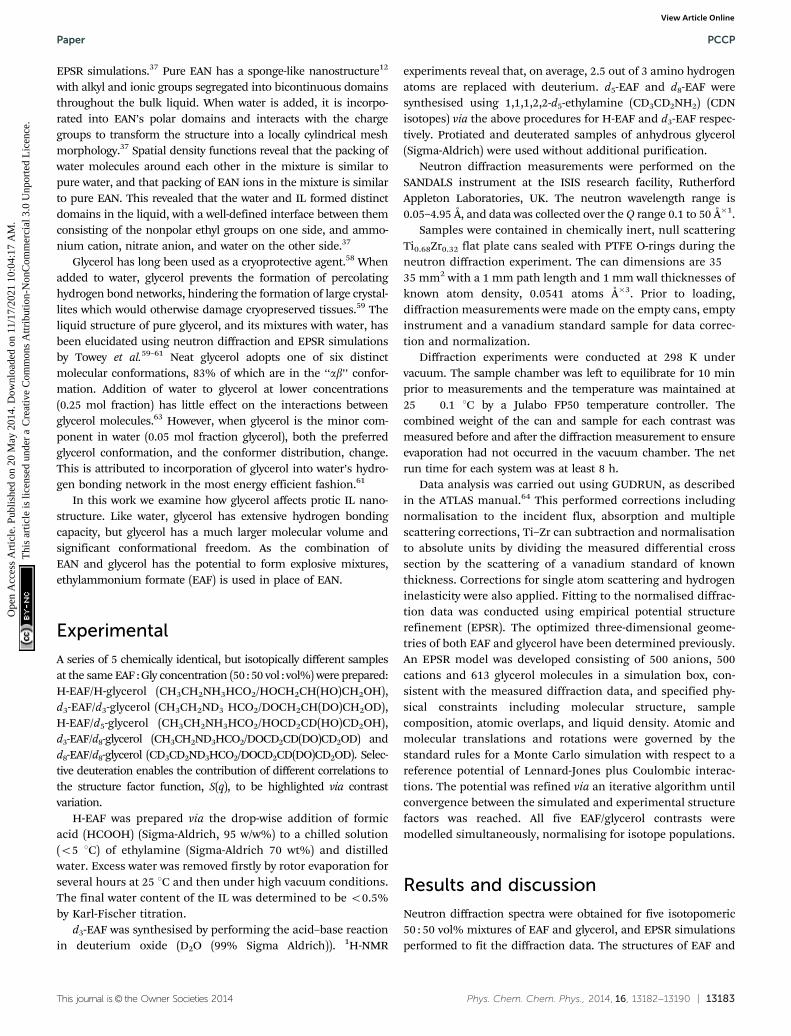
glycerol, and the labels used to identify specific atoms, are shownin Fig. 1. The Lennard-Jones parameters for EAF and glycerol60
used in the fitting routine have been published previously.The experimental diffraction data and EPSR fits for the five
50 : 50 vol% EAF–glycerol contrasts examined are shown inFig. 2. Unequivocally assigning diffraction peaks in ILs is oftenproblematic because multiple atom–atom correlations contri-bute to the structure factor function, S(q).65 However, forneutron based experiments contrast variation enables extrac-tion of detailed structural information.66 For the systemsstudied here, the isotopically pure contrasts, H-EAF + H-glycerol and d8-EAF + d8-glycerol, produce dissimilar spectrabecause scattering lengths of H and D are different. Systematicsubstitution of hydrogen for deuterium in ethylammonium andglycerol emphasise the contribution of different correlationlengths to S(q). The d3-EAF + d3-glycerol contrast emphasisescorrelations between exchangeable hydrogens in the mixture,the H-EAF + d5-glycerol contrast highlights correlationsbetween glycerol alkyl chains, and the d3-EAF + d8-glycerolcontrast probes interactions between glycerol molecules andthe ionic regions of EAF. In EPSR, all of these spectra are fitsimultaneously using the same model of the liquid structure.This provides confidence that the model is correct.
A striking feature of the diffraction spectra in Fig. 2 is thepresence of low-Q peaks. These occur at 0.6 Å�1 in both H-EAF +d5-glycerol and d3-EAF + d8-glycerol and at B0.85 Å�1 for d3-EAF +d3-glycerol. These peak positions correspond to repeat spacingsof 10.5 Å and B7.4 Å respectively. Additionally, all five spectrafeature a peak at B1.5 � 0.1 Å�1, consistent with a repeatspacing of B4 Å. The molecular dimensions of EAF and glycerol(from the pure liquid densities67) are 5.0 Å and 5.3 Å, respec-tively. While the 4 Å could be due to short range ion–ion, or ion–
glycerol correlations, the larger 10.5 Å and 7.4 Å distancesclearly indicate the presence of larger scale nanostructure inthis mixture.
In pure ILs, low Q peaks in both neutron diffraction andX-ray scattering spectra11–13,68–71 indicate intermediate-rangeorder resulting from the bulk IL self-assembled nanostruc-ture.9–13,70 Partial structure factor analysis72 and moleculardynamic simulations73–75 have elucidated the origin of the firstpeak in aprotic and protic ILs. In pure EAF the first peak is at0.625 Å�1, corresponding to a repeat spacing of 10.1 Å,76
slightly less than the 10.5 Å spacing found in the EAF–glycerolmixture. As such, the larger repeat spacing in the mixture isbroadly consistent with glycerol swelling the pre-existing EAFsponge structure, rather than the EAF nanostructure beingbroken to form a homogenous mixture, which would result inthe low Q peak disappearing. However, from the scattering dataalone it is not possible to tell how glycerol and EAF packtogether to produce a self-assembled structure. To resolve theseissues, EPSR fits to the diffraction data have been performed,and are shown as solid lines in Fig. 2. Excellent agreementbetween the data and fits is obtained across the entire angular(Q) range. The very slight deviations between the data and fit atlow Q is attributed to residual inelastic scattering.
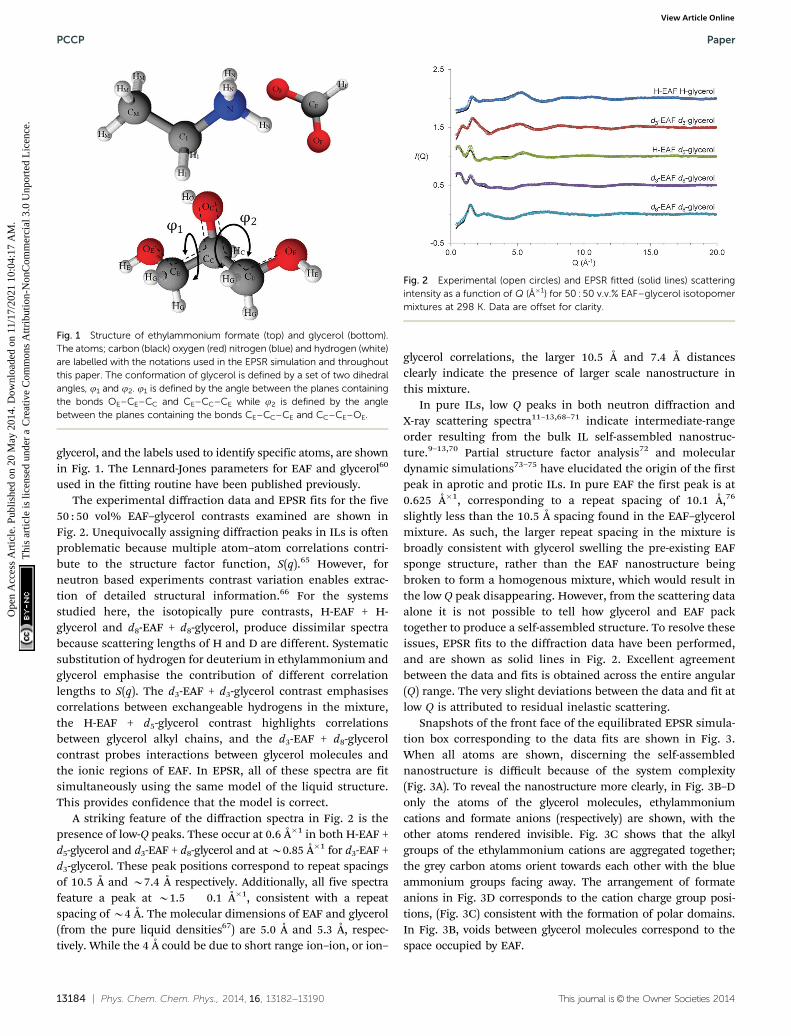
Snapshots of the front face of the equilibrated EPSR simula-tion box corresponding to the data fits are shown in Fig. 3.When all atoms are shown, discerning the self-assemblednanostructure is difficult because of the system complexity(Fig. 3A). To reveal the nanostructure more clearly, in Fig. 3B–Donly the atoms of the glycerol molecules, ethylammoniumcations and formate anions (respectively) are shown, with theother atoms rendered invisible. Fig. 3C shows that the alkylgroups of the ethylammonium cations are aggregated together;the grey carbon atoms orient towards each other with the blueammonium groups facing away. The arrangement of formateanions in Fig. 3D corresponds to the cation charge group posi-tions, (Fig. 3C) consistent with the formation of polar domains.In Fig. 3B, voids between glycerol molecules correspond to thespace occupied by EAF.
Fig. 1 Structure of ethylammonium formate (top) and glycerol (bottom).The atoms; carbon (black) oxygen (red) nitrogen (blue) and hydrogen (white)are labelled with the notations used in the EPSR simulation and throughoutthis paper. The conformation of glycerol is defined by a set of two dihedralangles, j1 and j2. j1 is defined by the angle between the planes containingthe bonds OE–CE–CC and CE–CC–CE while j2 is defined by the anglebetween the planes containing the bonds CE–CC–CE and CC–CE–OE.
Fig. 2 Experimental (open circles) and EPSR fitted (solid lines) scatteringintensity as a function of Q (Å�1) for 50 : 50 v.v.% EAF–glycerol isotopomermixtures at 298 K. Data are offset for clarity.
PCCP Paper
Ope
n A
cces
s A
rtic
le. P
ublis
hed
on 2
0 M
ay 2
014.
Dow
nloa
ded
on 1
1/17
/202
1 10
:04:
17 A
M.
Thi
s ar
ticle
is li
cens
ed u
nder
a C
reat
ive
Com
mon
s A
ttrib
utio
n-N
onC
omm
erci
al 3
.0 U
npor
ted
Lic
ence
.View Article Online
This journal is© the Owner Societies 2014 Phys. Chem. Chem. Phys., 2014, 16, 13182--13190 | 13185
The alkyl chain clustering noted in Fig. 3C suggests thatsolvophobic self-assembly occurs in the EAF–glycerol mixture, asper pure EAF, to create an apolar domain. The remainder of theliquid volume consists of EAF charged groups and the glycerolmolecules, forming a polar domain, cf. Fig. 3E. The periodicorder in these well-defined regions produces the low Q (largecorrelation length) peaks in the diffraction data. In the mixture,the volume fraction ratio of the polar domain to the apolardomain, based on liquid densities,67 is 0.73 : 0.27 whereas inpure EAF, it is 0.44 : 0.56. Simply swelling the polar domains of abicontinuous nanostructure with a sponge-like morphologywould shift the low Q peak down by the swelling ratio to around0.4 Å�1, or a repeat spacing of 16–17 Å. Accommodating thismarked increase in the polar domain volume and the smallchange in primary peak position observed requires a change inliquid nanostructure so that the ‘‘interface’’ between the twodomains becomes more curved.37 The manner in which the ions
arrange around each other to facilitate this change is elucidatedusing radial distribution functions, gij(r), and spatial densityfunction (SDF) plots determined from the EPSR simulation box.
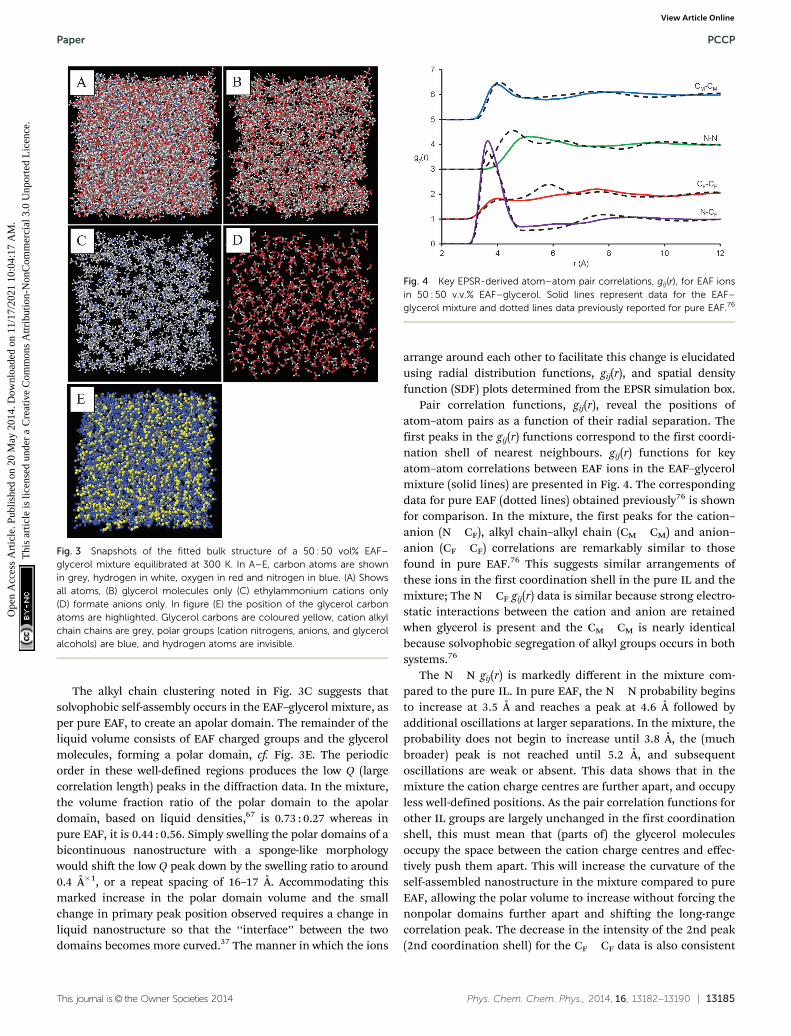
Pair correlation functions, gij(r), reveal the positions ofatom–atom pairs as a function of their radial separation. Thefirst peaks in the gij(r) functions correspond to the first coordi-nation shell of nearest neighbours. gij(r) functions for keyatom–atom correlations between EAF ions in the EAF–glycerolmixture (solid lines) are presented in Fig. 4. The correspondingdata for pure EAF (dotted lines) obtained previously76 is shownfor comparison. In the mixture, the first peaks for the cation–anion (N� � �CF), alkyl chain–alkyl chain (CM� � �CM) and anion–anion (CF� � �CF) correlations are remarkably similar to thosefound in pure EAF.76 This suggests similar arrangements ofthese ions in the first coordination shell in the pure IL and themixture; The N� � �CF gij(r) data is similar because strong electro-static interactions between the cation and anion are retainedwhen glycerol is present and the CM� � �CM is nearly identicalbecause solvophobic segregation of alkyl groups occurs in bothsystems.76
The N� � �N gij(r) is markedly different in the mixture com-pared to the pure IL. In pure EAF, the N� � �N probability beginsto increase at 3.5 Å and reaches a peak at 4.6 Å followed byadditional oscillations at larger separations. In the mixture, theprobability does not begin to increase until 3.8 Å, the (muchbroader) peak is not reached until 5.2 Å, and subsequentoscillations are weak or absent. This data shows that in themixture the cation charge centres are further apart, and occupyless well-defined positions. As the pair correlation functions forother IL groups are largely unchanged in the first coordinationshell, this must mean that (parts of) the glycerol moleculesoccupy the space between the cation charge centres and effec-tively push them apart. This will increase the curvature of theself-assembled nanostructure in the mixture compared to pureEAF, allowing the polar volume to increase without forcing thenonpolar domains further apart and shifting the long-rangecorrelation peak. The decrease in the intensity of the 2nd peak(2nd coordination shell) for the CF� � �CF data is also consistent
Fig. 3 Snapshots of the fitted bulk structure of a 50 : 50 vol% EAF–glycerol mixture equilibrated at 300 K. In A–E, carbon atoms are shownin grey, hydrogen in white, oxygen in red and nitrogen in blue. (A) Showsall atoms, (B) glycerol molecules only (C) ethylammonium cations only(D) formate anions only. In figure (E) the position of the glycerol carbonatoms are highlighted. Glycerol carbons are coloured yellow, cation alkylchain chains are grey, polar groups (cation nitrogens, anions, and glycerolalcohols) are blue, and hydrogen atoms are invisible.
Fig. 4 Key EPSR-derived atom–atom pair correlations, gij(r), for EAF ionsin 50 : 50 v.v.% EAF–glycerol. Solid lines represent data for the EAF–glycerol mixture and dotted lines data previously reported for pure EAF.76
Paper PCCP
Ope
n A
cces
s A
rtic
le. P
ublis
hed
on 2
0 M
ay 2
014.
Dow
nloa
ded
on 1
1/17
/202
1 10
:04:
17 A
M.
Thi
s ar
ticle
is li
cens
ed u
nder
a C
reat
ive
Com
mon
s A
ttrib
utio
n-N
onC
omm
erci
al 3
.0 U
npor
ted
Lic
ence
.View Article Online
13186 | Phys. Chem. Chem. Phys., 2014, 16, 13182--13190 This journal is© the Owner Societies 2014
with increased curvature, as anions interacting electrostaticallywith the ‘‘next’’ cation are further away than in the pure liquid.A similar change in the N� � �N gij(r) was noted when water wasadded to EAN.37
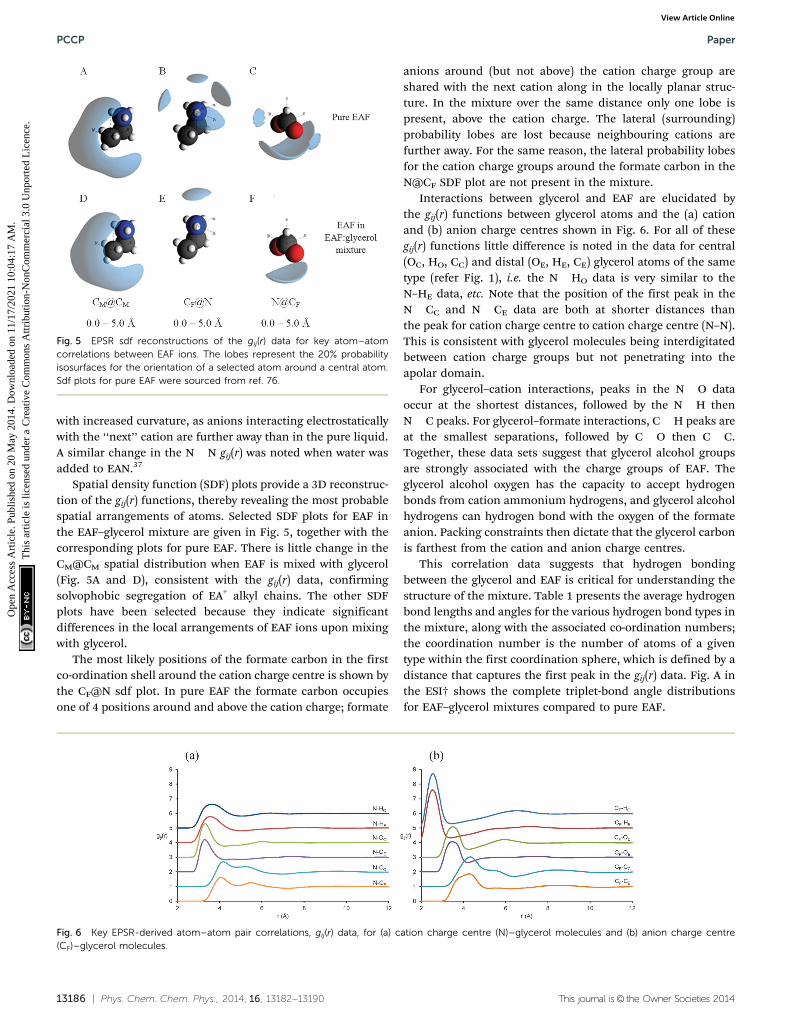
Spatial density function (SDF) plots provide a 3D reconstruc-tion of the gij(r) functions, thereby revealing the most probablespatial arrangements of atoms. Selected SDF plots for EAF inthe EAF–glycerol mixture are given in Fig. 5, together with thecorresponding plots for pure EAF. There is little change in theCM@CM spatial distribution when EAF is mixed with glycerol(Fig. 5A and D), consistent with the gij(r) data, confirmingsolvophobic segregation of EA+ alkyl chains. The other SDFplots have been selected because they indicate significantdifferences in the local arrangements of EAF ions upon mixingwith glycerol.
The most likely positions of the formate carbon in the firstco-ordination shell around the cation charge centre is shown bythe CF@N sdf plot. In pure EAF the formate carbon occupiesone of 4 positions around and above the cation charge; formate
anions around (but not above) the cation charge group areshared with the next cation along in the locally planar struc-ture. In the mixture over the same distance only one lobe ispresent, above the cation charge. The lateral (surrounding)probability lobes are lost because neighbouring cations arefurther away. For the same reason, the lateral probability lobesfor the cation charge groups around the formate carbon in theN@CF SDF plot are not present in the mixture.
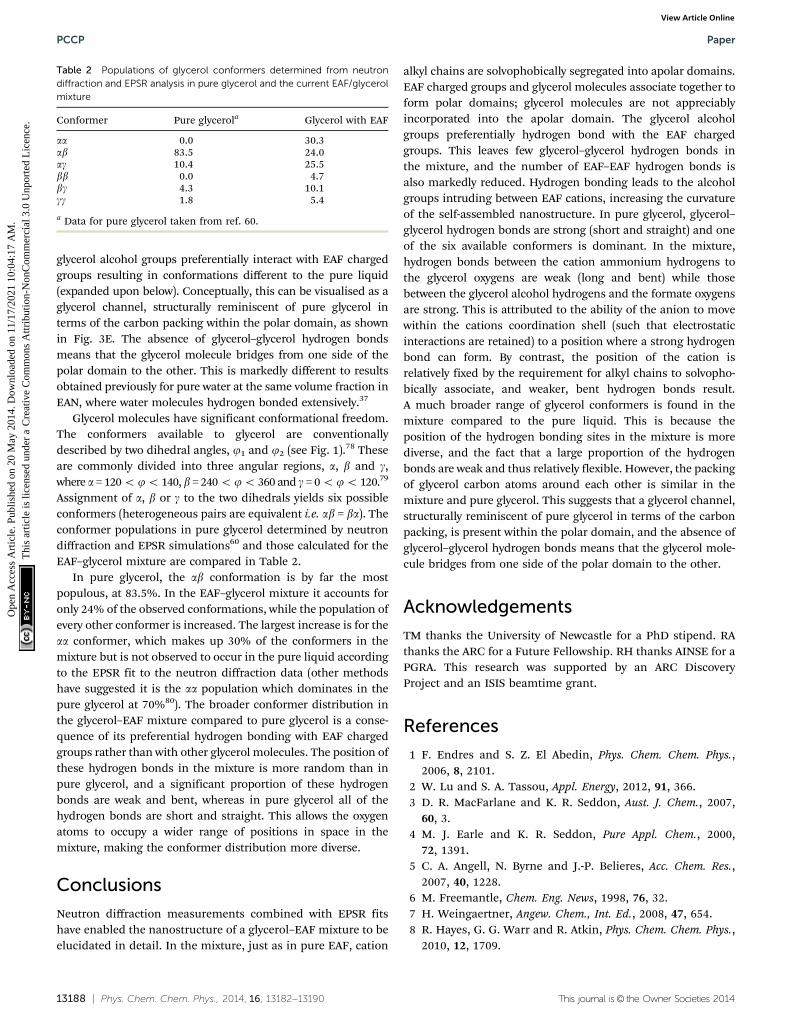
Interactions between glycerol and EAF are elucidated bythe gij(r) functions between glycerol atoms and the (a) cationand (b) anion charge centres shown in Fig. 6. For all of thesegij(r) functions little difference is noted in the data for central(OC, HO, CC) and distal (OE, HE, CE) glycerol atoms of the sametype (refer Fig. 1), i.e. the N� � �HO data is very similar to theN–HE data, etc. Note that the position of the first peak in theN� � �CC and N� � �CE data are both at shorter distances thanthe peak for cation charge centre to cation charge centre (N–N).This is consistent with glycerol molecules being interdigitatedbetween cation charge groups but not penetrating into theapolar domain.
For glycerol–cation interactions, peaks in the N� � �O dataoccur at the shortest distances, followed by the N� � �H thenN� � �C peaks. For glycerol–formate interactions, C� � �H peaks areat the smallest separations, followed by C� � �O then C� � �C.Together, these data sets suggest that glycerol alcohol groupsare strongly associated with the charge groups of EAF. Theglycerol alcohol oxygen has the capacity to accept hydrogenbonds from cation ammonium hydrogens, and glycerol alcoholhydrogens can hydrogen bond with the oxygen of the formateanion. Packing constraints then dictate that the glycerol carbonis farthest from the cation and anion charge centres.
This correlation data suggests that hydrogen bondingbetween the glycerol and EAF is critical for understanding thestructure of the mixture. Table 1 presents the average hydrogenbond lengths and angles for the various hydrogen bond types inthe mixture, along with the associated co-ordination numbers;the coordination number is the number of atoms of a giventype within the first coordination sphere, which is defined by adistance that captures the first peak in the gij(r) data. Fig. A inthe ESI† shows the complete triplet-bond angle distributionsfor EAF–glycerol mixtures compared to pure EAF.
Fig. 5 EPSR sdf reconstructions of the gij(r) data for key atom–atomcorrelations between EAF ions. The lobes represent the 20% probabilityisosurfaces for the orientation of a selected atom around a central atom.Sdf plots for pure EAF were sourced from ref. 76.
Fig. 6 Key EPSR-derived atom–atom pair correlations, gij(r) data, for (a) cation charge centre (N)–glycerol molecules and (b) anion charge centre(CF)–glycerol molecules.
PCCP Paper
Ope
n A
cces
s A
rtic
le. P
ublis
hed
on 2
0 M
ay 2
014.
Dow
nloa
ded
on 1
1/17
/202
1 10
:04:
17 A
M.
Thi
s ar
ticle
is li
cens
ed u
nder
a C
reat
ive
Com
mon
s A
ttrib
utio
n-N
onC
omm
erci
al 3
.0 U
npor
ted
Lic
ence
.View Article Online

This journal is© the Owner Societies 2014 Phys. Chem. Chem. Phys., 2014, 16, 13182--13190 | 13187
Form the coordination numbers in Table 1, EAF–glycerolhydrogen bonds occur most frequently in the mixture. Whenmultiple hydrogen bonds of the same types are accountedfor (e.g. there are two OE atoms for each glycerol), there are11 glycerol–EAF hydrogen bonds and 6.8 EAF–EAF hydrogenbonds for each glycerol–glycerol hydrogen bond.
In pure EAF,14 hydrogen bonds are long (42 Å) andpredominately bent (o1651).77 The situation is the same forEAF–EAF hydrogen bonds in the EAF glycerol mixture, but thecoordination number is reduced substantially from 2.6714 to1.53. In pure glycerol, hydrogen bonds are short, straight andsimple,62 meaning that the coordination numbers of alcoholhydrogens and oxygens with each other are near 1. In theglycerol–EAF mixture, hydrogen bonds remain short andstraight, but the co-ordination numbers are drastically reducedto B0.1, meaning that each glycerol alcohol hydrogen has onaverage only 0.1 coordinated glycerol alcohol oxygens, and viceversa. That is, in the mixture, glycerol–glycerol hydrogen bondsare almost absent, and EAF–EAF hydrogen bonding is B50%reduced. Both have been replaced by glycerol–EAF hydrogenbonds, consistent with the gij(r) functions, cf. Table 1.
There are two main types of hydrogen bonding between theEAF and the glycerol. Glycerol can act as a hydrogen bondacceptor (to the alcohol oxygen) and form a hydrogen bond withthe cation ammonium hydrogen (HN� � �OE and HN� � �OC). Alter-natively, glycerol can donate a hydrogen bond from its alcohol
hydrogens to the anion oxygen (HE� � �OF and HO� � �OF). Whenglycerol acts an acceptor, the resulting hydrogen bond is long andbent, similar to those formed in pure EAF, but when glycerol actsas a donor, the hydrogen bond is strong and straight, like in pureglycerol. This is likely because solvophobic segregation meansthat the position of the cation in the nanostructure is moreconstrained than the anion. As such, the anion is free to move toa position where a strong straight hydrogen bond can form withglycerol, but the (relative) immobility of the cation results in abent, weak hydrogen bond. The coordination number associatedwith the weak, bent hydrogen bonds is 1.97 (1.34 + 0.63) and withthe strong straight bonds is 1.30 (0.87 + 0.43).
Finally, we turn to the spatial arrangement and conformationof glycerol in the mixture. Fig. 7 shows key glycerol–glycerol gij(r)distributions in the mixture, along with those reported previouslyfor the pure liquid.60 The glycerol C� � �C correlations in the glycerolEAF mixture are extremely similar to those for pure glycerol. Thismeans that, relative to each other, the glycerol carbon atomsoccupy spatially similar positions in the mixture and the pureliquid, i.e. the carbon atoms are arranged in a similar fashion.However, the first O� � �O correlation peaks have significantlyreduced intensities in the mixture compared to the pure liquid.This is because most of the glycerol–glycerol hydrogen bonds havebeen replaced by glycerol–EAF hydrogen bonds, cf. Table 1.
The picture emerging is that glycerol carbon atoms are packedtogether in a fashion similar to that in pure glycerol, but that
Table 1 Average hydrogen bond lengths, hydrogen bond angles, coordination numbers and hydrogen bond classification for hydrogen bonds formedup to a distance b, capturing first peak in the corresponding gij(r) data. Hydrogen bond lengths and angles contained in parentheses are the previouslyreported values for pure EAF14 and pure glycerol62
Hydrogen bond Length (Å) Angle (1) Coord. number (b/Å) Classification
EAF–EAF HN–OF 2.43 (2.43) 109 (109) 1.53 � 1.39 (3.25) Long/bent
EAF–Gly HN–OE 2.61 109 1.34 � 0.96 (3.60) Long/bentHN–OC 2.55 109 0.63 � 0.69 (3.60) Long/bentHE–OF 1.65 175 0.87 � 0.81 (2.30) Short/straightHO–OF 1.65 175 0.43 � 0.60 (2.30) Short/straight
Gly–Gly HE–OE 1.83 (1.80) 175 (175) 0.16 � 0.37 (2.30) Short/straightHE–OC 1.83 (1.80) 175 (175) 0.08 � 0.26 (2.30) Short/straightHO–OE 1.83 (1.80) 175 (175) 0.12 � 0.33 (2.30) Short/straightHO–OC 1.83 (1.80) 175 (175) 0.08 � 0.27 (2.30) Short/straight
Fig. 7 Key EPSR-derived atom–atom pair correlations, gij(r) data, for (a) glycerol C–C correlations and (b) O–O correlations in a 50 : 50.vol%EAF/glycerol mixture. Solid lines represent data for the EAF–glycerol mixture and dotted lines data previously reported for pure glycerol.60
Paper PCCP
Ope
n A
cces
s A
rtic
le. P
ublis
hed
on 2
0 M
ay 2
014.
Dow
nloa
ded
on 1
1/17
/202
1 10
:04:
17 A
M.
Thi
s ar
ticle
is li
cens
ed u
nder
a C
reat
ive
Com
mon
s A
ttrib
utio
n-N
onC
omm
erci
al 3
.0 U
npor
ted
Lic
ence
.View Article Online
13188 | Phys. Chem. Chem. Phys., 2014, 16, 13182--13190 This journal is© the Owner Societies 2014
glycerol alcohol groups preferentially interact with EAF chargedgroups resulting in conformations different to the pure liquid(expanded upon below). Conceptually, this can be visualised as aglycerol channel, structurally reminiscent of pure glycerol interms of the carbon packing within the polar domain, as shownin Fig. 3E. The absence of glycerol–glycerol hydrogen bondsmeans that the glycerol molecule bridges from one side of thepolar domain to the other. This is markedly different to resultsobtained previously for pure water at the same volume fraction inEAN, where water molecules hydrogen bonded extensively.37
Glycerol molecules have significant conformational freedom.The conformers available to glycerol are conventionallydescribed by two dihedral angles, j1 and j2 (see Fig. 1).78 Theseare commonly divided into three angular regions, a, b and g,where a = 120ojo 140, b = 240ojo 360 and g = 0ojo 120.79
Assignment of a, b or g to the two dihedrals yields six possibleconformers (heterogeneous pairs are equivalent i.e. ab = ba). Theconformer populations in pure glycerol determined by neutrondiffraction and EPSR simulations60 and those calculated for theEAF–glycerol mixture are compared in Table 2.
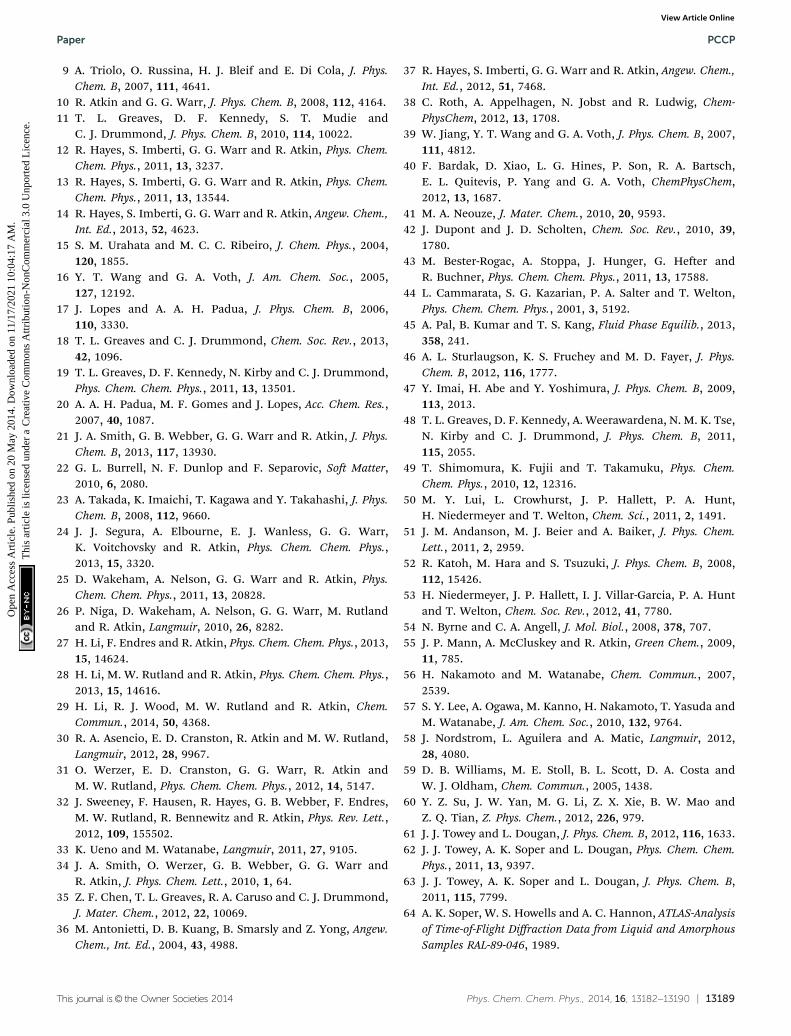
In pure glycerol, the ab conformation is by far the mostpopulous, at 83.5%. In the EAF–glycerol mixture it accounts foronly 24% of the observed conformations, while the population ofevery other conformer is increased. The largest increase is for theaa conformer, which makes up 30% of the conformers in themixture but is not observed to occur in the pure liquid accordingto the EPSR fit to the neutron diffraction data (other methodshave suggested it is the aa population which dominates in thepure glycerol at 70%80). The broader conformer distribution inthe glycerol–EAF mixture compared to pure glycerol is a conse-quence of its preferential hydrogen bonding with EAF chargedgroups rather than with other glycerol molecules. The position ofthese hydrogen bonds in the mixture is more random than inpure glycerol, and a significant proportion of these hydrogenbonds are weak and bent, whereas in pure glycerol all of thehydrogen bonds are short and straight. This allows the oxygenatoms to occupy a wider range of positions in space in themixture, making the conformer distribution more diverse.
Conclusions
Neutron diffraction measurements combined with EPSR fitshave enabled the nanostructure of a glycerol–EAF mixture to beelucidated in detail. In the mixture, just as in pure EAF, cation
alkyl chains are solvophobically segregated into apolar domains.EAF charged groups and glycerol molecules associate together toform polar domains; glycerol molecules are not appreciablyincorporated into the apolar domain. The glycerol alcoholgroups preferentially hydrogen bond with the EAF chargedgroups. This leaves few glycerol–glycerol hydrogen bonds inthe mixture, and the number of EAF–EAF hydrogen bonds isalso markedly reduced. Hydrogen bonding leads to the alcoholgroups intruding between EAF cations, increasing the curvatureof the self-assembled nanostructure. In pure glycerol, glycerol–glycerol hydrogen bonds are strong (short and straight) and oneof the six available conformers is dominant. In the mixture,hydrogen bonds between the cation ammonium hydrogens tothe glycerol oxygens are weak (long and bent) while thosebetween the glycerol alcohol hydrogens and the formate oxygensare strong. This is attributed to the ability of the anion to movewithin the cations coordination shell (such that electrostaticinteractions are retained) to a position where a strong hydrogenbond can form. By contrast, the position of the cation isrelatively fixed by the requirement for alkyl chains to solvopho-bically associate, and weaker, bent hydrogen bonds result.A much broader range of glycerol conformers is found in themixture compared to the pure liquid. This is because theposition of the hydrogen bonding sites in the mixture is morediverse, and the fact that a large proportion of the hydrogenbonds are weak and thus relatively flexible. However, the packingof glycerol carbon atoms around each other is similar in themixture and pure glycerol. This suggests that a glycerol channel,structurally reminiscent of pure glycerol in terms of the carbonpacking, is present within the polar domain, and the absence ofglycerol–glycerol hydrogen bonds means that the glycerol mole-cule bridges from one side of the polar domain to the other.
Acknowledgements
TM thanks the University of Newcastle for a PhD stipend. RAthanks the ARC for a Future Fellowship. RH thanks AINSE for aPGRA. This research was supported by an ARC DiscoveryProject and an ISIS beamtime grant.
References
1 F. Endres and S. Z. El Abedin, Phys. Chem. Chem. Phys.,2006, 8, 2101.
2 W. Lu and S. A. Tassou, Appl. Energy, 2012, 91, 366.3 D. R. MacFarlane and K. R. Seddon, Aust. J. Chem., 2007,
60, 3.4 M. J. Earle and K. R. Seddon, Pure Appl. Chem., 2000,
72, 1391.5 C. A. Angell, N. Byrne and J.-P. Belieres, Acc. Chem. Res.,
2007, 40, 1228.6 M. Freemantle, Chem. Eng. News, 1998, 76, 32.7 H. Weingaertner, Angew. Chem., Int. Ed., 2008, 47, 654.8 R. Hayes, G. G. Warr and R. Atkin, Phys. Chem. Chem. Phys.,
2010, 12, 1709.
Table 2 Populations of glycerol conformers determined from neutrondiffraction and EPSR analysis in pure glycerol and the current EAF/glycerolmixture
Conformer Pure glycerola Glycerol with EAF
aa 0.0 30.3ab 83.5 24.0ag 10.4 25.5bb 0.0 4.7bg 4.3 10.1gg 1.8 5.4
a Data for pure glycerol taken from ref. 60.
PCCP Paper
Ope
n A
cces
s A
rtic
le. P
ublis
hed
on 2
0 M
ay 2
014.
Dow
nloa
ded
on 1
1/17
/202
1 10
:04:
17 A
M.
Thi
s ar
ticle
is li
cens
ed u
nder
a C
reat
ive
Com
mon
s A
ttrib
utio
n-N
onC
omm
erci
al 3
.0 U
npor
ted
Lic
ence
.View Article Online
This journal is© the Owner Societies 2014 Phys. Chem. Chem. Phys., 2014, 16, 13182--13190 | 13189
9 A. Triolo, O. Russina, H. J. Bleif and E. Di Cola, J. Phys.Chem. B, 2007, 111, 4641.
10 R. Atkin and G. G. Warr, J. Phys. Chem. B, 2008, 112, 4164.11 T. L. Greaves, D. F. Kennedy, S. T. Mudie and
C. J. Drummond, J. Phys. Chem. B, 2010, 114, 10022.12 R. Hayes, S. Imberti, G. G. Warr and R. Atkin, Phys. Chem.
Chem. Phys., 2011, 13, 3237.13 R. Hayes, S. Imberti, G. G. Warr and R. Atkin, Phys. Chem.
Chem. Phys., 2011, 13, 13544.14 R. Hayes, S. Imberti, G. G. Warr and R. Atkin, Angew. Chem.,
Int. Ed., 2013, 52, 4623.15 S. M. Urahata and M. C. C. Ribeiro, J. Chem. Phys., 2004,
120, 1855.16 Y. T. Wang and G. A. Voth, J. Am. Chem. Soc., 2005,
127, 12192.17 J. Lopes and A. A. H. Padua, J. Phys. Chem. B, 2006,
110, 3330.18 T. L. Greaves and C. J. Drummond, Chem. Soc. Rev., 2013,
42, 1096.19 T. L. Greaves, D. F. Kennedy, N. Kirby and C. J. Drummond,
Phys. Chem. Chem. Phys., 2011, 13, 13501.20 A. A. H. Padua, M. F. Gomes and J. Lopes, Acc. Chem. Res.,
2007, 40, 1087.21 J. A. Smith, G. B. Webber, G. G. Warr and R. Atkin, J. Phys.
Chem. B, 2013, 117, 13930.22 G. L. Burrell, N. F. Dunlop and F. Separovic, Soft Matter,
2010, 6, 2080.23 A. Takada, K. Imaichi, T. Kagawa and Y. Takahashi, J. Phys.
Chem. B, 2008, 112, 9660.24 J. J. Segura, A. Elbourne, E. J. Wanless, G. G. Warr,
K. Voitchovsky and R. Atkin, Phys. Chem. Chem. Phys.,2013, 15, 3320.
25 D. Wakeham, A. Nelson, G. G. Warr and R. Atkin, Phys.Chem. Chem. Phys., 2011, 13, 20828.
26 P. Niga, D. Wakeham, A. Nelson, G. G. Warr, M. Rutlandand R. Atkin, Langmuir, 2010, 26, 8282.
27 H. Li, F. Endres and R. Atkin, Phys. Chem. Chem. Phys., 2013,15, 14624.
28 H. Li, M. W. Rutland and R. Atkin, Phys. Chem. Chem. Phys.,2013, 15, 14616.
29 H. Li, R. J. Wood, M. W. Rutland and R. Atkin, Chem.Commun., 2014, 50, 4368.
30 R. A. Asencio, E. D. Cranston, R. Atkin and M. W. Rutland,Langmuir, 2012, 28, 9967.
31 O. Werzer, E. D. Cranston, G. G. Warr, R. Atkin andM. W. Rutland, Phys. Chem. Chem. Phys., 2012, 14, 5147.
32 J. Sweeney, F. Hausen, R. Hayes, G. B. Webber, F. Endres,M. W. Rutland, R. Bennewitz and R. Atkin, Phys. Rev. Lett.,2012, 109, 155502.
33 K. Ueno and M. Watanabe, Langmuir, 2011, 27, 9105.34 J. A. Smith, O. Werzer, G. B. Webber, G. G. Warr and
R. Atkin, J. Phys. Chem. Lett., 2010, 1, 64.35 Z. F. Chen, T. L. Greaves, R. A. Caruso and C. J. Drummond,
J. Mater. Chem., 2012, 22, 10069.36 M. Antonietti, D. B. Kuang, B. Smarsly and Z. Yong, Angew.
Chem., Int. Ed., 2004, 43, 4988.
37 R. Hayes, S. Imberti, G. G. Warr and R. Atkin, Angew. Chem.,Int. Ed., 2012, 51, 7468.
38 C. Roth, A. Appelhagen, N. Jobst and R. Ludwig, Chem-PhysChem, 2012, 13, 1708.
39 W. Jiang, Y. T. Wang and G. A. Voth, J. Phys. Chem. B, 2007,111, 4812.
40 F. Bardak, D. Xiao, L. G. Hines, P. Son, R. A. Bartsch,E. L. Quitevis, P. Yang and G. A. Voth, ChemPhysChem,2012, 13, 1687.
41 M. A. Neouze, J. Mater. Chem., 2010, 20, 9593.42 J. Dupont and J. D. Scholten, Chem. Soc. Rev., 2010, 39,
1780.43 M. Bester-Rogac, A. Stoppa, J. Hunger, G. Hefter and
R. Buchner, Phys. Chem. Chem. Phys., 2011, 13, 17588.44 L. Cammarata, S. G. Kazarian, P. A. Salter and T. Welton,
Phys. Chem. Chem. Phys., 2001, 3, 5192.45 A. Pal, B. Kumar and T. S. Kang, Fluid Phase Equilib., 2013,
358, 241.46 A. L. Sturlaugson, K. S. Fruchey and M. D. Fayer, J. Phys.
Chem. B, 2012, 116, 1777.47 Y. Imai, H. Abe and Y. Yoshimura, J. Phys. Chem. B, 2009,
113, 2013.48 T. L. Greaves, D. F. Kennedy, A. Weerawardena, N. M. K. Tse,
N. Kirby and C. J. Drummond, J. Phys. Chem. B, 2011,115, 2055.
49 T. Shimomura, K. Fujii and T. Takamuku, Phys. Chem.Chem. Phys., 2010, 12, 12316.
50 M. Y. Lui, L. Crowhurst, J. P. Hallett, P. A. Hunt,H. Niedermeyer and T. Welton, Chem. Sci., 2011, 2, 1491.
51 J. M. Andanson, M. J. Beier and A. Baiker, J. Phys. Chem.Lett., 2011, 2, 2959.
52 R. Katoh, M. Hara and S. Tsuzuki, J. Phys. Chem. B, 2008,112, 15426.
53 H. Niedermeyer, J. P. Hallett, I. J. Villar-Garcia, P. A. Huntand T. Welton, Chem. Soc. Rev., 2012, 41, 7780.
54 N. Byrne and C. A. Angell, J. Mol. Biol., 2008, 378, 707.55 J. P. Mann, A. McCluskey and R. Atkin, Green Chem., 2009,
11, 785.56 H. Nakamoto and M. Watanabe, Chem. Commun., 2007,
2539.57 S. Y. Lee, A. Ogawa, M. Kanno, H. Nakamoto, T. Yasuda and
M. Watanabe, J. Am. Chem. Soc., 2010, 132, 9764.58 J. Nordstrom, L. Aguilera and A. Matic, Langmuir, 2012,
28, 4080.59 D. B. Williams, M. E. Stoll, B. L. Scott, D. A. Costa and
W. J. Oldham, Chem. Commun., 2005, 1438.60 Y. Z. Su, J. W. Yan, M. G. Li, Z. X. Xie, B. W. Mao and
Z. Q. Tian, Z. Phys. Chem., 2012, 226, 979.61 J. J. Towey and L. Dougan, J. Phys. Chem. B, 2012, 116, 1633.62 J. J. Towey, A. K. Soper and L. Dougan, Phys. Chem. Chem.
Phys., 2011, 13, 9397.63 J. J. Towey, A. K. Soper and L. Dougan, J. Phys. Chem. B,
2011, 115, 7799.64 A. K. Soper, W. S. Howells and A. C. Hannon, ATLAS-Analysis
of Time-of-Flight Diffraction Data from Liquid and AmorphousSamples RAL-89-046, 1989.
Paper PCCP
Ope
n A
cces
s A
rtic
le. P
ublis
hed
on 2
0 M
ay 2
014.
Dow
nloa
ded
on 1
1/17
/202
1 10
:04:
17 A
M.
Thi
s ar
ticle
is li
cens
ed u
nder
a C
reat
ive
Com
mon
s A
ttrib
utio
n-N
onC
omm
erci
al 3
.0 U
npor
ted
Lic
ence
.View Article Online
13190 | Phys. Chem. Chem. Phys., 2014, 16, 13182--13190 This journal is© the Owner Societies 2014
65 H. V. R. Annapureddy, H. K. Kashyap, P. M. De Biase andC. J. Margulis, J. Phys. Chem. B, 2010, 114, 16838.
66 B. Hammouda, S. Krueger and C. J. Glinka, J. Res. Natl. Inst.Stand. Technol., 1993, 98, 31.
67 R. Hayes, N. Borisenko, B. Corr, G. B. Webber, F. Endres andR. Atkin, Chem. Commun., 2012, 48, 10246.
68 O. Russina, A. Triolo, L. Gontrani and R. Caminiti, J. Phys.Chem. Lett., 2012, 3, 27.
69 O. Russina and A. Triolo, Faraday Discuss., 2012,154, 97.
70 C. Hardacre, J. D. Holbrey, C. L. Mullan, T. G. A. Youngs andD. T. Bowron, J. Chem. Phys., 2010, 133, 7.
71 M. Macchiagodena, L. Gontrani, F. Ramondo, A. Triolo andR. Caminiti, J. Chem. Phys., 2011, 134, 15.
72 H. K. Kashyap, J. J. Hettige, H. V. R. Annapureddy andC. J. Margulis, Chem. Commun., 2012, 48, 5103.
73 H. K. Kashyap, C. S. Santos, N. S. Murthy, J. J. Hettige,K. Kerr, S. Ramati, J. Gwon, M. Gohdo, S. I. Lall-Ramnarine,J. F. Wishart, C. J. Margulis and E. W. Castner, J. Phys. Chem.B, 2013, 117, 15328.
74 K. Shimizu, C. E. S. Bernardes and J. N. C. Lopes, J. Phys.Chem. B, 2014, 118, 567.
75 A. A. Freitas, K. Shimizu and J. N. Canongia Lopes, J. Chem.Eng. Data, 2014, DOI: 10.1021/je500197x.
76 R. Hayes, S. Imberti, G. G. Warr and R. Atkin, J. Phys. Chem. C,2014, submitted.
77 J. Kroon and J. A. Kanters, Nature, 1974, 248, 667.78 O. Bastiansen, Acta Chem. Scand., 1949, 3, 415.79 O. Bastiansen, H. Borgiel and E. Saluste, Acta Chem. Scand.,
1949, 3, 415.80 R. Chelli, F. L. Gervasio, C. Gellini, P. Procacci, G. Cardini
and V. Schettino, J. Phys. Chem. A, 2000, 104, 5351.
PCCP Paper
Ope
n A
cces
s A
rtic
le. P
ublis
hed
on 2
0 M
ay 2
014.
Dow
nloa
ded
on 1
1/17
/202
1 10
:04:
17 A
M.
Thi
s ar
ticle
is li
cens
ed u
nder
a C
reat
ive
Com
mon
s A
ttrib
utio
n-N
onC
omm
erci
al 3
.0 U
npor
ted
Lic
ence
.View Article Online